Embed Size (px)
Citation preview

Indiana University Kelley School of Business A455 - Professor Teri Lombardi Yohn
Marc H. Gerstein
Portfolio123, Director of Research
4/11/18

Biography• Marc H. Gerstein spent his career analyzing stocks,
educating investors, and helping to develop stock screening platforms at Value Line and various web sites. He is presently Director of Research at Portfolio123. His commentary can be found on Forbes.com (http://www.forbes.com/sites/marcgerstein), TalkMarkets.com, hvst.com and SeekingAlpha.com. He has authored three books, Screening the Market (Wiley, 2002), The Value Connection (Wiley 2003), Atlas Upgrades: Objectivism 2.0 (Create Space, 2013) and is presently working on a novel with a Wall Street setting, and a book with Stanford’s Dr. Charles Lee based on the latter’s course in “Alphanomics.”
2

Today's Questions• We've been taught a lot of theory and exposed to
a lot of academic research. • Are the ideas really valid?
• Is it just theory, or can the ideas really be used? • Some of the ideas are from a long time ago. Are they
still valid in today's market? • Universal principles are all well and good. But can we
use these ideas to actually generate investable portfolios • That contain a manageable number of stocks • That can withstand trading costs
• Spoiler • You may be pleasantly surprised by the extent to
which all three questions can be answered in the affirmative
3
Topics• The general validity of basic data-driven
strategies • How “factors” really work • A theoretical (how stocks are priced) Cheat
Sheet • Real-World Relative Valuation • Making Sense of Momentum • Coping with the Quant's Nightmare: WACC • Using the distinction between noise and value • The Residual Income Model; a DCF approach
that's actually usable 4

Must You be a Portfolio123 Power User?
• Absolutely not! • The main presentation will explain the logic of the
models and present them in both "pseudo-code" (plain English) and Portfolio123 syntax
• But if you are or want to become one . . . . • The next three slides will explain some vital
Portfolio123 functions • And there will be one more that addresses
potential crossing-zero problems that might plague growth-rate computations
5
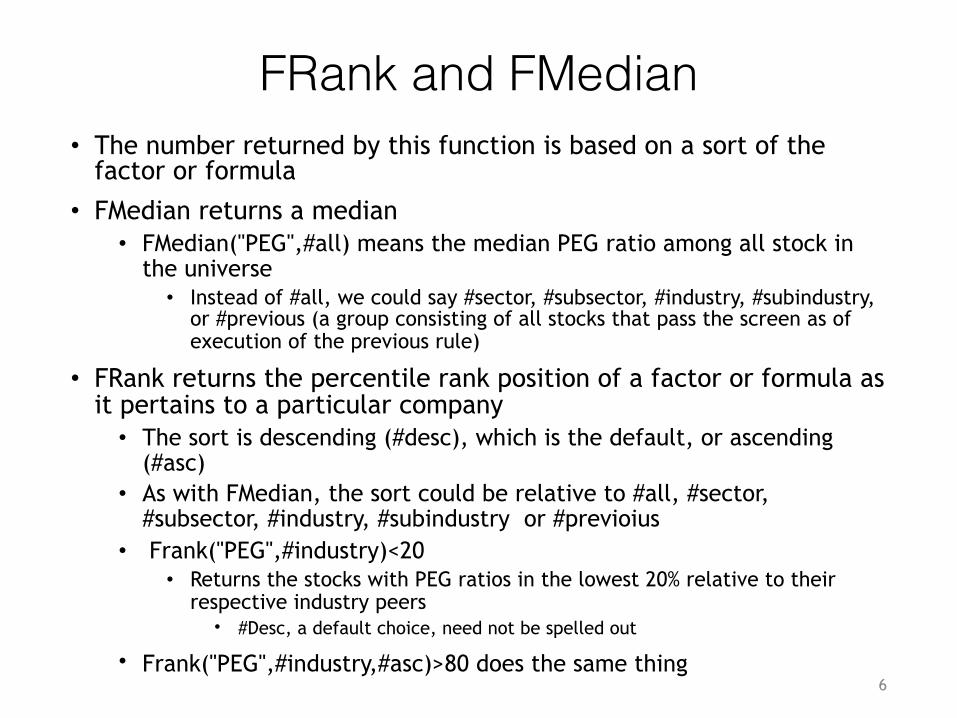
FRank and FMedian• The number returned by this function is based on a sort of the
factor or formula
• FMedian returns a median • FMedian("PEG",#all) means the median PEG ratio among all stock in
the universe • Instead of #all, we could say #sector, #subsector, #industry, #subindustry,
or #previous (a group consisting of all stocks that pass the screen as of execution of the previous rule)
• FRank returns the percentile rank position of a factor or formula as it pertains to a particular company • The sort is descending (#desc), which is the default, or ascending
(#asc) • As with FMedian, the sort could be relative to #all, #sector,
#subsector, #industry, #subindustry or #previoius • Frank("PEG",#industry)<20
• Returns the stocks with PEG ratios in the lowest 20% relative to their respective industry peers • #Desc, a default choice, need not be spelled out
• Frank("PEG",#industry,#asc)>80 does the same thing 6

ShowVar• This defines an item on the fly • ShowVar(@x,a+b)
• Adding a + b produces an item that can be referred to as @x
• ShowVar(Ev2S,EV/SalesTTM) • We can spell out EV/SalesTTM
• EV/SalesTTM<2 • Or we can do this: @EV2S<2
• This is very useful when creating complex formulas • The item can be broken down into many @X type
variables, and the final computation could work only with those • @X/(@y+@z)
7
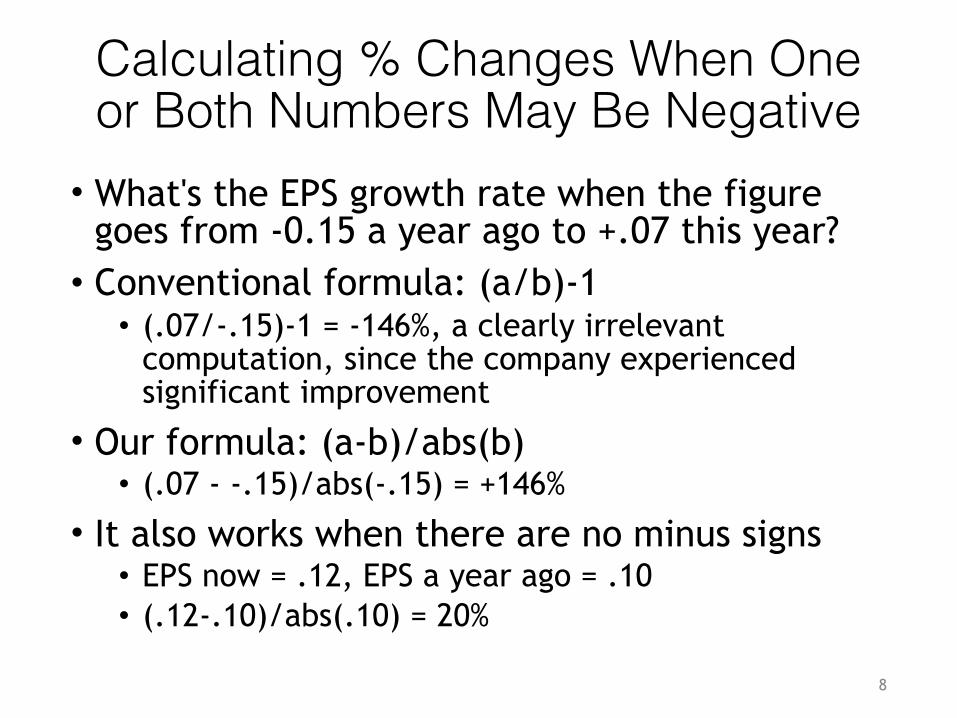
Calculating % Changes When One or Both Numbers May Be Negative• What's the EPS growth rate when the figure
goes from -0.15 a year ago to +.07 this year? • Conventional formula: (a/b)-1 • (.07/-.15)-1 = -146%, a clearly irrelevant
computation, since the company experienced significant improvement
• Our formula: (a-b)/abs(b) • (.07 - -.15)/abs(-.15) = +146%
• It also works when there are no minus signs • EPS now = .12, EPS a year ago = .10 • (.12-.10)/abs(.10) = 20%
8
Basic Data-Driven Strategies Work
• We’ll work with a group of style-oriented Portfolio123 pre-set ranking systems (each of which can be thought of as a factor) • Each test will divide the Russell 3000 and S&P 500
universes into best-to-worst quintiles based on rank score • This is not the sort of test I usually do
• It’s more academic in nature, designed to demonstrate broad principles
• I typically prefer to test investable portfolios consisting of a manageable numbers of stocks
• But this is a useful starting point in that it establishes the validity of the overall data-driven process
9

The Portfolio123 Basic: Quality Ranking System
• Margins (25%) • Trailing 12 Month (TTM) Operating Margin (75% - higher is
better) • 5 yr. average Operating Margin (25% - higher is better)
• Turnover (25%) • TTM Asset Turnover (100% - higher is better)
• Returns on Capital (25%) • TTM Return on Investment (30% - higher is better) • 5 yr. average Return on Investment (40% - higher is better) • TTM Return on Equity (10% - higher is better) • 5 yr. average Return on Equity (20% - higher is better)
• Finances (25%) • Latest Current Ratio (30% - higher is better) • TTM Interest Coverage (45% - higher is better) • Latest Total Debt to Capital (25% - higher is better)
10

The Portfolio123 Basic: Value Ranking System
• Value Based on Income Stream (65%) • Based on Earnings (50%)
• PE based on Trailing 12 months EPS (33.33%) • PE based on consensus estimate of Current Yr. EPS
(33.33%) • PEG ratio with G based on estimate of long-term
growth rate (33.33%) • Other (50%)
• Price/Trailing 12 month Sales (50%) • Price/Trailing 12 month Free Cash Flow (50%)
• Value Based on Assets (35%) • Price/Book (100%)
11

The Portfolio123 Basic: Growth Ranking System
• EPS Growth (75%) • Basic Growth (50%)
• YTY growth in latest quarter (higher is better – 33%) • Trailing 12 Month (TTM) growth (higher is better – 33%) • 5 year growth rate (higher is better – 33%)
• Acceleration in Growth (50%) • Latest qtr. growth compared to TTM (higher is better – 50%) • TTM growth compared to 5-year growth TTM (higher is better – 50%)
• Sales Growth (25%) • Basic Growth (75%)
• YTY growth in latest quarter (higher is better – 33%) • Trailing 12 Month (TTM) growth (higher is better – 33%) • 5 year growth rate (higher is better – 33%)
• Acceleration in Growth (25%) • Latest qtr. growth compared to TTM (higher is better – 50%) • TTM growth compared to 5-year growth TTM (higher is better – 50%)
12

The Portfolio123 Basic: Momentum Ranking System
• Share Price Change (65%) • Last 120 days (20% - higher is better) • Last 140 days (20% - higher is better) • Last 160 days (30% - higher is better) • Last 180 days (30% - higher is better)
• Technical Indicator (35%) • 20 Day Up-Down Ratio* (50% - higher is better) • 60 Day Up-Down Ratio* (30% - higher is better) • 120 Day Up-Down Ratio* (20% - higher is better)
* Volume in up days in defined period divided by volume in down days
13

The Portfolio123 Basic: Sentiment Ranking System
• Estimates (50%) • % 4 Week Change in Consensus Current Yr. EPS Est. (higher is
better - 33.33%) • % 4 Week Change in Consensus Current Qtr. EPS Est. (higher is
better - 33.33%) • Standard Deviation of Current Qtr. EPS estimates/absolute
value of consensus estimate (lower is better - 33.33%) • EPS Surprise (30%)
• Surprise % most recent quarter (higher is better - 65%) • Surprise % second most recent quarter (lower is better - 35%)
• Analyst Recommendations (20%) • 4-week change in consensus recommendation (more bullish is
better - 75%) • Current consensus recommendation (more bullish is better -
25%)
14

Ways to Think About Ranking Systems• The be-all and end-all
• The # 1 ranked stock is better than the #2, #2, is better than #3, and so on all the way to the last ranked stock, which is the worst • As we say in Brooklyn, “Fuggedaboudit!”
• No system can do that unless you cheat • The results of an empirical study aimed at identifying “what works”
• Many do this; it’s how factor investing got off the ground • I prefer to think of these as elements of a strategic blueprint, the
“intuition” that must lie behind any strategy you create and any tests you run • Never run a test purely cold — you should always have reason
to expect your idea should work • If it doesn’t, then the strategic blueprint should cue you on
your search for reasons why it failed and on changes you might make.
15

The Strategy: A Theoretical Cheat Sheet
• Dividend Discount Model • P = D / (R – G)
• P = price, D = dividend, R = required return, G = expected growth
• Assume based on Capital Asset Pricing Model, that • R = RF + (RM – RF) * B • RF = risk-free rate, RM = market return, B = stocks’ Beta
• In the real world, we often act as if all earnings were paid to shareholders who then voluntarily choose to reinvest some or all back into he company • Therefore . . .
• P = E / (R – G) • Reshuffling the equation . . .
• P/E = 1 / (R - G) . . . (“warranted” P/E) • Substituting for E
• EV/S = Margin / (R – G) . . . (“warranted” EV/S) • P/B = (ROE * BV) / (R – G) . . . (“warranted” P/B)
16
Implications of the Cheat Sheet• Now, we see why stylistic combinations are
better than the application of pure styles • Value alone, for example, isn’t the best
because it’s not supposed to be the best • P/E = 1/(R-G) • This means low P/E alone is not necessarily a good
thing • All else being equal, ideal P/E rises when R goes down
and/or when growth goes up • We’ve seen the relationship between high P/E and high
growth; it’s the PEG ratio • R is based on interest rates and company risk
• We know if interest rates go down, ideal P/E goes up • Low risk also pushes R down and elevates ideal P/E (risk
reduction is a valuable service, whether for auto insurance or stock pricing)
17

This Is Where Many Quants Miss The Boat
• They often test isolated factors and go so far as to try to control other factors out of the experiment • Then, when results don’t pan out, they scream
that the market is efficient and/or that active investing is a rip-off and that it should be all indexing all the time • The problem, though, is poor study design on
their part • Because their research is not grounded in a solid
understanding of theory, they tested ideas that never should have worked in the first place
18

Translating Theory Into the Real World• It’s hard because we don’t know the future • As badly as we need inputs for future R and G, the sad
fact is we can’t ever get them – until the future becomes the past in which case it’s too late • But we can be creative: We can look for clues or proxies
that may provide windows into probable futures • Proxies for G
• We can play with historical growth data, but persistence is often troublesome
• Instead, we can work with “Sentiment” and “Momentum” as proxies for investment community expectations regarding the future
• Proxies for R • Interest-rate forecasting is tolerably manageable, no less
so than most other things we do • For risk, we can use company-quality measures, DuPont-
analysis ideas • These metrics tend to be more stable than most
19

Playing This Out• I tend to rely on VQS (Value-Quality-Sentiment) type
strategies • I may not use all three in every model, but this is my
general template • You see it in Greenblatt’s Magic Formula, though he
omits S • This is the essence of Warren Buffett; he’s big in terms
of VQ and his own judgement supplies the S • Jim Cramer works this way, too. Though it may not
always be apparent on TV, he knows his Vs and Qs and has in incredibly perceptive sense of S
• Being a successful stock investor is not about math and statistics • It’s about one’s creativity and one’s detective skills,
finding interesting ways to work with Q and S to uncover productive relationships between P/E and 1/(R-G)
20

The Active Versus Passive Debate
• It’s silly and obsolete • Passive Investors are far more active than they
let on • They make active choices of which indexes to
“passively” track • Active Investing is no longer always a matter
of gut instincts • While there’s a ton of research on old fashioned
pull-it-out-of-the-wind decision making, there’s virtually nothing regarding disciplined data driven strategies, which are still fairly new in the grand scheme of things
21
A Closer Look at the VQS Approach• Test Protocol
• Divided a Universe into three ”buckets” (good, mid, and bad) based on a ranking system
• Universes • Russell 3000 • S&P 500
• Time period: 10 years (2/20/08-2/20/18) • Refresh: Every 13 weeks (approx. three months) • Present:
• A standard start-to-finish 10-year test • Rolling Tests
• on 2/20/08: Run a test that ends 5/20/08 • on 2/27/08: Run a test that ends 5/27/08 • Etc. – with a new three month test that starts each week; do this
over ten years • Evaluate Average of all 13-week returns
• On all periods • Only in Up periods • Only in Down periods
22

First Things First: Justify Use of Sentiment as a Growth Proxy• I’ll test a variety of ranking systems that could
arguably serve as a proxy for growth expectations • Basic Growth
• Basic Sentiment
• Basic Momentum
• 50-50 Combination: Basic Growth and Basic Sentiment
• 50-50 Combination: Basic Momentum and Basic Sentiment
• 50-50 Combination: Basic Growth and Basic Momentum
• LT Growth (the consensus 3- to 5-year EPS Growth Rate Projection
23

Some Growth Proxy Test Results
24
Sentiment - Russell 3000
Start to Finish 10-Year Test 10-Year Rolling Tests (new 13 wk. tests starts every week)Average of all sets of 13-week returns
Annual Return % Stan. Dev. % Annual Alpha % All Markets Up Markets Down Markets
Best S 13.59% 20.45% 2.20% 3.73% 8.13% -8.03%
Mid S 10.95% 20.85% -0.20% 3.32% 7.8% -8.64%
Worst S 6.45% 23.42% -4.99% 2.67% 7.54% -10.35%
Best - Worst 7.14% -2.97% 7.19% 1.06% 0.59% 2.32%
Growth - Russell 3000
Start to Finish 10-Year Test 10-Year Rolling Tests (new 13 wk. tests starts every week)Average of all sets of 13-week returns
Annual Return % Stan. Dev. % Annual Alpha % All Markets Up Markets Down Markets
Best G 11.46% 19.52% 0.59% 3.75% 7.55% -8.20%
Mid G 10.63% 20.73% -0.47% 3.29% 7.62% -8.27%
Worst G 8.92% 24.69% -2.98% 3.17% 8.30% -10.54%
Best - Worst 2.54% -5.17% 3.57% 0.58% -0.75% 2.34%

More Growth-Proxy Test Results
25
Momentum - Russell 3000
Start to Finish 10-Year Test 10-Year Rolling Tests (new 13 wk. tests starts every week)Average of all sets of 13-week returns
Annual Return % Stan. Dev. % Annual Alpha % All Markets Up Markets Down Markets
Best M 10.70% 18.32% 0.63% 2.79% 6.87% -8.13%
Mid M 12.23% 19.90% 1.29% 3.42% 7.7% -8.01%
Worst M 7.83% 27.84% -4.70% 3.5% 8.88% -10.86%
Best - Worst 2.87% -9.52% 5.33% -0.71% -2.01% 2.73%
Sentiment/Growth Combination - Russell 3000
Start to Finish 10-Year Test 10-Year Rolling Tests (new 13 wk. tests starts every week)Average of all sets of 13-week returns
Annual Return % Stan. Dev. % Annual Alpha % All Markets Up Markets Down Markets
Best S/G 13.05% 19.60% 2.02% 3.53% 7.79% -7.84%
Mid S/G 11.54% 21.00% 0.29% 3.44% 7.86% -8.36%
Worst S/G 6.67% 24.42% -4.97% 2.74% 4.81% -10.77%
Best - Worst 6.38% -4.82% 6.99% 0.79% 2.98% 2.93%
More Growth-Proxy Test Results
26
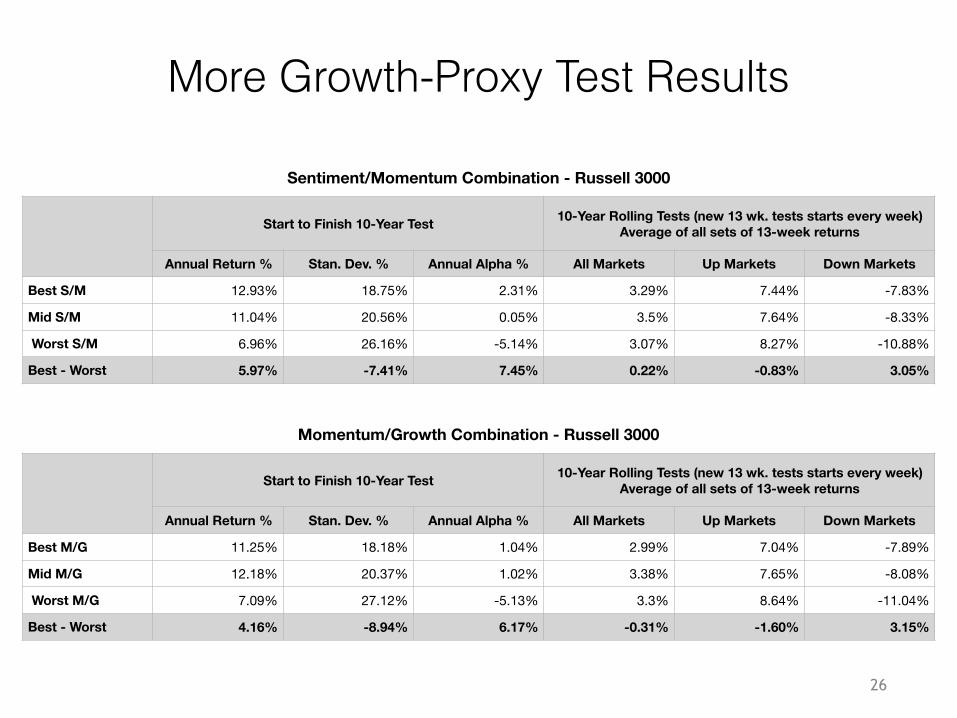
Sentiment/Momentum Combination - Russell 3000
Start to Finish 10-Year Test 10-Year Rolling Tests (new 13 wk. tests starts every week)Average of all sets of 13-week returns
Annual Return % Stan. Dev. % Annual Alpha % All Markets Up Markets Down Markets
Best S/M 12.93% 18.75% 2.31% 3.29% 7.44% -7.83%
Mid S/M 11.04% 20.56% 0.05% 3.5% 7.64% -8.33%
Worst S/M 6.96% 26.16% -5.14% 3.07% 8.27% -10.88%
Best - Worst 5.97% -7.41% 7.45% 0.22% -0.83% 3.05%
Momentum/Growth Combination - Russell 3000
Start to Finish 10-Year Test 10-Year Rolling Tests (new 13 wk. tests starts every week)Average of all sets of 13-week returns
Annual Return % Stan. Dev. % Annual Alpha % All Markets Up Markets Down Markets
Best M/G 11.25% 18.18% 1.04% 2.99% 7.04% -7.89%
Mid M/G 12.18% 20.37% 1.02% 3.38% 7.65% -8.08%
Worst M/G 7.09% 27.12% -5.13% 3.3% 8.64% -11.04%
Best - Worst 4.16% -8.94% 6.17% -0.31% -1.60% 3.15%
One More Growth-Proxy Test Result
27
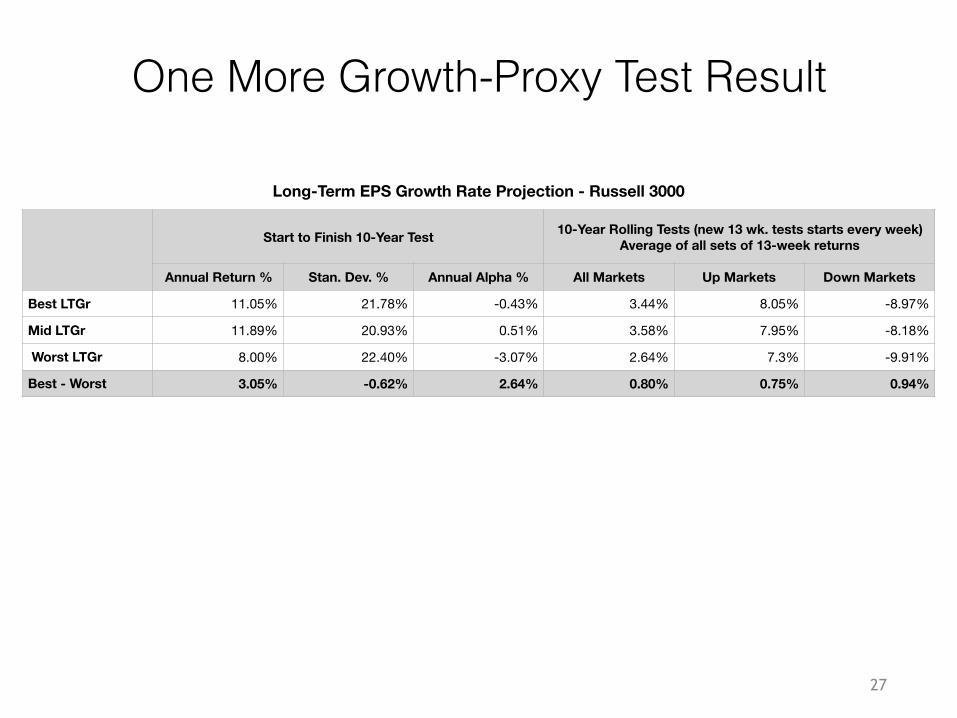
Long-Term EPS Growth Rate Projection - Russell 3000
Start to Finish 10-Year Test 10-Year Rolling Tests (new 13 wk. tests starts every week)Average of all sets of 13-week returns
Annual Return % Stan. Dev. % Annual Alpha % All Markets Up Markets Down Markets
Best LTGr 11.05% 21.78% -0.43% 3.44% 8.05% -8.97%
Mid LTGr 11.89% 20.93% 0.51% 3.58% 7.95% -8.18%
Worst LTGr 8.00% 22.40% -3.07% 2.64% 7.3% -9.91%
Best - Worst 3.05% -0.62% 2.64% 0.80% 0.75% 0.94%

Evaluating the Growth Proxies• Good cases can be made for any of the ranking systems
that were tested • We can also make good cases for countless variations
along these lines that I or others can create • For present purposes, I’ll choose “Basic: Sentiment” as a
proxy to stand in for future growth expectations • Notice that this isn’t actually a number that can be
plugged into a formula calling for a growth rate • It’s a way to assess growth prospects as good, ok,
or bad • Strategically speaking, that’s all you really need,
since it’s not as if we could actually predict future growth rates . . . Or anything about the future
28
Testing Each Style Individually• Screen Each Universe to Identify and Track • Those that Rate “Best” according to that style-
based ranking system (67-100) • Those in the Middle (34-66) • Those that rank Worst ((0-33)
• # of Stocks in each bucket • Russell 3000
• Approximately. 1000 • S&P 500
• Approximately 167
29

Value
30
Value Only - Russell 3000
Start to Finish 10-Year Test 10-Year Rolling Tests (new 13 wk. tests starts every week)Average of all sets of 13-week returns
Annual Return % Stan. Dev. % Annual Alpha % All Markets Up Markets Down Markets
Best V 13.70% 24.73% 1.27% 4.22% 9.15% -8.93%
Mid V 9.48% 21.12% -1.57% 3.06% 7.52% -8.86%
Worst V 7.87% 19.59% -2.35% 2.43% 6.79% -9.23%
Best - Worst 5.83% 5.14% 3.62% 1.79% 2.36% 0.30%
Value Only - S&P 500
Start to Finish 10-Year Test 10-Year Rolling Tests (new 13 wk. tests starts every week)Average of all sets of 13-week returns
Annual Return % Stan. Dev. % Annual Alpha % All Markets Up Markets Down Markets
Best V 12.45% 22.93% -0.01% 3.66% 8.38% -9.27%
Mid V 10.34% 17.41% -0.04% 3.1% 6.98% -7.56%
Worst V 10.62% 15.66% 1.16% 2.85% 6.33% -6.71%
Best - Worst 1.83% 7.27% -1.17% 0.81% 2.05% -2.56%

Sentiment
31
Sentiment Only - Russell 3000
Start to Finish 10-Year Test 10-Year Rolling Tests (new 13 wk. tests starts every week)Average of all sets of 13-week returns
Annual Return % Stan. Dev. % Annual Alpha % All Markets Up Markets Down Markets
Best S 13.59% 20.45% 2.20% 3.73% 8.13% -8.03%
Mid S 10.95% 20.85% -0.20% 3.32% 7.8% -8.64%
Worst S 6.45% 23.42% -4.99% 2.67% 7.54% -10.35%
Best - Worst 7.14% -2.97% 7.19% 1.06% 0.59% 2.32%
Sentiment Only - S&P 500
Start to Finish 10-Year Test 10-Year Rolling Tests (new 13 wk. tests starts every week)Average of all sets of 13-week returns
Annual Return % Stan. Dev. % Annual Alpha % All Markets Up Markets Down Markets
Best S 12.43% 17.20% 1.98% 3.23% 7.04% -7.26%
Mid S 11.66% 17.00% 1.50% 3.26% 7.09% -7.27%
Worst S 8.88% 21.50% -2.65% 3.12% 7.55% -9.06%
Best - Worst 3.55% -4.30% 4.63% 0.11% -0.51% 1.80%

Quality
32
Quality Only - Russell 3000
Start to Finish 10-Year Test 10-Year Rolling Tests (new 13 wk. tests starts every week)Average of all sets of 13-week returns
Annual Return % Stan. Dev. % Annual Alpha % All Markets Up Markets Down Markets
Best Q 12.17% 18.62% 1.65% 3.42% 7.36% -7.09%
Mid Q 11.69% 21.09% 0.35% 3.48% 7.93% -8.38%
Worst Q 7.11% 25.33% -4.83% 2.81% 8.17% -11.51%
Best - Worst 5.06% -6.71% 6.48% 0.61% -0.81% 4.42%
Quality Only - S&P 500
Start to Finish 10-Year Test 10-Year Rolling Tests (new 13 wk. tests starts every week)Average of all sets of 13-week returns
Annual Return % Stan. Dev. % Annual Alpha % All Markets Up Markets Down Markets
Best Q 11.54% 16.13% 1.58% 2.66% 6.29% -6.5%
Mid Q 12.76% 17.85% 2.10% 3.39% 7.3% -7.36%
Worst Q 8.97% 21.78% -2.55% 3.1% 7.73% -9.65%
Best - Worst 2.57% -5.65% 4.13% -0.44% -1.44% 3.15%
Thoughts on Single-Style Strategies• Value and Sentiment both work to enhance returns • As DDM theory suggests, Value per se is a high risk
strategy that delivers no real protection against down markets • If you think you’re seeing down market superiority for
value, it’s likely due to the influence of something else. • Growth, via the Sentiment proxy, supplies better down-
market performance than many might expect • Actually, though, this makes sense; when times are
tough, if you have to own equities, favor shares of companies more likely to grow
• Quality, as DDM theory suggests, is mainly of interest as a risk-reducing factor
33

Test Pairs of Styles• Screen Each Universe Based on Style A to Identify
and Track • Those that Rate “Best” according to that style-based
ranking system (66-100) • Those in the Middle (34-65) • Those that rank Worst ((0-33)
• For each Style A Bucket, do another screen to identify and test for Best, Mid and Worst as per Style B • # of Stocks in each final bucket
• Russell 3000 • Approximately 333
• S&P 500 • Approximately 56
34

Value - Sentiment
35
Value-Sentiment- Russell 3000
Start to Finish 10-Year Test 10-Year Rolling Tests (new 13 wk. tests starts every week)Average of all sets of 13-week returns
Annual Return % Stan. Dev. % Annual Alpha % All Markets Up Markets Down Markets
Best V/Best S 18.09% 23.86% 5.44% 4.6% 9.22% -7.72%
Mid V/Mid S 10.22% 20.07% -0.51% 3.07% 7.39% -8.48%
Worst V/Worst S 3.75% 20.28% -6.33% 1.64% 6.20% -10.54%
Best - Worst 14.34% 3.58% 11.77% 2.96% 3.02% 2.82%
Value-Sentiment S&P 500
Start to Finish 10-Year Test 10-Year Rolling Tests (new 13 wk. tests starts every week)Average of all sets of 13-week returns
Annual Return % Stan. Dev. % Annual Alpha % All Markets Up Markets Down Markets
Best V/Best S 14.26% 21.01% 2.29% 3.71% 7.97% -7.99%
Mid V/Mid S 10.10% 16.10% 0.54% 3.11% 6.79% -7.01%
Worst V/ Worst S 6.83% 18.98% -3.42% 2.55% 6.4% -7.31%
Best - Worst 7.43% 2.03% 5.71% 1.16% 1.57% -0.68%

Value - Quality
36
Value-Quality - Russell 3000
Start to Finish 10-Year Test 10-Year Rolling Tests (new 13 wk. tests starts every week)Average of all sets of 13-week returns
Annual Return % Stan. Dev. % Annual Alpha % All Markets Up Markets Down Markets
Best V/Best Q 13.15% 22.22% 1.44% 3.85% 8.24% -7.84%
Mid V/Mid Q 10.99% 19.79% 0.26% 3.19% 7.38% -7.98%
Worst V/Worst Q 5.60% 23.97% -5.44% 2.15% 7.25% -11.47%
Best - Worst 7.55% -1.75% 6.88% 1.70% 0.99% 3.63%
Value Quality - S&P 500
Start to Finish 10-Year Test 10-Year Rolling Tests (new 13 wk. tests starts every week)Average of all sets of 13-week returns
Annual Return % Stan. Dev. % Annual Alpha % All Markets Up Markets Down Markets
Best V/Best Q 8.60% 21.73% -2.59% 2.94% 7.11% -8.54%
Mid V/Mid Q 11.62% 17.85% 1.12% 3.23% 7.16% -7.56%
Worst V/Worst Q 6.86% 20.11% -3.46% 2.49% 6.77% -9.31%
Best - Worst 1.74% 1.62% 0.87% 0.45% 0.34% 0.77%

Sentiment - Quality
37
Sentiment-Quality Russell 3000
Start to Finish 10-Year Test 10-Year Rolling Tests (new 13 wk. tests starts every week)Average of all sets of 13-week returns
Annual Return % Stan. Dev. % Annual Alpha % All Markets Up Markets Down Markets
Best S/Best Q 12.74% 18.60% 2.15% 3.53% 7.52% -7.12%
Mid S/Mid Q 11.11% 20.50% 0.11% 3.49% 7.9% -8.27%
Worst S/Worst Q 1.74% 26.52% -9.77% 1.84% 8.29% -11.04%
Best - Worst 11.00% -7.92% 11.92% 1.69% -0.77% 3.92%
Sentiment-Quality - S&P 500
Start to Finish 10-Year Test 10-Year Rolling Tests (new 13 wk. tests starts every week)Average of all sets of 13-week returns
Annual Return % Stan. Dev. % Annual Alpha % All Markets Up Markets Down Markets
Best S/Best Q 13.54% 16.72% 3.34% 3.26% 6.72% -6.25%
Mid S/Mid Q 12.88% 17.76% 2.52% 3.58% 7.37% -6.86%
Worst S/Worst Q 5.53% 24.06% -4.77% 2.99% 7.83% -10.33%
Best - Worst 8.01% -7.34% 8.11% 0.27% -1.11% 4.08%

Thoughts on Two-Style Strategies• Adding Sentiment to Value is definitely a good thing.
• Given that sentiment is a proxy fro growth, we can pretty much view this combination as part of the PEG family
• Adding Quality to Value tames the latter’s otherwise risky tendencies • Interestingly, we don’t have to reach for the best with Quality • It can suffice to simply eliminate the worst
• Sentiment and Quality also make for a good pairing • The data here shows no penalty for omitting value from
consideration • But let’s keep the theory in mind — we know value is important
• While we don’t see problems here, we have to keep in mind, going forward, that the good things we see now could unravel in the face of significant overvaluation • This is the difference between naive interpretation of data
(“data mining”) versus understanding the intuition behind the data
38

Test for 3-Style Combination• Screen Each Universe Based on Style A to Identify and
Track • Those that Rate “Best” according to that style-based ranking
system (66-100) • Those in the Middle (34-65) • Those that rank Worst ((0-33)
• For each Style A Bucket, do another screen to identify and test for Best, Mid and Worst as per Style B
• Next, for each Style A-B combination, do a third screen to identify and test for Best, Mid and Worst as per Style C
• # of Stocks in each final bucket • Russell 3000
• Approximately 111 • S&P 500
• Approximately 19
39

Best vs. Mid vs. Worst
40
Value-Sentiment-Quality - Russell 3000
Start to Finish 10-Year Test 10-Year Rolling Tests (new 13 wk. tests starts every week)Average of all sets of 13-week returns
Annual Return % Stan. Dev. % Annual Alpha % All Markets Up Markets Down Markets
Best V/Best S/Best Q 15.10% 22.47% 3.18% 4.13% 8.46% -7.41%
Mid V/Mid S/ Mid Q 9.69% 19.41% -0.67% 2.91% 6.92% -7.8%
Worst V/Worst S/WorstQ 2.01% 23.70% -8.56% 1.18% 8.14% -11.69%
Best - Worst 13.09% -1.23% 11.74% 2.95% 0.32% 4.28%
Value-Sentiment-Quality - S&P 500
Start to Finish 10-Year Test 10-Year Rolling Tests (new 13 wk. tests starts every week)Average of all sets of 13-week returns
Annual Return % Stan. Dev. % Annual Alpha % All Markets Up Markets Down Markets
Best V/Best S/Best Q 12.84% 21.79% 0.33% 3.3% 7.41% -7.96%
Mid V/Mid S/ Mid Q 11.38% 18.02% 1.52% 3.5% 7.29% -6.92%
Worst V/Worst S/WorstQ 2.08% 23.26% -8.25% 1.89% 6.47% -10.71%
Best - Worst 10.76% -1.47% 8.58% 1.41% 0.94% 2.75%

Thoughts on the 3-Style Trifecta• Consistent with what DDM should lead us to expect the trifecta (good
valuation accompanied by favorable expected future growth, and not unraveled by excess risk) is best • This is clearest when we look at return and risk together, rather
than at returns only • This is reflected in
• The Alpha comparisons, and • The down-market rolling tests
• Interestingly, the rolling tests suggest we may accomplish more if we worry less about outperforming bull markets and devote more mental energy to protecting the downside • One might argue that if we can identify and ditch potential dogs,
we can almost index (use passive weightings) for what’s left. • There are some hedge funds that take this further and go
passive (i.e. the SPY S&P 500 ETF) for the main position and play the short side (either directly or via options) for stocks that believe will be dogs
41
Real-World Type Examples• What you’ve seen up till now has been similar to the traditional
academic format; analysis of a universe subcategorized on the basis of a set of “buckets” • I used three • Many academic studies use five or more often, ten (deciles)
• These are good for illustrating broad themes • But the results are not directly actionable
• The best “bucket” tends to contain more stocks than can be plausibly owned • Transaction costs tend to bet omitted, although in life, they
can be real and painful • It’s time now to apply the ideas gleaned here to the
development of strategies that can be directly implemented in the real-world markets
42
Our Typical Modeling Protocol• Work with Portfolio123 • Start with a screen
• Most will start with a universe of Russell 3000 constituents
• Use a (single-factor) Quick Rank or a (multi-factor) Ranking System to narrow the list of passing stocks to approximately 10-20 • Test over a 10-year period • Assume positions are equally weighted • Refresh the model and create a new equally
weighted portfolio every four weeks • Assume 0.25% share price slippage for each trade
that introduces a new position or eliminates an existing position
43
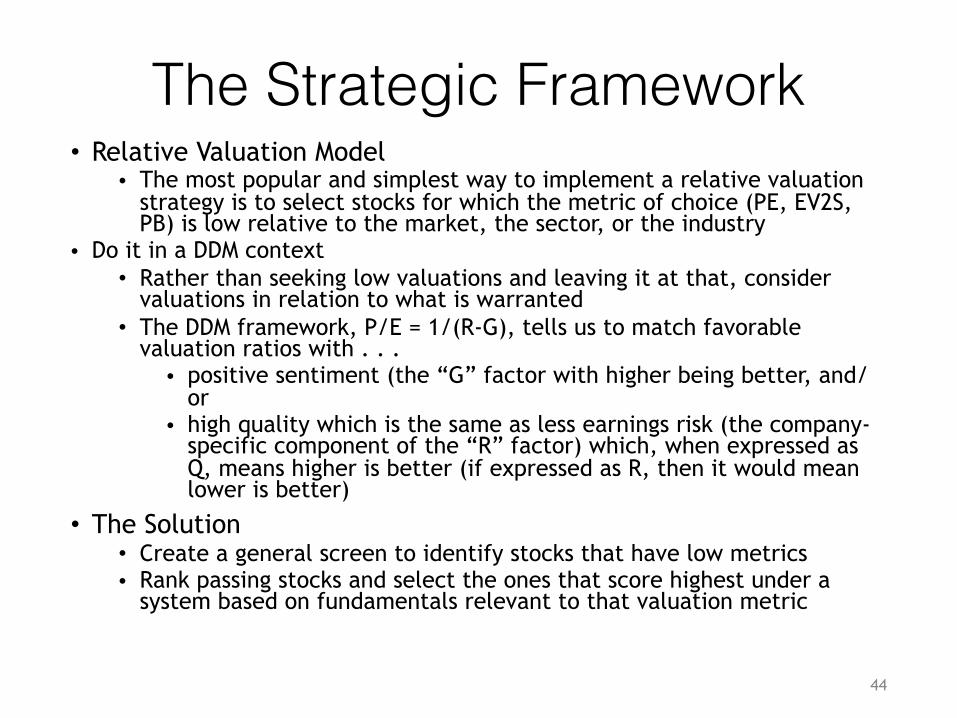
The Strategic Framework• Relative Valuation Model
• The most popular and simplest way to implement a relative valuation strategy is to select stocks for which the metric of choice (PE, EV2S, PB) is low relative to the market, the sector, or the industry
• Do it in a DDM context • Rather than seeking low valuations and leaving it at that, consider
valuations in relation to what is warranted • The DDM framework, P/E = 1/(R-G), tells us to match favorable
valuation ratios with . . . • positive sentiment (the “G” factor with higher being better, and/
or • high quality which is the same as less earnings risk (the company-
specific component of the “R” factor) which, when expressed as Q, means higher is better (if expressed as R, then it would mean lower is better)
• The Solution • Create a general screen to identify stocks that have low metrics • Rank passing stocks and select the ones that score highest under a
system based on fundamentals relevant to that valuation metric
44

A PE Screen• Universe is Russell 3000 • universe(Prussell3000)
• Limit consideration to stocks for which data is available (i.e. for which a forward PE based on estimated EPS can be computed) • ProjPECurFY!=NA
• The percentile rank of the PE computed using the consensus EPS estimate for the current fiscal year is in the bottom 20 percent (assuming an ascending lower-is-better sort) • Frank("ProjPECurFY",#previous)<20
45

PE Test Results: 400-500 stocks
46
Model Benchmark
BASIC TESTS
Annualized Return % 12.62 9.05
Standard Deviation % 26.35 16.01
Maximum Drawdown % -65.01 -52.01
Sharpe 0.60 0.66
Sortino 0.82 0.85
Correlation 0.92 - -
Beta 1.52 - -
Annualized Alpha % -0.31 - -
ROLLING 4-WEEK HOLDING PERIODS
Average Return - All Periods 1.03 0.80
Average Return - Up Periods 4.53 3.23
Average Return - Down Periods -5.48 -3.73
3/25/08 - 3/25/18
Benchmark = iShares Russell 3000 ETF

Address Warranted PE
• Add a screening rule that further limits consideration to companies for which estimates of long-term EPS growth rate were recently raised • FRank("(LTGrthMean - LTGrth13WkAgo )/
abs(LTGrth13WkAgo)",#previous)>80 • Estimating future growth is always a treacherous undertaking,
but we can use optimistic Street expectations as a proxy for a favorable input
• From the passing stocks, select the top 20 based on the Basic: Quality-Sentiment ranking system • We can get a lot of mileage from these styles which, in
terms of our cheat sheet • Enhances the capacity for G and the credibility of expectations • Reduces the B component of R • Also, it reduces the number of positions and gives us a genuinely
investable portfolio, as opposed to a theoretical exercise
47

Top 20 based on Warranted PE
48
Model Benchmark
BASIC TESTS
Annualized Return % 13.17 9.05
Standard Deviation % 25.07 16.01
Maximum Drawdown % -62.17 -52.01
Sharpe 0.63 0.66
Sortino 0.83 0.85
Correlation 0.90 - -
Beta 1.41 - -
Annualized Alpha % 0.94 - -
ROLLING 4-WEEK HOLDING PERIODS
Average Return - All Periods 1.28 0.80
Average Return - Up Periods 4.52 3.23
Average Return - Down Periods -4.74 -3.73
3/25/08 - 3/25/18
Benchmark = iShares Russell 3000 ETF

It’s Not Just P/E• We’re not using DDM literally as if we were inputting values into a
spreadsheet • Instead, we’re working with practical alternative to pure dividend
discount, earnings being one • P = D/(R - G), which leads to • P = E/(R - G), which leads to • P/E = 1/(R - G)
• We also know that D comes from E which in turn comes from S (Sales) • We also know that D comes from E which can be re-stated as ROE * BV • We can go on and on . . . D ultimately comes from cash flow, which
can be defined many ways, etc. • So instead of obsessing on D or E per se, let’s instead think in terms
of some measure of wealth generated by the corporation with Wealth (W) being definable in many ways • For now, we’ll think in terms of Sales and Book Value
49
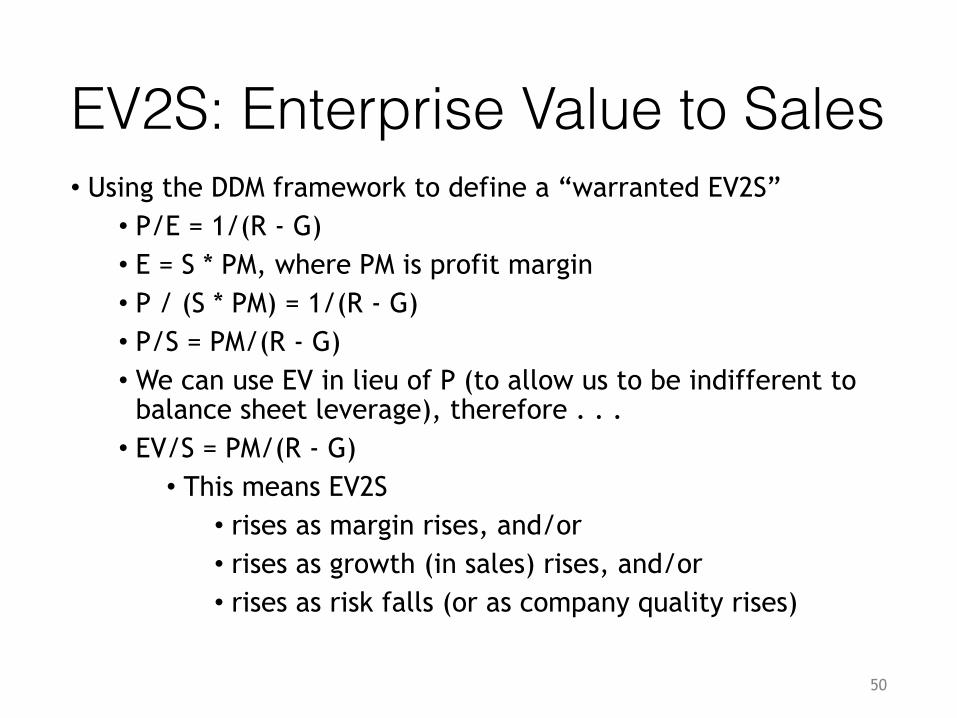
EV2S: Enterprise Value to Sales• Using the DDM framework to define a “warranted EV2S”
• P/E = 1/(R - G) • E = S * PM, where PM is profit margin • P / (S * PM) = 1/(R - G) • P/S = PM/(R - G) • We can use EV in lieu of P (to allow us to be indifferent to
balance sheet leverage), therefore . . . • EV/S = PM/(R - G)
• This means EV2S • rises as margin rises, and/or • rises as growth (in sales) rises, and/or • rises as risk falls (or as company quality rises)
50
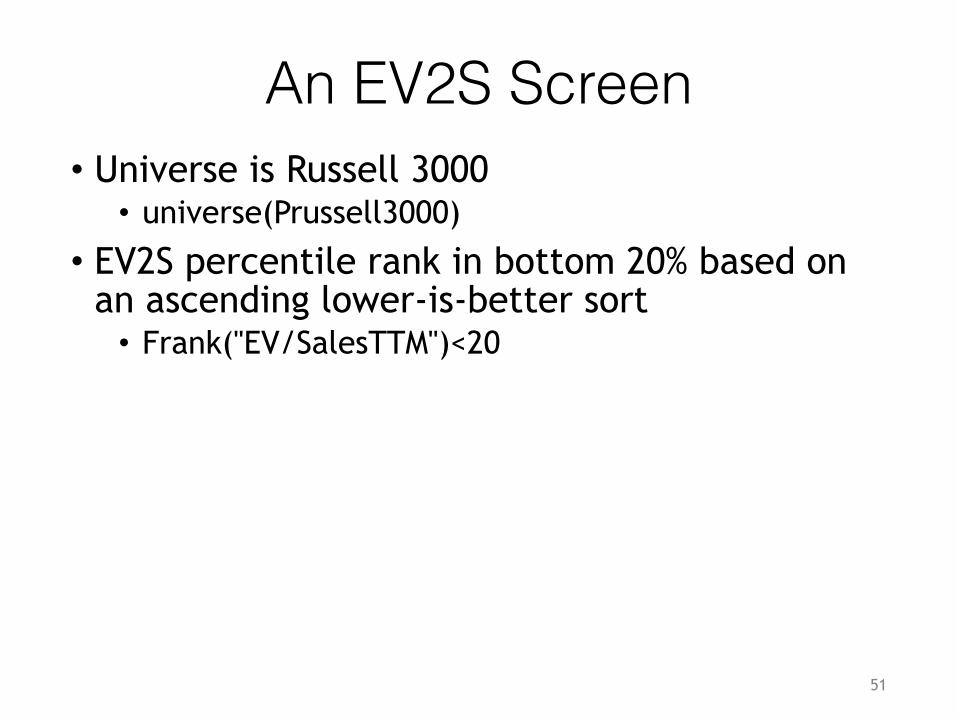
An EV2S Screen• Universe is Russell 3000 • universe(Prussell3000)
• EV2S percentile rank in bottom 20% based on an ascending lower-is-better sort • Frank("EV/SalesTTM")<20
51

EV2S Test Results: about 500-600 stocks
52
Model Benchmark
BASIC TESTS
Annualized Return % 12.30 9.05
Standard Deviation % 27.02 16.01
Maximum Drawdown % -58.13 -52.01
Sharpe 0.58 0.66
Sortino 0.82 0.85
Correlation 0.90 - -
Beta 1.52 - -
Annualized Alpha % -0.36 - -
ROLLING 4-WEEK HOLDING PERIODS
Average Return - All Periods 0.98 0.80
Average Return - Up Periods 4.50 3.23
Average Return - Down Periods -5.57 -3.73
3/25/08 - 3/25/18
Benchmark = iShares Russell 3000 ETF

Addressing Warranted EV2S
• Warranted EV2S determined by the PM/(R - G) framework • So we’re back to Q and S
• Therefore, look for a low EV2S group and . . . • Select top 20 stocks based on a QS (Quality-
Sentiment) Ranking system
53

Top 20 per Warranted EV2S
54
Model Benchmark
BASIC TESTS
Annualized Return % 18.44 9.05
Standard Deviation % 23.87 16.01
Maximum Drawdown % -44.72 -52.01
Sharpe 0.84 0.66
Sortino 1.25 0.85
Correlation 0.83 - -
Beta 1.24 - -
Annualized Alpha % 7.23 - -
ROLLING 4-WEEK HOLDING PERIODS
Average Return - All Periods 1.39 0.80
Average Return - Up Periods 4.28 3.23
Average Return - Down Periods -4.00 -3.73
3/25/08 - 3/25/18
Benchmark = iShares Russell 3000 ETF

PB: Price to Book Value• Using the DDM framework to define a “warranted PB” • P/E = 1/(R - G) • E = ROE * BV, where ROE is Return on Equity • P / (ROE * BV) = 1/(R - G) • P/BV or P/B = ROE/(R - G) • This means PB • rises as ROE rises, and/or • rises as growth (in ROE) rises, and/or • rises as risk falls (or as company quality
rises)
55

A PB Screen• Universe is Russell 3000 • universe(Prussell3000)
• Eliminate companies for which recent book value has been negative or for which trailing 12 months EPS is negative. (In other words, we eliminate companies for which PB cannot be calculated or for which relevant fundamentals may not be meaningful.) • BVPSQ>0 and BVPSA>0 and BVPSPY>0 and
EPSExclXorTTM>0 • PB percentile rank relative to industry is below
35% based on an ascending lower-is-better sort • Frank("Pr2BookQ",#industry)<35
56

PB Test Results: approx. 550-650 stocks
57
Model Benchmark
BASIC TESTS
Annualized Return % 12.08 9.05
Standard Deviation % 23.94 16.01
Maximum Drawdown % -60.69 -52.01
Sharpe 0.61 0.66
Sortino 0.83 0.85
Correlation 0.92 - -
Beta 1.38 - -
Annualized Alpha % -0.05 - -
ROLLING 4-WEEK HOLDING PERIODS
Average Return - All Periods 0.93 0.80
Average Return - Up Periods 4.09 3.23
Average Return - Down Periods -4.96 -3.73
3/25/08 - 3/25/18
Benchmark = iShares Russell 3000 ETF
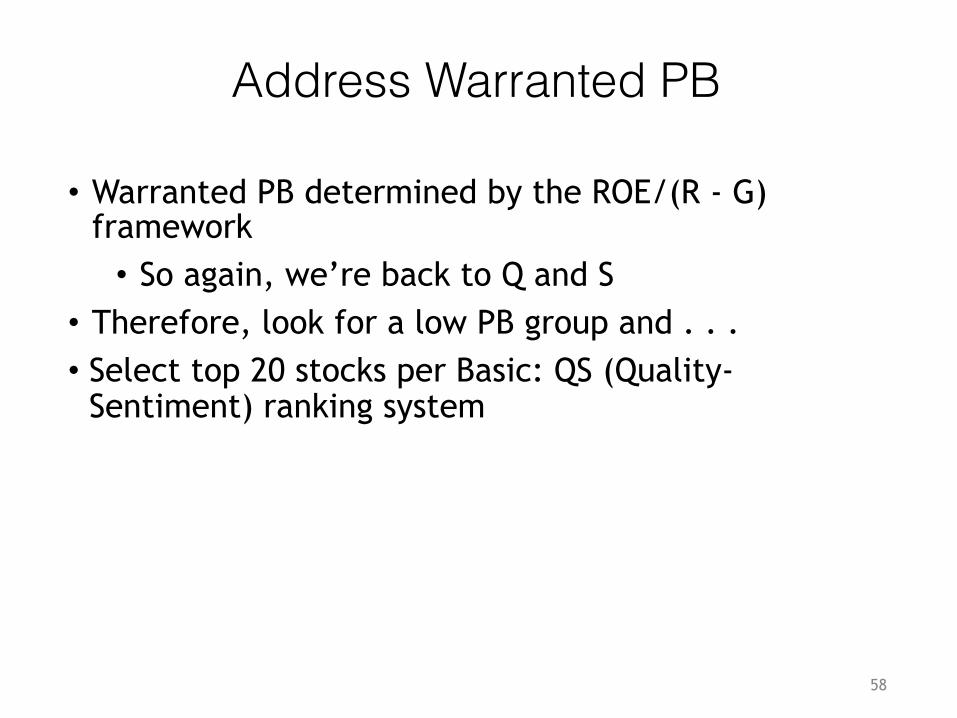
Address Warranted PB
• Warranted PB determined by the ROE/(R - G) framework • So again, we’re back to Q and S
• Therefore, look for a low PB group and . . . • Select top 20 stocks per Basic: QS (Quality-
Sentiment) ranking system
58

Top 20 per Warranted PB Rank
59
Model Benchmark
BASIC TESTS
Annualized Return % 13.32 9.05
Standard Deviation % 22.85 16.01
Maximum Drawdown % -59.70 -52.01
Sharpe 0.67 0.66
Sortino 0.89 0.85
Correlation 0.87 - -
Beta 1.25 - -
Annualized Alpha % 2.12 - -
ROLLING 4-WEEK HOLDING PERIODS
Average Return - All Periods 1.36 0.80
Average Return - Up Periods 4.17 3.23
Average Return - Down Periods -3.86 -3.73
3/25/08 - 3/25/18
Benchmark = iShares Russell 3000 ETF
Beyond “Value”Using the DDM framework to develop a
Momentum Strategy
60

Price Momentum• If we want to get hyper-literal, momentum is a meaningless factor
• We know past price action cannot and does not determine future price action • Score one each for the lawyers and efficient market adherents
• But there is no law against taking verbal shortcuts • Assume A does not cause B • Assume C causes A and B • There may be situations where my recognition of A may allow me to infer the
presence of C • If so, I can then assume B will occur
• Changing the labels • A = Past share-price momentum • B = future share returns • C = a bona fide and ongoing fundamental condition normally recognized as being
associated with good equity return • So now, we can notice price momentum, infer it’s being caused by something
legitimately of interest to us, and, therefore, assume good future returns • Voila!
• We can now legitimately use price momentum as a factor in assessing a stock’s future prospects
• It is another proxy for G in the DDM framework • We win!
61
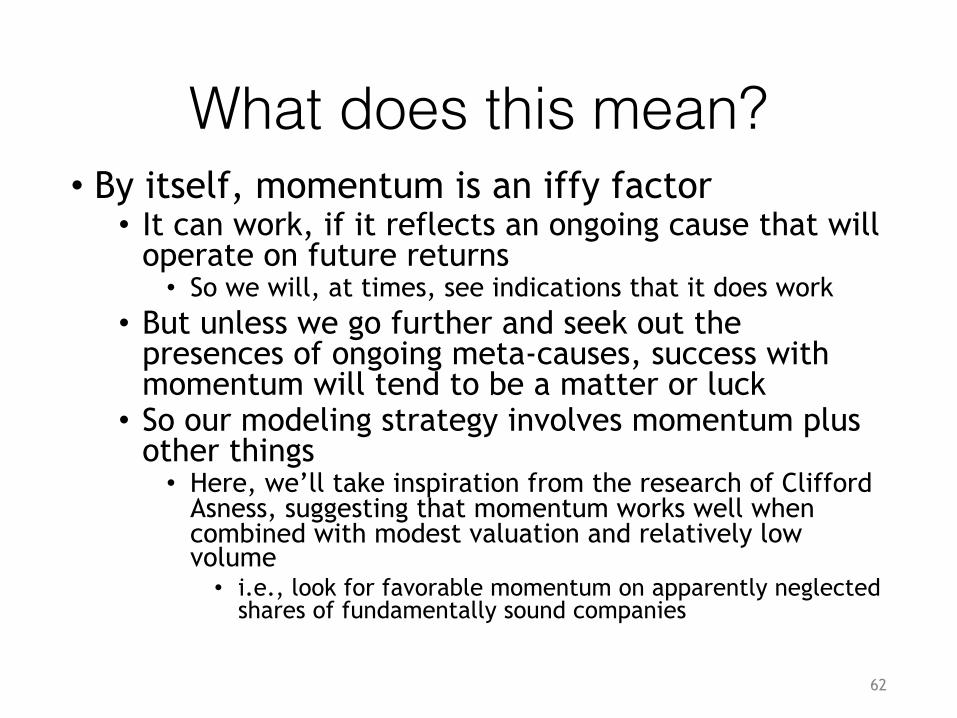
What does this mean?• By itself, momentum is an iffy factor • It can work, if it reflects an ongoing cause that will
operate on future returns • So we will, at times, see indications that it does work
• But unless we go further and seek out the presences of ongoing meta-causes, success with momentum will tend to be a matter or luck • So our modeling strategy involves momentum plus
other things • Here, we’ll take inspiration from the research of Clifford
Asness, suggesting that momentum works well when combined with modest valuation and relatively low volume • i.e., look for favorable momentum on apparently neglected
shares of fundamentally sound companies
62

Building Blocks for our Model• A Value ranking system
• EV2S (100%, lower is better) • EV/SalesTTM • Hence a rule that screens for ranks above 75 is selecting the lowest
valuations • Be careful: If we were using Frank, we our threshold would be <25
• A Momentum ranking system • Average monthly share return for the last year excluding the
most recent month; elimination of the last month allows for a bit of mean reversion/correction (100%, higher is better) • PctAvg(11,20,20)
• A volume factor for use in the screen • 60-day average volume scaled by market cap
• The Portfolio123 “Basic: QVG” ranking system • We’ll use this broad-based measure as the basis for our final
sort
63

The Momentum (+ Other Things) Screen• Universe is Russell 3000
• universe(PRussell3000)
• The rank score under our one-factor value ranking system is above 75 • Rating("EV2Sales")>75
• The stock’s volume, as per our Aseness volume factor, is in the bottom 25% among stocks making the screen to this point • FRank(" AvgDailyTot(60)/
MktCap",#previous,#desc,)<25
• The rank score under our one-factor “Asness Momentum Factor” ranking system is above 75
64

Momentum Test Results: 10-35 stocks
65
• Good for an obviously-aggressive strategy – but if we’d like to get more control over the number of passing stocks, we’ll have to go further and rank/sort
Model Benchmark BASIC TESTSAnnualized Return % 15.32 9.05Standard Deviation % 23.10 16.01
Maximum Drawdown % -45.13 -52.01
Sharpe 0.74 0.66
Sortino 1.04 0.85Correlation 0.84 - -Beta 1.21 - -
Annualized Alpha % 4.25 - - ROLLING 4-WEEK HOLDING PERIODSAverage Return - All Periods 1.15 0.80Average Return - Up Periods 3.98 3.23Average Return - Down Periods -4.12 -3.73
3/25/08 - 3/25/18Benchmark = iShares Russell 3000 ETF
Momentum Top 10 Stocks per QVG Rank
66
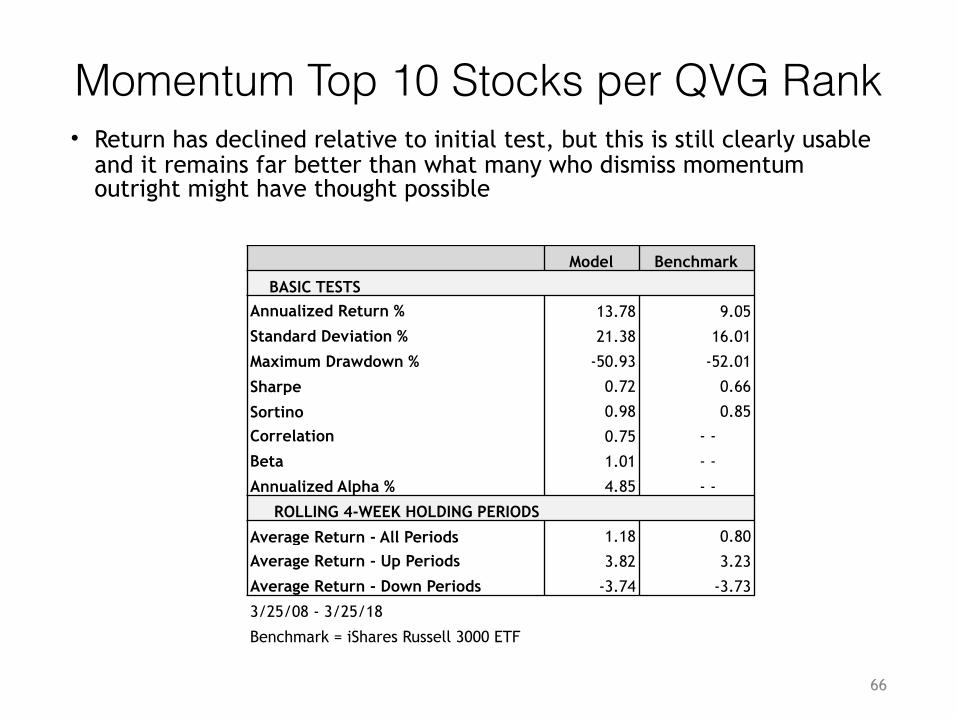
• Return has declined relative to initial test, but this is still clearly usable and it remains far better than what many who dismiss momentum outright might have thought possible
Model Benchmark
BASIC TESTSAnnualized Return % 13.78 9.05
Standard Deviation % 21.38 16.01
Maximum Drawdown % -50.93 -52.01
Sharpe 0.72 0.66
Sortino 0.98 0.85
Correlation 0.75 - -
Beta 1.01 - -
Annualized Alpha % 4.85 - -
ROLLING 4-WEEK HOLDING PERIODS
Average Return - All Periods 1.18 0.80
Average Return - Up Periods 3.82 3.23
Average Return - Down Periods -3.74 -3.73
3/25/08 - 3/25/18
Benchmark = iShares Russell 3000 ETF

Momentum Top 10 per Basic Quality Rank
• Return is nearly as high as initial model while volatility has bee reduced
• This is an example of how DuPont ideas can be used to contribute to a different sort of primary strategy
67
Model Benchmark BASIC TESTSAnnualized Return % 14.76 9.05Standard Deviation % 21.31 16.01Maximum Drawdown % -38.65 -52.01Sharpe 0.77 0.66Sortino 1.10 0.85Correlation 0.75 - -Beta 1.00 - -Annualized Alpha % 5.90 - - ROLLING 4-WEEK HOLDING PERIODSAverage Return - All Periods 0.90 0.80Average Return - Up Periods 3.48 3.23Average Return - Down Periods -3.91 -3.733/25/08 - 3/25/18Benchmark = iShares Russell 3000 ETF

Momentum Top 10 per Basic Sentiment Rank• Narrowing to Top 10 by doubling down on momentum-like consideration (qualitative
momentum) boosts returns
• Risk/volatility is up as is alpha (suggesting that quantitatively speaking, the extra returns are worth the extra risk
• So one’s acceptance or rejection of this approach is a matter of personal preference re: risk tolerance
68
Model Benchmark BASIC TESTSAnnualized Return % 20.88 9.05Standard Deviation % 27.94 16.01Maximum Drawdown % -44.93 -52.01Sharpe 0.84 0.66Sortino 1.18 0.85Correlation 0.80 - -Beta 1.36 - -Annualized Alpha % 8.84 - - ROLLING 4-WEEK HOLDING PERIODSAverage Return - All Periods 1.75 0.80Average Return - Up Periods 4.60 3.23Average Return - Down Periods -3.57 -3.733/25/08 - 3/25/18Benchmark = iShares Russell 3000 ETF

Switching GearsConsidering Practical Applications of
Topics Studied in Your Course
69

Noise and Value
70
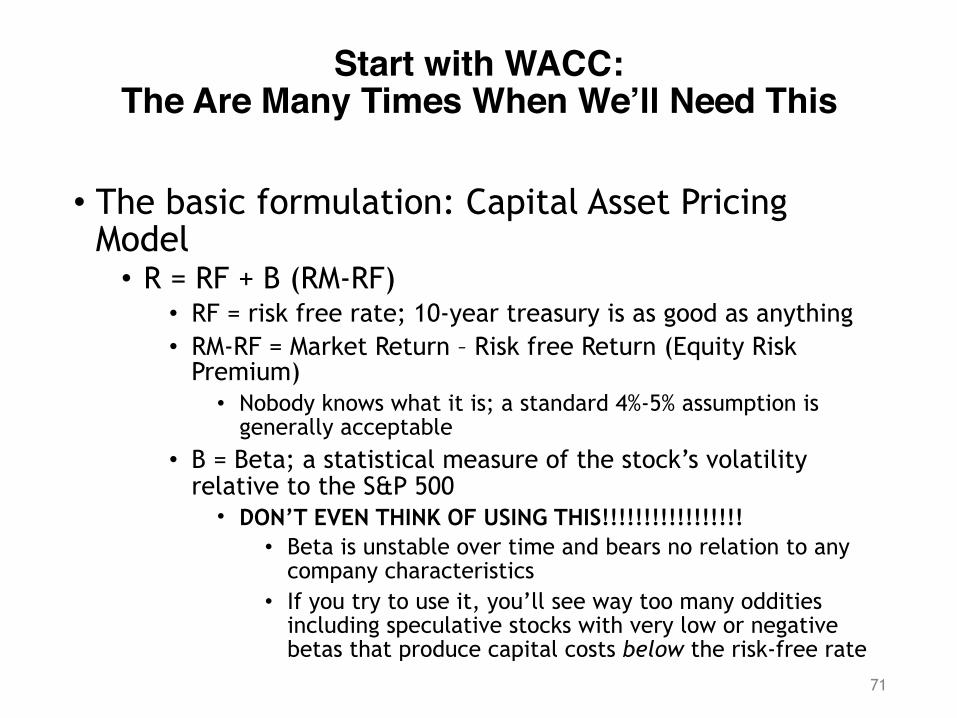
Start with WACC: The Are Many Times When We’ll Need This
• The basic formulation: Capital Asset Pricing Model • R = RF + B (RM-RF)
• RF = risk free rate; 10-year treasury is as good as anything • RM-RF = Market Return – Risk free Return (Equity Risk
Premium) • Nobody knows what it is; a standard 4%-5% assumption is
generally acceptable • B = Beta; a statistical measure of the stock’s volatility
relative to the S&P 500 • DON’T EVEN THINK OF USING THIS!!!!!!!!!!!!!!!!!
• Beta is unstable over time and bears no relation to any company characteristics
• If you try to use it, you’ll see way too many oddities including speculative stocks with very low or negative betas that produce capital costs below the risk-free rate
71

A Very Usable Spit-and-Chewing Gum Approach to WACC
• The Components • CD = Cost of debt = Risk free rate + 3% • CP = CD + 1% • CE = CD + 5%
• The Formula • WACC = (WtDebt*CD) + (WtPfd*CP) + (WtEq*CE)
• What the $%&@; that’s awfully simplistic. • Yes it is, but “I’d rather be vaguely right than
exactly wrong.” • Carveth Read, British philosopher and logician (quote
popularly but erroneously attributed to John Maynard Keynes)
72

A Noise-Value Strategy: The General Idea
• Screen for stocks where noise accounts for a low level (below 25%) of the total stock price (or market cap) • Focus on small-cap Russell 2000 universe • Gets less analytic attention, thus giving noise more
of an opportunity to assert itself in the stock price • From among the low-noise stocks, select the
top 20 as per a multi-factor ranking system designed to detect situations that may benefit in the near future from an increase in bullish noise (i.e., where sentiment indicators seemed favorable)
73

Starting Point: We Need to be Able to Quantify Noise
• Deconstruct a stock’s market cap (MC) into two components • Value based strictly on present business operation
(VPO) • This is a very conservative bond-like valuation which
assumes the income component never rises • We might call it a “stand-still valuation”
• Value based on future growth prospects (FGV)
• Therefore . . . • MC = VPO + FGV
74

Calculating VPO and FGV• VPO = NOPAT / CC
• Where • NOPAT = Net Operating Profit After Tax • CC = Cost of Capital
• NOPAT = Operating profit * (1 – tax rate) • For this purpose, Operating Profit = EBIT • We see many abnormal tax rates in the real world
• You can simply eliminate such stocks, or just assume all tax rates are normal; i.e. NOPAT = Oper Prof * .65
• CC, as we know, can be a pain in the neck • If you just want to plug in a number, I wouldn’t object
• Therefore, VPO = (OpProf *.65) / CC • Now, FGV falls into place
• FGV = Market Cap – VPO, or • FGV = Market Cap – ((OperProf *.65) /CC)
75

The Destination: Value and Noise• V% = VPO / MktCap • N% = FGV / MktCap
• Where • V% is the percent of a stock’s market cap attributable to Value • N% is the percent of a stock’s market cap attributable to Noise
• A simple back-of-the-envelope formula for the percent of noise in market cap (or stock price) • N = (Mkt Cap – ((OperProf *.65) / CC))/MktCap
• Recall that OperProf, for this purpose, is the same as EBIT
76

A Bit of Cheating• We assumed that FGV = Noise, based on an assumed
“standstill valuation” • In truth, we know that FGV = RG + NG + PN
• Where • RG = realistic growth expectations • NG = noise-based growth expectations • PN = pure noise
• To go forward, we’ll have to assume that RG is always zero • We’ll live with that
• Value gurus often talk about a margin of safety; here it is • Unlike with DDM, DCF, etc. etc. etc., we’re not going to
pretend to be more precise than we can actually be • Our estimate of Noise is likely to be a bit overstated, but as
long as we understand that and refrain from getting carried away with specifics, we can live with this, and even use it for screening and analysis
77

Some Well Known Stocks
• Note: It is possible for the contribution of noise to be negative, to drive the to a level that’s below “standstill value”
78
Est. % of Mkt CapTicker Name WACC % Noise ValueAMZN Amazon 7.76 95 5ANF Abercrombie & Fitch Co. 9.86 72 28BBBY Bed Bath & Beyond Inc. 9.07 -106 206BBY Best Buy Co Inc 9.47 32 68CAT Caterpillar Inc 7.24 24 76EBAY eBay Inc. 8.06 55 45ED Consolidated Edison Inc. 8.24 12 88EMR Emerson Electric Co. 8.85 52 48FB Facebook Inc 10.83 74 26GIS General Mills Inc. 7.53 10 90GOOGL Alphabet Inc 10.7 75 25INTC Intel Corp 9.41 45 55KO Coca-Cola Co (The) 7.15 52 48MMM 3M Co 8.09 54 46MSFT Microsoft Corp 8.17 67 33NKE Nike Inc 9.52 72 28QCOM QUALCOMM Inc. 8.39 51 49SBUX Starbucks Corp 8.53 62 38UTX United Technologies Corp 8.42 36 64WMT Walmart Inc 8.96 42 58Data from Compustat, Compuitations from Portfolio123
as of 3/25/18

Screening Rules(in Plain English)
• Confine consideration to Russell 2000 stocks • Eliminate non-US and Finance stocks • Eliminate companies reporting deficit values for EBIT, Taxes or
Capital Structure items • Compute heuristic weighted cost of capital (WACC)
• Cost Debt = 10Y Treasury + 300bp • Cost Preferred = Cost Debt + 100 bp • Cost Common Equity = Cost Debt + 500 bp • WACC = (% Dbt * Cost Dbt) + (% Pfd * Cost Pfd) + (% Com * Cost Com)
• Define NOPAT as EBIT/(1-Tax Rate) • Define FGV as: MktCap – (NOPAT/WACC) • Define %Noise as: (FGV/MktCap)*100 • Limit results to: %Noise<25
79

Screening Rules (in Portfolio123 syntax)
• Universe(Prussell2000): Not a screening rule; do this in Settings • Country=usa and GICS(40) • IncTaxExpTTM>0 and OpIncAftDeprTTM>0 and ComEq(0,qtr)>0 and
PfdEquity(0,qtr)>=0 and ComEq(0,qtr)>0 • Compute heuristic weighted cost of capital (WACC)
• ShowVar(@DbtCost,(close(0,#tnx)/10)+3) • ShowVar(@PfdCost,@DbtCost+1) • Showvar(@CostEq,@DbtCost+5) • Showvar (@Capital,DbtTot(0,qtr)+PfdEquity(0,qtr)+ComEq(0,qtr)) • Showvar(@PfdWt,PfdEquity(0,qtr)/@Capital) • Showvar(@DbtWt,DbtTot(0,qtr)/@Capital) • Showvar(@EqWt,ComEq(0,qtr)/@Capital) • Showvar(@CostCap,(@DbtWt*@DbtCost)+(@PfdWt*@PfdCost)+
(@EqWt*@CostEq))
• ShowVar(@NOPAT, OpIncAftDeprTTM*(1-(TaxRate%TTM/100))) • ShowVar(@FGV,MktCap-(@NOPAT/(@CostCap/100))) • ShowVar(@NoisePct,(@FGV/MktCap)*100) • @NoisePct<25
80
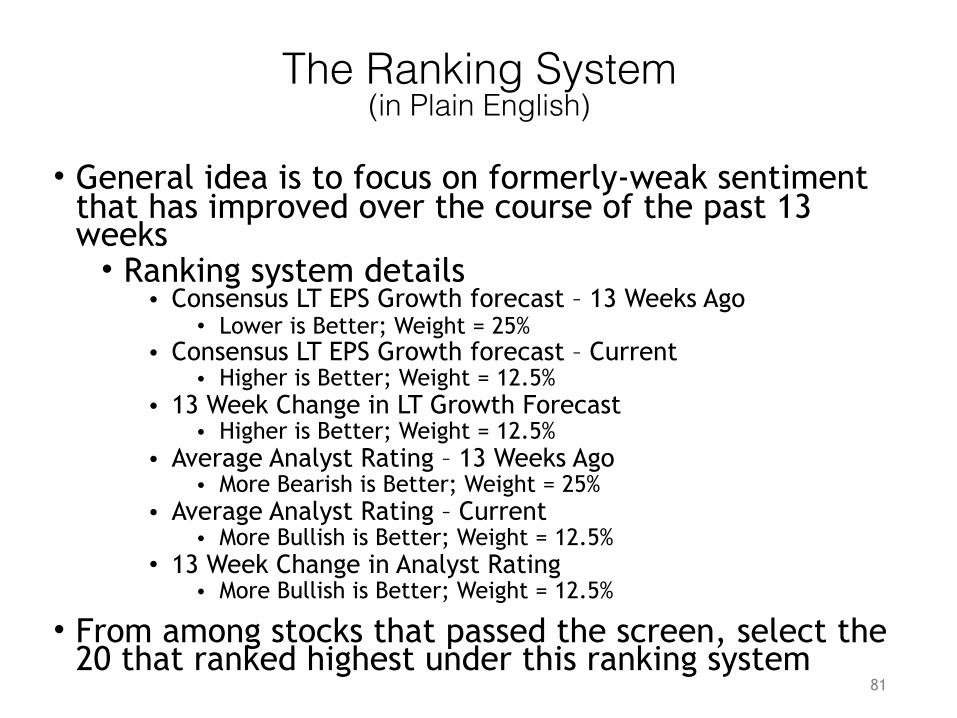
The Ranking System(in Plain English)
• General idea is to focus on formerly-weak sentiment that has improved over the course of the past 13 weeks • Ranking system details
• Consensus LT EPS Growth forecast – 13 Weeks Ago • Lower is Better; Weight = 25%
• Consensus LT EPS Growth forecast – Current • Higher is Better; Weight = 12.5%
• 13 Week Change in LT Growth Forecast • Higher is Better; Weight = 12.5%
• Average Analyst Rating – 13 Weeks Ago • More Bearish is Better; Weight = 25%
• Average Analyst Rating – Current • More Bullish is Better; Weight = 12.5%
• 13 Week Change in Analyst Rating • More Bullish is Better; Weight = 12.5%
• From among stocks that passed the screen, select the 20 that ranked highest under this ranking system
81

The Ranking System(in Portfolio123 syntax)
• General idea is to focus on formerly-weak sentiment that has improved over the course of the past 13 weeks • Ranking system details
• LTGrth13WkAgo • Lower is Better; Weight = 25%
• LTGrthMean • Higher is Better; Weight = 12.5%
• ( LTGrthMean- LTGrth13WkAgo)/abs( LTGrth13WkAgo) • Higher is Better; Weight = 12.5%
• AvgRec13WkAgo • Higher is Better; Weight = 25%
• AvgRec • Lower is Better; Weight = 12.5%
• AvgRec/ AvgRec13WkAgo • Lower is Better; Weight = 12.5%
• From among stocks that passed the screen, select the 20 that ranked highest under this ranking system
82

10-Year Noise-Value Test
83
Model Benchmark
BASIC TESTS
Annualized Return % 11.05 9.05
Standard Deviation % 24.66 16.01
Maximum Drawdown % -57.10 -52.01
Sharpe 0.55 0.66
Sortino 0.81 0.85
Correlation 0.92 - -
Beta 1.14 - -
Annualized Alpha % 0.91 - -
ROLLING 4-WEEK HOLDING PERIODS
Average Return - All Periods 1.01 0.80
Average Return - Up Periods 4.68 3.23
Average Return - Down Periods -4.64 -3.73
3/25/08 - 3/25/18
Benchmark = iShares Russell 3000 ETF

1-Year Noise-Value Test
84
Model Benchmark
BASIC TESTS
Annualized Return % 0.27 15.23
Standard Deviation % 18.96 10.47
Maximum Drawdown % -14.45 -8.96
Sharpe -0.08 1.09
Sortino -0.12 1.55
Correlation 0.91 - -
Beta 1.65 - -
Annualized Alpha % -18.58 - -
ROLLING 4-WEEK HOLDING PERIODS
Average Return - All Periods -0.05 1.35
Average Return - Up Periods 2.13 3.08
Average Return - Down Periods -4.41 -2.13
3/25/17 - 3/25/18
Benchmark = iShares Russell 3000 ETF
Intrinsic Value(the Residual Income Model)
85
Problems with Discounted Cash Flow (DCF)
• It’s hard enough to predict one quarter ahead • Do we seriously think it’s possible to predict cash flows
five, 10 or haven forbid 15 years ahead! • I know it’s better to be vaguely right than precisely wrong,
but there have to be limits to everything • There’s a difference between being imprecise or less wrong, versus
being just-plain whacky
• Although we can never eliminate the need to predict, we should, at least, try our best to cope by: • Making as smaller number of predictions as possible, and • Trying to have as many of those predictions be of items that
are less unpredictable • DCF doe not mitigate the predictability problem. It
maximizes it!
86
RIM as an Alternative to DCF• Its Much Simpler • Only 8 inputs into an Excel spreadsheet (one of
which is the current stock price)
• Its More effective • The main driver of this model is return on equity, a
metric that’s extremely relevant to determining company quality and which tends to be stable over time
• It minimizes the unpredictability problem
87

Introducing RIM – The Residual Income Model
• Value = Capital + Present Value of Future Enhancements to Wealth • Capital = Book Value • Present Value of Future Enhancements to Wealth =
Present Value of “Residual Income” • Residual Income = Book Value * (Return on Equity –
Cost of Equity) • Residual income formula is analogous to basic net
income, which is equity multiplied by return on equity • What we’re doing here is considering only that portion
of equity that is above cost of equity; bona fide enhancements to shareholder wealth
88
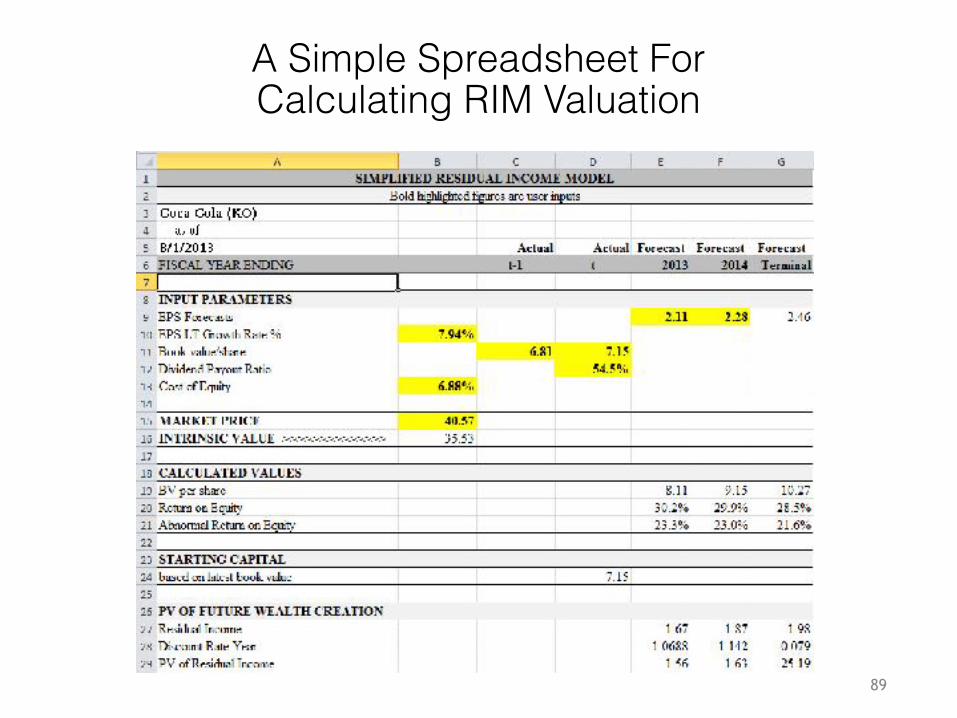
A Simple Spreadsheet For Calculating RIM Valuation
89

Simple Spreadsheet: Formulas
90
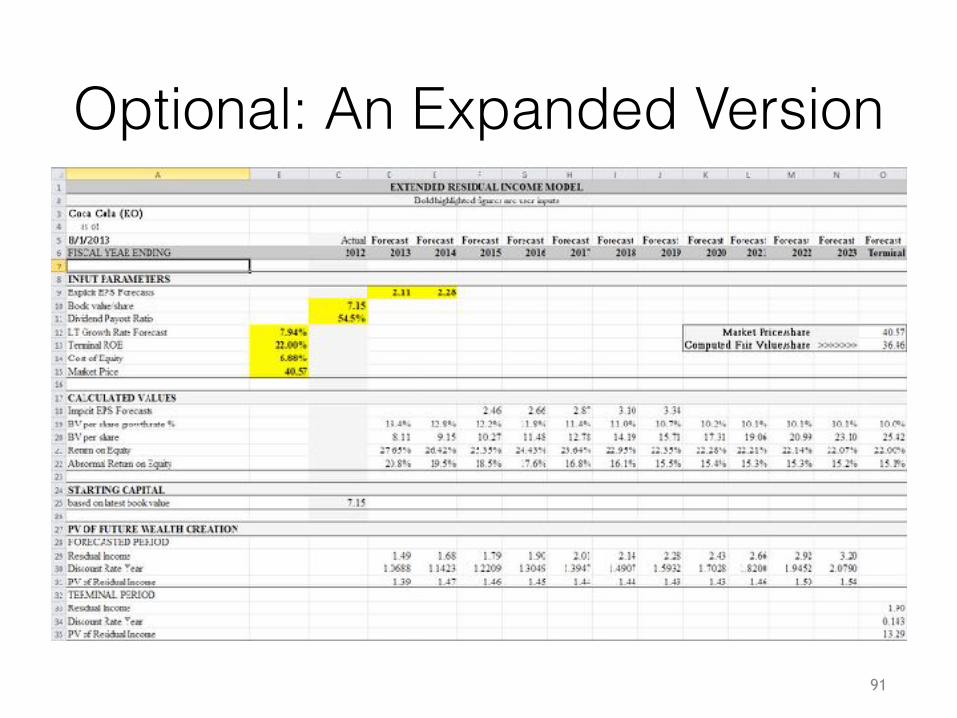
Optional: An Expanded Version
91

Expanded Version Formulas (1)
92

Expanded Version Formulas (2)
93

Exploring RIM Valuation: Preliminary Explorations• Let's start by seeing if there's anything at all here, anything that suggests we have
a chance to make this work
• Under the model to follow, I'll compare backtests of portfolios for which RIM Valuation relative to Price is in the highest 20% versus the lowest 20%
• We’re reminded that Value is not necessarily a low-risk strategy, but It looks promising, so we'll try to move from our 200-250 position study portfolios to something more investable
94
Low ValuationHi ValuationBenchmark BASIC TESTSAnnualized Return % 10.89 6.34 9.05Standard Deviation % 23.17 17.75 16.01Maximum Drawdown % -63.83 -51.78 -52.01Sharpe 0.59 0.45 0.66Sortino 0.77 0.61 0.85Correlation 0.95 0.93 - -Beta 1.37 1.03 - -Annualized Alpha % -0.87 -2.90 - - ROLLING 4-WEEK HOLDING PERIODSAverage Return - All Periods 0.88 0.43 0.80Average Return - Up Periods 4.02 2.86 3.23Average Return - Down Periods -4.98 -4.09 -3.733/25/08 - 3/25/18Benchmark = iShares Russell 3000 ETF

The RIM Model – Part 1 (In Plain English and Portfolio123 syntax)
• Establish the investment universe: Russell 3000 constituents • Universe(PRussell3000)
• Articulate screening rules that limit consideration to companies with sufficient data • Payout Ratio TTM >=0 and <100
• PayRatioTTM>=0 and PayRatioTTM<100 • Book Value Per Share Annual>0
• BVPSA>0 • Estimated EPS Current Fiscal Year >0
• CurFYEPSMean>0 • Estimated EPS Next Fiscal Year >0
• NextFYEPSMean>0
95

The RIM Model – Part 2(In Plain English)
• Follow with a series of rules that actually calculate the RIM valuations • Set cost of debt at twice the 10-year Treasury rate
• This illustrates a different approach from the one we previously used • Define @COE, Cost of Equity, at five percentage points above cost of debt • Define @Bt as Book Value per share for latest fiscal year • Define @Bt1 as @Bt + the retained portion of estimated current-year EPS • Define @Bt2 as @Bt + the retained portion of estimated earnings fior current
year and next year) • Define @ROE as current year estimated EPS divided by average of @Bt and
@Bt1 • Define @v0, starting valuation, as @Bt (last annual book value) • Define @V1 as the present value of residual income in year 1, which is @Bt
multiplied by excess ROE (@ROE-@COE) and then divided by 1+@COE • Define @V2 as present value of residual income in year 2, which is @Bt1
multiplied by excess ROE (@ROE-@COE) and then divided b y (1+@COE)^2 • Define @V3 as terminal value, year 3 residual income discounted assuming
zero growth into perpetuity: • @Bt2 time Excess ROE divided by ((1+@COE)^2)*@COE
• Define RIM-based Value, @RIMval, as @v0+@v1+@v2+@v3 96

The RIM Model – Part 2(In Portfolio123 syntax)
• Follow with a series of rules that actually calculate the RIM valuations • ShowVar(@DbtCost,(close(0,#tnx))*2/10) • ShowVar(@COE,(@DbtCost+5)/100) • ShowVar(@Bt,BVPSA) • ShowVar(@Bt1,BVPSA+(CurFYEPSMean*(1-(PayRatioTTM/100)))) • ShowVar(@Bt2,BVPSA+((CurFYEPSMean+NextFYEPSMean)*(1-
(PayRatioTTM/100)))) • ShowVar(@ROE,CurFYEPSMean/Avg(@Bt,@Bt1)) • ShowVar(@v0,@Bt) • ShowVar(@v1,((@ROE-@ COE)*@Bt)/(1+@ COE )) • ShowVar(@v2,((@ROE-@ COE)*@Bt1)/((1+@ COE)^2)) • ShowVar(@v3,((@ROE-@ COE)*@Bt2)/(((1+@ COE)^2)*@ COE)) • ShowVar(@RIMval,@v0+@v1+@v2+@v3)
97

The RIM Model – Part 3 (In Plain English and Portfolio123 syntax)up all else being equal
• Compute RIM Value as a % of market price and rank from high to low: Exclude stocks in the highest 20% of the sort • ShowVar(@P2RIM,close(0)/@RIMval) • Frank("@P2RIM",#previous)<80
• Sort on the basis of QVS (Quality-Value-Sentiment) ranking system • Quality factors reduce risk and push ideal valuations up all else
being equal • Sentiment is a judgmental proxy for attitudes re: future growth and
all else being equal, more bullish indicators push ideal valuations up all else being equal
• Value in this case consists of relative valuations, which support the direct-valuation screen
• Select the top 20 stocks
98

Testing the RIM Model
99
Model Benchmark
BASIC TESTS
Annualized Return % 14.09 9.05
Standard Deviation % 24.29 16.01
Maximum Drawdown % -62.89 -52.01
Sharpe 0.69 0.66
Sortino 0.94 0.85
Correlation 0.90 - -
Beta 1.37 - -
Annualized Alpha % 2.33 - -
ROLLING 4-WEEK HOLDING PERIODS
Average Return - All Periods 1.25 0.80
Average Return - Up Periods 4.25 3.23
Average Return - Down Periods -4.33 -3.73
3/25/08 - 3/25/18
Benchmark = iShares Russell 3000 ETF

Thank You!
100