Embed Size (px)
Citation preview
1
Indiana University-Purdue University Fort Wayne
Department of Engineering
ECE 406
Capstone Senior Design Project
Report #2
Project Title: Custom Circuit for Temperature, Pressure Sensing and Wireless Data Collection and Transmission
Team Members: Neelam Bola
Bradley Frane
Ali Izmirli
Markus Robinson
Faculty Advisor: Dr. Todor Cooklev
Date: May 3, 2012
2
Table of Contents
ACKNOWLEDGEMENT ................................................................................................................................... 3
ABSTRACT .......................................................................................................................................................... 4
SUMMARY ........................................................................................................................................................... 4
SECTION I: DESIGN DESCRIPTION ............................................................................................................. 4
1.1 INTRODUCTION AND BACKGROUND ............................................................................................................ 5 1.2 REQUIREMENTS AND SPECIFICATIONS ......................................................................................................... 5 1.3 GIVEN PARAMETERS ................................................................................................................................... 5 1.4 DESIGN VARIABLES..................................................................................................................................... 5 1.5 LIMITATIONS AND CONSTRAINTS ................................................................................................................ 6 1.6 SENSORS...................................................................................................................................................... 6 1.7 MICROPROCESSOR ....................................................................................................................................... 9 1.8 WIRELESS MODULE ..................................................................................................................................... 9 1.9 PROGRAMMING ......................................................................................................................................... 10
SECTION II: BUILDING PROCESS AND CHANGES ................................................................................ 14
SECTION III: TESTING .................................................................................................................................. 15
3.1 LIST OF PARAMETERS ................................................................................................................................ 15 3.2 TESTING PROCEDURE ................................................................................................................................ 15 3.3 DATA/MEASUREMENTS ............................................................................................................................. 17
SECTION IV: EVALUATION AND RECOMMENDATIONS .................................................................... 21
4.1 EVALUATION ................................................................................................................................................... 21 4.2 RECOMMENDATIONS ....................................................................................................................................... 23
REFERENCES ................................................................................................................................................... 25

3
Acknowledgement
The team would like to express our gratitude to everyone who helped us with making this project possible. First and foremost, our sincerest thanks are extended to our advisor Dr. Todor Cooklev and consultant with Parker Hannifin, Jeff Gustus. Without Dr. Cooklev’s experience and skilled guidance in the field of wireless communication, this project could not have been started. Also, the group would like to thank Jeff Gustus for his counsel, knowledge, and expertise with Parker Hannifin’s requirements and knowledge of wireless communication. Also, we would like to extend are sincerest gratitude to the Texas Instruments technical support team. Finally, we are grateful also to Parker Hannifin for being able to fund this project with equipment.

4
Abstract
The purpose of this project was to create a network of sensors and software that would let the consumer monitor the product that was purchased from Parker Hannifin. This information was to be wirelessly transmitted to a computer that a technician would carry around and download to view the performance of the system that the network of sensors was built for. The telemetry module would be sufficiently flexible to handle the expansion of various types of telemetry inputs without large additional investment in telemetry collection hardware. The module controller would store, process and transmit the data to a remote station wirelessly over a certain distance.
The wireless telemetry system is composed of the following components: pressure sensors, thermistor, thermocouples, motor speed sensor, data acquisition system, microprocessor, internal flash memory, wireless transmitter, wireless receiver, computer and a custom program that will decipher the information downloaded from the remote station. These components were researched, analyzed, modeled and selected to achieve specific performance criteria that will be covered in more detail later in this report. Each sensor was wired to the microprocessor board. The sensors provide analog information. The data would go through an analog-digital-converter in ordered to be stored in the memory on the board. A wireless system has been developed that is based on the industry standard IEEE 802.15.4, which is the leading technology for short-range wireless connectivity. The use of an industry standard ensures modularity and interoperability. The custom software can take the digital values from all the sensors and display the information in a graph. The technician would be able to see how the temperature and pressure acts with the speed of the motor. Also, the computer would also point out if any of the sensors fell out of the desired range.
Summary
The main goal of this project is to design, build and test a wireless telemetry module that is needed to monitor the overall performance of a system by collecting, storing and transmitting information to a data logger or maintenance terminal. A computer displays the readings from the sensors through a user interface on a computer in real-time, in such a manner that users can understand behavior of how the system is reacting in the environment. The program will be very simple and will mostly consist of checking whether the parameters are within specified ranges. The module controller would communicate when the data falls out of the range specified for the monitored system. Furthermore, the module would be able to be reprogrammable through a maintenance port that the technician can connect to the computer. Both the program and board would be able to be expanded when more sensors are needed. Section I: Design Description

5
1.1 Introduction and Background Consumers want the devices they buy from manufacturing companies to last longer. Currently manufacturing companies are looking into different ways to monitor systems that they have produced. Parker Hannifin Precision Cooling Department has requested that a low cost wireless sensor network be created that can transfer information to a wireless device, such as a computer. The system will be used to collect, store and transmit information to a data logger with a maintenance terminal. This wireless device would then allow a technician to download the data from the sensors. Then the technician can see what is the pressure, temperature and motor speed by performing a graphical analysis of the data.
A network of sensors may be wired to a module. The telemetry module should be sufficiently flexible to handle the expansion of various types of telemetry inputs without large additional investment in telemetry collection hardware. The module controller should store, process and transmit the data to a remote system wirelessly over a certain amount of distance. The processing of the data will be very simple and will mostly consist of checking whether the parameters are within specified ranges. The module controller should be able to communicate anomalies when the data falls out of the constraints specified for the monitored system. Furthermore, the module functionality should be able to be reprogrammable through the maintenance port. Finally, the telemetry module should be sufficiently scalable to allow more sensors to be connected in the future without complete redesign.
1.2 Requirements and Specifications A maintenance port shall be available via USB to support testing, debugging and
troubleshooting the firmware. The wireless module and system design shall support command and response
communication between the telemetry module and the user data terminal. The wireless transmission shall have a 128 bit encryption to protect the information
being transmitted to outside intruders.
1.3 Given Parameters The thermistor shall be a 10K, NTC (Negative Thermal Coefficient) with a range of -
40oF to +302oF with an accuracy of +/- 3.6oF. The thermocouple shall be a J type thermocouple with a range of -40oF to +302oF
with an accuracy of +/- 3.6oF. The pressure sensors shall output have a current of 4 to 20 mA with a range of 0 to
500 psi.
1.4 Design Variables The telemetry module design shall support two options: + 24V DC source and
standard USA residential 120VRMS, 60Hz. The module design shall support retain the last 7 days of measured data. Stored data
shall be purged upon receipt of a data delete command.
6
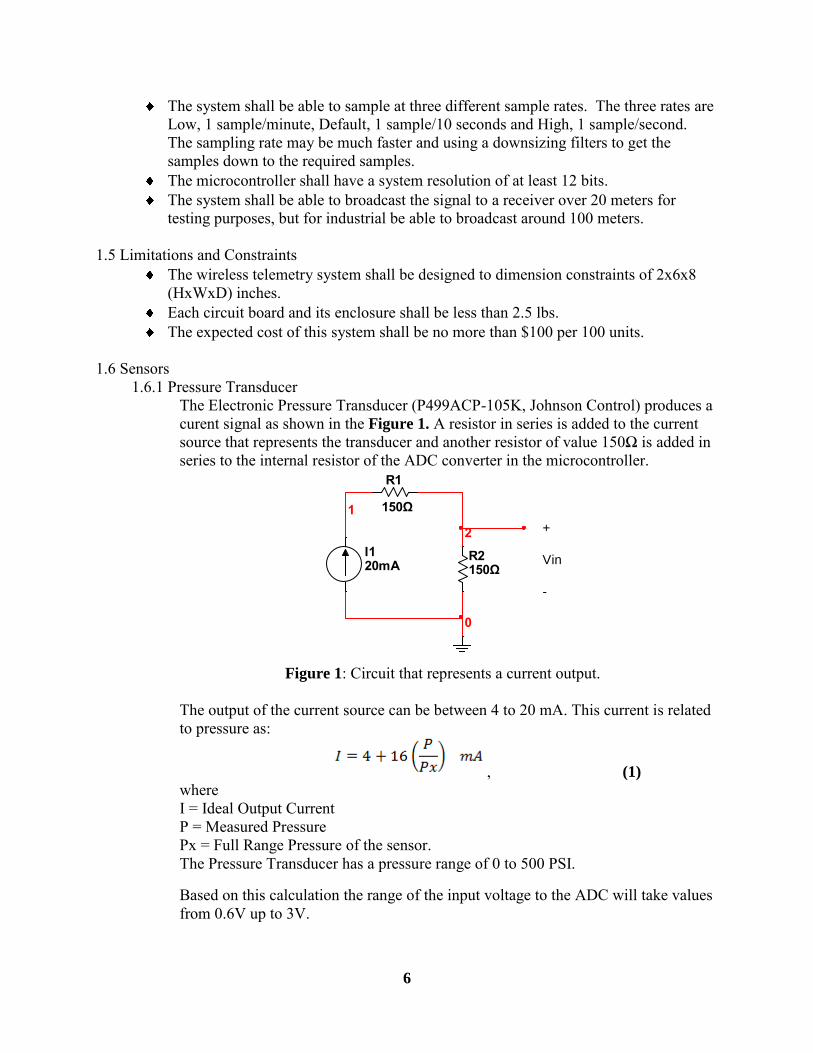
The system shall be able to sample at three different sample rates. The three rates are Low, 1 sample/minute, Default, 1 sample/10 seconds and High, 1 sample/second. The sampling rate may be much faster and using a downsizing filters to get the samples down to the required samples.
The microcontroller shall have a system resolution of at least 12 bits. The system shall be able to broadcast the signal to a receiver over 20 meters for
testing purposes, but for industrial be able to broadcast around 100 meters. 1.5 Limitations and Constraints
The wireless telemetry system shall be designed to dimension constraints of 2x6x8 (HxWxD) inches.
Each circuit board and its enclosure shall be less than 2.5 lbs. The expected cost of this system shall be no more than $100 per 100 units.
1.6 Sensors
1.6.1 Pressure Transducer The Electronic Pressure Transducer (P499ACP-105K, Johnson Control) produces a curent signal as shown in the Figure 1. A resistor in series is added to the current source that represents the transducer and another resistor of value 150Ω is added in series to the internal resistor of the ADC converter in the microcontroller.
I120mA
R1
150Ω
R2150Ω
1+
Vin
-
0
2
Figure 1: Circuit that represents a current output.
The output of the current source can be between 4 to 20 mA. This current is related to pressure as:
, (1) where I = Ideal Output Current P = Measured Pressure Px = Full Range Pressure of the sensor. The Pressure Transducer has a pressure range of 0 to 500 PSI.
Based on this calculation the range of the input voltage to the ADC will take values from 0.6V up to 3V.
7
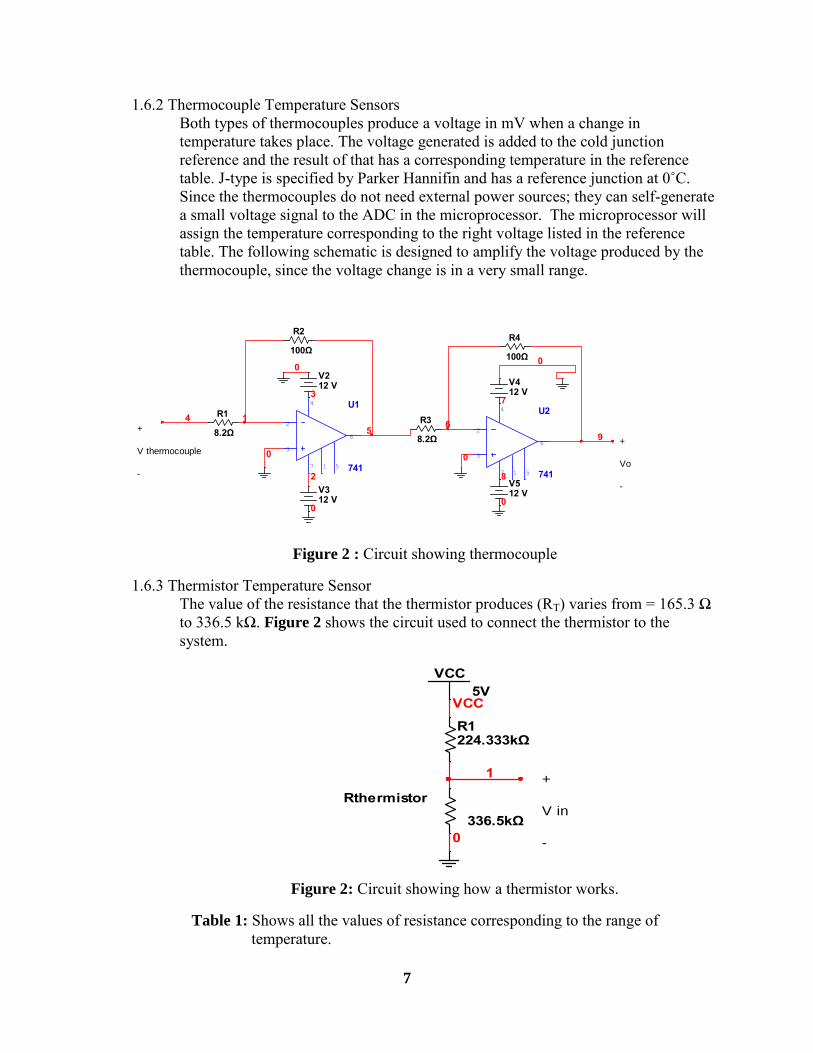
1.6.2 Thermocouple Temperature Sensors Both types of thermocouples produce a voltage in mV when a change in temperature takes place. The voltage generated is added to the cold junction reference and the result of that has a corresponding temperature in the reference table. J-type is specified by Parker Hannifin and has a reference junction at 0˚C. Since the thermocouples do not need external power sources; they can self-generate a small voltage signal to the ADC in the microprocessor. The microprocessor will assign the temperature corresponding to the right voltage listed in the reference table. The following schematic is designed to amplify the voltage produced by the thermocouple, since the voltage change is in a very small range.
U1
741
3
2
4
7
6
51
U2
741
3
2
4
7
6
51
R1
8.2Ω
R2
100Ω
R3
8.2Ω
R4
100Ω
V212 V
V312 V
V412 V
V512 V
15 6
00
0
2
0
3 7
8
0
0
9 +
Vo
-
4+
V thermocouple
-
Figure 2 : Circuit showing thermocouple
1.6.3 Thermistor Temperature Sensor The value of the resistance that the thermistor produces (RT) varies from = 165.3 Ω to 336.5 kΩ. Figure 2 shows the circuit used to connect the thermistor to the system.
VCC5V
R1224.333kΩ
Rthermistor
336.5kΩ
VCC
0
+
V in
-
1
Figure 2: Circuit showing how a thermistor works.
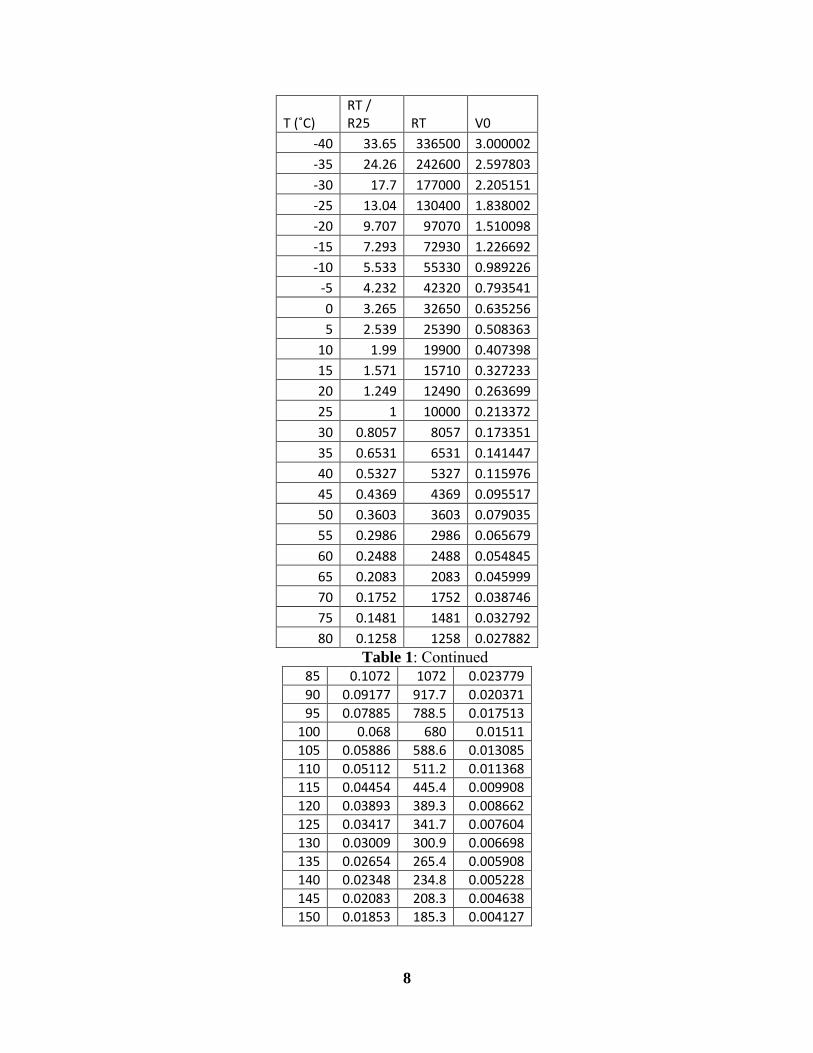
Table 1: Shows all the values of resistance corresponding to the range of temperature.
8
T (˚C) RT / R25 RT V0
-40 33.65 336500 3.000002
-35 24.26 242600 2.597803
-30 17.7 177000 2.205151
-25 13.04 130400 1.838002
-20 9.707 97070 1.510098
-15 7.293 72930 1.226692
-10 5.533 55330 0.989226
-5 4.232 42320 0.793541
0 3.265 32650 0.635256
5 2.539 25390 0.508363
10 1.99 19900 0.407398
15 1.571 15710 0.327233
20 1.249 12490 0.263699
25 1 10000 0.213372
30 0.8057 8057 0.173351
35 0.6531 6531 0.141447
40 0.5327 5327 0.115976
45 0.4369 4369 0.095517
50 0.3603 3603 0.079035
55 0.2986 2986 0.065679
60 0.2488 2488 0.054845
65 0.2083 2083 0.045999
70 0.1752 1752 0.038746
75 0.1481 1481 0.032792
80 0.1258 1258 0.027882 Table 1: Continued
85 0.1072 1072 0.023779 90 0.09177 917.7 0.020371 95 0.07885 788.5 0.017513
100 0.068 680 0.01511 105 0.05886 588.6 0.013085 110 0.05112 511.2 0.011368 115 0.04454 445.4 0.009908 120 0.03893 389.3 0.008662 125 0.03417 341.7 0.007604 130 0.03009 300.9 0.006698 135 0.02654 265.4 0.005908 140 0.02348 234.8 0.005228 145 0.02083 208.3 0.004638 150 0.01853 185.3 0.004127
9
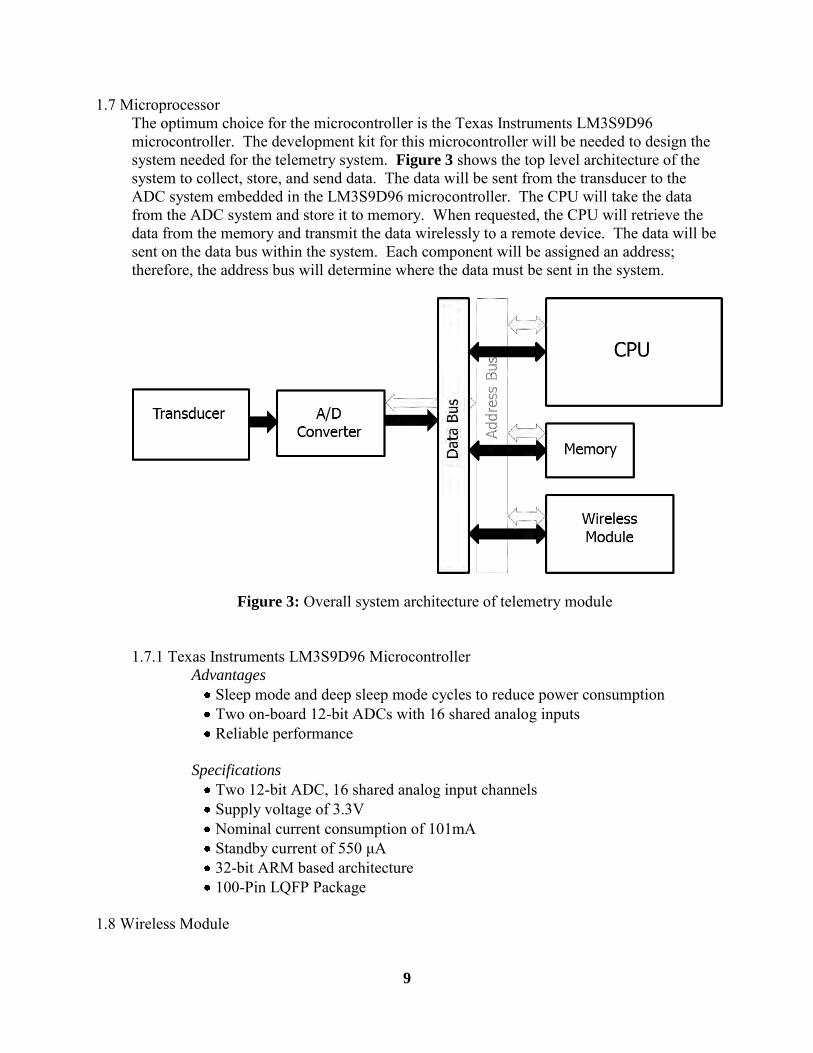
1.7 Microprocessor The optimum choice for the microcontroller is the Texas Instruments LM3S9D96 microcontroller. The development kit for this microcontroller will be needed to design the system needed for the telemetry system. Figure 3 shows the top level architecture of the system to collect, store, and send data. The data will be sent from the transducer to the ADC system embedded in the LM3S9D96 microcontroller. The CPU will take the data from the ADC system and store it to memory. When requested, the CPU will retrieve the data from the memory and transmit the data wirelessly to a remote device. The data will be sent on the data bus within the system. Each component will be assigned an address; therefore, the address bus will determine where the data must be sent in the system.
Figure 3: Overall system architecture of telemetry module
1.7.1 Texas Instruments LM3S9D96 Microcontroller
Advantages Sleep mode and deep sleep mode cycles to reduce power consumption Two on-board 12-bit ADCs with 16 shared analog inputs Reliable performance
Specifications Two 12-bit ADC, 16 shared analog input channels Supply voltage of 3.3V Nominal current consumption of 101mA Standby current of 550 μA 32-bit ARM based architecture 100-Pin LQFP Package
1.8 Wireless Module
10
The Zigbee Pro 802.15.4 module is the most optimal choice for this project. The XBee Pro is the selected module from Zigbee that will be used. A 2.4 GHz and the 900 MHz transceivers will be both used. Below in Figure 4 shows the module used for this project. The Zigbee protocol follows the industry standard IEEE 802.15.4. The key advantages to using Zigbee module are: it has a low power consumption, has a relatively long transmission range, it has the capability for a 128 bit encryption and can be expanded. The team decided to purchase the new Stellaris EM2 expansion board and the Chipcon 2.4 GHz 802.15.4 evaluation module along with the full suite of tools an engineer needs to develop and prototype ZigBee applications with Stellaris.
1.8.1 TI wireless Module with Zigbee Pro 2.4 GHz Protocal 1.8.1.1 Specifications
The Stellaris 2.4 GHz ZigBee Wireless Kit include 1 DK-LM3S9B96-EM2 Expansion Board 1 CC2520EM Low Power 2.4 GHz Radio transceiver evaluation
module 1 antenna for use with CC2520EM 2 CC2530EM Low Power SoC 2.4 GHz ZigBee modules 2 SmartRF05BB battery boards 2 antennas for use with CC2530Ems 1 CC-Debugger for reprogramming CC2530EM if needed Stellaris EM2 Expansion Board Documentation and Software CD Data Rate: 250,000 bps RX Current: 55 mA (@3.3 V) Power-down Current: < 10 μAADC
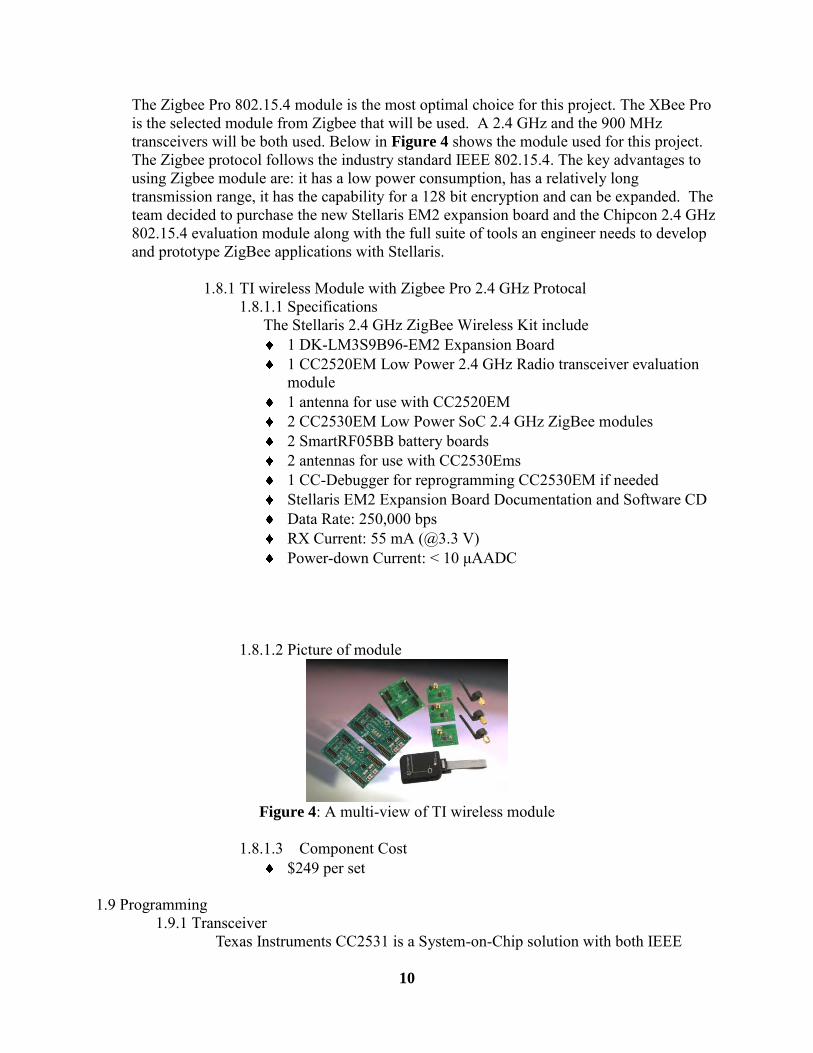
1.8.1.2 Picture of module
Figure 4: A multi-view of TI wireless module
1.8.1.3 Component Cost $249 per set
1.9 Programming
1.9.1 Transceiver Texas Instruments CC2531 is a System-on-Chip solution with both IEEE
11
802.15.4/Zigbee support for wireless communication, and USB support for serial communication. The integration of the chip allows for small sized implementation within a USB dongle.
1.9.2 Connection to Transceiver
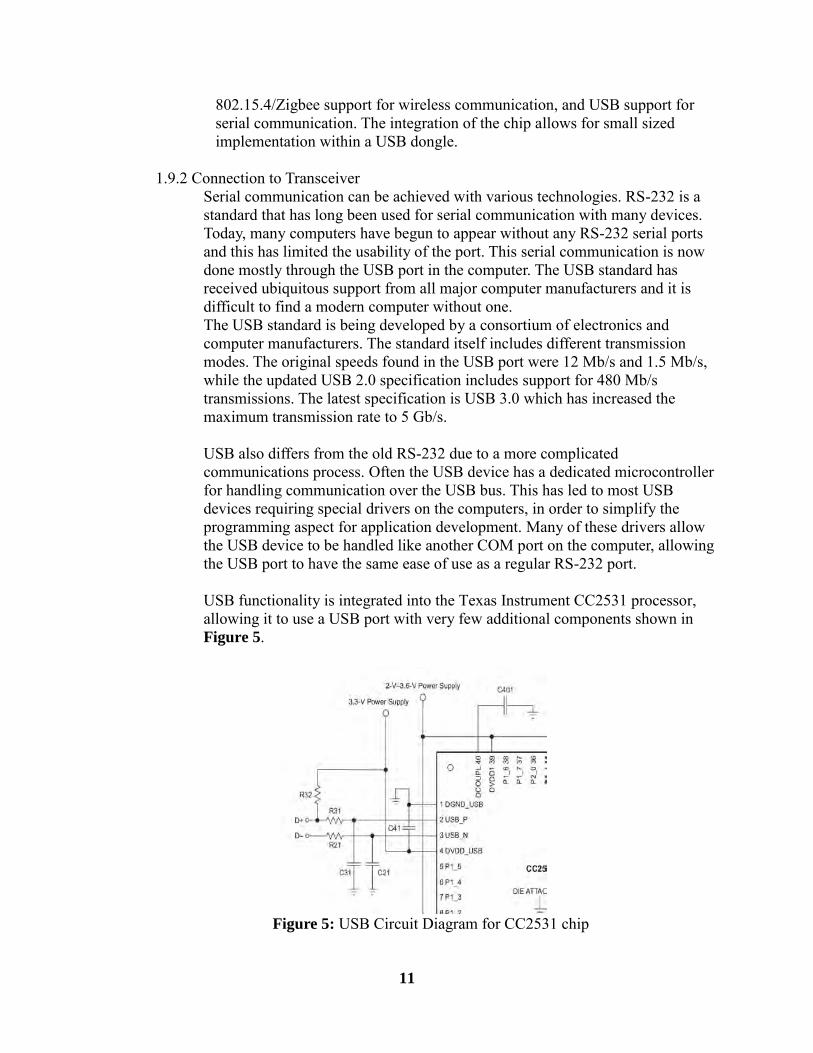
Serial communication can be achieved with various technologies. RS-232 is a standard that has long been used for serial communication with many devices. Today, many computers have begun to appear without any RS-232 serial ports and this has limited the usability of the port. This serial communication is now done mostly through the USB port in the computer. The USB standard has received ubiquitous support from all major computer manufacturers and it is difficult to find a modern computer without one. The USB standard is being developed by a consortium of electronics and computer manufacturers. The standard itself includes different transmission modes. The original speeds found in the USB port were 12 Mb/s and 1.5 Mb/s, while the updated USB 2.0 specification includes support for 480 Mb/s transmissions. The latest specification is USB 3.0 which has increased the maximum transmission rate to 5 Gb/s. USB also differs from the old RS-232 due to a more complicated communications process. Often the USB device has a dedicated microcontroller for handling communication over the USB bus. This has led to most USB devices requiring special drivers on the computers, in order to simplify the programming aspect for application development. Many of these drivers allow the USB device to be handled like another COM port on the computer, allowing the USB port to have the same ease of use as a regular RS-232 port. USB functionality is integrated into the Texas Instrument CC2531 processor, allowing it to use a USB port with very few additional components shown in Figure 5.
Figure 5: USB Circuit Diagram for CC2531 chip
12
1.9.3 Software Interface for Transceiver The transceiver has been programmed with an on-board microcontroller for wireless communication with the telemetry module, and it has also been programmed to interface through the USB port. However, the computer also needs programming in order to communicate through the USB port to the USB device. Thanks to the device drivers, the computer can be programmed as if the USB device was attached to a regular COM port on the computer. Most major programming languages have libraries for serial communication over a COM port library. These libraries are then easily integrated into the communication software. Both the Windows and Linux systems use GPL licensed RS232 library, which will communicate through a Serial Port. Both Windows and Linux systems can be a physical USB port as well, due to virtualization of the USB port as a Serial Port.
For Windows Communication, the following configuration can be used.
Windows USB driver C#
For Linux Communication, the following configuration can be used.
System CDC-ACM communication through/dev/ttyACM0 C++
Java can handle Serial Port communication through the use of Javax.comm libraries. Unfortunately they no longer enjoy official support from Oracle. A newer approach has been provided by the RXTX Project and is available through a GPL license.
1.9.4 Graphical User Interface
Data from the telemetry module will be displayed to the user with a Graphical User Interface, or GUI. This application can implement functions for user control of the communication software, the transceiver and even the telemetry module itself. The GUI can also be programmed to operate as a configuration manager for the underlying platform or the Operating System especially in cross-platform application development.
Terminal Communication Configuration Screen
Type of interface/port Connection configuration Operating System Local database
Telemetry Module Configuration Screen
State
13
Sensors Data value ranges Expected values and error conditions Data Format Password
Terminal Screen
Data in Table Columns: Sensors[16], Status, Custom (ex. trends), Reserved
(undetermined) Color coding to indicate out-of-bounds values, error conditions Resizable, scrollable Command buttons Load Data Purge Save
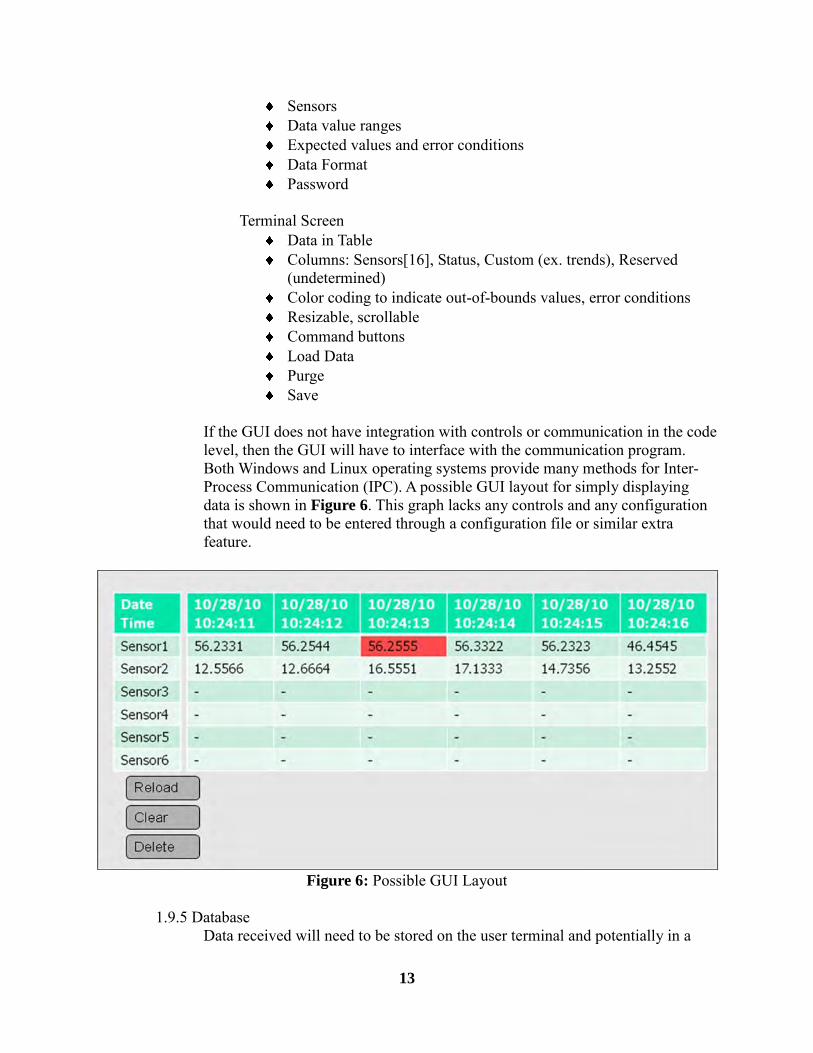
If the GUI does not have integration with controls or communication in the code level, then the GUI will have to interface with the communication program. Both Windows and Linux operating systems provide many methods for Inter-Process Communication (IPC). A possible GUI layout for simply displaying data is shown in Figure 6. This graph lacks any controls and any configuration that would need to be entered through a configuration file or similar extra feature.
Figure 6: Possible GUI Layout
1.9.5 Database
Data received will need to be stored on the user terminal and potentially in a

14
central storage location. The following data will need to be stored with a time-stamp index in the primary data table:
1. Sensors [1-16] 2. Alarm Condition 3. Device Status [1-2] 4. Time Stamp
The data will be accessed and sorted through the time stamps.
A second table will be used for sensor configuration settings. It will contain the following information:
1. Sensor ID 2. Sensor Description 3. Sensor status [enabled\disabled]
A third table will contain the configuration of the connection.
1. Connection type 2. Speed 3. Port 4. Bit setting for parity, start, stop, etc.
Section II: Building Process and Changes
When performing research last semester, we came up with a couple different ways to accomplish the project. The group, with the help of an engineer from Parker, decided to purchase a development board that would be able to handle all our requirements. The remaining tasks areto connect the sensors to the board, to make the microprocessor convert the data and transmit it to the receiver at the computer, and program the computer to receive and siplay the data . To test the sensors the group used an o’scope to figure out what type of signal is being sent. Once that was figured out the group used a function generator to send signals to the analog-to-digital convertor, to see how the microprocessor would handle the data. Concurrently, the receiver and program were being worked on to see how the data would be received by the computer. It was decided that Neel and Ali would be responsible for figuring out the sensors and the microprocessor program. The two would test the sensor to make sure a reading would be made and be sent. Markus and Brad would work in the communication from the board to the computer. Two extensive computer programs were developed. One program was created for the microprocessor to receive, store and transmit data. Another program was created to receive and display information to a local computer.
15
The group had a few difficulties with this project. One was figuring out how to power the sensors from the board. Also another problem was that the wireless module that was ordered did not meet the requirements to fit on the expansion board that was purchased for the development board in order to receive data wirelessly. Therefore, a TI wireless module was purchased that would work with the expansion board. Then the Zigbee protocol, was downloaded from TI in order to use the 2.4 GHz frequency that was specified in the system requirements. We found out from TI that there was not a 900 MHz transmitter for the expansion board and this optionwas dropped. Once the wireless module was figured out, the next problem we ran into was how the board was going to receive the data wirelessly. It was found that TI created a dongle, CC2531 that acted as a receiver with the proper driver and program downloaded to it. The only disadvantage to using the CC2531 dongle as a receiver is that the antenna on the dongle may not be powerful enough to receive a signal over the 10 meters that the team wanted to achieve. One of the team members found that it may be possible to use one of the SmartRF05BB with batteries as a wireless extender in order to increase the range . Another issue that came up was that a circuit board had to be built to power the sensors. The group also ran into a 60 Hz feedback signal in the data being sent to the board. The team decided to add a filter in order to filter out the signal. A filter was able to filter out the signal and the sensor data was able to be received. The final problem that arose was that the computer receiver was originally designed to display the data via a serial COM port. The problem came when the data was being transmitted wirelessly. Therefore, the computer was not displaying the data in the program that was built for it . The data is still able to be received in the hyper terminal which will work, but not match the requirements that we set for the program. Once, the debugging was finished with the program, the original program that was written was able to display the data.
Section III: Testing
3.1 List of Parameters The telemetry module must read four transducers: two for temperature, one for
pressure, and one for speed. Accurate and precise conversion from the analog sensor data with 1% accuracy to
actual data The telemetry module will be able to store 7 days of sensor data Data will be transmitted 20 meters for the prototype and 100 meters in the final
design to the computer system A notification feature must be able to notify the technician if the data falls out of
specified parameters Terminal can request data from telemetry module. Terminal is able to accurately display the transducer data to the user in a table. Terminal can clear telemetry module memory.
3.2 Testing Procedure
16
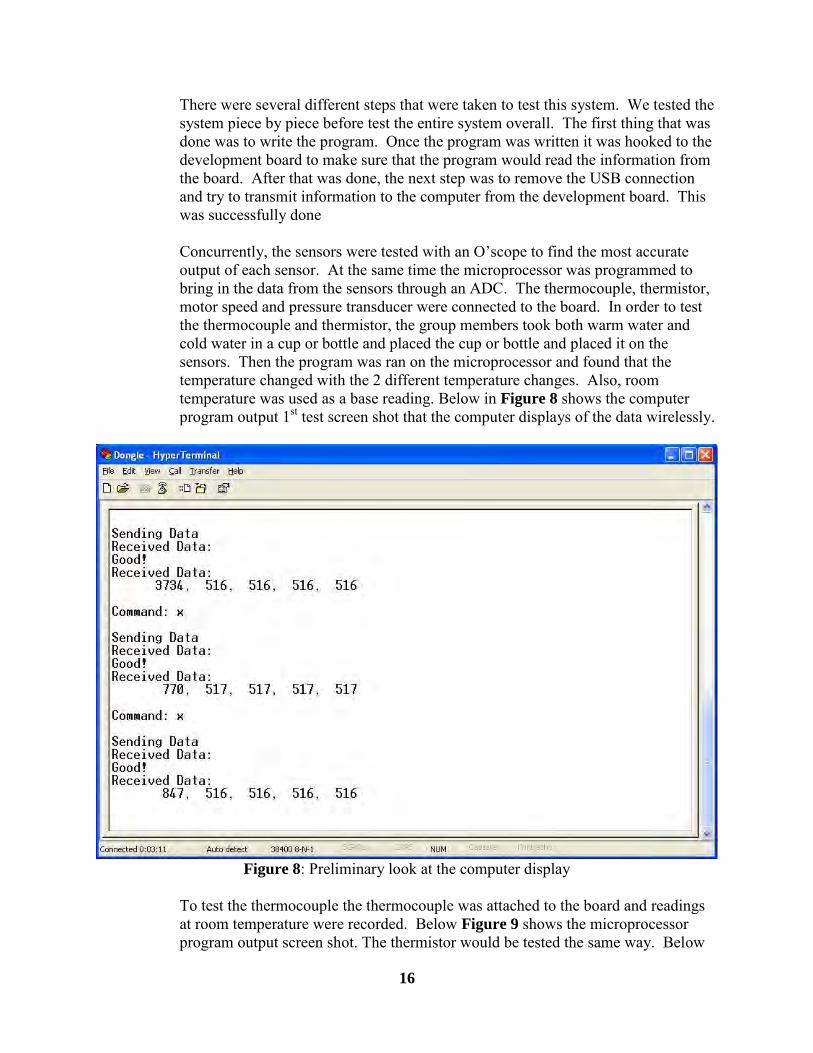
There were several different steps that were taken to test this system. We tested the system piece by piece before test the entire system overall. The first thing that was done was to write the program. Once the program was written it was hooked to the development board to make sure that the program would read the information from the board. After that was done, the next step was to remove the USB connection and try to transmit information to the computer from the development board. This was successfully done Concurrently, the sensors were tested with an O’scope to find the most accurate output of each sensor. At the same time the microprocessor was programmed to bring in the data from the sensors through an ADC. The thermocouple, thermistor, motor speed and pressure transducer were connected to the board. In order to test the thermocouple and thermistor, the group members took both warm water and cold water in a cup or bottle and placed the cup or bottle and placed it on the sensors. Then the program was ran on the microprocessor and found that the temperature changed with the 2 different temperature changes. Also, room temperature was used as a base reading. Below in Figure 8 shows the computer program output 1st test screen shot that the computer displays of the data wirelessly.
Figure 8: Preliminary look at the computer display
To test the thermocouple the thermocouple was attached to the board and readings at room temperature were recorded. Below Figure 9 shows the microprocessor program output screen shot. The thermistor would be tested the same way. Below
17
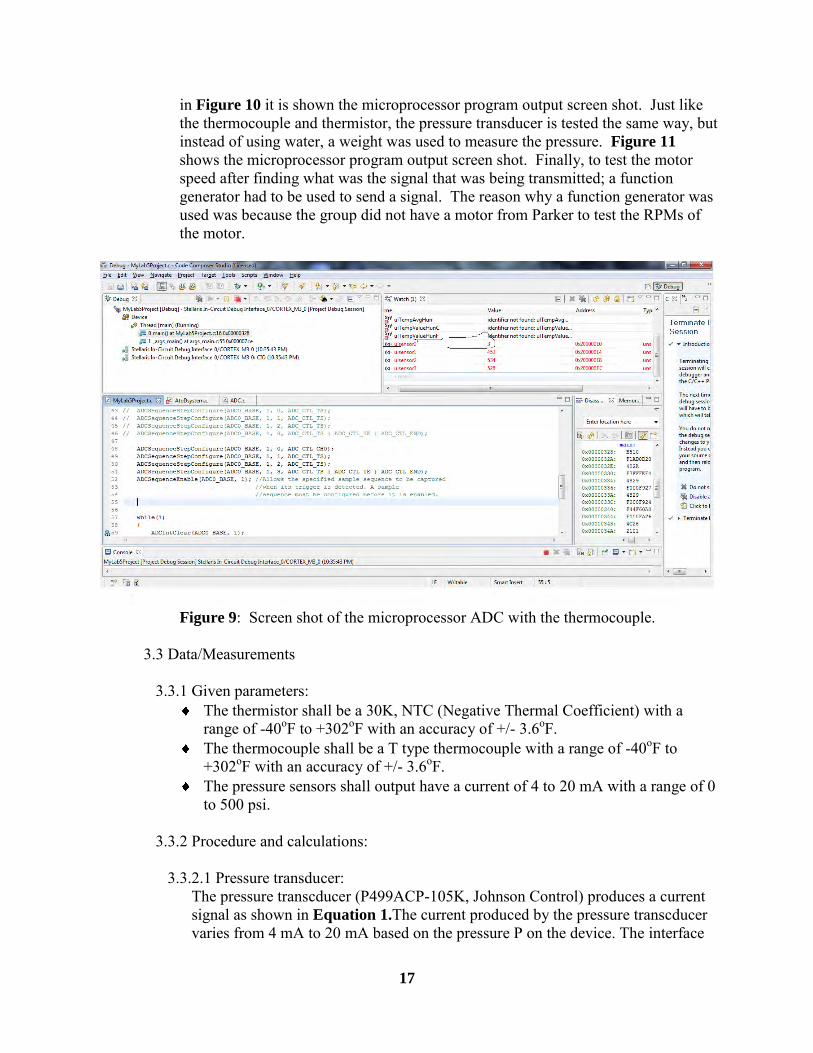
in Figure 10 it is shown the microprocessor program output screen shot. Just like the thermocouple and thermistor, the pressure transducer is tested the same way, but instead of using water, a weight was used to measure the pressure. Figure 11 shows the microprocessor program output screen shot. Finally, to test the motor speed after finding what was the signal that was being transmitted; a function generator had to be used to send a signal. The reason why a function generator was used was because the group did not have a motor from Parker to test the RPMs of the motor.
Figure 9: Screen shot of the microprocessor ADC with the thermocouple.
3.3 Data/Measurements 3.3.1 Given parameters:
The thermistor shall be a 30K, NTC (Negative Thermal Coefficient) with a range of -40oF to +302oF with an accuracy of +/- 3.6oF.
The thermocouple shall be a T type thermocouple with a range of -40oF to +302oF with an accuracy of +/- 3.6oF.
The pressure sensors shall output have a current of 4 to 20 mA with a range of 0 to 500 psi.
3.3.2 Procedure and calculations:
3.3.2.1 Pressure transducer: The pressure transcducer (P499ACP-105K, Johnson Control) produces a current signal as shown in Equation 1.The current produced by the pressure transcducer varies from 4 mA to 20 mA based on the pressure P on the device. The interface
18
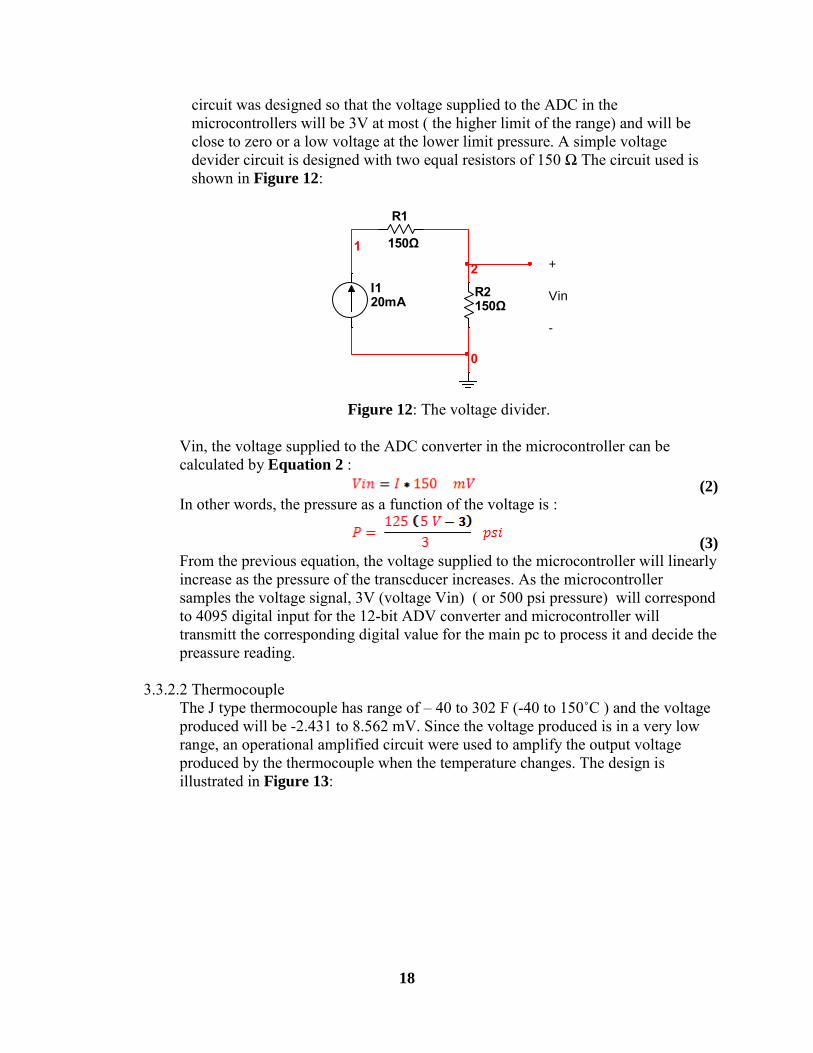
circuit was designed so that the voltage supplied to the ADC in the microcontrollers will be 3V at most ( the higher limit of the range) and will be close to zero or a low voltage at the lower limit pressure. A simple voltage devider circuit is designed with two equal resistors of 150 Ω The circuit used is shown in Figure 12:
I120mA
R1
150Ω
R2150Ω
1+
Vin
-
0
2
Figure 12: The voltage divider.
Vin, the voltage supplied to the ADC converter in the microcontroller can be calculated by Equation 2 :
(2)
In other words, the pressure as a function of the voltage is :
(3) From the previous equation, the voltage supplied to the microcontroller will linearly increase as the pressure of the transcducer increases. As the microcontroller samples the voltage signal, 3V (voltage Vin) ( or 500 psi pressure) will correspond to 4095 digital input for the 12-bit ADV converter and microcontroller will transmitt the corresponding digital value for the main pc to process it and decide the preassure reading.
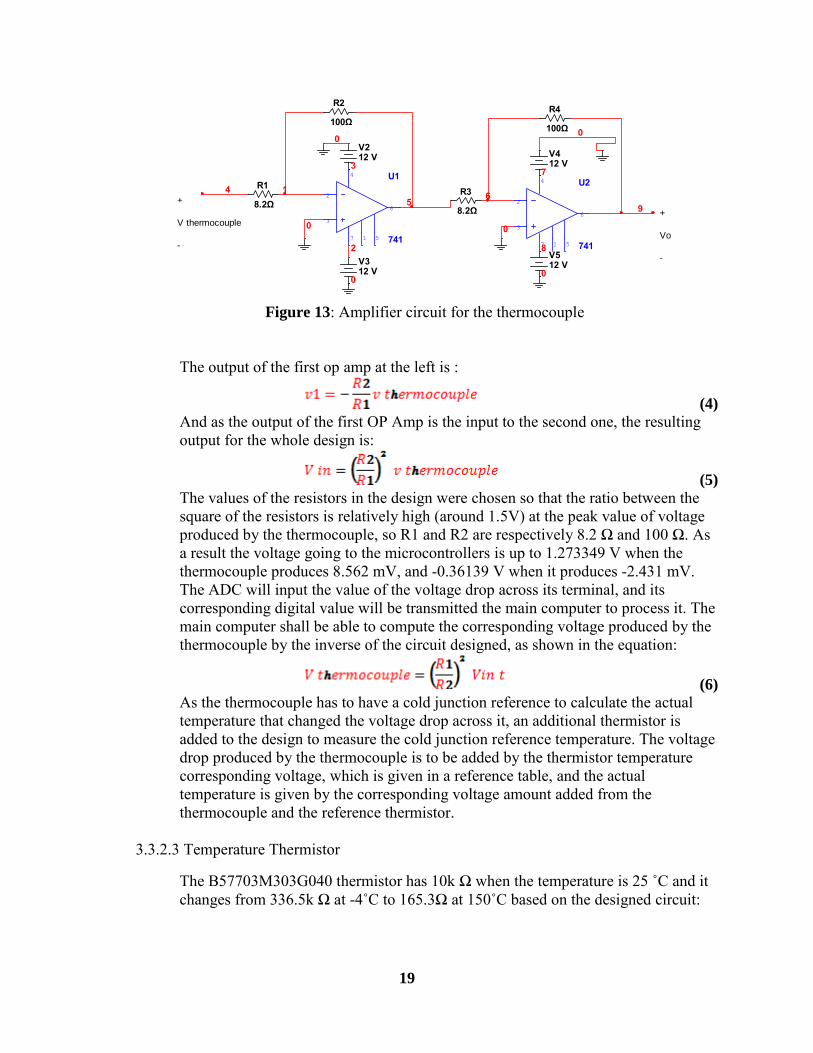
3.3.2.2 Thermocouple The J type thermocouple has range of – 40 to 302 F (-40 to 150˚C ) and the voltage produced will be -2.431 to 8.562 mV. Since the voltage produced is in a very low range, an operational amplified circuit were used to amplify the output voltage produced by the thermocouple when the temperature changes. The design is illustrated in Figure 13:
19
U1
741
3
2
4
7
6
51
U2
741
3
2
4
7
6
51
R1
8.2Ω
R2
100Ω
R3
8.2Ω
R4
100Ω
V212 V
V312 V
V412 V
V512 V
15 6
00
0
2
0
3 7
8
0
0
9 +
Vo
-
4+
V thermocouple
-
Figure 13: Amplifier circuit for the thermocouple
The output of the first op amp at the left is :
(4) And as the output of the first OP Amp is the input to the second one, the resulting output for the whole design is:
(5) The values of the resistors in the design were chosen so that the ratio between the square of the resistors is relatively high (around 1.5V) at the peak value of voltage produced by the thermocouple, so R1 and R2 are respectively 8.2 Ω and 100 Ω. As a result the voltage going to the microcontrollers is up to 1.273349 V when the thermocouple produces 8.562 mV, and -0.36139 V when it produces -2.431 mV. The ADC will input the value of the voltage drop across its terminal, and its corresponding digital value will be transmitted the main computer to process it. The main computer shall be able to compute the corresponding voltage produced by the thermocouple by the inverse of the circuit designed, as shown in the equation:
(6) As the thermocouple has to have a cold junction reference to calculate the actual temperature that changed the voltage drop across it, an additional thermistor is added to the design to measure the cold junction reference temperature. The voltage drop produced by the thermocouple is to be added by the thermistor temperature corresponding voltage, which is given in a reference table, and the actual temperature is given by the corresponding voltage amount added from the thermocouple and the reference thermistor.
3.3.2.3 Temperature Thermistor
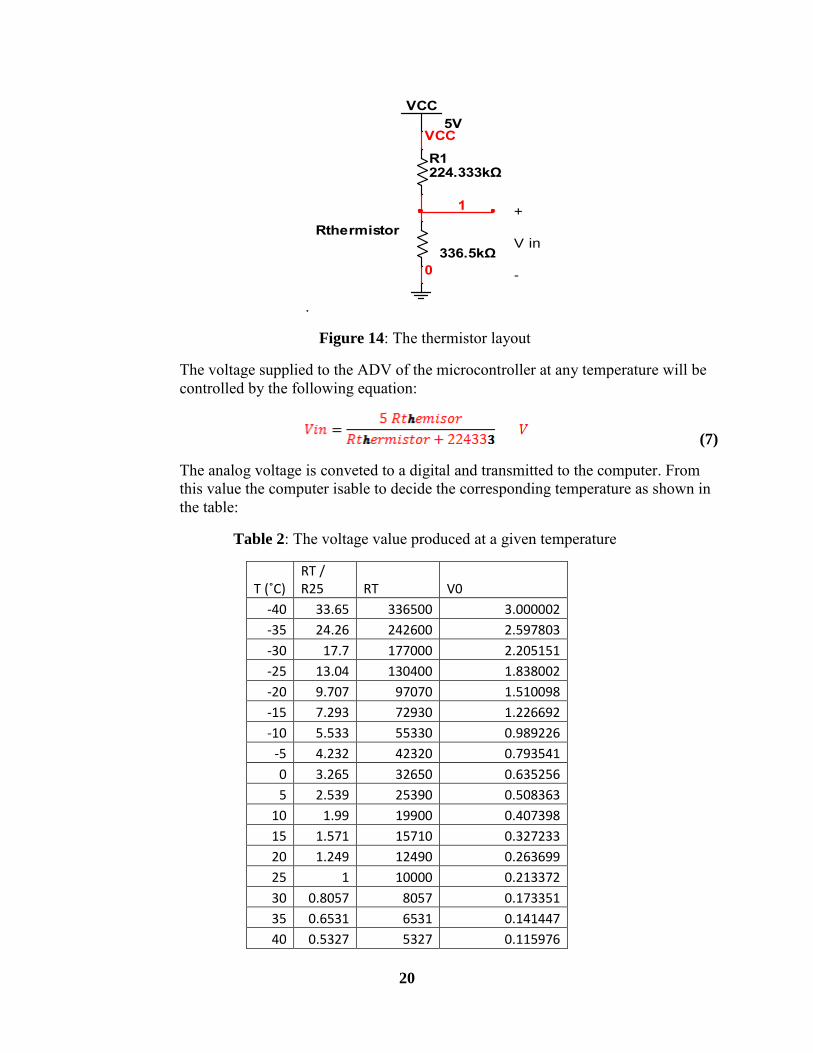
The B57703M303G040 thermistor has 10k Ω when the temperature is 25 ˚C and it changes from 336.5k Ω at -4˚C to 165.3Ω at 150˚C based on the designed circuit:
20
.
VCC5V
R1224.333kΩ
Rthermistor
336.5kΩ
VCC
0
+
V in
-
1
Figure 14: The thermistor layout
The voltage supplied to the ADV of the microcontroller at any temperature will be controlled by the following equation:
(7)
The analog voltage is conveted to a digital and transmitted to the computer. From this value the computer isable to decide the corresponding temperature as shown in the table:
Table 2: The voltage value produced at a given temperature
T (˚C) RT / R25 RT V0
-40 33.65 336500 3.000002
-35 24.26 242600 2.597803
-30 17.7 177000 2.205151
-25 13.04 130400 1.838002
-20 9.707 97070 1.510098
-15 7.293 72930 1.226692
-10 5.533 55330 0.989226
-5 4.232 42320 0.793541
0 3.265 32650 0.635256
5 2.539 25390 0.508363
10 1.99 19900 0.407398
15 1.571 15710 0.327233
20 1.249 12490 0.263699
25 1 10000 0.213372
30 0.8057 8057 0.173351
35 0.6531 6531 0.141447
40 0.5327 5327 0.115976
21
45 0.4369 4369 0.095517
50 0.3603 3603 0.079035
55 0.2986 2986 0.065679
60 0.2488 2488 0.054845
65 0.2083 2083 0.045999
70 0.1752 1752 0.038746
75 0.1481 1481 0.032792
80 0.1258 1258 0.027882
85 0.1072 1072 0.023779
90 0.09177 917.7 0.020371
95 0.07885 788.5 0.017513
100 0.068 680 0.01511
105 0.05886 588.6 0.013085 Table 2: Contiued
110 0.05112 511.2 0.011368 115 0.04454 445.4 0.009908 120 0.03893 389.3 0.008662 125 0.03417 341.7 0.007604 130 0.03009 300.9 0.006698 135 0.02654 265.4 0.005908 140 0.02348 234.8 0.005228 145 0.02083 208.3 0.004638 150 0.01853 185.3 0.004127
Section IV: Evaluation and Recommendations
4.1 Evaluation 4.1.1 Sensor Requirements
All the sensors used meet the previously stated requirements for range of pressure and temperature.
4.1.2 Terminal Application
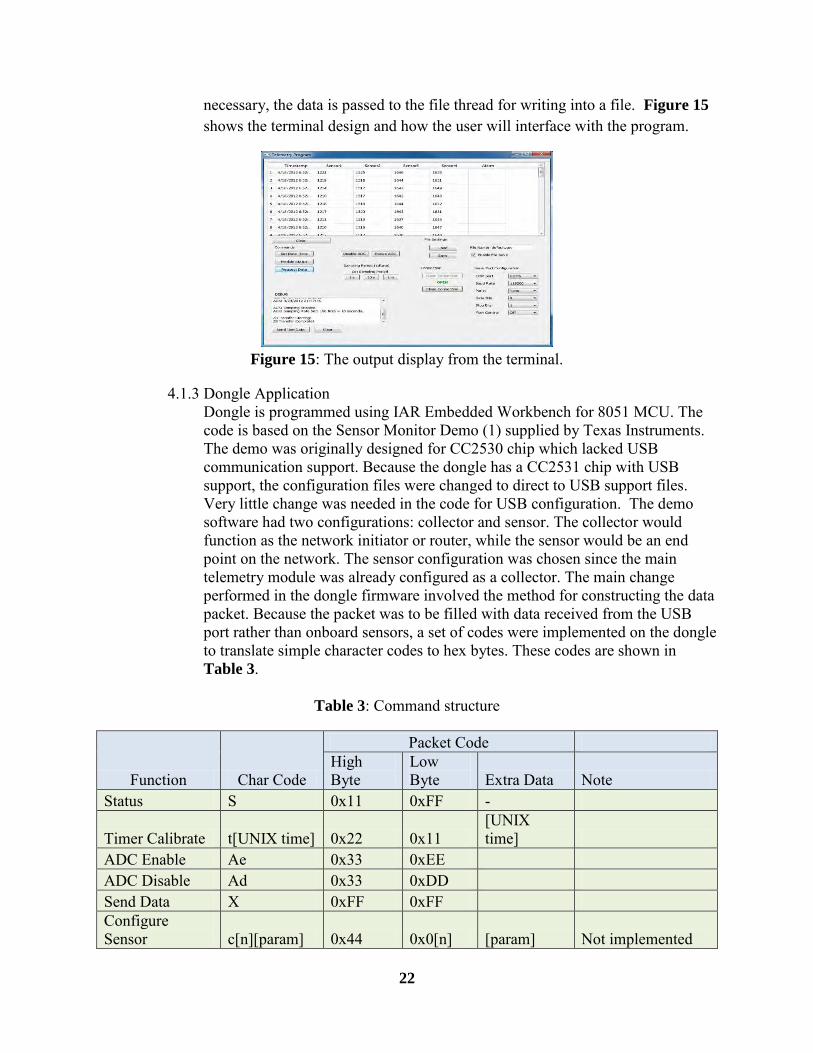
The Telemetry Terminal Program has three threads. The main thread initializes the GUI and starts the threads for COM port communication and file access. The program is written with Qt Creator 2.4.1 which is based on Qt 4.2.4. It is configures as a QWidget application. The Serial Port connection is maintained in its own QThread implementation which is initialized from the main thread. Once the openPort() public function is issued, the port is opened and the thread is started. The port access is done through QextSerialPort library. This library was a 3rd party component added to the project, and was built using Qt Creator. The library and its paths were added to the .pro configuration. The file handling is also maintained in its own thread. The data received by the COM port thread is first passed to the main thread which then parses the data. After the parsing, if
22
necessary, the data is passed to the file thread for writing into a file. Figure 15 shows the terminal design and how the user will interface with the program.
Figure 15: The output display from the terminal.
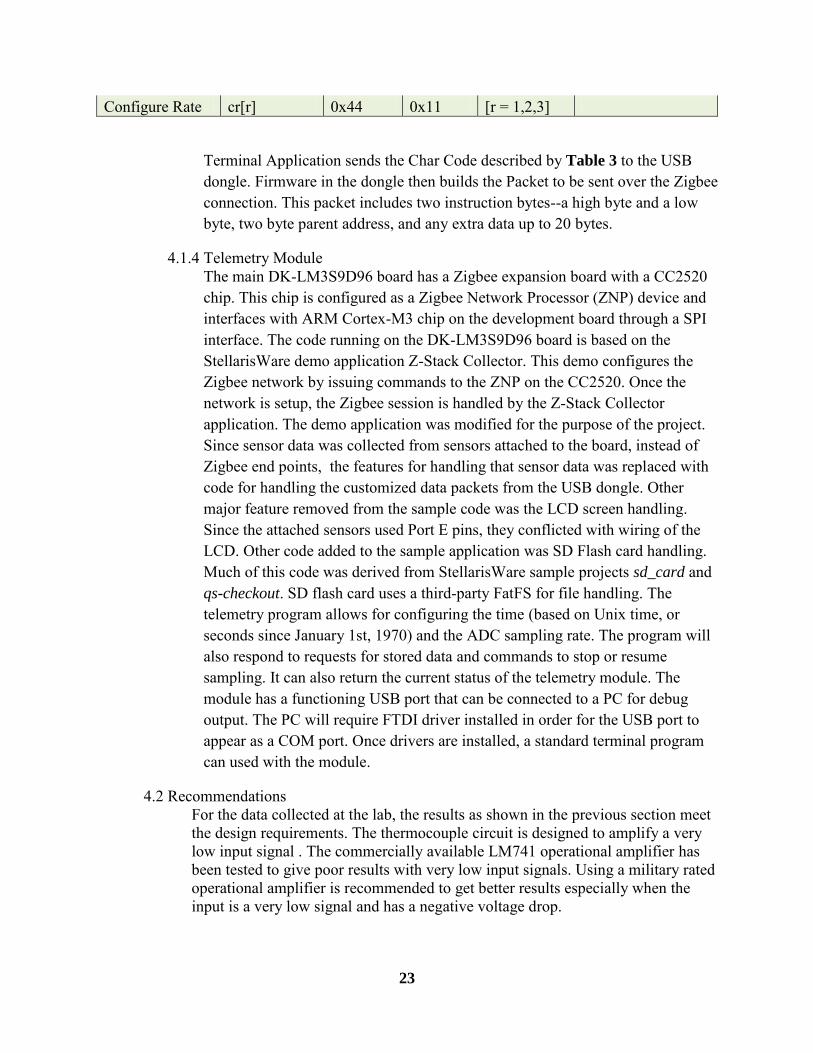
4.1.3 Dongle Application Dongle is programmed using IAR Embedded Workbench for 8051 MCU. The code is based on the Sensor Monitor Demo (1) supplied by Texas Instruments. The demo was originally designed for CC2530 chip which lacked USB communication support. Because the dongle has a CC2531 chip with USB support, the configuration files were changed to direct to USB support files. Very little change was needed in the code for USB configuration. The demo software had two configurations: collector and sensor. The collector would function as the network initiator or router, while the sensor would be an end point on the network. The sensor configuration was chosen since the main telemetry module was already configured as a collector. The main change performed in the dongle firmware involved the method for constructing the data packet. Because the packet was to be filled with data received from the USB port rather than onboard sensors, a set of codes were implemented on the dongle to translate simple character codes to hex bytes. These codes are shown in Table 3.
Table 3: Command structure
Function Char Code
Packet Code High Byte
Low Byte Extra Data Note
Status S 0x11 0xFF -
Timer Calibrate t[UNIX time] 0x22 0x11 [UNIX time]
ADC Enable Ae 0x33 0xEE ADC Disable Ad 0x33 0xDD Send Data X 0xFF 0xFF Configure Sensor c[n][param] 0x44 0x0[n] [param] Not implemented
23
Configure Rate cr[r] 0x44 0x11 [r = 1,2,3]
Terminal Application sends the Char Code described by Table 3 to the USB dongle. Firmware in the dongle then builds the Packet to be sent over the Zigbee connection. This packet includes two instruction bytes--a high byte and a low byte, two byte parent address, and any extra data up to 20 bytes.
4.1.4 Telemetry Module The main DK-LM3S9D96 board has a Zigbee expansion board with a CC2520 chip. This chip is configured as a Zigbee Network Processor (ZNP) device and interfaces with ARM Cortex-M3 chip on the development board through a SPI interface. The code running on the DK-LM3S9D96 board is based on the StellarisWare demo application Z-Stack Collector. This demo configures the Zigbee network by issuing commands to the ZNP on the CC2520. Once the network is setup, the Zigbee session is handled by the Z-Stack Collector application. The demo application was modified for the purpose of the project. Since sensor data was collected from sensors attached to the board, instead of Zigbee end points, the features for handling that sensor data was replaced with code for handling the customized data packets from the USB dongle. Other major feature removed from the sample code was the LCD screen handling. Since the attached sensors used Port E pins, they conflicted with wiring of the LCD. Other code added to the sample application was SD Flash card handling. Much of this code was derived from StellarisWare sample projects sd_card and qs-checkout. SD flash card uses a third-party FatFS for file handling. The telemetry program allows for configuring the time (based on Unix time, or seconds since January 1st, 1970) and the ADC sampling rate. The program will also respond to requests for stored data and commands to stop or resume sampling. It can also return the current status of the telemetry module. The module has a functioning USB port that can be connected to a PC for debug output. The PC will require FTDI driver installed in order for the USB port to appear as a COM port. Once drivers are installed, a standard terminal program can used with the module.
4.2 Recommendations For the data collected at the lab, the results as shown in the previous section meet the design requirements. The thermocouple circuit is designed to amplify a very low input signal . The commercially available LM741 operational amplifier has been tested to give poor results with very low input signals. Using a military rated operational amplifier is recommended to get better results especially when the input is a very low signal and has a negative voltage drop.
24
Some other recommendations would be to configure sensor parameters such as acceptable temperature ranges (the telemetry module and dongle firmware would need an update as well), which would differ from customer to customer. Without it the "alarm" column will always be empty. Disable/Enable buttons depending on the conditions to prevent accidental button pushing when the system isn't ready (already done for Open/Close connection). It is also desirable to make the program more aesthetically pleasing to the user. Resizing of the window is not handled very well by the program. Enumeration of the COM ports should be added so that only applicable COM ports appear on the drop down box. Also, configure COM ports so that it won’t be COM port specific on the computer. Once the driver is installed it will always use the same COM port, which in our case was COM6 (now the program defaults). The debug buttons are the wrong ones. We wanted to leave in the line-entered test data, and not the predefined data used by the "Send Test Data" button.
Finally, some other recommendations would to build a case that would be able to protect the development board. Also, one could buy a newer more powerful antenna for the dongle so that the range that it would pick up a signal would be extended. Then one could also buy a case for the USB dongle in order to protect it.
Conclusion
The components were determined by the team to complete the project. System requirements were determined to be within Parker Hannifin’s guidelines. Many components were analyzed one by one and the right components were picked. Parker Hannifin set a budget to keep the project under $5000. After performing a cost analysis on the project parts, it is projecting to cost only $1266.63. Engineering hours worked on this project was around 425 hours. The goal was hit to keep the price of the device below $5000. The actual cost of the project without the debugger, because it would only be during prototyping, and the buying the parts in bulk units would be around $1000. Using TI development kit was decided one with a TI 2.4 GHz wireless transceiver with a Zigbee protocal. If the engineering hours were added to the project to develop the system with an engineer that would make about $40 an hour, the overall first prototype would be around $19,000.
The group ran into some unforeseen problems that kept us from getting the project to work fully. Like what was described earlier about the circuit needed to be built to power all the sensors. In the end a circuit was built on a bread board to get power to the sensors. Another unforeseen problem was the wireless transmission module. Changes had to be made to how we were going to transmit, but that was fixed and we were able to take TI wireless module and transmit the data across a Zigbee 2.4 GHz protocol. Figure 15 was not the only way that the group wanted to display the information on the screen. Also, a graphical display was also desirable. It is great that the data gets stored in an excel file because a Marco can now be made in excel and a graph be displayed. A program was written earlier in the year and the board was transmitting data to the board over a COM terminal and not wirelessly. In spite of all the difficulties, overall, the team was able to design, build, and test a functioning system.
25
References
"2.4-GHz CyFi™ Transceiver." Cypress Perform. Cypress Semiconductor Corporation, 18 Aug. 2011. Web. 27 Sept. 2011. <http://www.cypress.com/?docID=30716>.
"ADC Oversampling Techniques." Texas Instruments . Texas Instruments, 07/07/2009. Web. 11 Dec 2011. <http://www.ti.com/lit/an/spma001/spma001.pdf>.
"Cypress CY8C29466-24PXI." Cypress Semiconductor. Cypress, 07/12/2011. Web. <http://www.cypress.com/?mpn=CY8C29466-24PXI>.
"Fast Response Surface Thermocouples with Self-Adhesive Backing." Sensors, Thermocouple,
PLC, Operator Interface, Data Acquisition, RTD. Web. 12 Nov. 2011. <http://www.omega.com/pptst/SA1.html>. Institute of Electrical and Electronics Engineers. IEEE 802.11, The Working Group Setting the Standards for Wireless LANs. 31 August 2010 <http://www.ieee802.org/11/>. IEEE 802.15 Working Group for Wireless Personal Area Networks (WPANs). 31 August 2010. "Interface between Data Terminal Equipment and Data Communication Equipment Employing Serial Binary Data Interchange. (Book, 1969) [WorldCat.org]." WorldCat.org: The World's Largest Library Catalog. Web. 09 Dec. 2011. <http://www.worldcat.org/title/interface-between-data-terminal-equipment-and-data-communication-equipment-employing-serial-binary-data-interchange/oclc/38637094>. Mitchell, Bradley. "Wireless Standards - 802.11b 802.11a 802.11g 802.11n - Which Is Best?" Networking - Computer and Wireless Networking Basics - Home Networks Tutorials. About.com Guide. Web. 6 Oct. 2011. <http://compnetworking.about.com/cs/wireless80211/a/aa80211standard.htm>.
"NTC Thermistor for Temperature Measurements ." epcos.com. Epcos, inc , February 2009. Web. 13 Nov 2011. <http://www.epcos.com/inf/50/db/ntc_09/ProbeAss__B57703__M703.pdf>.
"P499 Series Electronic Pressure Transducers". http://s3.pexsupply.com. Johnson Controls, June 13, 2007. Web. 13 Nov 2011. <http://s3.pexsupply.com/manuals/1280336286027/35389_PROD_FILE.pdf>.
26
"Personal Area Networks - ZigBee RF4CE - CC2531 - TI.com." Analog, Embedded Processing, Semiconductor Company, Texas Instruments. Web. 09 Dec. 2011. <http://www.ti.com/product/cc2531>.
"Product Manual V1.xEx - 802.15.4 Protocol." XBee®/XBee-PRO® RF Modules. Digi International Inc., 23 Sept. 2009. Web. 26 Sept. 2011. <http://www.sparkfun.com/datasheets/Wireless/Zigbee/XBee-Datasheet.pdf>.
RS-232 for Linux and WIN32, Tue 25 October 2011. <http://www.teuniz.net/RS-232/>.
"Revised Thermocouple Reference Table". Omega Engineering inc, n.d. Web. 12 Nov 2011. <Fast Response Surface Thermocouples with Self-Adhesive Backing> Sensors, Thermocouple, PLC, Operator Interface, Data Acquisition, RTD. Web. 12 Nov. 2011.
"Stellaris ARM Cortex." Texas Instruments . Texas Instruments, 07/20/2011. Web. 11 Dec 2011. <http://www.ti.com/product/lm3s9d96>.
"The Comparison of Wi-Fi, Bluetooth and ZigBee. (n.d)." SENA BLOG. 1 December 2010 <http://www.sena.com/blog/?p=359>.
Universal Serial Bus Revision 3.0 Specification, USB-IF, 1 May 2011. <http://usb.org>.
"XBee-PRO® 900." Point-to-Multipoint Embedded RF Modules for OEMs. Digi International Inc., 2008. Web. 21 Oct. 2011. <http://www.sparkfun.com/datasheets/Wireless/Zigbee/XBee-900-Datasheet.pdf>.


![[XLS] · Web viewIndiana University-Purdue University Fort Wayne (IPFW) Ramesh Narang 481-6384 narang@ipfw.edu 2101 E. Coliseum Blvd. Fort Wayne 46805 Iowa State University Logistics,](https://img.pdfslide.net/doc/110x75/5b427a187f8b9afa2c8b90e9/xls-web-viewindiana-university-purdue-university-fort-wayne-ipfw-ramesh.jpg)