Embed Size (px)
Citation preview

India’s Balance of PaymentsConcepts, Compilation and Recent Scenario
EPW Research Foundation*October 2003
* An original note on the subject was published in the Economic and Political Weekly (EPW) of November 13-20, 1993.The same has been thoroughly revised and updated by Ms. Shilpa Jain for publication on the website www.epwrf.res.in

Contents
Section No. Title Page No.
List of Exhibits and Appendices i
I Key Concepts 1Current and Capital AccountsMerchandise on FOB/ CIF basisInvisiblesCapital Account
II Sources of BOP Data 5Difference between RBI BOP data and customs dataApparent gaps in BOP data
III An Overview of India’s Balance of Payments 10
Notes 12
List of Text Tables
Text Table
1: India’s Foreign Trade:A Comparison of DGCI & S and RBI Data 6
2: Foreign Exchange Reserves:1950-51 to 2002-03 14
3: Financing of Current Account Deficits:1950-51 to 2002-03 15
4: Balance of Payments-Selected Indicators:1950-51 to 2001-02 17

List of Exhibits and AppendicesTitle Page No.
ExhibitsExhibit
A: Estimation of Invisible Accounts -A Comparison of RBI Classification with the IMF Classification (IMF BOP MANUAL) 7
B: Estimation of Invisible Accounts -A Comparison of RBI Classification with the IMF Classification (IMF BOP Yearbook) 8
AppendicesAppendix
1: Balance of Payments:1950-51 to 1989-90 (Rs. Crore / Dollar Million) 191990-91 to 2002-03 (Rs. Crore) 231990-91 to 2002-03 (US Dollar Million) 26
2: Break-up of Invisibles on Current Account 29(A) Travel Account 35
(B) Transportation Account :(i) 1956-57 to 1989-90 (Rs. Crore) 36(ii) 1990-91 to 2001-02 (Rs. Crore/ Dollar Million) 38
(C) Insurance Account :(i) 1956-57 to 1996-97 (Rs. Crore) 40(ii) 1997-98 to 2001-02 (Rs. Crore/ Dollar Million) 41
(D) Investment Income Account :(i) 1956-57 to 1996-97 (Rs. Crore) 42(ii) 1997-98 to 2001-02 (Rs. Crore/ Dollar Million) 45
(E) Government not included elsewhere Account :(i) 1956-57 to 1989-90 (Rs. Crore) 46(ii) 1990-91 to 2001-02 (Rs. Crore/ Dollar Million) 47
(F) Miscellaneous Account :(i) 1956-57 to 1989-90 (Rs. Crore) 48(ii) 1990-91 to 2001-02 (Rs. Crore/ Dollar Million) 50
(G) Official Transfer Payments Account :(i) 1956-57 to 1989-90 (Rs. Crore) 52(ii) 1990-91 to 2001-02 (Rs. Crore/ Dollar Million) 54
(H) Private Transfer Payments Account :(i) 1956-57 to 1989-90 (Rs. Crore) 55(ii) 1990-91 to 2001-02 (Rs. Crore/ Dollar Million) 57
3: Foreign Inevestment(A),(B) Private Foreign Investment 58
(C) Foreign Investment Inflows 59
4: NRI DepositsA Inflows under FCNR and NR(E)RA Accounts 60NRI Deposits Outstanding 61
5: External Transactions as per CSO’s 62National Account Statistics
i

India’s Balance of PaymentsConcepts, Compilation and Recent Scenario
IKey Concepts
A balance of payments statement is essentially a double entry system of record for a given period ofan economy’s two-way international transactions in the form of goods and services, receipts and paymentsof incomes, transfers without quid pro quo and financial claims and liabilities. With a view to standardisingthe concepts and definitions, classificatory schemes and conventions applied in the compilation of balanceof payments statistics by various countries, the International Monetary Fund (IMF) has prescribed a Balanceof Payments Manual1 . India, as in the case of other member countries of the IMF, has adopted the sameas a conceptual and methodological basis for compiling her balance of payments account. However, thereexist some departures from the IMF framework due to the constraints of data availability and to take accountof the country’s institutional structure2.
Principally, the balance of payments (BOP) account records transactions between a resident economicentity and rest of the world. Though the resident status of an individual is conceived in terms of the permanenceof interest within a given territory, the rule of thumb adopted for recognition of such permanence is a stayof one year or more. Tourist and commercial travellers, employees of foreign governments and internationalbodies on a mission of less than one year and seasonal workers from foreign countries are all consideredas residents of the economy in which they normally live. Major exceptions to this are the official diplomaticand consular representatives, members of armed forces and other government personnel of a foreign countrystationed in a given country who are treated (together with their dependents) as non-residents for the countryof their posting or as residents of the country they represent.
Current and Capital Accounts
In BOP accounting, transactions relating to goods, services and income, and current transfers constitutethe current account, while those relating to claims and liabilities of a financial nature and capital transfersand acquisition or disposals of non-produced, non-financial assets which go to finance the deficit on currentaccount, or to absorb its surplus, form the capital account. The sum of these current and capital accounttransactions together constitutes the basic balance on BOP and theoretically it should be finally roundedup. The double-entry accounting should be closed with the help of: a) purchase and repurchase from theIMF essentially as a multilateral agency for the countries’ BOP support, b) allocation of the IMF’s SpecialDrawing Rights (SDRs) intended to supplement the relatively inadequate international reserves and alsoto serve as a principle reserve asset of the international monetary system, and finally, c) the build-up ordraw down of the country’s own reserve assets. Incidentally, the objective of SDRs serving as a principalreserve asset was scuttled in the midst of the controversy regarding the justification or otherwise for additionalreserve assets.
The above is the theoretical position; in reality, due to myriad discrepancies arising from differences intiming, coverage, valuation and possible inaccurate estimation (which also includes clandestine capital flightthrough various devices), the credit side of the double entry accounting does not exactly match the sumof all debit entries. Therefore, the balancing act is performed by an item called “errors and omissions”—a negative sign in it implying an overstatement of receipts and an understatement of payments, generallya combination of both, and the positive sign signifying the reverse. It is very often found that in years oflarge depreciation of the rupee, the “errors and omissions” remain negative.
Merchandise on FOB / CIF basis
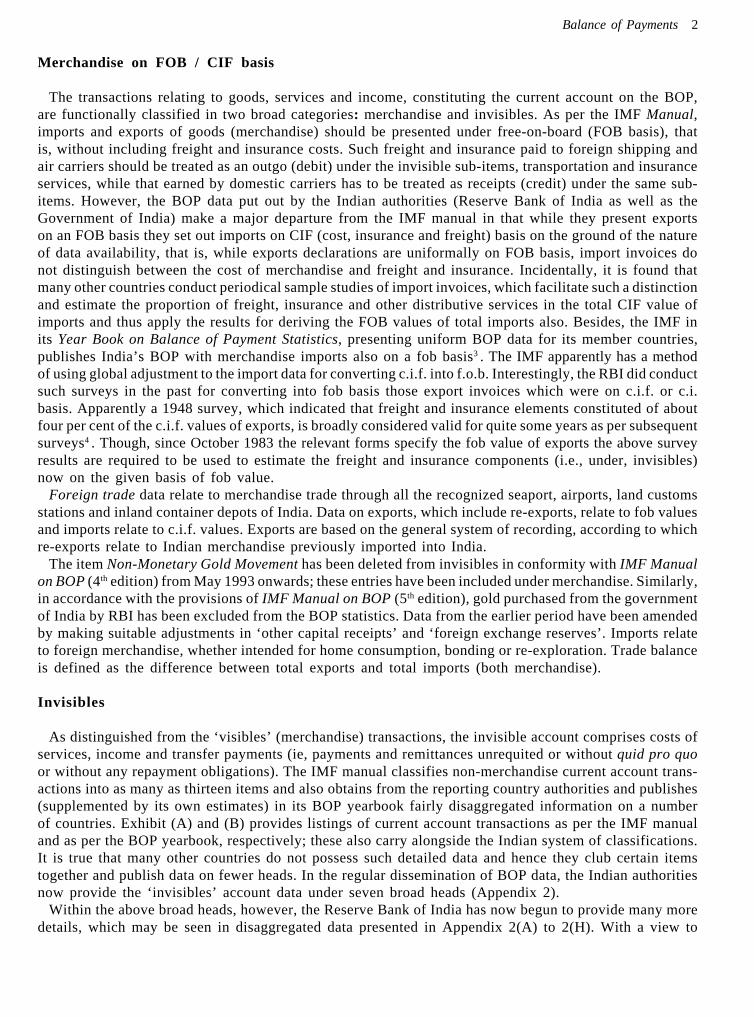
The transactions relating to goods, services and income, constituting the current account on the BOP,are functionally classified in two broad categories: merchandise and invisibles. As per the IMF Manual,imports and exports of goods (merchandise) should be presented under free-on-board (FOB basis), thatis, without including freight and insurance costs. Such freight and insurance paid to foreign shipping andair carriers should be treated as an outgo (debit) under the invisible sub-items, transportation and insuranceservices, while that earned by domestic carriers has to be treated as receipts (credit) under the same sub-items. However, the BOP data put out by the Indian authorities (Reserve Bank of India as well as theGovernment of India) make a major departure from the IMF manual in that while they present exportson an FOB basis they set out imports on CIF (cost, insurance and freight) basis on the ground of the natureof data availability, that is, while exports declarations are uniformally on FOB basis, import invoices donot distinguish between the cost of merchandise and freight and insurance. Incidentally, it is found thatmany other countries conduct periodical sample studies of import invoices, which facilitate such a distinctionand estimate the proportion of freight, insurance and other distributive services in the total CIF value ofimports and thus apply the results for deriving the FOB values of total imports also. Besides, the IMF inits Year Book on Balance of Payment Statistics, presenting uniform BOP data for its member countries,publishes India’s BOP with merchandise imports also on a fob basis3 . The IMF apparently has a methodof using global adjustment to the import data for converting c.i.f. into f.o.b. Interestingly, the RBI did conductsuch surveys in the past for converting into fob basis those export invoices which were on c.i.f. or c.i.basis. Apparently a 1948 survey, which indicated that freight and insurance elements constituted of aboutfour per cent of the c.i.f. values of exports, is broadly considered valid for quite some years as per subsequentsurveys4 . Though, since October 1983 the relevant forms specify the fob value of exports the above surveyresults are required to be used to estimate the freight and insurance components (i.e., under, invisibles)now on the given basis of fob value.
Foreign trade data relate to merchandise trade through all the recognized seaport, airports, land customsstations and inland container depots of India. Data on exports, which include re-exports, relate to fob valuesand imports relate to c.i.f. values. Exports are based on the general system of recording, according to whichre-exports relate to Indian merchandise previously imported into India.
The item Non-Monetary Gold Movement has been deleted from invisibles in conformity with IMF Manualon BOP (4th edition) from May 1993 onwards; these entries have been included under merchandise. Similarly,in accordance with the provisions of IMF Manual on BOP (5th edition), gold purchased from the governmentof India by RBI has been excluded from the BOP statistics. Data from the earlier period have been amendedby making suitable adjustments in ‘other capital receipts’ and ‘foreign exchange reserves’. Imports relateto foreign merchandise, whether intended for home consumption, bonding or re-exploration. Trade balanceis defined as the difference between total exports and total imports (both merchandise).
Invisibles
As distinguished from the ‘visibles’ (merchandise) transactions, the invisible account comprises costs ofservices, income and transfer payments (ie, payments and remittances unrequited or without quid pro quoor without any repayment obligations). The IMF manual classifies non-merchandise current account trans-actions into as many as thirteen items and also obtains from the reporting country authorities and publishes(supplemented by its own estimates) in its BOP yearbook fairly disaggregated information on a numberof countries. Exhibit (A) and (B) provides listings of current account transactions as per the IMF manualand as per the BOP yearbook, respectively; these also carry alongside the Indian system of classifications.It is true that many other countries do not possess such detailed data and hence they club certain itemstogether and publish data on fewer heads. In the regular dissemination of BOP data, the Indian authoritiesnow provide the ‘invisibles’ account data under seven broad heads (Appendix 2).
Within the above broad heads, however, the Reserve Bank of India has now begun to provide many moredetails, which may be seen in disaggregated data presented in Appendix 2(A) to 2(H). With a view to
Balance of Payments 2

disseminating more disaggregated data on India’s trade and services, the RBI has published such statisticsseparately for the period 1956-57 to 1998-99 in its monthly bulletins of March and April 1992 and in itscomprehensive publication Balance of Payments: 1948-49 to 1988-89 (July 1993); this practice has beencontinued thereafter on an annual basis. Apart from some broad details presented in Appendix 2A, attemptshave been made to cull out more disaggregated data on invisibles from the above studies which are presentedin eight separate sets in Appendix 2(A) to 2(H). As may be observed from these disaggregated data, Indiahas now begun to provide many more details; earlier income consisted only of investment income whereasnow one more sub-category ‘compensation of employees’ is added, in accordance with the IMF’s Balanceof Payments Manual (5th edition), 1993, under the head ‘income’ with effect from 1997-98. Earlier, theIndian practice was to record ‘compensation of employees’ under the head ‘services-miscellaneous’. Since1990-91, the value of defence related imports are recorded under imports (merchandise debit) with creditsfinancing such imports shown under “loans (external commercial borrowings) to India” in the capital account.Based on the recommendations of a high-level committee in their Reports of Policy Group and TaskForce on External Debt Statistics of India, 1992 (RBI), interest payments on defence debt owed to thegeneral currency area (GCA) are recorded under investment income (debit) and principal repayments underdebit to “Loans (external commercial borrowings) to India”.
The IMF classifies transfers as ‘current transfers’ and ‘capital transfers’. Transfers basically representreceipts and payments without quid pro quo. Current transfers include those of general government (eg,current international cooperation between different governments, payments of current taxes on income andwealth, etc.) and other transfers (eg, workers remittances, premiums-less service charges), and claims onnon-life insurance. Definitionally, capital transfers should include:
1. Transfer of ownership of fixed asset or2. The forgiveness of a liability by a creditor when no counter-part is received in return, or3. A transfer of cash when linked to, or conditional on, the acquisition or disposal of a fixed asset
(eg investment grant) by one or both parties to the transaction.Finally, capital transfer should result in a commensurate change in the stocks of assets of one or both
parties to the transaction. Due to non-availability of data, the RBI is unable to provide such segregationinto current and capital transfers; instead it has segregated transfers into private and official.
Government not included elsewhere represents remittances towards maintenances of foreign embassies,diplomatic missions and international/ regional institutions.
Miscellaneous services encompass communication services, software services, construction services,royalties, copyrights and licence fees, news agency services and others. Because of the emergence of softwareservices as a highly focused and dynamic area of export activity in the 1990s, it is shown as a separatesub-item under ‘Miscellaneous’ since 2000-01.
Investment income transactions are in the form of interest, dividend, profit and others for servicing ofcapital transactions. Investment income receipts comprise interest received on loans to non-residents, dividend/profit received by Indians on foreign investments, reinvested earnings of Indian FDI companies abroad,interest received on debentures, floating rate notes (FRNs), commercial papers (CPs), fixed deposits andfunds held abroad by ADs out of foreign currency loans/export proceeds, payments of taxes by non-residents/refunds of taxes by foreign governments and interest/discount earnings on RBI holding of foreign assets.Investment income payments comprise payment of interest on non-received deposits, payment of intereston loans from non-residents, payment of dividend/profit to non-resident shareholders, reinvested earningsof the FDI companies, payments of interest on debentures, FRNs, CPs, fixed deposits, government securities,charges on SDRs and others.
Even so, while the Indian classification of current transactions is found to be fairly comprehensive, someloss of information in it relating to the following items is noticed:
1. As explained earlier, data on insurance and freight on imports, which would constitute part of theitems transportation and insurance, are in fact included under merchandise.
2. Under the Indian classification, transactions relating to the life insurance business of the Life InsuranceCorporation of India or those relating to the general insurance business of the Indian general insurance
3 Balance of Payments

companies abroad for domestic hazards in those countries are clubbed under the item insurancewhich also covers the insurance of merchandise trade. The IMF classification places this undera separate item called ‘other goods, services and income’.
Expenditures of diplomatic missions in India or those of Indian missions abroad are not presented separatelyin the Indian data, whereas the IMF publishes such data under the head ‘other foreign official, NIE’ evenfor India separately.
Capital Account
Though the IMF manual distinguishes a large number of items under the capital account, India, as in thecase of many other countries, has dovetailed the accounting classification to fit into its own institutionalstructure and analytical needs. Until the end of the 1980s, key sectors distinguished under the capital accountwere: (i) private capital, (ii) banking capital, and (iii) official capital.
Private capital was sub-divided into (i) long-term and (ii) short-term, with loans of original maturity ofone year or less constituting the relevant dividing line. Long-term private capital, as published in the regularBOP data, covered foreign investments (both direct and portfolio), long-term loans, foreign currency deposits(FCNR and NRE) and an estimated portion of the unclassified receipts allocated to capital account. Bankingcapital essentially covered movements in the external financial assets and liabilities of commercial and co-operative banks authorised to deal in foreign exchange. Official capital transactions, other than those withthe IMF and movements in RBI’s holdings of foreign currency assets and monetary gold (SDRs are heldby the government), were classified into (i) loans, (ii) amortisation, and (iii) miscellaneous receipts andpayments. In the data base created here, statistical series on BOP for the period 1950-51 to 1989-90 arein this format (See Appendix 1A). Independent data published by the RBI give disaggregation of FDI byapproval categories and that of portfolio investments by types of flow. In FDI, there are three sourcesof approvals: government [Secretariat of Industrial Approvals (SIA) and Foreign Investment Promotion Board(FIPB)]; RBI; and NRI investments (See Appendix 3B). Likewise, RBI puts out data on NRI depositsunder different categories of deposits (Appendix 4A and 4B).
For the subsequent period, from 1990-91 onwards, the classification adopted is as follows:(i) Foreign investment, which is bifurcated into Foreign Direct Investment (FDI) and portfolio
investment. The FDI in India could be in the form of inflow of investment (credit) and outflowin the form of disinvestments (debit) or abroad in the reverse manner. The portfolio investment5 ,on the other had, comes in the form of Foreign Institutional Investors (FIIs), offshore fundsand Global Depository Receipts (GDRs) and American Depository Receipts (ADRs). The dataon acquisition of shares (acquisition of shares of Indian companies by non-residents under section5 of FEMA, 1999) has been included as part of foreign direct investment since January 1996.
(i) Loans, which are further classified into external assistance, medium and long-term commercialborrowings and short-term borrowings, with loans of original maturity of one-year or lessconstituting the relevant dividing line. The principal repayment of the defence debt to the GeneralCurrency Area (GCA) is shown under the debit to loans (external commercial borrowing toIndia) for the general currency area since 1990-91.
(ii) Banking capital comprises external assets and liabilities of commercial and government banksauthorized to deal in foreign exchange, and movement in balance of foreign central banks andinternational institutions like, World Bank, IDA, ADB and IFC maintained with RBI. An importantcomponent of banking capital is non-resident (NRI) deposits.
(iii) Rupee debt service contains interest payment on, and principal re-payment of, debt for theerstwhile rupee payments area (RPA). (This is done based on the recommendation of high-level committee on balance of payments.)
(iv) Other capital is a residual item and broadly includes delayed exports receipts, funds raisedand held abroad by Indian corporate, India’s subscriptions to international institutions and quotapayments to IMF. Delayed export receipts essentially arises from the leads and lags between
Balance of Payments 4

the physical shipment of goods recorded by the customs and receipt of funds through bankingchannel. It also includes rupee value of gold acquisition by the RBI (monetization of gold).
(v) Movement in Reserves comprises changes in the foreign currency assets held by the RBI andSDR balances held by the government of India. These are recorded after excluding changeson account of valuation. Valuation changes arise because foreign currency assets are expressedin US dollar terms and they include the effect of appreciation/depreciation of non-US currencies(such as Euro, Sterling, Yen and others) held in reserves. Furthermore, this item does not includereserve position with IMF.
As per the earlier classification, institutional character of the Indian creditor/debtor formed the dividingline for a capital account transaction, whereas now it is the functional nature of the capital transactionthat dominates the classification.
FDI to and by India up to 1999-2000 comprised mainly equity capital. In line with international best practices,the coverage of FDI has been expanded since 2000-01 to include, besides equity capital, reinvested earnings(retained earnings of FDI companies) and ‘other direct capital’ (inter-capital debt transactions betweenrelated entities). Data on equity capital include equity of unincorporated bodies. Reinvested earnings forthe latest year (2002-03) are estimated as average of the previous two years as these data are availablewith time-lag of a year. In view of the above revision, FDI data are not comparable with similar data forthe previous years (Appendix 3C). In terms of standard practise of BOP compilation, the above revisionof FDI data would not affect India’s overall position as the accretion to the foreign exchange reserveswould not undergo any change. The composition of BOP, however, would undergo changes. These changesrelate to investment income, external commercial borrowings and ‘errors and omissions’. In case of reinvestedearnings, there is a contra-entry (payments) of equal magnitude under investment income in the currentaccount. ‘Other Capital’ reported as part of FDI inflow has been carved out from the figure reported underexternal commercial borrowings by the same amount. ‘Other Capital’ by Indian companies abroad and equitycapital of unincorporated entities have been adjusted against ‘errors and omissions’ for 2000-01 and 2001-02.
IISources of BOP Data
The compilation of BOP data are considerably facilitated by two important prescriptions under foreignexchange regulations, which are a universal feature in the governance of transactions in foreign exchange,and which therefore have continued in India even after external sector liberalisation and replacement ofthe Foreign Exchange Regulation Act (FERA), 1973 by the Foreign Exchange Management Act (FEMA),1999. The prescriptions are: (i) all foreign exchange transactions are required to be channelled throughthe banking system; and (ii) the authorised dealers (ADs) are required to submit various returns to theRBI on those transactions (RBI 1987).
The compilation is thus done on the basis of such statistical returns submitted by ADs to the RBI. Themost important return is the well-known R returns, which covers export receipts, import payments, andalso non-merchandise transactions (current and capital) beyond a cut-off limit; this cut-off limit prescribedfor the supplementary statement of receipts in respect of purposes other than exports, was varied fromtime to time; it was Rs. 1 lakh and above for some time up to January 2001 but was raised to $ 10,000and above thereafter. These R return schedules, including the supplementary statement of receipts, for non-merchandise transactions are now obtained from about 2,000 AD branches in electronic form. All of theR returns data cover forex transactions including their purpose-wise classification up to and above the cut-off limit referred to above, and for the transactions below the limit, only total amount is given. Therefore,to capture such purpose-wise classification in respect of the balance of forex transactions below the cut-off limit of $10,000 now (about Rs 50,000), a sample survey of unclassified receipts is undertaken on aquarterly basis. Data on a number of what are called non-R return items, i.e, items dealt with directly bythe government such as defence-related purchases and other official transactions, are supplemented fromgovernment sources and major diplomatic missions abroad (Washington, London and Tokyo). Finally, thereare three more other sources which supplement the above BOP data:
5 Balance of Payments

(i) a foreign currency gross provisional return (FCGPR) on capital account transactions including allinvestment flows;
(ii) a BAL statement on balances in NRE deposit accounts; and(iii) information, through fortnightly section 42(2) returns of banks, on their Nostro balances (normally
in credit) and Vostro balances (normally in debt).In addition, there is yet another class of surveys on India’s ‘foreign liabilities and assets’, which has finally
culminated into a more comprehensive survey on international investment position (IIP). Earlier this surveyof foreign assets and liabilities was periodically undertaken to fill the gap in data regarding the capitaltransactions of the private sector; this survey was also used to obtain data on direct investment flows ona non-cash basis such as shares allotted to non-residents against import of plant and equipment or againsttechnical know-how fees, and direct investors’ portion of reinvested earnings. Now, the Indian governmenthas accepted Special Data Dissemination Standards (SDDS)6 prescribed by IMF in the aftermath of thefinancial crisis of 1997-98, according to which, the IIP, amongst others, ‘has become the focus of attentionon account of its comprehensive coverage and the feasibility of assessing the impact of policies on thecomposition of capital flows’ (RBI’s Annual Report, 2002-03, p.112). Under the SDDS, India wascommitted to compile the IIP for the period ending March 2002. Accordingly, the annual IIP of India forthe years March 1997 to March 2002 have been placed on RBI’s website.
Difference between RBI balance of payments data and customs data.
As repeatedly reported by the RBI, a phenomenon in the external trade statistics of India has been thesignificant divergence between the merchandise transactions, particularly on imports, as revealed by thecustoms data compiled by the Directorate General of Commercial Intelligence and Statistics (DGCI andS) and the BOP data published by the RBI on payment basis (see Table 1). Apart from valuation and timingdifferences as between the customs data based on the shipment of goods and the booking of, say, importson payments basis, a major cause for the difference in merchandise imports is that customs (DGCI andS) data do not cover import of defence stores including defence equipment, while the RBI data cover thesame as and when these imports are paid for. Besides, RBI data have a lead in payments in regard toimports under external assistance and commercial borrowings as the RBI records them when the payments
Table 1: IndiaTable 1: IndiaTable 1: IndiaTable 1: IndiaTable 1: India’s Foreign Trade : A Comparison of DGCI & S and RBI Datas Foreign Trade : A Comparison of DGCI & S and RBI Datas Foreign Trade : A Comparison of DGCI & S and RBI Datas Foreign Trade : A Comparison of DGCI & S and RBI Datas Foreign Trade : A Comparison of DGCI & S and RBI Data(Rupees, Crore)
ExportsExportsExportsExportsExports ImportsImportsImportsImportsImports Trade BalanceTrade BalanceTrade BalanceTrade BalanceTrade Balance
DGCI and S RBI Difference DGCI and S RBI Difference DGCI and S RBI Difference(2-3) (5-6) (8-9)
(1) (2) (3) (4) (5) (6) (7) (8) (9) (10)
1980-81 6711 6666 45 12549 12876 -327 -5838 -6210 3721981-82 7806 7766 40 13608 14260 -652 -5802 -6494 6921982-83 8803 9137 -334 14293 15856 -1563 -5490 -6719 12291983-84 9771 10169 -398 15831 17093 -1262 -6060 -6924 8641984-85 11744 11959 -215 17134 18680 -1546 -5390 -6721 13311985-86 10895 11578 -683 19658 21164 -1506 -8763 -9586 8231986-87 12452 13315 -863 20096 22669 -2573 -7644 -9354 17101987-88 15674 16396 -722 22244 25693 -3449 -6570 -9297 27271988-89 20232 20647 -415 28235 34202 -5967 -8003 -13555 55521989-90 27658 28229 -571 35328 40642 -5314 -7670 -12413 47431990-91 32558 33153 -595 43193 50086 -6893 -10635 -16933 62981993-94 69751 71146 -1395 73101 83869 -10768 -3350 -12723 93731994-95 82674 84329 -1655 89971 112749 -22778 -7297 -28420 211231995-96 106353 108481 -2128 122678 146542 -23864 -16325 -38061 217361996-97 118817 121194 -2377 138920 173753 -34833 -20103 -52559 324561997-98 130101 132703 -2602 154176 190508 -36332 -24075 -57805 337301998-99 139753 144436 -4683 178332 199914 -21582 -38579 -55478 168991999-00 159561 165993 -6432 215236 240112 -24876 -55675 -74119 184442000-01 203571 205287 -1716 230873 270663 -39790 -27302 -65376 380742001-02 209018 214351 -5333 245200 274778 -29578 -36182 -60427 24245
Sources : Various issues of RBI Bulletin
Balance of Payments 6

EX
HIB
IT A
: E
ST
IMA
TIO
N O
F I
NV
ISIB
LE
AC
CO
UN
TS
- A
CO
MP
AR
ISO
N O
F R
BI
CL
AS
SIF
CA
TIO
N W
ITH
TH
E I
MF
CL
AS
SIF
ICA
TIO
N (
IMF
BO
P M
anu
al)
EX
HIB
IT A
: E
ST
IMA
TIO
N O
F I
NV
ISIB
LE
AC
CO
UN
TS
- A
CO
MP
AR
ISO
N O
F R
BI
CL
AS
SIF
CA
TIO
N W
ITH
TH
E I
MF
CL
AS
SIF
ICA
TIO
N (
IMF
BO
P M
anu
al)
EX
HIB
IT A
: E
ST
IMA
TIO
N O
F I
NV
ISIB
LE
AC
CO
UN
TS
- A
CO
MP
AR
ISO
N O
F R
BI
CL
AS
SIF
CA
TIO
N W
ITH
TH
E I
MF
CL
AS
SIF
ICA
TIO
N (
IMF
BO
P M
anu
al)
EX
HIB
IT A
: E
ST
IMA
TIO
N O
F I
NV
ISIB
LE
AC
CO
UN
TS
- A
CO
MP
AR
ISO
N O
F R
BI
CL
AS
SIF
CA
TIO
N W
ITH
TH
E I
MF
CL
AS
SIF
ICA
TIO
N (
IMF
BO
P M
anu
al)
EX
HIB
IT A
: E
ST
IMA
TIO
N O
F I
NV
ISIB
LE
AC
CO
UN
TS
- A
CO
MP
AR
ISO
N O
F R
BI
CL
AS
SIF
CA
TIO
N W
ITH
TH
E I
MF
CL
AS
SIF
ICA
TIO
N (
IMF
BO
P M
anu
al)
I .
IMF
Cla
ssif
icat
ion
of
Invi
sib
les
I .
IMF
Cla
ssif
icat
ion
of
Invi
sib
les
I .
IMF
Cla
ssif
icat
ion
of
Invi
sib
les
I .
IMF
Cla
ssif
icat
ion
of
Invi
sib
les
I .
IMF
Cla
ssif
icat
ion
of
Invi
sib
les
II. I
nd
ian
Cla
ssif
icat
ion
of
Invi
sib
les
II. I
nd
ian
Cla
ssif
icat
ion
of
Invi
sib
les
II. I
nd
ian
Cla
ssif
icat
ion
of
Invi
sib
les
II. I
nd
ian
Cla
ssif
icat
ion
of
Invi
sib
les
II. I
nd
ian
Cla
ssif
icat
ion
of
Invi
sib
les
Cat
ego
ry C
ateg
ory
Cat
ego
ry C
ateg
ory
Cat
ego
ryN
o.N
o.N
o.N
o.N
o.N
omen
clat
ure
Nom
encl
atur
eN
omen
clat
ure
Nom
encl
atur
eN
omen
clat
ure
Bri
ef D
escr
ipti
on
Bri
ef D
escr
ipti
on
Bri
ef D
escr
ipti
on
Bri
ef D
escr
ipti
on
Bri
ef D
escr
ipti
on
Nom
encl
atur
eN
omen
clat
ure
Nom
encl
atur
eN
omen
clat
ure
Nom
encl
atur
eB
rief
Des
crip
tio
nB
rief
Des
crip
tio
nB
rief
Des
crip
tio
nB
rief
Des
crip
tio
nB
rief
Des
crip
tio
n
Ser
vice
s:-
Ser
vice
s:-
Ser
vice
s:-
Ser
vice
s:-
Ser
vice
s:-
1T
rans
port
atio
nIn
clud
es s
ea t
rans
port
and
air
tra
npor
t an
d ot
her
Tra
nspo
rtat
ion
Cat
egor
y 1
unde
r S
ervi
ces
as p
er I
MF
spe
cific
atio
n.
tran
spor
t fo
r pa
ssen
ger
and
frei
ght
traf
fic.
2T
rave
lC
over
s tr
avel
for
bus
ines
s or
per
sona
l pu
rpos
e.T
rave
lC
ateg
ory
2 un
der
Ser
vice
s as
per
IM
F s
peci
ficat
ion.
3C
onst
ruct
ion
serv
ices
Cov
er w
ork
perf
orm
ed o
n co
nstr
uctio
n pr
ojec
ts a
nd
inst
alla
tions
by
empl
oyee
s of
an
ente
rpri
se i
nIn
sura
nce
Cat
egor
y 5
unde
r S
ervi
ces
as p
er I
MF
spe
cific
atio
n.
loca
tions
out
side
the
eco
nom
ic t
erri
tory
of
the
en
terp
rise
.G
.n.i.
e.
Cat
egor
y 11
und
er S
ervi
ces
as p
er I
MF
spe
cific
atio
n.4
Com
mun
icat
ion
serv
ices
Incl
ude
tele
com
mun
icat
ions
in
turn
inc
ludi
ng
tran
smis
sion
of
soun
d, i
mag
es,
othe
rM
isce
llane
ous
Incl
udes
Cat
egor
y 3,
4,6,
7,8,
9,10
und
er S
ervi
ces
as p
er
info
rmat
ion
by v
ario
us m
odes
and
the
irIM
F s
peci
ficat
ion.
m
aint
enan
ce a
nd p
osta
l an
d co
urie
r se
rvic
es.
5In
sura
nce
serv
ices
Cov
er t
he p
rovi
sion
of
insu
ranc
e to
non
-res
iden
tsIn
com
eC
ateg
ory
1 an
d 2
unde
r In
com
e as
per
IM
F s
peci
ficat
ion.
by
res
iden
t en
terp
rise
s co
veri
ng f
reig
ht a
nd d
irec
t
insu
ranc
e (l
ife,
acci
dent
, he
alth
etc
. in
sura
nce)
Off
icia
l tr
ansf
ers
Cat
egor
y 1
unde
r T
rans
fers
as
per
IMF
spe
cific
atio
n.6
Fin
anci
al s
ervi
ces
Incl
ude
inte
rmed
iary
ser
vice
fee
s as
soci
ated
with
th
e lin
e of
cre
dit,
lea
sing
etc
. It
als
o co
vers
Pri
vate
tra
nsfe
rsC
ateg
ory
2 un
der
Tra
nsfe
rs a
s pe
r IM
F s
peci
ficat
ion.
co
mm
isss
ions
rel
ated
to
tran
sact
ions
in
secu
ritie
s7
Com
pute
r an
d in
form
atio
nIn
clud
e co
mpu
ter
data
and
new
s-re
late
dse
rvic
es
se
rvic
e tr
ansa
ctio
n co
veri
ng d
ata
base
s,
data
pro
cess
ing,
har
dwar
e co
nsul
tanc
y.8
Roy
altie
s an
d lic
ence
fee
sC
over
rec
eipt
s/pa
ymen
ts d
ue t
o sa
le o
f tr
adem
arks
,
copy
righ
ts,
pate
nts,
fra
nchi
ses
due
to t
he u
se o
f
prod
uced
ori
gina
ls s
uch
as f
ilms,
man
uscr
ipts
.9
Oth
er b
usin
ess
serv
ices
serv
ices
; op
erat
iona
l le
asin
g se
rvic
es;
and
mis
cella
-
neou
s bu
sine
ss,
prof
essi
onal
, te
chni
cal
serv
ices
.10
Per
sona
l, cu
ltura
l an
dIn
clud
e se
rvic
es a
ssoc
iate
d w
ith t
he p
rodu
ctio
n of
recr
eatio
nal
serv
ices
m
otio
n pi
ctur
es o
n fil
ms
or v
ideo
-tap
e, r
adio
and
te
levi
sion
pro
gram
mes
11G
over
nmen
t se
rvic
es n
.i.e.
Cov
ers
serv
ices
ass
ocia
ted
with
gov
ernm
ent
sect
ors
or
int
erna
tiona
l or
reg
iona
l or
gani
satio
ns a
nd n
ot
clas
sifie
d el
sew
here
.In
com
e:-
Inco
me:
-In
com
e:-
Inco
me:
-In
com
e:-
1C
ompe
nsat
ion
ofC
over
s w
ages
, sa
lari
es,
othe
r be
nefit
s in
cas
h or
empl
oyee
s
in k
ind
of b
orde
r, s
easo
nal
and
non-
resi
dent
w
orke
rs i
n em
bass
ies
2In
vest
men
t in
com
eC
onsi
sts
of d
irec
t an
d po
rtfo
lio i
ncom
e, a
nd
othe
r in
com
eT
ran
sfer
s:-
Tra
nsf
ers:
-T
ran
sfer
s:-
Tra
nsf
ers:
-T
ran
sfer
s:-
1O
ffic
ial
tran
sfer
sIn
clud
es c
urre
nt i
nter
natio
nal
coop
erat
ion
betw
een
go
vern
men
ts,
paym
ents
of
curr
ent
taxe
s on
in
com
e an
d w
ealth
2P
riva
te t
rans
fers
Incl
udes
wor
kers
rem
ittan
ces,
cla
ims
on
non-
life
insu
ranc
e et
c.
Not
e:T
he r
ecor
ding
of
tran
spor
tatio
n an
d in
sura
nce
tran
sact
ions
on
a gr
oss
basi
s an
d th
eir
recl
assi
ficat
ion
from
mer
chan
dise
to
invi
sibl
es f
orm
par
t of
the
ong
oing
eff
orts
to
refin
e an
dba
lanc
e of
pay
men
ts s
tatis
tics.
Sou
rce:
IMF
, B
alan
ce o
f P
aym
ents
Man
ual,
5th
Edi
tion,
199
3.
7 Balance of Payments

EX
HIB
IT B
: E
ST
IMA
TIO
N O
F I
NV
ISIB
LE
AC
CO
UN
TS
- A
CO
MP
AR
ISO
N O
F R
BI
CL
AS
SIF
CA
TIO
N W
ITH
TH
E I
MF
CL
AS
SIF
ICA
TIO
N (
IMF
BO
P Y
earb
oo
k)E
XH
IBIT
B:
ES
TIM
AT
ION
OF
IN
VIS
IBL
E A
CC
OU
NT
S -
A C
OM
PA
RIS
ON
OF
RB
I C
LA
SS
IFC
AT
ION
WIT
H T
HE
IM
F C
LA
SS
IFIC
AT
ION
(IM
F B
OP
Yea
rbo
ok)
EX
HIB
IT B
: E
ST
IMA
TIO
N O
F I
NV
ISIB
LE
AC
CO
UN
TS
- A
CO
MP
AR
ISO
N O
F R
BI
CL
AS
SIF
CA
TIO
N W
ITH
TH
E I
MF
CL
AS
SIF
ICA
TIO
N (
IMF
BO
P Y
earb
oo
k)
I .
IMF
Cla
ssif
icat
ion
of
Invi
sib
les
I .
IMF
Cla
ssif
icat
ion
of
Invi
sib
les
I .
IMF
Cla
ssif
icat
ion
of
Invi
sib
les
I .
IMF
Cla
ssif
icat
ion
of
Invi
sib
les
I .
IMF
Cla
ssif
icat
ion
of
Invi
sib
les
I .
IMF
Cla
ssif
icat
ion
of
Invi
sib
les
I .
IMF
Cla
ssif
icat
ion
of
Invi
sib
les
I .
IMF
Cla
ssif
icat
ion
of
Invi
sib
les
I .
IMF
Cla
ssif
icat
ion
of
Invi
sib
les
I .
IMF
Cla
ssif
icat
ion
of
Invi
sib
les
Item
Nos
.N
omen
clat
ure
Bri
ef D
escr
iptio
nIt
em N
os.
Nom
encl
atur
eB
rief
Des
crip
tion
(Cre
dit
and
Deb
it)(C
redi
t an
d D
ebit)
3 an
d 4
Shi
pmen
tF
reig
ht a
nd i
nsur
ance
cha
rges
on
expo
rts
and
23 a
nd 2
4O
ther
res
iden
tA
mis
cella
neou
s ca
tego
ry (
like
sale
of
emba
ssy
inpo
rts
offic
ial,
Nie
build
ings
, fo
r in
stan
ce)
5 an
d 6
Pas
seng
er s
ervi
ces
Pas
seng
er f
ares
25 a
nd 2
6O
ther
res
iden
tA
ll fo
reig
n em
bass
y re
ceip
ts a
nd p
aym
ents
for
offic
ial,
Nie
dipl
omat
ic m
issi
ons
abro
ad i
nclu
ding
exp
endi
ture
s7
and
8P
ort
serv
ices
Bun
kers
, su
pplie
s of
jet
fue
l, an
d re
pair
ser
vice
sin
curr
ed b
y U
N a
genc
ies
and
the
agen
cies
lik
eat
por
ts a
nd a
irpo
rts
the
Wor
ld B
ank,
IM
F a
nd A
DB
.
9 an
d 10
Tra
vel
Tou
rist
s an
d ot
her
tem
pora
ry v
isito
rs’s
for
eign
27 a
nd 2
8La
bour
inc
ome,
Nie
.P
erso
nal
inco
me
earn
ed/
rem
itted
in
resp
ect
ofex
chan
ge e
xpen
ditu
rew
orke
rs w
ho s
tay
outs
ide
the
coun
try
of t
heir
resi
denc
e fo
r le
ss t
han
one
year
I.e
. fo
rte
mpo
rary
em
ploy
men
t.11
and
12
Re-
inve
sted
ear
ning
sS
hare
of
undi
stri
bute
d ea
rnin
gs o
f co
mpa
nies
with
on d
irec
t in
vest
men
tfo
reig
n sh
areh
oldi
ngs.
Thi
s in
clud
es e
arni
ngs
of29
and
30
Pro
pert
y in
com
e, N
ieR
ecei
pts/
paym
ents
for
pat
ents
and
roy
altie
s.ab
road
bran
ches
of
fore
ign
com
pani
es u
nrem
itted
(inc
ludi
ng b
anki
ng c
ompa
nies
)
13 a
nd 1
4O
ther
dir
ect
this
sec
tion
cove
rs d
istr
ibut
ed e
arni
ngs
of31
and
32
othe
r go
ods,
serv
ices
Thi
s w
ill c
over
:in
vest
men
t in
com
efo
reig
n co
ntro
lled
com
pani
es o
r pr
ofits
rem
itted
and
inco
mes
, N
ie.
(i)
valu
e ad
ded
from
re-
expo
rts
(dis
trib
uted
ear
ning
s)in
the
cas
e of
bra
nche
s or
int
eres
t pa
ymen
ts(i
i) l
ocal
exp
ense
s of
off
hsor
e co
mpa
nies
mad
e to
pri
ncip
als.
(iii)
mot
ion
pict
ure
film
ren
tal
and
man
agem
ent
fees
(iv)
net
tra
nsac
tions
fro
m l
ife i
nsur
ance
cor
pora
tions
i.e a
ll no
n-m
erch
andi
se i
nsur
ance
and
non
-tra
de15
and
16
Oth
er i
nves
tmen
tth
is s
houl
d in
clud
e in
tere
st i
ncom
e re
ceiv
able
on
serv
ices
obt
aine
d fr
om a
broa
d.in
com
e of
res
iden
tfo
reig
n cu
rren
cy a
sset
s he
ld a
broa
d an
als
o in
te-
offic
ial,
incl
udin
gre
st p
aid
on f
orei
gn d
ebt
held
by
gove
rnm
ent
and
33 a
nd 3
4M
igra
nts‘
tra
nsfe
rR
emitt
ance
rec
eive
d /p
aid
from
/for
tem
pora
ryin
tero
ffic
ial
gove
rnm
ent
owne
d pu
blic
util
ities
and
age
ncie
s.m
igra
nts
abro
ad o
ther
tha
n th
ose
seek
ing
empl
oym
ent
or i
nitia
l ar
riva
ls
17 a
nd 1
8O
ther
inv
estm
ent
For
eign
off
icia
l in
tere
st i
ncom
e pa
id t
o a
non-
35 a
nd 3
6W
orke
r’s
rem
ittan
ces
Rem
ittan
ce o
f w
orke
rs I
.e.
thos
e w
ho a
re f
orin
com
e of
for
eign
offic
ial
orga
nisa
tion
(cre
dit)
and
a p
riva
tere
gula
r em
ploy
men
t bu
t ith
er t
han
thos
e in
offic
ial
excl
udin
gor
gani
satio
n pa
ying
int
eres
t to
a f
orei
gn o
ffic
ial
busi
ness
. A
lso
pers
onal
rem
ittan
ce b
y pe
rson
sin
tero
ffic
ial
orga
nisa
tion
(deb
it)em
ploy
ed u
nder
tec
hnic
al a
ssis
tanc
e.
19 a
nd 2
0O
ther
inv
estm
ent
Cov
ers:
37 a
nd 3
8O
ther
pri
vate
Per
sona
l re
mitt
ance
s of
a s
peci
al n
atur
e su
ch a
sin
com
e (p
riva
te t
o(i
) D
ivid
ends
on
port
folio
inv
estm
ent
tran
sfer
spe
nsio
ns a
nd s
ocia
l se
curi
ty r
ecei
pts/
paym
ents
priv
ate)
i
ncom
e in
equ
ities
and
all
gilts
(ii)
Int
eres
t ea
rned
/pai
d on
ban
k de
posi
ts(i
ii) D
eben
ture
s an
d ot
her
debt
sec
uriti
es39
and
40
Inte
roff
icia
l tr
ansf
ers
On
the
rece
ipts
sid
e, c
ontr
a-en
trie
s fo
r al
l gr
ants
(iv)
Thi
s ite
m a
lso
cove
rs i
nter
set
paid
on
fore
ign
for
tech
nica
l as
sist
ance
; a
lso
canc
ella
tion
of
deb
t by
pub
lic e
nter
pris
es a
nd a
lso
corp
orat
ions
debt
is
incl
uded
in
this
ite
m.D
ebits
inc
lude
w
hose
deb
t is
qua
rant
eed
by l
ocal
gov
ernm
ents
actu
al g
rant
fig
ures
.
21 a
nd 2
2In
ter-
off
icia
l, n
.i.e
.T
his
shou
ld c
over
val
ue o
f se
rvic
es o
btai
ned/
41 a
nd 4
2O
ther
tra
nsfe
rs o
fT
his
incl
udes
som
e tr
ansf
ers
to r
esid
ent
gove
rn-
rend
ered
und
er a
id p
rogr
amm
es w
hich
are
fin
ance
dre
side
nt o
ffic
ial
men
ts l
ike
taxe
s fr
om n
on-r
esid
ents
(lik
e fo
reig
nby
gra
nts
andd
whi
ch h
as a
con
tra
entr
y un
der
com
pany
reg
istr
atio
n fe
es)
or o
n th
e de
bt s
ide
item
no
39 b
elow
.of
ficia
l tr
ansf
ers
to p
riva
te e
ntiti
es a
broa
d lik
epe
nsio
n pa
ymen
ts.
43 a
nd 4
4O
ther
tra
nsfe
rs o
fT
his
cove
rs c
laim
s re
ceiv
ed f
orm
for
eign
soc
ial
fore
ign
offic
ial
secu
rity
ins
titut
ion,
pen
sion
s an
d sc
hola
rshi
ps,
etc.
on t
he d
ebit
side
, pa
ymnt
s by
pri
vate
ind
ivid
uals
and
orga
nisa
tions
to
fore
ign
gove
rnm
ents
(fo
reig
nso
cial
sec
urity
ins
titut
ions
) an
d co
nsul
ar a
ndvi
sa-f
ee a
ymen
ts.
(Con
td)
Balance of Payments 8

EX
HIB
IT B
: E
ST
IMA
TIO
N O
F I
NV
ISIB
LE
AC
CO
UN
TS
- A
CO
MP
AR
ISO
N O
F R
BI
CL
AS
SIF
CA
TIO
N W
ITH
TH
E I
MF
CL
AS
SIF
ICA
TIO
N (
IMF
BO
P Y
earb
oo
k)E
XH
IBIT
B:
ES
TIM
AT
ION
OF
IN
VIS
IBL
E A
CC
OU
NT
S -
A C
OM
PA
RIS
ON
OF
RB
I C
LA
SS
IFC
AT
ION
WIT
H T
HE
IM
F C
LA
SS
IFIC
AT
ION
(IM
F B
OP
Yea
rbo
ok)
EX
HIB
IT B
: E
ST
IMA
TIO
N O
F I
NV
ISIB
LE
AC
CO
UN
TS
- A
CO
MP
AR
ISO
N O
F R
BI
CL
AS
SIF
CA
TIO
N W
ITH
TH
E I
MF
CL
AS
SIF
ICA
TIO
N (
IMF
BO
P Y
earb
oo
k)(C
oncl
uded
)
II. R
BI
Cla
ssif
icat
ion
II. R
BI
Cla
ssif
icat
ion
II. R
BI
Cla
ssif
icat
ion
II. R
BI
Cla
ssif
icat
ion
II. R
BI
Cla
ssif
icat
ion
Nom
encl
atur
eN
omen
clat
ure
Nom
encl
atur
eN
omen
clat
ure
Nom
encl
atur
eC
orr
esp
on
din
g I
tem
No
s in
ab
ove
IM
F C
lass
ific
atio
nC
orr
esp
on
din
g I
tem
No
s in
ab
ove
IM
F C
lass
ific
atio
nC
orr
esp
on
din
g I
tem
No
s in
ab
ove
IM
F C
lass
ific
atio
nC
orr
esp
on
din
g I
tem
No
s in
ab
ove
IM
F C
lass
ific
atio
nC
orr
esp
on
din
g I
tem
No
s in
ab
ove
IM
F C
lass
ific
atio
n
1 T
rave
lIt
em n
umbe
rs 9
and
10
(inc
ludi
ng t
he r
elev
ant
shar
e fr
omun
clas
sifie
d re
ceip
ts
2 T
rans
port
atio
nIt
em n
umbe
rs 3
and
4 (f
reig
ht c
ompo
nent
onl
y) a
nd a
lso
5an
d 6
(pas
seng
er f
ares
) an
d ite
m n
umbe
rs 7
and
8 (
port
serv
ice
s)
3 In
sura
nce
Item
num
bers
3 a
nd 4
(in
sura
nce
com
pone
nt o
nly)
.Thi
s ite
mal
so i
nclu
des
surp
lus
fund
s re
ceiv
ed b
y In
dian
Ins
uran
ceco
mpa
nies
fro
m a
broa
d (I
tem
num
bers
31
and
32)
4. I
ncom
e :
Inv
estm
ent
Inco
me
Item
num
bers
11
and
12,
13,
14 ,
15 a
nd 1
6, 1
7,an
d 18
and
19
and
20
C
ompe
nsat
ion
to e
mpl
oyee
sIt
em n
umbe
rs 2
7 an
d 28
5 G
over
nmen
t n.
i.e.
Item
num
bers
23
and
24 a
nd 2
5 an
d 26
6. M
isce
llane
ous
Item
no
29 a
nd 3
0
7 T
rans
fer
Pay
men
ts
(I
) O
ffic
ial
Item
num
bers
21a
nd 2
2, 2
3 an
d 24
, 3
9 an
d 40
, 41
and
42
and
43 a
nd 4
4
(ii)
Pri
vate
Item
num
bers
33
and
34,
35 a
nd 3
6,37
and
38.
Not
e:T
he r
ecor
ding
of
tran
spor
tatio
n an
d in
sura
nce
tran
sact
ions
on
a gr
oss
basi
s an
d th
eir
recl
assi
ficat
ion
from
mer
chan
dise
to
invi
sibl
es f
orm
par
t of
the
ong
oing
eff
orts
to
refin
e an
ddi
sagg
rega
te t
heba
lanc
e of
pay
men
ts s
tatis
tics.
Sou
rce:
IMF
, B
alan
ce o
f P
aym
ents
Sta
tistic
s, Y
earb
ook,
Vol
ume
35,
Par
t I,
198
4
9 Balance of Payments

are made to suppliers while the DGCI and S data cover them when the goods arrive in thecountry in accordancewith the recommendations of the report of the technical group on reconciling balance of payments andDGCI and S data sources on merchandise trade. Data on gold and silver brought in by the Indians returningfrom transfer receipts since 1992-93 abroad have been included under import payments with contra entryunder private transfer receipts.
As the data in text Table 1 shows, the differences between the two sources have got widened, particularlyin the latter half of the last decade when defence purchases seem to have got expanded; it is quiet likelythat leads and lags between shipments and payment receipts may have also got widened.
Apparent gaps in balance of payments data:-
1. As pointed out earlier, there is the need to present import data in fob terms and thus give the valuesof freight and insurance under invisibles more accurately.
2. IMF publications classify data on invisibles under 15 heads, whereas Indian BOP is generally reportedunder 7 heads. Now that the RBI has begun collecting substantially more disaggregated data, BOPclassification may be expanded (Exhibit A).
3. RBI was conducting sporadic studies on currency-wise pattern of exports and imports and invisibles.It is hoped that these will be continued and that an analysis of the available data may be undertakenmore regularly such as once in two years.
4. Detailed dissemination of FDI inflows by sectors and by projects is needed. The advisory groupon data dissemination had in fact highlighted this requirement. Currently, the Secretariat of IndustrialApprovals (GoI) publishes in their SIA Newsletter (monthly) census list of FDI approvals with briefdetails on individual proposals and some consolidated data on actual inflows. RBI may attemptpublishing similar data on the progress achieved in actual inflow of FDI and technical collaborations,along with ‘individual profiles’ for major cases of inflows and projects under implementation.
IIIAn Overview of India’s Balance of Payments
Appendix 1(A) to 5 present a detailed account of all the major components of India’s balance of paymentsfor about 53 years since 1950-51. A few special tables amongst them give further details of some importantsub-categories of invisibles and capital transactions. A text Table 2, depicts a profile of end-year foreignexchange reserves including annual transactions with the IMF. A separate table presents ‘rest of the worldaccount’ transactions as tabulated by the Central Statistical Organisation (CSO) in its National AccountsStatistics (Appendix 6). A few analytical tables such as the one on financing of current account deficit(Table 3) and another on selected indicators of BOP (Table 4) are also presented as text tables. Theymake an attempt to provide a perspective of macro analysis that is possible of BOP statistics. Apart fromexports and imports of goods and services, the table on ‘rest of the world account’ provides data on (a)compensation of employees from, and to, the rest of the world; and (b) property and entrepreneurial incomesimilarly from, and to, the rest of the world. The objective of this note is to present these data for useby research scholars and others and not to provide any detailed analysis. However, opportunity is takento make a few observations on what these mass of data reveal essentially as a lead for their users.
First, there has occurred a quantum leap in the proportion of India’s exports in GDP. For over threedecades, merchandise exports had constituted around 4 to 4.5 per cent of GDP but this has jumped toabout 8 to 9 per cent in the 1990s (Table 4 in the text). Further it is revealed that inclusive of exportsof services, the rise in the ratio of goods and services to GDP has been much sharper, from about a rangeof 8-9 per cent to 16-17 per cent . Significantly, the rise in export earnings has been accompanied by similarsizeable increase in imports as percentage of GDP. It must, however, be noted that after a leap forwardin external trade of India until the mid-1990s, the physical trade to GDP ratio has not shown any significantexpansion in the second half of the 1990’s (Graphs 1 and 2), probably pari passu with the sluggish growthof the national economy as a whole. On the other hand, what stands out is the more rapid and continuous
Balance of Payments 10

Export/Import as Percentage of GDP
0
5
10
15
20
25
1961
-62
1963
-64
1965
-66
1967
-68
1969
-70
1971
-72
1973
-74
1975
-76
1977
-78
1979
-80
1981
-82
1983
-84
1985
-86
1987
-88
1989
-90
1991
-92
1993
-94
1995
-96
1997
-98
1999
-00
YearsP
erce
ntag
e
Exports as % to GDP Imports as % to GDP
Graph 1rise in exports of services as percentage ofGDP from about 2.5-3.5 per cent for abouttwo decades until the early 1990s to 5 percent in 1995-96 and to 7.5 per cent during2001-02.
Secondly, the current account deficit – acrucial macro economic indicator – has faceda chequered trend. As percentage of GDP,it was around 2 per cent during the highinvestment phases of the second and thirdfive-year plan periods (1956-57 to 1965-66)and also during the decade of the 1980s.Interestingly, the 1990s in particular haveshown the lowest relative current accountdeficit so much so that by 2001-02, therehas arisen a current account surplus, whichhas continued in 2002-03 too. Earlier, sucha surplus was experienced in the mid-1970s
Total Merchandise as % to GDP
0
5
10
15
20
25
1961
-62
1963
-64
1965
-66
1967
-68
1969
-70
1971
-72
1973
-74
1975
-76
1977
-78
1979
-80
1981
-82
1983
-84
1985
-86
1987
-88
1989
-90
1991
-92
1993
-94
1995
-96
1997
-98
1999
-00
Years
Perc
enta
ges
T otal Merchandise as % to GDP
G raph 2when the national economy had similarlyexperienced an investment famine.
Thirdly, again, in the financing of currentdeficit (Table 3 and Graph 3), there hasoccurred a significant change in the relativeimportance of various sources of finance inthis respect. While the role of externalassistance has declined in the 1990s, theimportance of private investment flows, NRIdeposits and commercial borrowings has in-creased. Separate information provided onthe first two items of investment flows [Ap-pendix 3A and 3B and 3C] and NRI deposits(Appendix 4A and 4B) speak of their impor-
Financing CAD
-10000
0
10000
20000
30000
40000
50000
60000
Yea
rs
1962
-63
1965
-66
1968
-69
1971
-72
1974
-75
1977
-78
1980
-81
1983
-84
1986
-87
1989
-90
1992
-93
1995
-96
1998
-99
2001
-02
Years
Rs
Cro
re
E xternal assistance C om m ercia l B orrow ingsFore ign Investm ents N R I D eposits
Ext Ass
Com m Borr
For Inv
NR I D eptance in absolute numbers.Finally, above all, it is the phenomenal
expansion in foreign currency assets in the1990s that stands out. As indicated in thetext Table 2, the country’s foreign exchangereserves had generally remained low afterthe sterling balances were brought down inthe early phase of planning. The years whenthe reserves formed more than three months’import requirements, as in the 1970s and theearly 1980s, were periods of considerablerecessionary conditions in Indian industry;in the early 1980s the reserves were also
Graph 3
11 Balance of Payments

Symbols and Abbreviations
1. The following symbols have been used throughout the article... = data not available-, 0 = nil or negligible. = Denotes data not available separately and has been clubbed elsewhere.
2. f.o.b. = free on boardc.i.f- cost, insurance and freight.
3. NR(E)RA = Non-Resident (External) Rupee Account4. FCNR (B) = Foreign Currency Non-Resident (Banks)5. FCNR (A) = Foreign Currency Non-Resident (Accounts)
supported by the IMF drawals.The same phenomena of recession as
well as IMF and other exceptionaldrawings were prevalent in the early1990s; thereafter the foreign exchangereserves began to rise. But, the increasesin reserves that have occurred after1995-96 or thereabout are of a differentgenre. Not only have there been no IMFborrowings (in fact all repurchase ob-ligations have been cleared), therecessionary conditions have not beenas severe as in, for instance, in the1970s. In fact, inflows have been quitesizeable as a result of reduced merchan-dise deficits, rapid increases in privateinward remittances, and higher capitalflows – all of which could not probablyhave been absorbed even if the tempo
Import Cover
0
10000
20000
30000
40000
50000
60000
1970
-71
1971
-72
1972
-73
1973
-74
1974
-75
1975
-76
1976
-77
1977
-78
1978
-79
1979
-80
1980
-81
1981
-82
1982
-83
1983
-84
1984
-85
1985
-86
1986
-87
1987
-88
1988
-89
1989
-90
1990
-91
1991
-92
1992
-93
1993
-94
1994
-95
1995
-96
1996
-97
1997
-98
1998
-99
1999
-00
2000
-01
2001
-02
Foreign Exchange Reserves (Rs Crore)
Imp
orts
in M
ont
hs
0.0
2.0
4.0
6.0
8.0
10.0
12.0
Forex Reserves Import Cover
Graph 4
of investment was stepped up.
Notes
1 International Monetary Fund, Balance of Payments Manual, Fourth Edition, 1971.
2 The Reserve Bank of India has compiled and published its own manual setting out the concepts and methodology,the main constitutents of BoP and source of data used. See Reserve Bank of India (1987), Balance of PaymentsCompilation Manual, October, 1987.
3 See International Monetary Fund, Balance of Payments Statistics (various yearbook volumes)
4 See RBI,op cit, pp 21-22.
5 Portfolio investment mainly includes FIIs’ investment, funds raised through GDRs/ADRs by Indian companiesand through offshore funds. Data on investment abroad, hitherto reported, have been split into equity capitaland portfolio investment since 2000-01.
6 A detailed note on the SDDS has been published by the EPW Research Foundation (2003) ; it is : “ InternationalReserve, Foreign Currency Liquidity and External Debt : Data template”, Economic and Political Weekly, September30, 2003.
Balance of Payments 12

13B
alance of Paym
ents
Table 2: Foreign Exchange Reserves : 1950-51 to 2002-03Table 2: Foreign Exchange Reserves : 1950-51 to 2002-03Table 2: Foreign Exchange Reserves : 1950-51 to 2002-03Table 2: Foreign Exchange Reserves : 1950-51 to 2002-03Table 2: Foreign Exchange Reserves : 1950-51 to 2002-03
Foreign Exchange Reserves Transactions with the IMF
Year SDRs Gold Foreign TotalTotalTotalTotalTotal SDRs Gold Foreign TotalTotalTotalTotalTotal Drawings Repur- Out- Drawings Repur- Out- Reserve ReservesCurrency Currency chases standing chases standing Position in termsAssets Assets Repurchase # Repurchase in the of no of
Obligations Obligations Fund months ofImports
(In Rs Crore) (In US Dollar Million) (In Rs Crore) (In US Dollar Million)(1) (2) (3) (4) (5)(5)(5)(5)(5) (6) (7) (8) (9)(9)(9)(9)(9) (10) (11) (12) (13) (14) (15) (16) (17)
1950-51 ----- 118 911 10291029102910291029 ----- 247 1914 21612161216121612161 ----- ----- 48 ----- ----- 100 .......... 19.01951-52 ----- 118 747 865865865865865 ----- 247 1568 18151815181518151815 ----- ----- 48 ----- ----- 100 .......... 10.81952-53 ----- 118 763 881881881881881 ----- 247 1603 18501850185018501850 ----- ----- 48 ----- ----- 100 .......... 16.71953-54 ----- 118 792 910910910910910 ----- 247 1664 19111911191119111911 ----- 17 30 ----- 36 64 .......... 18.41954-55 ----- 118 774 892892892892892 ----- 247 1626 18731873187318731873 ----- 17 13 ----- 36 28 .......... 15.51955-56 ----- 118 785 903903903903903 ----- 247 1648 18951895189518951895 ----- 7 6 ----- 15 13 .......... 14.01956-57 ----- 118 563 681681681681681 ----- 247 1184 14311431143114311431 61 6 61 126 12 128 .......... 7.41957-58 ----- 118 303 421421421421421 ----- 247 637 884884884884884 35 ----- 95 72 ----- 200 .......... 4.11958-59 ----- 118 261 379379379379379 ----- 247 548 795795795795795 ----- ----- 95 ----- ----- 200 .......... 4.41959-60 ----- 118 245 363363363363363 ----- 247 515 762762762762762 ----- 24 71 ----- 50 150 .......... 4.71960-61 ----- 118 186 304304304304304 ----- 247 390 637637637637637 ----- 11 61 ----- 23 128 .......... 3.31961-62 ----- 118 180 298298298298298 ----- 247 377 624624624624624 119 61 119 249 127 250 .......... 3.51962-63 ----- 118 177 295295295295295 ----- 247 372 619619619619619 12 - 131 25 ----- 275 .......... 3.21963-64 ----- 118 188 306306306306306 ----- 247 395 642642642642642 - 24 107 - 50 225 .......... 2.91964-65 ----- 134 116 250250250250250 ----- 281 243 524524524524524 48 48 107 99 100 225 .......... 2.11965-66 ----- 116 182 298298298298298 ----- 243 383 626626626626626 66 36 137 137 75 288 .......... 2.61966-67 ----- 183 296 479479479479479 ----- 243 395 638638638638638 89 43 313 126 57 418 .......... 2.71967-68 ----- 183 356 539539539539539 ----- 243 475 718718718718718 68 43 338 89 58 450 .......... 3.11968-69 ----- 183 394 577577577577577 ----- 243 526 769769769769769 ----- 59 279 ----- 78 372 .......... 3.91969-70 92 183 546 821821821821821 123 243 728 10941094109410941094 ----- 125 154 ----- 167 205 .......... 6.21970-71 112 183 438 733733733733733 148 243 584 975975975975975 ----- 153.8 ----- ----- 205 - .......... 4.81971-72 194 183 480 857857857857857 269 264 661 11941194119411941194 ----- ----- ----- ----- ----- ----- .......... 5.01972-73 226 183 479 888888888888888 297 293 629 12191219121912191219 ----- ----- ----- ----- ----- ----- .......... 4.91973-74 230 183 581 994994994994994 296 293 736 13251325132513251325 62 ----- 59 79 ----- 75 .......... 4.21974-75 229 183 610 10221022102210221022 293 304 782 13791379137913791379 485 ----- 557 608 ----- 715 .......... 2.71975-76 211 183 1492 18861886188618861886 234 281 1657 21722172217221722172 207 ----- 804 239 ----- 896 .......... 4.21976-77 192 188 2863 32433243324332433243 217 290 3240 37473747374737473747 ----- 303 492 - 336 559 .......... 7.11977-78 170 193 4500 48634863486348634863 200 319 5305 58245824582458245824 ----- 249 210 ----- 333 249 .......... 9.71978-79 381 220 5220 58215821582158215821 470 377 6421 72687268726872687268 ----- 207 - ----- 256 ----- .......... 8.91979-80 545 225 5164 59345934593459345934 662 375 6324 73617361736173617361 ----- 55 $ - ----- 145 ----- .......... 7.31980-81 497 226 4822 55455545554555455545 603 370 5850 68236823682368236823 274 @ 5 $$ 268 342 16 327 .......... 5.21981-82 444 226 3355 40254025402540254025 473 335 3582 43904390439043904390 637@@ - 901 692 40 964 .......... 3.41982-83 291 226 4265 47824782478247824782 291 324 4281 48964896489648964896 1893@@ - 2867 1968 - 2876 .......... 3.61983-84 248 226 5498 59725972597259725972 230 320 5099 56495649564956495649 1414@@ 72(a) 4444 1376 70 4150 .......... 4.21984-85 181 246 6817 72437243724372437243 145 325 5482 59525952595259525952 219@@ 156(b) 4888 201 134 3932 .......... 4.71985-86 161 274 7384 78197819781978197819 131 417 5972 65206520652065206520 ----- 253(c) 5285 ----- 209 4290 .......... 4.4
(Contd)

Table 2: Foreign Exchange Reserves : 1950-51 to 2002-03 Table 2: Foreign Exchange Reserves : 1950-51 to 2002-03 Table 2: Foreign Exchange Reserves : 1950-51 to 2002-03 Table 2: Foreign Exchange Reserves : 1950-51 to 2002-03 Table 2: Foreign Exchange Reserves : 1950-51 to 2002-03 (Concluded)(Rupees, Crore)
Foreign Exchange Reserves Transactions with the IMF
Year SDRs Gold Foreign TotalTotalTotalTotalTotal SDRs Gold Foreign TotalTotalTotalTotalTotal Drawings Repur- Out- Drawings Repur- Out- Reserve ReservesCurrency Currency chases standing chases standing Position in termsAssets Assets Repurchase # Repurchase in the of no of
Obligations Obligations Fund months ofImports
(In Rs Crore) (In US Dollar Million) (In Rs Crore ) (In US Dollar Million)(1) (2) (3) (4) (5)(5)(5)(5)(5) (6) (7) (8) (9)(9)(9)(9)(9) (10) (11) (12) (13) (14) (15) (16) (17)
1986-87 232 274 7645 81518151815181518151 179 471 5924 65746574657465746574 ----- 672(d) 5548 ----- 521 4291 .......... 4.31987-88 125 274 7287 76867686768676867686 97 508 5618 62236223622362236223 ----- 1209(e) 4732 ----- 930 3653 633.5 3.61988-89 161 274 6605 70407040704070407040 103 473 4226 48024802480248024802 ----- 1547(f) 3696 ----- 1070 2365 671.6 2.51989-90 184 281 5787 62526252625262526252 107 487 3368 39623962396239623962 ----- 1460(g) 2572 ----- 873 1493 630.0 1.81990-91 200 6828 4388 1141611416114161141611416 102 3496 2236 58345834583458345834 3334 & 1156(h) 5132 1858 647 2623 .......... 2.71991-92 233 9039 14578 2385023850238502385023850 90 3499 5631 92209220922092209220 3205 @@ 1127(I) 8934 1240 460 3451 .......... 5.61992-93 55 10549 20140 3074430744307443074430744 18 3380 6434 98329832983298329832 4231 868(j) 14986 1623 335 4799 296 5.11993-94 339 12794 47287 6042060420604206042060420 108 4078 15068 1925419254192541925419254 1007 420(k) 15812 325 134 5040 299 8.61994-95 23 13752 66005 7978079780797807978079780 7 4370 20809 2518625186251862518625186 ----- 3585(l) 13545 ----- 1146 4300 331 8.51995-96 280 15658 58446 7438474384743847438474384 82 4561 17044 2168721687216872168721687 ----- 5749(m) 8152 ----- 1710 2374 310 6.11996-97 7 14557 80368 9493294932949329493294932 2 4054 22367 2642326423264232642326423 ----- 3461(n) 4714 ----- 977 1313 291 6.61997-98 4 13394 102507 115905115905115905115905115905 1 3391 25975 2936729367293672936729367 ----- 2286(o) 2624 ----- 615 664 283 6.91998-99 34 12559 125412 138005138005138005138005138005 8 2960 29522 3249032490324903249032490 ----- 1652(p) 1220 ----- 102 287 663 8.21999-00 16 12973 152924 165913165913165913165913165913 4 2974 35058 3803638036380363803638036 ----- ----- ----- ----- ----- ----- 658 8.22000-01 11 12711 184482 197204197204197204197204197204 2 2725 39554 4228142281422814228142281 ----- ----- ----- ----- ----- ----- 616 8.62001-02 50 14868 249118 264036264036264036264036264036 10 3047 51049 5410654106541065410654106 ----- ----- ----- ----- ----- ----- 610 11.32002-03 19 16785 341476 358280358280358280358280358280 4 3534 71890 7542875428754287542875428 672 13.8
^ import cover is calculated by taking total foreign exchange reserves in US Dollar Million and dividng it by a months import for that year.-’ : denotes nil.@ Excludes Rs. 544.53 crore under Trust Fund.@@ Drawals under Extended Fund Facility(EFF) of Stand-by Arrangement&& Drawals of Rs. 2217.2 crore under Compensatory and Contingency Financing Facility and Rs. 987.5 crore under First Credit Tranche of Stand-by Arrangement$ Includes voluntary repurchases of Rupees (Rs. 199 crore) and sales of Rupees by the IMF under its general Resource accout (Rs. 35.2 crore)$$ Sales of Rupees by the Fund.# Additionally, SDR 59.9 million in May 1979,SDR 59.9 million in July 1980 and SDR 34.5 million in March 1982 were used for repurchases of Rupees.(a) SDR 34.5 million were used for repurchases of dawals under Compensatory Financing
Facility.(b) SDR 33.25 million and Rs. 117.85 crore in foreign currencies were used for repur
chases of drawals under CFF.(c) SDR 66.5 million and SDRs 131.25 million were used for repurchases of drawals
under CFF and EFF respectively.(d) SDR 431.25 million were used for repurchases of drawals under EFF.(e) SDR 704.17 million were used for repurchases of drawals under EFF.(f) SDR 804.18million were used for repurchases of drawals under EFF.(g) SDR 68125 million were used for repurchases of drawals under EFF.
(h) SDR 468.75 million were used for repurchases of drawals under EFF.(i) SDR 337.49 million were used for repurchases of drawals under EFF.(j) SDR 237.49 million were used for repurchases of drawals under EFF.(k) SDR 95.84 million were used for repurchases of drawals under EFF.(l) SDR 337.49 million were used for repurchases of drawals under EFF.(m) SDR 237.49million were used for repurchases of drawals under EFF.(n) SDR 678.38 million were used for repurchases of drawals under EFF.(o) SDR 499.29 million were used for repurchases of drawals under EFF.(p) SDR 212.46 million were used for repurchases of drawals under EFF.
Notes: 1) Figures after 1965-66 are not comparable with those of the earlier years owing to devaluation of th rupee in June 1966.2) Also figures for July 1991 are not comparable with those of earler periods due to the downward adjustment of the Rupee effected on July 1 & 3, 1991.3) Drawals, Repurchase and Outstanding repurchase Obligations are calculated at the ruling rates of exchange.4) Gold is valued at Rs. 53.58 per 10 grams up to May 1966 and at Rs. 84.39 per 10 grams of gold up to September 1990 and closer to international market price w.e.f. October 17,1990.5) Foreign Exchange includes a) Foreign assets of the Reserve Bank of India b) Government balance held abroad up to 1955-56.6) While reserves pertain to end period, repurchases are for the relevant period.7) Import cover is arrived at by dividing total reserves with imports (both in $ million) and multiplying the result by 12.
Sources: Government of India, Economic Survey (various issues) and RBI, Annual Report (various issues)
Balance of P
ayments
14

15B
alance of Paym
ents
Table 3: Financing of Current Account Deficits : 1950-51 to 2002-03Table 3: Financing of Current Account Deficits : 1950-51 to 2002-03Table 3: Financing of Current Account Deficits : 1950-51 to 2002-03Table 3: Financing of Current Account Deficits : 1950-51 to 2002-03Table 3: Financing of Current Account Deficits : 1950-51 to 2002-03(Rupees, Crore)
Financed byFinanced byFinanced byFinanced byFinanced by
Current External Assistance Commercial Borrowing NRI Deposits IMF and SDR Foreign Rupee Debt Other MovementAccount Allocations Investments Service Capital in ReservesDeficit
Year (CAD) Net Percent Drawals Repay- Net Percent Drawals Repay- Net Percent Net Net Percent Net Net inclu- (Decrease+ /of CAD ments of CAD ments of CAD of CAD ding errors Increase-)
and omissions(1) (2) (3) (4) (5) (6) (7) (8) (9) (10) (11) (12) (13) (14) (15) (16) (17) (18)
1950-51 39 -5 12.8 7.7 12.9 0 ----- 0 0 0 ----- 0 4 10.3 0 -9 -29
1951-52 -163 47 28.8 59.6 12.9 0 ----- 0 0 0 ----- 0 4 2.5 0 -53 165
1952-53 60 22 36.7 35.1 12.8 0 ----- 0 0 0 ----- 0 4 6.7 0 -69 -17
1953-54 48 -10 20.8 1.6 11.2 0 ----- 0 0 0 ----- -17 8 16.7 0 0 -29
1954-55 6 -10 166.7 0.6 10.7 0 ----- 0 0 0 ----- -17 8 133.3 0 -5 18
1955-56 7 6 85.7 9.4 3.6 0 ----- 0 0 0 ----- -7 24 342.9 0 -19 -11
1956-57 -313 27 8.6 30.4 3.3 0 ----- 0 0 0 ----- 55 21 6.7 0 -11 221
1957-58 -431 36 8.4 115.0 79** 0 ----- 0 0 0 ----- 35 3 0.7 0 98 260
1958-59 -327 218 66.7 225.5 7.3 0 ----- 0 0 0 ----- 0 10 3.1 0 57 42
1959-60 -186 175 94.1 187.3 12.3 0 ----- 0 0 0 ----- -24 52 28.0 0 -33 16
1960-61 -392 219 55.9 256.6 37.6 0 ----- 0 0 0 ----- -11 28 7.1 0 97 59
1961-62 -307 214 69.7 274.1 60.3 0 ----- 0 0 0 ----- 58 30 9.8 0 -1 6
1962-63 -354 343 96.9 395.6 53.0 0 ----- 0 0 0 ----- 12 0 0.0 0 -3 2
1963-64 -349 388 111.2 445.5 57.2 0 ----- 0 0 0 ----- -24 26 7.4 0 -30 -11
1964-65 -468 544 116.2 621.6 77.5 0 ----- 0 0 0 ----- 0 47 10.0 0 -179 56
1965-66 -510 475 93.1 560.0 85.0 0 ----- 0 0 0 ----- 30 18 3.5 0 35 -48
1966-67 -843 822 97.5 965.6 143.7 0 ----- 0 0 0 ----- 46 31 3.7 0 -93 37
1967-68 -807 831 103.0 1026.6 195.3 0 ----- 0 0 0 ----- 24 37 4.6 0 -14 -71
1968-69 -410 645 157.3 830.0 185.0 0 ----- 0 0 0 ----- -59 28 6.8 0 -166 -38
1969-70 -234 469 200.4 683.9 214.5 0 ----- 0 0 0 ----- -30 24 10.3 0 9 -238
1970-71 -445 504 113.3 735.2 231.2 16 3.6 27.0 10.8 0 ----- -79 36 8.1 0 -121 89
1971-72 -499 508 101.8 757.7 249.3 10 2.0 30.2 20.6 0 ----- 75 44 8.8 0 -43 -95
1972-73 -312 377 120.8 663.2 286.0 54 17.3 76.9 22.7 0 ----- 0 30 9.6 0 -182 33
1973-74 1135 @@465 41.0 872.1 407.0 72 6.3 101.8 29.4 0 ----- 62 52 4.6 0 -14 -84
1974-75 -956 854 89.3 1137.1 282.9 156 16.3 195.3 39.8 0 ----- 485 69 7.2 0 -601 -7
1975-76 -178 1219 684.8 1553.2 333.9 231 129.8 291.2 60.0 36 20.2 218 -8 4.5 0 -688 -830
1976-77 894 1270 142.1 1650.9 380.9 163 18.2 235.3 72.1 167 18.7 -306 -26 2.9 0 -766 -1396
1977-78 1124 882 78.5 1359.7 477.9 34 3.0 116.1 82.6 200 17.8 -288 -10 0.9 0 -396 -1546
1978-79 -238 455 191.2 932.9 477.8 164 68.9 252.9 88.5 156 65.5 -74 24 10.1 0 513 -1000
1979-80 -553 656 118.6 1198.1 541.7 44 8.0 115.3 70.9 162 29.3 42 70 12.7 0 -52 -369
1980-81 -2214 1112 50.2 1803.6 691.4 199 9.0 315.8 117.1 178 8.0 383 - - - -177 516
(Contd)

Balance of P
ayments
16
Table 3: Financing of Current Account Deficits : 1950-51 to 2002-03 Table 3: Financing of Current Account Deficits : 1950-51 to 2002-03 Table 3: Financing of Current Account Deficits : 1950-51 to 2002-03 Table 3: Financing of Current Account Deficits : 1950-51 to 2002-03 Table 3: Financing of Current Account Deficits : 1950-51 to 2002-03 (Concluded)(Rupees, Crore)
Financed byFinanced byFinanced byFinanced byFinanced by
Current External Assistance Commercial Borrowing NRI Deposits IMF and SDR Foreign Rupee Debt Other MovementAccount Allocations Investments Service Capital in ReservesDeficit
Year (CAD) Net Percent Drawals Repay- Net Percent Drawals Repay- Net Percent Net Net Percent Net Net inclu- (Decrease+ /of CAD ments of CAD ments of CAD of CAD ding errors Increase-)
and omissions(1) (2) (3) (4) (5) (6) (7) (8) (9) (10) (11) (12) (13) (14) (15) (16) (17) (18)
1981-82 -2839 746 26.3 1367.0 621.5 146 5.1 373.1 227.0 206 7.3 635 - - - -513 1618
1982-83 -3280 1125 34.3 1774.9 650.4 732 22.3 943.3 211.0 383 11.7 1895 - - - -228 -625
1983-84 -3316 1183 35.7 1924.5 741.1 785 23.7 1053.8 269.0 709 21.4 1351 - - - 59 -773
1984-85 -2873 1407 49.0 1953.0 546.0 1110 38.6 1472.0 362.0 879 30.6 59 - - - 342 -926
1985-86 -5956 1676 28.1 2481.0 805.0 1167 19.6 1827.0 660.0 1767 29.7 -265 - - - 904 707
1986-87 -5830 1808 31.0 3056.2 1248.6 2513 43.1 4304.4 1791.2 1650 28.3 -672 249 4.3 249 -450 732
1987-88 -6293 2945 46.8 -4613.9 1669.1 1266 20.1 3207.8 1941.8 1840 29.2 -1209 563 8.9 563 -69 956
1988-89 -10410 3210 30.8 4859.6 1649.9 2743 26.3 4265.0 1522.1 3636 34.9 -1547 517 5.0 517 1572 1449
1989-90 -9830 3090 31.4 4998.4 1908.5 2958 30.1 4823.3 1864.9 4000 40.7 -1460 683 6.9 683 886 1232
1990-91 -17366 3965 22.8 6095.0 2129.0 4035 23.2 7630.0 3595.0 2756 15.9 2178 183 1.1 -2140 4096 2293
1991-92 -2235 7395 330.9 10715.0 3320.0 3807 170.3 7852.0 4045.0 1008 45.1 2077 339 15.2 -2785 -256 -9351
1992-93 -12763 5748 -45.0 10172.0 4424.0 -1095 8.6 3583.0 4677.0 6097 47.8 3363 1699 13.3 -2335 1768 -2481
1993-94 -3634 5964 164.1 10904.0 4940.0 1905 52.4 9137.0 7232.0 3780 104.0 587 13281 365.5 -3302 8786 -27366
1994-95 -10582 4798 45.3 10025.0 5227.0 3238 30.6 13041.0 9803.0 539 5.1 -3585 15088 142.6 -3090 7811 -14575
1995-96 -29606 3356 11.3 10101.0 6895.0 4548 15.4 14440.0 9892.0 3821 12.9 -5749 15624 52.8 -3106 -9334 9798
1996-97 -16281 3998 24.6 10893.0 7071.0 10004 61.4 26867.0 16863.0 11894 73.1 -3461 21162 130.0 -2542 -4681 -20759
1997-98 -20883 3461 16.6 10826.0 7365.0 14557 69.7 27210.0 12653.0 4325 20.7 -2286 19832 95.0 -2784 -1987 -14367
1998-99 -16789 3485 20.8 11507.0 8022.0 18557 110.5 30624.0 12067.0 4060 24.2 -1652 9737 58.0 -3308 2072 -16593
1999-00 -20331 3915 19.3 13339.0 9424.0 1360 6.7 13823.0 12463.0 6709 33.0 -1122 22184 109.1 -3059 16675 -26648
2000-01 -16401 2080 12.7 13528.0 11448.0 18832 114.8 43091.0 24259.0 10567 64.4 -115 27245 166.1 -2763 -12889 -27547
2001-02 3734 5830 156.1 16073.0 10243.0 -5432 145.5 -5432.0 14940.0 13127 351.6 ----- 31877 853.7 -2458 10531 -56592
2002-03 17925 -11588 64.6 13392.0 24980.0 -8283 46.2 13219.0 21502.0 13602 75.9 ----- 21918 122.3 -2303 19989 -82016
** Includes silver dispatched to USA and delivered to the American embassy values at Rs. 64.8 crore during April-June 1957 and Rs. 9.6 crore during June-September 1957 in fulfilment oflead-lease obligations.
# Includes India Development Bonds@ Other capital includes banking capital net of non-residents deposits but excludes short-term capital.@@ The net figure as per latest data is -1123, which is after excluding certain prepayments.Notes: * Receipts/disbursements for the year 1973-74 exclude Rs. 1664 crore as official grant receipts/amortisation under the agreement dated Feb.18, 1974 between the government of India
and USA.Signs have been ignored in columns 4, 8, 12, 15

Table 4: Balance of Payments-Selected Indicators : 1950-51 to 2001-02 Table 4: Balance of Payments-Selected Indicators : 1950-51 to 2001-02 Table 4: Balance of Payments-Selected Indicators : 1950-51 to 2001-02 Table 4: Balance of Payments-Selected Indicators : 1950-51 to 2001-02 Table 4: Balance of Payments-Selected Indicators : 1950-51 to 2001-02
Year Export as Import as Merchandise Invisibles as Exports of Imports of Current Merchandise Net Invisibles Gross PrivatePercentage Percentage as percentage Percentage Goods and Goods and Account Deficit as as Per Cent of Transfer as
in GDP in GDP of GDP of GDP Services as Services as Deficit as Percentage Merchandise percentagePercentage Percentage Percentage of Current Deficit of:
of GDP of GDP of::::: Account(2+6) (3+7) Deficit
Net Rec Pay GDP GDCF Merch. Inv.Deficit Rec.
(1) (2) (3) (4) (5) (6) (7) (8) (9) (10) (11) (12) (13) (14) (15)
1950-51 6.5 6.5 13.1 0.4 1.4 1.0 7.9 7.5 0.4 4.5 -7.7 1366.7 1366.7 29.5
1951-52 6.9 9.1 16.0 0.7 1.7 1.0 8.6 10.2 -1.5 -14.0 143.6 30.3 20.5 26.7
1952-53 5.8 6.1 11.9 0.9 1.9 1.0 7.7 7.1 0.6 7.3 -51.7 300.0 167.7 26.7
1953-54 4.8 5.2 10.0 0.9 1.7 0.8 6.5 6.1 0.4 5.5 -108.3 194.2 92.3 25.0
1954-55 5.6 6.5 12.0 0.9 1.9 1.0 7.5 7.5 0.1 0.6 -1550.0 106.5 54.8 24.8
1955-56 5.9 7.1 13.0 1.3 2.4 1.1 8.2 8.2 0.1 0.5 -1900.0 105.3 43.6 22.6
1956-57 4.9 8.5 13.4 1.2 2.1 0.9 7.0 9.4 -2.4 -16.1 149.2 33.0 13.7 24.1
1957-58 5.0 9.2 14.2 1.0 1.9 0.9 6.9 10.1 -3.2 -23.2 130.9 23.4 11.0 24.9
1958-59 3.9 6.9 10.8 0.8 1.7 0.9 5.6 7.8 -2.2 -18.3 138.5 27.6 12.8 22.9
1959-60 4.0 5.9 10.0 0.7 1.6 0.9 5.7 6.8 -1.2 -9.4 160.8 37.8 18.7 22.0
1960-61 3.7 6.4 10.1 0.5 1.5 1.0 5.2 7.5 -2.3 -15.9 121.2 17.3 9.5 17.3
1961-62 3.7 5.5 9.2 0.2 1.3 1.1 5.0 6.6 -1.7 -12.4 110.5 9.2 12.1 17.4
1962-63 3.5 5.6 10.0 0.3 1.5 1.1 4.9 6.7 -1.8 -12.1 117.5 14.9 9.6 14.1
1963-64 3.6 5.5 9.1 0.4 1.5 1.0 5.0 6.6 -1.6 -10.9 126.9 21.0 10.6 14.4
1964-65 3.1 5.4 8.5 0.6 1.5 1.0 4.6 6.4 -1.8 -12.6 132.5 24.4 6.8 10.3
1965-66 2.8 4.9 7.8 0.3 1.3 1.0 4.1 5.9 -1.8 -11.4 114.1 12.5 13.4 22.5
1966-67 3.5 6.4 9.8 0.2 1.5 1.3 4.9 7.6 -2.7 -15.9 107.2 6.6 8.1 15.9
1967-68 3.4 5.6 9.1 0.0 1.2 1.2 4.6 6.8 -2.2 -15.6 99.3 0.6 9.0 16.5
1968-69 3.5 4.6 8.1 0.0 1.2 1.2 4.8 5.8 -1.1 -8.0 103.7 3.5 21.6 19.1
1969-70 3.3 3.7 7.0 -0.1 1.0 1.2 4.3 4.9 -0.5 -3.7 73.1 36.3 57.3 22.3
1970-71 3.1 4.0 7.1 -0.1 1.1 1.2 4.2 5.2 -1.0 -6.3 91.9 9.1 24.7 20.4
1971-72 3.2 4.2 7.4 0.0 1.1 1.2 4.3 5.4 -1.0 -6.4 95.2 5.1 24.4 21.3
1972-73 3.7 4.0 7.7 -0.3 1.0 1.2 4.6 5.2 -0.6 -3.8 54.0 85.7 66.1 21.6
1973-74 3.6 4.4 8.0 2.5 3.5 1.0 7.1 5.3 1.7 10.0 -44.9 322.7 31.0 6.9
1974-75 4.1 5.8 9.9 0.4 1.3 0.8 5.4 6.6 -1.2 -7.3 134.6 25.7 18.3 23.9
1975-76 5.0 6.4 11.5 1.2 2.2 1.0 7.2 7.4 -0.2 -1.3 664.6 84.9 38.4 25.0
1976-77 5.7 6.1 11.8 1.3 2.5 1.1 8.2 7.2 1.0 5.6 -34.7 388.5 245.8 34.6
1977-78 5.4 5.9 11.3 1.7 2.7 1.0 8.1 7.0 1.1 6.0 -53.1 288.4 185.6 40.0
1978-79 5.1 7.1 12.2 1.8 2.9 1.1 8.0 8.2 -0.2 -1.0 929.4 89.2 50.2 34.9
1979-80 5.2 8.1 8.6 2.4 3.6 1.2 8.9 9.3 -0.5 -2.2 622.1 83.9 51.2 40.2
(Contd)
17B
alance of Paym
ents

Balance of P
ayments
18
Table 4: Balance of Payments-Selected Indicators : 1950-51 to 2001-02 Table 4: Balance of Payments-Selected Indicators : 1950-51 to 2001-02 Table 4: Balance of Payments-Selected Indicators : 1950-51 to 2001-02 Table 4: Balance of Payments-Selected Indicators : 1950-51 to 2001-02 Table 4: Balance of Payments-Selected Indicators : 1950-51 to 2001-02 (Concluded)
Year Export as Import as Merchandise Invisibles as Exports of Imports of Current Merchandise Net Invisibles Gross PrivatePercentage Percentage as percentage Percentage Goods and Goods and Account Deficit as as Per Cent of Transfer as
in GDP in GDP of GDP of GDP Services as Services as Deficit as Percentage Merchandise percentagePercentage Percentage Percentage of Current Deficit of:
of GDP of GDP of::::: Account(2+6) (3+7) Deficit
Net Rec Pay GDP GDCF Merch. Inv.Deficit Rec.
(1) (2) (3) (4) (5) (6) (7) (8) (9) (10) (11) (12) (13) (14) (15)
1980-81 4.6 9.0 13.6 2.8 3.9 1.2 8.6 10.1 -1.5 -7.6 280.5 64.4 34.4 37.7
1981-82 4.6 8.5 5.4 2.2 3.4 1.2 8.0 9.6 -1.7 -8.4 228.7 56.3 32.1 36.8
1982-83 4.9 8.4 13.3 1.8 3.2 1.4 8.1 9.8 -1.7 -8.9 204.8 51.2 36.2 40.1
1983-84 4.6 7.8 12.4 1.6 3.1 1.5 7.8 9.3 -1.5 -8.1 208.8 52.1 38.2 38.4
1984-85 4.9 7.6 12.5 1.6 3.4 1.8 8.2 9.4 -1.2 -5.8 233.9 57.3 44.4 36.2
1985.86. 4.2 7.6 11.8 1.3 2.8 1.5 7.0 9.1 -2.1 -9.9 160.9 37.9 22.1 26.9
1986-87 4.3 7.3 11.6 1.1 2.7 1.5 6.9 8.8 -1.9 -8.9 160.4 37.7 32.0 36.1
1987-88 4.6 7.3 11.9 0.8 2.6 1.8 7.2 9.0 -1.8 -7.9 147.7 32.3 38.0 38.1
1988-89 4.9 8.1 13.0 0.5 2.6 2.1 7.5 10.2 -2.7 -11.6 117.1 14.6 28.5 35.4
1989-90 5.8 8.4 14.2 0.2 2.6 2.4 8.4 10.7 -2.3 -9.5 109.0 8.3 30.8 30.6
1990-91 5.8 8.8 7.3 -0.1 2.4 2.4 8.2 11.2 -3.1 -11.6 97.5 2.6 22.1 27.9
1991-92 6.9 7.9 14.8 0.7 3.6 2.9 10.5 10.8 -0.3 -1.5 290.6 65.6 145.0 40.2
1992-93 7.3 9.6 16.9 0.6 3.6 3.0 10.9 12.6 -1.7 -7.2 135.1 26.0 65.3 41.6
1993-94 8.3 9.8 18.0 1.1 4.1 3.1 12.4 12.8 -0.4 -1.8 350.1 71.4 130.3 46.7
1994-95 8.3 11.1 19.5 1.8 4.8 3.1 13.1 14.2 -1.0 -4.0 268.5 62.8 89.6 52.2
1995-96 9.1 12.3 12.6 1.6 5.0 3.5 14.1 15.8 -1.7 -6.2 193.7 48.4 75.6 48.4
1996-97 8.9 12.7 21.6 2.7 5.6 2.9 14.4 15.6 -1.2 -4.9 322.8 69.0 84.1 58.1
1997-98 8.7 12.5 21.2 2.4 5.7 3.2 14.4 15.8 -1.4 -5.5 276.8 63.9 76.0 50.9
1998-99 8.2 11.4 19.8 2.2 6.2 4.0 14.4 15.3 -1.0 -4.1 330.4 69.7 78.4 40.1
1999-00 8.4 12.3 20.8 2.9 6.7 3.8 15.1 16.1 -1.0 -4.5 380.5 73.7 68.9 40.5
2000-01 9.8 12.4 22.6 2.6 7.5 4.9 17.3 17.3 -0.8 -4.5 398.6 82.5 89.9 37.2
2001-02 9.3 12.0 21.3 2.9 7.6 4.9 16.9 16.8 0.2 -4.5 -1618.3 111.1 96.2 34.2
2002-03* 10.5 12.9 23.4 3.2 8.5 5.3 18.9 18.2 0.7 ----- -336.7 129.7 118.8 34.4
* = Estimated, Rec.:- ReceiptsPay.:- Payments , GDCF:- Gross Domestic Capital Formation.- :- Not Available, Exp.:-Exports, Imp.:-ImportsNotes: GDP figures for 2000-01 are provisional.
GDP figures are taken at current market pricesGDP figures for 2001-02 are quick estimates.In Columns 13 & 14, signs are ignored.
Sources: RBI, Report on Currency and Finance, (various issues), and RBI, Annual Report, (various issues).

19B
alance of Paym
ents
Appendix 1(A): Balance of Payments : 1950-51 to 1989-90Appendix 1(A): Balance of Payments : 1950-51 to 1989-90Appendix 1(A): Balance of Payments : 1950-51 to 1989-90Appendix 1(A): Balance of Payments : 1950-51 to 1989-90Appendix 1(A): Balance of Payments : 1950-51 to 1989-90
1950-51 1951-52 1952-53 1953-54 1954-55 1955-56 1956-57 1957-58 1958-59 1959-60
Rs Cr $ Mn Rs Cr $ Mn Rs Cr $ Mn Rs Cr $ Mn Rs Cr $ Mn Rs Cr $ Mn Rs Cr $ Mn Rs Cr $ Mn Rs Cr $ Mn Rs Cr $ Mn
(1) (2) (3) (4) (5) (6) (7) (8) (9) (10) (11) (12) (13) (14) (15) (16) (17) (18) (19) (20) (21)
(1)(1)(1)(1)(1) Current Account (Net)Current Account (Net)Current Account (Net)Current Account (Net)Current Account (Net) 3939393939 8282828282 -163-163-163-163-163 -342-342-342-342-342 6060606060 126126126126126 4747474747 100100100100100 66666 1313131313 77777 1414141414 -313-313-313-313-313 -657-657-657-657-657 -431-431-431-431-431 -906-906-906-906-906 -327-327-327-327-327 -687-687-687-687-687 -186-186-186-186-186 -390-390-390-390-390Receipts 786 1646 909 1909 795 1671 730 1534 801 1683 890 1869 901 1892 918 1928 829 1742 888 1864Payments 747 1564 1072 2251 735 1544 683 1435 795 1670 896 1883 1214 2549 1349 2834 1156 2429 1073 2254
(a) Merchandise -4 -8 -233 -489 -31 -65 -52 -109 -93 -195 -133 -279 -467 -981 -565 -1186 -453 -952 -299 -628Exports f o b 647 1355 730 1534 602 1264 540 1134 597 1253 640 1345 635 1334 669 1405 576 1211 633 1330Imports c i f 650 1366 964 2025 633 1330 592 1243 690 1449 773 1624 1102 2315 1233 2591 1029 2162 932 1959
(b) Invisibles (Net) 42 88 71 150 91 192 100 209 99 208 139 292 154 324 133 280 253 532 113 238Receipts 140 293 179 376 193 406 191 401 205 430 256 538 266 558 249 523 127 267 254 534Payments 97 203 108 226 102 214 91 192 105 221 116 245 111 234 116 243 126 265 141 296
(2)(2)(2)(2)(2) Capital Account (Net)Capital Account (Net)Capital Account (Net)Capital Account (Net)Capital Account (Net) -4-4-4-4-4 -8-8-8-8-8 4343434343 9090909090 6060606060 126126126126126 -4-4-4-4-4 -8-8-8-8-8 55555 1111111111 2929292929 6060606060 3737373737 7878787878 145145145145145 304304304304304 314314314314314 659659659659659 218218218218218 458458458458458Receipts 84 176 122 256 795 1671 63 132 73 153 86 180 154 324 331 695 419 881 439 922Payments 87 182 79 166 735 1544 66 139 67 142 57 120 117 246 186 391 106 222 221 464
(a) Private (Net) -14 -29 -10 -22 -6 -12 -11 -23 -5 -10 10 22 -22 -46 4 7 -20 -42 -5 -10Receipts 15 31 16 33 22 46 24 50 27 56 39 83 37 78 50 104 34 72 43 91Payments 29 61 26 54 28 59 19 41 31 66 26 54 59 124 46 97 54 114 48 101
(b) Official (Net) -12 -25 30 63 29 61 9 18 17 36 9 19 72 150 153 320 329 691 210 442(I) (Loans 8 17 60 125 35 74 2 3 1 1 9 20 30 64 100 210 226 474 187 393
Receipts 8 17 60 126 35 74 2 3 1 1 9 20 30 64 115 242 226 474 187 393Payments 0 0 0 0 0 0 0 0 0 0 0 0 0 0 15 32 0 0 0 0
(ii) Amortisation -3 -6 -1 -3 -3 -7 -3 -6 11 23 6 12 3 7 -73 -153 28 60 -12 -25Receipts 10 21 12 25 10 20 8 17 22 45 9 20 7 15 6 13 36 75 1 1Payments 13 27 13 27 13 27 11 24 11 22 4 8 3 6 79 166 7 15 12 26
(iii) Miscellaneous -17 -36 -29 -60 -3 -6 10 21 6 12 -6 -12 38 80 125 263 75 158 35 73Receipts 13 27 2 4 8 17 13 27 7 15 8 17 55 116 137 287 93 196 172 360Payments 30 63 30 64 11 24 3 6 12 26 14 29 18 37 11 24 18 38 137 287
(c) Banking excluding RBI 22 46 23 48 -36 -76 -1 -3 4 9 9 19 -13 -26 -11 -23 5 10 13 26Receipts 38 80 33 69 14 30 16 34 17 37 23 48 25 52 24 50 31 64 36 76Payments 16 34 10 21 50 105 17 37 13 27 14 29 37 78 35 73 26 54 24 50
(3)(3)(3)(3)(3) IMF (SDR Allocation)IMF (SDR Allocation)IMF (SDR Allocation)IMF (SDR Allocation)IMF (SDR Allocation) 00000 00000 00000 00000 00000 00000 -17-17-17-17-17 -36-36-36-36-36 -17-17-17-17-17 -36-36-36-36-36 -7-7-7-7-7 -15-15-15-15-15 5555555555 115115115115115 3535353535 7474747474 00000 00000 -24-24-24-24-24 -50-50-50-50-50Receipts 0 0 0 0 0 0 0 0 0 0 0 0 61 128 35 72 0 0 0 0Payments 0 0 0 0 0 0 17 36 17 36 7 15 6 13 0 0 0 0 24 50
(4)(4)(4)(4)(4) Capital Account, IMF and SDR AllocationCapital Account, IMF and SDR AllocationCapital Account, IMF and SDR AllocationCapital Account, IMF and SDR AllocationCapital Account, IMF and SDR Allocation -4 -8 43 90 -18 -37 -21 -44 92 193 21 45 92 193 179 377 314 659 194 408Receipts 84 176 122 256 84 176 63 132 215 451 86 180 215 451 365 767 419 881 439 922Payments 87 182 79 166 102 214 84 176 123 258 64 135 123 258 186 391 106 222 245 514
(5)(5)(5)(5)(5) Total Current Account, Capital AccountTotal Current Account, Capital AccountTotal Current Account, Capital AccountTotal Current Account, Capital AccountTotal Current Account, Capital AccountIMF and SDR AllocationIMF and SDR AllocationIMF and SDR AllocationIMF and SDR AllocationIMF and SDR Allocation 3535353535 7373737373 -120-120-120-120-120 -252-252-252-252-252 -18-18-18-18-18 -37-37-37-37-37 2727272727 5656565656 -12-12-12-12-12 -25-25-25-25-25 2828282828 5959595959 -221-221-221-221-221 -464-464-464-464-464 -252-252-252-252-252 -529-529-529-529-529 -13-13-13-13-13 -28-28-28-28-28 99999 1919191919
Receipts 870 1822 1031 2165 84 176 793 1666 73 153 982 2063 1115 2343 1283 2695 1249 2623 1327 2787Payments 835 1748 1151 2417 102 214 767 1611 85 178 954 2004 1336 2808 1535 3225 1262 2651 1318 2769
(6)(6)(6)(6)(6) Errors and OmissionsErrors and OmissionsErrors and OmissionsErrors and OmissionsErrors and Omissions -7-7-7-7-7 -15-15-15-15-15 -45-45-45-45-45 -95-95-95-95-95 -26-26-26-26-26 -54-54-54-54-54 22222 55555 -18-18-18-18-18 -37-37-37-37-37 -18-18-18-18-18 -37-37-37-37-37 00000 -1-1-1-1-1 88888 1717171717 -29-29-29-29-29 -61-61-61-61-61 -25-25-25-25-25 -51-51-51-51-51(7)(7)(7)(7)(7) Reserves and Monetary GoldReserves and Monetary GoldReserves and Monetary GoldReserves and Monetary GoldReserves and Monetary Gold -29-29-29-29-29 -61-61-61-61-61 164164164164164 345345345345345 1717171717 3535353535 -29-29-29-29-29 -61-61-61-61-61 1111111111 2222222222 -11-11-11-11-11 -22-22-22-22-22 -221-221-221-221-221 -465-465-465-465-465 260260260260260 546546546546546 4242424242 8989898989 1616161616 3434343434
Memo Items :Memo Items :Memo Items :Memo Items :Memo Items :Non-monetary goldmovement (Net) 0 0 0 0 0 0 0 0 0 0 0 0 0 0 0 0 0 0 0 0
(Contd)

Balance of P
ayments
20
Appendix 1(A): Balance of Payments : 1950-51 to 1989-90Appendix 1(A): Balance of Payments : 1950-51 to 1989-90Appendix 1(A): Balance of Payments : 1950-51 to 1989-90Appendix 1(A): Balance of Payments : 1950-51 to 1989-90Appendix 1(A): Balance of Payments : 1950-51 to 1989-90
1960-61 1961-62 1962-63 1963-64 1964-65 1965-66 1966-67 1967-68 1968-69 1969-70
Rs Cr $ Mn Rs Cr $ Mn Rs Cr $ Mn Rs Cr $ Mn Rs Cr $ Mn Rs Cr $ Mn Rs Cr $ Mn Rs Cr $ Mn Rs Cr $ Mn Rs Cr $ Mn
(1) (22) (23) (24) (25) (26) (27) (28) (29) (30) (31) (32) (33) (34) (35) (36) (37) (38) (39) (40) (41)
(1)(1)(1)(1)(1) Current Account (Net)Current Account (Net)Current Account (Net)Current Account (Net)Current Account (Net) -392-392-392-392-392 -824-824-824-824-824 -1252-1252-1252-1252-1252 -2630-2630-2630-2630-2630 -2112-2112-2112-2112-2112 -4437-4437-4437-4437-4437 -2972-2972-2972-2972-2972 -6244-6244-6244-6244-6244 -3832-3832-3832-3832-3832 -8050-8050-8050-8050-8050 -4692-4692-4692-4692-4692 -9857-9857-9857-9857-9857 844844844844844 11911191119111911191 -808-808-808-808-808 -1077-1077-1077-1077-1077 -410-410-410-410-410 -547-547-547-547-547 -234-234-234-234-234 -312-312-312-312-312Receipts 890 1870 2844 5975 965 2027 1128 2369 1208 2537 1129 2372 1546 2183 1696 2261 1849 2466 1844 2459Payments 1283 2695 1209 2540 1319 2771 1477 3103 1676 3520 1640 3446 2390 3374 2503 3337 2260 3013 2078 2771
(a) Merchandise -475 -998 -338 -709 -416 -874 -443 -932 -620 -1302 -583 -1226 -905 -1277 -802 -1070 -425 -567 -171 -227Exports f o b 631 1326 668 1404 681 1430 802 1684 801 1683 785 1648 1087 1534 1260 1680 1367 1823 1405 1874Imports c i f 1106 2324 1006 2113 1097 2304 1245 2616 1420 2983 1368 2874 1991 2811 2063 2750 1792 2390 1576 2101
(b) Invisibles (Net) 83 174 31 66 62 130 94 197 152 319 73 153 61 86 -5 -7 15 19 -63 -85Receipts 260 546 234 492 284 597 326 685 407 854 345 724 460 649 436 581 482 643 439 585Payments 177 372 203 426 222 467 232 487 255 535 272 572 399 563 441 588 467 623 502 669
(2)(2)(2)(2)(2) Capital Account (Net)Capital Account (Net)Capital Account (Net)Capital Account (Net)Capital Account (Net) 350350350350350 735735735735735 234234234234234 491491491491491 334334334334334 701701701701701 439439439439439 921921921921921 461461461461461 968968968968968 542542542542542 11381138113811381138 748748748748748 10561056105610561056 938938938938938 12501250125012501250 626626626626626 835835835835835 521521521521521 695695695695695Receipts 499 1048 491 1032 550 1154 630 1324 848 1782 923 1938 1406 1985 1619 2158 1218 1623 1041 1387Payments 149 313 258 541 216 453 191 402 388 815 381 801 658 929 681 908 592 789 519 692
(a) Private (Net) 17 36 -4 -8 -1 -2 5 11 5 11 3 7 11 15 5 7 9 11 -3 -5Receipts 52 109 33 69 45 95 48 101 49 103 52 110 84 118 68 91 71 94 79 105Payments 35 74 36 76 46 96 43 90 44 92 60 126 73 103 63 84 62 83 82 110
(b) Official (Net) 324 681 242 508 327 686 433 909 472 992 530 1114 741 1046 1278 1704 635 847 509 679(I) Loans 252 529 274 576 396 831 446 936 594 1248 531 1116 906 1279 980 1307 806 1075 654 872
Receipts 257 540 274 576 396 831 446 936 594 1248 531 1116 906 1280 987 1316 811 1081 661 881Payments 5 11 0 0 0 0 0 0 0 0 0 0 1 1 7 9 5 6 7 9
(ii) Amortisation -35 -74 -58 -122 -51 -107 -55 -116 -63 -132 -73 -153 -127 -179 176 235 -156 -208 -177 -236Receipts 3 6 2 4 2 4 2 4 5 9 2 3 2 3 2 3 3 4 4 6Payments 38 80 60 127 53 111 57 120 67 142 74 156 128 181 178 237 159 213 181 241
(iii) Miscellaneous 107 225 26 54 -18 -38 42 89 -59 -124 72 150 -39 -54 122 163 -15 -20 32 42Receipts 144 303 140 294 60 125 78 165 158 333 270 568 316 446 415 553 280 373 236 314Payments 37 78 114 239 78 164 36 76 217 456 199 417 355 501 293 390 294 393 204 272
(c) Banking excluding RBI 10 21 -4 -9 8 17 1 2 -17 -36 8 17 -4 -5 6 8 -17 -23 15 20Receipts 44 92 43 89 47 99 56 118 42 89 56 118 98 139 147 196 53 71 61 81Payments 34 71 47 98 39 82 55 116 60 125 48 101 102 144 141 187 71 94 7 9
(3)(3)(3)(3)(3) IMF (SDR Allocation)IMF (SDR Allocation)IMF (SDR Allocation)IMF (SDR Allocation)IMF (SDR Allocation) 00000 00000 5858585858 123123123123123 1212121212 2525252525 -24-24-24-24-24 -50-50-50-50-50 00000 00000 3030303030 6363636363 4646464646 6565656565 2424242424 3333333333 -59-59-59-59-59 -78-78-78-78-78 3030303030 40Receipts 0 0 119 250 12 25 0 0 48 100 66 138 89 126 68 90 0 0 95 126Payments 0 0 61 128 0 0 24 50 48 101 36 75 43 61 43 58 59 79 125 167
(4)(4)(4)(4)(4) Capital Account, IMF and SDR AllocationCapital Account, IMF and SDR AllocationCapital Account, IMF and SDR AllocationCapital Account, IMF and SDR AllocationCapital Account, IMF and SDR Allocation 340 714 292 614 346 726 415 871 461 968 571 1200 794 1121 962 1283 568 757 490 654Receipts 499 1048 611 1283 561 1179 630 1324 986 2071 988 2076 1495 2111 1686 2248 1218 1623 1135 1513Payments 160 336 318 668 216 453 215 452 435 915 417 876 701 990 724 966 650 867 645 860
(5)(5)(5)(5)(5) Total Current Account, Capital AccountTotal Current Account, Capital AccountTotal Current Account, Capital AccountTotal Current Account, Capital AccountTotal Current Account, Capital AccountIMF and SDR AllocationIMF and SDR AllocationIMF and SDR AllocationIMF and SDR AllocationIMF and SDR Allocation -53-53-53-53-53 -111-111-111-111-111 -14-14-14-14-14 -30-30-30-30-30 -8-8-8-8-8 -17-17-17-17-17 6565656565 137137137137137 -7-7-7-7-7 -16-16-16-16-16 6161616161 127127127127127 -50-50-50-50-50 -70-70-70-70-70 154154154154154 206206206206206 157157157157157 210210210210210 256256256256256 342342342342342
Receipts 1390 2920 1513 3179 1526 3207 1758 3692 2104 4419 2118 4449 3041 4294 3382 4509 3067 4089 2979 3973Payments 1443 3032 1527 3208 1535 3224 1692 3555 2111 4435 2057 4321 3091 4364 3227 4303 2910 3880 2723 3631
(6)(6)(6)(6)(6) Errors and OmissionsErrors and OmissionsErrors and OmissionsErrors and OmissionsErrors and Omissions -6-6-6-6-6 -13-13-13-13-13 88888 1616161616 66666 1212121212 -55-55-55-55-55 -115-115-115-115-115 -49-49-49-49-49 -103-103-103-103-103 -12-12-12-12-12 -26-26-26-26-26 1313131313 1919191919 -84-84-84-84-84 -112-112-112-112-112 -119-119-119-119-119 -159-159-159-159-159 -18-18-18-18-18 -25-25-25-25-25(7)(7)(7)(7)(7) Reserves and Monetary GoldReserves and Monetary GoldReserves and Monetary GoldReserves and Monetary GoldReserves and Monetary Gold 5959595959 124124124124124 66666 1313131313 22222 55555 -11-11-11-11-11 -23-23-23-23-23 5656565656 118118118118118 -48-48-48-48-48 -101-101-101-101-101 3737373737 5252525252 -71-71-71-71-71 -94-94-94-94-94 -38-38-38-38-38 -51-51-51-51-51 -238-238-238-238-238 -317-317-317-317-317
Memo Items :Memo Items :Memo Items :Memo Items :Memo Items :Non-monetary goldmovement (Net) 0 0 0 0 0 0 0 0 0 0 0 0 0 0 0 0 0 0 0 0
(Contd)

Appendix 1(A): Balance of Payments : 1950-51 to 1989-90Appendix 1(A): Balance of Payments : 1950-51 to 1989-90Appendix 1(A): Balance of Payments : 1950-51 to 1989-90Appendix 1(A): Balance of Payments : 1950-51 to 1989-90Appendix 1(A): Balance of Payments : 1950-51 to 1989-90
1970-71 1971-72 1972-73 1973-74 1974-75 1975-76 1976-77 1977-78 1978-79 1979-80
Rs Cr $ Mn Rs Cr $ Mn Rs Cr $ Mn Rs Cr $ Mn Rs Cr $ Mn Rs Cr $ Mn Rs Cr $ Mn Rs Cr $ Mn Rs Cr $ Mn Rs Cr $ Mn
(1) (42) (43) (44) (45) (46) (47) (48) (49) (50) (51) (52) (53) (54) (55) (56) (57) (58) (59) (60) (61)
(1)(1)(1)(1)(1) Current Account (Net)Current Account (Net)Current Account (Net)Current Account (Net)Current Account (Net) -445-445-445-445-445 -593-593-593-593-593 -499-499-499-499-499 -666-666-666-666-666 -311-311-311-311-311 -405-405-405-405-405 11351135113511351135 14571457145714571457 -956-956-956-956-956 -1204-1204-1204-1204-1204 -178-178-178-178-178 -205-205-205-205-205 894894894894894 996996996996996 11241124112411241124 13091309130913091309 -238-238-238-238-238 -289-289-289-289-289 -553-553-553-553-553 -683-683-683-683-683Receipts 1914 2552 2126 2839 2508 3266 4638 5954 4180 5264 5995 6906 7344 8178 8208 9367 8779 10667 10699 13209Payments 2359 3121 2635 3518 2819 3671 2489 3195 5136 6468 6173 7111 6450 7182 7083 8084 9017 10956 11253 13892
(a) Merchandise -409 -541 -475 -634 -168 -218 -510 -655 -1287 -1621 -1183 -1362 -310 -345 -597 -682 -2212 -2688 -3440 -4247Exports f o b 1418 1876 1581 2110 1994 2596 2357 3025 3195 4024 4180 4815 5140 5723 5440 6209 5594 6797 613 757Imports c i f 1826 2416 2055 2744 2161 2814 2867 3680 4482 5645 5362 6178 5450 6069 6038 6890 7806 9485 9753 12041
(b) Invisibles (Net) -37 -49 -24 -32 -144 -187 1646 2112 331 417 1005 1157 1204 1341 1722 1965 1974 2399 2887 3564Receipts 496 656 546 728 514 670 2281 2929 985 1241 1815 2091 204 227 2767 3158 3185 3870 4386 5415Payments 533 705 570 761 658 857 636 816 654 824 810 933 1000 1114 1046 1193 1211 1471 1500 1851
(2)(2)(2)(2)(2) Capital Account (Net)Capital Account (Net)Capital Account (Net)Capital Account (Net)Capital Account (Net) 502502502502502 664664664664664 499499499499499 666666666666666 383383383383383 499499499499499 -926-926-926-926-926 -1189-1189-1189-1189-1189 704704704704704 887887887887887 10031003100310031003 11561156115611561156 10881088108810881088 12121212121212121212 585585585585585 667667667667667 -238-238-238-238-238 -289-289-289-289-289 -553-553-553-553-553 -683-683-683-683-683Receipts 1194 1580 2126 2839 1132 1474 1563 2006 2044 2574 2491 2870 2626 2924 2433 2777 8779 10667 10699 13209Payments 692 916 2625 3505 749 975 2489 3195 1340 1688 1488 1714 1538 1713 1848 2109 9017 10956 11253 13892
(a) Private (Net) 4 5 26 35 34 45 45 58 100 125 40 46 46 51 151 172 117 143 62 76Receipts 104 138 121 161 135 176 151 194 229 288 197 227 412 459 303 346 332 403 254 314Payments 100 132 95 126 101 131 106 137 130 163 156 180 186 207 153 174 214 260 192 238
(b) Official (Net) 497 658 583 778 337 439 -990 -1271 652 821 936 1078 928 1033 368 419 469 569 851 1050(I) Loans 706 934 681 909 599 779 869 1116 1184 1491 1647 1897 1705 1898 1335 1524 932 1132 1200 1482
Receipts 719 951 728 971 665 865 895 1149 1214 1529 1730 1993 1776 1978 1364 1557 996 1210 1262 1559Payments 13 17 47 63 66 86 26 33 30 38 83 96 71 79 29 33 64 78 62 77
(ii) Amortisation -180 -238 -176 -235 -193 -251 -1986 -2550 -237 -298 -268 -308 -298 -332 -445 -508 -436 -529 -517 -638Receipts 12 16 39 52 56 73 14 18 13 16 32 37 43 48 9 10 19 23 5 6Payments 191 253 215 287 249 324 2000 2568 249 314 300 345 341 379 454 518 455 553 522 644
(iii) Miscellaneous -29 -38 78 105 -68 -89 127 163 -295 -371 -443 -510 -479 -533 -523 -596 -28 -34 167 207Receipts 312 413 232 310 195 254 420 540 481 606 400 461 339 377 364 415 840 1020 504 622Payments 341 451 154 206 264 343 293 376 -295 -371 843 971 818 910 886 1011 868 1054 337 415
(c) Banking excluding RBI 0 0 4 5 11 15 19 24 -48 -60 27 31 115 128 67 76 -8 -10 -82 -101Receipts 47 62 54 72 81 105 82 106 107 135 132 152 237 264 393 449 286 348 206 255Payments 47 62 51 68 69 90 63 81 155 195 105 121 123 136 327 373 295 358 289 356
(3)(3)(3)(3)(3) IMF (SDR Allocation)IMF (SDR Allocation)IMF (SDR Allocation)IMF (SDR Allocation)IMF (SDR Allocation) -154-154-154-154-154 -204-204-204-204-204 7575757575 100100100100100 00000 00000 6262626262 8080808080 485485485485485 611611611611611 218218218218218 251251251251251 -306-306-306-306-306 -341-341-341-341-341 -288-288-288-288-288 -328-328-328-328-328 -74-74-74-74-74 -90-90-90-90-90 4242424242 5252525252Receipts 0 0 75 100 0 0 62 80 485 611 218 251 0 0 0 0 126 153 124 154Payments 154 204 0 0 0 0 0 0 0 0 0 0 306 341 288 329 200 243 82 101
(4)(4)(4)(4)(4) Capital Account, IMF and SDR AllocationCapital Account, IMF and SDR AllocationCapital Account, IMF and SDR AllocationCapital Account, IMF and SDR AllocationCapital Account, IMF and SDR Allocation 424 561 687 917 383 499 -864 -1109 1189 1497 1221 1407 782 871 297 339 503 612 872 1077Receipts 1269 1679 1248 1667 1132 1474 1625 2085 2529 3185 2709 3121 2626 2924 2433 2777 2599 3157 2356 2908Payments 846 1119 561 749 749 975 2489 3195 1340 1688 1488 1714 1844 2054 2136 2438 2095 2546 1484 1832
(5)(5)(5)(5)(5) Total Current Account, Capital AccountTotal Current Account, Capital AccountTotal Current Account, Capital AccountTotal Current Account, Capital AccountTotal Current Account, Capital AccountIMF and SDR AllocationIMF and SDR AllocationIMF and SDR AllocationIMF and SDR AllocationIMF and SDR Allocation -22-22-22-22-22 -29-29-29-29-29 188188188188188 252252252252252 7272727272 9393939393 271271271271271 348348348348348 233233233233233 293293293293293 10431043104310431043 12021202120212021202 16761676167616761676 18671867186718671867 14211421142114211421 16221622162216221622 266266266266266 323323323323323 319319319319319 394394394394394
Receipts 3183 4211 3375 4505 3640 4739 6262 8039 6709 8449 8704 10027 9970 11103 10641 12143 11377 13824 13055 16117Payments 3205 4241 3186 4254 3568 4646 5991 7691 6476 8156 7661 8825 8294 9236 9219 10521 11112 13502 12736 15724
(6)(6)(6)(6)(6) Errors and OmissionsErrors and OmissionsErrors and OmissionsErrors and OmissionsErrors and Omissions -67-67-67-67-67 -89-89-89-89-89 -93-93-93-93-93 -125-125-125-125-125 -105-105-105-105-105 -136-136-136-136-136 -187-187-187-187-187 -240-240-240-240-240 -256-256-256-256-256 -322-322-322-322-322 -214-214-214-214-214 -246-246-246-246-246 -280-280-280-280-280 -312-312-312-312-312 125125125125125 142142142142142 734734734734734 892892892892892 5151515151 6262626262(7)(7)(7)(7)(7) Reserves and Monetary GoldReserves and Monetary GoldReserves and Monetary GoldReserves and Monetary GoldReserves and Monetary Gold 8989898989 118118118118118 -95-95-95-95-95 -127-127-127-127-127 3333333333 4343434343 -84-84-84-84-84 -108-108-108-108-108 -7-7-7-7-7 -9-9-9-9-9 -830-830-830-830-830 -956-956-956-956-956 -1396-1396-1396-1396-1396 -1555-1555-1555-1555-1555 -1546-1546-1546-1546-1546 -1764-1764-1764-1764-1764 -1000-1000-1000-1000-1000 -1215-1215-1215-1215-1215 -369-369-369-369-369 -456-456-456-456-456
Memo Items :Memo Items :Memo Items :Memo Items :Memo Items :Non-monetary goldmovement (Net) 0 131 17 0 0 0 0 0 0 0 0 0 0 0 0 0 0 0 0 0
(Contd)
21B
alance of Paym
ents

Balance of P
ayments
22
Appendix 1(A): Balance of Payments : 1950-51 to 1989-90 Appendix 1(A): Balance of Payments : 1950-51 to 1989-90 Appendix 1(A): Balance of Payments : 1950-51 to 1989-90 Appendix 1(A): Balance of Payments : 1950-51 to 1989-90 Appendix 1(A): Balance of Payments : 1950-51 to 1989-90 (Concluded)
1980-81 1981-82 1982-83 1983-84 1984-85 1985-86 1986-87 1987-88 1988-89 1989-90
Rs Cr $ Mn Rs Cr $ Mn Rs Cr $ Mn Rs Cr $ Mn Rs Cr $ Mn Rs Cr $ Mn Rs Cr $ Mn Rs Cr $ Mn Rs Cr $ Mn Rs Cr $ Mn
(1) (62) (63) (64) (65) (66) (67) (68) (69) (70) (71) (72) (73) (74) (75) (76) (77) (78) (79) (80) (81)
(1)(1)(1)(1)(1) Current Account (Net)Current Account (Net)Current Account (Net)Current Account (Net)Current Account (Net) -2214-2214-2214-2214-2214 -2800-2800-2800-2800-2800 -2839-2839-2839-2839-2839 -3166-3166-3166-3166-3166 -3280-3280-3280-3280-3280 -3393-3393-3393-3393-3393 -3316-3316-3316-3316-3316 -3207-3207-3207-3207-3207 -2873-2873-2873-2873-2873 -2417-2417-2417-2417-2417 -5956-5956-5956-5956-5956 -4868-4868-4868-4868-4868 -5830-5830-5830-5830-5830 -4563-4563-4563-4563-4563 -6293-6293-6293-6293-6293 -4853-4853-4853-4853-4853 -10410-10410-10410-10410-10410 -7188-7188-7188-7188-7188 -9830-9830-9830-9830-9830 -5904-5904-5904-5904-5904Receipts 12335 15598 13429 14974 15199 15724 17061 16500 20202 16992 19453 15899 21589 16895 25675 19802 31573 21802 40713 24454Payments 14548 18397 16268 18140 18479 19118 20377 19707 23075 19409 25409 20767 27419 21458 31968 24655 41983 28990 50543 30358
(a) Merchandise -6211 -7854 -6494 -7241 -6719 -6951 -6925 -6697 -6721 -5653 -9586 -7835 -9354 -7320 -9296 -7170 -13556 -9361 -12413 -7456Exports f o b 6666 8429 7766 8660 9137 9453 10169 9835 11959 10059 11578 9463 13315 10420 16397 12464 20647 14257 28229 16955Imports c i f 12877 16284 1420 1583 15857 16405 17093 16531 18680 15712 21164 17298 22669 17741 25693 19816 34202 23617 40642 24411
(b) Invisibles (Net) 3997 5054 3655 4076 3439 3558 3068 2967 3849 3237 3630 2967 3524 2758 3004 2317 3146 2172 2583 1551Receipts 5669 7169 5664 6316 6062 6271 6893 6666 8243 6933 7875 6436 8274 6475 9279 7156 10926 7545 12484 7498Payments 1672 2114 2008 2239 2622 2713 3284 3176 4394 3696 4245 3470 4751 3718 6275 4840 7781 5373 9901 5947
(2)(2)(2)(2)(2) Capital Account (Net)Capital Account (Net)Capital Account (Net)Capital Account (Net)Capital Account (Net) 14431443144314431443 18251825182518251825 676676676676676 754754754754754 15811581158115811581 16361636163616361636 30183018301830183018 29192919291929192919 34113411341134113411 28692869286928692869 49224922492249224922 40234023402340234023 58995899589958995899 46174617461746174617 74937493749374937493 57795779577957795779 1030510305103051030510305 71167116711671167116 1077710777107771077710777 64736473647364736473Receipts 3953 4999 2997 3342 4651 4812 6012 5814 5920 4979 8064 6591 11960 9360 17149 13226 21284 14697 27810 16704Payments 2510 3174 2321 2588 3070 3176 2994 2896 2509 2110 3142 2568 6061 4743 9656 7447 10980 7582 17032 10230(a) Private (Net) 331 419 224 250 378 391 922 892 1092 918 2091 1709 2267 1774 2248 1734 3250 2244 3150 1892
Receipts 539 682 418 466 615 636 1188 1149 1467 1234 2617 2139 3222 2530 3984 3073 6613 4566 10110 6072Payments 207 262 194 216 237 245 266 257 375 315 526 430 966 756 1736 1339 3363 2322 6960 4180
(b) Official (Net) 1098 1388 465 519 1135 1174 1914 1851 2512 2113 2645 2162 3702 2897 5170 3987 7319 5054 7568 4546(i) Loans 1942 2456 1517 1692 2472 2257 2611 2525 3034 2552 3683 3010 6462 5057 6832 5269 8437 5826 8428 5062
Receipts 1971 2492 1525 1700 2489 2575 2625 2539 3059 2573 3693 3018 6478 5070 6852 5285 8465 5845 8436 5067 Payments 28 35 8 9 17 18 14 14 25 21 10 8 15 12 20 15 27 19 8 5
(ii) Amortisation -660 -835 -774 -863 -798 -826 -916 -886 -727 -611 -1152 -942 -2588 -2025 -2834 -286 -3067 -2118 -2990 -1796 Receipts 3 4 - - 1 1 1 1 0 0 0 0 0 0 8 6 15 10 14 8 Payments 63 80 774 863 799 827 917 887 727 611 1152 942 2588 2025 2841 2191 3082 2128 3004 1804
(iii) Miscellaneous -184 -233 -278 -310 -539 -558 219 212 205 172 114 93 -172 -135 1172 904 1949 1346 2130 1279 Receipts 1008 1275 697 777 1128 1167 1802 1743 1028 865 1000 817 1874 1467 5990 4620 5493 3793 8276 4971 Payments 1192 1507 975 1087 1666 1724 1583 1531 823 692 886 724 2074 1601 4818 3716 3544 2447 6145 3691
(c) Banking excluding RBI 13 16 -13 -14 68 70 182 176 -193 -162 186 152 -70 -55 75 58 265 -183 59 35 Receipts 432 546 358 399 418 432 396 383 367 309 755 617 376 294 315 243 698 482 974 585 Payments 419 530 371 414 350 362 214 207 560 471 568 464 446 349 240 185 963 665 914 549
(3)(3)(3)(3)(3) IMF (SDR Allocation)IMF (SDR Allocation)IMF (SDR Allocation)IMF (SDR Allocation)IMF (SDR Allocation) 265265265265265 335335335335335 635635635635635 708708708708708 18951895189518951895 19601960196019601960 13511351135113511351 13071307130713071307 5959595959 5050505050 -265-265-265-265-265 -217-217-217-217-217 -672-672-672-672-672 -526-526-526-526-526 -120-120-120-120-120 -932-932-932-932-932 -1547-1547-1547-1547-1547 -1068-1068-1068-1068-1068 -1460-1460-1460-1460-1460 -877-877-877-877-877Receipts 273 345 671 748 1895 1960 1425 1378 217 183 0 0 0 0 0 0 0 0 0 0Payments 8 10 36 40 0 0 74 72 159 134 265 217 672 526 1209 932 1547 1068 1460 877
(4)(4)(4)(4)(4) Capital Account, IMF and SDR AllocationCapital Account, IMF and SDR AllocationCapital Account, IMF and SDR AllocationCapital Account, IMF and SDR AllocationCapital Account, IMF and SDR Allocation 1826 2309 1310 1461 3476 3596 4369 4225 3469 2918 4658 3807 5227 4091 6284 4847 8757 6047 9318 5597Receipts 4343 5492 3668 4090 6545 6771 7437 7192 6137 5162 8064 6591 11960 9360 17149 13226 21284 14697 27810 16704Payments 2517 3183 2357 2628 3070 3176 3068 2967 2668 2244 3407 2785 6733 5269 10865 8380 12527 8650 18492 11107
(5)(5)(5)(5)(5) Total Current Account, Capital AccountTotal Current Account, Capital AccountTotal Current Account, Capital AccountTotal Current Account, Capital AccountTotal Current Account, Capital AccountIMF and SDR AllocationIMF and SDR AllocationIMF and SDR AllocationIMF and SDR AllocationIMF and SDR Allocation -387-387-387-387-387 -489-489-489-489-489 -1529-1529-1529-1529-1529 -1705-1705-1705-1705-1705 196196196196196 203203203203203 10531053105310531053 10181018101810181018 597597597597597 502502502502502 -1298-1298-1298-1298-1298 -1061-1061-1061-1061-1061 -603-603-603-603-603 -472-472-472-472-472 -9-9-9-9-9 -7-7-7-7-7 -1653-1653-1653-1653-1653 -1141-1141-1141-1141-1141 -512-512-512-512-512 -308-308-308-308-308
Receipts 16678 21090 17097 19064 21744 22495 24498 23692 26339 22154 27517 22490 33550 26256 42824 33028 52857 36498 68523 41157Payments 17066 21581 18625 20768 21578 22293 23445 22674 25742 21652 28815 23551 34152 26727 42832 33034 54510 37640 69035 41465
(6)(6)(6)(6)(6) Errors and OmissionsErrors and OmissionsErrors and OmissionsErrors and OmissionsErrors and Omissions -129-129-129-129-129 -163-163-163-163-163 -90-90-90-90-90 -100-100-100-100-100 429429429429429 444444444444444 -280-280-280-280-280 -271-271-271-271-271 329329329329329 277277277277277 592592592592592 484484484484484 -129-129-129-129-129 -101-101-101-101-101 -948-948-948-948-948 -731-731-731-731-731 203203203203203 140140140140140 -720-720-720-720-720 -432-432-432-432-432(7)(7)(7)(7)(7) Reserves and Monetary GoldReserves and Monetary GoldReserves and Monetary GoldReserves and Monetary GoldReserves and Monetary Gold 516516516516516 653653653653653 16181618161816181618 18041804180418041804 -625-625-625-625-625 -647-647-647-647-647 -773-773-773-773-773 -748-748-748-748-748 -926-926-926-926-926 -779-779-779-779-779 707707707707707 578578578578578 732732732732732 573573573573573 956956956956956 737737737737737 14491449144914491449 10011001100110011001 12321232123212321232 740740740740740
Memo Items :Memo Items :Memo Items :Memo Items :Memo Items :Non-monetary goldmovement (Net) 17 0 0 0 0 0 0 0 20 17 29 24 0 0 0 0 0 0 6 4
Source : Reserve Bank of India Bulletin, 2003, and its various other issues.Monograph on India’s Balance of Payments, July 1993.

Appendix 1(B): Balance of Payments : 1990-91 to 2002-03Appendix 1(B): Balance of Payments : 1990-91 to 2002-03Appendix 1(B): Balance of Payments : 1990-91 to 2002-03Appendix 1(B): Balance of Payments : 1990-91 to 2002-03Appendix 1(B): Balance of Payments : 1990-91 to 2002-03
(Rupees, Crore)
1990-91 1991-92 1992-93 1993-94 1994-95
Receipts Payments Net Receipts Payments Net Receipts Payments Net Receipts Payments Net Receipts Payments Net
A)A)A)A)A) CURRENT ACCOUNT (I+II)CURRENT ACCOUNT (I+II)CURRENT ACCOUNT (I+II)CURRENT ACCOUNT (I+II)CURRENT ACCOUNT (I+II) 4654946549465494654946549 6391563915639156391563915 -17366-17366-17366-17366-17366 6837268372683726837268372 7060770607706077060770607 -2235-2235-2235-2235-2235 8180381803818038180381803 9456694566945669456694566 -12763-12763-12763-12763-12763 106648106648106648106648106648 110282110282110282110282110282 -3634-3634-3634-3634-3634 133167133167133167133167133167 143749143749143749143749143749 -10582-10582-10582-10582-10582I)I)I)I)I) Merchandise (FoB/CIF)Merchandise (FoB/CIF)Merchandise (FoB/CIF)Merchandise (FoB/CIF)Merchandise (FoB/CIF) 3315333153331533315333153 5008650086500865008650086 -16933-16933-16933-16933-16933 4492344923449234492344923 5141751417514175141751417 -6494-6494-6494-6494-6494 5476154761547615476154761 7200072000720007200072000 -17239-17239-17239-17239-17239 7114771147711477114771147 8387083870838708387083870 -12723-12723-12723-12723-12723 8432984329843298432984329 112748112748112748112748112748 -28419-28419-28419-28419-28419II)II)II)II)II) Invisibles (a+b+c)Invisibles (a+b+c)Invisibles (a+b+c)Invisibles (a+b+c)Invisibles (a+b+c) 1339613396133961339613396 1382913829138291382913829 -433-433-433-433-433 2344923449234492344923449 1919019190191901919019190 42594259425942594259 2704227042270422704227042 2256622566225662256622566 44764476447644764476 3550135501355013550135501 2641226412264122641226412 90899089908990899089 4883948839488394883948839 3100131001310013100131001 1783817838178381783817838
B)B)B)B)B) Total Capital AccountTotal Capital AccountTotal Capital AccountTotal Capital AccountTotal Capital Account 4085140851408514085140851 2819328193281932819328193 1265812658126581265812658 5730057300573005730057300 4748947489474894748947489 98119811981198119811 6604466044660446604466044 5391753917539175391753917 1212712127121271212712127 9082090820908209082090820 6291562915629156291562915 2790527905279052790527905 8136081360813608136081360 5466754667546675466754667 26693266932669326693266931.1.1.1.1. Foreign Investment (I+II)Foreign Investment (I+II)Foreign Investment (I+II)Foreign Investment (I+II)Foreign Investment (I+II) 201201201201201 1919191919 183183183183183 385385385385385 4646464646 339339339339339 17971797179717971797 9898989898 16991699169916991699 1446114461144611446114461 11801180118011801180 1328113281132811328113281 1808618086180861808618086 29982998299829982998 1508815088150881508815088
In India (Ii + IIi) 201 19 172 385 46 339 1797 98 1699 14461 1179 13282 18058 2609 15449Abroad (Iii + IIii) ----- ----- ----- ----- ----- ----- ----- ----- ----- ----- 1 -1 28 390 -362
I. DirectI. DirectI. DirectI. DirectI. Direct 191191191191191 1919191919 172172172172172 375375375375375 4646464646 329329329329329 10511051105110511051 9292929292 959959959959959 242242242242242 204204204204204 3838383838 42414241424142414241 2525252525 42164216421642164216i) In India ----- ----- ----- ----- ----- ----- ----- ----- ----- ----- ----- ----- ----- - -----
Equity ----- ----- ----- ----- ----- ----- ----- ----- ----- ----- ----- ----- ----- - ----- Reinvested Earnings ----- ----- ----- ----- ----- ----- ----- ----- ----- ----- ----- ----- ----- - ----- Other Capital ----- ----- ----- ----- ----- ----- ----- ----- ----- ----- ----- ----- ----- - -----
ii) Abroad ----- ----- ----- ----- ----- ----- ----- ----- ----- ----- ----- ----- ----- - ----- Equity ----- ----- ----- ----- ----- ----- ----- ----- ----- ----- ----- ----- ----- - ----- Reinvested Earnings ----- ----- ----- ----- ----- ----- ----- ----- ----- ----- ----- ----- ----- - ----- Other Capital ----- ----- ----- ----- ----- ----- ----- ----- ----- ----- ----- ----- ----- - -----
II.II.II.II.II. PortfolioPortfolioPortfolioPortfolioPortfolio 1010101010 00000 1010101010 1010101010 00000 1010101010 746746746746746 66666 740740740740740 1242012420124201242012420 975975975975975 1144511445114451144511445 1381713817138171381713817 25842584258425842584 1123311233112331123311233i) In India ----- ----- ----- ----- ----- ----- ----- ----- ----- ----- ----- ----- ----- ----- -----ii) Abroad ----- ----- ----- ----- ----- ----- ----- ----- ----- ----- ----- ----- ----- ----- -----
2.2.2.2.2. LoansLoansLoansLoansLoans 1692416924169241692416924 69966996699669966996 99289928992899289928 2321923219232192321923219 1329413294132941329413294 99259925992599259925 2663926639266392663926639 2519425194251942519425194 14451445144514451445 3127631276312763127631276 2559025590255902559025590 56865686568656865686 3432934329343293432934329 2478724787247872478724787 95429542954295429542a) External Assistance 6095 2139 3956 10715 3335 7380 10172 4434 5738 1904 4955 -3051 10030 5257 4773
i) By India ----- 11 -11 0 14 -14 0 11 -11 ----- 15 -15 4 29 -25ii) To India 6095 2129 3966 10715 3320 7395 10172 4424 5748 10904 4940 5964 10025 5227 4798
b) Commercial Borrowings 7684 3639 4045 7896 4074 3822 3621 4740 -1119 9457 7308 2149 13347 9813 3533i) By India 54 44 10 45 29 16 38 62 -24 320 76 244 306 11 296ii) To India 7630 3595 4035 7851 4045 3806 3583 4678 -1095 9137 7232 1905 13041 9803 3238
c) Short term To India 3145 1216 1928 4609 5885 -1276 12847 16020 -3173 10915 13328 -2413 10953 9717 12363.3.3.3.3. Banking CapitalBanking CapitalBanking CapitalBanking CapitalBanking Capital 1813318133181331813318133 1691016910169101691016910 12231223122312231223 2677226772267722677226772 2542225422254222542225422 13501350135013501350 3425734257342573425734257 2210022100221002210022100 1215712157121571215712157 3607036070360703607036070 288971288971288971288971288971 -252902-252902-252902-252902-252902 2203422034220342203422034 2309223092230922309223092 -1058-1058-1058-1058-1058
a) Commercial Banks 14282 12661 1621 22452 21850 602 29684 20728 8956 33289 2891 30398 20244 22216 -1972i) Assets 763 1415 -652 3397 2838 559 3783 485 3298 864 3513 -29649 756 3780 -3024ii) Liabilities 13519 11244 2275 19054 19011 43 25901 20242 -438 32425 24578 4067 19488 18436 513
Of which::::: Non-Resident Deposits 13184 10427 2757 18972 17965 1007 25191 19094 6097 27759 23979 3780 18224 17685 539b) Others 3851 4249 -399 4320 3573 747 4573 1372 3201 2781 880 1900 1790 876 914
4.4.4.4.4. Rupee Debt ServiceRupee Debt ServiceRupee Debt ServiceRupee Debt ServiceRupee Debt Service 00000 21402140214021402140 -2140-2140-2140-2140-2140 00000 27852785278527852785 -2785-2785-2785-2785-2785 00000 23352335233523352335 -2335-2335-2335-2335-2335 ----- 33023302330233023302 -3302-3302-3302-3302-3302 ----- 30903090309030903090 -3090-3090-3090-3090-30905.5.5.5.5. Other CapitalOther CapitalOther CapitalOther CapitalOther Capital 55935593559355935593 21292129212921292129 34643464346434643464 69236923692369236923 59445944594459445944 979979979979979 33513351335133513351 41914191419141914191 -840-840-840-840-840 90149014901490149014 38733873387338733873 51415141514151415141 69126912691269126912 701701701701701 62116211621162116211
C.C.C.C.C. Errors & OmissionsErrors & OmissionsErrors & OmissionsErrors & OmissionsErrors & Omissions 235235235235235 ----- 238238238238238 ----- 301301301301301 -301-301-301-301-301 44004400440044004400 46454645464546454645 -245-245-245-245-245 25102510251025102510 ----- 25102510251025102510 20492049204920492049 ----- 20492049204920492049D.D.D.D.D. Overall Balance (A+B+C)Overall Balance (A+B+C)Overall Balance (A+B+C)Overall Balance (A+B+C)Overall Balance (A+B+C) 8763487634876348763487634 9210592105921059210592105 -4471-4471-4471-4471-4471 125672125672125672125672125672 118398118398118398118398118398 72747274727472747274 147843147843147843147843147843 148726148726148726148726148726 -883-883-883-883-883 199977199977199977199977199977 173198173198173198173198173198 2677926779267792677926779 216576216576216576216576216576 198416198416198416198416198416 1816018160181601816018160E.E.E.E.E. Monetary MovementsMonetary MovementsMonetary MovementsMonetary MovementsMonetary Movements 44714471447144714471 ----- 44714471447144714471 32053205320532053205 1047910479104791047910479 -7274-7274-7274-7274-7274 42314231423142314231 33483348334833483348 883883883883883 10071007100710071007 2778627786277862778627786 -26779-26779-26779-26779-26779 ----- 1816018160181601816018160 -18160-18160-18160-18160-18160
i) I.M.F. 2178 ----- 2178 3205 1127 2078 4231 869 3362 1007 420 587 4231 3585 3363ii) Foreign Exchange Reserves 2293 ----- 2293 ----- 9351 -9351 ----- 2481 -2481 ----- 27366 -27366 1623 14575 -2481
(Contd)
23B
alance of Paym
ents

Balance of P
ayments
24
Appendix 1(B): Balance of Payments : 1990-91 to 2002-03Appendix 1(B): Balance of Payments : 1990-91 to 2002-03Appendix 1(B): Balance of Payments : 1990-91 to 2002-03Appendix 1(B): Balance of Payments : 1990-91 to 2002-03Appendix 1(B): Balance of Payments : 1990-91 to 2002-03
(Rupees, Crore)
1995-96 1996-97 1997-98 1998-99 1999-00
Receipts Payments Net Receipts Payments Net Receipts Payments Net Receipts Payments Net Receipts Payments Net
A)A)A)A)A) CURRENT ACCOUNT (I+II)CURRENT ACCOUNT (I+II)CURRENT ACCOUNT (I+II)CURRENT ACCOUNT (I+II)CURRENT ACCOUNT (I+II) 157963157963157963157963157963 187569187569187569187569187569 -29606-29606-29606-29606-29606 197285197285197285197285197285 213566213566213566213566213566 -16281-16281-16281-16281-16281 218948218948218948218948218948 239831239831239831239831239831 -20883-20883-20883-20883-20883 252895252895252895252895252895 269684269684269684269684269684 -16789-16789-16789-16789-16789 294202294202294202294202294202 314533314533314533314533314533 -20331-20331-20331-20331-20331I)I)I)I)I) Merchandise (FoB/CIF)Merchandise (FoB/CIF)Merchandise (FoB/CIF)Merchandise (FoB/CIF)Merchandise (FoB/CIF) 108481108481108481108481108481 4102741027410274102741027 6745467454674546745467454 121194121194121194121194121194 173753173753173753173753173753 -52559-52559-52559-52559-52559 132703132703132703132703132703 190508190508190508190508190508 -57805-57805-57805-57805-57805 144436144436144436144436144436 199914199914199914199914199914 -55478-55478-55478-55478-55478 162753162753162753162753162753 240112240112240112240112240112 -77359-77359-77359-77359-77359II)II)II)II)II) Invisibles (a+b+c)Invisibles (a+b+c)Invisibles (a+b+c)Invisibles (a+b+c)Invisibles (a+b+c) 5948259482594825948259482 4102741027410274102741027 1845518455184551845518455 7609176091760917609176091 3981339813398133981339813 3627836278362783627836278 8624586245862458624586245 4932349323493234932349323 3692236922369223692236922 108459108459108459108459108459 6977069770697706977069770 3868938689386893868938689 131449131449131449131449131449 7442174421744217442174421 5702857028570285702857028
B)B)B)B)B) Total Capital AccountTotal Capital AccountTotal Capital AccountTotal Capital AccountTotal Capital Account 8160381603816038160381603 6733267332673326733267332 1427114271142711427114271 128559128559128559128559128559 8594485944859448594485944 4261542615426154261542615 146102146102146102146102146102 109497109497109497109497109497 3660536605366053660536605 143561143561143561143561143561 107679107679107679107679107679 3588235882358823588235882 175822175822175822175822175822 130494130494130494130494130494 45328453284532845328453281.1.1.1.1. Foreign Investment (I+II)Foreign Investment (I+II)Foreign Investment (I+II)Foreign Investment (I+II)Foreign Investment (I+II) 1904219042190421904219042 34183418341834183418 1562415624156241562415624 2778427784277842778427784 66226622662266226622 2116221162211622116221162 3444434444344443444434444 1461214612146121461214612 1983219832198321983219832 2482524825248252482524825 1508815088150881508815088 97379737973797379737 5312553125531255312553125 3094130941309413094130941 2218422184221842218422184
In India (Ii + IIi) 18994 2721 16273 27751 5922 21829 34075 14114 19961 24210 14041 10169 52607 30106 22501Abroad (Iii + IIii) 48 697 -649 33 700 -667 369 4988 -4619 615 1047 -432 518 835 -317
I. DirectI. DirectI. DirectI. DirectI. Direct 72777277727772777277 101101101101101 71767176717671767176 1017110171101711017110171 7777777777 1009410094100941009410094 1331713317133171331713317 124124124124124 1319313193131931319313193 1055010550105501055010550 162162162162162 1038810388103881038810388 94099409940994099409 1313131313 93969396939693969396i) In India ----- ----- ----- ----- ----- ----- ----- ----- ----- ----- ----- ----- ----- ----- -----
Equity ----- ----- ----- ----- ----- ----- ----- ----- ----- ----- ----- ----- ----- ----- ----- Reinvested Earnings ----- ----- ----- ----- ----- ----- ----- ----- ----- ----- ----- ----- ----- ----- ----- Other Capital ----- ----- ----- ----- ----- ----- ----- ----- ----- ----- ----- ----- ----- ----- -----
ii) Abroad ----- ----- ----- ----- ----- ----- ----- ----- ----- ----- ----- ----- ----- ----- ----- Equity ----- ----- ----- ----- ----- ----- ----- ----- ----- ----- ----- ----- ----- ----- ----- Reinvested Earnings ----- ----- ----- ----- ----- ----- ----- ----- ----- ----- ----- ----- ----- ----- ----- Other Capital ----- ----- ----- ----- ----- ----- ----- ----- ----- ----- ----- ----- ----- ----- -----
II.II.II.II.II. PortfolioPortfolioPortfolioPortfolioPortfolio 1171711717117171171711717 26202620262026202620 90979097909790979097 1758117581175811758117581 58455845584558455845 1173611736117361173611736 2075820758207582075820758 1399013990139901399013990 67686768676867686768 1366013660136601366013660 1387913879138791387913879 -219-219-219-219-219 4319843198431984319843198 3009330093300933009330093 1310513105131051310513105i) In India ----- ----- ----- ----- ----- ----- ----- ----- ----- ----- ----- ----- ----- ----- -----ii) Abroad ----- ----- ----- ----- ----- ----- ----- ----- ----- ----- ----- ----- ----- ----- -----
2.2.2.2.2. LoansLoansLoansLoansLoans 3839638396383963839638396 3042230422304223042230422 79747974797479747974 6299162991629916299162991 4600946009460094600946009 1698216982169821698216982 6414464144641446414464144 4669746697466974669746697 1744717447174471744717447 6197261972619726197261972 4300943009430094300943009 1896318963189631896318963 5664656646566465664656646 4969549695496954969549695 69516951695169516951a) External Assistance 10101 6799 3302 10893 6924 3969 10827 7441 3386 11608 8107 3501 13342 9471 3871
i) By India ----- 54 -54 ----- 29 29 77 -77 2 85 -83 3 47 -44ii) To India 10101 6746 3355 10893 6895 3998 10827 7364 3463 11506 8022 3484 13339 9424 3915
b) Commercial Borrowings 14470 9892 4578 26897 16863 10034 27254 12653 14601 30646 12067 18579 87 12463 -12376i) By India 30 ----- 30 30 ----- 30 43 ----- 43 22 ----- 22 13823 ----- 13823ii) To India 14440 9892 4548 26867 16863 10004 27211 12653 14558 30624 12067 18557 - 12463 -12463
c) Short term To India 13824 13730 94 25201 22222 2979 26063 26593 -530 19718 22834 -3116 29394 27761 16333.3.3.3.3. Banking CapitalBanking CapitalBanking CapitalBanking CapitalBanking Capital 2169221692216922169221692 1924719247192471924719247 24452445244524452445 2839428394283942839428394 2050420504205042050420504 78907890789078907890 3305633056330563305633056 3624336243362433624336243 -3187-3187-3187-3187-3187 3752537525375253752537525 3439634396343963439634396 31293129312931293129 4621246212462124621246212 3699536995369953699536995 92179217921792179217
a) Commercial Banks 20787 17704 3083 27052 19146 7906 30328 34838 -4510 31507 33194 -1687 44496 34486 10010i) Assets 2845 4320 -1475 2650 5738 -3088 2093 10214 -8121 5713 11421 -5708 11486 8079 3407ii) Liabilities 17942 13384 4558 24402 13409 10993 28235 24625 3610 26894 21773 5121 33010 26407 6603
Of which::::: Non-Resident Deposits 16671 12850 3821 24039 12146 11893 28041 23716 4325 26267 21207 5060 32133 25424 6709b) Others 904 1543 -639 1342 1358 -16 2728 1405 1323 6018 1202 4816 1716 2509 -793
4.4.4.4.4. Rupee Debt ServiceRupee Debt ServiceRupee Debt ServiceRupee Debt ServiceRupee Debt Service ----- 31063106310631063106 -3106-3106-3106-3106-3106 ----- 25422542254225422542 -2542-2542-2542-2542-2542 ----- 27842784278427842784 -2784-2784-2784-2784-2784 ----- 33083308330833083308 -3308-3308-3308-3308-3308 ----- 30593059305930593059 -3059-3059-3059-3059-30595.5.5.5.5. Other CapitalOther CapitalOther CapitalOther CapitalOther Capital 24742474247424742474 1114011140111401114011140 -8666-8666-8666-8666-8666 93909390939093909390 1026710267102671026710267 -877-877-877-877-877 1445814458144581445814458 91719171917191719171 52875287528752875287 1933919339193391933919339 1187911879118791187911879 74607460746074607460 1983919839198391983919839 98049804980498049804 1003510035100351003510035
C.C.C.C.C. Errors & OmissionsErrors & OmissionsErrors & OmissionsErrors & OmissionsErrors & Omissions 12871287128712871287 ----- 12871287128712871287 ----- 21142114211421142114 -2114-2114-2114-2114-2114 931931931931931 ----- 931931931931931 143561143561143561143561143561 848848848848848 142713142713142713142713142713 27732773277327732773 ----- 27732773277327732773D.D.D.D.D. Overall Balance (A+B+C)Overall Balance (A+B+C)Overall Balance (A+B+C)Overall Balance (A+B+C)Overall Balance (A+B+C) 250853250853250853250853250853 254902254902254902254902254902 -4049-4049-4049-4049-4049 325844325844325844325844325844 301624301624301624301624301624 2422024220242202422024220 365981365981365981365981365981 349328349328349328349328349328 1665316653166531665316653 396456396456396456396456396456 378211378211378211378211378211 1824518245182451824518245 472797472797472797472797472797 445027445027445027445027445027 2777027770277702777027770E.E.E.E.E. Monetary MovementsMonetary MovementsMonetary MovementsMonetary MovementsMonetary Movements 97989798979897989798 57495749574957495749 40494049404940494049 ----- 2422024220242202422024220 -24220-24220-24220-24220-24220 ----- 1665316653166531665316653 -16653-16653-16653-16653-16653 ----- 1824518245182451824518245 -18245-18245-18245-18245-18245 ----- 2777027770277702777027770 -27770-27770-27770-27770-27770
i) I.M.F. ----- 5749 -5749 ----- 3461 -3461 ----- 2286 -2286 ----- 1652 -1652 ----- 1122 -1122ii) Foreign Exchange Reserves 9798 ----- 9798 ----- 20759 -20759 ----- 14367 -14367 ----- 16593 -16593 ----- 26648 -26648
(Contd)
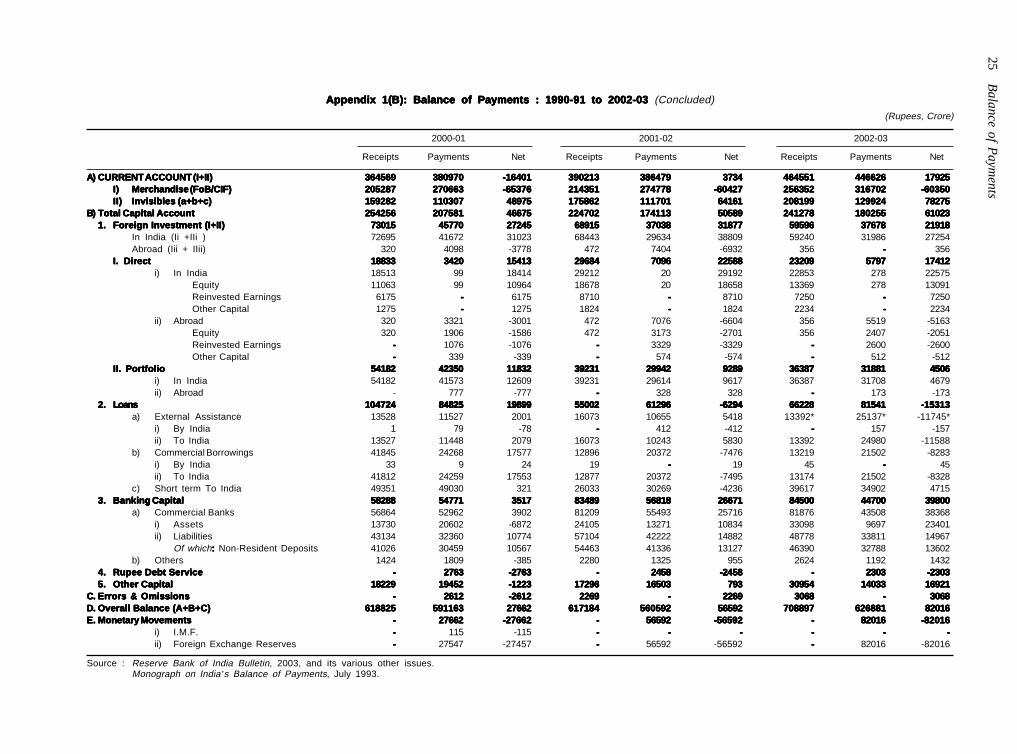
25B
alance of Paym
ents
Appendix 1(B): Balance of Payments : 1990-91 to 2002-03 Appendix 1(B): Balance of Payments : 1990-91 to 2002-03 Appendix 1(B): Balance of Payments : 1990-91 to 2002-03 Appendix 1(B): Balance of Payments : 1990-91 to 2002-03 Appendix 1(B): Balance of Payments : 1990-91 to 2002-03 (Concluded)
(Rupees, Crore)
2000-01 2001-02 2002-03
Receipts Payments Net Receipts Payments Net Receipts Payments Net
A)A)A)A)A) CURRENT ACCOUNT (I+II)CURRENT ACCOUNT (I+II)CURRENT ACCOUNT (I+II)CURRENT ACCOUNT (I+II)CURRENT ACCOUNT (I+II) 364569364569364569364569364569 380970380970380970380970380970 -16401-16401-16401-16401-16401 390213390213390213390213390213 386479386479386479386479386479 37343734373437343734 464551464551464551464551464551 446626446626446626446626446626 1792517925179251792517925I)I)I)I)I) Merchandise (FoB/CIF)Merchandise (FoB/CIF)Merchandise (FoB/CIF)Merchandise (FoB/CIF)Merchandise (FoB/CIF) 205287205287205287205287205287 270663270663270663270663270663 -65376-65376-65376-65376-65376 214351214351214351214351214351 274778274778274778274778274778 -60427-60427-60427-60427-60427 256352256352256352256352256352 316702316702316702316702316702 -60350-60350-60350-60350-60350II)II)II)II)II) Invisibles (a+b+c)Invisibles (a+b+c)Invisibles (a+b+c)Invisibles (a+b+c)Invisibles (a+b+c) 159282159282159282159282159282 110307110307110307110307110307 4897548975489754897548975 175862175862175862175862175862 111701111701111701111701111701 6416164161641616416164161 208199208199208199208199208199 129924129924129924129924129924 7827578275782757827578275
B)B)B)B)B) Total Capital AccountTotal Capital AccountTotal Capital AccountTotal Capital AccountTotal Capital Account 254256254256254256254256254256 207581207581207581207581207581 4667546675466754667546675 224702224702224702224702224702 174113174113174113174113174113 5058950589505895058950589 241278241278241278241278241278 180255180255180255180255180255 61023610236102361023610231.1.1.1.1. Foreign Investment (I+II)Foreign Investment (I+II)Foreign Investment (I+II)Foreign Investment (I+II)Foreign Investment (I+II) 7301573015730157301573015 4577045770457704577045770 2724527245272452724527245 6891568915689156891568915 3703837038370383703837038 3187731877318773187731877 5959659596595965959659596 3767837678376783767837678 2191821918219182191821918
In India (Ii +IIi ) 72695 41672 31023 68443 29634 38809 59240 31986 27254Abroad (Iii + IIii) 320 4098 -3778 472 7404 -6932 356 ----- 356
I. DirectI. DirectI. DirectI. DirectI. Direct 1883318833188331883318833 34203420342034203420 1541315413154131541315413 2968429684296842968429684 70967096709670967096 2258822588225882258822588 2320923209232092320923209 57975797579757975797 1741217412174121741217412i) In India 18513 99 18414 29212 20 29192 22853 278 22575
Equity 11063 99 10964 18678 20 18658 13369 278 13091Reinvested Earnings 6175 ----- 6175 8710 ----- 8710 7250 ----- 7250Other Capital 1275 ----- 1275 1824 ----- 1824 2234 ----- 2234
ii) Abroad 320 3321 -3001 472 7076 -6604 356 5519 -5163Equity 320 1906 -1586 472 3173 -2701 356 2407 -2051Reinvested Earnings ----- 1076 -1076 ----- 3329 -3329 ----- 2600 -2600Other Capital ----- 339 -339 ----- 574 -574 ----- 512 -512
II. PortfolioII. PortfolioII. PortfolioII. PortfolioII. Portfolio 5418254182541825418254182 4235042350423504235042350 1183211832118321183211832 3923139231392313923139231 2994229942299422994229942 92899289928992899289 3638736387363873638736387 3188131881318813188131881 45064506450645064506i) In India 54182 41573 12609 39231 29614 9617 36387 31708 4679ii) Abroad - 777 -777 ----- 328 328 ----- 173 -173
2.2.2.2.2. LoansLoansLoansLoansLoans 104724104724104724104724104724 8482584825848258482584825 1989919899198991989919899 5500255002550025500255002 6129661296612966129661296 -6294-6294-6294-6294-6294 6622866228662286622866228 8154181541815418154181541 -15313-15313-15313-15313-15313a) External Assistance 13528 11527 2001 16073 10655 5418 13392* 25137* -11745*
i) By India 1 79 -78 ----- 412 -412 ----- 157 -157ii) To India 13527 11448 2079 16073 10243 5830 13392 24980 -11588
b) Commercial Borrowings 41845 24268 17577 12896 20372 -7476 13219 21502 -8283i) By India 33 9 24 19 ----- 19 45 ----- 45ii) To India 41812 24259 17553 12877 20372 -7495 13174 21502 -8328
c) Short term To India 49351 49030 321 26033 30269 -4236 39617 34902 47153.3.3.3.3. Banking CapitalBanking CapitalBanking CapitalBanking CapitalBanking Capital 5828858288582885828858288 5477154771547715477154771 35173517351735173517 8348983489834898348983489 5681856818568185681856818 2667126671266712667126671 8450084500845008450084500 4470044700447004470044700 3980039800398003980039800
a) Commercial Banks 56864 52962 3902 81209 55493 25716 81876 43508 38368i) Assets 13730 20602 -6872 24105 13271 10834 33098 9697 23401ii) Liabilities 43134 32360 10774 57104 42222 14882 48778 33811 14967
Of which::::: Non-Resident Deposits 41026 30459 10567 54463 41336 13127 46390 32788 13602b) Others 1424 1809 -385 2280 1325 955 2624 1192 1432
4.4.4.4.4. Rupee Debt ServiceRupee Debt ServiceRupee Debt ServiceRupee Debt ServiceRupee Debt Service ----- 27632763276327632763 -2763-2763-2763-2763-2763 ----- 24582458245824582458 -2458-2458-2458-2458-2458 ----- 23032303230323032303 -2303-2303-2303-2303-23035.5.5.5.5. Other CapitalOther CapitalOther CapitalOther CapitalOther Capital 1822918229182291822918229 1945219452194521945219452 -1223-1223-1223-1223-1223 1729617296172961729617296 1650316503165031650316503 793793793793793 3095430954309543095430954 1403314033140331403314033 1692116921169211692116921
C.C.C.C.C. Errors & OmissionsErrors & OmissionsErrors & OmissionsErrors & OmissionsErrors & Omissions ----- 26122612261226122612 -2612-2612-2612-2612-2612 22692269226922692269 ----- 22692269226922692269 30683068306830683068 ----- 30683068306830683068D.D.D.D.D. Overall Balance (A+B+C)Overall Balance (A+B+C)Overall Balance (A+B+C)Overall Balance (A+B+C)Overall Balance (A+B+C) 618825618825618825618825618825 591163591163591163591163591163 2766227662276622766227662 617184617184617184617184617184 560592560592560592560592560592 5659256592565925659256592 708897708897708897708897708897 626881626881626881626881626881 8201682016820168201682016E.E.E.E.E. Monetary MovementsMonetary MovementsMonetary MovementsMonetary MovementsMonetary Movements ----- 2766227662276622766227662 -27662-27662-27662-27662-27662 ----- 5659256592565925659256592 -56592-56592-56592-56592-56592 ----- 8201682016820168201682016 -82016-82016-82016-82016-82016
i) I.M.F. ----- 115 -115 ----- ----- ----- ----- ----- -----ii) Foreign Exchange Reserves ----- 27547 -27457 ----- 56592 -56592 ----- 82016 -82016
Source : Reserve Bank of India Bulletin, 2003, and its various other issues.Monograph on India’s Balance of Payments, July 1993.

Balance of P
ayments
26
Appendix 1(C): Balance of Payments : 1990-91 to 2002-03Appendix 1(C): Balance of Payments : 1990-91 to 2002-03Appendix 1(C): Balance of Payments : 1990-91 to 2002-03Appendix 1(C): Balance of Payments : 1990-91 to 2002-03Appendix 1(C): Balance of Payments : 1990-91 to 2002-03(US Dollar Million)
1990-91 PR 1991-92 1992-93 1993-94 1994-95
Receipts Payments Net Receipts Payments Net Receipts Payments Net Receipts Payments Net Receipts Payments Net
A)A)A)A)A) CURRENT ACCOUNT (I+II)CURRENT ACCOUNT (I+II)CURRENT ACCOUNT (I+II)CURRENT ACCOUNT (I+II)CURRENT ACCOUNT (I+II) 2594125941259412594125941 3562135621356213562135621 -9680-9680-9680-9680-9680 2776827768277682776827768 2894628946289462894628946 -1178-1178-1178-1178-1178 28203 31729 -3526 34002 35160 -1158 42409 45778 -3369I)I)I)I)I) Merchandise (FoB/CIF)Merchandise (FoB/CIF)Merchandise (FoB/CIF)Merchandise (FoB/CIF)Merchandise (FoB/CIF) 1847718477184771847718477 2791527915279152791527915 -9438-9438-9438-9438-9438 1826618266182661826618266 2106421064210642106421064 -2798-2798-2798-2798-2798 1886918869188691886918869 2431624316243162431624316 -5447-5447-5447-5447-5447 2268322683226832268322683 2673926739267392673926739 -4056-4056-4056-4056-4056 2685526855268552685526855 3590435904359043590435904 -9049-9049-9049-9049-9049II)II)II)II)II) Invisibles (a+b+c)Invisibles (a+b+c)Invisibles (a+b+c)Invisibles (a+b+c)Invisibles (a+b+c) 74647464746474647464 77067706770677067706 -242-242-242-242-242 95029502950295029502 78827882788278827882 16201620162016201620 93349334933493349334 74137413741374137413 19211921192119211921 1031910319103191031910319 84218421842184218421 28982898289828982898 1555415554155541555415554 98749874987498749874 56805680568056805680
B)B)B)B)B) Total Capital AccountTotal Capital AccountTotal Capital AccountTotal Capital AccountTotal Capital Account 22766 15710 7056 23334 19424 3910 22617 18741 3876 28955 20060 8395 25914 17412 85021.1.1.1.1. Foreign Investment (I+II)Foreign Investment (I+II)Foreign Investment (I+II)Foreign Investment (I+II)Foreign Investment (I+II) 113113113113113 1010101010 103103103103103 151151151151151 1818181818 133133133133133 589589589589589 3232323232 557557557557557 46114611461146114611 376376376376376 42354235423542354235 57635763576357635763 956956956956956 48074807480748074807
In India (Ii +IIi ) 113 10 103 151 18 133 589 32 557 4611 376 4235 5753 831 4922Abroad (Iii + IIii) - - - - - - - - - - - - 10 125 -115
I. DirectI. DirectI. DirectI. DirectI. Direct 107107107107107 1010101010 9797979797 147147147147147 1818181818 129129129129129 345345345345345 3030303030 315315315315315 651651651651651 6565656565 586586586586586 13511351135113511351 88888 13431343134313431343i) In India .......... .......... .......... .......... .......... .......... .......... .......... .......... .......... .......... .......... .......... .......... ..........
Equity .......... .......... .......... .......... .......... .......... .......... .......... .......... .......... .......... .......... .......... .......... .......... Reinvested Earnings .......... .......... .......... .......... .......... .......... .......... .......... .......... .......... .......... .......... .......... .......... .......... Other Capital .......... .......... .......... .......... .......... .......... .......... .......... .......... .......... .......... .......... .......... .......... ..........
ii) Abroad .......... .......... .......... .......... .......... .......... .......... .......... .......... .......... .......... .......... .......... .......... ..........Equity .......... .......... .......... .......... .......... .......... .......... .......... .......... .......... .......... .......... .......... .......... ..........Reinvested Earnings .......... .......... .......... .......... .......... .......... .......... .......... .......... .......... .......... .......... .......... .......... ..........Other Capital .......... .......... .......... .......... .......... .......... .......... .......... .......... .......... .......... .......... .......... .......... ..........
II.II.II.II.II. PortfolioPortfolioPortfolioPortfolioPortfolio 66666 00000 66666 44444 ----- 44444 244244244244244 22222 242242242242242 39603960396039603960 311311311311311 36493649364936493649 44024402440244024402 823823823823823 35793579357935793579i) In India .......... .......... .......... .......... .......... .......... .......... .......... .......... .......... .......... .......... .......... .......... ..........ii) Abroad .......... .......... .......... .......... .......... .......... .......... .......... .......... .......... .......... .......... .......... .......... ..........
2.2.2.2.2. LoansLoansLoansLoansLoans 94329432943294329432 38993899389938993899 55335533553355335533 94169416941694169416 54375437543754375437 39793979397939793979 86718671867186718671 82608260826082608260 411411411411411 99719971997199719971 81598159815981598159 18121812181218121812 1093010930109301093010930 78957895789578957895 30353035303530353035a) External Assistance 3397 1193 2204 4366 1335 3031 3302 1446 1856 3476 1580 1896 3193 1675 1518
i) By India - 6 -6 - 6 -6 - 3 -3 - 5 -5 2 10 -8ii) To India 3397 1187 2210 4366 1329 3037 3302 1443 1859 3476 1575 1901 3191 1665 1526
b) Commercial Borrowings 4282 2028 2254 31523152315231523152 1689 1463 1179 1545 -366 3015 2330 685 4249 3125 1124i) By India 30 24 6 19 12 7 12 20 -8 102 24 78 97 3 94ii) To India 4252 2004 2248 3133 1677 1456 1167 1525 -358 29132913291329132913 23062306230623062306 607 4152 31223122312231223122 1030
c) Short term To India 1753 678 1075 1898 2413 -515 4190 5259 -1069 3480 4249 -769 3488 3095 3933.3.3.3.3. Banking CapitalBanking CapitalBanking CapitalBanking CapitalBanking Capital 1010610106101061010610106 94249424942494249424 682682682682682 1095810958109581095810958 1039410394103941039410394 564564564564564 1199811998119981199811998 81728172817281728172 38263826382638263826 1150011500115001150011500 92379237923792379237 22632263226322632263 70207020702070207020 73547354735473547354 -334-334-334-334-334
a) Commercial Banks 7960 7056 904 9065 8929 136 10653 7723 2930 10614 8956 1658 6449 7075 -626i) Assets 425 789 -364 1335 1107 228 1234 161 1073 276 1120 -844 241 1203 -962ii) Liabilities 187 456 -269 35 417 -382 231 375 -144 1483 191 1292 403 239 164
of which:::::Non-Resident Deposits 7348 5811 1537 7695 7405 290 9188 7187 2001 8850 7645 1205 5805 5633 172b) Others 2146 2368 -222 1893 1465 428 1345 449 896 886 281 605 571 279 292
4.4.4.4.4. Rupee Debt ServiceRupee Debt ServiceRupee Debt ServiceRupee Debt ServiceRupee Debt Service ----- 11931193119311931193 -1193-1193-1193-1193-1193 ----- 12401240124012401240 -1240-1240-1240-1240-1240 ----- 878878878878878 -878-878-878-878-878 ----- 10531053105310531053 -1053-1053-1053-1053-1053 ----- 983983983983983 -983-983-983-983-9835.5.5.5.5. Other CapitalOther CapitalOther CapitalOther CapitalOther Capital 31173117311731173117 11861186118611861186 19311931193119311931 28092809280928092809 23352335233523352335 474474474474474 13591359135913591359 13991399139913991399 -40-40-40-40-40 28732873287328732873 12351235123512351235 16381638163816381638 22012201220122012201 224224224224224 19771977197719771977
C.C.C.C.C. Errors & OmissionsErrors & OmissionsErrors & OmissionsErrors & OmissionsErrors & Omissions 132132132132132 ----- 132132132132132 ----- 133133133133133 -133-133-133-133-133 ----- 940940940940940 -940-940-940-940-940 800800800800800 ----- 800800800800800 654654654654654 ----- 654654654654654D.D.D.D.D. Overall Balance (A+B+C)Overall Balance (A+B+C)Overall Balance (A+B+C)Overall Balance (A+B+C)Overall Balance (A+B+C) 4883948839488394883948839 5133151331513315133151331 -2492-2492-2492-2492-2492 5110251102511025110251102 4850348503485034850348503 -2599-2599-2599-2599-2599 5082050820508205082050820 5141051410514105141051410 -590-590-590-590-590 6375763757637576375763757 5522055220552205522055220 85378537853785378537 6897768977689776897768977 6319063190631906319063190 57875787578757875787E.E.E.E.E. Monetary MovementsMonetary MovementsMonetary MovementsMonetary MovementsMonetary Movements 31363136313631363136 644644644644644 24922492249224922492 12451245124512451245 459459459459459 786786786786786 16231623162316231623 10331033103310331033 590590590590590 321321321321321 88588858885888588858 -8537-8537-8537-8537-8537 ----- 57875787578757875787 -5787-5787-5787-5787-5787
i) I.M.F. 1858 644 1214 1245 459 786 1623 335 1288 321 134 187 - 1143 -1143ii) Foreign Exchange Reserves 1278 - 1278 - 3385 -3375 - 698 -698 - 8724 -8724 - 4644 -4644
(Contd)

Appendix 1(C): Balance of Payments : 1990-91 to 2002-03Appendix 1(C): Balance of Payments : 1990-91 to 2002-03Appendix 1(C): Balance of Payments : 1990-91 to 2002-03Appendix 1(C): Balance of Payments : 1990-91 to 2002-03Appendix 1(C): Balance of Payments : 1990-91 to 2002-03(US Dollar Million)
1995-96 1996-97 1997-98 PR 1998-99 1999-2000PR
Receipts Payments Net Receipts Payments Net Receipts Payments Net Receipts Payments Net Receipts Payments Net
A)A)A)A)A) CURRENT ACCOUNT (I+II)CURRENT ACCOUNT (I+II)CURRENT ACCOUNT (I+II)CURRENT ACCOUNT (I+II)CURRENT ACCOUNT (I+II) 49987 55886 -5899 55538 60157 -4619 58924 64424 -5500 60068 64106 -4038 6785467854678546785467854 7255272552725527255272552 -4698-4698-4698-4698-4698I)I)I)I)I) Merchandise (FoB/CIF)Merchandise (FoB/CIF)Merchandise (FoB/CIF)Merchandise (FoB/CIF)Merchandise (FoB/CIF) 3231132311323113231132311 4367043670436704367043670 -11359-11359-11359-11359-11359 3413334133341333413334133 4894848948489484894848948 -14815 3568035680356803568035680 5118751187511875118751187 -15507 3429834298342983429834298 4754447544475444754447544 -13246 3754237542375423754237542 5538355383553835538355383 -17841-17841-17841-17841-17841II)II)II)II)II) Invisibles (a+b+c)Invisibles (a+b+c)Invisibles (a+b+c)Invisibles (a+b+c)Invisibles (a+b+c) 1767617676176761767617676 1221612216122161221612216 54605460546054605460 2140521405214052140521405 1120911209112091120911209 10196 2324423244232442324423244 1323713237132371323713237 10007 2577025770257702577025770 1656216562165621656216562 9208 3031230312303123031230312 1716917169171691716917169 1314313143131431314313143
B)B)B)B)B) Total Capital AccountTotal Capital AccountTotal Capital AccountTotal Capital AccountTotal Capital Account 24165 20087 4078 36191 24185 12006 3929239292392923929239292 2944829448294482944829448 9844 3417034170341703417034170 2573525735257352573525735 8435 4053140531405314053140531 3008730087300873008730087 10444104441044410444104441.1.1.1.1. Foreign Investment (I+II)Foreign Investment (I+II)Foreign Investment (I+II)Foreign Investment (I+II)Foreign Investment (I+II) 56325632563256325632 10281028102810281028 46044604460446044604 78247824782478247824 18611861186118611861 59635963596359635963 92669266926692669266 39133913391339133913 53535353535353535353 58925892589258925892 35803580358035803580 23122312231223122312 1224012240122401224012240 71237123712371237123 51175117511751175117
In India (Ii +IIi ) 5632 824 4794 7816 1663 6153 9169 3779 5390 5743 3331 2412 12121 6930 5191Abroad (Iii + IIii) 14 204 -190 8 198 -190 97 134 -37 149 249 -100 119 193 -74
I.I.I.I.I. DirectDirectDirectDirectDirect 21622162216221622162 2929292929 21332133213321332133 28632863286328632863 2222222222 28412841284128412841 35963596359635963596 3434343434 35623562356235623562 25182518251825182518 3838383838 24802480248024802480 21702170217021702170 33333 21672167216721672167i) In India .......... .......... .......... .......... .......... .......... .......... .......... .......... .......... .......... .......... .......... .......... ..........
Equity .......... .......... .......... .......... .......... .......... .......... .......... .......... .......... .......... .......... .......... .......... .......... Reinvested Earnings .......... .......... .......... .......... .......... .......... .......... .......... .......... .......... .......... .......... .......... .......... .......... Other Capital .......... .......... .......... .......... .......... .......... .......... .......... .......... .......... .......... .......... .......... .......... ..........
ii) Abroad .......... .......... .......... .......... .......... .......... .......... .......... .......... .......... .......... .......... .......... .......... .......... Equity .......... .......... .......... .......... .......... .......... .......... .......... .......... .......... .......... .......... .......... .......... .......... Reinvested Earnings .......... .......... .......... .......... .......... .......... .......... .......... .......... .......... .......... .......... .......... .......... .......... Other Capital .......... .......... .......... .......... .......... .......... .......... .......... .......... .......... .......... .......... .......... .......... ..........
II.II.II.II.II. PortfolioPortfolioPortfolioPortfolioPortfolio 34563456345634563456 795795795795795 26612661266126612661 49534953495349534953 16411641164116411641 33123312331233123312 55735573557355735573 37453745374537453745 18281828182818281828 32253225322532253225 32933293329332933293 -68-68-68-68-68 99519951995199519951 69276927692769276927 30243024302430243024i) In India .......... .......... .......... .......... .......... .......... .......... .......... .......... .......... .......... .......... .......... .......... ..........ii) Abroad .......... .......... .......... .......... .......... .......... .......... .......... .......... .......... .......... .......... .......... .......... ..........
2.2.2.2.2. LoansLoansLoansLoansLoans 1133211332113321133211332 91319131913191319131 22012201220122012201 1772017720177201772017720 1292512925129251292512925 47954795479547954795 1730117301173011730117301 1250212502125021250212502 47994799479947994799 1477114771147711477114771 1035310353103531035310353 44184418441844184418 1306013060130601306013060 1145911459114591145911459 16011601160116011601a) External Assistance 2933 20662066206620662066 867 30563056305630563056 19551955195519551955 1101 2885 2000 885 2726 1927 799 3074 2183 891
i) By India 0 16 -16 - 8 -8 - 22 -22 - 21 -21 0 10 -10ii) To India 2933 2050 883 3056 1947 1109 2885 1978 907 2726 1906 820 3074 2173 901
b) Commercial Borrowings 4262 2977 1285 7579 4723 2856 7382 3372 4010 7231 2864 4367 3207 2874 333i) By India 10 0 10 8 - 8 11 - 11 124 135 -11 20 - 20ii) To India 4252 29772977297729772977 1275 75717571757175717571 47234723472347234723 2848 7371 3372 3999 5 - 5 3187 2874 313
c) Short term To India 41374137413741374137 4088 49 7085 6247 838 7034 7130 -96 7226 2864 4362 6779 6402 377
3.3.3.3.3. Banking CapitalBanking CapitalBanking CapitalBanking CapitalBanking Capital 64536453645364536453 56915691569156915691 762762762762762 80188018801880188018 57895789578957895789 22292229222922292229 89108910891089108910 98039803980398039803 -893-893-893-893-893 48144814481448144814 55625562556255625562 -748-748-748-748-748 1065910659106591065910659 85328532853285328532 21272127212721272127a) Commercial Banks 6172 5235 937 7632 5407 2225 8164 9424 -1260 81978197819781978197 67176717671767176717 1480 10259 7955 2304
i) Assets 867 1251 -384 755 1625 -870 580 2775 -2195 6768 6434 334 26532653265326532653 1863 790ii) Liabilities 376 158 218 102 357 -255 52 242 -190 1344 2741 -1397 201 227 -26
Of which::::: Non-Resident Deposits 4929 3826 1103 6775 3425 3350 7532 6407 1125 45114511451145114511 9288692886928869288692886 -88375 7405 5865 1540b) Others 281 456 -175 386 382 4 746 379 367 5300 3558 1742 400 577 -177
4.4.4.4.4. Rupee Debt ServiceRupee Debt ServiceRupee Debt ServiceRupee Debt ServiceRupee Debt Service ----- 952952952952952 -952-952-952-952-952 727727727727727 -727-727-727-727-727 ----- 767767767767767 -767-767-767-767-767 14291429142914291429 283283283283283 11461146114611461146 ----- 711711711711711 -711-711-711-711-7115.5.5.5.5. Other CapitalOther CapitalOther CapitalOther CapitalOther Capital 748748748748748 32853285328532853285 -2537-2537-2537-2537-2537 26292629262926292629 28832883288328832883 -254-254-254-254-254 38153815381538153815 24632463246324632463 13521352135213521352 ----- 802802802802802 -802-802-802-802-802 45724572457245724572 22622262226222622262 23102310231023102310
C.C.C.C.C. Errors & OmissionsErrors & OmissionsErrors & OmissionsErrors & OmissionsErrors & Omissions 600600600600600 ----- 600600600600600 ----- 594594594594594 -594-594-594-594-594 167167167167167 ----- 167167167167167 39583958395839583958 28012801280128012801 11571157115711571157 656656656656656 ----- 656656656656656D.D.D.D.D. Overall Balance (A+B+C)Overall Balance (A+B+C)Overall Balance (A+B+C)Overall Balance (A+B+C)Overall Balance (A+B+C) 7475274752747527475274752 7597375973759737597375973 -1221-1221-1221-1221-1221 9172991729917299172991729 67936793679367936793 8493684936849368493684936 9838398383983839838398383 9387293872938729387293872 45114511451145114511 3281832818328183281832818 2425324253242532425324253 85658565856585658565 109041109041109041109041109041 102639102639102639102639102639 64026402640264026402E.E.E.E.E. Monetary MovementsMonetary MovementsMonetary MovementsMonetary MovementsMonetary Movements 29362936293629362936 17151715171517151715 12211221122112211221 ----- 67936793679367936793 -6793-6793-6793-6793-6793 ----- 45114511451145114511 -4511-4511-4511-4511-4511 ----- 305305305305305 -305-305-305-305-305 ----- 64026402640264026402 -6402-6402-6402-6402-6402
i) I.M.F. - -1715 -1715 - 975 -975 - 618 -618 - 260 -260ii) Foreign Exchange Reserves 2936 - 2936 - 5818 -5818 - 3893 -3893 1935 5479 -3544 - 6142 -6142
(Contd)
27B
alance of Paym
ents

Appendix 1(C): Balance of Payments : 1990-91 to 2002-03 Appendix 1(C): Balance of Payments : 1990-91 to 2002-03 Appendix 1(C): Balance of Payments : 1990-91 to 2002-03 Appendix 1(C): Balance of Payments : 1990-91 to 2002-03 Appendix 1(C): Balance of Payments : 1990-91 to 2002-03 (Concluded)(US Dollar Million)
2000-01 PR 2001-02 PR 2002-03Receipts Payments Net Receipts Payments Net Receipts Payments Net
A)A)A)A)A) CURRENT ACCOUNT (I+II)CURRENT ACCOUNT (I+II)CURRENT ACCOUNT (I+II)CURRENT ACCOUNT (I+II)CURRENT ACCOUNT (I+II) 7968079680796807968079680 8327083270832708327083270 -3590-3590-3590-3590-3590 8160581605816058160581605 8082380823808238082380823 782782782782782 9603796037960379603796037 9232992329923299232992329 37083708370837083708I)I)I)I)I) Merchandise (FoB/CIF)Merchandise (FoB/CIF)Merchandise (FoB/CIF)Merchandise (FoB/CIF)Merchandise (FoB/CIF) 4489444894448944489444894 5926459264592645926459264 -14370-14370-14370-14370-14370 4491544915449154491544915 5761857618576185761857618 -12703-12703-12703-12703-12703 5300053000530005300053000 6547465474654746547465474 -12474-12474-12474-12474-12474II)II)II)II)II) Invisibles (a+b+c)Invisibles (a+b+c)Invisibles (a+b+c)Invisibles (a+b+c)Invisibles (a+b+c) 3478634786347863478634786 2400624006240062400624006 1078010780107801078010780 3669036690366903669036690 2320523205232052320523205 1348513485134851348513485 4303743037430374303743037 2685526855268552685526855 1618216182161821618216182
B)B)B)B)B) Total Capital AccountTotal Capital AccountTotal Capital AccountTotal Capital AccountTotal Capital Account 5554255542555425554255542 4552445524455244552445524 1001810018100181001810018 4710847108471084710847108 3653536535365353653536535 1057310573105731057310573 4988849888498884988849888 3725037250372503725037250 12638126381263812638126381.1.1.1.1. Foreign Investment (I+II)Foreign Investment (I+II)Foreign Investment (I+II)Foreign Investment (I+II)Foreign Investment (I+II) 1598115981159811598115981 1011910119101191011910119 58625862586258625862 1445014450144501445014450 77587758775877587758 66926692669266926692 1232512325123251232512325 77707770777077707770 45554555455545554555
In India (Ii +IIi ) 1591115911159111591115911 91229122912291229122 67896789678967896789 1435114351143511435114351 62006200620062006200 81518151815181518151 1225212252122521225212252 66136613661366136613 56395639563956395639Abroad (Iii + IIii) 7070707070 170170170170170 -100-100-100-100-100 9999999999 15581558155815581558 -1459-1459-1459-1459-1459 7373737373 11571157115711571157 -1084-1084-1084-1084-1084
I.I.I.I.I. DirectDirectDirectDirectDirect 41214121412141214121 849849849849849 32723272327232723272 62356235623562356235 14941494149414941494 47414741474147414741 47904790479047904790 11791179117911791179 36113611361136113611i) In India 4051 22 4029 6136 5 6131 4717 57 4660
Equity 2422 22 2400 4100 5 4095 2757 57 2700 Reinvested Earnings 1350 - 1350 1646 - 1646 1498 - 1498 Other Capital 279 - 279 390 - 390 462 - 462
ii) Abroad 70 827 -757 99 1489 -1390 73 1122 -1049Equity 70 414 -344 99 669 -570 73 497 -424Reinvested Earnings - 339 -339 - 699 -699 - 519 -519Other Capital - 74 -74 - 121 -121 - 106 -106
II.II.II.II.II. PortfolioPortfolioPortfolioPortfolioPortfolio 1186011860118601186011860 92709270927092709270 25902590259025902590 82158215821582158215 62646264626462646264 19511951195119511951 75357535753575357535 65916591659165916591 944944944944944i) In India 11860 9100 2760 8215 6195 2020 7535 6556 979ii) Abroad - 170 -170 - 69 -69 - 35 -35
2.2.2.2.2. LoansLoansLoansLoansLoans 2279722797227972279722797 1854518545185451854518545 42524252425242524252 1151211512115121151211512 1286212862128621286212862 -1350-1350-1350-1350-1350 1369913699136991369913699 1687816878168781687816878 -3179-3179-3179-3179-3179a) External Assistance 2942 2532 410 3352 2235 1117 2773* 5233* -2460*
i) By India - 17 -17 - 87 -87 - 32 -32ii) To India 2942 2515 427 3352 2148 1204 2773 5201 -2428
b) Commercial Borrowings 9052 5315 3737 2696 4272 -1576 2737 4435 -1698i) By India 7 2 5 3 - 3 9 - 9ii) To India 9045 5313 3732 2693 4272 -1579 2728 4435 -1707
c) Short term To India 10803 10698 105 5464 6355 -891 8189 7210 9793.3.3.3.3. Banking CapitalBanking CapitalBanking CapitalBanking CapitalBanking Capital 1277212772127721277212772 1196111961119611196111961 811811811811811 1752617526175261752617526 1193411934119341193411934 55925592559255925592 1746217462174621746217462 92199219921992199219 82438243824382438243
a) Commercial Banks 12452 11567 885 17041 11656 5385 16926 8973 7953i) Assets 3009 4477 -1468 5051 2789 2262 6853 1990ii) Liabilities 9443 7090 2353 11990 8867 3123 10073 6983
of which:::::Non-Resident Deposits 8989 6672 2317 11435 8681 2754 9580 6772 2808b) Others 320 394 -74 485 278 207 536 246 290
4.4.4.4.4. Rupee Debt ServiceRupee Debt ServiceRupee Debt ServiceRupee Debt ServiceRupee Debt Service ----- 617617617617617 -617-617-617-617-617 ----- 519519519519519 -519-519-519-519-519 ----- 474474474474474 -474-474-474-474-4745.5.5.5.5. Other CapitalOther CapitalOther CapitalOther CapitalOther Capital 39923992399239923992 42824282428242824282 -290-290-290-290-290 36203620362036203620 34623462346234623462 158158158158158 64026402640264026402 29092909290929092909 34933493349334933493
C.C.C.C.C. Errors & OmissionsErrors & OmissionsErrors & OmissionsErrors & OmissionsErrors & Omissions ----- 572572572572572 -572-572-572-572-572 402402402402402 ----- 402402402402402 634634634634634 ----- 634634634634634D.D.D.D.D. Overall Balance (A+B+C)Overall Balance (A+B+C)Overall Balance (A+B+C)Overall Balance (A+B+C)Overall Balance (A+B+C) 135222135222135222135222135222 129366129366129366129366129366 58565856585658565856 129115129115129115129115129115 117358117358117358117358117358 1175711757117571175711757 146559146559146559146559146559 129579129579129579129579129579 1698016980169801698016980E.E.E.E.E. Monetary MovementsMonetary MovementsMonetary MovementsMonetary MovementsMonetary Movements ----- 58565856585658565856 -5856-5856-5856-5856-5856 ----- 1175711757117571175711757 -11757-11757-11757-11757-11757 ----- 1698016980169801698016980 -16980-16980-16980-16980-16980
i) I.M.F. - 26 -26 - - - - - -ii) Foreign Exchange Reserves - 5830 -5830 - 11757 -11757 - 16980 -16980
* Includes repayment of US dollar 3035 million of government loans effected in Jan-Mar 2003@ Data for 2002-03 are estimated as average of the previous two years.Notes: Data on Foreign Direct Investment (FDI) have been revised since 2000-01 with expanded coverage to approach international best practices. These data, therefore, are not comparable
with FDI data for previous years.Sources: Reserve Bank of India Bulletin, July 2003 and various previous issues
Balance of P
ayments
28

29B
alance of Paym
ents
Appendix 2: Break-up of Invisibles on Current AccountAppendix 2: Break-up of Invisibles on Current AccountAppendix 2: Break-up of Invisibles on Current AccountAppendix 2: Break-up of Invisibles on Current AccountAppendix 2: Break-up of Invisibles on Current Account
1950-51 1951-52 1952-53 1953-54 1954-55 1955-56 1956-57 1957-58 1958-59
Rs.Cr US $ Mn Rs.Cr US $ Mn Rs.Cr US $ Mn Rs.Cr US $ Mn Rs.Cr US $ Mn Rs.Cr US $ Mn Rs.Cr US $ Mn Rs.Cr US $ Mn Rs.Cr US $ Mn
(1) (2) (3) (4) (5) (6) (7) (8) (9) (10) (11) (12) (13) (14) (15) (16) (17) (18) (19)
(1)(1)(1)(1)(1) Foreign Travel (Net)Foreign Travel (Net)Foreign Travel (Net)Foreign Travel (Net)Foreign Travel (Net) -12-12-12-12-12 -25-25-25-25-25 -13-13-13-13-13 -27-27-27-27-27 -1-1-1-1-1 -2-2-2-2-2 -6-6-6-6-6 -12-12-12-12-12 -4-4-4-4-4 -8-8-8-8-8 00000 00000 33333 77777 66666 1212121212 44444 888881.1 Receipts 5 11 9 19 9 19 7 15 9 19 12 25 15 32 13 27 12 251.2 Payments 17 36 22 46 10 21 13 27 13 27 12 25 12 25 7 15 8 17
(2)(2)(2)(2)(2) Transportation (Net)Transportation (Net)Transportation (Net)Transportation (Net)Transportation (Net) 2222222222 4646464646 2727272727 5757575757 1313131313 2727272727 2121212121 4444444444 2525252525 5353535353 2323232323 4848484848 3030303030 6363636363 2828282828 5959595959 2727272727 57575757572.1 Receipts 30 63 41 86 34 71 33 69 36 76 38 80 46 97 47 99 45 952.2 Payments 8 17 14 29 21 44 12 25 11 23 15 32 16 34 19 40 18 38
(3)(3)(3)(3)(3) Insurance (Net)Insurance (Net)Insurance (Net)Insurance (Net)Insurance (Net) 55555 1111111111 77777 1515151515 66666 1313131313 44444 99999 44444 99999 55555 1010101010 33333 66666 33333 66666 55555 10101010103.1 Receipts 8 17 10 21 10 21 8 17 8 17 10 21 10 21 9 19 10 213.2 Payments 3 6 3 6 4 8 4 8 4 8 5 11 7 15 6 13 5 11
(4)(4)(4)(4)(4) Income (Net)Income (Net)Income (Net)Income (Net)Income (Net)1. Investment income (net) -24 -50 -18 -38 -8 -17 -3 -6 -5 -10 0 0 9 19 -6 -13 -20 -42
4.1a Receipts 7 15 11 23 19 40 21 44 25 53 30 63 33 69 23 48 16 344.1b Payments 31 65 29 61 27 57 24 50 30 63 30 63 24 50 29 61 36 76
Of which: Interest and service payments on Foreign loans and credit - - - - - - - - - - - - - - - - - -
2. Compensation to employees (net) - - - - - - - - - - - - - - - - - -4.2a Receipts - - - - - - - - - - - - - - - - - -4.2b Payments - - - - - - - - - - - - - - - - - -
(5)(5)(5)(5)(5) Government (NEI)Government (NEI)Government (NEI)Government (NEI)Government (NEI) 44444 88888 77777 1515151515 88888 1717171717 99999 1919191919 1010101010 2121212121 1010101010 2121212121 1111111111 2323232323 1111111111 2424242424 2424242424 50505050505.1 Receipts 19 40 25 53 27 57 25 53 27 57 23 48 24 50 25 53 39 825.2 Payments 15 32 18 38 19 40 16 34 17 36 13 27 13 27 13 29 15 32
(6)(6)(6)(6)(6) Miscellaneous (Net)Miscellaneous (Net)Miscellaneous (Net)Miscellaneous (Net)Miscellaneous (Net) 1111111111 2323232323 1414141414 2929292929 1818181818 3737373737 1616161616 3333333333 1313131313 2727272727 1313131313 2727272727 1313131313 2828282828 1313131313 2525252525 88888 17171717176.1 Receipts 27 57 31 65 33 69 31 65 28 59 34 71 37 78 37 53 37 786.2 Payments 16 34 17 36 15 32 15 32 15 32 21 44 24 50 24 28 29 61
Of which: software - - - - - - - - - - - - - - - - - - services (net)
6.1a Receipts - - - - - - - - - - - - - - - - - -6.1b Payments - - - - - - - - - - - - - - - - - -
(7)(7)(7)(7)(7) Transfer PayementsTransfer PayementsTransfer PayementsTransfer PayementsTransfer Payements 3737373737 7878787878 4747474747 9999999999 5757575757 119119119119119 6060606060 126126126126126 5656565656 117117117117117 8989898989 187187187187187 8585858585 234234234234234 6262626262 163163163163163 7777777777 1621621621621621. Private (Net) 35 74 42 88 46 96 41 86 34 71 37 78 48 100 45 94 41 86
7.1a Receipts 41 86 48 101 52 109 48 101 51 107 58 122 64 134 62 130 58 1227.1b Payments 6 13 6 13 6 13 7 15 17 36 21 44 16 34 17 36 17 36
2. Official (Net) 2 4 5 11 11 23 19 40 22 46 52 109 37 78 33 69 36 76Receipts 2 4 5 110 11 23 19 40 22 46 52 109 37 78 33 69 36 76Payments 0 0 0 0 0 0 0 0 0 0 0 0 0 0 0 0 0 0
(8)(8)(8)(8)(8) Total (Net)Total (Net)Total (Net)Total (Net)Total (Net) 4343434343 9090909090 7171717171 150150150150150 9393939393 194194194194194 101101101101101 213213213213213 9999999999 209209209209209 154154154154154 293293293293293 154154154154154 324324324324324 132132132132132 276276276276276 125125125125125 2622622622622628.1 Receipts 140 294 180 379 195 409 192 404 206 434 206 539 266 559 249 523 253 5338.2 Payments 97 204 109 229 102 215 91 191 107 225 112 235 112 235 117 247 128 271
(Contd)

Balance of P
ayments
30
Appendix 2: Break-up of Invisibles on Current AccountAppendix 2: Break-up of Invisibles on Current AccountAppendix 2: Break-up of Invisibles on Current AccountAppendix 2: Break-up of Invisibles on Current AccountAppendix 2: Break-up of Invisibles on Current Account
1959-60 1960-61 1961-62 1962-63 1963-64 1964-65 1965-66 1966-67 1967-68
Rs.Cr US $ Mn Rs.Cr US $ Mn Rs.Cr US $ Mn Rs.Cr US $ Mn Rs.Cr US $ Mn Rs.Cr US $ Mn Rs.Cr US $ Mn Rs.Cr US $ Mn Rs.Cr US $ Mn
(1) (20) (21) (22) (23) (24) (25) (26) (27) (28) (29) (30) (31) (32) (33) (34) (35) (36) (37)
(1)(1)(1)(1)(1) Foreign Travel (Net)Foreign Travel (Net)Foreign Travel (Net)Foreign Travel (Net)Foreign Travel (Net) 44444 88888 33333 66666 44444 99999 44444 99999 66666 1313131313 88888 1717171717 44444 99999 33333 55555 1111111111 15151515151.1 Receipts 14 29 15 32 15 32 16 34 17 36 18 38 15 32 18 29 26 351.2 Payments 10 21 12 25 11 23 12 25 11 23 10 21 11 23 15 24 15 20
(2)(2)(2)(2)(2) Transportation (Net)Transportation (Net)Transportation (Net)Transportation (Net)Transportation (Net) 2323232323 4949494949 2020202020 4242424242 2121212121 4444444444 2121212121 4444444444 2828282828 5959595959 2525252525 5353535353 2626262626 5454545454 3535353535 5757575757 3434343434 45454545452.1 Receipts 45 95 45 95 48 101 49 103 57 120 57 120 54 113 81 132 94 1252.2 Payments 22 46 25 53 27 57 28 59 29 61 32 67 28 59 46 75 60 80
(3)(3)(3)(3)(3) Insurance (Net)Insurance (Net)Insurance (Net)Insurance (Net)Insurance (Net) 33333 66666 22222 44444 11111 22222 33333 66666 22222 44444 22222 44444 66666 1212121212 77777 1212121212 66666 888883.1 Receipts 8 17 8 17 7 15 8 17 8 17 7 15 12 25 12 20 13 173.2 Payments 5 11 6 13 6 13 5 11 6 13 5 11 6 13 5 8 7 9
(4)(4)(4)(4)(4) Income (Net)Income (Net)Income (Net)Income (Net)Income (Net)1. Investment income (net) -33 -70 -48 -101 -68 -113 -83 -174 -92 -193 -108.3 -229 -124.2 -261 -193 -315 -233 -281
4.1a Receipts 14 29 14 29 12 25 11 23 11 23 11 23 11 23 18 29 25 274.1b Payments 47 99 62 130 80 138 94 197 103 216 120 252 135 284 211 344 258 308
Of which: Interest and service payments on Foreign loans and credit - - (34) (71) (46) (96) (58) (122) (67) (77) (76) (150) (91) (170) (148) (211) (168) (224)
2. Compensation to employees (net) - - - - - - - - - - - - - - - - - -4.2a Receipts - - - - - - - - - - - - - - - - - -4.2b Payments - - - - - - - - - - - - - - - - - -
(5)(5)(5)(5)(5) Government (NEI)Government (NEI)Government (NEI)Government (NEI)Government (NEI) 3737373737 7878787878 3030303030 6363636363 66666 1313131313 2525252525 5252525252 4646464646 9797979797 8181818181 170170170170170 3030303030 6363636363 5959595959 9696969696 5656565656 75757575755.1 Receipts 49 103 51 107 30 63 50 105 70 147 96 202 46 97 852 134 81 1085.2 Payments 12 25 21 44 24 50 25 53 24 50 15 32 16 34 23 38 25 33
(6)(6)(6)(6)(6) Miscellaneous (Net)Miscellaneous (Net)Miscellaneous (Net)Miscellaneous (Net)Miscellaneous (Net) 11111 22222 22222 44444 -3-3-3-3-3 -6-6-6-6-6 -11-11-11-11-11 -23-23-23-23-23 -14-14-14-14-14 -30-30-30-30-30 -23-23-23-23-23 -49-49-49-49-49 -24-24-24-24-24 -48-48-48-48-48 -12-12-12-12-12 -19-19-19-19-19 -24-24-24-24-24 -32-32-32-32-326.1 Receipts 30 63 37 78 36 72 33 69 33 69 23 48 26 55 50 82 43 576.2 Payments 29 61 35 74 39 82 44 92 47 99 46 97 49 103 62 101 67 89
Of which: software - - - - - - - - - - - - - - - - - - services (net)
6.1a Receipts - - - - - - - - - - - - - - - - - -6.1b Payments - - - - - - - - - - - - - - - - - -
(7)(7)(7)(7)(7) Transfer PayementsTransfer PayementsTransfer PayementsTransfer PayementsTransfer Payements 7878787878 164164164164164 2828282828 154154154154154 7171717171 149149149149149 103103103103103 217217217217217 117117117117117 246246246246246 167167167167167 350350350350350 155155155155155 323323323323323 161161161161161 102102102102102 123123123123123 1641641641641641. Private (Net) 40 84 28 59 25 52 26 55 34 72 25 52 63 130 53 86 53 71
7.1a Receipts 56 118 45 95 41 86 40 84 47 99 42 88 78 164 73 119 72 967.1b Payments 16 34 17 36 16 34 14 29 13 27 17 36 16 34 20 33 19 25
2. Official (Net) 38 80 0 95 46 97 77 162 83 174 142 298 92 193 108 16 70 93Receipts 38 80 0 95 46 97 77 162 83 174 152 319 104 218 125 204 88 117Payments 0 0 0 0 0 0 0 0 0 0 10 21 12 25 17 28 18 24
(8)(8)(8)(8)(8) Total (Net)Total (Net)Total (Net)Total (Net)Total (Net) 113113113113113 237237237237237 8383838383 174174174174174 3232323232 6868686868 6262626262 131131131131131 9393939393 196196196196196 151151151151151 316316316316316 7373737373 152152152152152 6060606060 9898989898 -5-5-5-5-5 -6-6-6-6-68.1 Receipts 254 534 260 546 235 495 284 597 326 685 406 853 316 727 459 749 437 5828.2 Payments 141 297 177 372 203 427 222 466 233 489 255 537 273 575 399 651 442 588
(Contd)

31B
alance of Paym
ents
Appendix 2: Break-up of Invisibles on Current AccountAppendix 2: Break-up of Invisibles on Current AccountAppendix 2: Break-up of Invisibles on Current AccountAppendix 2: Break-up of Invisibles on Current AccountAppendix 2: Break-up of Invisibles on Current Account
1968-69 1969-70 1970-71 1971-72 1972-73 1973-74 1974-75 1975-76 1976-77
Rs.Cr US $ Mn Rs.Cr US $ Mn Rs.Cr US $ Mn Rs.Cr US $ Mn Rs.Cr US $ Mn Rs.Cr US $ Mn Rs.Cr US $ Mn Rs.Cr US $ Mn Rs.Cr US $ Mn
(1) (38) (39) (40) (41) (42) (43) (44) (45) (46) (47) (48) (49) (50) (51) (52) (53) (54) (55)
(1)(1)(1)(1)(1) Foreign Travel (Net)Foreign Travel (Net)Foreign Travel (Net)Foreign Travel (Net)Foreign Travel (Net) 1313131313 1717171717 2222222222 2929292929 1919191919 2525252525 1313131313 1818181818 2020202020 2525252525 4848484848 6161616161 8888888888 110110110110110 187187187187187 216216216216216 237237237237237 2652652652652651.1 Receipts 27 36 37 49 37 49 33 44 39 50 65 83 103 129 209 241 276 3081.2 Payments 14 19 15 20 18 24 19 26 19 25 17 22 15 19 22 25 38 43
(2)(2)(2)(2)(2) Transportation (Net)Transportation (Net)Transportation (Net)Transportation (Net)Transportation (Net) 3434343434 4545454545 3030303030 4040404040 3030303030 4040404040 4343434343 5757575757 5050505050 6464646464 4444444444 5656565656 8585858585 107107107107107 6161616161 7070707070 4747474747 53535353532.1 Receipts 99 132 102 136 109 145 111 149 121 156 145 185 218 273 256 296 295 3302.2 Payments 65 87 72 96 79 105 68 92 71 92 102 129 133 166 196 226 248 277
(3)(3)(3)(3)(3) Insurance (Net)Insurance (Net)Insurance (Net)Insurance (Net)Insurance (Net) 44444 55555 00000 00000 00000 00000 -6-6-6-6-6 -8-8-8-8-8 44444 55555 77777 99999 1212121212 1616161616 1111111111 1313131313 22222 222223.1 Receipts 13 12 13 17 12 16 14 18 16 21 21 26 26 33 36 41 32 353.2 Payments 9 17 13 17 12 16 19 26 12 16 14 17 14 17 24 28 30 33
(4)(4)(4)(4)(4) Income (Net)Income (Net)Income (Net)Income (Net)Income (Net)1. Investment income (net) -233 -311 -246 -328 -254 -339 -269 -361 -298 -386 -318 -405 -248 -312 -224 -258 -189 -211
4.1a Receipts 25 33 34 45 49 65 37 49 31 40 44 56 98 122 119 138 176 1974.1b Payments 258 344 280 373 303 404 306 410 329 426 362 461 346 434 343 396 365 408
Of which: Interest and service payments on Foreign loans and credit (184) (245) (190) (253) (204) (271) (199) (267) (218) (291) (241) (308) (217) (274) (199) (229) (216.6) (241.6)
2. Compensation to employees (net) - - - - - - - - - - - - - - - - - -4.2a Receipts - - - - - - - - - - - - - - - - - -4.2b Payments - - - - - - - - - - - - - - - - - -
(5)(5)(5)(5)(5) Government (NEI)Government (NEI)Government (NEI)Government (NEI)Government (NEI) 99999 2929292929 33333 44444 7 9 5 7 8 11 11 14 45 56 72 8383838383 755755755755755 37373737375.1 Receipts 22 57 27 36 30 40 29 39 31 40 33 42 75 94 104 121 762 935.2 Payments 43 29 24 32 2323232323 3131313131 2424242424 3232323232 2323232323 1919191919 2222222222 2828282828 3030303030 3838383838 3333333333 38 7 56
(6)(6)(6)(6)(6) Miscellaneous (Net)Miscellaneous (Net)Miscellaneous (Net)Miscellaneous (Net)Miscellaneous (Net) -8-8-8-8-8 -10-10-10-10-10 -23-23-23-23-23 -30-30-30-30-30 -47 -63 -31 -42 -35 -45 -42 -53 -17 -21 -20 -23-23-23-23-23 -65-65-65-65-65 -73-73-73-73-736.1 Receipts 59 79 44 59 31 41 48 64 47 61 49 62 83 104 151 175 187 2096.2 Payments 67 89 67 89 78 14 79 106 82 106 91 115 100 125 171 198 252 282
Of which: software - - - - - - - - - - - - - - - - - - services (net)
6.1a Receipts - - - - - - - - - - - - - - - - - -6.1b Payments - - - - - - - - - - - - - - - - - -
(7)(7)(7)(7)(7) Transfer PayementsTransfer PayementsTransfer PayementsTransfer PayementsTransfer Payements 183183183183183 245245245245245 152152152152152 202202202202202 210 280 220 296 107 139 1896 2411 367 460 919 10611061106110611061 11381138113811381138 127412741274127412741. Private (Net) 76 102 84 112 88 117 104 140 99 128 146 186 229 287 441 509 755 845
7.1a Receipts 92 123 98 131 101 135 116 156 111 143 158 201 235 295 454 524 762 8537.1b Payments 16 21 14 19 13 17 12 16 11 15 12 15 6 8 13 15 7 8
2. Official (Net) 107 143 68 90 122 163 116 156 8 11 1750 2225 138 173 478 552 383 429Receipts 123 164 85 113 128 171 158 212 118 153 1767 2247 148 186 486 561 394 441Payments 16 21 17 23 66666 88888 4242424242 5656565656 110110110110110 142142142142142 1717171717 2222222222 1010101010 1313131313 88888 9 11 12
(8)(8)(8)(8)(8) Total (Net)Total (Net)Total (Net)Total (Net)Total (Net) 1515151515 2020202020 -62-62-62-62-62 -83-83-83-83-83 -37 -49 -24 -33 -144 -187 1646 2093 331 416 1005 11621162116211621162 12041204120412041204 134713471347134713478.1 Receipts 481 641 440 586 496 661 546 731 514 664 2281 2902 985 1236 1815 2097 2204 24668.2 Payments 466 621 502 669 533 711 570 764 658 851 636 809 654 820 810 935 1000 1119
(Contd)

Balance of P
ayments
32
Appendix 2: Break-up of Invisibles on Current AccountAppendix 2: Break-up of Invisibles on Current AccountAppendix 2: Break-up of Invisibles on Current AccountAppendix 2: Break-up of Invisibles on Current AccountAppendix 2: Break-up of Invisibles on Current Account
1977-78 1978-79 1979-80 1980-81 1981-82 1982-83 1983-84 1984-85 1985-86
Rs.Cr US $ Mn Rs.Cr US $ Mn Rs.Cr US $ Mn Rs.Cr US $ Mn Rs.Cr US $ Mn Rs.Cr US $ Mn Rs.Cr US $ Mn Rs.Cr US $ Mn Rs.Cr US $ Mn
(1) (56) (57) (58) (59) (60) (61) (62) (63) (64) (65) (66) (67) (68) (69) (70) (71) (72) (73)
(1)(1)(1)(1)(1) Foreign Travel (Net)Foreign Travel (Net)Foreign Travel (Net)Foreign Travel (Net)Foreign Travel (Net) 329329329329329 384384384384384 359359359359359 437437437437437 497497497497497 615615615615615 874874874874874 11071107110711071107 920920920920920 10261026102610261026 946946946946946 979979979979979 834834834834834 807807807807807 489489489489489 411411411411411 778778778778778 6366366366366361.1 Receipts 373 436 423 516 585 724 964 1221 1064 1186 1131 1170 1075 1040 898 755 1189 9721.2 Payments 44 52 65 79 88 109 90 114 144 161 185 191 242 234 409 344 412 336
(2)(2)(2)(2)(2) Transportation (Net)Transportation (Net)Transportation (Net)Transportation (Net)Transportation (Net) 6565656565 7676767676 4545454545 5555555555 6969696969 8585858585 66666 88888 -85-85-85-85-85 -95-95-95-95-95 -291-291-291-291-291 -301-301-301-301-301 -276-276-276-276-276 267267267267267 -274-274-274-274-274 -230-230-230-230-230 212212212212212 -173-173-173-173-1732.1 Receipts 281 328 280 342 321 398 361 457 398 444 407 421 440 426 644 542 604 4942.2 Payments 216 252 235 287 253 313 355 449 483 539 699 723 715 691 918 772 816 667
(3)(3)(3)(3)(3) Insurance (Net)Insurance (Net)Insurance (Net)Insurance (Net)Insurance (Net) 44444 55555 -1-1-1-1-1 -1-1-1-1-1 1818181818 2222222222 1717171717 2222222222 1515151515 1717171717 -11-11-11-11-11 -11-11-11-11-11 3939393939 3838383838 55555 44444 -5-5-5-5-5 -4-4-4-4-43.1 Receipts 35 41 36 44 46 57 51 65 55 61 58 60 114 110 89 75 79 643.2 Payments 31 36 37 45 28 35 34 43 40 45 69 71 75 72 84 71 83 68
(4)(4)(4)(4)(4) Income (Net)Income (Net)Income (Net)Income (Net)Income (Net)1. Investment income (net)
4.1a Receipts -212 -247 -127 -155 89 110 257 325 191 213 -323 -334 -543 -525 -996 -838 -950 -7764.1b Payments 222 259 331 404 549 680 724 917 666 743 465 481 463 448 586 493 669 547
Of which: Interest and 434 506 458 559 460 570 467 592 475 530 788 815 1006 973 1582 1331 1619 1323 service payments on Foreign loans and credit (267) (311) (268) (326) (280) (346) (290) (355) (1121) (1533) (1200) (1949) (1503) (2560) (1313) (3536) (1372) (1121)
2. Compensation to employees (net) - - - - - - - - - - - - - - - - - -4.2a Receipts - - - - - - - - - - - - - - - - - -4.2b Payments - - - - - - - - - - - - - - - - - -
(5)(5)(5)(5)(5) Government (NEI)Government (NEI)Government (NEI)Government (NEI)Government (NEI) 3333333333 3939393939 2323232323 2727272727 -1-1-1-1-1 -2-2-2-2-2 4141414141 5151515151 7272727272 8080808080 4343434343 4444444444 2020202020 1919191919 2121212121 1818181818 -7-7-7-7-7 -6-6-6-6-65.1 Receipts 78 91 90 110 86 107 88 111 131 146 107 111 139 134 105 88 116 955.2 Payments 44 52 68 83 88 109 47 60 59 66 64 66 118 114 84 71 124 101
(6)(6)(6)(6)(6) Miscellaneous (Net)Miscellaneous (Net)Miscellaneous (Net)Miscellaneous (Net)Miscellaneous (Net) 1717171717 2020202020 5252525252 6363636363 -33-33-33-33-33 -41-41-41-41-41 8888888888 111111111111111 2929292929 3232323232 279279279279279 289289289289289 505505505505505 488488488488488 10641064106410641064 895895895895895 899899899899899 7357357357357356.1 Receipts 275 322 377 460 529 655 751 951 818 912 1077 1114 1615 1561 2362 1987 2063 6866.2 Payments 258 302 326 397 562 696 663 840 789 880 798 826 1110 1074 1298 1092 1164 951
Of which: software - - - - - - - - - - - - - - - - - - services (net)
6.1a Receipts - - - - - - - - - - - - - - - - - -6.1b Payments - - - - - - - - - - - - - - - - - -
(7)(7)(7)(7)(7) Transfer PayementsTransfer PayementsTransfer PayementsTransfer PayementsTransfer Payements 14841484148414841484 17341734173417341734 16251625162516251625 19801980198019801980 22492249224922492249 27842784278427842784 27172717271727172717 34423442344234423442 25142514251425142514 28052805280528052805 27962796279627962796 28922892289228922892 30303030303030303030 29312931293129312931 35413541354135413541 29792979297929792979 31283128312831283128 255725572557255725571. Private (Net) 1102 1287 1093 1332 1754 2172 2125 2692 2066 2305 2417 2500 2638 2552 2967 2496 2701 2208
7.1a Receipts 1108 1295 1110 1352 1762 2182 2137 2707 2083 2324 2431 2515 2638 2561 2982 2509 2716 22207.1b Payments 7 8 17 20 8 10 12 15 17 19 14 15 10 9 15 13 15 12
2. Official (Net) 382 447 532 648 495 612 592 750 448 500 379 392 392 379 574 483 427 349Receipts 394 461 536 354 507 628 596 755 451 503 386 399 399 386 578 486 440 359Payments 12 14 5 6 13 16 4 5 3 3 7 7 7 7 4 3 13 10
(8)(8)(8)(8)(8) Total (Net)Total (Net)Total (Net)Total (Net)Total (Net) 17221722172217221722 20112011201120112011 19741974197419741974 24062406240624062406 28872887288728872887 35733573357335733573 39973997399739973997 50635063506350635063 36553655365536553655 40784078407840784078 34393439343934393439 35583558355835583558 36093609360936093609 34893489348934893489 38493849384938493849 32373237323732373237 36303630363036303630 296729672967296729678.1 Receipts 2767 3233 3184 3882 4386 5431 5667 7181 5664 7231 6062 6271 6893 6666 8243 6933 7830 64378.2 Payments 1046 1222 1211 1476 1500 1858 1672 2118 2008 2239 2622 2713 3284 3176 4394 3696 4245 3470
(Contd)

33B
alance of Paym
ents
Appendix 2: Break-up of Invisibles on Current AccountAppendix 2: Break-up of Invisibles on Current AccountAppendix 2: Break-up of Invisibles on Current AccountAppendix 2: Break-up of Invisibles on Current AccountAppendix 2: Break-up of Invisibles on Current Account
1986-87 1987-88 1988-89 1989-90 1990-91 1991-92 1992-93 1993-94 1994-95
Rs.Cr US $ Mn Rs.Cr US $ Mn Rs.Cr US $ Mn Rs.Cr US $ Mn Rs.Cr US $ Mn Rs.Cr US $ Mn Rs.Cr US $ Mn Rs.Cr US $ Mn Rs.Cr US $ Mn
(1) (74) (75) (76) (77) (78) (79) (80) (81) (82) (83) (84) (85) (86) (87) (88) (89) (90) (91)
(1)(1)(1)(1)(1) Foreign Travel (Net)Foreign Travel (Net)Foreign Travel (Net)Foreign Travel (Net)Foreign Travel (Net) 12361236123612361236 967967967967967 13681368136813681368 10551055105510551055 14671467146714671467 10131013101310131013 17161716171617161716 10311031103110311031 19101910191019101910 10641064106410641064 37803780378037803780 15121512151215121512 48844884488448844884 17131713171317131713 54125412541254125412 17251725172517251725 48544854485448544854 154715471547154715471.1 Receipts 1606 1257 1856 1432 2054 1418 2386 1433 2613 1456 4892 1977 6061 2098 6971 2222 7424 23651.2 Payments 371 290 488 376 586 405 670 403 703 392 1112 465 1177 385 1559 497 2570 818
(2)(2)(2)(2)(2) Transportation (Net)Transportation (Net)Transportation (Net)Transportation (Net)Transportation (Net) -60-60-60-60-60 -47-47-47-47-47 -246-246-246-246-246 -190-190-190-190-190 -187-187-187-187-187 -129-129-129-129-129 -346-346-346-346-346 -208-208-208-208-208 -196-196-196-196-196 -110-110-110-110-110 -882-882-882-882-882 -350-350-350-350-350 -1697-1697-1697-1697-1697 -503-503-503-503-503 -1043-1043-1043-1043-1043 -332-332-332-332-332 -524-524-524-524-524 -167-167-167-167-1672.1 Receipts 688 538 882 680 1300 898 1511 907 1765 983 2308 939 2851 982 4494 1433 5328 16962.2 Payments 748 585 1128 870 1487 1027 1857 1115 1961 1093 3190 1289 4548 1485 5537 1765 5852 1863
(3)(3)(3)(3)(3) Insurance (Net)Insurance (Net)Insurance (Net)Insurance (Net)Insurance (Net) -19-19-19-19-19 -15-15-15-15-15 -1-1-1-1-1 -1-1-1-1-1 4141414141 2828282828 5858585858 3535353535 4040404040 2323232323 -42-42-42-42-42 -18-18-18-18-18 1010101010 1212121212 -1223-1223-1223-1223-1223 -71-71-71-71-71 -91-91-91-91-91 -29-29-29-29-293.1 Receipts 83 65 106 81 136 94 198 119 199 111 265 108 460 158 388 124 476 1523.2 Payments 102 80 107 82 95 66 140 84 159 88 307 126 450 146 611 195 567 181
(4)(4)(4)(4)(4) Income (Net)Income (Net)Income (Net)Income (Net)Income (Net) -6733-6733-6733-6733-6733 -3752-3752-3752-3752-3752 -9396-9396-9396-9396-9396 -3830-3830-3830-3830-3830 -10503-10503-10503-10503-10503 -3423-3423-3423-3423-3423 -10258-10258-10258-10258-10258 -3270-3270-3270-3270-3270 -10773-10773-10773-10773-10773 -3431-3431-3431-3431-34311. Investment income (net) -6733 -3752 -9396 -3830 -10503 -3423 -10258 -3270 -10773 -3431
4.1a Receipts -1249 -978 -1733 -1337 -2478 -1711 -3316 -1990 660 368 542 221 1004 376 1238 395 2782 8864.1b Payments 641 501 579 446 603 416 688 413 7393 4120 9938 4051 11507 3799 11496 3665 13555 4317
Of which: Interest and 1890 1479 2312 1783 3081 2127 4004 2403 service payments on Foreign loans and credit (1533.3) (1200) (1949) (1503) (2560) (1768) (3536) (2124) (4958) (2763) (6346) (2590) (2201) (10865) (2912) (12851) (3045) (13811)
2. Compensation to employees (net) - - - - - - - - - - - - - - - - - -4.2a Receipts - - - - - - - - - - - - - - - - - -4.2b Payments - - - - - - - - - - - - - - - - - -
(5)(5)(5)(5)(5) Government (NEI)Government (NEI)Government (NEI)Government (NEI)Government (NEI) -3-3-3-3-3 -2-2-2-2-2 -61-61-61-61-61 -47-47-47-47-47 -94-94-94-94-94 -65-65-65-65-65 -159-159-159-159-159 -96-96-96-96-96 -283-283-283-283-283 -158-158-158-158-158 -250-250-250-250-250 -102-102-102-102-102 -86-86-86-86-86 -25-25-25-25-25 -387-387-387-387-387 -123-123-123-123-123 -491-491-491-491-491 -155-155-155-155-1555.1 Receipts 133 104 121 93 118 82 52 31 27 15 42 17 220 75 94 30 28 105.2 Payments 136 106 182 40 212 147 211 127 310 173 292 119 306 100 481 153 519 165
(6)(6)(6)(6)(6) Miscellaneous (Net)Miscellaneous (Net)Miscellaneous (Net)Miscellaneous (Net)Miscellaneous (Net) 118118118118118 9292929292 -353-353-353-353-353 -272-272-272-272-272 -169-169-169-169-169 -117-117-117-117-117 -64-64-64-64-64 -38-38-38-38-38 290290290290290 161161161161161 527527527527527 165165165165165 -413-413-413-413-413 -68-68-68-68-68 -2082-2082-2082-2082-2082 -664-664-664-664-664 -1866-1866-1866-1866-1866 -594-594-594-594-5946.1 Receipts 1603 1254 1668 1286 2118 1462 2924 1756 3565 1986 4840 1981 4129 1417 4563 1455 6003 19126.2 Payments 1485 1162 2021 1558 2287 1579 2988 1796 3275 1825 4343 1816 4542 1485 6645 2119 7869 2506
Of which: software - - - - - - - - - - - - - - - - - - services (net)
6.1a Receipts - - - - - - - - - - - - - - - - - -6.1b Payments - - - - - - - - - - - - - - - - - -
(7)(7)(7)(7)(7) Transfer PayementsTransfer PayementsTransfer PayementsTransfer PayementsTransfer Payements 35013501350135013501 27402740274027402740 40304030403040304030 31093109310931093109 45664566456645664566 31533153315331533153 46954695469546954695 28202820282028202820 45394539453945394539 25302530253025302530 1052210522105221052210522 42434243424342434243 1228012280122801228012280 42154215421542154215 1767017670176701767017670 56335633563356335633 2672626726267262672626726 850985098509850985091.Private (Net) 2976 2329 3498 2698 3842 2653 3798 2281 3712 2069 9382 3783 11226 3852 16514 5265 25417 8093
7.1a Receipts 2991 2340 3533 2725 3865 2669 3824 2297 3737 2083 9419 3798 11261 3864 16582 5287 25474 81127.1b Payments 15 12 34 26 24 17 26 16 25 14 37 15 35 12 68 22 57 19
2. Official (Net) 525 411 532 411 724 500 897 539 827 461 1140 460 1054 363 1156 368 1309 416Receipts 530 415 536 413 733 502 902 542 830 462 1141 461 1056 364 1171 373 1323 421Payments 5 4 3 3 9 6 5 3 3 1 1 1 2 1 15 5 14 5
(8)(8)(8)(8)(8) Total (Net)Total (Net)Total (Net)Total (Net)Total (Net) 35243524352435243524 27582758275827582758 30043004300430043004 23172317231723172317 31463146314631463146 21722172217221722172 25832583258325832583 15501550155015501550 -433-433-433-433-433 -242-242-242-242-242 42594259425942594259 16201620162016201620 44754475447544754475 19121912191219121912 90899089908990899089 28982898289828982898 1783517835178351783517835 568056805680568056808.1 Receipts 8274 6475 9279 7156 10926 7545 12484 7498 13396 7464 23449 9502 27042 9334 35501 11319 48838 155548.2 Payments 4751 3718 6275 4840 7781 5373 9901 5940 13829 7706 19190 7882 22567 7413 26412 8421 31003 9874
(Contd)
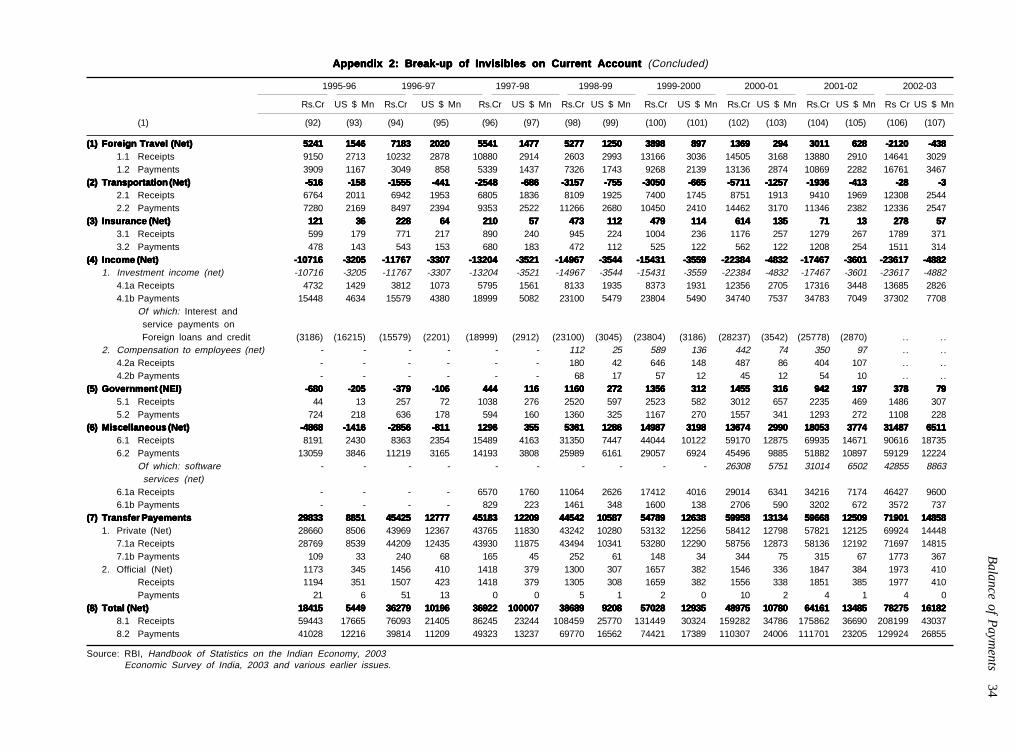
Appendix 2: Break-up of Invisibles on Current Account Appendix 2: Break-up of Invisibles on Current Account Appendix 2: Break-up of Invisibles on Current Account Appendix 2: Break-up of Invisibles on Current Account Appendix 2: Break-up of Invisibles on Current Account (Concluded)
1995-96 1996-97 1997-98 1998-99 1999-2000 2000-01 2001-02 2002-03
Rs.Cr US $ Mn Rs.Cr US $ Mn Rs.Cr US $ Mn Rs.Cr US $ Mn Rs.Cr US $ Mn Rs.Cr US $ Mn Rs.Cr US $ Mn Rs Cr US $ Mn
(1) (92) (93) (94) (95) (96) (97) (98) (99) (100) (101) (102) (103) (104) (105) (106) (107)
(1)(1)(1)(1)(1) Foreign Travel (Net)Foreign Travel (Net)Foreign Travel (Net)Foreign Travel (Net)Foreign Travel (Net) 52415241524152415241 15461546154615461546 71837183718371837183 20202020202020202020 55415541554155415541 14771477147714771477 52775277527752775277 12501250125012501250 38983898389838983898 897897897897897 13691369136913691369 294294294294294 30113011301130113011 628628628628628 -2120-2120-2120-2120-2120 -438-438-438-438-4381.1 Receipts 9150 2713 10232 2878 10880 2914 2603 2993 13166 3036 14505 3168 13880 2910 14641 30291.2 Payments 3909 1167 3049 858 5339 1437 7326 1743 9268 2139 13136 2874 10869 2282 16761 3467
(2)(2)(2)(2)(2) Transportation (Net)Transportation (Net)Transportation (Net)Transportation (Net)Transportation (Net) -516-516-516-516-516 -158-158-158-158-158 -1555-1555-1555-1555-1555 -441-441-441-441-441 -2548-2548-2548-2548-2548 -686-686-686-686-686 -3157-3157-3157-3157-3157 -755-755-755-755-755 -3050-3050-3050-3050-3050 -665-665-665-665-665 -5711-5711-5711-5711-5711 -1257-1257-1257-1257-1257 -1936-1936-1936-1936-1936 -413-413-413-413-413 -28-28-28-28-28 -3-3-3-3-32.1 Receipts 6764 2011 6942 1953 6805 1836 8109 1925 7400 1745 8751 1913 9410 1969 12308 25442.2 Payments 7280 2169 8497 2394 9353 2522 11266 2680 10450 2410 14462 3170 11346 2382 12336 2547
(3)(3)(3)(3)(3) Insurance (Net)Insurance (Net)Insurance (Net)Insurance (Net)Insurance (Net) 121121121121121 3636363636 228228228228228 6464646464 210210210210210 5757575757 473473473473473 112112112112112 479479479479479 114114114114114 614614614614614 135135135135135 7171717171 1313131313 278278278278278 57575757573.1 Receipts 599 179 771 217 890 240 945 224 1004 236 1176 257 1279 267 1789 3713.2 Payments 478 143 543 153 680 183 472 112 525 122 562 122 1208 254 1511 314
(4)(4)(4)(4)(4) Income (Net)Income (Net)Income (Net)Income (Net)Income (Net) -10716-10716-10716-10716-10716 -3205-3205-3205-3205-3205 -11767-11767-11767-11767-11767 -3307-3307-3307-3307-3307 -13204-13204-13204-13204-13204 -3521-3521-3521-3521-3521 -14967-14967-14967-14967-14967 -3544-3544-3544-3544-3544 -15431-15431-15431-15431-15431 -3559-3559-3559-3559-3559 -22384-22384-22384-22384-22384 -4832-4832-4832-4832-4832 -17467-17467-17467-17467-17467 -3601-3601-3601-3601-3601 -23617-23617-23617-23617-23617 -4882-4882-4882-4882-48821. Investment income (net) -10716 -3205 -11767 -3307 -13204 -3521 -14967 -3544 -15431 -3559 -22384 -4832 -17467 -3601 -23617 -4882
4.1a Receipts 4732 1429 3812 1073 5795 1561 8133 1935 8373 1931 12356 2705 17316 3448 13685 28264.1b Payments 15448 4634 15579 4380 18999 5082 23100 5479 23804 5490 34740 7537 34783 7049 37302 7708
Of which: Interest and service payments on Foreign loans and credit (3186) (16215) (15579) (2201) (18999) (2912) (23100) (3045) (23804) (3186) (28237) (3542) (25778) (2870) .. ..
2. Compensation to employees (net) - - - - - - 112 25 589 136 442 74 350 97 .. ..4.2a Receipts - - - - - - 180 42 646 148 487 86 404 107 .. ..4.2b Payments - - - - - - 68 17 57 12 45 12 54 10 .. ..
(5)(5)(5)(5)(5) Government (NEI)Government (NEI)Government (NEI)Government (NEI)Government (NEI) -680-680-680-680-680 -205-205-205-205-205 -379-379-379-379-379 -106-106-106-106-106 444444444444444 116116116116116 11601160116011601160 272272272272272 13561356135613561356 312312312312312 14551455145514551455 316316316316316 942942942942942 197197197197197 378378378378378 79797979795.1 Receipts 44 13 257 72 1038 276 2520 597 2523 582 3012 657 2235 469 1486 3075.2 Payments 724 218 636 178 594 160 1360 325 1167 270 1557 341 1293 272 1108 228
(6)(6)(6)(6)(6) Miscellaneous (Net)Miscellaneous (Net)Miscellaneous (Net)Miscellaneous (Net)Miscellaneous (Net) -4868-4868-4868-4868-4868 -1416-1416-1416-1416-1416 -2856-2856-2856-2856-2856 -811-811-811-811-811 12961296129612961296 355355355355355 53615361536153615361 12861286128612861286 1498714987149871498714987 31983198319831983198 1367413674136741367413674 29902990299029902990 1805318053180531805318053 37743774377437743774 3148731487314873148731487 651165116511651165116.1 Receipts 8191 2430 8363 2354 15489 4163 31350 7447 44044 10122 59170 12875 69935 14671 90616 187356.2 Payments 13059 3846 11219 3165 14193 3808 25989 6161 29057 6924 45496 9885 51882 10897 59129 12224
Of which: software - - - - - - - - - - 26308 5751 31014 6502 42855 8863 services (net)
6.1a Receipts - - - - 6570 1760 11064 2626 17412 4016 29014 6341 34216 7174 46427 96006.1b Payments - - - - 829 223 1461 348 1600 138 2706 590 3202 672 3572 737
(7)(7)(7)(7)(7) Transfer PayementsTransfer PayementsTransfer PayementsTransfer PayementsTransfer Payements 2983329833298332983329833 88518851885188518851 4542545425454254542545425 1277712777127771277712777 4518345183451834518345183 1220912209122091220912209 4454244542445424454244542 1058710587105871058710587 5478954789547895478954789 1263812638126381263812638 5995859958599585995859958 1313413134131341313413134 5966859668596685966859668 1250912509125091250912509 7190171901719017190171901 14858148581485814858148581. Private (Net) 28660 8506 43969 12367 43765 11830 43242 10280 53132 12256 58412 12798 57821 12125 69924 14448
7.1a Receipts 28769 8539 44209 12435 43930 11875 43494 10341 53280 12290 58756 12873 58136 12192 71697 148157.1b Payments 109 33 240 68 165 45 252 61 148 34 344 75 315 67 1773 367
2. Official (Net) 1173 345 1456 410 1418 379 1300 307 1657 382 1546 336 1847 384 1973 410Receipts 1194 351 1507 423 1418 379 1305 308 1659 382 1556 338 1851 385 1977 410Payments 21 6 51 13 0 0 5 1 2 0 10 2 4 1 4 0
(8)(8)(8)(8)(8) Total (Net)Total (Net)Total (Net)Total (Net)Total (Net) 1841518415184151841518415 54495449544954495449 3627936279362793627936279 1019610196101961019610196 3692236922369223692236922 100007100007100007100007100007 3868938689386893868938689 92089208920892089208 5702857028570285702857028 1293512935129351293512935 4897548975489754897548975 1078010780107801078010780 6416164161641616416164161 1348513485134851348513485 7827578275782757827578275 16182161821618216182161828.1 Receipts 59443 17665 76093 21405 86245 23244 108459 25770 131449 30324 159282 34786 175862 36690 208199 430378.2 Payments 41028 12216 39814 11209 49323 13237 69770 16562 74421 17389 110307 24006 111701 23205 129924 26855
Source: RBI, Handbook of Statistics on the Indian Economy, 2003Economic Survey of India, 2003 and various earlier issues.
Balance of P
ayments
34

35B
alance of Paym
ents
Appendix 2(A): Travel Account : 1990-91 to 2001-02Appendix 2(A): Travel Account : 1990-91 to 2001-02Appendix 2(A): Travel Account : 1990-91 to 2001-02Appendix 2(A): Travel Account : 1990-91 to 2001-02Appendix 2(A): Travel Account : 1990-91 to 2001-02
(Rs. Crore)(Rs. Crore)(Rs. Crore)(Rs. Crore)(Rs. Crore) (US $ Mn)(US $ Mn)(US $ Mn)(US $ Mn)(US $ Mn) (Rs. Crore)(Rs. Crore)(Rs. Crore)(Rs. Crore)(Rs. Crore) (US $ Mn)(US $ Mn)(US $ Mn)(US $ Mn)(US $ Mn) (Rs. Crore)(Rs. Crore)(Rs. Crore)(Rs. Crore)(Rs. Crore) (US $ Mn)(US $ Mn)(US $ Mn)(US $ Mn)(US $ Mn) (Rs. Crore)(Rs. Crore)(Rs. Crore)(Rs. Crore)(Rs. Crore) (US $ Mn)(US $ Mn)(US $ Mn)(US $ Mn)(US $ Mn) (Rs. Crore)(Rs. Crore)(Rs. Crore)(Rs. Crore)(Rs. Crore) (US $ Mn)(US $ Mn)(US $ Mn)(US $ Mn)(US $ Mn) (Rs. Crore)(Rs. Crore)(Rs. Crore)(Rs. Crore)(Rs. Crore) (US $ Mn)(US $ Mn)(US $ Mn)(US $ Mn)(US $ Mn) (Rs. Crore)(Rs. Crore)(Rs. Crore)(Rs. Crore)(Rs. Crore) (US $ Mn)(US $ Mn)(US $ Mn)(US $ Mn)(US $ Mn)
ItemItemItemItemItem 1990-91 1991-92 1992-93 1993-94 1994-95 1995-96 1996-97
1 2 3 4 5 6 7 8 9 10 11 12 13 14
AAAAA ReceiptsReceiptsReceiptsReceiptsReceiptsTourist Expenses 2612.5 1456 4891.9 1977 6060.3 2098 6970.3 2222 7423.8 2365 9150.3 2713 10231.8 2878 in IndiaTOTAL-ATOTAL-ATOTAL-ATOTAL-ATOTAL-A 2612.52612.52612.52612.52612.5 14561456145614561456 4891.94891.94891.94891.94891.9 19771977197719771977 6060.36060.36060.36060.36060.3 20982098209820982098 6970.36970.36970.36970.36970.3 22222222222222222222 7423.87423.87423.87423.87423.8 23652365236523652365 9150.39150.39150.39150.39150.3 27132713271327132713 10231.810231.810231.810231.810231.8 28782878287828782878
BBBBB PaymentsPaymentsPaymentsPaymentsPaymentsBusiness 443.8 247 679.2 284 832 271 1189 379 1815.3 578 2347.8 702 1136.3 320Health Related 9.5 5 53.1 23 12.8 4 16.2 5 16.7 5 17.6 5 13.8 4EducationRelated 77.8 43 136.2 58 118.6 39 106.6 34 149.7 48 218.5 65 96.5 24Basic travel quota (BTQ) .......... .......... .......... .......... .......... .......... .......... .......... .......... .......... .......... .......... .......... ..........Pilgrimage 19.9 11 49.8 21 53.6 17 69.8 22 100.2 32 172.1 51 226.7 64Others 171.4 97 243 100 3920 71 4100 79 2872.6 187 2657.6 395 5935.9 510(includes settlements ofinternational credit cards)TOTAL-BTOTAL-BTOTAL-BTOTAL-BTOTAL-B 702.5702.5702.5702.5702.5 392392392392392 1111.51111.51111.51111.51111.5 465465465465465 1176.91176.91176.91176.91176.9 385385385385385 1558.51558.51558.51558.51558.5 497497497497497 2569.52569.52569.52569.52569.5 818818818818818 3908.83908.83908.83908.83908.8 11671167116711671167 3049.33049.33049.33049.33049.3 858858858858858
C.C.C.C.C. Travel Net (A-B)Travel Net (A-B)Travel Net (A-B)Travel Net (A-B)Travel Net (A-B) 19101910191019101910 10641064106410641064 3780.43780.43780.43780.43780.4 15121512151215121512 4883.44883.44883.44883.44883.4 17131713171317131713 5411.85411.85411.85411.85411.8 17251725172517251725 4854.34854.34854.34854.34854.3 15471547154715471547 5241.55241.55241.55241.55241.5 15461546154615461546 7182.57182.57182.57182.57182.5 20202020202020202020
(Rs. Crore)(Rs. Crore)(Rs. Crore)(Rs. Crore)(Rs. Crore) (US $ (US $ (US $ (US $ (US $ MnMnMnMnMn))))) (Rs. Crore)(Rs. Crore)(Rs. Crore)(Rs. Crore)(Rs. Crore) (US $ (US $ (US $ (US $ (US $ MnMnMnMnMn))))) (Rs. Crore)(Rs. Crore)(Rs. Crore)(Rs. Crore)(Rs. Crore) (US $ (US $ (US $ (US $ (US $ MnMnMnMnMn))))) (Rs. Crore)(Rs. Crore)(Rs. Crore)(Rs. Crore)(Rs. Crore) (US $ (US $ (US $ (US $ (US $ MnMnMnMnMn))))) (Rs. Crore)(Rs. Crore)(Rs. Crore)(Rs. Crore)(Rs. Crore) (US $ (US $ (US $ (US $ (US $ MnMnMnMnMn))))) (Rs. Crore)(Rs. Crore)(Rs. Crore)(Rs. Crore)(Rs. Crore) (US $ (US $ (US $ (US $ (US $ MnMnMnMnMn)))))
ItemItemItemItemItem 1997-98 1998-99 1999-00PR 2000-01 2001-02 2001-02
15 16 17 18 19 20 21 22 23 24 25 26
AAAAA ReceiptsReceiptsReceiptsReceiptsReceiptsTourist Expenses 10880 2914 12604 2993 13166 3036 14505 3168 13880 2910 13880 2910 in IndiaTOTAL-ATOTAL-ATOTAL-ATOTAL-ATOTAL-A 1088010880108801088010880 29142914291429142914 1260412604126041260412604 29932993299329932993 1316613166131661316613166 30363036303630363036 1450514505145051450514505 31683168316831683168 1388013880138801388013880 29102910291029102910 1388013880138801388013880 29102910291029102910
BBBBB PaymentsPaymentsPaymentsPaymentsPaymentsBusiness 2391 643 3687 877 5490 1268 7177 1570 6098 1281 6098 1281Health Related 21 6 40 9 13 3 15 3 9 2 9 2EducationRelated 210 57 218 52 263 61 378 83 582 122 582 122Basic travel quota ( BTQ) 1256 340 1532 363 1638 379 2977 652 2293 483 2293 483Pilgrimage 329 85 292 69 602 137 819 179 333 69 333 69Others (includes settlements of 1132 306 1557 373 1262 291 1770 387 1554 325 1554 325international credit cards)TOTAL-BTOTAL-BTOTAL-BTOTAL-BTOTAL-B 53395339533953395339 14371437143714371437 73267326732673267326 17431743174317431743 92689268926892689268 21392139213921392139 1313613136131361313613136 28742874287428742874 1086910869108691086910869 22822282228222822282 1086910869108691086910869 22822282228222822282
C.C.C.C.C. Travel Net (A-B)Travel Net (A-B)Travel Net (A-B)Travel Net (A-B)Travel Net (A-B) 55415541554155415541 14771477147714771477 52785278527852785278 12501250125012501250 38983898389838983898 897897897897897 13691369136913691369 294294294294294 30113011301130113011 628628628628628 30113011301130113011 628628628628628
PR : Partially revised.Note: The data from 1956-57 to 1989-90 has no further break-up and hence is the same as given in Appendix 2.
Sources: Reserve Bank of India Bulletin, May 2003, January 2001, April 1999Monograph on India’s Balance of Payments, July 1993

Balance of P
ayments
36
Appendix 2 (Bi): Transportation Account: 1956-57 to 1989-90Appendix 2 (Bi): Transportation Account: 1956-57 to 1989-90Appendix 2 (Bi): Transportation Account: 1956-57 to 1989-90Appendix 2 (Bi): Transportation Account: 1956-57 to 1989-90Appendix 2 (Bi): Transportation Account: 1956-57 to 1989-90
1956-57 1957-58 1958-59 1959-60 1960-61 1961-62 1962-63 1963-64 1964-65 1965-66 1966-67 1967-68 1968-69 1969-70 1970-71 1971-72 1972-73
ItemItemItemItemItem 1 2 3 4 5 6 7 8 9 10 11 12 13 14 15 16 17
ReceiptsReceiptsReceiptsReceiptsReceipts1 Remittances of surplus passage 10.6 10.7 8.4 7.3 7.1 9.4 7.7 11.7 9.7 8.3 15.1 17.6 19.3 17.1 19.9 22.1 15.9
fare and frieght collections byIndian steamship owners oroperators abroad*
2 Operating expenses of foreign 9.5 11.5 9.4 8.3 8.1 7.1 9.3 8.8 8.9 8.2 15.6 18.6 17.1 17.3 16.1 17.1 20.0steamship companies in India**
3 Remittances of surplus passage .......... .......... .......... .......... .......... .......... .......... .......... .......... .......... .......... .......... .......... - -fare and frieght collections byIndian airlines operator orowners abroad
4 Operating expenses of foreign .......... .......... .......... .......... .......... .......... .......... .......... .......... .......... .......... .......... .......... - -air line companies in India
5 Estimated freight on exports 25.0 23.4 22.6 24.6 24.5 26.0 25.9 30.4 31.4 31.0 42.8 49.6 53.9 55.4 55.3 61.3 74.56 Transportation receipts .......... .......... .......... .......... .......... .......... .......... .......... 1.9 3.3 5.6 5.6 4.8 3.9 5.1 5.5 6.1
of oil companies***7 Others 1.1 1.8 4.7 4.9 4.9 5.1 6.4 6.5 4.6 2.8 2.3 2.7 4.0 8.1 12.1 5.3 4.4
AAAAA TotalTotalTotalTotalTotal 46.246.246.246.246.2 47.447.447.447.447.4 45.145.145.145.145.1 45.145.145.145.145.1 44.644.644.644.644.6 47.647.647.647.647.6 49.349.349.349.349.3 57.457.457.457.457.4 56.556.556.556.556.5 53.653.653.653.653.6 81.481.481.481.481.4 94.194.194.194.194.1 99.199.199.199.199.1 101.8101.8101.8101.8101.8 108.5108.5108.5108.5108.5 111.3111.3111.3111.3111.3 120.9120.9120.9120.9120.9
PaymentsPaymentsPaymentsPaymentsPayments1 Remittances of surplus passage 8.4 8.0 8.0 11.1 12.0 14.5 12.5 12.8 15.4 12.8 21.8 24.1 23.8 26.6 27.4 28.6 33.9
fare and frieght collections toforeign steamship ownersor operators abroad*
2 Operating expenses of Indian 1.9 2.1 2.3 3.3 2.9 3.2 3.3 5.6 3.7 3.8 5.5 6.3 10.3 10.5 11.3 11.9 14.1steamship companies in India**
3 Remittances of surplus passage .......... .......... .......... .......... .......... .......... .......... .......... 0.1 ----- ----- ----- ----- ----- ----- ----- -----fare and frieght collections to foreignairlines operator or owners abroad
4 Operating expenses of Indian .......... .......... .......... .......... .......... .......... .......... .......... ----- ----- ----- ----- ----- ----- 0.1 0.1 0.4air line companies in India
5 Operating expenses of foreign .......... .......... .......... .......... .......... .......... .......... .......... 0.3 0.1 0.3 - 0.1 0.3 ----- ----- -----steamship and air-line companies
6 Charter hire payments .......... .......... .......... .......... .......... .......... .......... .......... 1.1 1.3 3.3 6.7 9.9 13.2 11.4 5.6 2.77 Remittances of passage expenses .......... .......... .......... .......... .......... .......... .......... .......... ----- ----- ----- 0.2 ----- ----- 0.1 ----- -----8 Freight payment on exports .......... .......... .......... .......... .......... .......... .......... .......... 1.1 1.8 3.9 1.5 1.5 1.7 3.0 2.8 2.29 Frieght payment on imports 2.7 6.9 3.4 1.4 3.9 3.1 3.0 2.4 3.3 1.5 2.2 7.5 8.5 10.0 13.6 8.7 11.110 Transportation payment .......... .......... .......... .......... .......... .......... .......... .......... 6.5 5.7 8.6 11.0 9.9 9.5 11.0 9.5 3.9
of oil-companies@11 Others 3.1 2.0 4.3 5.7 5.8 5.7 9.0 8.1 0.7 0.9 0.8 2.4 1.0 0.5 0.5 1.1 3.0
BBBBB TotalTotalTotalTotalTotal 16.116.116.116.116.1 19.019.019.019.019.0 18.018.018.018.018.0 21.521.521.521.521.5 24.624.624.624.624.6 26.526.526.526.526.5 27.827.827.827.827.8 28.928.928.928.928.9 32.232.232.232.232.2 27.927.927.927.927.9 46.446.446.446.446.4 59.759.759.759.759.7 65.065.065.065.065.0 72.372.372.372.372.3 78.478.478.478.478.4 68.368.368.368.368.3 71.371.371.371.371.3
Net (A-B)Net (A-B)Net (A-B)Net (A-B)Net (A-B) 30.130.130.130.130.1 28.428.428.428.428.4 27.127.127.127.127.1 23.623.623.623.623.6 20.020.020.020.020.0 21.121.121.121.121.1 21.521.521.521.521.5 28.528.528.528.528.5 24.324.324.324.324.3 25.725.725.725.725.7 35.035.035.035.035.0 34.434.434.434.434.4 34.134.134.134.134.1 29.529.529.529.529.5 30.130.130.130.130.1 43.043.043.043.043.0 49.649.649.649.649.6
(Contd)

37B
alance of Paym
ents
Appendix 2 (Bi): Transportation Account: 1956-57 to 1989-90 Appendix 2 (Bi): Transportation Account: 1956-57 to 1989-90 Appendix 2 (Bi): Transportation Account: 1956-57 to 1989-90 Appendix 2 (Bi): Transportation Account: 1956-57 to 1989-90 Appendix 2 (Bi): Transportation Account: 1956-57 to 1989-90 (Concluded)
1973-74 1974-75 1975-76 1976-77 1977-78 1978-79 1979-80 1980-81 1981-82 1982-83 1983-84 1984-85 1985-86 1986-87 1987-88 1988-89 1989-90
ItemItemItemItemItem 18 19 20 21 22 23 24 25 26 27 28 29 30 31 32 33 34
ReceiptsReceiptsReceiptsReceiptsReceipts1 Remittances of surplus passage 10.7 17.3 7.0 9.3 8.4 5.0 2.3 2.8 3.7 2.3 3.4 1.4 1.0 3.4 5.4 11.4 5.3
fare and frieght collections byIndian steamship owners oroperators abroad*
2 Operating expenses of foreign 23.5 58.3 46.4 58.9 42.5 35.9 48.8 59.9 59.5 67.5 41.0 75.9 49.5 51.5 76.0 107.8 173.9steamship companies in India**
3 Remittances of surplus passage - - - 4.8 2.5 2.0 0.8 2.8 1.0 1.8 0.2 88.7 93.7 105.2 150.4 360.8 208.6fare and frieght collections byIndian airlines operator orowners abroad
4 Operating expenses of foreign - - 8.0 12.4 10.8 16.4 18.0 24.0 6.3 6.7 11.3 2.1 2.2 1.2 3.3 6.0 6.0air line companies in India
5 Estimated freight on exports 92.3 125.2 164.7 202.2 214.1 219.3 248.5 262.6 305.9 318.1 378.0 471.1 456.0 524.5 645.0 808.3 1098.66 Transportation receipts 8.6 6.8 10.1 3.1 - - - - - - - - - - - - -
of oil companies***7 others 10.1 10.3 20.2 4.1 2.4 1.7 2.8 8.7 21.3 10.8 5.7 4.5 1.5 2.2 1.5 5.5 18.1
AAAAA TotalTotalTotalTotalTotal 145.2145.2145.2145.2145.2 217.9217.9217.9217.9217.9 256.4256.4256.4256.4256.4 294.8294.8294.8294.8294.8 280.7280.7280.7280.7280.7 280.3280.3280.3280.3280.3 321.2321.2321.2321.2321.2 360.8360.8360.8360.8360.8 397.7397.7397.7397.7397.7 407.2407.2407.2407.2407.2 439.6439.6439.6439.6439.6 643.7643.7643.7643.7643.7 603.9603.9603.9603.9603.9 688.0688.0688.0688.0688.0 881.6881.6881.6881.6881.6 1299.81299.81299.81299.81299.8 1510.51510.51510.51510.51510.5
PaymentsPaymentsPaymentsPaymentsPayments1 Remittances of surplus passage 39.5 49.3 59.3 69.6 52.2 38.1 56.2 62.3 74.9 62.0 61.1 117.5 85.7 96.3 101.3 168.0 255.9
fare and frieght collections toforeign steamship owners oroperators abroad*
2 Operating expenses of Indian 25.8 32.7 74.8 83.8 82.5 107.9 117.0 162.4 218.2 311.5 335.0 332.2 305.7 318.2 496.7 525.8 562.0steamship companies in India**
3 Remittances of surplus passage 2.6 ----- 6.4 18.4 24.7 34.1 28.3 47.2 69.4 109.6 123.8 161.3 191.7 144.8 275.2 360.2 518.5fare and frieght collections to foreignairlines operator or owners abroad
4 Operating expenses of Indian 0.7 5.6 8.8 18.9 5.2 17.1 16.6 21.1 31.8 46.3 4.7 5.8 2.5 25.8 37.3 17.3 24.5air line companies in India
5 Operating expenses of foreign ----- ----- 1.6 3.4 5.5 0.8 0.8 0.5 3.4 0.3 0.2 2.5 14.0 6.8 4.6 2.5 10.2steamship and air-line companies
6 Charter hire payments 4.2 5.8 8.4 11.2 10.5 8.4 17.0 28.0 35.7 63.1 70.5 90.9 32.5 42.5 64.2 101.6 119.87 Remittances of passage expenses ----- ----- ----- ----- ----- ----- 0.3 0.1 0.2 1.9 0.4 0.4 ----- 0.6 0.2 1.1 0.68 Freight payment on exports 2.4 2.6 2.1 5.2 3.3 4.2 2.4 2.9 1.4 2.1 4.1 4.5 10.6 7.1 2.2 ----- -----9 Frieght payment on imports 21.0 23.6 28.7 26.8 29.3 23.7 7.7 14.9 27.1 75.7 103.5 184.1 151.1 91.1 138.2 283.4 353.410 Transportation payment 4.0 3.7 2.1 ----- ----- ----- ----- ----- ----- ----- ----- ----- ----- ----- ----- ----- -----
of oil-companies@11 others 1.3 9.3 3.5 10.4 2.4 0.9 6.4 15.7 20.4 26.0 11.9 18.5 22.3 14.7 8.0 26.6 11.8
BBBBB Total Total Total Total Total 101.5101.5101.5101.5101.5 132.6132.6132.6132.6132.6 195.7195.7195.7195.7195.7 247.7247.7247.7247.7247.7 215.6215.6215.6215.6215.6 235.2235.2235.2235.2235.2 252.7252.7252.7252.7252.7 355.1355.1355.1355.1355.1 482.5482.5482.5482.5482.5 698.5698.5698.5698.5698.5 715.2715.2715.2715.2715.2 917.7917.7917.7917.7917.7 816.1816.1816.1816.1816.1 747.9747.9747.9747.9747.9 1127.91127.91127.91127.91127.9 1486.51486.51486.51486.51486.5 1856.71856.71856.71856.71856.7
Net (A-B)Net (A-B)Net (A-B)Net (A-B)Net (A-B) 43.743.743.743.743.7 85.385.385.385.385.3 60.760.760.760.760.7 47.147.147.147.147.1 65.165.165.165.165.1 45.145.145.145.145.1 68.568.568.568.568.5 5.75.75.75.75.7 -84.8-84.8-84.8-84.8-84.8 -291.3-291.3-291.3-291.3-291.3 -275.6-275.6-275.6-275.6-275.6 -274.0-274.0-274.0-274.0-274.0 -212.2-212.2-212.2-212.2-212.2 -59.9-59.9-59.9-59.9-59.9 -246.3-246.3-246.3-246.3-246.3 -186.7-186.7-186.7-186.7-186.7 -346.2-346.2-346.2-346.2-346.2
Sources: Reserve Bank of India Bulletin, May 2003, January 2001, April 1999Monograph on India’s Balance of Payments, July 1993
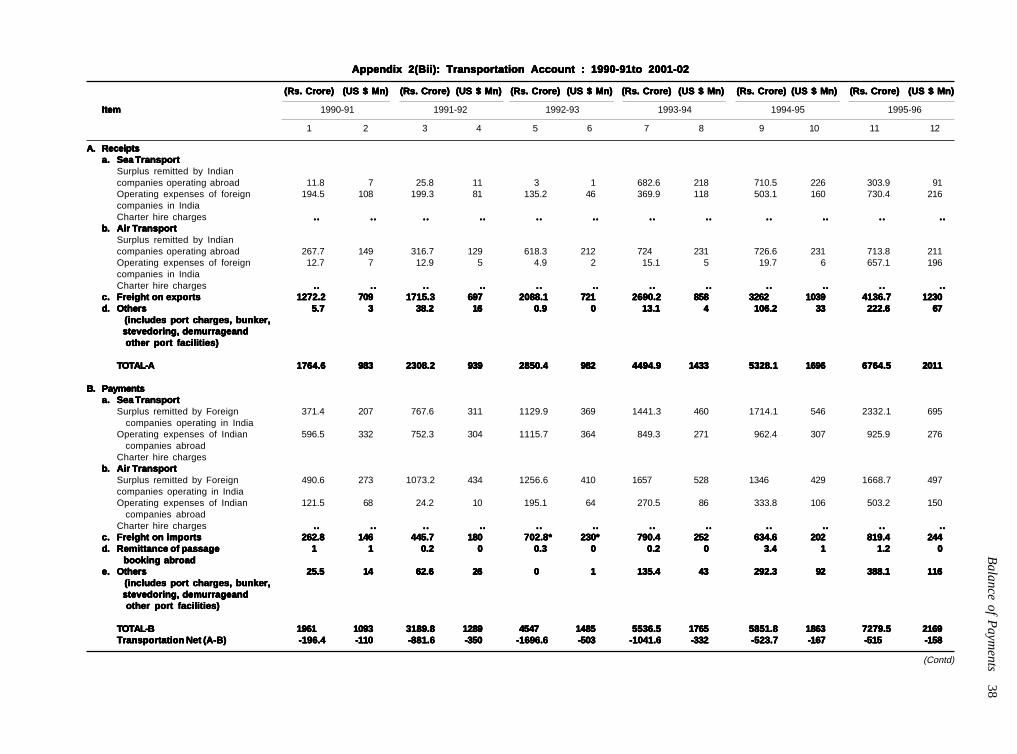
Balance of P
ayments
38
Appendix 2(Bii): Transportation Account : 1990-91to 2001-02Appendix 2(Bii): Transportation Account : 1990-91to 2001-02Appendix 2(Bii): Transportation Account : 1990-91to 2001-02Appendix 2(Bii): Transportation Account : 1990-91to 2001-02Appendix 2(Bii): Transportation Account : 1990-91to 2001-02
(Rs. Crore)(Rs. Crore)(Rs. Crore)(Rs. Crore)(Rs. Crore) (US $ Mn)(US $ Mn)(US $ Mn)(US $ Mn)(US $ Mn) (Rs. Crore)(Rs. Crore)(Rs. Crore)(Rs. Crore)(Rs. Crore) (US $ Mn)(US $ Mn)(US $ Mn)(US $ Mn)(US $ Mn) (Rs. Crore)(Rs. Crore)(Rs. Crore)(Rs. Crore)(Rs. Crore) (US $ Mn)(US $ Mn)(US $ Mn)(US $ Mn)(US $ Mn) (Rs. Crore)(Rs. Crore)(Rs. Crore)(Rs. Crore)(Rs. Crore) (US $ Mn)(US $ Mn)(US $ Mn)(US $ Mn)(US $ Mn) (Rs. Crore)(Rs. Crore)(Rs. Crore)(Rs. Crore)(Rs. Crore) (US $ Mn)(US $ Mn)(US $ Mn)(US $ Mn)(US $ Mn) (Rs. Crore)(Rs. Crore)(Rs. Crore)(Rs. Crore)(Rs. Crore) (US $ Mn)(US $ Mn)(US $ Mn)(US $ Mn)(US $ Mn)
ItemItemItemItemItem 1990-91 1991-92 1992-93 1993-94 1994-95 1995-96
1 2 3 4 5 6 7 8 9 10 11 12
A.A.A.A.A. ReceiptsReceiptsReceiptsReceiptsReceiptsa.a.a.a.a. Sea TransportSea TransportSea TransportSea TransportSea Transport
Surplus remitted by Indiancompanies operating abroad 11.8 7 25.8 11 3 1 682.6 218 710.5 226 303.9 91Operating expenses of foreign 194.5 108 199.3 81 135.2 46 369.9 118 503.1 160 730.4 216companies in IndiaCharter hire charges .......... .......... .......... .......... .......... .......... .......... .......... .......... .......... .......... ..........
b.b.b.b.b. Air TransportAir TransportAir TransportAir TransportAir TransportSurplus remitted by Indiancompanies operating abroad 267.7 149 316.7 129 618.3 212 724 231 726.6 231 713.8 211Operating expenses of foreign 12.7 7 12.9 5 4.9 2 15.1 5 19.7 6 657.1 196companies in IndiaCharter hire charges .......... .......... .......... .......... .......... .......... .......... .......... .......... .......... .......... ..........
c.c.c.c.c. Freight on exportsFreight on exportsFreight on exportsFreight on exportsFreight on exports 1272.21272.21272.21272.21272.2 709709709709709 1715.31715.31715.31715.31715.3 697697697697697 2088.12088.12088.12088.12088.1 721721721721721 2690.22690.22690.22690.22690.2 858858858858858 32623262326232623262 10391039103910391039 4136.74136.74136.74136.74136.7 12301230123012301230d.d.d.d.d. OthersOthersOthersOthersOthers 5.75.75.75.75.7 33333 38.238.238.238.238.2 1616161616 0.90.90.90.90.9 00000 13.113.113.113.113.1 44444 106.2106.2106.2106.2106.2 3333333333 222.6222.6222.6222.6222.6 6767676767
(includes port charges, bunker, (includes port charges, bunker, (includes port charges, bunker, (includes port charges, bunker, (includes port charges, bunker, stevedoring, demurrageand stevedoring, demurrageand stevedoring, demurrageand stevedoring, demurrageand stevedoring, demurrageand other port facilities)other port facilities)other port facilities)other port facilities)other port facilities)
TOTAL-ATOTAL-ATOTAL-ATOTAL-ATOTAL-A 1764.61764.61764.61764.61764.6 983983983983983 2308.22308.22308.22308.22308.2 939939939939939 2850.42850.42850.42850.42850.4 982982982982982 4494.94494.94494.94494.94494.9 14331433143314331433 5328.15328.15328.15328.15328.1 16961696169616961696 6764.56764.56764.56764.56764.5 20112011201120112011
B.B.B.B.B. PaymentsPaymentsPaymentsPaymentsPaymentsa.a.a.a.a. Sea TransportSea TransportSea TransportSea TransportSea Transport
Surplus remitted by Foreign 371.4 207 767.6 311 1129.9 369 1441.3 460 1714.1 546 2332.1 695 companies operating in IndiaOperating expenses of Indian 596.5 332 752.3 304 1115.7 364 849.3 271 962.4 307 925.9 276 companies abroadCharter hire charges
b.b.b.b.b. Air TransportAir TransportAir TransportAir TransportAir TransportSurplus remitted by Foreign 490.6 273 1073.2 434 1256.6 410 1657 528 1346 429 1668.7 497companies operating in IndiaOperating expenses of Indian 121.5 68 24.2 10 195.1 64 270.5 86 333.8 106 503.2 150 companies abroadCharter hire charges .......... .......... .......... .......... .......... .......... .......... .......... .......... .......... .......... ..........
c.c.c.c.c. Freight on importsFreight on importsFreight on importsFreight on importsFreight on imports 262.8262.8262.8262.8262.8 146146146146146 445.7445.7445.7445.7445.7 180180180180180 702.8*702.8*702.8*702.8*702.8* 230*230*230*230*230* 790.4790.4790.4790.4790.4 252252252252252 634.6634.6634.6634.6634.6 202202202202202 819.4819.4819.4819.4819.4 244244244244244d.d.d.d.d. Remittance of passageRemittance of passageRemittance of passageRemittance of passageRemittance of passage 11111 11111 0.20.20.20.20.2 00000 0.30.30.30.30.3 00000 0.20.20.20.20.2 00000 3.43.43.43.43.4 11111 1.21.21.21.21.2 00000
booking abroad booking abroad booking abroad booking abroad booking abroade.e.e.e.e. OthersOthersOthersOthersOthers 25.525.525.525.525.5 1414141414 62.662.662.662.662.6 2626262626 00000 11111 135.4135.4135.4135.4135.4 4343434343 292.3292.3292.3292.3292.3 9292929292 388.1388.1388.1388.1388.1 116116116116116
(includes port charges, bunker, (includes port charges, bunker, (includes port charges, bunker, (includes port charges, bunker, (includes port charges, bunker, stevedoring, demurrageand stevedoring, demurrageand stevedoring, demurrageand stevedoring, demurrageand stevedoring, demurrageand other port facilities) other port facilities) other port facilities) other port facilities) other port facilities)
TOTAL-BTOTAL-BTOTAL-BTOTAL-BTOTAL-B 19611961196119611961 10931093109310931093 3189.83189.83189.83189.83189.8 12891289128912891289 45474547454745474547 14851485148514851485 5536.55536.55536.55536.55536.5 17651765176517651765 5851.85851.85851.85851.85851.8 18631863186318631863 7279.57279.57279.57279.57279.5 21692169216921692169Transportation Net (A-B)Transportation Net (A-B)Transportation Net (A-B)Transportation Net (A-B)Transportation Net (A-B) -196.4-196.4-196.4-196.4-196.4 -110-110-110-110-110 -881.6-881.6-881.6-881.6-881.6 -350-350-350-350-350 -1696.6-1696.6-1696.6-1696.6-1696.6 -503-503-503-503-503 -1041.6-1041.6-1041.6-1041.6-1041.6 -332-332-332-332-332 -523.7-523.7-523.7-523.7-523.7 -167-167-167-167-167 -515-515-515-515-515 -158-158-158-158-158
(Contd)

39B
alance of Paym
ents
Appendix 2(Bii): Transportation Account : 1990-91to 2001-02 Appendix 2(Bii): Transportation Account : 1990-91to 2001-02 Appendix 2(Bii): Transportation Account : 1990-91to 2001-02 Appendix 2(Bii): Transportation Account : 1990-91to 2001-02 Appendix 2(Bii): Transportation Account : 1990-91to 2001-02 (Concluded)
(Rs. Crore)(Rs. Crore)(Rs. Crore)(Rs. Crore)(Rs. Crore) (US $ Mn)(US $ Mn)(US $ Mn)(US $ Mn)(US $ Mn) (Rs. Crore)(Rs. Crore)(Rs. Crore)(Rs. Crore)(Rs. Crore) (US $ Mn)(US $ Mn)(US $ Mn)(US $ Mn)(US $ Mn) (Rs. Crore)(Rs. Crore)(Rs. Crore)(Rs. Crore)(Rs. Crore) (US $ Mn)(US $ Mn)(US $ Mn)(US $ Mn)(US $ Mn) (Rs. Crore)(Rs. Crore)(Rs. Crore)(Rs. Crore)(Rs. Crore) (US $ Mn)(US $ Mn)(US $ Mn)(US $ Mn)(US $ Mn) (Rs. Crore)(Rs. Crore)(Rs. Crore)(Rs. Crore)(Rs. Crore) (US $ Mn)(US $ Mn)(US $ Mn)(US $ Mn)(US $ Mn) (Rs. Crore)(Rs. Crore)(Rs. Crore)(Rs. Crore)(Rs. Crore) (US $ Mn)(US $ Mn)(US $ Mn)(US $ Mn)(US $ Mn)
ItemItemItemItemItem 1996-97 1997-98 1998-99 1999-00PR 2000-01 2001-02
13 14 15 16 17 18 19 20 21 22 23 24
A.A.A.A.A. ReceiptsReceiptsReceiptsReceiptsReceiptsa.a.a.a.a. Sea TransportSea TransportSea TransportSea TransportSea Transport
Surplus remitted by Indian companies operating abroad 194.2 55 181 47 207 49 262 61 250 55 322 68Operating expenses of foreign 670.8 189 1139 308 844 201 696 161 539 118 665 137 companies in IndiaCharter hire charges .......... .......... 176 49 104 25 181 42 214 47 250 52
b.b.b.b.b. Air TransportAir TransportAir TransportAir TransportAir TransportSurplus remitted by Indian companies operating abroad 940.8 265 937 252 700 167 781 180 804 176 835 175Operating expenses of foreign 287.9 81 301 81 251 60 87 20 89 20 41 9 companies in IndiaCharter hire charges .......... .......... 72 19 374 89 103 24 19 4 76 16
c.c.c.c.c. Freight on exportsFreight on exportsFreight on exportsFreight on exportsFreight on exports 4626.34626.34626.34626.34626.3 13031303130313031303 35703570357035703570 966966966966966 43184318431843184318 10261026102610261026 46174617461746174617 10651065106510651065 61776177617761776177 13501350135013501350 64986498649864986498 13611361136113611361d.d.d.d.d. OthersOthersOthersOthersOthers 222.4222.4222.4222.4222.4 6060606060 429429429429429 114114114114114 13111311131113111311 308308308308308 673673673673673 155155155155155 658658658658658 143143143143143 723723723723723 152152152152152
(includes port charges, bunker, (includes port charges, bunker, (includes port charges, bunker, (includes port charges, bunker, (includes port charges, bunker, stevedoring, demurrageand stevedoring, demurrageand stevedoring, demurrageand stevedoring, demurrageand stevedoring, demurrageand other port facilities)other port facilities)other port facilities)other port facilities)other port facilities)
TOTAL-ATOTAL-ATOTAL-ATOTAL-ATOTAL-A 6942.46942.46942.46942.46942.4 19531953195319531953 68056805680568056805 18361836183618361836 81098109810981098109 19251925192519251925 74007400740074007400 17071707170717071707 87508750875087508750 19131913191319131913 94109410941094109410 19691969196919691969
B.B.B.B.B. PaymentsPaymentsPaymentsPaymentsPaymentsa.a.a.a.a. Sea TransportSea TransportSea TransportSea TransportSea Transport
Surplus remitted by Foreign 2800.5 789 2396 649 1834 388 1681 387 1841 404 1464 308695 companies operating in IndiaOperating expenses of Indian 1281.1 361 1070 290 1353 319 1757 406 2058 450 1506 315 companies abroadCharter hire charges 663 179 656 155 501 116 720 161 826 175
b.b.b.b.b. Air TransportAir TransportAir TransportAir TransportAir TransportSurplus remitted by Foreign 1937.7 546 2249 610 3226 769 3561 821 5936 1299 4074 854 companies operating in IndiaOperating expenses of Indian 638.8 180 779 208 966 232 580 134 435 95 346 73 companies abroadCharter hire charges .......... .......... 529529529529529 144 345 177 324 75 307 67 234 49
c.c.c.c.c. Freight on importsFreight on importsFreight on importsFreight on importsFreight on imports 600.8600.8600.8600.8600.8 169169169169169 10041004100410041004 268268268268268 15841584158415841584 380380380380380 13171317131713171317 304304304304304 28072807280728072807 615615615615615 23692369236923692369 497497497497497d.d.d.d.d. Remittance of passageRemittance of passageRemittance of passageRemittance of passageRemittance of passage 1414141414 44444 430430430430430 114114114114114 332332332332332 3131313131 104104104104104 2424242424 3434343434 77777 9494949494 2020202020
booking abroad booking abroad booking abroad booking abroad booking abroade.e.e.e.e. OthersOthersOthersOthersOthers 518.5518.5518.5518.5518.5 146146146146146 233233233233233 6060606060 969969969969969 229229229229229 625625625625625 144144144144144 324324324324324 7272727272 433433433433433 9191919191
(includes port charges, bunker, (includes port charges, bunker, (includes port charges, bunker, (includes port charges, bunker, (includes port charges, bunker, stevedoring, demurrageand stevedoring, demurrageand stevedoring, demurrageand stevedoring, demurrageand stevedoring, demurrageand other port facilities) other port facilities) other port facilities) other port facilities) other port facilities)
TOTAL-BTOTAL-BTOTAL-BTOTAL-BTOTAL-B 8497.18497.18497.18497.18497.1 23942394239423942394 93539353935393539353 25222522252225222522 1126511265112651126511265 26802680268026802680 1045010450104501045010450 24102410241024102410 1446114461144611446114461 31703170317031703170 1134611346113461134611346 23822382238223822382Transportation Net (A-B)Transportation Net (A-B)Transportation Net (A-B)Transportation Net (A-B)Transportation Net (A-B) -1554.7-1554.7-1554.7-1554.7-1554.7 -441-441-441-441-441 -2548-2548-2548-2548-2548 -686-686-686-686-686 -3156-3156-3156-3156-3156 -755-755-755-755-755 -3050-3050-3050-3050-3050 -703-703-703-703-703 -5711-5711-5711-5711-5711 -1257-1257-1257-1257-1257 -1936-1936-1936-1936-1936 -413-413-413-413-413
* includes frieght payment on exports also.Sources: Reserve Bank of India Bulletin, May 2003, January 2001, April 1999
Monograph on India’s Balance of Payments, July 1993

Balance of Payments 40
Appendix 2(Ci): Insurance Account : 1956-57 to 1996-67Appendix 2(Ci): Insurance Account : 1956-57 to 1996-67Appendix 2(Ci): Insurance Account : 1956-57 to 1996-67Appendix 2(Ci): Insurance Account : 1956-57 to 1996-67Appendix 2(Ci): Insurance Account : 1956-57 to 1996-67(Rupees, Crore)(Rupees, Crore)(Rupees, Crore)(Rupees, Crore)(Rupees, Crore)
Year Life Marine Others TotalTotalTotalTotalTotal TotalTotalTotalTotalTotal NetNetNetNetNet
Receipts Payments Receipts Payments Receipts Payments ReceiptsReceiptsReceiptsReceiptsReceipts PaymentsPaymentsPaymentsPaymentsPayments
1 2 3 4 5 6 77777 88888 (7-8)(7-8)(7-8)(7-8)(7-8)
1956-57 0.9 1.2 3.9 0.9 5.6 4.8 10.410.410.410.410.4 6.96.96.96.96.9 3.53.53.53.53.5
1957-58 0.5 0.8 4.3 0.7 4.2 4.0 9.09.09.09.09.0 5.55.55.55.55.5 3.53.53.53.53.5
1958-59 0.3 0.4 3.9 0.8 5.6 4.2 9.89.89.89.89.8 5.45.45.45.45.4 4.44.44.44.44.4
1959-60 0.4 0.4 3.8 0.8 3.8 4.1 8.08.08.08.08.0 5.35.35.35.35.3 2.72.72.72.72.7
1960-61 0.2 0.6 3.9 0.8 4.0 4.4 8.18.18.18.18.1 5.85.85.85.85.8 2.32.32.32.32.3
1961-62 0.2 0.7 4.1 0.8 3.1 4.1 7.47.47.47.47.4 5.65.65.65.65.6 1.81.81.81.81.8
1962-63 0.2 0.5 3.9 0.8 3.5 3.6 7.67.67.67.67.6 4.94.94.94.94.9 2.72.72.72.72.7
1963-64 0.2 0.6 4.4 0.9 3.5 4.0 8.18.18.18.18.1 5.55.55.55.55.5 2.62.62.62.62.6
1964-65 0.1 0.4 4.4 1.1 2.8 3.4 7.37.37.37.37.3 4.94.94.94.94.9 2.42.42.42.42.4
1965-66 0.2 0.3 4.8 1.4 6.7 4.4 11.711.711.711.711.7 6.16.16.16.16.1 5.65.65.65.65.6
1966-67 0.1 0.4 7.2 1.1 4.4 3.7 11.711.711.711.711.7 5.25.25.25.25.2 6.56.56.56.56.5
1967-68 - 0.5 7.5 1.8 5.0 4.5 12.512.512.512.512.5 6.86.86.86.86.8 5.75.75.75.75.7
1968-69 0.1 0.8 8.0 3.3 4.9 5.0 13.013.013.013.013.0 9.19.19.19.19.1 3.93.93.93.93.9
1969-70 0.1 1.6 8.5 4.1 4.6 7.7 13.213.213.213.213.2 13.413.413.413.413.4 -0.2-0.2-0.2-0.2-0.2
1970-71 0.2 0.3 7.4 2.1 4.7 9.9 12.312.312.312.312.3 12.312.312.312.312.3 0.00.00.00.00.0
1971-72 0.3 0.6 8.0 4.7 5.2 13.9 13.513.513.513.513.5 19.219.219.219.219.2 -5.7-5.7-5.7-5.7-5.7
1972-73 0.4 1.2 10.3 1.9 5.7 9.2 16.416.416.416.416.4 12.312.312.312.312.3 4.14.14.14.14.1
1973-74 0.6 0.4 12.2 2.5 7.7 10.7 20.520.520.520.520.5 13.613.613.613.613.6 6.96.96.96.96.9
1974-75 - 0.6 16.7 2.8 9.3 10.5 26.026.026.026.026.0 13.913.913.913.913.9 12.112.112.112.112.1
1975-76 0.1 1.4 21.6 8.2 13.9 14.8 35.635.635.635.635.6 24.424.424.424.424.4 11.211.211.211.211.2
1976-77 0.2 0.8 26.7 9.1 4.7 19.8 31.631.631.631.631.6 29.729.729.729.729.7 1.91.91.91.91.9
1977-78 0.3 1.2 28.3 15.1 6.8 14.8 35.435.435.435.435.4 31.131.131.131.131.1 4.34.34.34.34.3
1978-79 0.4 6.1 28.9 12.2 6.9 18.8 36.236.236.236.236.2 37.137.137.137.137.1 -0.9-0.9-0.9-0.9-0.9
1979-80 0.2 2.2 32.7 7.3 13.2 18.5 46.146.146.146.146.1 28.028.028.028.028.0 18.118.118.118.118.1
1980-81 0.2 2.9 34.5 9.7 15.9 21.3 50.650.650.650.650.6 33.933.933.933.933.9 16.716.716.716.716.7
1981-82 0.8 3.1 40.7 8.4 13.2 28.6 54.754.754.754.754.7 40.140.140.140.140.1 14.614.614.614.614.6
1982-83 0.4 2.8 42.9 17.5 14.7 48.6 58.058.058.058.058.0 68.968.968.968.968.9 -10.9-10.9-10.9-10.9-10.9
1983-84 6.3 2.4 50.1 15.7 57.4 57.1 113.8113.8113.8113.8113.8 75.275.275.275.275.2 38.638.638.638.638.6
1984-85 0.4 5.8 61.9 20.8 26.5 57.5 88.888.888.888.888.8 84.184.184.184.184.1 4.74.74.74.74.7
1985-86 0.8 3.1 60.4 28.2 17.4 52.0 78.678.678.678.678.6 83.383.383.383.383.3 -4.7-4.7-4.7-4.7-4.7
1986-87 0.9 3.9 69.3 37.5 12.9 60.2 83.183.183.183.183.1 101.6101.6101.6101.6101.6 -18.5-18.5-18.5-18.5-18.5
1987-88 1.3 2.0 86.3 22.9 17.9 82.0 105.5105.5105.5105.5105.5 106.9106.9106.9106.9106.9 -1.4-1.4-1.4-1.4-1.4
1988-89 1.7 3.0 107.0 30.0 27.3 62.2 136136136136136 95.295.295.295.295.2 40.840.840.840.840.8
1989-90 8.4 4.4 146.3 24.5 43.2 110.8 197.9197.9197.9197.9197.9 139.7139.7139.7139.7139.7 58.258.258.258.258.2
1990-91 5.6 12.4 1.4 47.9 191.4 98.1 198.4198.4198.4198.4198.4 158.4158.4158.4158.4158.4 40.040.040.040.040.0
1991-92 10.0 8.5 2.9 67.9 251.8 230.4 264.7264.7264.7264.7264.7 306.8306.8306.8306.8306.8 -42.1-42.1-42.1-42.1-42.1
1992-93 7.8 19.5 1.0 122.2 450.6 307.2 459.4459.4459.4459.4459.4 448.9448.9448.9448.9448.9 10.510.510.510.510.5
1993-94 3.9 8.7 0.8 121.3 383.4 481.8 388.1388.1388.1388.1388.1 611.8611.8611.8611.8611.8 -223.7-223.7-223.7-223.7-223.7
1994-95 3.5 9.4 2.8 78.8 469.4 478.4 475.7475.7475.7475.7475.7 566.6566.6566.6566.6566.6 -90.9-90.9-90.9-90.9-90.9
1995-96 4.1 22.0 2.9 67.4 592.6 389.5 599.6599.6599.6599.6599.6 478.9478.9478.9478.9478.9 120.7120.7120.7120.7120.7
1996-97 6.0 46.3 12.9 112.4 752.2 383.9 771.1771.1771.1771.1771.1 542.6542.6542.6542.6542.6 228.5228.5228.5228.5228.5
Sources: Reserve Bank of India Bulletin, May 2003, January 2001, April 1999Monograph on India’s Balance of Payments, July 1993

Appendix 2(Cii): Insurance Account : 1997-98 to 2001-02Appendix 2(Cii): Insurance Account : 1997-98 to 2001-02Appendix 2(Cii): Insurance Account : 1997-98 to 2001-02Appendix 2(Cii): Insurance Account : 1997-98 to 2001-02Appendix 2(Cii): Insurance Account : 1997-98 to 2001-02
(Rs. Crore)(Rs. Crore)(Rs. Crore)(Rs. Crore)(Rs. Crore) (US $ Mn)(US $ Mn)(US $ Mn)(US $ Mn)(US $ Mn) (Rs. Crore)(Rs. Crore)(Rs. Crore)(Rs. Crore)(Rs. Crore) (US $ Mn)(US $ Mn)(US $ Mn)(US $ Mn)(US $ Mn) (Rs. Crore)(Rs. Crore)(Rs. Crore)(Rs. Crore)(Rs. Crore) (US $ Mn)(US $ Mn)(US $ Mn)(US $ Mn)(US $ Mn) (Rs. Crore)(Rs. Crore)(Rs. Crore)(Rs. Crore)(Rs. Crore) (US $ Mn)(US $ Mn)(US $ Mn)(US $ Mn)(US $ Mn) (Rs. Crore)(Rs. Crore)(Rs. Crore)(Rs. Crore)(Rs. Crore) (US $ Mn)(US $ Mn)(US $ Mn)(US $ Mn)(US $ Mn)
ItemItemItemItemItem 1997-981997-981997-981997-981997-98 1998-991998-991998-991998-991998-99 1998-991998-991998-991998-991998-99 1999-001999-001999-001999-001999-00 1999-001999-001999-001999-001999-00 2000-012000-012000-012000-012000-01 2000-012000-012000-012000-012000-01 2001-022001-022001-022001-022001-02 2001-022001-022001-022001-022001-02
1 2 3 4 5 6 7 8 9 10
A.A.A.A.A. ReceiptsReceiptsReceiptsReceiptsReceipts
a.a.a.a.a. Insurance on exportInsurance on exportInsurance on exportInsurance on exportInsurance on export 683 184 744 176 832 192 1056 231 1110 232b.b.b.b.b. PremiumPremiumPremiumPremiumPremium
Life 19 5 2 0 3 1 5 1 25 5Non-life 1 0 34 8 31 7 22 5 26 5Reinsurance from foreign companies 50 12 78 19 43 10 18 4 36 8
c.c.c.c.c. Commission on BusinessCommission on BusinessCommission on BusinessCommission on BusinessCommission on Business received from foreign companies received from foreign companies received from foreign companies received from foreign companies received from foreign companies 5 1 15 4 2 0 7 2 14 3
d.d.d.d.d. OthersOthersOthersOthersOthers 132 38 72 17 93 21 68 15 68 14 (includes settlement of claims(includes settlement of claims(includes settlement of claims(includes settlement of claims(includes settlement of claims on account of insurance andon account of insurance andon account of insurance andon account of insurance andon account of insurance and re-insurance)re-insurance)re-insurance)re-insurance)re-insurance)
TOTAL-ATOTAL-ATOTAL-ATOTAL-ATOTAL-A 890890890890890 240240240240240 945945945945945 224224224224224 10041004100410041004 231231231231231 11761176117611761176 257257257257257 12791279127912791279 267267267267267
B.B.B.B.B. PaymentsPaymentsPaymentsPaymentsPayments
a.a.a.a.a. PremiumPremiumPremiumPremiumPremiumLife 4 1 2 0 3 1 1 0 3 1Non-life 197 54 93 34 45 10 43 9 123 26Reinsurance 333 89 192 46 328 76 344 75 780 163
b.b.b.b.b. Commission on BusinessCommission on BusinessCommission on BusinessCommission on BusinessCommission on Business 12 3 6 1 24 6 1 0 11 2
c.c.c.c.c. OthersOthersOthersOthersOthers 134 36 179 31 125 29 173 38 291 62 (includes settlement of claims(includes settlement of claims(includes settlement of claims(includes settlement of claims(includes settlement of claims on account of insurance and on account of insurance and on account of insurance and on account of insurance and on account of insurance and reinsurance reinsurance reinsurance reinsurance reinsurance
TOTAL-BTOTAL-BTOTAL-BTOTAL-BTOTAL-B 680680680680680 183183183183183 472472472472472 112112112112112 525525525525525 122122122122122 562562562562562 122122122122122 12081208120812081208 254254254254254Insurance Net (A-B)Insurance Net (A-B)Insurance Net (A-B)Insurance Net (A-B)Insurance Net (A-B) 210210210210210 5757575757 473473473473473 112112112112112 479479479479479 109109109109109 614614614614614 135135135135135 7171717171 1313131313
Sources: Reserve Bank of India Bulletin, May 2003, January 2001, April 1999Monograph on India’s Balance of Payments, July 1993
41B
alance of Paym
ents

Balance of P
ayments
42
Appendix 2(Di): Investment Income Account : 1956-57 to 1996-97Appendix 2(Di): Investment Income Account : 1956-57 to 1996-97Appendix 2(Di): Investment Income Account : 1956-57 to 1996-97Appendix 2(Di): Investment Income Account : 1956-57 to 1996-97Appendix 2(Di): Investment Income Account : 1956-57 to 1996-97
Item 1956-57 1957-58 1958-59 1959-60 1960-61 1961-62 1962-63 1963-64 1964-65 1965-66 1966-67 1967-68 1968-69 1969-70
1 2 3 4 5 6 7 8 9 10 11 12 13 14
ReceiptsReceiptsReceiptsReceiptsReceipts 1 Current profits .......... .......... .......... .......... .......... 0.9 1 0.8 1 0.7 0.9 0.9 0.8 0.7 2 Dividends of foreign government .......... .......... .......... .......... .......... 0.5 0.5 0.4 0.5 0.5 1.1 1 0.7 0.6
securities held by residents 3 Interest on foreign government .......... .......... .......... .......... .......... 8.2 6.7 7.3 7.4 6.5 14.2 15.1 21 29.7
securities held by residents 4 Interest on (non-banking) .......... .......... .......... .......... .......... ----- ----- ----- 0.3 0.2 0.2 0.4 0.3 0.3
private claims on non-residents 5 Interest on loans extended to non-residents .......... .......... .......... .......... .......... ----- ----- ----- ----- - ----- ----- ----- -----
by official and semi-official institutions 6 Interest on overdrafts, loans, extended to .......... .......... .......... .......... .......... 0.1 0.1 0.2 0.3 0.3 0.3 0.3 0.2 0.1
non-resident banks and on balances held abroad by banks in India
7 Interest on holdings of SDRs ----- ----- ----- ----- ----- ----- ----- ----- - - - - - - 8 Taxes and tax refunds on profits, .......... .......... .......... .......... .......... 1.4 1.2 0.8 1.1 1.6 0.8 1.4 1.2 1.4
dividends and interest 9 Income on real estate .......... .......... .......... .......... .......... - - - - 0.2 - - - - 10 Others .......... .......... .......... .......... .......... 1.1 1.3 1.4 0.8 0.9 0.8 0.9 1.2 1.1
AAAAA TotalTotalTotalTotalTotal 32.832.832.832.832.8 23.323.323.323.323.3 16.316.316.316.316.3 1414141414 14.214.214.214.214.2 12.212.212.212.212.2 10.810.810.810.810.8 10.910.910.910.910.9 11.411.411.411.411.4 10.910.910.910.910.9 18.318.318.318.318.3 2020202020 25.425.425.425.425.4 33.933.933.933.933.9of which:Private investment income receipts 6.4 7.1 7.4 4.8 4.6 4.1 4.2 4 4.2 4.5 4.2 4.9 4.4 4.3Government investment income receipts 26.4 16.2 8.9 9.2 9.6 8.1 6.6 6.9 7.2 6.4 14.1 15.1 21 29.6PaymentsPaymentsPaymentsPaymentsPayments
1 Current profits 9 11.8 11.5 10.8 12.2 10.3 10.1 7.3 9.8 9.8 15.5 8.9 8 8.7 2 Dividends of foreign controlled companies* 7.1 8.8 8.3 11.7 12.4 18.5 20.8 18.8 18.1 17.2 24.7 29.3 25.2 27.6 3 Dividends of non-controlled companies .......... .......... .......... .......... .......... .......... ----- ----- 3.9 2.2 4.1 3.4 4.8 4.1 4 Interest on government securities .......... .......... .......... .......... .......... .......... ----- ----- 0.2 0.2 0.3 0.1 0.2 0.1
and obligations held by non-residents 5 Interest onobligations of private .......... .......... .......... .......... .......... .......... ----- ----- 0.5 0.5 1.8 2.5 2.6 4.9
individuals institutions other than banking institutions
6 Interest on long-term loans received 6.7 7.1 14.3 23.3 34.3 47.2 57.9 73.2 77.4 94.4 150.1 169.8 184.8 189.8 from non-residents including international institutions by official and private sectors**Of which:Interest on long-term loans received from foreign governments and international institutions by: (i) Official sector 4 4.5 9.1 17.1 26.7 43.1 53.4 62.4 72 86 135.3 154.2 167.6 176.3 (ii) Private sector 2.7 2.6 5.2 6.2 7.6 4.1 4.5 10.8 5.4 8.4 14.8 15.6 17.2 13.5
7 Interest on loans and overdrafts .. .. .. .. .. .. - - 0.3 0.5 1 1.3 0.4 1 obtained by banking institutions
8 Interest on balances held in India by .. .. .. .. .. .. - - 6.1 7.2 11.2 10.6 11.4 9.6 non-resident banks and official institutions
9 Charges on utitlisation of SDRs - - - - - - - - - - - - - - 10 Taxes and tax refunds on profits, .. .. .. .. .. .. - - 2.4 2.3 1.2 1.5 2.1 2.4
dividends and interest 11 Retained earnings of foreign .. .. .. .. .. .. - - - - - - 17 29
controlled rupee companies 12 Income on real estate owned by foreigners .. .. .. .. .. .. - - 0.4 0.1 0.5 - - - 13 Others 1.1 0.8 2.1 1.5 3 4.4 5.6 3.6 0.6 0.7 0.5 3.2 1.5 2.7
BBBBB Total*Total*Total*Total*Total* 23.923.923.923.923.9 28.528.528.528.528.5 36.236.236.236.236.2 47.347.347.347.347.3 61.961.961.961.961.9 80.480.480.480.480.4 94.494.494.494.494.4 102.9102.9102.9102.9102.9 119.7119.7119.7119.7119.7 135.1135.1135.1135.1135.1 210.9210.9210.9210.9210.9 230.6230.6230.6230.6230.6 258258258258258 279.9279.9279.9279.9279.9of whichPrivate investment income payments 19.9 24 27.1 30.2 35.2 37.3 40.9 40.5 43.5 42.3 64.7 66.1 79.6 94.1Government investment income payments 4 4.5 9.1 17.1 26.7 43.1 53.5 62.4 76.2 92.8 146.2 164.5 178.4 185.8Net (A-B)Net (A-B)Net (A-B)Net (A-B)Net (A-B) 8.98.98.98.98.9 -5.2-5.2-5.2-5.2-5.2 -19.9-19.9-19.9-19.9-19.9 -33.3-33.3-33.3-33.3-33.3 -47.7-47.7-47.7-47.7-47.7 -68.2-68.2-68.2-68.2-68.2 -83.6-83.6-83.6-83.6-83.6 -92-92-92-92-92 -108.3-108.3-108.3-108.3-108.3 -124.2-124.2-124.2-124.2-124.2 -192.6-192.6-192.6-192.6-192.6 -210.6-210.6-210.6-210.6-210.6 -232.6-232.6-232.6-232.6-232.6 -246-246-246-246-246
(Contd)

Appendix 2(Di): Investment Income Account : 1956-57 to 1996-97Appendix 2(Di): Investment Income Account : 1956-57 to 1996-97Appendix 2(Di): Investment Income Account : 1956-57 to 1996-97Appendix 2(Di): Investment Income Account : 1956-57 to 1996-97Appendix 2(Di): Investment Income Account : 1956-57 to 1996-97
Item 1970-71 1971-72 1972-73 1973-74 1974-75 1975-76 1976-77 1977-78 1978-79 1979-80 1980-81 1981-82 1982-83 1983-84
15 16 17 18 19 20 21 22 23 24 25 26 27 28
ReceiptsReceiptsReceiptsReceiptsReceipts 1 Current profits 0.5 1.3 1.1 0.6 1.2 3.7 4.8 1.8 2 1.7 2.7 2.7 2 0.9 2 Dividends of foreign government 0.4 0.5 0.9 0.5 1.1 0.7 1.1 1.3 0.3 0.3 0.3 0.4 0.6 0.9
securities held by residents 3 Interest on foreign government 44.2 28.9 23.9 32 80 91.2 150.7 192.3 304.3 522.1 674.2 595.1 353.9 392.9
securities held by residents 4 Interest on (non-banking) 0.8 1.7 0.1 0.1 0.1 0.3 0.6 0.2 - - 0.1 0.7 1.8 1.3
private claims on non-residents 5 Interest on loans extended to non-residents - 1.2 3 4.6 6.4 4.9 7 14.1 13.7 8.6 5.3 11.6 20.7 11.9
by official and semi-official institutions 6 Interest on overdrafts, loans, extended to 1.1 0.4 0.2 0.2 0.3 0.5 0.2 1.1 0.8 0.2 0.1 0.8 2.7 0.5
non-resident banks and on balances held abroad by banks in India
7 Interest on holdings of SDRs - - - 2.8 2.8 8 8.8 7.4 6 13.2 33.8 47.8 64.5 49.9 8 Taxes and tax refunds on profits, 1 1.5 0.7 1.2 2.2 1.5 0.9 1 2 1.2 1.4 2.1 13.1 0.8
dividends and interest 9 Income on real estate - 0.1 0.1 - - - - - 0.1 - 0.1 - 1 - 10 Others 1.1 1 1.2 2.1 3.5 8.4 1.6 2.9 2 2 5.6 4.3 4.7 3.4
AAAAA TotalTotalTotalTotalTotal 49.149.149.149.149.1 36.636.636.636.636.6 31.231.231.231.231.2 44.144.144.144.144.1 97.697.697.697.697.6 119.2119.2119.2119.2119.2 175.7175.7175.7175.7175.7 222.1222.1222.1222.1222.1 331.2331.2331.2331.2331.2 549.3549.3549.3549.3549.3 723.6723.6723.6723.6723.6 665.5665.5665.5665.5665.5 465465465465465 462.5462.5462.5462.5462.5of which:Private investment income receipts 5 6.4 6.5 7 12.1 18.1 13.8 12.7 12 7.8 12.9 20 15.1 8Government investment income receipts 44.1 30.2 24.7 37.1 85.5 101.1 161.9 209.4 319.2 541.5 710.7 645.5 449.9 454.5PaymentsPaymentsPaymentsPaymentsPayments
1 Current profits 9.7 7.2 7.6 14 4.2 11.5 7 6.3 4.9 2.5 5.3 6.4 18.1 15.8 2 Dividends of foreign controlled companies* 37.4 33.8 34.4 32.3 15.8 21.2 41.2 48.4 43 32 30.3 33.1 25.8 33.5 3 Dividends of non-controlled companies 4.8 5.1 4.7 5.2 2.5 3.7 7.3 19.5 11.4 18.9 25.6 25.8 44.5 28.6 4 Interest on government securities 0.3 0.3 0.1 - 0.1 0.6 1.4 3.6 3.3 0.6 - 5.1 0.5 0.4
and obligations held by non-residents 5 Interest onobligations of private 1.7 1.8 0.6 1.1 2.2 2 2.1 2.1 4.7 3.3 2 0.6 10.5 15.7
individuals institutions other than banking institutions
6 Interest on long-term loans received 203.8 207.3 230.3 243.6 234.7 217.3 244.7 275.5 276.4 282 244.1 279.3 395.3 463 from non-residents including international institutions by official and private sectors**Of which:Interest on long-term loans received from foreign governments and international institutions by: (i) Official sector 186.1 183.6 203.5 216.4 185.2 180.8 208 243.3 236.6 248.2 205.5 237.2 314.4 381.1 (ii) Private sector 17.7 23.7 26.8 27.2 49.5 36.5 36.7 32.2 39.8 33.8 38.6 42.1 80.9 81.9
7 Interest on loans and overdrafts 1.2 0.9 0.7 0.5 1.1 1.4 2.8 2.9 19.9 29.5 30.1 33.6 39.3 54.7 obtained by banking institutions
8 Interest on balances held in India by 10.4 10.1 9.6 11.6 0.3 0.8 1.3 0.7 0.7 0.2 0.7 0.2 0.6 0.9 non-resident banks and official institutions
9 Charges on utitlisation of SDRs - 1.8 - 3.7 7.5 39 13.2 12.8 12.3 18.5 45.7 77.9 239.2 383.6 10 Taxes and tax refunds on profits, 2.6 2.1 2.2 2.1 2.7 1.2 5.8 3.3 18.9 2.3 2.4 4 3 6.5
dividends and interest 11 Retained earnings of foreign 28.4 32.5 33.6 47.2 73.4 43.3 37.1 54.3 57.5 63.1 78.2 .. .. ..
controlled rupee companies 12 Income on real estate owned by foreigners - - - 0.1 - - 0.3 - - 0.1 0.1 0.1 - - 13 Others 3 2.8 5.3 0.9 1.2 1 0.4 4.1 5.4 7.2 2.7 8.8 11.2 3.6
BBBBB Total*Total*Total*Total*Total* 303.3303.3303.3303.3303.3 305.7305.7305.7305.7305.7 329.1329.1329.1329.1329.1 362.3362.3362.3362.3362.3 345.7345.7345.7345.7345.7 343343343343343 364.6364.6364.6364.6364.6 433.5433.5433.5433.5433.5 458.4458.4458.4458.4458.4 460.2460.2460.2460.2460.2 467.2467.2467.2467.2467.2 474.9474.9474.9474.9474.9 788788788788788 1006.31006.31006.31006.31006.3of whichPrivate investment income payments 107 110.1 115.9 130.1 153.4 121.7 141.9 174.9 208 193 214.7 154.8 233.8 250.2Government investment income payments 196.3 195.6 213.2 232.2 192.3 221.3 222.7 258.6 250.4 267.2 252.5 320.1 554.2 756.1Net (A-B)Net (A-B)Net (A-B)Net (A-B)Net (A-B) -254.2-254.2-254.2-254.2-254.2 -269.1-269.1-269.1-269.1-269.1 -297.9-297.9-297.9-297.9-297.9 -318.2-318.2-318.2-318.2-318.2 -248.1-248.1-248.1-248.1-248.1 -223.8-223.8-223.8-223.8-223.8 -188.9-188.9-188.9-188.9-188.9 -211.4-211.4-211.4-211.4-211.4 -127.2-127.2-127.2-127.2-127.2 89.189.189.189.189.1 256.4256.4256.4256.4256.4 190.6190.6190.6190.6190.6 -323-323-323-323-323 -543.8-543.8-543.8-543.8-543.8
(Contd)
43B
alance of Paym
ents

Balance of P
ayments
44
Appendix 2(Di): Investment Income Account : 1956-57 to 1996-97 Appendix 2(Di): Investment Income Account : 1956-57 to 1996-97 Appendix 2(Di): Investment Income Account : 1956-57 to 1996-97 Appendix 2(Di): Investment Income Account : 1956-57 to 1996-97 Appendix 2(Di): Investment Income Account : 1956-57 to 1996-97 (Concluded)
Item 1984-85 1985-86 1986-87 1987-88 1988-89 1989-90 1990-91 1991-92 1992-93 1993-94 1994-95 1995-96 1996-97
29 30 31 32 33 34 35 36 37 38 39 40 41
ReceiptsReceiptsReceiptsReceiptsReceipts 1 Current profits 1.5 3.2 1.4 0.4 1.4 9 2.1 1.5 0.2 1.3 61.0 82.1 107.6 2 Dividends of foreign government 0.2 1.5 0.9 1.6 1.4 2.8 2.8 3.7 11.2 4.4 6.4 16.0 19.6
securities held by residents 3 Interest on foreign government 521.3 571.1 577.5 5.2 481.6 514.0 476.8 390.3 842.8 1069.7 2604.0 4518.3 3329.8
securities held by residents 4 Interest on (non-banking) 3.4 1.3 1.2 1.8 4.0 3.9 4.5 4.0 22.7 5.9 6.1 20.0 95.0
private claims on non-residents 5 Interest on loans extended to non-residents 2.8 2.7 7.4 24.0 15.5 16.1 64.6 69.6 51.9 44.4 0.2 0.9 5.6
by official and semi-official institutions 6 Interest on overdrafts, loans, extended to 0.8 0.5 0.4 0.5 1.6 7.2 4.7 5.5 4.0 7.7 0.4 5.0 31.0
non-resident banks and on balances held abroad by banks in India
7 Interest on holdings of SDRs 53.7 37.4 37.0 36.1 33.6 58.3 67.9 50.8 45.5 82.6 7.9 13.7 7.1 8 Taxes and tax refunds on profits, 1.0 0.6 1.0 2.2 3.7 3.7 2.1 6.5 2.4 6.5 38.4 22.3 121.9
dividends and interest 9 Income on real estate - 0.1 0.1 - - - 0 0 0 0 0 0 2.0 10 Others 1.2 50.7* 13.6 10.0 59.9 72.8 35.0 9.9 23.2 15.1 58.1 53.7 91.4
AAAAA TotalTotalTotalTotalTotal 585.9585.9585.9585.9585.9 669.1669.1669.1669.1669.1 640.5640.5640.5640.5640.5 81.881.881.881.881.8 602.7602.7602.7602.7602.7 687.8687.8687.8687.8687.8 660.5660.5660.5660.5660.5 541.8541.8541.8541.8541.8 1003.91003.91003.91003.91003.9 1237.61237.61237.61237.61237.6 2782.52782.52782.52782.52782.5 4732.04732.04732.04732.04732.0 3811.03811.03811.03811.03811.0of which:Private investment income receipts 5.0 19.2 170.9 15.3 18.3 34.2 .......... .......... .......... .......... .......... .......... ..........Government investment income receipts 580.9 649.9 469.6 563.3 584.4 653.6 .......... .......... .......... .......... .......... .......... ..........PaymentsPaymentsPaymentsPaymentsPayments
1 Current profits 12.5 10.6 7.8 9.2 40.8 39.1 34.8 51.1 40.0 18.9 3.4 25.4 16 2 Dividends of foreign controlled companies* 33.9 32.7 40.2 31.8 34.6 32.0 70.6 103.4 78.6 149.8 267.7 504.7 102.1 3 Dividends of non-controlled companies 44.3 42.6 45.2 60.2 90.9 109.5 146.5 166.2 266.7 129.2 304.5 377.2 834.8 4 Interest on government securities 36.5 21.1 6.1 2.7 0.8 2.6 4.0 6.6 5.8 12.4 5.1 20.2 33.4
and obligations held by non-residents 5 Interest onobligations of private 102.4 23.9 73.3 178 145.2 160.6 212.7 542.7 218.2 227.9 465.2 1126.9 708.0
individuals institutions other than banking institutions
6 Interest on long-term loans received 725.5 872.9 1067.8 1504.9 2152.3 3102.8 4555.4 5562.3 6994.2 7113.3 7711.2 7376.1 6927.2 from non-residents including international institutions by official and private sectors**Of which:Interest on long-term loans received from foreign governments and international institutions by: (i) Official sector 601.4 644.9 744.5 1164.9 1763.0 2478.4 .......... .......... .......... .......... .......... .......... .......... (ii) Private sector 124.1 228.0 323.3 340.0 389.3 624.4 .......... .......... .......... .......... .......... .......... ..........
7 Interest on loans and overdrafts 85.7 66.3 170.2 56.9 151.8 76.1 74.3 163.6 175.5 32.6 343.9 187.8 78.9 obtained by banking institutions
8 Interest on balances held in India by 4.5 13.7 1.2 12.0 31.9 3.4 10.1 0.6 1.4 1.8 53.2 111.5 156.4 non-resident banks and official institutions
9 Charges on utitlisation of SDRs 508.7 499.1 464.7 443.7 408.0 433.2 402.1 783.5 885.5 919.5 834.8 634.4 472.2 10 Taxes and tax refunds on profits, 3.2 3.9 7.5 4.4 2.6 7.6 21.1 14.8 17.2 14.8 7.5 35.5 38.8
dividends and interest 11 Retained earnings of foreign .. .. .. .. .......... .......... .......... .......... .......... .......... .......... .......... ..........
controlled rupee companies 12 Income on real estate owned by foreigners - 2.5 - - 0.1 1.5 0 0 0 0.4 1.5 3.2 0.4 13 Others 24.8 29.7 6.0 8.4 21.8 35.6 13.1 22.6 21.3 55.8 314.5 1372.7 318.5
BBBBB Total*Total*Total*Total*Total* 1582.01582.01582.01582.01582.0 1619.01619.01619.01619.01619.0 1890.01890.01890.01890.01890.0 2312.22312.22312.22312.22312.2 3080.83080.83080.83080.83080.8 -5562.4-5562.4-5562.4-5562.4-5562.4 7392.97392.97392.97392.97392.9 9938.59938.59938.59938.59938.5 11506.711506.711506.711506.711506.7 11496.411496.411496.411496.411496.4 13554.513554.513554.513554.513554.5 15448.515448.515448.515448.515448.5 15579.515579.515579.515579.515579.5of whichPrivate investment income payments 685.1 546.0 673.8 724.3 903.1 1073.4 .......... .......... .......... .......... .......... .......... ..........Government investment income payments 896.9 1073.0 1216.2 1587.9 2177.7 2930.6 .......... .......... .......... .......... .......... .......... ..........
Net (A-B)Net (A-B)Net (A-B)Net (A-B)Net (A-B) -996.1-996.1-996.1-996.1-996.1 -949.9-949.9-949.9-949.9-949.9 -1249.5-1249.5-1249.5-1249.5-1249.5 -2230.4-2230.4-2230.4-2230.4-2230.4 -2478.1-2478.1-2478.1-2478.1-2478.1 -4874.6-4874.6-4874.6-4874.6-4874.6 -6732.4-6732.4-6732.4-6732.4-6732.4 -9396.7-9396.7-9396.7-9396.7-9396.7 -10502.8-10502.8-10502.8-10502.8-10502.8 -10258.8-10258.8-10258.8-10258.8-10258.8 -10772.0-10772.0-10772.0-10772.0-10772.0 -10716.5-10716.5-10716.5-10716.5-10716.5 -11768.5-11768.5-11768.5-11768.5-11768.5
* Total figures post 1989-90 include certain items elaborated in RBI Bulletin, April 1999. Hence the sum will not tally.@: Upto 1963-64 this item includes dividends of non-controlled companies.:**:Interest Payments in 1961 include for U.K. India credit for oil-pipe line under private account.:*: include an interest subsidy of Rs 44.5 crore received from IMF.Note : Data do not include interest on Foreign Currency (Non-Residents) Accounts scheme since its inception in 1975.Sources: Reserve Bank of India Bulletin, May 2003, January 2001, April 1999
Monograph on India’s Balance of Payments, July 1993
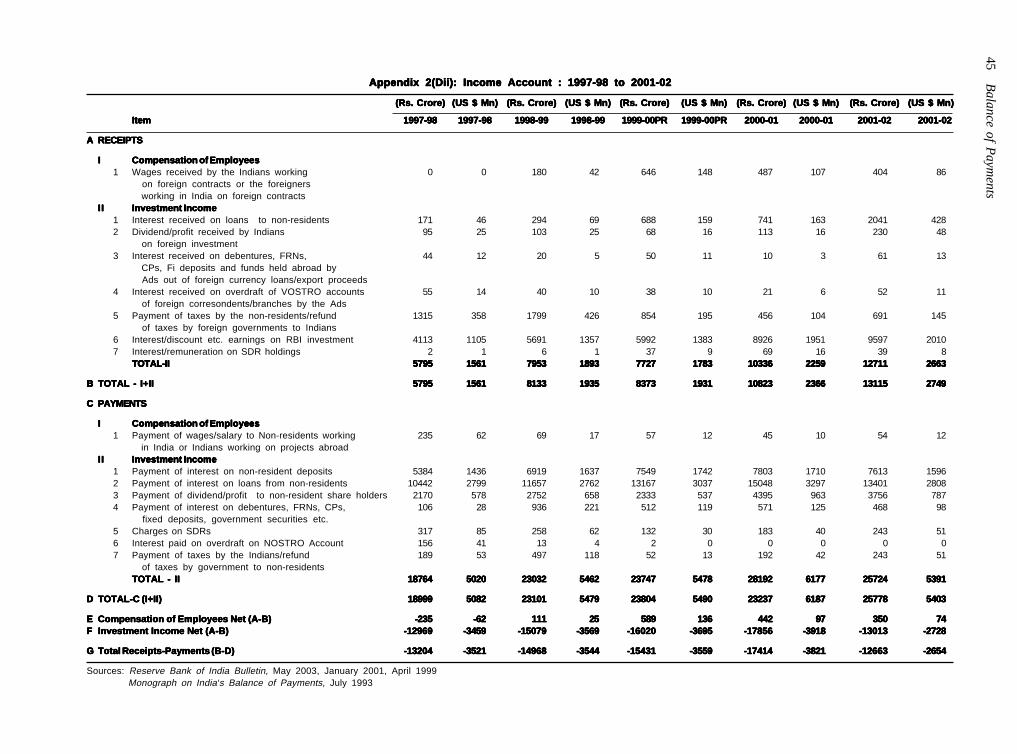
45B
alance of Paym
ents
Appendix 2(Dii): Income Account : 1997-98 to 2001-02Appendix 2(Dii): Income Account : 1997-98 to 2001-02Appendix 2(Dii): Income Account : 1997-98 to 2001-02Appendix 2(Dii): Income Account : 1997-98 to 2001-02Appendix 2(Dii): Income Account : 1997-98 to 2001-02
(Rs. Crore)(Rs. Crore)(Rs. Crore)(Rs. Crore)(Rs. Crore) (US $ Mn)(US $ Mn)(US $ Mn)(US $ Mn)(US $ Mn) (Rs. Crore)(Rs. Crore)(Rs. Crore)(Rs. Crore)(Rs. Crore) (US $ Mn)(US $ Mn)(US $ Mn)(US $ Mn)(US $ Mn) (Rs. Crore)(Rs. Crore)(Rs. Crore)(Rs. Crore)(Rs. Crore) (US $ Mn)(US $ Mn)(US $ Mn)(US $ Mn)(US $ Mn) (Rs. Crore)(Rs. Crore)(Rs. Crore)(Rs. Crore)(Rs. Crore) (US $ Mn)(US $ Mn)(US $ Mn)(US $ Mn)(US $ Mn) (Rs. Crore)(Rs. Crore)(Rs. Crore)(Rs. Crore)(Rs. Crore) (US $ Mn)(US $ Mn)(US $ Mn)(US $ Mn)(US $ Mn)
ItemItemItemItemItem 1997-981997-981997-981997-981997-98 1997-981997-981997-981997-981997-98 1998-991998-991998-991998-991998-99 1998-991998-991998-991998-991998-99 1999-00PR1999-00PR1999-00PR1999-00PR1999-00PR 1999-00PR1999-00PR1999-00PR1999-00PR1999-00PR 2000-012000-012000-012000-012000-01 2000-012000-012000-012000-012000-01 2001-022001-022001-022001-022001-02 2001-022001-022001-022001-022001-02
AAAAA RECEIPTSRECEIPTSRECEIPTSRECEIPTSRECEIPTS
IIIII Compensation of EmployeesCompensation of EmployeesCompensation of EmployeesCompensation of EmployeesCompensation of Employees1 Wages received by the Indians working 0 0 180 42 646 148 487 107 404 86
on foreign contracts or the foreigners working in India on foreign contracts
IIIIIIIIII Investment IncomeInvestment IncomeInvestment IncomeInvestment IncomeInvestment Income1 Interest received on loans to non-residents 171 46 294 69 688 159 741 163 2041 4282 Dividend/profit received by Indians 95 25 103 25 68 16 113 16 230 48
on foreign investment3 Interest received on debentures, FRNs, 44 12 20 5 50 11 10 3 61 13
CPs, Fi deposits and funds held abroad by Ads out of foreign currency loans/export proceeds
4 Interest received on overdraft of VOSTRO accounts 55 14 40 10 38 10 21 6 52 11 of foreign corresondents/branches by the Ads
5 Payment of taxes by the non-residents/refund 1315 358 1799 426 854 195 456 104 691 145 of taxes by foreign governments to Indians
6 Interest/discount etc. earnings on RBI investment 4113 1105 5691 1357 5992 1383 8926 1951 9597 20107 Interest/remuneration on SDR holdings 2 1 6 1 37 9 69 16 39 8
TOTAL-IITOTAL-IITOTAL-IITOTAL-IITOTAL-II 57955795579557955795 15611561156115611561 79537953795379537953 18931893189318931893 77277727772777277727 17831783178317831783 1033610336103361033610336 22592259225922592259 1271112711127111271112711 26632663266326632663
BBBBB TOTAL - I+IITOTAL - I+IITOTAL - I+IITOTAL - I+IITOTAL - I+II 57955795579557955795 15611561156115611561 81338133813381338133 19351935193519351935 83738373837383738373 19311931193119311931 1082310823108231082310823 23662366236623662366 1311513115131151311513115 27492749274927492749
CCCCC PAYMENTSPAYMENTSPAYMENTSPAYMENTSPAYMENTS
IIIII Compensation of EmployeesCompensation of EmployeesCompensation of EmployeesCompensation of EmployeesCompensation of Employees1 Payment of wages/salary to Non-residents working 235 62 69 17 57 12 45 10 54 12
in India or Indians working on projects abroadIIIIIIIIII Investment IncomeInvestment IncomeInvestment IncomeInvestment IncomeInvestment Income
1 Payment of interest on non-resident deposits 5384 1436 6919 1637 7549 1742 7803 1710 7613 15962 Payment of interest on loans from non-residents 10442 2799 11657 2762 13167 3037 15048 3297 13401 28083 Payment of dividend/profit to non-resident share holders 2170 578 2752 658 2333 537 4395 963 3756 7874 Payment of interest on debentures, FRNs, CPs, 106 28 936 221 512 119 571 125 468 98
fixed deposits, government securities etc.5 Charges on SDRs 317 85 258 62 132 30 183 40 243 516 Interest paid on overdraft on NOSTRO Account 156 41 13 4 2 0 0 0 0 07 Payment of taxes by the Indians/refund 189 53 497 118 52 13 192 42 243 51
of taxes by government to non-residentsTOTAL - IITOTAL - IITOTAL - IITOTAL - IITOTAL - II 1876418764187641876418764 50205020502050205020 2303223032230322303223032 54625462546254625462 2374723747237472374723747 54785478547854785478 2819228192281922819228192 61776177617761776177 2572425724257242572425724 53915391539153915391
DDDDD TOTAL-C (I+II)TOTAL-C (I+II)TOTAL-C (I+II)TOTAL-C (I+II)TOTAL-C (I+II) 1899918999189991899918999 50825082508250825082 2310123101231012310123101 54795479547954795479 2380423804238042380423804 54905490549054905490 2323723237232372323723237 61876187618761876187 2577825778257782577825778 54035403540354035403
EEEEE Compensation of Employees Net (A-B)Compensation of Employees Net (A-B)Compensation of Employees Net (A-B)Compensation of Employees Net (A-B)Compensation of Employees Net (A-B) -235-235-235-235-235 -62-62-62-62-62 111111111111111 2525252525 589589589589589 136136136136136 442442442442442 9797979797 350350350350350 7474747474FFFFF Investment Income Net (A-B)Investment Income Net (A-B)Investment Income Net (A-B)Investment Income Net (A-B)Investment Income Net (A-B) -12969-12969-12969-12969-12969 -3459-3459-3459-3459-3459 -15079-15079-15079-15079-15079 -3569-3569-3569-3569-3569 -16020-16020-16020-16020-16020 -3695-3695-3695-3695-3695 -17856-17856-17856-17856-17856 -3918-3918-3918-3918-3918 -13013-13013-13013-13013-13013 -2728-2728-2728-2728-2728
GGGGG Total Receipts-Payments (B-D)Total Receipts-Payments (B-D)Total Receipts-Payments (B-D)Total Receipts-Payments (B-D)Total Receipts-Payments (B-D) -13204-13204-13204-13204-13204 -3521-3521-3521-3521-3521 -14968-14968-14968-14968-14968 -3544-3544-3544-3544-3544 -15431-15431-15431-15431-15431 -3559-3559-3559-3559-3559 -17414-17414-17414-17414-17414 -3821-3821-3821-3821-3821 -12663-12663-12663-12663-12663 -2654-2654-2654-2654-2654
Sources: Reserve Bank of India Bulletin, May 2003, January 2001, April 1999Monograph on India's Balance of Payments, July 1993

Balance of P
ayments
46
Appendix 2(Ei): Government not included elsewhere Account : From 1956-57 to 1989-90Appendix 2(Ei): Government not included elsewhere Account : From 1956-57 to 1989-90Appendix 2(Ei): Government not included elsewhere Account : From 1956-57 to 1989-90Appendix 2(Ei): Government not included elsewhere Account : From 1956-57 to 1989-90Appendix 2(Ei): Government not included elsewhere Account : From 1956-57 to 1989-90
Item 1956-57 1957-58 1958-59 1959-60 1960-61 1961-62 1962-63 1963-64 1964-65 1965-66 1966-67 1967-68 1968-69 1969-70 1970-71 1971-72 1972-73
1 2 3 4 5 6 7 8 9 10 11 12 13 14 15 16 17
ReceiptsReceiptsReceiptsReceiptsReceipts1 Maintenance of foreign embassies 15 7.8 16.3 26.1 20 14 19.8 30.3 57.1 40.1 71.3 67.7 36.8 22.1 23.6 22.1 25.1
and diplomatic missions in India including U.S. embassy expenditure out of PL 480 funds
2 Maintenance of international and ----- ----- ----- ----- ----- ----- ----- ----- ----- 0.4 1.3 0.2 0.5 1.3 0.9 1.3 2.1 regional institutions in India
3 PL 480 freight refund* 2 7.4 15.6 14.6 24.1 9.7 17.8 28.3 33.2 ----- ----- ----- ----- ----- ----- ----- -----4 Others 6.7 9.3 7.1 8.6 6.9 5.8 12.5 10.9 5.9 5 9 12.7 6.1 3.5 5.3 5.5 3.6
AAAAA TotalTotalTotalTotalTotal 23.723.723.723.723.7 24.524.524.524.524.5 3939393939 49.349.349.349.349.3 5151515151 29.529.529.529.529.5 50.150.150.150.150.1 69.569.569.569.569.5 96.296.296.296.296.2 45.545.545.545.545.5 81.681.681.681.681.6 80.680.680.680.680.6 43.443.443.443.443.4 26.926.926.926.926.9 29.829.829.829.829.8 28.928.928.928.928.9 30.830.830.830.830.8PaymentsPaymentsPaymentsPaymentsPayments1 Maintenamce of Indian embassies 7.2 7.1 7 5.2 7.3 8.2 7.4 9.8 10.9 11.1 19.3 14.5 14.6 16.6 14.1 16.1 13.6
and diplomatic missions abroad2 Contribution to Indus Basin - - - - 8.3 8.3 8.3 8.3 - - - - ----- ----- ----- ----- -----
Development Fund**3 Others 5.5 6.8 7.5 7.2 5.7 7.7 9.5 6.1 4 4.5 3.4 10.1 6.5 7.1 9 8 9.1
BBBBB TotalTotalTotalTotalTotal 12.712.712.712.712.7 13.913.913.913.913.9 14.514.514.514.514.5 12.412.412.412.412.4 21.321.321.321.321.3 24.224.224.224.224.2 25.225.225.225.225.2 24.224.224.224.224.2 14.914.914.914.914.9 15.615.615.615.615.6 22.722.722.722.722.7 24.624.624.624.624.6 21.121.121.121.121.1 23.723.723.723.723.7 23.123.123.123.123.1 24.124.124.124.124.1 22.722.722.722.722.7Net (A-B)Net (A-B)Net (A-B)Net (A-B)Net (A-B) 1111111111 10.610.610.610.610.6 24.524.524.524.524.5 36.936.936.936.936.9 29.729.729.729.729.7 5.35.35.35.35.3 24.924.924.924.924.9 45.345.345.345.345.3 81.381.381.381.381.3 29.929.929.929.929.9 58.958.958.958.958.9 5656565656 22.322.322.322.322.3 3.23.23.23.23.2 6.76.76.76.76.7 4.84.84.84.84.8 8.18.18.18.18.1
Item 1973-74 1974-75 1975-76 1976-77 1977-78 1978-79 1979-80 1980-81 1981-82 1982-83 1983-84 1984-85 1985-86 1986-87 1987-88 1988-89 1989-90
18 19 20 21 22 23 24 25 26 27 28 29 30 31 32 33 34
ReceiptsReceiptsReceiptsReceiptsReceipts1 Maintenance of foreign embassies 25.9 51.9 70.6 57.9 64.7 82.4 73.5 72.1 111 92.9 118 93.8 114.9 106 81.8 65.7 31.2
and diplomatic missions in India including U.S. embassy expenditure out of PL 480 funds
2 Maintenance of international and 2.5 4.1 6.5 2.5 4.4 0.8 ----- 10.9 18 12.1 17.6 10.9 0.8 26.7 38.6 44.2 19.7 regional institutions in India
3 PL 480 freight refund* ----- ----- ----- ----- ----- ----- ----- ----- ----- ----- ----- ----- ----- ----- ----- ----- -----4 Others 4.5 18.6 27.2 23.1 8.7 7.2 12.9 4.5 1.6 1.5 3.1 ----- 0.7 0.1 0.4 8.1 1
AAAAA TotalTotalTotalTotalTotal 32.932.932.932.932.9 74.674.674.674.674.6 104.3104.3104.3104.3104.3 83.583.583.583.583.5 77.877.877.877.877.8 90.490.490.490.490.4 86.486.486.486.486.4 87.587.587.587.587.5 130.6130.6130.6130.6130.6 106.5106.5106.5106.5106.5 138.7138.7138.7138.7138.7 104.7104.7104.7104.7104.7 116.4116.4116.4116.4116.4 132.8132.8132.8132.8132.8 120.8120.8120.8120.8120.8 118118118118118 51.951.951.951.951.9PaymentsPaymentsPaymentsPaymentsPayments1 Maintenamce of Indian embassies 14.2 16.9 21.3 31.8 26.3 41.7 40.7 44.6 58 63.5 117.2 84.2 123.6 135.3 182.1 212.1 209.8
and diplomatic missions abroad2 Contribution to Indus Basin ----- ----- ----- ----- ----- ----- ----- ----- ----- ----- ----- ----- ----- ----- ----- ----- -----
Development Fund**3 Others 7.6 13.2 11.4 18.1 18.1 26 47.1 2.5 1.2 0.1 1.2 - 0.2 0.5 ----- 0.1 1.2
BBBBB TotalTotalTotalTotalTotal 21.821.821.821.821.8 30.130.130.130.130.1 32.732.732.732.732.7 49.949.949.949.949.9 44.444.444.444.444.4 67.767.767.767.767.7 87.887.887.887.887.8 47.147.147.147.147.1 59.259.259.259.259.2 63.663.663.663.663.6 118.4118.4118.4118.4118.4 84.284.284.284.284.2 123.8123.8123.8123.8123.8 135.8135.8135.8135.8135.8 182.1182.1182.1182.1182.1 212.2212.2212.2212.2212.2 211211211211211Net (A-B)Net (A-B)Net (A-B)Net (A-B)Net (A-B) 11.111.111.111.111.1 44.544.544.544.544.5 71.671.671.671.671.6 33.633.633.633.633.6 33.433.433.433.433.4 22.722.722.722.722.7 -1.4-1.4-1.4-1.4-1.4 40.440.440.440.440.4 71.471.471.471.471.4 42.942.942.942.942.9 20.320.320.320.320.3 20.520.520.520.520.5 -7.4-7.4-7.4-7.4-7.4 -3-3-3-3-3 -61.3-61.3-61.3-61.3-61.3 -94.2-94.2-94.2-94.2-94.2 -159.1-159.1-159.1-159.1-159.1
Notes :*: Represents freight on PL 480 imports initially borne by India but subsequently refunded by the U.S. authorities.:**; This is now shown under official transfer payments from 1964-65Sources: Reserve Bank of India Bulletin, May 2003, January 2001, April 1999
Monograph on India’s Balance of Payments, July 1993
(Contd. above)

47B
alance of Paym
ents
Appendix 2(Eii): Government not included elsewhere Account : 1990-98 to 2001-02Appendix 2(Eii): Government not included elsewhere Account : 1990-98 to 2001-02Appendix 2(Eii): Government not included elsewhere Account : 1990-98 to 2001-02Appendix 2(Eii): Government not included elsewhere Account : 1990-98 to 2001-02Appendix 2(Eii): Government not included elsewhere Account : 1990-98 to 2001-02
(Rs. Crore)(Rs. Crore)(Rs. Crore)(Rs. Crore)(Rs. Crore) (US $ Mn)(US $ Mn)(US $ Mn)(US $ Mn)(US $ Mn) (Rs. Crore)(Rs. Crore)(Rs. Crore)(Rs. Crore)(Rs. Crore) (US $ Mn)(US $ Mn)(US $ Mn)(US $ Mn)(US $ Mn) (Rs. Crore)(Rs. Crore)(Rs. Crore)(Rs. Crore)(Rs. Crore) (US $ Mn)(US $ Mn)(US $ Mn)(US $ Mn)(US $ Mn) (Rs. Crore)(Rs. Crore)(Rs. Crore)(Rs. Crore)(Rs. Crore) (US $ Mn)(US $ Mn)(US $ Mn)(US $ Mn)(US $ Mn) (Rs. Crore)(Rs. Crore)(Rs. Crore)(Rs. Crore)(Rs. Crore) (US $ Mn)(US $ Mn)(US $ Mn)(US $ Mn)(US $ Mn) (Rs. Crore)(Rs. Crore)(Rs. Crore)(Rs. Crore)(Rs. Crore) (US $ Mn)(US $ Mn)(US $ Mn)(US $ Mn)(US $ Mn)
1990-91 1991-92 1992-93 1993-94 1994-95 1995-96
A.A.A.A.A. ReceiptsReceiptsReceiptsReceiptsReceipts
a. Maintenance of foreign embassies 20.5 11.0 39.2 16.0 24.6 8.0 47.2 15.0 23.6 8.0 31.0 9.0 and diplomatic missions in India.b. Maintenance of international and 6.8 4.0 2.8 1.0 195.0 64.0 5.0 2.0 0.5 0.0 0.0 0.0 regional institutions in Indiac. Others 0.0 0.0 0.0 0.0 0.0 3.0 42.3 13.0 4.2 2.0 13.0 4.0
TOTAL-ATOTAL-ATOTAL-ATOTAL-ATOTAL-A 27.327.327.327.327.3 15.015.015.015.015.0 42.042.042.042.042.0 17.017.017.017.017.0 219.6219.6219.6219.6219.6 75.075.075.075.075.0 94.594.594.594.594.5 30.030.030.030.030.0 28.328.328.328.328.3 10.010.010.010.010.0 44.044.044.044.044.0 13.013.013.013.013.0
B.B.B.B.B. PaymentsPaymentsPaymentsPaymentsPayments
a. Maintenance of Indian embassies 310.7 173.0 286.1 116.0 261.0 85.0 383.3 122.0 410.9 131.0 569.8 170.0 and diplomatic missions abroadb. Remittances by foreign embassies .......... .......... .......... .......... .......... .......... .......... .......... .......... .......... .......... ..........
and missions in Indiac Others 0.5 0.0 6.4 3.0 44.2 14.0 97.3 31.0 107.5 34.0 154.3 48.0
TOTAL-BTOTAL-BTOTAL-BTOTAL-BTOTAL-B 311.2311.2311.2311.2311.2 173.0173.0173.0173.0173.0 292.5292.5292.5292.5292.5 119.0119.0119.0119.0119.0 305.2305.2305.2305.2305.2 99.099.099.099.099.0 480.6480.6480.6480.6480.6 153.0153.0153.0153.0153.0 518.4518.4518.4518.4518.4 165.0165.0165.0165.0165.0 724.1724.1724.1724.1724.1 218.0218.0218.0218.0218.0Gnie Net (A-B)Gnie Net (A-B)Gnie Net (A-B)Gnie Net (A-B)Gnie Net (A-B) -283.9-283.9-283.9-283.9-283.9 -158.0-158.0-158.0-158.0-158.0 -250.5-250.5-250.5-250.5-250.5 -102.0-102.0-102.0-102.0-102.0 -85.6-85.6-85.6-85.6-85.6 -24.0-24.0-24.0-24.0-24.0 -386.1-386.1-386.1-386.1-386.1 -123.0-123.0-123.0-123.0-123.0 -490.1-490.1-490.1-490.1-490.1 -155.0-155.0-155.0-155.0-155.0 -680.1-680.1-680.1-680.1-680.1 -205.0-205.0-205.0-205.0-205.0
(Rs. Crore)(Rs. Crore)(Rs. Crore)(Rs. Crore)(Rs. Crore) (US $ Mn)(US $ Mn)(US $ Mn)(US $ Mn)(US $ Mn) (Rs. Crore)(Rs. Crore)(Rs. Crore)(Rs. Crore)(Rs. Crore) (US $ Mn)(US $ Mn)(US $ Mn)(US $ Mn)(US $ Mn) (Rs. Crore)(Rs. Crore)(Rs. Crore)(Rs. Crore)(Rs. Crore) (US $ Mn)(US $ Mn)(US $ Mn)(US $ Mn)(US $ Mn) (Rs. Crore)(Rs. Crore)(Rs. Crore)(Rs. Crore)(Rs. Crore) (US $ Mn)(US $ Mn)(US $ Mn)(US $ Mn)(US $ Mn) (Rs. Crore)(Rs. Crore)(Rs. Crore)(Rs. Crore)(Rs. Crore) (US $ Mn)(US $ Mn)(US $ Mn)(US $ Mn)(US $ Mn) (Rs. Crore)(Rs. Crore)(Rs. Crore)(Rs. Crore)(Rs. Crore) (US $ Mn)(US $ Mn)(US $ Mn)(US $ Mn)(US $ Mn)
1996-97 1997-98 1998-99 1999-00PR 2000-01 2001-02
A.A.A.A.A. ReceiptsReceiptsReceiptsReceiptsReceipts
a. Maintenance of foreign embassies 75.6 21.0 457.0 125.0 749.0 178.0 887.0 205.0 1016.0 853.0 222.0 178.0 and diplomatic missions in India.
b. Maintenance of international and 0.0 0.0 581.0 151.0 1771.0 419.0 1636.0 377.0 1996.0 1382.0 435.0 291.0 regional institutions in India
c. Others 181.3 51.0
TOTAL-ATOTAL-ATOTAL-ATOTAL-ATOTAL-A 256.9256.9256.9256.9256.9 72.072.072.072.072.0 1038.01038.01038.01038.01038.0 276.0276.0276.0276.0276.0 2520.02520.02520.02520.02520.0 597.0597.0597.0597.0597.0 2523.02523.02523.02523.02523.0 582.0582.0582.0582.0582.0 3012.03012.03012.03012.03012.0 2235.02235.02235.02235.02235.0 657.0657.0657.0657.0657.0 469.0469.0469.0469.0469.0
B.B.B.B.B. PaymentsPaymentsPaymentsPaymentsPayments
a. Maintenance of Indian embassies 581.6 163.0 1227.0 293.0 1023.0 237.0 1232.0 956.0 270.0 201.0 270.0 201.0 and diplomatic missions abroad
b. Remittances by foreign embassies .......... .......... 79.0 21.0 132.0 32.0 144.0 33.0 325.0 337.0 71.0 71.0and missions in India
c Others 53.1 15.0
TOTAL-BTOTAL-BTOTAL-BTOTAL-BTOTAL-B 634.7634.7634.7634.7634.7 178.0178.0178.0178.0178.0 594.0594.0594.0594.0594.0 160.0160.0160.0160.0160.0 1359.01359.01359.01359.01359.0 325.0325.0325.0325.0325.0 1167.01167.01167.01167.01167.0 270.0270.0270.0270.0270.0 1557.01557.01557.01557.01557.0 1293.01293.01293.01293.01293.0 341.0341.0341.0341.0341.0 272.0272.0272.0272.0272.0Gnie Net (A-B)Gnie Net (A-B)Gnie Net (A-B)Gnie Net (A-B)Gnie Net (A-B) -377.8-377.8-377.8-377.8-377.8 -106.0-106.0-106.0-106.0-106.0 444.0444.0444.0444.0444.0 116.0116.0116.0116.0116.0 1161.01161.01161.01161.01161.0 272.0272.0272.0272.0272.0 1356.01356.01356.01356.01356.0 312.0312.0312.0312.0312.0 1455.01455.01455.01455.01455.0 942.0942.0942.0942.0942.0 316.0316.0316.0316.0316.0 197.0197.0197.0197.0197.0
Sources: Reserve Bank of India Bulletin, May 2003, January 2001, April 1999Monograph on India's Balance of Payments, July 1993
(Contd. above)

Balance of P
ayments
48
Appendix 2(Fi): Miscellaneous Account : From 1956-57 to 1989-90Appendix 2(Fi): Miscellaneous Account : From 1956-57 to 1989-90Appendix 2(Fi): Miscellaneous Account : From 1956-57 to 1989-90Appendix 2(Fi): Miscellaneous Account : From 1956-57 to 1989-90Appendix 2(Fi): Miscellaneous Account : From 1956-57 to 1989-90(Rupees, Crore)
Item 1956-57 1957-58 1958-59 1959-60 1960-61 1961-62 1962-63 1963-64 1964-65 1965-66 1966-67 1967-68 1968-69 1969-70 1970-71 1971-72 1972-731 2 3 4 5 6 7 8 9 10 11 12 13 14 15 16 17
A ReceiptsReceiptsReceiptsReceiptsReceipts 1 Technicians .......... .......... .......... .......... .......... .......... .......... .......... ----- 1 5 1.5 7.3 7.1 7.8 7.7 5.3 2 Professional Services 0.3 0.2 0.6 0.5 0.5 0.3 0.2 3.1 3.1 2.4 ----- ----- 0.1 0.4 0.3 0.3 0.8 3 Technical know-how .. .. .. .. .. .. .. .. ----- ----- ----- ----- 0.1 0.1 -2.4 0.2 0.4 4 Management fees, office expenses, 11.5 11.3 9.6 9.7 11.8 12.1 12.3 15.1 12.8 13.4 17.2 19.7 15.8 13.5 13.5 15.7 14.3
agency services, etc. 5 Underwriters’ commission .......... .......... .......... .......... .......... .......... .......... .......... ----- ----- ----- ----- ----- ----- ----- ----- ----- 6 Settlement on account of post, .......... .......... .......... .......... .......... .......... .......... .......... 0.9 0.7 1.5 2.2 3.2 2.3 1.6 1.6 1.5
telegraph, telephone and radio charges
7 Advertisement charges ----- ----- ----- ----- .......... .......... .......... .......... 0.2 0.1 0.2 0.2 0.3 0.2 0.3 0.1 0.1 8 Foreign Subscriptions to Indian .......... .......... .......... .......... .......... .......... .......... .......... 0.1 ----- 0.1 0.1 0.2 0.1 0.1 0.1 0.1
periodicals, magazines, etc. 9 Film rentals .......... .......... .......... .......... .......... .......... .......... .......... 0.1 ----- 0.1 0.4 0.2 0.1 0.3 0.2 0.110 Refunds and rebates on imports .......... .......... .......... .......... .......... .......... .......... .......... 0.5 0.8 0.6 1.0 0.6 0.4 0.2 0.3 0.411 Other refunds and rebates .......... .......... .......... .......... .......... .......... .......... .......... 0.4 0.2 0.4 0.2 1.0 0.6 0.8 0.2 0.312 Royalties .......... .......... .......... .......... .......... .......... .......... .......... ----- ----- ----- ----- 0.1 0.1 ----- 0.1 0.213 Rentals .......... .......... .......... .......... .......... .......... .......... .......... ----- ----- ----- ----- ----- ----- ----- ----- -----14 Oil companies’ miscellaneous .......... .......... .......... .......... .......... .......... .......... .......... 7.9 7.6 12.2 7.5 4.0 4.6 2.7 0.8 0.6
remmittance equivalents15 Proceeds of rupee travellers’ cheques .......... .......... .......... .......... .......... .......... .......... .......... ----- ----- ----- ----- ----- ----- ----- ----- -----
sold by non-resident banks16 Others 25.3 25.1 27.0 19.9 24.3 23.1 20.9 14.3 -2.6 -0.4 13.1 10.2 26.5 14.0 6.1 20.7 23.0
AAAAA TotalTotalTotalTotalTotal 37.137.137.137.137.1 36.636.636.636.636.6 37.237.237.237.237.2 30.130.130.130.130.1 36.636.636.636.636.6 35.535.535.535.535.5 33.433.433.433.433.4 32.532.532.532.532.5 23.423.423.423.423.4 25.825.825.825.825.8 50.450.450.450.450.4 43.043.043.043.043.0 59.459.459.459.459.4 43.543.543.543.543.5 31.331.331.331.331.3 48.048.048.048.048.0 47.147.147.147.147.1BBBBB PaymentsPaymentsPaymentsPaymentsPayments
1 Technicians .......... .......... .......... .......... .......... .......... .......... .......... 12.6 13.3 16.8 15.1 12.1 11.4 8.4 8.3 8.2 2 Other professional Services 5.5 4.7 4.4 5.8 5.5 9.6 13 12.7 1.9 2.1 2.6 2.8 2.5 3.0 2.2 3.9 2.7 3 Technical know-how .......... .......... .......... .......... .......... .......... .......... .......... 3.6 7.0 10.4 14.7 16.0 12.8 20.6 13.9 11.3 4 Management fees, office expenses, 9.6 10.5 9.2 10.0 9.1 10.0 9.6 12.7 10.3 12.0 15.8 16.5 16.2 18.2 21.3 26.9 26.0
agency services, etc. 5 Newspaper correspondents .......... .......... .......... .......... .......... .......... .......... .......... 0.2 0.2 0.3 0.3 0.3 0.3 0.3 0.4 0.36 Underwriters’ commission .......... .......... .......... .......... .......... .......... .......... .......... ----- ----- ----- ----- ----- ----- ----- 0.1 -----
7 Remittances against non-fulfilment .......... .......... .......... .......... .......... .......... .......... .......... ----- 0.1 0.3 0.2 0.1 0.2 ----- 0.1 ----- of contracts
8 Settlement on account of post, .......... .......... .......... .......... .......... .......... .......... .......... 0.1 0.2 0.3 0.3 0.2 0.4 0.4 0.4 0.3 telegraph, telephone and radio charges
9 Advertisement charges .......... .......... .......... .......... .......... .......... .......... .......... 0.4 0.4 0.4 0.5 0.4 0.5 0.7 1.7 0.810 Indian Subscriptions to Foreign .......... .......... .......... .......... .......... .......... .......... .......... 1.6 1.8 2.7 3.1 3.5 4.5 4.6 5.3 5.6
periodicals, magazines, etc.11 Film rentals .......... .......... .......... .......... .......... .......... .......... .......... 0.3 0.2 0.3 0.6 0.3 0.3 0.3 0.1 -12 Refunds and rebates on exports .......... .......... .......... .......... .......... .......... .......... .......... ----- ----- ----- ----- ----- 0.3 1.9 2.1 1.813 Other refunds and rebates .......... .......... .......... .......... .......... .......... .......... .......... 1.0 0.9 2.5 1.4 2.4 1.5 0.6 1.2 1.514 Royalties 1.2 0.9 1.3 1.8 2.5 2.4 3.6 4.6 4.4 2.9 5.1 4.3 4.8 5.8 5.2 5.9 7.315 Rentals .......... .......... .......... .......... .......... .......... .......... .......... ----- 0.3 0.1 0.1 0.2 ----- ----- ----- -----16 Oil companies’ miscellaneous .......... .......... .......... .......... .......... .......... .......... .......... 9.2 7.2 1.7 7.4 6.4 6.6 8.2 2.3 0.4
remmittable liabilities (not included elsewhere)
17 Others 7.3 9.2 13.6 11.1 17.5 16.7 18 16.5 0.2 0.8 2.3 ----- 1.8 1.2 3.8 6.4 16.0BBBBB TotalTotalTotalTotalTotal 23.623.623.623.623.6 25.325.325.325.325.3 28.528.528.528.528.5 28.728.728.728.728.7 34.634.634.634.634.6 38.738.738.738.738.7 44.244.244.244.244.2 46.546.546.546.546.5 45.845.845.845.845.8 49.449.449.449.449.4 61.661.661.661.661.6 67.367.367.367.367.3 67.267.267.267.267.2 6767676767 78.578.578.578.578.5 79.079.079.079.079.0 82.282.282.282.282.2
Net (A-B)Net (A-B)Net (A-B)Net (A-B)Net (A-B) 13.513.513.513.513.5 11.311.311.311.311.3 8.78.78.78.78.7 1.41.41.41.41.4 2.02.02.02.02.0 -3.2-3.2-3.2-3.2-3.2 -10.8-10.8-10.8-10.8-10.8 -14.0-14.0-14.0-14.0-14.0 -22.4-22.4-22.4-22.4-22.4 -23.6-23.6-23.6-23.6-23.6 -11.2-11.2-11.2-11.2-11.2 -24.3-24.3-24.3-24.3-24.3 -7.8-7.8-7.8-7.8-7.8 -23.5-23.5-23.5-23.5-23.5 -47.2-47.2-47.2-47.2-47.2 -31.0-31.0-31.0-31.0-31.0 -35.1-35.1-35.1-35.1-35.1
(Contd)

Appendix 2(Fi): Miscellaneous Account : From 1956-57 to 1989-90 Appendix 2(Fi): Miscellaneous Account : From 1956-57 to 1989-90 Appendix 2(Fi): Miscellaneous Account : From 1956-57 to 1989-90 Appendix 2(Fi): Miscellaneous Account : From 1956-57 to 1989-90 Appendix 2(Fi): Miscellaneous Account : From 1956-57 to 1989-90 (Concluded)(Rupees, Crore)
Item 1973-74 1974-75 1975-76 1976-77 1977-78 1978-79 1979-80 1980-81 1981-82 1982-83 1983-84 1984-85 1985-86 1986-87 1987-88 1988-89 1989-90
18 19 20 21 22 23 24 25 26 27 28 29 30 31 32 33 34
A ReceiptsReceiptsReceiptsReceiptsReceipts 1 Technicians 2.7 0.2 0.7 0.9 0.5 0.5 0.7 1.2 2.1 1.9 2.3 3.2 4.1 2.7 5.0 13.3 69.0 2 Professional Services 0.5 1.1 1.3 3.1 4.6 3.3 7.2 5.1 6.7 8.4 7.0 8.9 10.2 6.6 12.4 20.2 44.2 3 Technical know-how 0.1 0.5 0.5 0.9 1.1 6.1 1.9 3.1 5.8 8.1 6.0 3.6 8.3 12.8 6.3 8.4 8.7 4 Management fees, office expenses, 18.9 21.1 25.2 25.8 30.2 58.8 73.7 74.5 90.8 198.6 153.6 232.4 172.8 214.3 347.8 516.1 817.3
agency services, etc. 5 Underwriters’ commission ----- ----- ----- 0.1 0.4 0.1 0.3 0.7 ----- ----- 0.1 0.2 0.1 ----- ----- 0.3 ----- 6 Settlement on account of post, 0.5 1.4 2.5 2.8 1.2 0.9 2 1.4 1.9 5.7 7.2 4.3 0.5 0.7 3.1 50.1 16.2
telegraph, telephone and radio charges
7 Advertisement charges 0.2 0.2 0.1 0.1 0.2 0.1 0.1 0.8 0.1 1.2 1 0.9 0.2 0.5 2.4 6.7 13.7 8 Foreign Subscriptions to Indian 0.2 0.1 0.3 0.3 0.8 0.6 0.4 1.0 0.3 0.4 0.2 1.6 1.6 2.3 6.2 11.1 24.9
periodicals, magazines, etc. 9 Film rentals ----- ----- 0.1 ----- 0.3 ----- 0.2 0.2 0.2 0.2 1.4 0.2 0.1 1.3 0.1 0.4 0.510 Refunds and rebates on imports 0.3 0.2 0.7 0.5 0.6 1.1 1.7 0.8 2.9 9.3 6.3 1.2 1.1 4.7 3.5 3.3 6.411 Other refunds and rebates 0.3 0.5 0.3 0.9 1.8 0.8 0.9 1.0 1.8 1.7 1.8 1.1 2.5 1.3 5.2 10.7 11.712 Royalties 0.1 0.1 0.2 0.1 0.2 0.1 0.1 0.1 0.2 10.0 0.5 0.1 0.3 0.6 1.4 1.2 2.513 Rentals ----- ----- ----- ----- 0.1 ----- ----- 0.1 ----- ----- ----- ----- 0.1 0.1 0.2 0.4 1.314 Oil companies’ miscellaneous 0.3 0.4 0.1 0.1 ----- ----- ----- ----- ----- ----- ----- ----- ----- ----- ----- ----- -----
remmittance equivalents15 Proceeds of rupee travellers’ cheques ----- ----- ----- 0.1 0.3 0.4 0.1 0.7 0.5 0.3 1.4 0.4 1.1 0.8 1.3 2 2.3
sold by non-resident banks16 Others 24.4 56.9 119.4 151.5 233.1 304.5 439.7 659.9 704.3 840.3 1426.4 2103.7 1859.7 1354.1 1272.6 1473.5 1905.0
AAAAA TotalTotalTotalTotalTotal 48.548.548.548.548.5 82.782.782.782.782.7 151.4151.4151.4151.4151.4 187.2187.2187.2187.2187.2 275.4275.4275.4275.4275.4 377.3377.3377.3377.3377.3 529.0529.0529.0529.0529.0 750.6750.6750.6750.6750.6 817.6817.6817.6817.6817.6 1077.01077.01077.01077.01077.0 1615.01615.01615.01615.01615.0 2362.02362.02362.02362.02362.0 2063.02063.02063.02063.02063.0 1603.01603.01603.01603.01603.0 103.0 160.0 175.3 2 Other professional Services 2.8 3.4 4.1 13.2 37.6 8.0 11.3 11.9 13.9 42.0 45.3 82.6 69.5 105.7 282.0 230.4 169.2 3 Technical know-how 14.1 12.5 25.7 37.8 28.1 55.5 44.0 98.0 270.7 258.6 314.9 300.6 367.8 358.4 459.3 316.7 458.8 4 Management fees, office expenses, 28.9 33.1 50.9 73.1 80.0 96.2 185.5 146.6 261.0 210.6 233.5 294.6 331.7 447.9 470.2 714.3 902.6
agency services, etc. 5 Newspaper correspondents 0.2 0.1 0.2 0.2 0.1 0.1 0.2 0.1 0.4 0.5 0.3 0.8 1.4 0.6 0.7 0.9 1.1 6 Underwriters’ commission ----- ----- 0.1 ----- ----- 0.1 ----- 0.1 - 0.1 0.1 0.2 0.2 ----- 0.3 ----- 3.9 7 Remittances against non-fulfilment 0.2 0.2 0.2 0.2 0.3 0.1 0.2 0.2 1.8 0.5 8.9 2.2 0.9 1.6 2.8 4.1 6.5
of contracts 8 Settlement on account of post, 0.5 0.2 0.3 1.5 0.5 1.8 0.8 1.3 2.8 14.7 7.3 7.2 3.9 14.5 62.2 40.5 9.2
telegraph, telephone and radio charges
9 Advertisement charges 1.8 2.6 1.3 0.8 2.9 2.5 2.0 3.2 2.6 5.0 10.1 3.9 10.0 51.8 7.0 15.0 10.710 Indian Subscriptions to Foreign 7.0 6.0 11.2 13.9 13.5 19.1 26.8 28.9 32.0 48.0 40.8 102.1 83.3 131.7 99.7 114.7 134.4
periodicals, magazines, etc.11 Film rentals 0.3 0.2 - 0.6 0.3 0.4 0.2 0.6 0.1 - 0.2 0.1 0.1 - 0.2 0.3 0.512 Refunds and rebates on exports 2.9 2.2 4.5 15.0 13.7 8.1 8.5 6.0 3.8 9.3 7.5 6.7 10.5 23.8 23.3 20.1 37.113 Other refunds and rebates 0.9 1.0 1.9 3.1 18.8 3.8 26.7 6.1 4.0 10.3 12.9 16.2 69.9 13.9 11.2 28.5 27.214 Royalties 6.2 8.5 10.5 15.9 19.5 12.7 9.6 8.9 16.0 39.7 27.6 28.5 23.5 40.1 60.4 180.6 197.415 Rentals 0.4 0.7 0.5 1.2 0.5 0.7 0.2 0.2 0.1 0.5 1.5 1.3 1.5 1.3 9.7 3.7 4.716 Oil companies’ miscellaneous 1.8 ----- 0.7 1.4 ----- ----- ----- ----- ----- ----- ----- ----- ----- ----- ----- ----- -----
remmittable liabilities (not included elsewhere)
17 Others 12.5 21.9 52.0 64.1 32.3 71.2 237.0 328.2 166.1 128.4 372.8 421.2 147.6 220.8 428.5 457.3 848.9BBBBB TotalTotalTotalTotalTotal 90.690.690.690.690.6 100.0100.0100.0100.0100.0 171.2171.2171.2171.2171.2 252.3252.3252.3252.3252.3 258.3258.3258.3258.3258.3 325.7325.7325.7325.7325.7 562.1562.1562.1562.1562.1 662.9662.9662.9662.9662.9 788.4788.4788.4788.4788.4 798.3798.3798.3798.3798.3 1110.01110.01110.01110.01110.0 1298.01298.01298.01298.01298.0 1164.01164.01164.01164.01164.0 1485.01485.01485.01485.01485.0 2021.02021.02021.02021.02021.0 2287.02287.02287.02287.02287.0 2988.02988.02988.02988.02988.0
Net (A-B)Net (A-B)Net (A-B)Net (A-B)Net (A-B) -42.1-42.1-42.1-42.1-42.1 -17.3-17.3-17.3-17.3-17.3 -19.8-19.8-19.8-19.8-19.8 -65.1-65.1-65.1-65.1-65.1 17.117.117.117.117.1 51.651.651.651.651.6 -33.1-33.1-33.1-33.1-33.1 87.787.787.787.787.7 29.229.229.229.229.2 278.8278.8278.8278.8278.8 505.4505.4505.4505.4505.4 1064.01064.01064.01064.01064.0 898.9898.9898.9898.9898.9 117.7117.7117.7117.7117.7 -353.0-353.0-353.0-353.0-353.0 -169.0-169.0-169.0-169.0-169.0 -63.8-63.8-63.8-63.8-63.8
Sources: Reserve Bank of India Bulletin, May 2003, January 2001, April 1999Monograph on India's Balance of Payments, July 199
49B
alance of Paym
ents

Balance of P
ayments
50
Appendix 2(Fii): Miscellaneous Account : 1990-91 to 2001-02Appendix 2(Fii): Miscellaneous Account : 1990-91 to 2001-02Appendix 2(Fii): Miscellaneous Account : 1990-91 to 2001-02Appendix 2(Fii): Miscellaneous Account : 1990-91 to 2001-02Appendix 2(Fii): Miscellaneous Account : 1990-91 to 2001-02
(Rs. Crore)(Rs. Crore)(Rs. Crore)(Rs. Crore)(Rs. Crore) (US $ Mn)(US $ Mn)(US $ Mn)(US $ Mn)(US $ Mn) (Rs. Crore)(Rs. Crore)(Rs. Crore)(Rs. Crore)(Rs. Crore) (US $ Mn)(US $ Mn)(US $ Mn)(US $ Mn)(US $ Mn) (Rs. Crore)(Rs. Crore)(Rs. Crore)(Rs. Crore)(Rs. Crore) (US $ Mn)(US $ Mn)(US $ Mn)(US $ Mn)(US $ Mn) (Rs. Crore)(Rs. Crore)(Rs. Crore)(Rs. Crore)(Rs. Crore) (US $ Mn)(US $ Mn)(US $ Mn)(US $ Mn)(US $ Mn) (Rs. Crore)(Rs. Crore)(Rs. Crore)(Rs. Crore)(Rs. Crore) (US $ Mn)(US $ Mn)(US $ Mn)(US $ Mn)(US $ Mn) (Rs. Crore)(Rs. Crore)(Rs. Crore)(Rs. Crore)(Rs. Crore) (US $ Mn)(US $ Mn)(US $ Mn)(US $ Mn)(US $ Mn)
1990-91 1991-92 1992-93 1993-94 1994-95 1995-96
A. ReceiptsReceiptsReceiptsReceiptsReceipts
Communication services .......... .......... .......... .......... .......... .......... .......... .......... .......... .......... .......... ..........
Construction Sevices .......... .......... .......... .......... .......... .......... .......... .......... .......... .......... .......... ..........
Financial services .......... .......... .......... .......... .......... .......... .......... .......... .......... .......... .......... ..........
Software services .......... .......... .......... .......... .......... .......... 1020 325 1185.4 489 2520 747
News agency services .......... .......... .......... .......... .......... .......... .......... .......... .......... .......... .......... ..........
Royalties, copyright and license fees .......... .......... .......... .......... .......... .......... .......... .......... .......... .......... .......... ..........
Management services 1009.9 563 1253.5 512 1124.8 386 1392.8 444 1910.7 609 1866.5 554
Other services (Advertising, rentals, .......... .......... .......... .......... .......... .......... .......... .......... .......... .......... .......... ..........
office maintenance, prizes,
exhibitions & other services
not enumerated elsewhere)
TOTAL-ATOTAL-ATOTAL-ATOTAL-ATOTAL-A 1009.91009.91009.91009.91009.9 563563563563563 1253.51253.51253.51253.51253.5 512512512512512 1124.81124.81124.81124.81124.8 386386386386386 2412.82412.82412.82412.82412.8 769769769769769 3096.13096.13096.13096.13096.1 10981098109810981098 4386.54386.54386.54386.54386.5 13011301130113011301
B. PaymentsPaymentsPaymentsPaymentsPayments
Communication services .......... .......... .......... .......... .......... .......... .......... .......... .......... .......... .......... ..........
Construction services .......... .......... .......... .......... .......... .......... .......... .......... .......... .......... .......... ..........
Financial services .......... .......... .......... .......... .......... .......... .......... .......... .......... .......... .......... ..........
Software services .......... .......... .......... .......... .......... .......... .......... .......... .......... .......... .......... ..........
News agency services .......... .......... .......... .......... .......... .......... .......... .......... .......... .......... .......... ..........
Royalties, copyright and license fees .......... .......... .......... .......... .......... .......... .......... .......... .......... .......... .......... ..........
Management services 1197.1 667 2246.7 946 2279.8 744 2046.7 653 3130.3 997 6655.5 1961
Other services (Advertising, .......... .......... .......... .......... .......... .......... .......... .......... .......... .......... .......... ..........
rentals, office maintenance, prizes,
exhibitions & other services
not enumerated elsewhere)
TOTAL-BTOTAL-BTOTAL-BTOTAL-BTOTAL-B 1197.11197.11197.11197.11197.1 667667667667667 2246.72246.72246.72246.72246.7 946946946946946 2279.82279.82279.82279.82279.8 744744744744744 2046.72046.72046.72046.72046.7 653653653653653 3130.33130.33130.33130.33130.3 997997997997997 6655.56655.56655.56655.56655.5 19611961196119611961
C. Miscellaneous Net (A-B)Miscellaneous Net (A-B)Miscellaneous Net (A-B)Miscellaneous Net (A-B)Miscellaneous Net (A-B) -187.2-187.2-187.2-187.2-187.2 -104-104-104-104-104 -993.2-993.2-993.2-993.2-993.2 -434-434-434-434-434 -1155-1155-1155-1155-1155 -358-358-358-358-358 366.1366.1366.1366.1366.1 116116116116116 -34.2-34.2-34.2-34.2-34.2 101101101101101 -2269-2269-2269-2269-2269 -660-660-660-660-660
(Contd)

51B
alance of Paym
ents
Appendix 2(Fii): Miscellaneous Account : 1990-91 to 2001-02 Appendix 2(Fii): Miscellaneous Account : 1990-91 to 2001-02 Appendix 2(Fii): Miscellaneous Account : 1990-91 to 2001-02 Appendix 2(Fii): Miscellaneous Account : 1990-91 to 2001-02 Appendix 2(Fii): Miscellaneous Account : 1990-91 to 2001-02 (Concluded)
(Rs. Crore)(Rs. Crore)(Rs. Crore)(Rs. Crore)(Rs. Crore) (US $ Mn)(US $ Mn)(US $ Mn)(US $ Mn)(US $ Mn) (Rs. Crore)(Rs. Crore)(Rs. Crore)(Rs. Crore)(Rs. Crore) (US $ Mn)(US $ Mn)(US $ Mn)(US $ Mn)(US $ Mn) (Rs. Crore)(Rs. Crore)(Rs. Crore)(Rs. Crore)(Rs. Crore) (US $ Mn)(US $ Mn)(US $ Mn)(US $ Mn)(US $ Mn) (Rs. Crore)(Rs. Crore)(Rs. Crore)(Rs. Crore)(Rs. Crore) (US $ Mn)(US $ Mn)(US $ Mn)(US $ Mn)(US $ Mn) (Rs. Crore)(Rs. Crore)(Rs. Crore)(Rs. Crore)(Rs. Crore) (US $ Mn)(US $ Mn)(US $ Mn)(US $ Mn)(US $ Mn) (Rs. Crore)(Rs. Crore)(Rs. Crore)(Rs. Crore)(Rs. Crore) (US $ Mn)(US $ Mn)(US $ Mn)(US $ Mn)(US $ Mn)
1996-97 1997-98 1998-99 1999-00 2000-01 2001-02
A. ReceiptsReceiptsReceiptsReceiptsReceipts
Communication services .......... .......... 624 171 2552 601 4601 1064 5949 1288 4377 921
Construction Sevices .......... .......... 370 101 634 150 1691 389 3081 671 803 167
Financial services .......... .......... 1112 296 1190 283 1569 361 3193 696 3719 780
Software services 3900 1099 6570 1760 11064 2626 17412 4016 29014 6341 34216 7175
News agency services .......... .......... 586 156 1106 262 1485 342 511 114 35 7
Royalties, copyright and license fees .......... .......... 80 21 73 18 237 54 280 62 400 84
Management services 1394.3 393 2044 549 2477 590 2790 643 4471 970 4546 951
Other services (Advertising, rentals, .......... .......... 4103 1109 12254 2917 14259 3284 12671 2733 21839 4586
office maintenance, prizes,
exhibitions & other services
not enumerated elsewhere)
TOTAL-ATOTAL-ATOTAL-ATOTAL-ATOTAL-A 5294.35294.35294.35294.35294.3 14921492149214921492 1548915489154891548915489 41634163416341634163 3135031350313503135031350 74477447744774477447 4404444044440444404444044 1015310153101531015310153 5917059170591705917059170 1287512875128751287512875 6993569935699356993569935 1467114671146711467114671
B. PaymentsPaymentsPaymentsPaymentsPayments
Communication services .......... .......... 323 87 435 103 826 190 1138 247 2719 571
Construction services .......... .......... 239 65 414 98 220 51 996 216 2462 517
Financial services .......... .......... 2402 647 2885 687 5785 1632 9221 2003 11117 2335
Software services .......... .......... 829 223 1461 348 1600 138 2706 590 3202 672
News agency services .......... .......... 530 142 431 104 693 90 1378 299 1509 317
Royalties, copyright and license fees .......... .......... 618 166 1055 250 1351 311 2367 514 2671 561
Management services 4074.2 1151 3132 841 2802 663 3456 795 6376 1385 8341 1752
Other services (Advertising, .......... .......... 6120 1637 16506 3908 15126 3497 21314 4631 19861 4172
rentals, office maintenance, prizes,
exhibitions & other services
not enumerated elsewhere)
TOTAL-BTOTAL-BTOTAL-BTOTAL-BTOTAL-B 4074.24074.24074.24074.24074.2 11511151115111511151 1419314193141931419314193 38083808380838083808 2598925989259892598925989 61616161616161616161 2905729057290572905729057 67046704670467046704 4549645496454964549645496 98859885988598859885 5188251882518825188251882 1089710897108971089710897
C. Miscellaneous Net (A-B)Miscellaneous Net (A-B)Miscellaneous Net (A-B)Miscellaneous Net (A-B)Miscellaneous Net (A-B) 1220.11220.11220.11220.11220.1 341341341341341 12961296129612961296 355355355355355 53615361536153615361 12861286128612861286 1498714987149871498714987 34493449344934493449 1367413674136741367413674 29902990299029902990 1805318053180531805318053 37743774377437743774
PR : Partially revised.Sources: Reserve Bank of India Bulletin, May 2003, January 2001, April 1999
Monograph on India's Balance of Payments, July 1993

Balance of P
ayments
52
Appendix 2(Gi): Official Transfer Payments Account : 1956-57 to 1989-90Appendix 2(Gi): Official Transfer Payments Account : 1956-57 to 1989-90Appendix 2(Gi): Official Transfer Payments Account : 1956-57 to 1989-90Appendix 2(Gi): Official Transfer Payments Account : 1956-57 to 1989-90Appendix 2(Gi): Official Transfer Payments Account : 1956-57 to 1989-90(Rupees, Crore)
1956-57 1957-58 1958-59 1959-60 1960-61 1961-62 1962-63 1963-64 1964-65 1965-66 1966-67 1967-68 1968-69 1969-70 1970-71 1971-72 1972-73
Item 1 2 3 4 5 6 7 8 9 10 11 12 13 14 15 16 17
ReceiptsReceiptsReceiptsReceiptsReceipts
1 Grants from various countries 36.7 32.8 35.5 37.5 33.2 30.3 22.7 19.3 15.3 26.9 87.6 40.0 57.8 20.4 49.7 52.7 11.7
2 PL 480 Title I ----- ----- ----- 0.3 11.8* 13.3 54.4 62.8 122.0 60.2 0.2 ----- 10.9 41.2 17.9 40.8 44.4
3 PL 480 Title II ----- ----- ----- ----- ----- ----- ----- ----- 14.0 16.5 37.0 48.1 50.7 49.4 55.8 62.7 61.1
4 Others 0.3 0.1 0.1 0.2 0.2 2.3 0.1 1.3 0.8 0.2 ----- 0.2 3.8 4.1 4.6 2.0 1.2
AAAAA TotalTotalTotalTotalTotal 37.037.037.037.037.0 32.932.932.932.932.9 35.635.635.635.635.6 38.038.038.038.038.0 45.245.245.245.245.2 45.945.945.945.945.9 77.277.277.277.277.2 83.483.483.483.483.4 152.1152.1152.1152.1152.1 103.8103.8103.8103.8103.8 124.8124.8124.8124.8124.8 88.388.388.388.388.3 123.2123.2123.2123.2123.2 115.1115.1115.1115.1115.1 128.0128.0128.0128.0128.0 158.2158.2158.2158.2158.2 118.4118.4118.4118.4118.4
PaymentsPaymentsPaymentsPaymentsPayments
1 Pension on government account ----- ----- ----- ----- ----- ----- ----- ----- 0.3 0.4 0.4 0.6 0.4 0.3 0.5 0.5 0.6
in India
2 Government contribution to ----- ----- ----- ----- ----- ----- ----- ----- 1.7 2.8 3.8 4.4 4.6 3.0 4.5 3.1 4.6
international agencies
3 Donations and technical assistance ----- ----- ----- ----- ----- ----- ----- ----- ----- ----- ----- 0.1 ----- 0.1 1.4 12.0 0.1
extended by Government of India
4 Contribution to Indus Basin ----- ----- ----- ----- ----- ----- ----- ----- 8.3 8.3 13.0 13.0 11.2 11.3 ----- -----
Development Fund
5 Commodity agreement with Gulf states ----- ----- ----- ----- ----- ----- ----- ----- ----- ----- ----- ----- ----- 2.2 ----- 0.6 0.2
6 Exports on gift basis ----- ----- ----- ----- ----- ----- ----- ----- ----- ----- ----- ----- ----- ----- ----- ----- 4.5
7 Government exports-grants ----- ----- ----- ----- ----- ----- ----- ----- ----- ----- ----- ----- ----- ----- 0.1 ----- -----
8 Grants to Bangladesh ----- ----- ----- ----- ----- ----- ----- ----- ----- ----- ----- ----- ----- ----- ----- 23.5 99.5
9 Grants to ITEC programme ----- ----- ----- ----- ----- ----- ----- ----- ----- ----- ----- ----- ----- ----- ----- ----- -----
10 Contribution to World Health ----- ----- ----- ----- ----- ----- ----- ----- ----- ----- ----- ----- ----- ----- ----- 2.2 0.5
Organisation
11 Others ----- ----- ----- ----- ----- ----- ----- ----- ----- ----- ----- ----- ----- ----- ----- ----- -----
BBBBB TotalTotalTotalTotalTotal ----- ----- ----- ----- ----- ----- ----- ----- 10.310.310.310.310.3 11.511.511.511.511.5 17.217.217.217.217.2 18.118.118.118.118.1 16.216.216.216.216.2 16.916.916.916.916.9 6.56.56.56.56.5 41.941.941.941.941.9 110.0110.0110.0110.0110.0
Net (A-B)Net (A-B)Net (A-B)Net (A-B)Net (A-B) 37.037.037.037.037.0 32.932.932.932.932.9 35.635.635.635.635.6 38.038.038.038.038.0 33.433.433.433.433.4 45.945.945.945.945.9 77.277.277.277.277.2 83.483.483.483.483.4 141.8141.8141.8141.8141.8 92.392.392.392.392.3 107.6107.6107.6107.6107.6 70.270.270.270.270.2 107.0107.0107.0107.0107.0 98.298.298.298.298.2 121.5121.5121.5121.5121.5 116.3116.3116.3116.3116.3 8.48.48.48.48.4
(Contd)

Appendix 2(Gi): Official Transfer Payments Account : 1956-57 to 1989-90 Appendix 2(Gi): Official Transfer Payments Account : 1956-57 to 1989-90 Appendix 2(Gi): Official Transfer Payments Account : 1956-57 to 1989-90 Appendix 2(Gi): Official Transfer Payments Account : 1956-57 to 1989-90 Appendix 2(Gi): Official Transfer Payments Account : 1956-57 to 1989-90 (Concluded)(Rupees, Crore)
1973-74 1974-75 1975-76 1976-77 1977-78 1978-79 1979-80 1980-81 1981-82 1982-83 1983-84 1984-85 1985-86 1986-87 1987-88 1988-89 1989-90
Item 18 19 20 21 22 23 24 25 26 27 28 29 30 31 32 33 34
ReceiptsReceiptsReceiptsReceiptsReceipts
1 Grants from various countries 15.2 71.4 317.6 259.2 268.6 397.3 306.2 348.2 291.1 275.1 242.9 405.6 319.4 369.9 391.9 518.2 749.9
2 PL 480 Title I 1688.4@ 16.4 - - - - - - - - - - - - - - -
3 PL 480 Title II 60.8 59.7 117.6 121.9 112.0 115.5 159.8 119.3 154.3 110.0 136.9 134.3 119.9 119.2 116.9 171.0 127.9
4 Others 2.6 0.5 50.3 12.7 13.7 23.6 41.4 128.0 5.3 1.2 19.5 38.2 0.6 40.9 26.9 43.7 24.2
AAAAA TotalTotalTotalTotalTotal 1767.01767.01767.01767.01767.0 148.0148.0148.0148.0148.0 485.5485.5485.5485.5485.5 393.8393.8393.8393.8393.8 394.3394.3394.3394.3394.3 536.4536.4536.4536.4536.4 507.4507.4507.4507.4507.4 595.5595.5595.5595.5595.5 450.7450.7450.7450.7450.7 386.3386.3386.3386.3386.3 399.3399.3399.3399.3399.3 578.1578.1578.1578.1578.1 439.9439.9439.9439.9439.9 530.0530.0530.0530.0530.0 535.7535.7535.7535.7535.7 732.9732.9732.9732.9732.9 902.0902.0902.0902.0902.0
PaymentsPaymentsPaymentsPaymentsPayments
1 Pension on government account 0.5 1.1 0.8 0.5 0.5 0.6 0.4 0.2 0.5 0.3 0.1 0.1 0.3 0.2 0.2 0.3 0.2
in India
2 Government contribution to 4.8 6.8 3.0 6.3 3.2 0.9 3.5 ----- 1.6 5.8 7.1 3.6 12.1 4.4 3.1 8.4 5.0
international agencies
3 Donations and technical assistance ----- ----- ----- ----- ----- 0.1 ----- ----- ----- 0.1 ----- 0.1 0.2 0.1 ----- ----- -----
extended by Government of India
4 Contribution to Indus Basin ----- ----- ----- ----- ----- ----- ----- ----- ----- ----- ----- ----- ----- ----- ----- ----- -----
Development Fund
5 Commodity agreement with Gulf states 0.2 0.1 ----- ----- ----- ----- ----- ----- ----- ----- ----- ----- ----- ----- ----- ----- -----
6 Exports on gift basis 3.0 1.0 ----- 0.1 0.1 0.1 4.8 0.3 0.5 0.3 0.1 ----- ----- ----- ----- ----- -----
7 Government exports-grants ----- ----- ----- ----- ----- ----- ----- ----- ----- ----- ----- ----- ----- ----- ----- ----- -----
8 Grants to Bangladesh 2.7 1.2 1.1 1.0 1.4 0.2 0.1 0.2 ----- ----- ----- ----- ----- ----- ----- ----- -----
9 Grants to ITEC programme ----- ----- 2.8 2.9 6.7 3.0 4.1 3.0 ----- ----- ----- ----- ----- ----- ----- ----- -----
10 Contribution to World Health ----- ----- ----- ----- ----- ----- ----- ----- ----- ----- ----- ----- ----- ----- ----- ----- -----
Organisation
11 Others 5.8 ----- 0.1 ----- ----- ----- ----- ----- ----- ----- ----- ----- ----- ----- ----- ----- -----
BBBBB TotalTotalTotalTotalTotal 17.017.017.017.017.0 10.210.210.210.210.2 7.87.87.87.87.8 10.810.810.810.810.8 11.911.911.911.911.9 4.94.94.94.94.9 12.912.912.912.912.9 3.73.73.73.73.7 2.62.62.62.62.6 6.56.56.56.56.5 7.37.37.37.37.3 3.83.83.83.83.8 12.612.612.612.612.6 4.74.74.74.74.7 3.33.33.33.33.3 8.78.78.78.78.7 5.25.25.25.25.2
Net (A-B)Net (A-B)Net (A-B)Net (A-B)Net (A-B) 1750.01750.01750.01750.01750.0 137.8137.8137.8137.8137.8 477.7477.7477.7477.7477.7 383.0383.0383.0383.0383.0 382.4382.4382.4382.4382.4 531.5531.5531.5531.5531.5 494.5494.5494.5494.5494.5 591.8591.8591.8591.8591.8 448.1448.1448.1448.1448.1 379.8379.8379.8379.8379.8 392.0392.0392.0392.0392.0 574.3574.3574.3574.3574.3 427.3427.3427.3427.3427.3 525.3525.3525.3525.3525.3 532.4532.4532.4532.4532.4 724.2724.2724.2724.2724.2 896.8896.8896.8896.8896.8
Notes : *: Include Rs 8.4 crore earmarked by the U.S. authorities to finance export of goods and services to Nepal under their economic aid programme to that country.:@: Receipts for the year 1973-74 include Rs 1664 crore as official grant receipts under the agreement dated February 18, 1974 between the government of India and USA.
Sources: Reserve Bank of India Bulletin, May 2003, January 2001, April 1999Monograph on India's Balance of Payments, July 1993
53B
alance of Paym
ents

Balance of P
ayments
54
Appendix 2(Gii): Official Transfers Account : 1990-91 to 2001-02Appendix 2(Gii): Official Transfers Account : 1990-91 to 2001-02Appendix 2(Gii): Official Transfers Account : 1990-91 to 2001-02Appendix 2(Gii): Official Transfers Account : 1990-91 to 2001-02Appendix 2(Gii): Official Transfers Account : 1990-91 to 2001-02
(Rs. Crore)(Rs. Crore)(Rs. Crore)(Rs. Crore)(Rs. Crore) (US $ Mn)(US $ Mn)(US $ Mn)(US $ Mn)(US $ Mn) (Rs. Crore)(Rs. Crore)(Rs. Crore)(Rs. Crore)(Rs. Crore) (US $ Mn)(US $ Mn)(US $ Mn)(US $ Mn)(US $ Mn) (Rs. Crore)(Rs. Crore)(Rs. Crore)(Rs. Crore)(Rs. Crore) (US $ Mn)(US $ Mn)(US $ Mn)(US $ Mn)(US $ Mn) (Rs. Crore)(Rs. Crore)(Rs. Crore)(Rs. Crore)(Rs. Crore) (US $ Mn)(US $ Mn)(US $ Mn)(US $ Mn)(US $ Mn) (Rs. Crore)(Rs. Crore)(Rs. Crore)(Rs. Crore)(Rs. Crore) (US $ Mn)(US $ Mn)(US $ Mn)(US $ Mn)(US $ Mn) (Rs. Crore)(Rs. Crore)(Rs. Crore)(Rs. Crore)(Rs. Crore) (US $ Mn)(US $ Mn)(US $ Mn)(US $ Mn)(US $ Mn)
1990-91 1991-92 1992-93 1993-94 1994-95 1995-96
AAAAA ReceiptsReceiptsReceiptsReceiptsReceipts
Donations received from Non- residents 178.8 100 201.5 81 306.6 106 0.8 0 315.4 100 223.5 66Grant under PL 480 II 11.8 7 5.3 2 0.6 0 291.3 93 4.6 1 14.1 4Grants from other Governments 638.7 356 934.7 378 747.8 258 878.2 280 1002.9 319 956.1 281
TOTAL-ATOTAL-ATOTAL-ATOTAL-ATOTAL-A 829.3829.3829.3829.3829.3 463463463463463 1141.51141.51141.51141.51141.5 461461461461461 10551055105510551055 364364364364364 1170.31170.31170.31170.31170.3 373373373373373 1322.91322.91322.91322.91322.9 420420420420420 1193.71193.71193.71193.71193.7 351351351351351
BBBBB PaymentsPaymentsPaymentsPaymentsPaymentsGrants/donations from official sector 1.7 1 1.4 1 2.2 1 14.9 5 13.3 5 20 5
TOTAL-BTOTAL-BTOTAL-BTOTAL-BTOTAL-B 1.81.81.81.81.8 11111 1.51.51.51.51.5 11111 2.32.32.32.32.3 11111 1515151515 55555 13.913.913.913.913.9 55555 2121212121 66666
Official Transfers Net (A-B)Official Transfers Net (A-B)Official Transfers Net (A-B)Official Transfers Net (A-B)Official Transfers Net (A-B) 827.5827.5827.5827.5827.5 462462462462462 11401140114011401140 460460460460460 1052.71052.71052.71052.71052.7 363363363363363 1155.31155.31155.31155.31155.3 368368368368368 13091309130913091309 415415415415415 1172.71172.71172.71172.71172.7 345345345345345
(Rs. Crore)(Rs. Crore)(Rs. Crore)(Rs. Crore)(Rs. Crore) (US $ Mn)(US $ Mn)(US $ Mn)(US $ Mn)(US $ Mn) (Rs. Crore)(Rs. Crore)(Rs. Crore)(Rs. Crore)(Rs. Crore) (US $ Mn)(US $ Mn)(US $ Mn)(US $ Mn)(US $ Mn) (Rs. Crore)(Rs. Crore)(Rs. Crore)(Rs. Crore)(Rs. Crore) (US $ Mn)(US $ Mn)(US $ Mn)(US $ Mn)(US $ Mn) (Rs. Crore)(Rs. Crore)(Rs. Crore)(Rs. Crore)(Rs. Crore) (US $ Mn)(US $ Mn)(US $ Mn)(US $ Mn)(US $ Mn) (Rs. Crore)(Rs. Crore)(Rs. Crore)(Rs. Crore)(Rs. Crore) (US $ Mn)(US $ Mn)(US $ Mn)(US $ Mn)(US $ Mn) (Rs. Crore)(Rs. Crore)(Rs. Crore)(Rs. Crore)(Rs. Crore) (US $ Mn)(US $ Mn)(US $ Mn)(US $ Mn)(US $ Mn)
1996-97 1997-98 1998-99 1999-00 2000-01 2001-02
AAAAA ReceiptsReceiptsReceiptsReceiptsReceipts
Donations received from Non- residents 42.3 12 6 2 0 0 174 40 489 107 29 6Grant under PL 480 II 0 0 386 105 400 94 414 96 439 95 279 58Grants from other Governments 1465.1 411 1026 272 905 214 1071 246 628 136 1543 321
TOTAL-ATOTAL-ATOTAL-ATOTAL-ATOTAL-A 1507.41507.41507.41507.41507.4 423423423423423 14181418141814181418 379379379379379 13051305130513051305 308308308308308 16591659165916591659 382382382382382 15561556155615561556 338338338338338 18511851185118511851 385385385385385
BBBBB PaymentsPaymentsPaymentsPaymentsPaymentsGrants/donations from official sector 50 13 0 0 5 1 2 0 10 2 4 1
TOTAL-BTOTAL-BTOTAL-BTOTAL-BTOTAL-B 50.350.350.350.350.3 1313131313 00000 00000 55555 11111 22222 00000 1010101010 22222 44444 11111
Official Transfers Net (A-B)Official Transfers Net (A-B)Official Transfers Net (A-B)Official Transfers Net (A-B)Official Transfers Net (A-B) 1457.11457.11457.11457.11457.1 410410410410410 14181418141814181418 379379379379379 13001300130013001300 307307307307307 16571657165716571657 382382382382382 15461546154615461546 336336336336336 18471847184718471847 384384384384384
Sources: Reserve Bank of India Bulletin, May 2003, January 2001, April 1999Monograph on India's Balance of Payments, July 1993

55B
alance of Paym
ents
Appendix 2(Hi): Private Transfer Payments Account : 1956-57 to 1989-90Appendix 2(Hi): Private Transfer Payments Account : 1956-57 to 1989-90Appendix 2(Hi): Private Transfer Payments Account : 1956-57 to 1989-90Appendix 2(Hi): Private Transfer Payments Account : 1956-57 to 1989-90Appendix 2(Hi): Private Transfer Payments Account : 1956-57 to 1989-90(Rupees, Crore)
1956-57 1957-58 1958-59 1959-60 1960-61 1961-62 1962-63 1963-64 1964-65 1965-66 1966-67 1967-68 1968-69 1969-70 1970-71 1971-72 1972-73Item 1 2 3 4 5 6 7 8 9 10 11 12 13 14 15 16 17
Receipts*Receipts*Receipts*Receipts*Receipts*1 Receipts for family maintenance .......... .......... .......... .......... .......... .......... .......... .......... 3.3 1.8 2.1 4.5 5.0 4.4 4.4 3.9 3.02 Personal gifts and donations to 21.4 21.5 20.7 20.5 19.0 19.6 31.1 35.7 26.5 11.4 21.5 52.6 62.7 68.3 72.6 90.1 75.3
religious orgainsations andcharitableinstitutions in India
3 Migrants’ transfers by Indian 6.8 6.1 5.9 6.1 5.0 3.5 3.7 4.6 1.6 0.8 0.7 2.2 3.0 3.2 4.5 3.1 3.7nationals
4 Migrants’ transfers by foreign .......... .......... .......... .......... .......... .......... .......... .......... ----- ----- 0.1 0.2 - 0.3 0.3 0.3 0.2nationals
5 Transfers of legacies and .......... .......... .......... .......... .......... .......... .......... .......... 0.2 0.4 0.5 0.2 0.3 0.4 0.3 0.3 0.4assets in trust
6 Repatriation of savings by .......... .......... .......... .......... .......... .......... .......... .......... 2.7 1.2 2.3 6.3 10.0 10.6 8.6 9.7 18.0Indians resident abroad
7 Remittances of professional .......... .......... .......... .......... .......... .......... .......... .......... 0.2 0.1 ----- 0.2 ----- 0.3 0.3 - -income-tax and income-tax refunds
8 Receipts of provident fund .......... .......... .......... .......... .......... .......... .......... .......... 0.2 0.3 0.3 0.4 0.7 0.7 0.9 0.6 0.9and other retirement benefitfunds from abroad
9 Reimbursement of money 33.2 33.2 28.1 24.9 20.7 13.9 .. .. 7.5 4.6 5.9 5.2 9.9 9.4 8.8 8.3 9.1order drawings
10 Others 2.2 1.4 3.2 4.6 0.2 4.2 5.3 7.1 ----- ----- ----- ----- ----- ----- ----- ----- -----
AAAAA TotalTotalTotalTotalTotal 63.663.663.663.663.6 62.262.262.262.262.2 57.957.957.957.957.9 56.156.156.156.156.1 44.944.944.944.944.9 41.241.241.241.241.2 40.140.140.140.140.1 47.447.447.447.447.4 42.242.242.242.242.2 78.4*78.4*78.4*78.4*78.4* 73.2*73.2*73.2*73.2*73.2* 71.871.871.871.871.8 91.691.691.691.691.6 97.697.697.697.697.6 100.7100.7100.7100.7100.7 116.3116.3116.3116.3116.3 110.6110.6110.6110.6110.6
PaymentsPaymentsPaymentsPaymentsPayments1 Family maintenance .......... .......... .......... .......... .......... .......... .......... .......... 5.4 5.3 6.5 6.3 4.8 4.4 3.2 2.8 2.72 Personal gifts and donations to .......... .......... .......... .......... .......... .......... .......... .......... 0.3 - 0.1 0.1 0.1 0.3 0.1 0.2 1.2
religious organisation andcharitable institutions abroad
3 Migrants’ transfers by Indian .......... .......... .......... .......... .......... .......... .......... .......... 1.1 1.0 1.3 1.3 1.0 1.0 1.1 1.0 0.5nationals
4 Migrants’ transfers by foreign .......... .......... .......... .......... .......... .......... .......... .......... 5.8 5.6 7.4 6.6 6.2 4.6 5.1 4.2 3.6nationals
5 Transfers of legacies and assets .......... .......... .......... .......... .......... .......... .......... .......... 0.5 0.6 0.5 0.5 0.6 0.6 0.6 0.5 0.5in trust
6 Remittances of savings by foreign .......... .......... .......... .......... .......... .......... .......... .......... 2.1 1.8 2.8 2.1 1.6 1.4 1.2 1.1 1.0nationals
7 Personal income-tax and .......... .......... .......... .......... .......... .......... .......... .......... - - - - - - - 0.8 0.4income-tax refunds
8 Transfers of provident fund and .......... .......... .......... .......... .......... .......... .......... .......... 0.6 0.5 0.5 0.7 0.7 0.5 0.5 0.2 0.2other retirement benefit funds
9 Pensions .......... .......... .......... .......... .......... .......... .......... .......... 0.7 1.0 1.1 1.3 1.4 1.3 1.3 1.3 1.210 Reimbursement of money .......... .......... .......... .......... .......... .......... .......... .......... 0.1 - - - - - - - -
order drawings11 Lottery tickets and prizes .......... .......... .......... .......... .......... .......... .......... .......... ----- ----- ----- ----- ----- ----- ----- ----- -----
BBBBB TotalTotalTotalTotalTotal 15.815.815.815.815.8 16.516.516.516.516.5 16.716.716.716.716.7 16.116.116.116.116.1 16.816.816.816.816.8 16.216.216.216.216.2 14.014.014.014.014.0 13.313.313.313.313.3 16.616.616.616.616.6 15.815.815.815.815.8 20.220.220.220.220.2 18.918.918.918.918.9 16.416.416.416.416.4 14.114.114.114.114.1 13.113.113.113.113.1 12.112.112.112.112.1 11.311.311.311.311.3Net (A-B)Net (A-B)Net (A-B)Net (A-B)Net (A-B) 47.847.847.847.847.8 45.745.745.745.745.7 41.241.241.241.241.2 40.040.040.040.040.0 28.128.128.128.128.1 25.025.025.025.025.0 26.126.126.126.126.1 34.134.134.134.134.1 25.625.625.625.625.6 62.662.662.662.662.6 53.053.053.053.053.0 52.952.952.952.952.9 75.275.275.275.275.2 83.583.583.583.583.5 87.687.687.687.687.6 104.2104.2104.2104.2104.2 99.399.399.399.399.3
(Contd)(Contd)(Contd)(Contd)(Contd)

Balance of P
ayments
56
Appendix 2(Hi): Private Transfer Payments Account : 1956-57 to 1989-90 Appendix 2(Hi): Private Transfer Payments Account : 1956-57 to 1989-90 Appendix 2(Hi): Private Transfer Payments Account : 1956-57 to 1989-90 Appendix 2(Hi): Private Transfer Payments Account : 1956-57 to 1989-90 Appendix 2(Hi): Private Transfer Payments Account : 1956-57 to 1989-90 (Concluded)(Rupees, Crore)
1973-74 1974-75 1975-76 1976-77 1977-78 1978-79 1979-80 1980-81 1981-82 1982-83 1983-84 1984-85 1985-86 1986-87 1987-88 1988-89 1989-90Item 18 19 20 21 22 23 24 25 26 27 28 29 30 31 32 33 34
Receipts*Receipts*Receipts*Receipts*Receipts* 1 Receipts for family maintenance 5.7 10.5 48.5 81.7 120.5 133.1 206.1 241.6 326.9 339.8 338.9 371.0 403.6 500.3 835.4 777.6 1199.1 2 Personal gifts and donations to 99.4 152.3 201.1 315.5 453.4 358.3 573.8 587.5 495.5 531.1 532.4 610.3 506.2 451.4 566.2 551.2 673.6
religious orgainsations andcharitableinstitutions in India
3 Migrants’ transfers by Indian 5.4 6.2 4.6 6.4 9.0 1.2 1.7 59.9 4.3 3.8 2.7 2.6 2.1 2.2 2.5 2.0 0.6nationals
4 Migrants’ transfers by foreign 0.4 0.4 0.4 0.6 1.0 0.1 0.1 - 0.4 0.3 10.2 8.2 6.1 0.5 ----- 0.4 -----nationals
5 Transfers of legacies and 0.5 0.7 - 0.4 0.1 - 1.0 6.4 0.4 0.7 0.8 0.7 0.5 0.2 0.5 0.4 -----assets in trust
6 Repatriation of savings by 30.1 40.8 137.6 268.9 386.4 573.6 908.6 1239.3 1251.8 1551.4 1758.7 1983.2 1790.5 2027.9 2117.8 1878.9 1932.8Indians resident abroad
7 Remittances of professional 0.2 0.1 - 0.1 0.1 1.0 1.6 - 0.4 1.1 1.6 1.8 2.8 2.9 2.8 1.6 1.4income-tax and income-tax refunds
8 Receipts of provident fund 1.1 2.4 4.5 8.8 15.5 2.3 3.7 2.0 2.4 2.4 3.0 4.1 3.7 5.2 7.2 8.3 16.1and other retirement benefitfunds from abroad
9 Reimbursement of money 15.4 22.0 57.1 79.7 122.4 39.9 65.5 - 0.7 0.4 ----- ----- ----- ----- 0.3 0.8 0.3order drawings
10 Others ----- ----- ----- ----- ----- ----- ----- ----- ----- ----- ----- ----- ----- ----- ----- 644.2@@@@@ -
AAAAA TotalTotalTotalTotalTotal 158.2158.2158.2158.2158.2 235.4235.4235.4235.4235.4 453.8453.8453.8453.8453.8 762.1762.1762.1762.1762.1 1108.41108.41108.41108.41108.4 1109.51109.51109.51109.51109.5 1762.11762.11762.11762.11762.1 2136.72136.72136.72136.72136.7 2082.82082.82082.82082.82082.8 2431.02431.02431.02431.02431.0 2648.32648.32648.32648.32648.3 2981.92981.92981.92981.92981.9 2715.52715.52715.52715.52715.5 2990.62990.62990.62990.62990.6 3532.73532.73532.73532.73532.7 3865.43865.43865.43865.43865.4 3823.93823.93823.93823.93823.9
PaymentsPaymentsPaymentsPaymentsPayments 1 Family maintenance 2.0 1.5 1.7 1.1 0.8 0.7 0.9 2.0 1.4 2.0 1.3 3.7 5.3 4.7 3.7 4.0 8.1 2 Personal gifts and donations to 1.2 0.1 0.2 0.1 0.1 0.1 0.2 0.2 0.2 0.2 0.5 0.6 1.0 0.9 0.9 0.7 0.6
religious organisation andcharitable institutions abroad
3 Migrants’ transfers by Indian 1.6 0.2 0.7 0.2 0.3 0.3 0.3 0.6 1.5 0.5 0.8 0.9 0.5 0.5 0.5 0.4 0.6nationals
4 Migrants’ transfers by foreign 3.1 2.1 2.9 2.2 1.4 9.3 2.0 0.8 0.8 1.5 1.9 1.5 1.5 2.8 3.1 5.1 4.2nationals
5 Transfers of legacies and assets 0.4 0.3 0.4 0.4 0.6 1.1 0.5 0.8 0.3 0.3 0.3 0.6 0.3 0.6 0.4 0.4 0.7in trust
6 Remittances of savings by foreign 1.3 0.6 1.5 0.9 0.8 3.1 1.2 1.4 1.7 0.5 0.6 2.5 1.8 2.8 22.5 6.2 4.4nationals
7 Personal income-tax and 0.6 0.3 4.3 0.7 0.5 0.6 0.8 1.2 0.5 2.2 1.5 0.4 1.3 0.7 0.5 2.0 2.8income-tax refunds
8 Transfers of provident fund and 0.2 0.2 0.2 - 0.8 0.2 ----- ----- 0.6 ----- ----- 3.8 ----- 0.1 0.7 1.1 -----other retirement benefit funds
9 Pensions 1.2 1.0 1.4 1.3 1.2 1.3 1.8 1.4 1.6 1.2 3.7 1.2 3.1 1.7 2.0 3.9 4.610 Reimbursement of money 0.4 ----- ----- ----- ----- ----- ----- 3.2 7.9 5.6 ----- ----- ----- ----- ----- ----- -----
order drawings11 Lottery tickets and prizes ----- ----- ----- ----- ----- ----- ----- ----- ----- 0.1 ----- ----- ----- ----- ----- ----- 0.2
BBBBB TotalTotalTotalTotalTotal 12.012.012.012.012.0 6.36.36.36.36.3 13.313.313.313.313.3 6.96.96.96.96.9 6.56.56.56.56.5 16.716.716.716.716.7 7.77.77.77.77.7 11.611.611.611.611.6 16.516.516.516.516.5 14.114.114.114.114.1 10.610.610.610.610.6 15.215.215.215.215.2 14.814.814.814.814.8 14.814.814.814.814.8 34.334.334.334.334.3 23.823.823.823.823.8 26.226.226.226.226.2Net (A-B)Net (A-B)Net (A-B)Net (A-B)Net (A-B) 146.2146.2146.2146.2146.2 229.1229.1229.1229.1229.1 440.5440.5440.5440.5440.5 755.2755.2755.2755.2755.2 1101.91101.91101.91101.91101.9 1092.81092.81092.81092.81092.8 1754.41754.41754.41754.41754.4 2125.12125.12125.12125.12125.1 2066.32066.32066.32066.32066.3 2416.92416.92416.92416.92416.9 2637.72637.72637.72637.72637.7 2966.72966.72966.72966.72966.7 2700.72700.72700.72700.72700.7 2975.82975.82975.82975.82975.8 3498.43498.43498.43498.43498.4 3841.63841.63841.63841.63841.6 3797.73797.73797.73797.73797.7
Notes :*: Exclusive of PL 480 Title grants which are shown separately in the table on Official Transfer Payments.:@: The figure of Rs 644.2 crore reported in 1988-89 against Others is the compensation for Bhopal Gas tragedy received from Union Carbide Corporation ($ 425 million in US $) and
Union Carbide (India) Limited ($45 million in Indian rupees) deposited with RBI on March 14, 1989.Sources: Reserve Bank of India Bulletin, May 2003, January 2001, April 1999
Monograph on India's Balance of Payments, July 1993

57B
alance of Paym
ents
Appendix 2(Hii): Private Transfers : 1990-91 to 2001-02Appendix 2(Hii): Private Transfers : 1990-91 to 2001-02Appendix 2(Hii): Private Transfers : 1990-91 to 2001-02Appendix 2(Hii): Private Transfers : 1990-91 to 2001-02Appendix 2(Hii): Private Transfers : 1990-91 to 2001-02
(Rs. Crore)(Rs. Crore)(Rs. Crore)(Rs. Crore)(Rs. Crore) (US $ Mn)(US $ Mn)(US $ Mn)(US $ Mn)(US $ Mn) (Rs. Crore)(Rs. Crore)(Rs. Crore)(Rs. Crore)(Rs. Crore) (US $ Mn)(US $ Mn)(US $ Mn)(US $ Mn)(US $ Mn) (Rs. Crore)(Rs. Crore)(Rs. Crore)(Rs. Crore)(Rs. Crore) (US $ Mn)(US $ Mn)(US $ Mn)(US $ Mn)(US $ Mn) (Rs. Crore)(Rs. Crore)(Rs. Crore)(Rs. Crore)(Rs. Crore) (US $ Mn)(US $ Mn)(US $ Mn)(US $ Mn)(US $ Mn) (Rs. Crore)(Rs. Crore)(Rs. Crore)(Rs. Crore)(Rs. Crore) (US $ Mn)(US $ Mn)(US $ Mn)(US $ Mn)(US $ Mn) (Rs. Crore)(Rs. Crore)(Rs. Crore)(Rs. Crore)(Rs. Crore) (US $ Mn)(US $ Mn)(US $ Mn)(US $ Mn)(US $ Mn)
1990-91 1991-92 1992-93 1993-94 1994-95 1995-96
Items 1 2 3 4 5 6 7 8 9 10 11 12
A. RECEIPTSRECEIPTSRECEIPTSRECEIPTSRECEIPTSInward remittance from Indian workers 1122.8 626 1743.5 702 2127.9 730 1611.8 514 5421 1727 3387.1 1003 abroad for family maintenanceLocal withdrawals / redemptions 0 0 0 0 0 0 0 0 0 0 0 0 of non-resident depositsGold and silver brought through 0 0 0 0 3136.7 1076 5238.4 1670 6593.1 2100 6546.2 1943 passenger baggage Personal gifts / donations to 747.5 417 852.5 344 1299.3 445 2629.1 838 1843.9 587 4584.7 1359 charitable/religious institutions in India
TOTAL - ATOTAL - ATOTAL - ATOTAL - ATOTAL - A 3736.73736.73736.73736.73736.7 20832083208320832083 9418.99418.99418.99418.99418.9 37983798379837983798 11260.811260.811260.811260.811260.8 38643864386438643864 16582.116582.116582.116582.116582.1 52875287528752875287 25474.225474.225474.225474.225474.2 81128112811281128112 2876828768287682876828768 85398539853985398539
B.B.B.B.B. PAYMENTSPAYMENTSPAYMENTSPAYMENTSPAYMENTSRemittance by foreign workers 9.7 5 10.6 4 10.3 3 5.9 2 8.7 3 37.9 11 for family maintainancePersonal gifts/donations to 0.9 1 9.8 4 9.3 3 6.1 2 11.6 4 20 6 charitable/religious institutions abroad
TOTAL - BTOTAL - BTOTAL - BTOTAL - BTOTAL - B 25.725.725.725.725.7 1414141414 37.537.537.537.537.5 1515151515 3535353535 1212121212 68.468.468.468.468.4 2222222222 57.657.657.657.657.6 1919191919 108.2108.2108.2108.2108.2 3333333333PRIVATE TRANSFERS NET (A-B)PRIVATE TRANSFERS NET (A-B)PRIVATE TRANSFERS NET (A-B)PRIVATE TRANSFERS NET (A-B)PRIVATE TRANSFERS NET (A-B) 37113711371137113711 20692069206920692069 9381.49381.49381.49381.49381.4 37833783378337833783 11225.811225.811225.811225.811225.8 38523852385238523852 16513.716513.716513.716513.716513.7 52655265526552655265 25416.625416.625416.625416.625416.6 80938093809380938093 28659.828659.828659.828659.828659.8 85068506850685068506
(Rs. Crore)(Rs. Crore)(Rs. Crore)(Rs. Crore)(Rs. Crore) (US $ Mn)(US $ Mn)(US $ Mn)(US $ Mn)(US $ Mn) (Rs. Crore)(Rs. Crore)(Rs. Crore)(Rs. Crore)(Rs. Crore) (US $ Mn)(US $ Mn)(US $ Mn)(US $ Mn)(US $ Mn) (Rs. Crore)(Rs. Crore)(Rs. Crore)(Rs. Crore)(Rs. Crore) (US $ Mn)(US $ Mn)(US $ Mn)(US $ Mn)(US $ Mn) (Rs. Crore)(Rs. Crore)(Rs. Crore)(Rs. Crore)(Rs. Crore) (US $ Mn)(US $ Mn)(US $ Mn)(US $ Mn)(US $ Mn) (Rs. Crore)(Rs. Crore)(Rs. Crore)(Rs. Crore)(Rs. Crore) (US $ Mn)(US $ Mn)(US $ Mn)(US $ Mn)(US $ Mn) (Rs. Crore)(Rs. Crore)(Rs. Crore)(Rs. Crore)(Rs. Crore) (US $ Mn)(US $ Mn)(US $ Mn)(US $ Mn)(US $ Mn)
1996-97 1997-98 1998-99 1999-00 2000-01 2001-02
Items 13 14 15 16 17 18 19 20 21 22 23 24
A. RECEIPTSRECEIPTSRECEIPTSRECEIPTSRECEIPTSInward remittance from Indian workers 8950.2 2518 19303 5232 32253 7661 32192 7423 37681 8255 38514 8076 abroad for family maintenanceLocal withdrawals / redemptions 12215.1 3427 12773 3418 7808 1859 17849 4120 17305 3791 16422 3444 of non-resident depositsGold and silver brought through 9649.5 2718 9900 2699 705 171 57 13 41 9 62 13 passenger baggage Personal gifts / donations to 2576.1 726 1954 526 2728 650 3182 734 3729 818 3138 659 charitable/religious institutions in India
TOTAL -ATOTAL -ATOTAL -ATOTAL -ATOTAL -A 44208.344208.344208.344208.344208.3 1243512435124351243512435 4393043930439304393043930 1187511875118751187511875 4349443494434944349443494 1034110341103411034110341 5328053280532805328053280 1229012290122901229012290 5875658756587565875658756 1287312873128731287312873 5813658136581365813658136 1219212192121921219212192
B.B.B.B.B. PAYMENTSPAYMENTSPAYMENTSPAYMENTSPAYMENTSRemittance by foreign workers 61.3 17 153 42 219 53 125 29 201 44 172 37 for family maintainancePersonal gifts/donations to 7.9 2 12 3 33 8 23 5 143 31 143 30 charitable/religious institutions abroad
TOTAL -BTOTAL -BTOTAL -BTOTAL -BTOTAL -B 240.2240.2240.2240.2240.2 6868686868 165165165165165 4545454545 252252252252252 6161616161 148148148148148 3434343434 344344344344344 7575757575 315315315315315 6767676767PRIVATE TRANSFERS NET (A-B)PRIVATE TRANSFERS NET (A-B)PRIVATE TRANSFERS NET (A-B)PRIVATE TRANSFERS NET (A-B)PRIVATE TRANSFERS NET (A-B) 43968.143968.143968.143968.143968.1 1236712367123671236712367 4376543765437654376543765 1183011830118301183011830 4324243242432424324243242 1028010280102801028010280 5313253132531325313253132 1225612256122561225612256 5841258412584125841258412 1279812798127981279812798 5782157821578215782157821 1212512125121251212512125
Note: The total figures for the year 1990-91 to 1996-97 will not tally since all the items are not available for all the years. The same can be taken from the RBI Bulletin, April, 1999Source: Reserve Bank of India Bulletin, April, 1999 and May, 2003
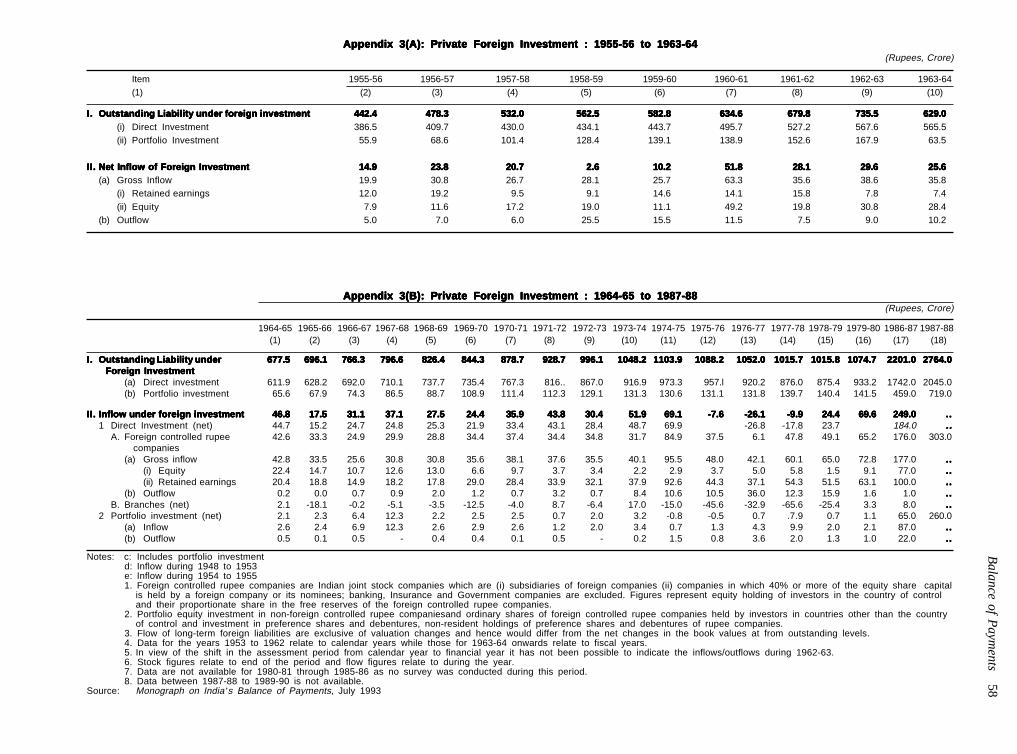
Balance of P
ayments
58
Appendix 3(A): Private Foreign Investment : 1955-56 to 1963-64Appendix 3(A): Private Foreign Investment : 1955-56 to 1963-64Appendix 3(A): Private Foreign Investment : 1955-56 to 1963-64Appendix 3(A): Private Foreign Investment : 1955-56 to 1963-64Appendix 3(A): Private Foreign Investment : 1955-56 to 1963-64(Rupees, Crore)
Item 1955-56 1956-57 1957-58 1958-59 1959-60 1960-61 1961-62 1962-63 1963-64(1) (2) (3) (4) (5) (6) (7) (8) (9) (10)
I.I.I.I.I. Outstanding Liability under foreign investmentOutstanding Liability under foreign investmentOutstanding Liability under foreign investmentOutstanding Liability under foreign investmentOutstanding Liability under foreign investment 442.4442.4442.4442.4442.4 478.3478.3478.3478.3478.3 532.0532.0532.0532.0532.0 562.5562.5562.5562.5562.5 582.8582.8582.8582.8582.8 634.6634.6634.6634.6634.6 679.8679.8679.8679.8679.8 735.5735.5735.5735.5735.5 629.0629.0629.0629.0629.0(i) Direct Investment 386.5 409.7 430.0 434.1 443.7 495.7 527.2 567.6 565.5(ii) Portfolio Investment 55.9 68.6 101.4 128.4 139.1 138.9 152.6 167.9 63.5
II.II.II.II.II. Net Inflow of Foreign InvestmentNet Inflow of Foreign InvestmentNet Inflow of Foreign InvestmentNet Inflow of Foreign InvestmentNet Inflow of Foreign Investment 14.914.914.914.914.9 23.823.823.823.823.8 20.720.720.720.720.7 2.62.62.62.62.6 10.210.210.210.210.2 51.851.851.851.851.8 28.128.128.128.128.1 29.629.629.629.629.6 25.625.625.625.625.6(a) Gross Inflow 19.9 30.8 26.7 28.1 25.7 63.3 35.6 38.6 35.8
(i) Retained earnings 12.0 19.2 9.5 9.1 14.6 14.1 15.8 7.8 7.4(ii) Equity 7.9 11.6 17.2 19.0 11.1 49.2 19.8 30.8 28.4
(b) Outflow 5.0 7.0 6.0 25.5 15.5 11.5 7.5 9.0 10.2
Appendix 3(B): Private Foreign Investment : 1964-65 to 1987-88Appendix 3(B): Private Foreign Investment : 1964-65 to 1987-88Appendix 3(B): Private Foreign Investment : 1964-65 to 1987-88Appendix 3(B): Private Foreign Investment : 1964-65 to 1987-88Appendix 3(B): Private Foreign Investment : 1964-65 to 1987-88(Rupees, Crore)
1964-65 1965-66 1966-67 1967-68 1968-69 1969-70 1970-71 1971-72 1972-73 1973-74 1974-75 1975-76 1976-77 1977-78 1978-79 1979-80 1986-87 1987-88(1) (2) (3) (4) (5) (6) (7) (8) (9) (10) (11) (12) (13) (14) (15) (16) (17) (18)
I.I.I.I.I. Outstanding Liability underOutstanding Liability underOutstanding Liability underOutstanding Liability underOutstanding Liability under 677.5677.5677.5677.5677.5 696.1696.1696.1696.1696.1 766.3766.3766.3766.3766.3 796.6796.6796.6796.6796.6 826.4826.4826.4826.4826.4 844.3844.3844.3844.3844.3 878.7878.7878.7878.7878.7 928.7928.7928.7928.7928.7 996.1996.1996.1996.1996.1 1048.21048.21048.21048.21048.2 1103.91103.91103.91103.91103.9 1088.21088.21088.21088.21088.2 1052.01052.01052.01052.01052.0 1015.71015.71015.71015.71015.7 1015.81015.81015.81015.81015.8 1074.71074.71074.71074.71074.7 2201.02201.02201.02201.02201.0 2764.02764.02764.02764.02764.0 Foreign InvestmentForeign InvestmentForeign InvestmentForeign InvestmentForeign Investment
(a) Direct investment 611.9 628.2 692.0 710.1 737.7 735.4 767.3 816.. 867.0 916.9 973.3 957.l 920.2 876.0 875.4 933.2 1742.0 2045.0(b) Portfolio investment 65.6 67.9 74.3 86.5 88.7 108.9 111.4 112.3 129.1 131.3 130.6 131.1 131.8 139.7 140.4 141.5 459.0 719.0
II.II.II.II.II. Inflow under foreign investmentInflow under foreign investmentInflow under foreign investmentInflow under foreign investmentInflow under foreign investment 46.846.846.846.846.8 17.517.517.517.517.5 31.131.131.131.131.1 37.137.137.137.137.1 27.527.527.527.527.5 24.424.424.424.424.4 35.935.935.935.935.9 43.843.843.843.843.8 30.430.430.430.430.4 51.951.951.951.951.9 69.169.169.169.169.1 -7.6-7.6-7.6-7.6-7.6 -26.1-26.1-26.1-26.1-26.1 -9.9-9.9-9.9-9.9-9.9 24.424.424.424.424.4 69.669.669.669.669.6 249.0249.0249.0249.0249.0 ..........1 Direct Investment (net) 44.7 15.2 24.7 24.8 25.3 21.9 33.4 43.1 28.4 48.7 69.9 -26.8 -17.8 23.7 184.0 ..........
A. Foreign controlled rupee 42.6 33.3 24.9 29.9 28.8 34.4 37.4 34.4 34.8 31.7 84.9 37.5 6.1 47.8 49.1 65.2 176.0 303.0 companies(a) Gross inflow 42.8 33.5 25.6 30.8 30.8 35.6 38.1 37.6 35.5 40.1 95.5 48.0 42.1 60.1 65.0 72.8 177.0 ..........
(i) Equity 22.4 14.7 10.7 12.6 13.0 6.6 9.7 3.7 3.4 2.2 2.9 3.7 5.0 5.8 1.5 9.1 77.0 ..........(ii) Retained earnings 20.4 18.8 14.9 18.2 17.8 29.0 28.4 33.9 32.1 37.9 92.6 44.3 37.1 54.3 51.5 63.1 100.0 ..........
(b) Outflow 0.2 0.0 0.7 0.9 2.0 1.2 0.7 3.2 0.7 8.4 10.6 10.5 36.0 12.3 15.9 1.6 1.0 ..........B. Branches (net) 2.1 -18.1 -0.2 -5.1 -3.5 -12.5 -4.0 8.7 -6.4 17.0 -15.0 -45.6 -32.9 -65.6 -25.4 3.3 8.0 ..........
2 Portfolio investment (net) 2.1 2.3 6.4 12.3 2.2 2.5 2.5 0.7 2.0 3.2 -0.8 -0.5 0.7 .7.9 0.7 1.1 65.0 260.0(a) Inflow 2.6 2.4 6.9 12.3 2.6 2.9 2.6 1.2 2.0 3.4 0.7 1.3 4.3 9.9 2.0 2.1 87.0 ..........(b) Outflow 0.5 0.1 0.5 - 0.4 0.4 0.1 0.5 - 0.2 1.5 0.8 3.6 2.0 1.3 1.0 22.0 ..........
Notes: c: Includes portfolio investmentd: Inflow during 1948 to 1953e: Inflow during 1954 to 19551. Foreign controlled rupee companies are Indian joint stock companies which are (i) subsidiaries of foreign companies (ii) companies in which 40% or more of the equity share capital
is held by a foreign company or its nominees; banking, Insurance and Government companies are excluded. Figures represent equity holding of investors in the country of controland their proportionate share in the free reserves of the foreign controlled rupee companies.
2. Portfolio equity investment in non-foreign controlled rupee companiesand ordinary shares of foreign controlled rupee companies held by investors in countries other than the countryof control and investment in preference shares and debentures, non-resident holdings of preference shares and debentures of rupee companies.
3. Flow of long-term foreign liabilities are exclusive of valuation changes and hence would differ from the net changes in the book values at from outstanding levels.4. Data for the years 1953 to 1962 relate to calendar years while those for 1963-64 onwards relate to fiscal years.5. In view of the shift in the assessment period from calendar year to financial year it has not been possible to indicate the inflows/outflows during 1962-63.6. Stock figures relate to end of the period and flow figures relate to during the year.7. Data are not available for 1980-81 through 1985-86 as no survey was conducted during this period.8. Data between 1987-88 to 1989-90 is not available.
Source: Monograph on India’s Balance of Payments, July 1993

Appendix 3(C): Foreign Investment Inflows : 1990-91 to 2002-03Appendix 3(C): Foreign Investment Inflows : 1990-91 to 2002-03Appendix 3(C): Foreign Investment Inflows : 1990-91 to 2002-03Appendix 3(C): Foreign Investment Inflows : 1990-91 to 2002-03Appendix 3(C): Foreign Investment Inflows : 1990-91 to 2002-03(In US Million)
1990-91 1991-92 1992-93 1993-94 1994-95 1995-96 1996-97 1997-98 1998-99 1999-00 2000-01 2001-02 2002-03
(1) (2) (3) (4) (5) (6) (7) (8) (9) (10) (11) (12) (13) (14)
A.A.A.A.A. Direct InvestmentDirect InvestmentDirect InvestmentDirect InvestmentDirect Investment 9797979797 129129129129129 315315315315315 586586586586586 1,3141,3141,3141,3141,314 2,1442,1442,1442,1442,144 2,8212,8212,8212,8212,821 3,5573,5573,5573,5573,557 2,4622,4622,4622,4622,462 2,1552,1552,1552,1552,155 4,0294,0294,0294,0294,029 6,1316,1316,1316,1316,131 4,6604,6604,6604,6604,660
I. Equity (a+b+c+d+e) .. 129 315 586 1,314 2,144 2,821 3,557 2,462 2,155 2,400 4,095 2,700
a. Government (SIA/FIPB) .. 66 222 280 701 1,249 1,922 2,754 1,821 1,410 1,456 2,221 919
b. RBI .. - 42 89 171 169 135 202 179 171 454 767 739
c. NRI .. 63 51 217 442 715 639 241 62 84 67 35 -
d. Acquisition of shares* .. .. .. .. .. 11 125 360 400 490 362 881 916
e. Equity capital of
unincorporated bodies .. .. .. .. .. .. .. .. .. .. 61 191 126
II. Reinvested earnings $ .. .. .. .. .. .. .. .. .. .. 1,350 1,646 1,498
III. Other Capital $$ .. .. .. .. .. .. .. .. .. .. 279 390 462
B.B.B.B.B. Portfolio InvestmentPortfolio InvestmentPortfolio InvestmentPortfolio InvestmentPortfolio Investment 66666 44444 244244244244244 3,5673,5673,5673,5673,567 3,8243,8243,8243,8243,824 2,7482,7482,7482,7482,748 3,3123,3123,3123,3123,312 1,8281,8281,8281,8281,828 -61-61-61-61-61 3,0263,0263,0263,0263,026 2,7602,7602,7602,7602,760 2,0212,0212,0212,0212,021 979979979979979
a. GDRs/ADRs # - - 240 1,520 2,082 683 1,366 645 270 768 831 477 600
b. FIIs ** - - 1 1,665 1,503 2,009 1,926 979 -390 2,135 1,847 1,505 377
c. Offshore funds and others 6 4 3 382 239 56 20 204 59 123 82 39 2
Total (A+B)Total (A+B)Total (A+B)Total (A+B)Total (A+B) 103103103103103 133133133133133 559559559559559 4,1534,1534,1534,1534,153 5,1385,1385,1385,1385,138 4,8924,8924,8924,8924,892 6,1336,1336,1336,1336,133 5,3855,3855,3855,3855,385 2,4012,4012,4012,4012,401 5,1815,1815,1815,1815,181 6,7896,7896,7896,7896,789 8,1528,1528,1528,1528,152 5,6395,6395,6395,6395,639
* : : : : : Relates to acquisition of shares of Indian companies by non-residents under Section 5 of FEMA, 1999 Data on such acquisitions have been included as part of FDI since January 1996.# : : : : : Represents the amount raised by Indian corporates through Global Depositary Receipts (GDRs) and American Depository Receipts (ADRs)** : : : : : Represents fresh inflow of funds by Foreign Institutional Investors (FIIs)$ : : : : : Data for 2002-03 are estimated as average of previous two years.$$ : : : : : Data pertain to inter-company debt transactions of FDI entities.Notes::::: 1. 1. 1. 1. 1. Data on FDI has been revised since 2000-01 with expanded coverage to approach international best practices. These data, therefore, are not comparable with FDI data for previous
years.Source:RBI, Annual Report, 2003
59B
alance of Paym
ents

Balance of P
ayments
60
Appendix 4(A): Inflows under FCNR and NR(E)RA Accounts 1975 to 1999-00Appendix 4(A): Inflows under FCNR and NR(E)RA Accounts 1975 to 1999-00Appendix 4(A): Inflows under FCNR and NR(E)RA Accounts 1975 to 1999-00Appendix 4(A): Inflows under FCNR and NR(E)RA Accounts 1975 to 1999-00Appendix 4(A): Inflows under FCNR and NR(E)RA Accounts 1975 to 1999-00
FCNRA@ NR(E)RA
Year Including accrued interest Excluding estimated accrued interest
Rs. crore U.S.$ million Rs. crore U.S.$ million Rs. crore U.S.$ million(1) (2) (3) (4) (5) (6) (7)
1975-76 6.5 7.5 33.1 38.1 29.8 34.31976-77 50.0 55.7 126.1 140.4 117.2 130.51977-78 83.4 97.1 134.7 156.8 116.7 135.81978-79 17.6 21.3 167.2 203.2 138.6 168.41979-80 -5.0 -6.2 209.0 258.1 167.3 206.51980-81 -3.7 -4.7 236.8 299.4 93.7 118.51981-82 -16.3 -18.2 321.3 358.3 87.3 -97.31982-83 109.1 112.8 420.2 434.7 111.9 115.81983-84 331.4 320.9 575.1 556.2 341.2 330.01984-85 275.4 231.7 609.7 512.8 603.6 507.71985-86 1151.2 940.8 597.5 488.3 616.0 503.41986-87 1172.8 917.8 874.8 684.6 477.0 373.41987-88 1362.8 1051.1 770.8 594.5 477.0 368.01988-89 2230.0 1540.0 792.0 546.9 235.0 162.01989-90 2165.0 1309.0 608.0 365.2 277.0 166.01990-91 255.0 168.0 842.0 469.1 156.0 84.01991-92 -3605.0 -1611.0 - - -44.0 -27.01992-93 223.0 86.0 - - 111.0 39.01993-94 -7416.0 -2364.0 - -1994-95 - - - - - -1995-96 - - - - - -1996-97 - - - - - -1997-98 - - - - - -1998-99 - - - - - -1999-00 - - - - - -
Notes: @: Excluding accrued interest.Sources: Monograph on India's Balance of Payments, July, 1993
RBI's Annual Report, 2003

Appendix 4(B): NRI Deposits - Outstandings : 1975-76 to 2002-03Appendix 4(B): NRI Deposits - Outstandings : 1975-76 to 2002-03Appendix 4(B): NRI Deposits - Outstandings : 1975-76 to 2002-03Appendix 4(B): NRI Deposits - Outstandings : 1975-76 to 2002-03Appendix 4(B): NRI Deposits - Outstandings : 1975-76 to 2002-03
(U.S. $ million) (As at the end of March)
Year (end March) 1975 1976 1977 1978 1979 1980 1981 1982 1983 1984(1) (2) (3) (4) (5) (6) (7) (8) (9) (10) (11)
1.1.1.1.1. FCNR(A)FCNR(A)FCNR(A)FCNR(A)FCNR(A) ** 9 65 168 192 188 185 157 252 570
2.2.2.2.2. FCNR(B)FCNR(B)FCNR(B)FCNR(B)FCNR(B) ** ** ** ** ** ** ** ** ** **
3.3.3.3.3. NR(E)RANR(E)RANR(E)RANR(E)RANR(E)RA 40 71 216 386 604 856 1145 1347 1684 2105
4.4.4.4.4. NR(NR)RDNR(NR)RDNR(NR)RDNR(NR)RDNR(NR)RD ** ** ** ** ** ** ** ** ** **
(U.S. $ million) (As at the end of March)
Year (end March) 1985 1986 1987 1988 1989 1990 1991 1992 1993 1994(1) (2) (3) (4) (5) (6) (7) (2) (3) (4) (5)
1.1.1.1.1. FCNR(A)FCNR(A)FCNR(A)FCNR(A)FCNR(A) 770 1770 2719 3828 5275 6586 10103 9792 10617 9300
2.2.2.2.2. FCNR(B)FCNR(B)FCNR(B)FCNR(B)FCNR(B) ** ** ** ** ** ** ** ** ** 1108
3.3.3.3.3. NR(E)RANR(E)RANR(E)RANR(E)RANR(E)RA 2304 2817 3354 3942 3774 3777 3618 3025 2740 3523
4.4.4.4.4. NR(NR)RDNR(NR)RDNR(NR)RDNR(NR)RDNR(NR)RD ** ** ** ** ** ** *** *** 610 1754
(U.S. $ million) (As at the end of March)
Year (end March) 1995 1996 1997 1998 1999 2000 2001 2002 2003(1) (6) (7) (8) (9) (10) (11) (12) (13) (14)
1.1.1.1.1. FCNR(A)FCNR(A)FCNR(A)FCNR(A)FCNR(A) 7051 4255 2306 1 * * * * *
2.2.2.2.2. FCNR(B)FCNR(B)FCNR(B)FCNR(B)FCNR(B) 3063 5720 7496 8467 7835 8172 9076 9673 10193
3.3.3.3.3. NR(E)RANR(E)RANR(E)RANR(E)RANR(E)RA 4556 3916 4983 5637 6045 6758 7147 8449 14716
4.4.4.4.4. NR(NR)RDNR(NR)RDNR(NR)RDNR(NR)RDNR(NR)RD 2486 3542 5604 6262 6618 6754 6849 7052 3449
@ ::::: inclusive of accrued interest* ::::: withdrawn effective August, 1994@@ ::::: The inflows into NR(E)RA deposits during the year 2003-04 may partly be due to crediting of maturity proceeds of the NR(NR)R deposits which were discontinued with effect from
April 1, 2002.** ::::: introduced in May, 1993*** ::::: introduced in June, 1992Source::::: Reserve Bank of India Bulletin, July, 2003
61B
alance of Paym
ents

Appendix 5: External Transactions As Per CSOAppendix 5: External Transactions As Per CSOAppendix 5: External Transactions As Per CSOAppendix 5: External Transactions As Per CSOAppendix 5: External Transactions As Per CSO’s National Accounts Statisticss National Accounts Statisticss National Accounts Statisticss National Accounts Statisticss National Accounts Statistics As Per 1980-81 Series (at Current Prices) As Per 1980-81 Series (at Current Prices) As Per 1980-81 Series (at Current Prices) As Per 1980-81 Series (at Current Prices) As Per 1980-81 Series (at Current Prices)
(Rupees, Crore)
ItemItemItemItemItem 1960-611960-611960-611960-611960-61 1961-621961-621961-621961-621961-62 1962-631962-631962-631962-631962-63 1963-641963-641963-641963-641963-64 1964-651964-651964-651964-651964-65 1965-661965-661965-661965-661965-66 1966-671966-671966-671966-671966-67 1967-681967-681967-681967-681967-68 1968-691968-691968-691968-691968-69 1969-701969-701969-701969-701969-70
(1) (2) (3) (4) (5) (6) (7) (8) (9) (10) (11) (12)
IIIII Current TransactionsCurrent TransactionsCurrent TransactionsCurrent TransactionsCurrent Transactions
(1) Exports of goods and services 784 802 835 985 1015 932 1325 1508 1597 1625(4.6) (4.4) (4.3) (4.4) (3.9) (3.4) (4.2) (4.1) (4.1) (3.8)
(2) Compensation of Employees from the rest of the world 2 2 2 1 3 4 5 1 7 7
(3) Property and enterprenuerial income from the rest of the world 14 12 11 11 11 11 18 20 26 34
(4) Other current transfers from the rest of the world 45 53 48 55 56 95 110 121 144 139
(5) Adjustment of merchandise exports to the change of ownership basis* N.A. N.A. N.A. N.A. N.A. N.A. N.A. N.A. N.A. N.A.
(6) Current receipts 845 869 896 1052 1085 1042 1458 1650 1774 1805 (7) Imports of goods and services 1236 1110 1209 1363 1526 1464 2115 2201 1897 1747
(7.2) (6.1) (6.2) (6.1) (5.8) (5.3) (6.8) (6.0) (4.9) (4.1) (8) Compensation of employees
to the rest of the world 11 16 18 13 22 26 35 37 37 33 (9) Property and enterpreneurial income
to the rest of the world 62 80 95 103 120 135 211 230 240 252(10) Other current tranfers
to the rest of the world 17 18 14 13 17 16 20 19 16 14(11) Adjustment of merchandise
imports to the change of ownership basis* N.A. N.A. N.A. N.A. N.A. N.A. N.A. N.A. N.A. N.A.
(12) Surplus of the nation on current transactions -495 -361 -448 -448 -619 -616 -930 -849 -427 -269
(13) Disposal of current receipts 845 869 896 1052 1085 1042 1458 1650 1774 1805
IIIIIIIIII Capital TransactionsCapital TransactionsCapital TransactionsCapital TransactionsCapital Transactions
(14) Surplus of the nation on current transactions -495 -361 -448 -448 -619 -616 -930 -849 -427 -269
(15) Capital transfers from the rest of the world (Net) 45 23 60 76 128 76 71 22 40 19
(16) Incurrence of foreign liabilities (Net) 0 0 0 0 0 0 0 0 0 0(17) Receipts -450 -338 -388 -372 -491 -540 -859 -827 -387 -250(18) Purchases of intangible assets
n.e.c. from the rest of the world (Net) 0 0 0 0 0 0 0 0 0 0
(19) Acquisition of foreign financial assets -450 -338 -388 -372 -491 -540 -859 -827 -387 -250
(20) Disbursements -450 -338 -388 -372 -491 -540 -859 -827 -387 -250
(Contd)
Balance of Payments 62

Appendix 5: External Transactions As Per CSOAppendix 5: External Transactions As Per CSOAppendix 5: External Transactions As Per CSOAppendix 5: External Transactions As Per CSOAppendix 5: External Transactions As Per CSO’s National Accounts Statisticss National Accounts Statisticss National Accounts Statisticss National Accounts Statisticss National Accounts Statistics As Per 1980-81 Series (at Current Prices) As Per 1980-81 Series (at Current Prices) As Per 1980-81 Series (at Current Prices) As Per 1980-81 Series (at Current Prices) As Per 1980-81 Series (at Current Prices)
(Rupees, Crore)
ItemItemItemItemItem 1970-711970-711970-711970-711970-71 1971-721971-721971-721971-721971-72 1972-731972-731972-731972-731972-73 1973-741973-741973-741973-741973-74 1974-751974-751974-751974-751974-75 1975-761975-761975-761975-761975-76 1976-771976-771976-771976-771976-77 1977-781977-781977-781977-781977-78 1978-791978-791978-791978-791978-79 1979-801979-801979-801979-801979-80
(1) (2) (13) (14) (15) (16) (17) (18) (19) (20) (21) (22)
IIIII Current TransactionsCurrent TransactionsCurrent TransactionsCurrent TransactionsCurrent Transactions
(1) Exports of goods and services 1771 1785 2149 2830 3835 4812 6139 6636 7115 8381(3.9) (3.6) (4.0) (4.3) (4.9) (5.8) (6.8) (6.5) (6.5) (6.9)
(2) Compensation of Employees from the rest of the world 8 8 6 3 1 2 4 56 4 8
(3) Property and enterprenuerial income from the rest of the world 49 35 38 42 95 116 188 268 398 645
(4) Other current transfers from the rest of the world 136 175 165 204 280 541 746 1029 1059 1632
(5) Adjustment of merchandise exports to the change of ownership basis* -132 N.A. N.A. -172 -149 -135 -13 30 -171 -258
(6) Current receipts 1832 2003 2358 2907 4062 5606 7064 7968 8405 10408(7) Imports of goods and services 1816 1994 2328 3176 4779 5143 5614 6522 7426 9859
(4.0) (4.1) (4.3) (4.8) (6.2) (6.2) (6.3) (6.4) (6.7) (8.2)(8) Compensation of employees
to the rest of the world 11 12 11 12 11 11 23 48 54 20(9) Property and enterpreneurial income
to the rest of the world 300 282 305 325 281 322 368 410 452 433(10) Other current tranfers
to the rest of the world 13 12 11 12 6 13 7 7 17 8(11) Adjustment of merchandise
imports to the change of ownership basis* 86 N.A. N.A. -226 -362 0 -257 -487 584 668
(12) Surplus of the nation on current transactions -424 -518 -327 -425 -748 77 1275 1417 -180 -627
(13) Disposal of current receipts 1832 2003 2358 2907 4062 5606 7064 7968 8405 10408
IIIIIIIIII Capital TransactionsCapital TransactionsCapital TransactionsCapital TransactionsCapital Transactions
(14) Surplus of the nation on current transactions -424 -518 -327 -425 -748 77 1257 1417 -180 -627
(15) Capital transfers from the rest of the world (Net) 53 75 43 1691 8 176 216 270 296 336
(16) Incurrence of foreign liabilities (Net) 0 0 0 0 0 0 0 0 0 0(17) Receipts -371 -443 -284 1266 -740 -371 253 1491 116 -288(18) Purchases of intangible assets
n.e.c. from the rest of the world (Net) 0 0 0 0 0 0 0 0 0 0
(19) Acquisition of foreign financial assets -371 -443 -284 1266 -740 253 1491 1687 116 -288
(20) Disbursements -371 -443 -284 1266 -740 253 1491 1687 116 -288
(Contd)
63 Balance of Payments

Balance of Payments 64
Appendix 5: External Transactions As Per CSOAppendix 5: External Transactions As Per CSOAppendix 5: External Transactions As Per CSOAppendix 5: External Transactions As Per CSOAppendix 5: External Transactions As Per CSO’s National Accounts Statisticss National Accounts Statisticss National Accounts Statisticss National Accounts Statisticss National Accounts Statistics As Per 1980-81 Series (at Current Prices) As Per 1980-81 Series (at Current Prices) As Per 1980-81 Series (at Current Prices) As Per 1980-81 Series (at Current Prices) As Per 1980-81 Series (at Current Prices)
(Rupees, Crore)
ItemItemItemItemItem 1980-811980-811980-811980-811980-81 1981-821981-821981-821981-821981-82 1982-831982-831982-831982-831982-83 1983-841983-841983-841983-841983-84 1984-851984-851984-851984-851984-85 1985-861985-861985-861985-861985-86 1986-871986-871986-871986-871986-87 1987-881987-881987-881987-881987-88 1988-891988-891988-891988-891988-89 1989-901989-901989-901989-901989-90
(1) (2) (23) (24) (25) (26) (27) (28) (29) (30) (31) (32)
IIIII Current TransactionsCurrent TransactionsCurrent TransactionsCurrent TransactionsCurrent Transactions
(1) Exports of goods and services 9029 10256 11563 13139 15846 14951 16543 20281 25913 34632(6.3) (6.1) (6.1) (6.0) (6.5) (5.4) (5.3) (5.7) (6.1) (7.1)
(2) Compensation of Employees from the rest of the world 6 9 10 9 12 14 9 17 33 113
(3) Property and enterprenuerial income from the rest of the world 859 820 515 469 590 679 654 586 613 700
(4) Other current transfers from the rest of the world 2269 2237 2541 2785 3116 2835 2991 3533 3865 3824
(5) Adjustment of merchandise exports to the change of ownership basis* -135 -41 334 397 215 683 853 722 415 584
(6) Current receipts 12028 13281 14963 16799 19779 19161 21060 25139 30839 39817(7) Imports of goods and services 13596 14809 15736 17675 19484 21754 22359 25259 32010 40300
(9.5) (8.8) (8.4) (8.1) (7.9) (7.8) (7.2) (7.1) (7.6) (8.3)(8) Compensation of employees
to the rest of the world 35 27 72 72 113 112 178 380 390 332(9) Property and enterpreneurial
income to the rest of the world 485 762 1087 1350 1913 2009 2290 2842 4752 6212(10) Other current tranfers
to the rest of the world 12 16 14 11 15 14 15 34 34 26(11) Adjustment of merchandise
mports to the change of ownership basis* -6 278 620 208 1546 1506 2573 3448 5667 5226
(12) Surplus of the nation on current transactions -2094 -2611 -2566 -2517 -3292 -6234 -6335 -6825 -12304 -12279
(13) Disposal of current receipts 12028 13281 14963 16799 19779 19161 21060 25139 30839 39817
II Capital TransactionsII Capital TransactionsII Capital TransactionsII Capital TransactionsII Capital Transactions
(14) Surplus of the nation on current transactions -2094 -2611 -2566 -2517 -3292 -6234 -6355 -6825 -12304 -12279
(15) Capital transfers from the rest of the world (Net) 438 294 270 255 440 307 525 532 724 897
(16) Incurrence of foreign liabilities (Net) 1864 1342 3257 3774 3588 4232 5707 5864 9658 10990(17) Receipts 208 -975 961 1512 736 -1665 -123 -429 -1922 -392(18) Purchases of intangible assets
n.e.c.from the rest of the world (Net) 0 0 0 0 0 0 0 0 0 0
(19) Acquisition of foreign financial assets 208 -975 961 1512 736 -1695 -123 -429 -1922 -392
(20) Disbursements 208 -975 961 1512 736 -1695 -123 -429 -1922 -392
(Contd)

Appendix 5: External Transactions As Per CSOAppendix 5: External Transactions As Per CSOAppendix 5: External Transactions As Per CSOAppendix 5: External Transactions As Per CSOAppendix 5: External Transactions As Per CSO’s National Accounts Statistics As Per 1980-81 Seriess National Accounts Statistics As Per 1980-81 Seriess National Accounts Statistics As Per 1980-81 Seriess National Accounts Statistics As Per 1980-81 Seriess National Accounts Statistics As Per 1980-81 Seriesfor 1990-91 to 1992-93 and As Per 1993-94 Series thereafter (All at Current Prices) for 1990-91 to 1992-93 and As Per 1993-94 Series thereafter (All at Current Prices) for 1990-91 to 1992-93 and As Per 1993-94 Series thereafter (All at Current Prices) for 1990-91 to 1992-93 and As Per 1993-94 Series thereafter (All at Current Prices) for 1990-91 to 1992-93 and As Per 1993-94 Series thereafter (All at Current Prices) (Concluded)
(Rupees, Crore)
ItemItemItemItemItem 1990-911990-911990-911990-911990-91 1991-921991-921991-921991-921991-92 1992-931992-931992-931992-931992-93 1993-941993-941993-941993-941993-94 1994-951994-951994-951994-951994-95 1995-961995-961995-961995-961995-96 1996-971996-971996-971996-971996-97 1997-981997-981997-981997-981997-98 1998-991998-991998-991998-991998-99 1999-001999-001999-001999-001999-00
(1) (2) (33) (34) (35) (36) (37) (38) (39) (40) (41) (42)
IIIII Current TransactionsCurrent TransactionsCurrent TransactionsCurrent TransactionsCurrent Transactions
(1) Exports of goods and services 40635 56254 67312 86147 101607 130733 144854 165203 195281 231111(7.1) (8.6) (9.0) (10.0) (10.0) (11.0) (10.6) (10.9) (11.1) (11.8)
(2) Compensation of Employees from the rest of the world 74 117 35 105 278 302 528 0 180 646
(3) Property and enterprenuerial income from the rest of the world 676 558 1021 1284 2830 4838 3811 5795 7953 7727
(4) Other current transfers from the rest of the world 3737 9419 8124 11344 18881 22220 44208 43929 43494 53280
(5) Adjustment of merchandise exports to the change of ownership basis* 595 880 1074 1395 1655 2127 2377 2602 4683 3068
(6) Current receipts 45717 67228 77566 100238 125251 160220 195778 217529 251591 2955832(7) Imports of goods and services 48696 56249 73000 85999 104710 144953 161022 184333 224743 256007
(8.6) (8.6) (9.8) (10.0) (10.3) (12.2) (11.8) (12.1) (12.8) (13.1)(8) Compensation of employees
to the rest of the world 320 286 347 1277 1299 1504 1841 235 69 57(9) Property and enterpreneurial income
to the rest of the world 7975 10466 12512 12455 14892 17120 15580 18765 23032 23747(10) Other current tranfers
to the rest of the world 26 37 35 68 58 108 240 165 252 148(11) Adjustment of merchandise
imports to the change of ownership basis* 6894 3567 5488 5529 16183 17315 34833 36333 21582 35529
(12) Surplus of the nation on current transactions -18196 -3377 -13816 -4791 -11891 -20780 -17738 -22302 -18087 -19656
(13) Disposal of current receipts 5717 67228 77566 100238 125251 160220 195778 217529 251591 295832
IIIIIIIIII Capital TransactionsCapital TransactionsCapital TransactionsCapital TransactionsCapital Transactions
(14) Surplus of the nation on current transactions -18196 -3377 -13816 -4791 -11891 -20780 -17738 -22302 -18087 -19656
(15) Capital transfers from the rest of the world (Net) 828 1140 1053 1155 1309 1173 1457 1417 1300 1657
(16) Incurrence of foreign liabilities (Net) 16624 10606 12608 23965 19331 18753 53210 48072 48285 45675(17) Receipts -744 8369 -155 20329 8749 -854 36929 27187 31497 27676(18) Purchases of intangible assets
n.e.c.from the rest of the world (Net) 0 0 0 0 0 0 0 0 0 0
(19) Acquisition of foreign financial assets -744 8369 -155 20329 8749 -854 36929 27187 31497 27676
(20) Disbursements -744 8369 -155 20329 8749 -854 36929 27187 31497 27676
***** Shows the difference between the figures of merchandise exports/imports from the two sources viz. RBI and DGCI & S.Note: Figures within bracket represent percentages to GDP at Current Market Prices.Sources: CSO, National Accounts Statistics, (various issues)
65 Balance of Payments