Embed Size (px)
Citation preview

March 2016
OIES PAPER: WPM 65
India’s Oil Demand: On the Verge of ‘Take-Off’?
Amrita Sen* & Anupama Sen**

India’s Oil Demand: On the Verge of ‘Take-Off’?
i
The contents of this paper are the authors’ sole responsibility. They do not
necessarily represent the views of the Oxford Institute for Energy Studies or any of
its members.
Copyright © 2016
Oxford Institute for Energy Studies
(Registered Charity, No. 286084)
This publication may be reproduced in part for educational or non-profit purposes without special
permission from the copyright holder, provided acknowledgment of the source is made. No use of this
publication may be made for resale or for any other commercial purpose whatsoever without prior
permission in writing from the Oxford Institute for Energy Studies.
ISBN 978-1-78467-053-5
*Chief Oil Analyst, Energy Aspects
**Senior Research Fellow, Oxford Institute for Energy Studies

India’s Oil Demand: On the Verge of ‘Take-Off’?
ii
Acknowledgements
The authors are grateful to Bassam Fattouh, Richard Mallinson and Xin Li for their comments and
help on this paper. Many thanks to Elisabeth Wood, Kate and Catherine for their help with formatting
and publication.
India’s Oil Demand: On the Verge of ‘Take-Off’?
iii
Contents
Acknowledgements .............................................................................................................................. ii Abstract .................................................................................................................................................. 4 1. Introduction .................................................................................................................................... 1 2. Historical and Current Oil Demand .............................................................................................. 3 3. The Concept of ‘Take-off’ in Economic Growth and Energy Use ............................................. 7 4. Per Capita Oil Consumption ......................................................................................................... 8
4.1 Vehicle ownership ................................................................................................................... 9 4.2 Infrastructure and Road Building........................................................................................... 12 4.3 Environmental Factors .......................................................................................................... 14
5. The Push towards Manufacturing .............................................................................................. 15 5.1 The ‘Make in India’ policy initiative ........................................................................................ 15 5.2 The effect on oil consumption ............................................................................................... 17 5.3 Naphtha and Petrochemicals ................................................................................................ 18
6. Implications for Trade Flows ...................................................................................................... 19 7. Conclusion ................................................................................................................................... 21 References ........................................................................................................................................... 22 Appendix 1: Estimates of oil consumption in manufacturing ........................................................ 24
Figures
Figure 1: Oil Demand Growth in China and India: year-on-year changes (kb/d) .................................... 1
Figure 2: Oil Consumption by top consumers, 2000–14 (kb/d) .............................................................. 2
Figure 3: Year-on-Year Growth in India’s Crude Oil Consumption, 1965–2015 (kb/d) .......................... 3
Figure 4: Year-on-Year Change in Total Oil Demand, 2014–15 (kb/d) .................................................. 4
Figure 5: India Oil Product Demand, 2009–15........................................................................................ 5
Figure 6: Per capita oil consumption, 2014 (b/d) .................................................................................... 9
Figure 7: India – Car ownership and penetration .................................................................................. 10
Figure 8: China – Car ownership and penetration ................................................................................ 10
Figure 9: India – Vehicle ownership and penetration (cars plus two-wheelers) ................................... 11
Figure 10: Additions to India’s total vehicle fleet ................................................................................... 12
Figure 11: Per capita income and vehicles per 1000 people in India ................................................... 13
Figure 12: Construction of National Highways in India ......................................................................... 13
Figure 13: Sectoral Shares of GDP (%) ............................................................................. 15 Figure 14: Growth in Sectors (%) ............................................................................. 15
Figure 15: Manufacturing GDP (US$) and Estimated/Projected Oil Consumption in Manufacturing (’000 tonnes) ......................................................................................................................................... 18
Figure 16: Exports and Oil Consumption .............................................................................................. 20
Tables Table 1: Sectors Targeted through ‘Make in India’ ............................................................................... 16
Table 2: Targeted Growth in Manufacturing Sectors ............................................................................ 17

4
Abstract
Over the last decade, non-OECD oil demand growth, and by extension global oil demand growth, was driven
mainly by China, which accounted for half to two-thirds of this growth. However, since the Chinese
government embarked on a deliberate policy of rebalancing, the country’s annual demand growth has slowed
to under 0.3 mb/d, compared to an average demand growth of over 0.5 mb/d in the 10 years prior to 2013. In
this new era of slower Chinese growth, a new contender has emerged: India, which in 2015 was the main
driver of non-OECD oil demand growth. In this paper we argue that in addition to the boost from low oil prices,
structural and policy-driven changes are underway which could result in India’s oil demand ‘taking off’ in a
similar way to China’s during the late 1990s, when Chinese oil demand was at levels roughly equivalent to
current Indian oil demand. These changes include: a rise in per capita oil consumption (reflected in rising
motorization of the Indian economy), a massive programme of road construction (amounting to 30 km per
day), and a push towards increasing the share of manufacturing in GDP by 2022 (which could increase oil
consumption by at least a third based on a conservative linear estimate). This paper also examines the
implications of a take-off in domestic demand for India’s recently acquired status as a net petroleum product
exporter.
Keywords: India, oil, demand, manufacturing, transportation, construction

1
1. Introduction
In 2015, India emerged as the main driver of non-OECD oil demand growth, with world demand
growth at its strongest since 2010, at 1.8 million barrels per day (mb/d). However, in contrast with
2010, when demand growth was largely stimulus-led following the global financial downturn, demand
growth in 2015 was independent of stimulus, although the 50 per cent fall in oil prices provided a
significant boost to consumer demand. Although part of the demand growth has come from OECD
economies, where a slow global economic recovery is underway, an interesting dynamic pertaining to
shifts in non-OECD demand growth has emerged over the course of the last year.
Over the last decade, non-OECD demand growth, and by extension global oil demand growth, was
driven mainly by China, which accounted for half to two-thirds of this growth. However, since the
Chinese government embarked on a deliberate policy of rebalancing economic growth away from
export-oriented heavy industry, the country’s annual demand growth has slowed to under 0.3 mb/d,
compared to an average figure of just over 0.5 mb/d in the decade prior to 2013. Despite a sharp drop
in oil prices, this slowing trend continued in 2015, with Chinese demand growth ranging around 0.3
mb/d from January to November.1
In this new era of slower Chinese growth, a new contender has emerged: India. Touted by many as
the worthy successor to China, Indian oil demand growth had previously failed to parallel that of
China, partly due to the proportionately dominant share of its services sector relative to manufacturing
in GDP, and partly because a situation of ‘political paralysis’ over the last few years was unattractive
for industrial investment. India’s burgeoning budget deficit prior to the oil price drop, worsened by oil
prices above US$100 per barrel, added to the lacklustre investment climate, and oil demand growth
languished at around 0.13 mb/d for the past decade. However, 2015 saw a ‘new India’ emerge, with
oil demand growth year-on-year (y/y) jumping to 0.3 mb/d, a record high (see Figure 1).
Figure 1: Oil Demand Growth in China and India: year-on-year changes (kb/d)
Source: Energy Aspects.
India is soon likely to overtake Japan as the second-largest oil consuming economy in Asia (see
Figure 2). Part of this demand growth has come from the effects of a low oil price. The global price
downturn, which began in June 2014, halved the oil import bills of the largest oil importing economies,
bringing substantial fiscal improvements (World Bank, 2015a; 2015b). This implies potential longer-
term effects for economic growth: for instance, a 10 per cent decrease in oil prices is estimated to
1 December data was not available at the time of writing.

2
raise growth in oil-importing countries by 0.1 to 0.5 per cent, depending on the share of oil imports in
GDP (World Bank, 2015a; 2015b; Rasmussen and Roitman, 2011). Furthermore, the shift in income
from oil exporting economies with high average savings rates, to net importers with a higher
propensity to spend, is said to result in stronger global demand over the medium term (World Bank,
2015a; 2015b).
Figure 2: Oil Consumption by top consumers, 2000–14 (kb/d)
Source: BP (2015)
Note: Excludes USA.
Apart from the effects of the oil price decline, India’s GDP growth is estimated to have overtaken
China’s in 2015 (7.2 per cent growth for India, as opposed to 6.9 per cent for China) and is forecast to
remain relatively high in 2016, with China’s economy readjusting to a ‘new normal’ of lower growth
(IMF, 2016). Improvements in macroeconomic and fiscal indicators (for instance, a historically low
current account deficit at around 1.6 per cent of GDP as of late 2015) suggest that India’s GDP
growth could continue on a relatively high path, subject to its ability to carry out structural reform. This
has significant long-term implications for the country’s oil demand. The oil ministry, for instance,
estimates that India will consume 3.56 mb/d of refined products in the current financial year (which
began 1 April 2015); this figure is 7 per cent higher y/y, much larger than a previous estimate of 3.3
per cent.
In this paper we argue that in addition to the boost from low oil prices, structural and policy-driven
changes are underway which could result in India’s oil demand ‘taking off’ in a similar way to China’s
during the late 1990s, when Chinese oil demand was at levels roughly equivalent to current Indian oil
demand. India’s per capita oil consumption has increased as a result of the increased affordability of
oil in various uses (on the back of the drop in the oil price) for a large section of its population who
could not previously afford it; this is becoming visible in the motorization of the Indian economy.
Furthermore, the Indian government’s target of increasing the manufacturing sector’s share of GDP to
25 per cent by the beginning of the next decade (from roughly 15 per cent at present) could lead to
higher oil consumption in manufacturing. Finally, the programme of infrastructure construction (roads
and national highways) that is being partly funded through revenues from the higher taxation of oil
and oil products is also likely to support oil demand growth.
The paper begins in Section 2, by looking at the rising trend in oil consumption, and breaks this down
into growth in product demand (diesel, gasoline, and LPG) to identify which sector has had the most
significant effect on oil demand. Section 3 briefly discusses the theory of ‘take-off’ in economic
growth, specifically in relation to energy (and oil) use, highlighting the role of the transport sector and
the significance of a key metric – the trend in motorization. Section 4 focuses on per capita oil
consumption through the lens of the transport (specifically automobile) sector, where the prices of the
main oil products have been liberalized; these prices have responded relatively quickly to movements
in international crude prices, and have in turn affected consumption. This section also looks at

3
environmental constraints on transportation, whilst also considering the government’s road
construction programmes in relation to oil use. Section 5 examines India’s recent push towards
manufacturing, and the potential impact of this on oil consumption. Section 6 discusses the
implications of all the above issues for product trade flows, in light of India’s recent status as a net
petroleum product exporter. Section 7 concludes.
2. Historical and Current Oil Demand
Historical data for India shows that crude oil consumption has been rising at a steady rate (Figure 3).
Over the past decade or so (2004–15), the average oil demand growth has been roughly 0.15 mb/d
annually. This steady rise is consistent with the literature on oil consumption in countries at relatively
early stages of income and development,2 which concludes that income effects tend to ‘swamp’ price
effects in these stages, implying a low price elasticity of demand. Fattouh et al. (2013) for instance,
show an income elasticity of demand for gasoline and diesel of around 1 for India between 2005 and
2012. These figures are consistent with a large number of studies that find similar income elasticity
values for developing countries (IMF, 2011; Dahl 1993). The IMF in 2011, for instance, predicted that
between 2015 and 2018 the Indian economy would grow at around 6 per cent on average. An income
elasticity of around unity implies that diesel and gasoline consumption would grow at a similar rate
(Fattouh et al., 2013).
Figure 3: Year-on-Year Growth in India’s Crude Oil Consumption, 1965–2015 (kb/d)
Source: BP (2015); Energy Aspects.
In addition to this expected long-term trend, however, there was an upsurge in oil demand in India
during 2014 and 2015. Although some of the upsurge can be attributed to lower prices (and the
increased affordability of oil to consumers), it has occurred despite the removal of oil product
subsidies and the imposition of excise duties on oil consumers, implying that the full extent of the
price fall has not even been passed on to consumers.3 Retail selling prices of diesel and gasoline did
not fall commensurately with the drop in the crude oil price in late 2014; notably, the Indian
government carried out four excise duty increases from November 2014 to January 2015, which
2 Relative to OECD economies. 3 The Indian government had reduced excise duties to zero during the period of US$100 oil prices (between 2010-mid 2014) in
an attempt to mitigate the impact on finances of the National Oil Companies and state-owned oil marketing companies, as their
revenues were used to finance the oil subsidy and import bills.

4
supported retail prices.4 Retail prices actually stabilized at levels equivalent to a crude price of around
70 US$/bbl.
This demand pattern can be better understood by a further examination of data from 2014 and 2015
(Figure 4), as oil demand remained largely depressed during 2013 due to an economic downturn in
India. It picked up in June 2014 with the strongest demand growth since January 2013, but remained
relatively muted through 2014 and registered its first fall since August 2014 in October 2014. Demand
rebounded from November 2014 onwards, showing a then record increase of 9.4 per cent in February
2015 (or 0.34 mb/d, totalling 3.91 mb/d – the second highest growth on record at the time).
Figure 4: Year-on-Year Change in Total Oil Demand, 2014–15 (kb/d)
Source: Energy Aspects. Note: Indian crude oil price excludes taxes.
Demand growth remained robust through 2015, albeit with occasional dips due to a weakening rural
sector.5 In September 2015 y/y demand growth reached 0.5 mb/d (similar to levels seen in China in
the 2000s; totalling 3.82 mb/d) and a record 0.62 mb/d in October6 – the latter was led by diesel,
rising (y/y) by 0.22 mb/d (16.3 per cent), following a mammoth 0.25 mb/d of diesel demand growth in
September. Growth rates were, however, inflated by a very low 2014 base, during which floods
impacted irrigation and construction activity, weighing on diesel in particular. 7 Gasoline demand
increased y/y by 14.5 per cent to 0.53 mb/d, supported by rising vehicle miles driven and stronger car
sales. In October, domestic passenger car sales rose at their fastest pace for four and half years, with
y/y growth at 21.8 per cent. Two-wheeler sales, the key driver of gasoline demand, hit a record high of
over 5.25 million units, up y/y by nearly 37 per cent.
4 India’s gasoline and diesel prices are adjusted fortnightly, in line with international crude oil prices. Gasoline prices were
liberalized at the retail level in 2010, whereas diesel prices were liberalized in September 2014 following an 18 month process
of the gradual elimination of the diesel subsidy. See Fattouh et al. (2013) for further analysis. The four excise duty hikes totalled
Rs7.75/litre for gasoline and Rs6.50/litre for diesel. 5 Demand growth slowed in March, May, and July, owing to factors such as erratic rainfall and poor crop realization. 6 This coincided with the festive season in India. 7 See ‘India and Pakistan Floods’, BBC News, 9 September 2014. Available at www.bbc.com/news/world-asia-india-29121941.

5
Figure 5: India Oil Product Demand, 2009–15
a) Diesel sales (mb/d) b) Y/y Change – Diesel sales (kb/d)
c) Gasoline demand (mb/d) d) Y/y Change (kb/d) – Gasoline sales
e) LPG sales (mb/d) f) Y/y Change (kb/d) – LPG sales
Source: Energy Aspects

6
While November 2015 demand growth eased back to a more realistic 6.4 per cent (0.24 mb/d),
December 2015 demand growth picked back up to 0.31 mb/d. Average oil demand growth from April
2014 to December 2015 was around 0.22 mb/d, while average growth from January to December
2015 was 0.29 mb/d, both figures being considerably higher than the historical average demand
growth of roughly 0.1–0.15 mb/d between 2000 and 2015. Demand stayed near record highs at 3.95
mb/d in January, higher y/y by 0.45 mb/d, continuing with the momentum seen in 2015.
A clearer picture of the growth of oil demand in various uses can be obtained by a closer look at a
breakdown of product demand – particularly diesel, gasoline, and LPG (Figure 5, a–f). Although
influenced by various seasonal factors (for instance, by monsoon rainfall), it is possible to discern
some trends from April 2014 to January 2016.
Diesel growth has been somewhat inconsistent over the period under observation due to the
cyclicality of demand (reflected in Figure 5a). Diesel is mostly used in goods transportation and
agricultural (tractor) operations; notably, both agricultural and power generation demand tend to be
seasonal. But the inconsistency of diesel demand is also due to the effect of the gradual removal of
diesel subsidies and the substitution effect with gasoline – this is reflected in the Indian auto industry,
in which product demand has arguably swung towards gasoline. 8 Average monthly growth rates
(based on y/y changes) in diesel demand over the period were around 4 per cent, with demand
contracting in six out of 21 months.9 Overall, diesel demand growth over 2015 has been strong – a
record figure of 20.2 per cent (totalling 1.47 mb/d) being seen in September. By November, growth
had slowed dramatically to 1.6 per cent as floods in southern India curtailed economic activity, but it
picked up in December to achieve a total of 1.57 mb/d. Diesel demand in January 2016 picked up to
1.52 mb/d, with y/y growth rising to 0.11 mb/d (7.9 per cent).
Average growth in gasoline demand (based on y/y changes) has been consistently high, at around 12
per cent between April 2014 and December 2015. February and April 2015 were notable months as
demand growth in both touched 20 per cent (y/y). A record 25.5 per cent (y/y) (0.53 mb/d) was
reached in September; this was followed by a marginally lower y/y growth in October (totalling 0.52
mb/d), before a rise to 17.2 per cent in November, and to 0.50 mb/d (total) in December, growing
further by 51 thousand b/d (y/y) in January 2016. The majority of this growth has been driven by the
Indian automobile sector, particularly two-wheeler sales in addition to passenger cars.
LPG demand has consistently posted positive y/y growth since April 2014, with average monthly
growth rates (based on y/y changes) at around 8.2 per cent between April 2014 and December 2015.
The highest y/y growth during the period was in December 2014, at 17.7 per cent (0.96 mb/d), but
growth from January to December 2015 averaged around 0.57 mb/d. Some of this has come off the
back of the provision of LPG subsidies, but it has also been due to the gradual move towards
urbanization and a shift in household fuel use away from non-commercial sources and kerosene. LPG
demand reached a record high of 0.68 mb/d in December 2015, before easing to 0.64 mb/d in
January 2016.
The data indicate a ‘jump’ in oil demand over the past several months. The growth in product demand
– particularly gasoline – is reminiscent of the growth rates in China about a decade ago, at the
beginning of the country’s industrialization ‘boom’, when Chinese gasoline demand went on to
average around 1 mb/d. Moreover, India’s growth in demand has occurred despite the removal of
subsidies and the imposition of excise duties.
8 This is a partial reversal of a previous trend – when gasoline prices were liberalized in 2010, the Indian auto industry (which at
the time was 70 per cent gasoline), had turned into an 80 per cent diesel market by 2012, and auto companies were either
diverting gasoline vehicles to export markets or using heavy promotions and discounts to market them domestically. 9 Including April and October 2014, and March, May, and July 2015.

7
3. The Concept of ‘Take-off’ in Economic Growth and Energy Use
The concept of ‘stages’ of economic growth in a country’s economic trajectory is distinctive in the
literature on growth theory. It can be traced back to a paper, published by W.W. Rostow in 1956,
which describes the process of economic growth as centring on a relatively brief time interval of two
or three decades when an economy, and the society of which it is a part, transform themselves in
such ways that economic growth is subsequently more or less automatic. The sequence of growth is
taken to consist of three periods: a long period (amounting to several decades) when the
preconditions for take-off are established,10 the take-off itself, defined within two or three decades,
and a long period when growth becomes normal and relatively automatic11 (Rostow, 1956). These
three stages do not preclude the possibility of growth giving way to secular stagnation and decline.
The ‘take-off’ is further defined as requiring three related conditions (Rostow, 1956):
(a) A rise in the rate of productive investment from 5 per cent or less to over 10 per cent of national income or net national product;
(b) The development of one or more substantial manufacturing sectors, with a high rate of growth; and,
(c) The existence or emergence of a political, social, and institutional framework which supports sustained economic growth.
Rostow’s theory of a stage-based growth trajectory has not been empirically proven, and as such, is
considered by many to be redundant. For instance, while the presumption of stage-based growth is a
sequential progression from agricultural to industrial growth, developing economies such as India
have followed a non-linear path, with the tertiary (or services) sector forming the largest proportion of
GDP, whilst the take-off in manufacturing has thus far failed to occur. However, Rostow
acknowledges that a growing society need not replicate the structural sequence of developed
economies such as Britain or the USA (on which the theory is largely based) but stipulates that four
basic factors must be present (Rostow, 1956):
i) There must be an enlarged effective demand for the product or products of sectors which have the potential to generate a rapid rate of growth in output. Historically this has been brought about by the transfer of income from consumption to productive investment, by capital imports, by a sharp increase in the productivity of current investment inputs yielding an increase in the consumers’ real income expended on domestic manufactures, or by a combination of the above.
ii) There must be an introduction into these sectors of new production functions as well as an expansion of capacity.
iii) The society must be capable of generating the capital initially required to catalyse the take-off in these key sectors, and there must be a high rate of plough-back by the state or private entrepreneurs controlling capacity and technique in these sectors, and in supplementary growth sectors.
iv) The leading sector(s) must be such that their expansion and technical transformation induce a chain of Leontief input–output requirements for increased capacity and the potential for new production functions in other sectors, to which the society progressively responds.
It can be argued that although empirically unproven, the fundamental concept of the economic ‘take-
off’ is a normative ideal to which most developing country governments aspire and one which they
consequently attempt to catalyse through specific policies. One of the reasons for a lack of consensus
around the empirical evidence on ‘stage-based’ theories of economic growth is that it has been
10 Also termed the ‘traditional society’ and ‘transition’ stages. 11 Also known as the ‘drive to maturity’ and the ‘stage of high mass consumption’.

8
extremely difficult to pinpoint a ‘watershed’ growth period for any economy based on historical data.
Furthermore, some of the stipulated conditions for take-off – such as a rise in the rate of productive
investment to over 10 per cent of national income or net national product – are arguably redundant,
as many economies (for instance, India) have attained levels of 20–30 per cent without clearly
demonstrating a watershed period. Nevertheless, some broad patterns are discernible in the data for
developing countries; for example, the push towards manufacturing as a catalyst for the economic
take-off stage (similar to the course taken by China).
Some studies of ‘take-off’ have taken a microeconomic approach, focusing specifically on an
economic sector and looking for stage-based advancements. In energy use, Bruce (2005) suggests
an ‘energy ladder’ for analysing fuel use patterns in lighting and cooking for poor households; it
argues that a move up the energy ladder from traditional fuels (firewood, for instance) to more
commercial and efficient, yet costlier, fuels (such as LPG and electricity) coincides with increased
income and progress in economic development. The energy ladder hypothesis is based on the
assumption that as households move up the income ladder, they not only consume more of the same
fuel, but also start using better quality fuels. El Katiri and Fattouh analyse the energy ladder
hypothesis in detail, using recent evidence which suggests that as incomes rise, households tend to
increase the number of fuels used (fuel stacking) but do not completely switch from the consumption
of traditional fuels to modern ones (El-Katiri and Fattouh, 2011). Furthermore, the causality under the
energy ladder approach to stage-based economic development is unclear: improved access to energy
can contribute to improvements in household incomes through enabling factors such as education
and productivity (El-Katiri and Fattouh, 2011).
A more recent approach to the study of stage-based economic growth has been to focus on per
capita oil consumption in transport, which is estimated to account for over half of oil consumption
worldwide. The underlying argument is that as economies and incomes grow, larger proportions of
their populations become vehicle owners, contributing to the ‘motorization’ of the economy. The
relationship between the growth of vehicle ownership and per capita income is highly non-linear
(Dargay et al., 2007). Various empirical studies have postulated that vehicle ownership grows
relatively slowly at the lowest levels of per capita income, then about twice as fast as income at
middle income levels (4,000–10,000 US$ per capita), and about as fast as income at high income
levels, before reaching ‘saturation’ at the very highest levels of income (~US$30,000) (Dargay et al.,
2007). Previous studies have empirically modelled this effect as an ‘S’ shaped curve, estimated
through a Gompertz function (Dargay et al., 2007; Dargay and Gately, 1999).12 Dargay et al. (2007)
utilize historical data and projections on passenger vehicle ownership and per capita income for
OECD and non-OECD countries (including India), using an ‘S’ shaped function. Based on their data,
they estimate that the vehicle ownership level at which the maximum income elasticity occurs is
around 90 vehicles per 1000 people.
In the remaining sections of this paper, we use evidence from India to explore the argument that
Indian oil demand is poised for a ‘take-off’, reflecting a wider economic shift. It is beyond the scope of
this paper to pinpoint whether this falls within any of the defined stages of economic growth in a wider
sense, but it is analytically useful to have this discussion of stage-based growth theory as the context,
both to our main arguments and to India’s recent ‘policy push’.
4. Per Capita Oil Consumption
India’s per capita oil consumption remains relatively low in comparison to both the world’s largest
consuming economies and to other non-OECD countries (Figure 6). The wealthiest 10 per cent of its
12 The Gompertz function, used to model the relationship between per capita income and vehicle ownership, is similar to a
logistic function, but allows different curvatures at low and high income levels.

9
population accounts for a quarter of household energy expenditure. Furthermore, household
expenditure on energy is two and a half times higher in urban areas than in rural areas, with the most
affluent sectors of the urban population spending around eight times as much as the poorest,
whereas in rural areas the most affluent only spend four and a half times as much as the poorest
(IEA, 2015). The drop in oil prices (the price of the Indian crude oil basket has fallen from 109
US$/barrel in June 2014 to 25 US$/barrel in January 2016) 13 has been sufficient to increase
affordability for a whole new segment of the growing middle class population. The effect of prices is
reflected in both higher consumption of fuels as well as a switch away from bioenergy and kerosene
towards commercial fuels such as LPG.
Figure 6: Per capita oil consumption, 2014 (b/d)
Source: BP (2015).
4.1 Vehicle ownership
Following Dargay and Gately (2007), the effect on per capita oil consumption is best observed in the
transportation sector, which accounts for roughly 40 per cent of India’s oil consumption (most of which
is diesel).14 The bars (scale on the left axis) in Figure 7 show figures for car ownership in India, while
the line illustrates the number of cars per 1000 people in the country (scale on the right axis). In 2014,
this latter measure stood at 20 per 1000 people;15 this is well below the maximum elasticity level of 90
per 1000 postulated by Dargay et al. (2007). It is also far below levels seen in other economies which
have arguably begun to approach maximum income elasticity, followed by a plateau. For instance,
Figure 8 shows car ownership and penetration for China, and the data thus displayed imply that China
reached the estimated ‘maximum elasticity’ level of 90 cars per 1000 people sometime between 2013
and 2014. In contrast, India appears to be somewhere around the level that China was at in the mid-
2000s (2006–7) in terms of both car ownership and penetration.
13 ‘Global crude oil price of Indian basket was US$24.96 per bbl on 18.01.2016’, Press Information Bureau, Ministry of
Petroleum and Natural Gas, Government of India. Available at http://pib.nic.in/newsite/PrintRelease.aspx?relid=134583. 14 70 per cent of oil consumption in transport in India is accounted for by diesel (IEA, 2014). 15 Authors’ analysis. This estimate is corroborated by the estimate of passenger vehicle ownership in IEA (2015).

10
Figure 7: India – Car ownership and penetration
Source: Authors’ analysis; Ministry of Road Transport and Highways, India.16
Figure 8: China – Car ownership and penetration
Source: Authors’ analysis; National Bureau of Statistics of China.17
Car ownership and penetration, although commonly used in OECD studies as an indicator of
economic take-off, is not an entirely accurate representation of patterns in India. Car sales are
indicative of the effect of rising incomes and the move towards higher-end private transportation;
16 See http://morth.nic.in/. 17 Data available at http://data.stats.gov.cn/english/easyquery.htm?cn=C01 . We use data for Chinese civil passenger vehicles,
in line with the literature estimating Gompertz curves for China. See Huo et al. (2007).

11
however, two-wheeler sales are much more reflective of the number of new consumers entering the
market for personal transportation, on the back of the increased affordability of oil. The purchasing of
two-wheelers is therefore a closer reflection of a step up on the energy ladder towards motorization.
Figure 9 depicts the ownership and penetration of cars and two-wheelers combined for India, and
shows the much higher figure of 144 per 1000 people. It can be expected that much of the two-
wheeler fleet will be replaced by cars, as consumers continue to climb the energy ladder on the back
of rising economic growth and per capita income.
Figure 9: India – Vehicle ownership and penetration (cars plus two-wheelers)
Source: Authors’ analysis; Ministry of Road Transport and Highways, India.
Figures 7 and 9 illustrate the fact that India’s vehicle ownership pattern mimics the rising trend of the
Gompertz curve. Furthermore, while India’s per capita income in FY 2015 was estimated at
Rs88,533,18 when this figure was converted on a purchasing power parity metric (US$1 = Rs17),19 it
stood at US$5,208, falling just above the lower bound of the middle-income range of ‘peaking’ income
elasticity of demand as postulated by Dargay et al. (2007). ‘Saturation’ levels for OECD countries
such as the USA are estimated to be around 850 vehicles per 1000 people; India’s low-income
curvature (estimated by Dargay et al. 2007 at 200 vehicles per 1000 people) is estimated to be
reached at a per capita income level of US$6,500, while its saturation level is predicted to be roughly
683 per 1000 people (Dargay et al., 2007). Figures 7 and 9 also depict a ‘jump’ in vehicle ownership
and penetration having taken place around 2014. Figure 10 shows additions to India’s total vehicle
fleet disaggregated by cars, two-wheelers, and all other vehicles; this shows that the ‘take-off’ has
been driven mainly by additions of two-wheelers to the total vehicle fleet, further reinforcing the point
that a combination of rising per capita income levels and the drop in the oil price have facilitated the
affordability of oil to a wide range of lower and middle income consumers.
India is now the world’s sixth largest car market, with 26 million units sold in 2014. From 2010 to
2015, car sales have been increasing by around 2 million units annually. Percentage growth rates are
misleading here. Even if the market slows down, the crucial factor for oil markets is that the vast
majority of new car sales in India go to fleet expansion. That is to say, unlike developed markets
(where the majority of new cars are replacing ageing vehicles that are being scrapped and overall
fleet growth tends to track population growth) India, like other developing markets, is experiencing a
rapid increase in the size of its vehicle fleet.
18 See ‘Per capita income rises to Rs88,533 in FY15’, Hindu Business Line, 26 February. Available at
www.thehindubusinessline.com/economy/per-capita-income-rises-to-rs-88533-in-fy15/article6937042.ece 19 Based on PPP conversion factor, GDP; from World Bank World Development Indicators 2014.

12
Figure 10: Additions to India’s total vehicle fleet
Source: Ministry of Road Transport and Highways, India.
Between 2007 and 2014 the size of India’s vehicle fleet nearly doubled, rising from around 96 million
vehicles to just under 200 million vehicles. And while the used car market is growing, it remains a
fraction of new car sales. The average Indian car is just five years old, so relatively few cars are old
enough to be worth scrapping. Not surprisingly, this implies that new car sales and fleet growth are
closely correlated. Furthermore, the major proportion of the increase in vehicle sales is accounted for
by two-wheelers (Figure 10), reflecting the entry of new consumers into the passenger vehicle
transportation market.
Collectively, this evidence implies that India’s vehicle ownership pattern is indicative of the
motorization stage, with consequent implications for oil consumption. For instance, when China
underwent a similar take-off in oil consumption, vehicle ownership was estimated to be growing 2.2
times as fast as per capita income (Dargay et al., 2007).
4.2 Infrastructure and Road Building
One aspect that is not separately accounted for in the literature related to economic ‘take-off’ is the
development of infrastructure. In the studies discussed above, per capita income is taken to be the
primary determinant of vehicle ownership growth and saturation levels (Figure 11). The development
of infrastructure, particularly roads in developing countries, is assumed to follow the trajectory seen in
developed countries.
13
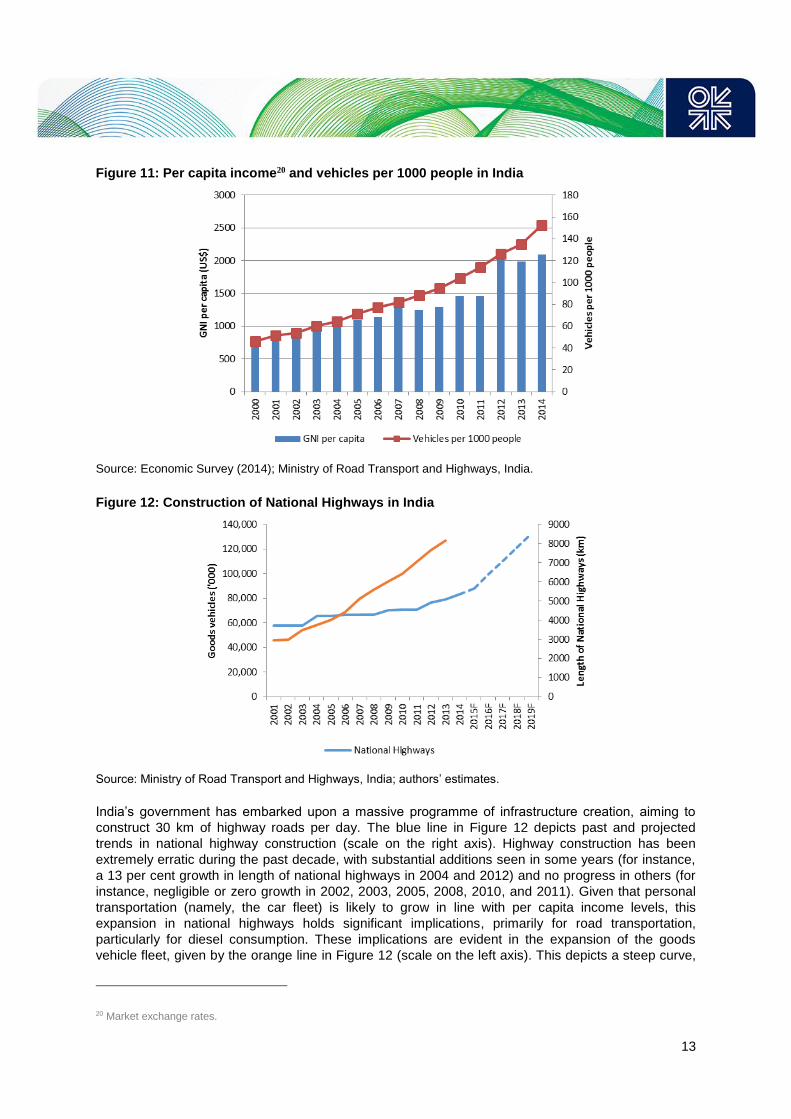
Figure 11: Per capita income20 and vehicles per 1000 people in India
Source: Economic Survey (2014); Ministry of Road Transport and Highways, India.
Figure 12: Construction of National Highways in India
Source: Ministry of Road Transport and Highways, India; authors’ estimates.
India’s government has embarked upon a massive programme of infrastructure creation, aiming to
construct 30 km of highway roads per day. The blue line in Figure 12 depicts past and projected
trends in national highway construction (scale on the right axis). Highway construction has been
extremely erratic during the past decade, with substantial additions seen in some years (for instance,
a 13 per cent growth in length of national highways in 2004 and 2012) and no progress in others (for
instance, negligible or zero growth in 2002, 2003, 2005, 2008, 2010, and 2011). Given that personal
transportation (namely, the car fleet) is likely to grow in line with per capita income levels, this
expansion in national highways holds significant implications, primarily for road transportation,
particularly for diesel consumption. These implications are evident in the expansion of the goods
vehicle fleet, given by the orange line in Figure 12 (scale on the left axis). This depicts a steep curve,
20 Market exchange rates.
14
indicating that the size of the goods vehicle fleet has been rising despite flat growth in national
highway construction in previous years. The broad conclusion from this is that the ‘boom’ in road
construction, if successfully achieved, will further lift the expansion of the goods vehicle fleet and
concomitantly increase diesel consumption. In a recently released ‘Global Construction 2030’ report,21
the Indian construction market is highlighted as the key driver of growth – being set to overtake Japan
as the third-largest construction market within the next five years.
4.3 Environmental Factors
A factor that is largely unaccounted for in the literature on growth-based motorization is that of
environmental constraints, imposed through policy measures on pollution, aimed at curbing
particulate matter emissions from vehicles. While this constraint is unlikely to alter the trend in
motorization, it will alter the demand for oil products used in enabling motorization. In India, this is
likely to affect diesel demand, as diesel-powered vehicles account for over 90 per cent of SUVs, 34
per cent of small cars, and 70 per cent of large/medium cars. In December 2015, India’s Supreme
Court placed restrictions on the use of high-end diesel passenger vehicles (including SUVs with an
engine size of 2000 cc and above) in India’s National Capital Region (which includes Delhi, ranked
amongst the most polluted cities in the world); these restrictions ban such high-end vehicles from new
registrations until 31 March 2016. The Court has also banned diesel goods vehicles registered prior to
2005 from entering Delhi. Furthermore, all taxis in the capital must mandatorily switch to Compressed
Natural Gas (CNG); this is estimated to impact around 30,000 vehicles. The impact of the ban on
overall diesel demand in January 2016 was relatively small (around 10-20 thousand b/d), more than
offset by higher demand from manufacturing.
Delhi’s state administration has also imposed a ‘green cess’ on light and heavy commercial vehicles
which will push up the cost of maintaining diesel vehicles. Should policy measures aimed at
controlling air pollution be replicated in other large metropolitan areas, India’s transport sector could
see a massive shift towards gasoline (in passenger vehicles) and CNG (in public transportation).
However, this is unlikely to fundamentally alter the rising trend of the Gompertz curve, as diesel will
be substituted by gasoline and CNG in the growth of the vehicle fleet. CNG use in India is currently
constrained by infrastructure – the existing number of CNG filling stations is unable to cater to even
existing demand, let alone allow for a potential increase. There is therefore likely to be a lag between
the substitution of diesel with CNG, and the shortfall could be made up by gasoline.
That said, much like the position in other emerging markets, Indian policymakers are increasingly
concerned about rising urban air pollution levels. In January 2016, Delhi’s government carried out a
15 day pilot programme when private cars were allowed to operate on public roads only on alternate
days, depending on whether their licence plates ended in an even or an odd number. As the middle
class population grows and more cars are purchased, such measures are likely to be more widely
adopted. However, certain exemptions apply: for instance – and importantly for gasoline – two-
wheelers have thus far been excluded from such initiatives. Nevertheless, over the longer run, the
pace of gasoline demand growth is likely to be tempered from the double digit figures seen in 2015 to
around 8–9 per cent over the next decade.
21‘A global forecast for the construction industry to 2030’, Global Construction Perspectives and Oxford Economics, 10
September 2015. Available at https://www.pwc.com/gx/en/engineering-construction/pdf/global-construction-summit-2030-
enr.pdf.

15
5. The Push towards Manufacturing
While the bulk of the growth in Indian oil demand so far has been in the transportation and power
sectors, an important aspect for oil products demand going forward could be the potential change to
industrial fuel demand.
5.1 The ‘Make in India’ policy initiative
In September 2014, India’s government announced a major policy initiative entitled ‘Make in India’;
this was aimed at expanding the share of manufacturing from 15 per cent of GDP (around which
figure it has languished for a long time, see Figure 13), to 25 per cent by the year 2022. The primary
driver behind the adoption of this policy has been a growing concern over the creation of jobs for
India’s growing working-age demographic22 – it has been estimated that 220 million additional jobs
will be required by 2025 (GoI, 2011). India’s manufacturing sector currently comprises roughly 11 per
cent of total employment, in contrast with the position in other emerging markets where the share of
manufacturing employment ranges from 15 to 30 per cent (GoI, 2013), and the ‘Make in India’ policy
aims to generate 100 million additional manufacturing jobs by 2022. In order to do so, it has been
estimated that India’s manufacturing sector as a whole will need to grow at a rate that is 2 to 4
percentage points higher than the growth rate of its GDP, a pattern that is visible in most other
emerging market economies, where manufacturing sector growth has equalled or exceeded GDP
growth (GoI, 2011; 2013). In contrast, India’s manufacturing sector has generally grown at a rate
below that of its GDP.23
Figure 13: Sectoral Shares of GDP (%) Figure 14: Growth in Sectors (%)
Source: India Open Government Data Platform, 2015.24
22 Around 60 per cent of India’s population is aged between 15 and 59 years of age. 23 The annual average growth of manufacturing from 1999 to 2009 was 6.8 per cent, compared with GDP growth of 7 per cent
for the same period. In contrast, China’s manufacturing sector grew at 10.3 per cent during 1999–2009, whereas its GDP grew
at 9.9 per cent for the same period. 24 Manufacturing is usually a subset of industry but has been represented separately for analytical purposes. Refer to India’s
National Industrial Classification for details. Available at http://mospi.nic.in/Mospi_New/site/inner.aspx?status=2&menu_id=129

16
As seen in Figure 14, manufacturing growth over the last decade has been inconsistent (relative to
services, which have achieved 5–10 per cent growth) with frequent spikes and troughs, and it slowed
down to 2 per cent in 2012. The push towards manufacturing through ‘Make in India’ aims at raising
the manufacturing growth rate to 12–14 per cent by 2025 (GoI, 2013). It appears to be targeted at
replicating China’s success: China’s manufacturing sector currently comprises 30 per cent of GDP,
and its manufacturing output as a percentage of world output has risen from below 5 per cent in 1970
to roughly 19 per cent in 2010 (GoI, 2013). Export-oriented manufacturing has formed an important
part of China’s economic boom; its merchandise exports rose from a figure of 2 per cent of world
merchandise exports in 1990, to 12 per cent in 2014. In contrast, India’s share of world merchandise
exports rose from less than 1 per cent to under 2 per cent during the same period.25
The push towards manufacturing through ‘Make in India’ is targeted towards specific segments of
manufacturing industry: employment-intensive industries, capital goods industries, strategically
important industries (the development of ‘national capabilities’), industries where India is seen as
already having a competitive advantage (through existing indigenous expertise and cost effective
manufacturing), Small and Medium Enterprises (SMEs),26 and public sector enterprises. These are
summarized in Table 1 below.27
Table 1: Sectors Targeted through ‘Make in India’
Employment-intensive industries Textiles and garments, leather and footwear,
gems and jewellery, food processing.
Capital goods Machine tools, heavy electrical equipment,
heavy transport, earth moving and mining
equipment.
Strategic industries Aerospace, shipping, IT hardware and
electronics, telecommunications equipment,
defence equipment, solar energy.
Competitive advantage Automobiles, pharmaceuticals, medical
equipment.
Small and Medium Enterprises (SMEs) Miscellaneous.
Public Sector Enterprises Miscellaneous.
Source: GoI (2011).
Table 2 further details the estimated growth rates deemed necessary within specific sub-sectors of
manufacturing in order to achieve these manufacturing targets (GoI, 2013). This is based on several
assumptions, which include the target annual average growth rate of 12 per cent for the
manufacturing sector as a whole during the Twelfth Five-Year Plan (2012–17) and until 2025.
25 In 2010, manufacturing represented 61.5 per cent of India’s total merchandise exports. 26 SMEs contribute significantly to manufacturing output, employment, and exports. 27 ‘Make in India’ separates the target sectors into automobiles, auto components, aviation, biotechnology, chemicals,
construction, defence, manufacturing, electrical machinery, electronic system design and manufacturing, food processing,
leather, mining, oil and gas, pharmaceuticals, ports, railways, roads and highways, renewable energy, ‘space’, textiles, and
thermal power.
17
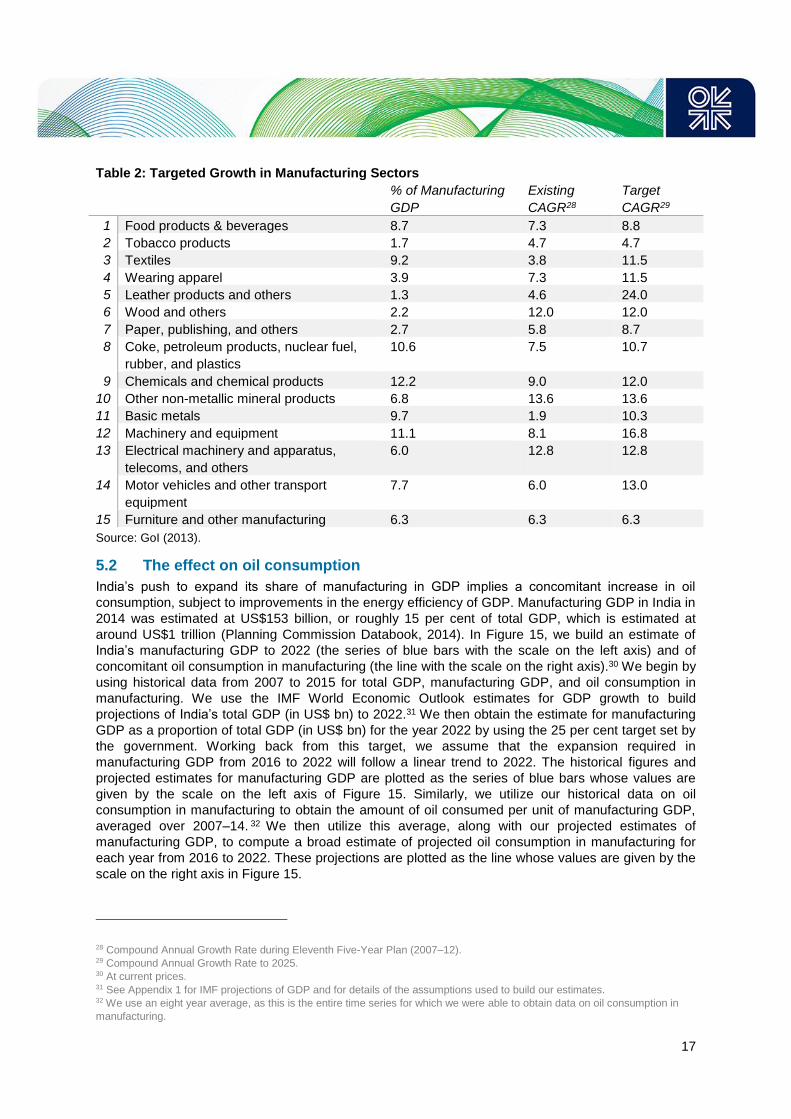
Table 2: Targeted Growth in Manufacturing Sectors
% of Manufacturing
GDP
Existing
CAGR28
Target
CAGR29
1 Food products & beverages 8.7 7.3 8.8
2 Tobacco products 1.7 4.7 4.7
3 Textiles 9.2 3.8 11.5
4 Wearing apparel 3.9 7.3 11.5
5 Leather products and others 1.3 4.6 24.0
6 Wood and others 2.2 12.0 12.0
7 Paper, publishing, and others 2.7 5.8 8.7
8 Coke, petroleum products, nuclear fuel,
rubber, and plastics
10.6 7.5 10.7
9 Chemicals and chemical products 12.2 9.0 12.0
10 Other non-metallic mineral products 6.8 13.6 13.6
11 Basic metals 9.7 1.9 10.3
12 Machinery and equipment 11.1 8.1 16.8
13 Electrical machinery and apparatus,
telecoms, and others
6.0 12.8 12.8
14 Motor vehicles and other transport
equipment
7.7 6.0 13.0
15 Furniture and other manufacturing 6.3 6.3 6.3
Source: GoI (2013).
5.2 The effect on oil consumption
India’s push to expand its share of manufacturing in GDP implies a concomitant increase in oil
consumption, subject to improvements in the energy efficiency of GDP. Manufacturing GDP in India in
2014 was estimated at US$153 billion, or roughly 15 per cent of total GDP, which is estimated at
around US$1 trillion (Planning Commission Databook, 2014). In Figure 15, we build an estimate of
India’s manufacturing GDP to 2022 (the series of blue bars with the scale on the left axis) and of
concomitant oil consumption in manufacturing (the line with the scale on the right axis).30 We begin by
using historical data from 2007 to 2015 for total GDP, manufacturing GDP, and oil consumption in
manufacturing. We use the IMF World Economic Outlook estimates for GDP growth to build
projections of India’s total GDP (in US$ bn) to 2022.31 We then obtain the estimate for manufacturing
GDP as a proportion of total GDP (in US$ bn) for the year 2022 by using the 25 per cent target set by
the government. Working back from this target, we assume that the expansion required in
manufacturing GDP from 2016 to 2022 will follow a linear trend to 2022. The historical figures and
projected estimates for manufacturing GDP are plotted as the series of blue bars whose values are
given by the scale on the left axis of Figure 15. Similarly, we utilize our historical data on oil
consumption in manufacturing to obtain the amount of oil consumed per unit of manufacturing GDP,
averaged over 2007–14. 32 We then utilize this average, along with our projected estimates of
manufacturing GDP, to compute a broad estimate of projected oil consumption in manufacturing for
each year from 2016 to 2022. These projections are plotted as the line whose values are given by the
scale on the right axis in Figure 15.
28 Compound Annual Growth Rate during Eleventh Five-Year Plan (2007–12). 29 Compound Annual Growth Rate to 2025. 30 At current prices. 31 See Appendix 1 for IMF projections of GDP and for details of the assumptions used to build our estimates. 32 We use an eight year average, as this is the entire time series for which we were able to obtain data on oil consumption in
manufacturing.

18
Figure 15: Manufacturing GDP (US$) and Estimated/Projected Oil Consumption in
Manufacturing (’000 tonnes)
Source: Authors’ estimates.
The projections show a clear upward trend from 2016 onwards, with oil consumption in manufacturing
in 2022 estimated at around a third higher than the figure for 2014. However, it must be stressed that
this is a broad and somewhat conservative estimate, based on a set of assumptions. The actual trend
could well be non-linear, and is contingent upon the effectiveness of government policy in catalysing
the required ramp-up in manufacturing GDP. Furthermore, improvements in energy efficiency could
temper oil consumption growth in manufacturing. However, one firm conclusion that can be drawn is
that the push towards manufacturing will support the upward trend in oil consumption, through to
2022.
5.3 Naphtha and Petrochemicals
Diesel will not be the sole beneficiary of the push toward manufacturing, as naphtha and bitumen
consumption are also likely to increase. Indeed, naphtha demand has grown considerably since
March 2015, reaching a double-digit growth figure in July 2015. Between July and November 2015,
naphtha demand growth averaged 29 per cent, with November growth a massive 40 per cent. This
was driven by the demand for naphtha as a gasoline blend stock, and more importantly by demand
from the growing petrochemical (particularly plastics and polymers) and fertilizer sectors. As
manufacturing demand grows, so will the demand for plastics (petrochemical industry), and naphtha
is best placed to benefit from this, particularly given the focus of the ‘Make in India’ campaign.
The Indian petrochemical industry has grown rapidly in the last 10 years; capacity expansions have
led to much greater self-sufficiency for major petrochemical building blocks such as ethylene,
propylene, butadiene, and aromatics, amongst others. These building blocks all had surplus capacity
of at least 0.5 million tons per annum (Mtpa)33 as of 2013. The olefinic base chemical capacity is
expected to increase from ~ 4.5 Mtpa to 8–10 Mtpa, while the aromatic base chemical capacity is
expected to increase from 3.2 Mtpa to 5–6 Mtpa over the next five to six years. Robust expansions in
the refining sector, together with surplus availability of naphtha as feedstock for petrochemical plants,
have supported this growth. Over the next five years, the capacity expansion projects announced by
33 Department of Chemicals and Petrochemicals.

19
all major Indian petrochemical companies will lead to a reversal of balances, with excess naphtha
supplies falling sharply.
For instance, Mangalore Refinery and Petrochemicals Limited (MRPL) recently launched its long-
delayed aromatics plant (OMPL), which will use naphtha. Brahmaputra Cracker & Polymer Ltd.
(BCPL) has begun commissioning activities for the first phase of its long-awaited integrated
petrochemical complex in Assam. Reliance Industries’ Jamnagar complex, although delayed, is also
expected to begin operations in the next few years. The long-delayed 1.1 Mtpa OPAL naphtha
cracker in Gujarat is inching toward completion and is likely to process some naphtha in 2016. Indian
Oil Corporation (IOCL) will expand capacity at its Panipat naphtha cracker to 1.2 Mtpa by 2019, from
0.85 Mtpa at present. A recent McKinsey report34 concludes that India will consume an additional 20–
25 Mtpa of petrochemical intermediates by 2025 as industrial demand rises. The Indian Ministry of
Petroleum and Natural Gas, which had earlier forecast that naphtha and fuel oil sales would contract
year-on-year in 2016, now foresees substantial growth for both fuels, with naphtha demand set to rise
in 2016 by 16.6 per cent. Thus, the petrochemical sector has contributed substantially to double-digit
growth rates in sales of naphtha.
6. Implications for Trade Flows
Our analysis suggests that oil consumption in India is at a potential inflection point, mimicking the
stage of economic ‘take-off’. It can be argued that the relationships between infrastructure creation,
the push towards manufacturing, and oil consumption, generally hold true for emerging markets, and
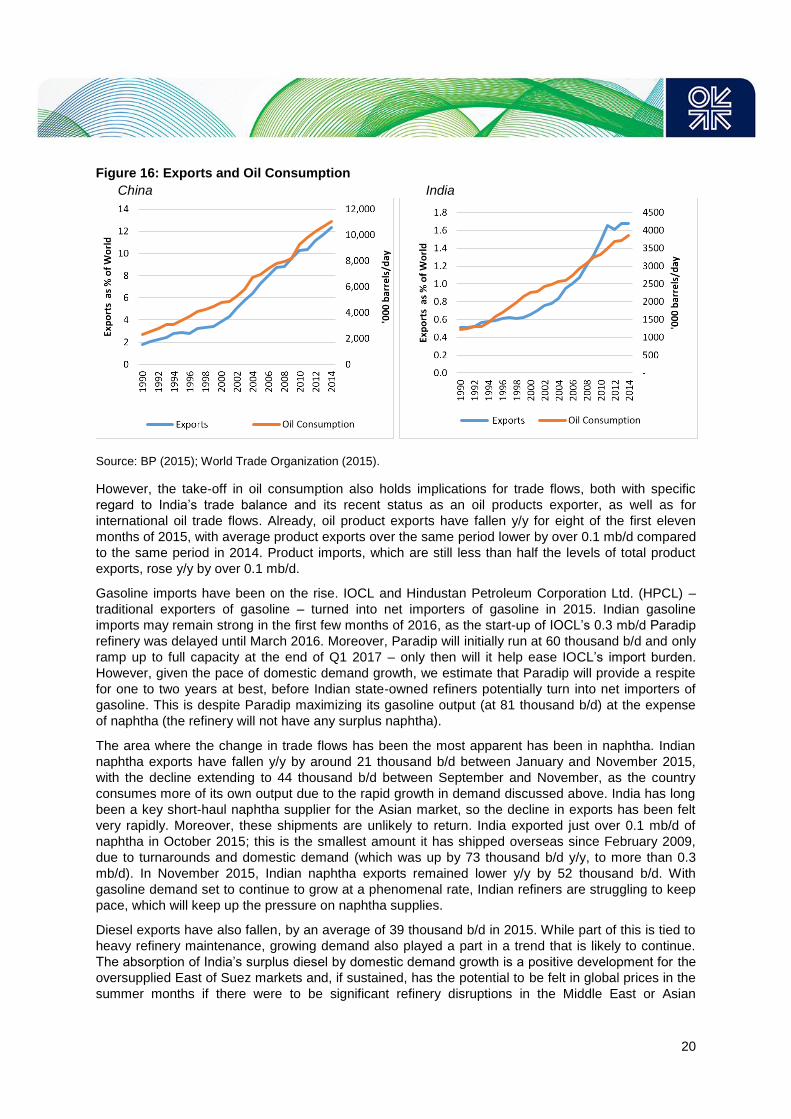
can be illustrated by looking at export data for China and India. 35 Figure 16 shows that oil
consumption and exports (plotted here as a percentage of GDP to enable relative comparisons) have
tended to move together – a simple correlation of India’s merchandise exports with its oil consumption
yields a strong positive coefficient of 0.92.36
34 ‘Building a self-sufficient petrochemical intermediates industry in India by 2025’, Chemicals Practice, McKinsey & Company,
March 2015. 35 We consider ‘exports’ as a uniform measure; this enables comparison between India and China, since ‘manufacturing’ may
constitute different definitions (and calculations) in either country’s national accounts data. Furthermore, it can be argued that
the bulk of manufacturing is injected into exports. 36 Authors’ estimate.
20
Figure 16: Exports and Oil Consumption
China India
Source: BP (2015); World Trade Organization (2015).
However, the take-off in oil consumption also holds implications for trade flows, both with specific
regard to India’s trade balance and its recent status as an oil products exporter, as well as for
international oil trade flows. Already, oil product exports have fallen y/y for eight of the first eleven
months of 2015, with average product exports over the same period lower by over 0.1 mb/d compared
to the same period in 2014. Product imports, which are still less than half the levels of total product
exports, rose y/y by over 0.1 mb/d.
Gasoline imports have been on the rise. IOCL and Hindustan Petroleum Corporation Ltd. (HPCL) –
traditional exporters of gasoline – turned into net importers of gasoline in 2015. Indian gasoline
imports may remain strong in the first few months of 2016, as the start-up of IOCL’s 0.3 mb/d Paradip
refinery was delayed until March 2016. Moreover, Paradip will initially run at 60 thousand b/d and only
ramp up to full capacity at the end of Q1 2017 – only then will it help ease IOCL’s import burden.
However, given the pace of domestic demand growth, we estimate that Paradip will provide a respite
for one to two years at best, before Indian state-owned refiners potentially turn into net importers of
gasoline. This is despite Paradip maximizing its gasoline output (at 81 thousand b/d) at the expense
of naphtha (the refinery will not have any surplus naphtha).
The area where the change in trade flows has been the most apparent has been in naphtha. Indian
naphtha exports have fallen y/y by around 21 thousand b/d between January and November 2015,
with the decline extending to 44 thousand b/d between September and November, as the country
consumes more of its own output due to the rapid growth in demand discussed above. India has long
been a key short-haul naphtha supplier for the Asian market, so the decline in exports has been felt
very rapidly. Moreover, these shipments are unlikely to return. India exported just over 0.1 mb/d of
naphtha in October 2015; this is the smallest amount it has shipped overseas since February 2009,
due to turnarounds and domestic demand (which was up by 73 thousand b/d y/y, to more than 0.3
mb/d). In November 2015, Indian naphtha exports remained lower y/y by 52 thousand b/d. With
gasoline demand set to continue to grow at a phenomenal rate, Indian refiners are struggling to keep
pace, which will keep up the pressure on naphtha supplies.
Diesel exports have also fallen, by an average of 39 thousand b/d in 2015. While part of this is tied to
heavy refinery maintenance, growing demand also played a part in a trend that is likely to continue.
The absorption of India’s surplus diesel by domestic demand growth is a positive development for the
oversupplied East of Suez markets and, if sustained, has the potential to be felt in global prices in the
summer months if there were to be significant refinery disruptions in the Middle East or Asian

21
markets. A ‘take-off’ in domestic oil demand could therefore reverse India’s recently achieved status
as a net oil products exporter, with significant implications for international trade flows.
7. Conclusion
India’s oil demand has soared over the last year, reaching an average figure for oil demand growth
y/y of 0.30 mb/d in 2015, compared with 0.1–0.15 mb/d over the previous decade. This jump in
demand reflects a number of underlying dynamics at play, which indicate that India’s oil demand may
be on the verge of ‘taking off’. The magnitude of this ‘take-off’ can be gauged by the fact that Indian oil
demand is demonstrating trends that were visible in China around a decade or a decade and a half
ago, during the country’s industrialization ‘boom’: for instance, the level of growth in oil product
demand, particularly gasoline, is rapidly approaching levels seen in China prior to its ‘boom’.
Furthermore, an analysis of motorization, widely regarded as an acceptable metric in gauging oil
consumption patterns and economic ‘take-off’, shows that car ownership trends in India (per thousand
population) are at around the levels which China reached a decade ago. India’s per capita income on
a purchasing power parity basis is also estimated to have breached the threshold beyond which
motorization rapidly ensues.
While the drop in oil prices since June 2014 has aided the expansion in oil demand (the increased
affordability of oil to a very large section of the population is reflected, for instance, in massive
additions of two-wheelers to the total vehicle fleet over 2015) this paper has also shown that recent
policy initiatives are likely to further lift oil demand, a process which is already apparent in the data.
Specifically, this paper has estimated the impact on oil demand, and specifically on oil products such
as diesel and naphtha, of the push to increase manufacturing’s share within GDP from 15 per cent at
present to 25 per cent by 2022. Such an increase could add at least a third to India’s current demand
levels, based on a broad and conservative linear estimate. A concomitant programme of road
infrastructure creation targeting the addition of 30 km a day will add to this, although this paper has
argued that growing environmental and air pollution concerns could constrain growth in oil demand in
the transportation sector. In terms of the bigger picture: while China’s oil demand growth has slowed
to around 0.30 mb/d since 2013 from levels of 0.50 mb/d in the previous decade, India appears to not
have long to go in terms of achieving the same levels of oil demand growth. This rise in demand also
has implications for India’s recently acquired status as a net exporter of oil products, which, as
discussed, could well be reversed. Finally, the question of whether India will manage to soar to a
higher plane of development and consumption is contingent to a great extent upon its ability to carry
out and sustain structural reforms to support economic growth.

22
References
BP (2015). Statistical Review of World Energy. Available at www.bp.com/en/global/corporate/energy-
economics/statistical-review-of-world-energy.html.
Bruce, N. (2005). ‘The Health Burden of Indoor Air Pollution: Overview of the Global Evidence’, in
World Health Organization (ed.), Indoor Air Pollution and Child Health in Pakistan, Report of seminar
held at the Aga Khan University, Karachi, September.
Dahl, C. (1993). ‘A survey of oil demand elasticities for developing countries’, OPEC Review, 17 (4),
399–420.
Dargay, J., Gately, D., and Sommer, M. (2007). ‘Vehicle Ownership and Income Growth, Worldwide:
1960–2030’, The Energy Journal, 28 (4), 143–70.
Dargay, J., and Gately, D. (1999). ‘Income’s effect on car and vehicle ownership, worldwide: 1960–
2015’, Transportation Research, Part A, 33: 101–38.
Economic Survey (2014). Ministry of Finance, Government of India. Available at
http://indiabudget.nic.in/survey.asp.
El Katiri, L. and Fattouh, B. (2011). ‘Energy Poverty in the Arab World: The Case of Yemen’, OIES
Working Paper MEP 1, Oxford Institute for Energy Studies. Available at
www.oxfordenergy.org/2011/08/energy-poverty-in-the-arab-world-the-case-of-yemen/.
Fattouh, B., Sen, A., and Sen, A. (2013). ‘Diesel Pricing Reforms in India: A Perspective on Demand’,
Oxford Energy Comment, Oxford Institute for Energy Studies, August. Available at
http://www.oxfordenergy.org/2013/08/diesel-pricing-reforms-in-india-a-perspective-on-demand/.
GoI (2013). ‘Economic Sectors’, Volume II, Twelfth Five Year Plan (2012–17), Planning Commission,
Government of India.
GoI (2011). ‘National Manufacturing Policy’, Press Note No. 2 (2011 Series), Government of India,
Ministry of Commerce and Industry, Department of Industrial Policy & Promotion (Manufacturing
Policy Section). Available at
http://dipp.nic.in/english/policies/national_manufacturing_policy_25october2011.pdf.
Huo, H., Wang, M., Johnson, L. and Dongquan, He (2007). ‘Projection of Chinese Motor Vehicle
Growth, Oil Demand and CO2 Emissions through 2050’, Transportation Research Record: Journal of
the Transportation Research Board, No. 2038, pp. 69–77; Transportation Research Board of the
National Academies, Washington, D.C. Available at
http://citeseerx.ist.psu.edu/viewdoc/download?doi=10.1.1.461.9380&rep=rep1&type=pdf
IEA (2015) World Energy Outlook, International Energy Agency, Paris.
IEA (2014) World Energy Outlook, International Energy Agency, Paris.
IMF (2016). World Economic Outlook Update, January 2016, International Monetary Fund,
Washington, D.C. Available at www.imf.org/external/pubs/ft/weo/2016/update/01/.
IMF (2011). World Economic Outlook, International Monetary Fund, Washington, D.C. Available at
https://www.imf.org/external/pubs/ft/weo/2011/01/.
Planning Commission Databook (2014). Government of India. Available at
http://planningcommission.gov.in/data/datatable/index.php?data=datatab.
Rasmussen, T. and Roitman, A. (2011). ‘Oil Shocks in a Global Perspective: Are they really that
Bad?’ IMF Working Paper No. 11/194, International Monetary Fund, Washington, D.C. Available at
https://www.imf.org/external/pubs/ft/wp/2011/wp11194.pdf.
23
Rostow, W.W. (1956). ‘The Take-Off into Self Sustained Growth’, The Economic Journal, 66 (261),
25–48.
World Bank (2015a). ‘Understanding the Plunge in Oil Prices: Sources and Implications’, Global
Economic Prospects, January 2015, The World Bank Group, Washington D.C. Available at
https://www.worldbank.org/content/dam/Worldbank/GEP/GEP2015a/pdfs/GEP2015a_chapter4_report
_oil.pdf.
World Bank (2015b). ‘The Great Plunge in Oil Prices: Causes, Consequences and Policy Responses’,
Policy Research Note PRN/15/01, The World Bank Group, Washington D.C. Available at
www.worldbank.org/content/dam/Worldbank/Research/PRN01_Mar2015_Oil_Prices.pdf.
World Trade Organization (2015). World Merchandise Exports, Trade and Tariff Data. Available from
https://www.wto.org/english/res_e/statis_e/statis_e.htm.

24
Appendix 1: Estimates of oil consumption in manufacturing
IMF-WEO projections for India’s GDP growth
Year % GDP growth
2014 7.3
2015 7.3
2016 7.5
2017 7.5
2018 7.6
2019 7.7
2020 7.7
2021* 7.7
2022* 7.7
*Assumed by authors
Assumptions for estimates of oil consumption in manufacturing
Year Total GDP
(US$ bn)
Manufacturing
GDP (US$ bn)
Share of
Manufacturing
GDP in Total GDP
(%)
Oil Consumption
in Manufacturing
(’000 tonnes)
2007 968 156 16.14 12229
2008 906 143 15.78 13430
2009 952 154 16.17 13959
2010 1079 174 16.17 13929
2011 1095 178 16.28 14515
2012 1008 159 15.76 14954
2013 949 142 14.94 12775
2014 1018 153 15.00 12726
2015 1093 164 15.00 13213
2016 1175 206 17.52 13700
2017 1263 248 19.61 14186
2018 1359 290 21.31 14673
2019 1463 331 22.65 15160
2020 1576 373 23.68 15646
2021 1697 415 24.46 16133
2022 1828 457 25.00 16620
Note: Data on oil consumption in manufacturing covered LPG, Naphtha, High Speed Diesel Oil, Light Diesel Oil,
Furnace Oil, and Low Sulphur Heavy Stock/High Sulphur Heavy Stock. Data on oil consumption was gathered
from the Indian Petroleum and Natural Gas Statistics of the Ministry of Petroleum and Natural Gas. GDP data
was obtained from the (erstwhile) Planning Commission and National Accounts.