Embed Size (px)
Citation preview
www.csiro.au
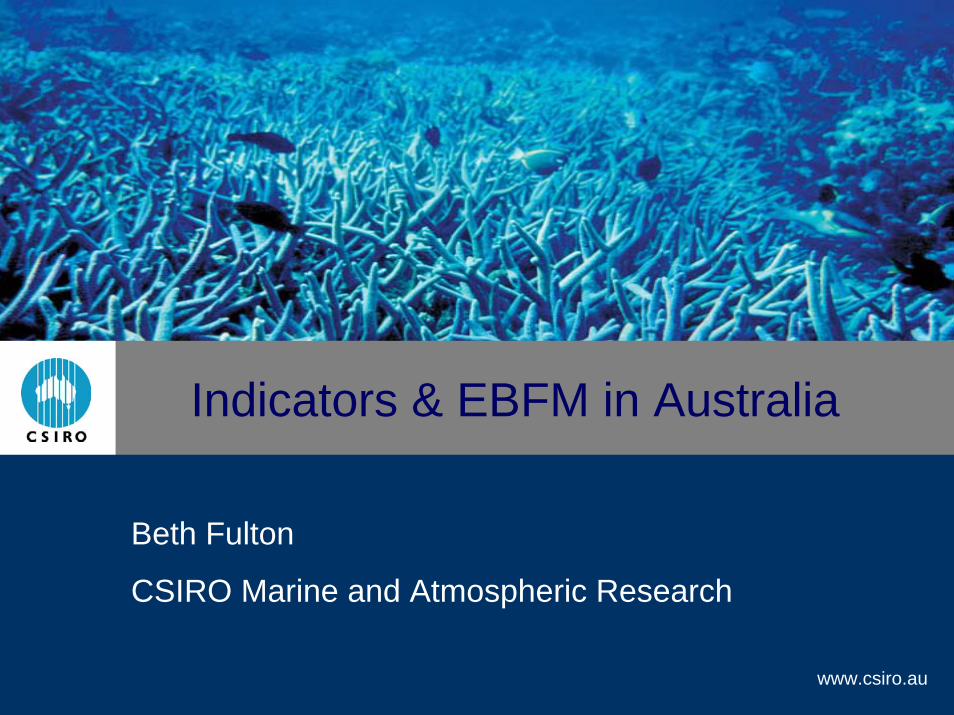
Indicators & EBFM in Australia
Beth Fulton
CSIRO Marine and Atmospheric Research
Australian EBFM: Theory and Practice
Acknowledgements
Mark BravingtonJoe DowdneyRudy KloserAlan WilliamsFranciz AlthausHelen WebbMarinelle BassonCampbell Davies
Cathy Bulman
Miriana Sporcic
Ross Daley
Alistair Hobday
Sally Wayte
Geoff Tuck
Tony Smith
Australian EBFM: Theory and Practice
Tools Needed For EBFM
Legislation requires assessment of fisheries impacts on the environment (e.g. in Australia)
— fisheries management acts
— EPBC (endangered, protected and biodiversity)
Focus = developing reliable tools
— targeted different points in Adaptive Management Cycle
Australian EBFM: Theory and Practice
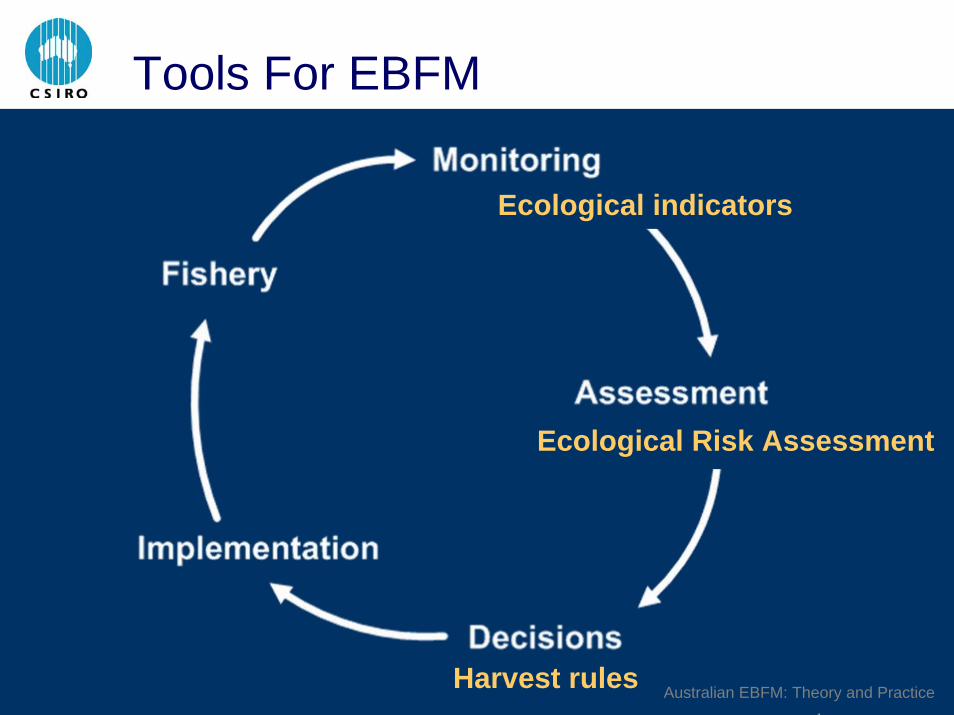
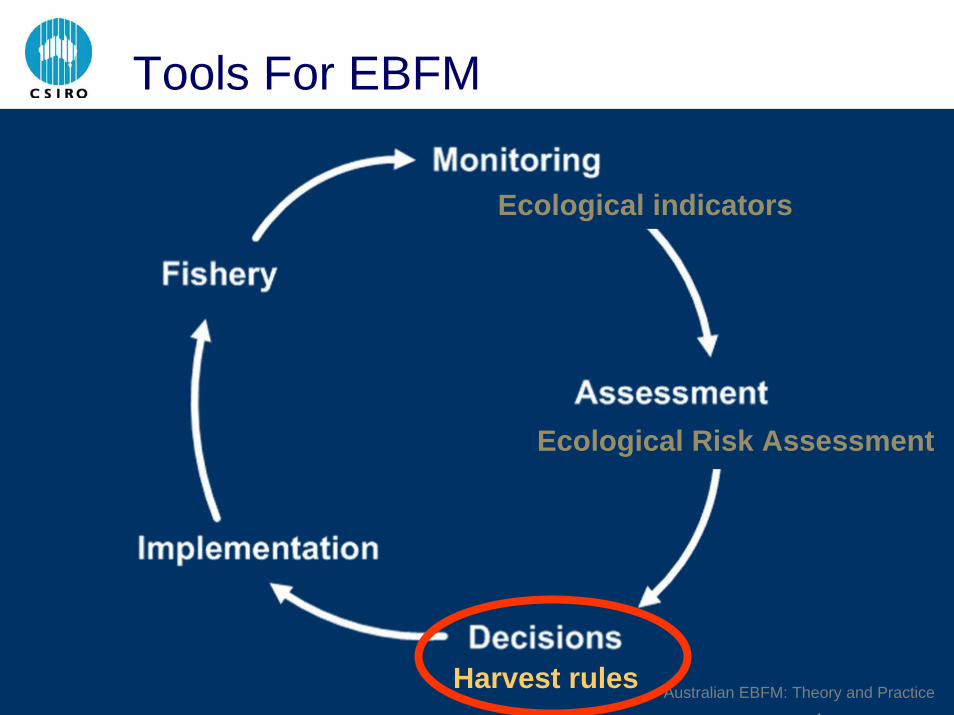
Tools For EBFM
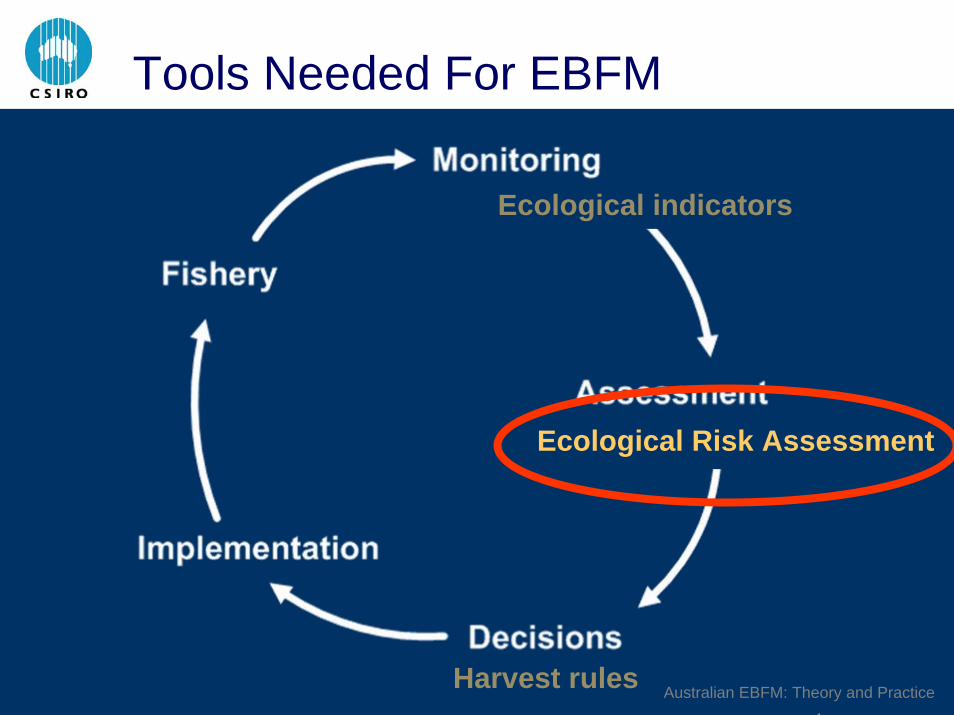
Harvest rules
Ecological Risk Assessment
Ecological indicators

Australian EBFM: Theory and Practice
Tools Needed For EBFM
Harvest rules
Ecological Risk Assessment
Ecological indicators
Australian EBFM: Theory and Practice
Indicators – General PropertiesGood indicators
— easily measured and understood; cost effective
Need a suite (no single indicator) as indicator performance may differ with
— indicator performance can differ with ecosystem, history of exploitation, other pressures, quality of data
— cover species: with fast turnover rates (potential early warning), targeted by fisheries, habitat defining, sensitive (often “integrating”)
— multiple spatial and temporal scales
► best combination of signal detection + system state
Australian EBFM: Theory and Practice
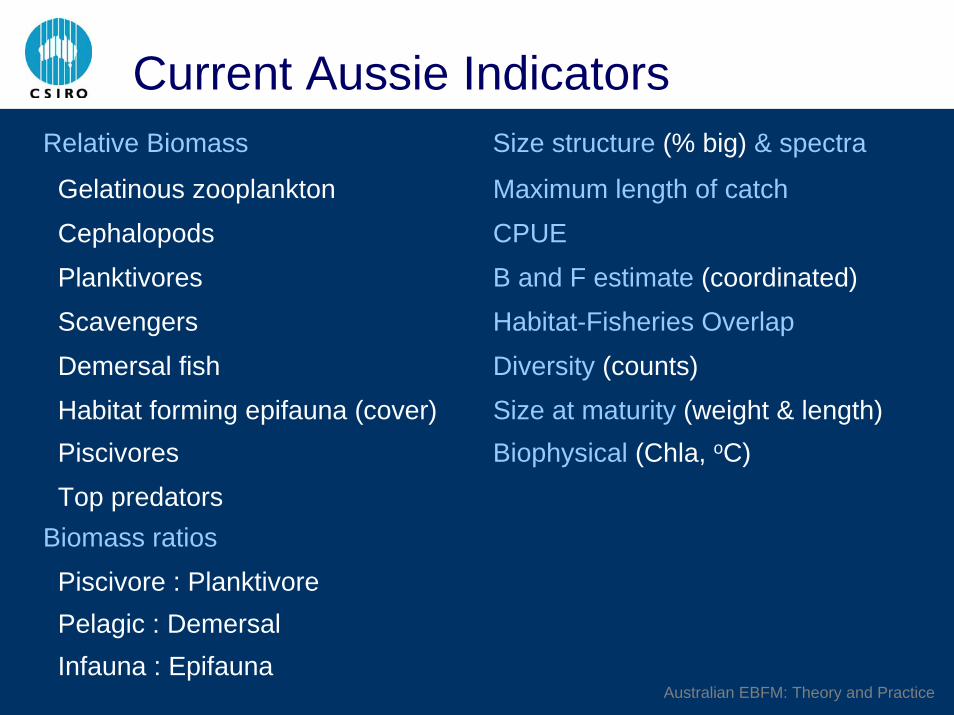
Current Aussie IndicatorsRelative Biomass Size structure (% big) & spectra
Gelatinous zooplankton
Pelagic : Demersal
Maximum length of catch
Cephalopods CPUE
Planktivores B and F estimate (coordinated)
Scavengers Habitat-Fisheries Overlap
Demersal fish Diversity (counts)
Habitat forming epifauna (cover) Size at maturity (weight & length) Piscivores Biophysical (Chla, oC)
Top predatorsBiomass ratios
Piscivore : Planktivore
Infauna : Epifauna
Australian EBFM: Theory and Practice
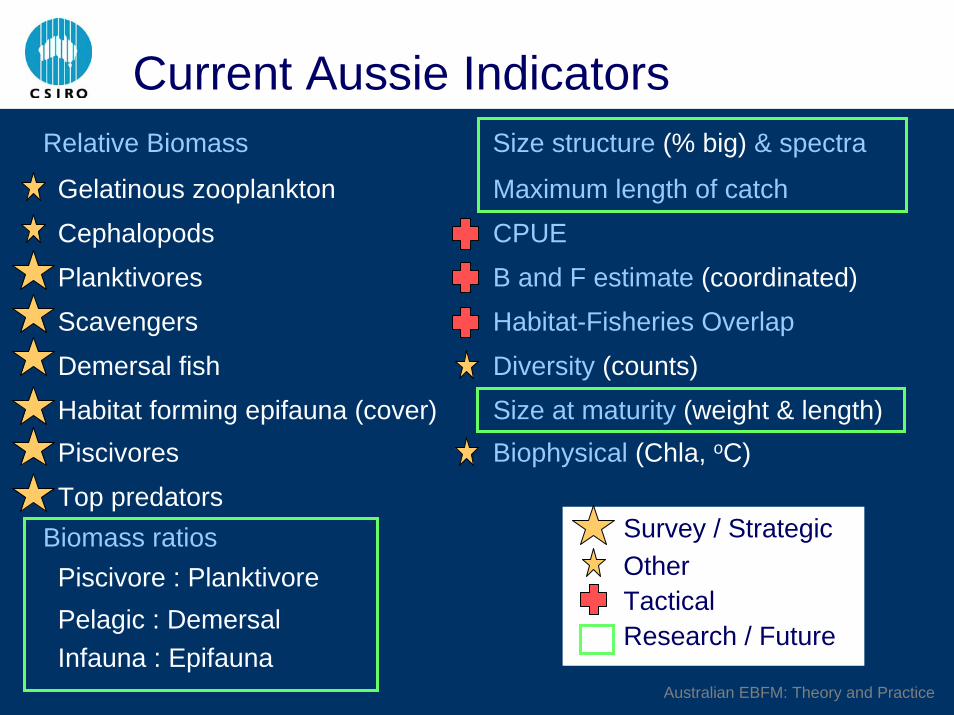
Relative Biomass Size structure (% big) & spectra
Maximum length of catchGelatinous zooplankton
Pelagic : Demersal
Cephalopods CPUEPlanktivores B and F estimate (coordinated)
Scavengers Habitat-Fisheries Overlap
Demersal fish Diversity (counts)Habitat forming epifauna (cover)Piscivores
Top predatorsBiomass ratiosPiscivore : Planktivore
Infauna : Epifauna
Size at maturity (weight & length) Biophysical (Chla, oC)
Current Aussie Indicators
Survey / StrategicOtherTacticalResearch / Future
Australian EBFM: Theory and Practice
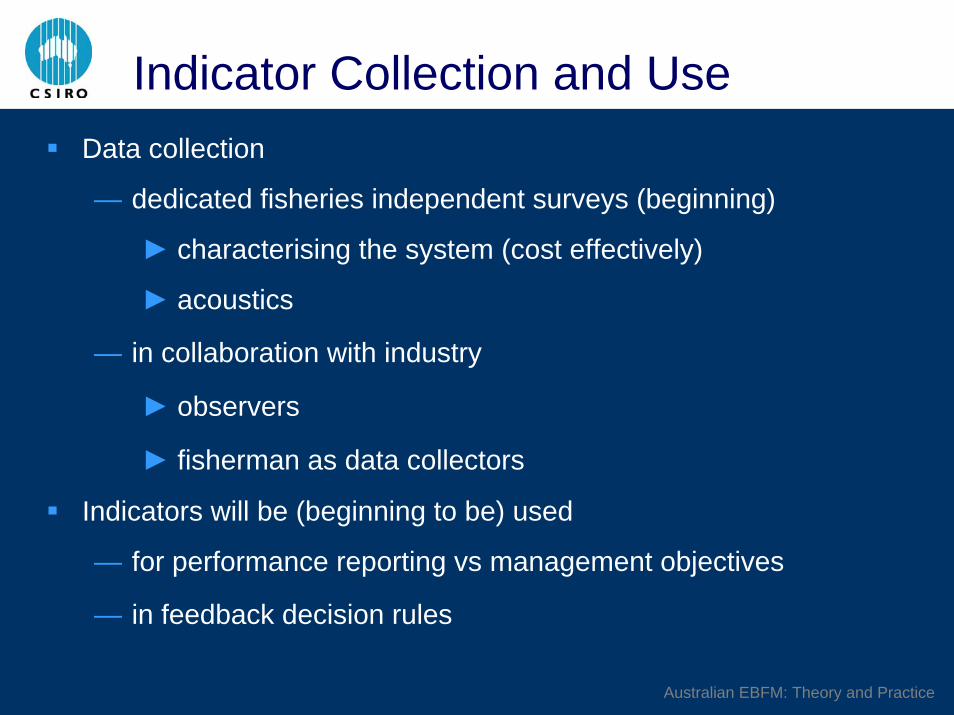
Indicator Collection and UseData collection
— dedicated fisheries independent surveys (beginning)
► characterising the system (cost effectively)
► acoustics
— in collaboration with industry
► observers
► fisherman as data collectors
Indicators will be (beginning to be) used
— for performance reporting vs management objectives
— in feedback decision rules
Australian EBFM: Theory and Practice
Tools Needed For EBFM
Harvest rules
Ecological Risk Assessment
Ecological indicators

Australian EBFM: Theory and Practice
Ecological Risk AssessmentHobday et al (2004)
— so far use existing data (e.g. swath mapped habitat; acoustics-based biomass estimates of various groups)
— + expert knowledge
— identify main hazards target, by-product, bycatch, PET species, habitats, communities
— consider probability property of the system changes beyond acceptable limits
Australian EBFM: Theory and Practice
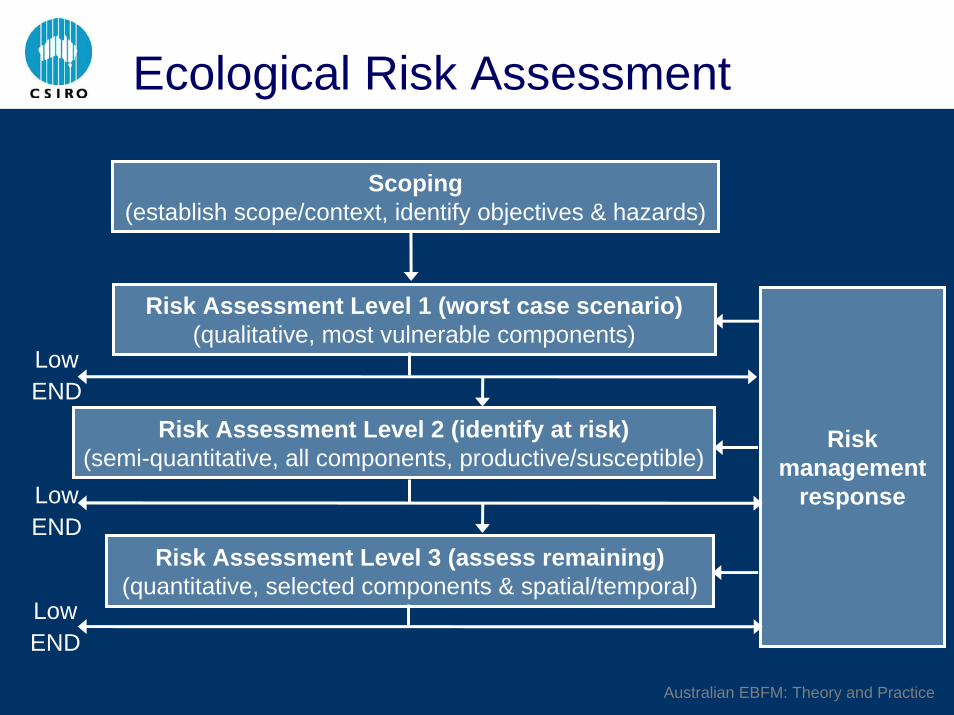
Ecological Risk Assessment
Risk management
response
Scoping (establish scope/context, identify objectives & hazards)
Risk Assessment Level 1 (worst case scenario) (qualitative, most vulnerable components)
Risk Assessment Level 2 (identify at risk) (semi-quantitative, all components, productive/susceptible)
Risk Assessment Level 3 (assess remaining) (quantitative, selected components & spatial/temporal)
LowEND
LowEND
LowEND
Australian EBFM: Theory and Practice
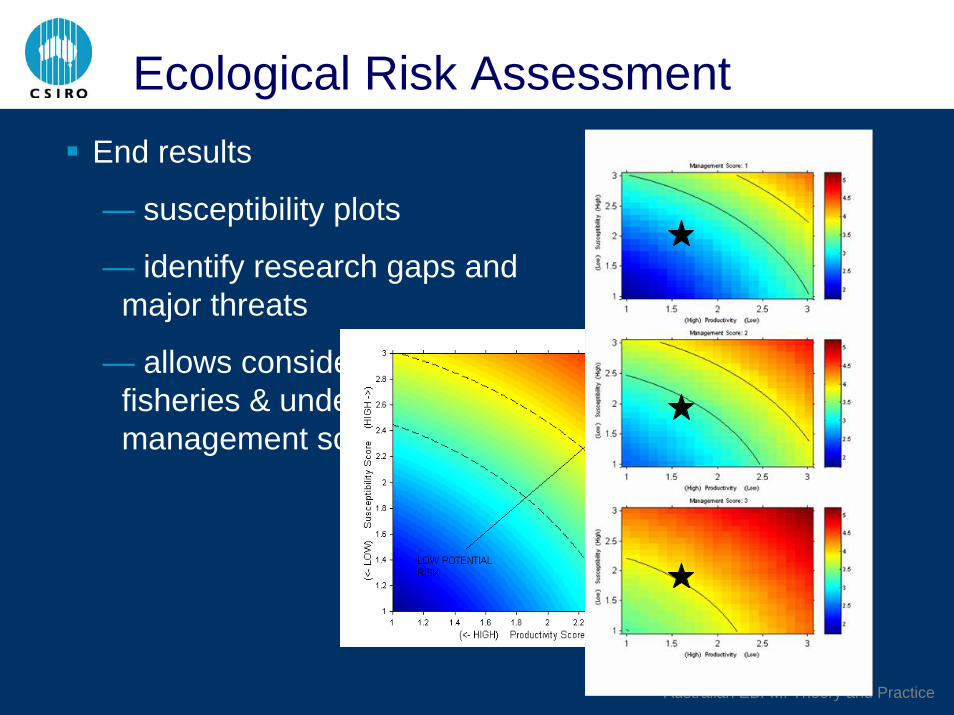
Ecological Risk AssessmentEnd results
— susceptibility plots
— identify research gaps and major threats
— allows consideration across fisheries & under different management schemes

Australian EBFM: Theory and Practice
Ecological Risk AssessmentStatus
— initial level 1 (and 1.5) done for all federal fisheries (32+ fisheries)
— all new fisheries will be assessed
— periodic updates and extension = standard practice
— methods being refined
— = method of turning detailed indicators into prioritisedlist across species and communities
Likely spatial management will be easiest method of covering as many highlighted issues as possible cost effectively
Australian EBFM: Theory and Practice
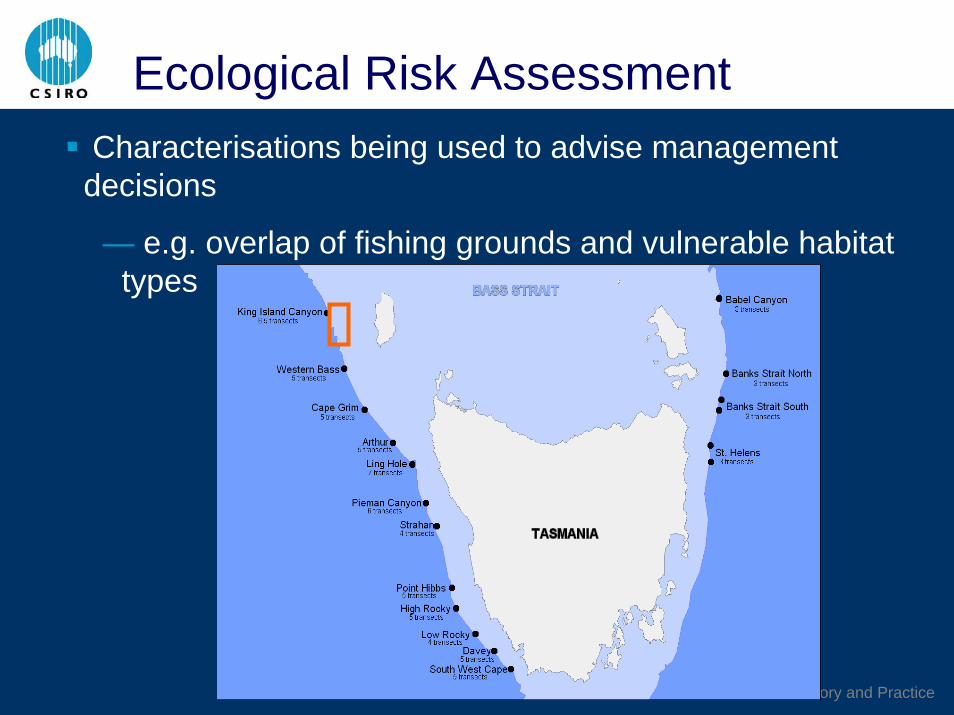
Ecological Risk AssessmentCharacterisations being used to advise management decisions
— e.g. overlap of fishing grounds and vulnerable habitat types
Australian EBFM: Theory and Practice
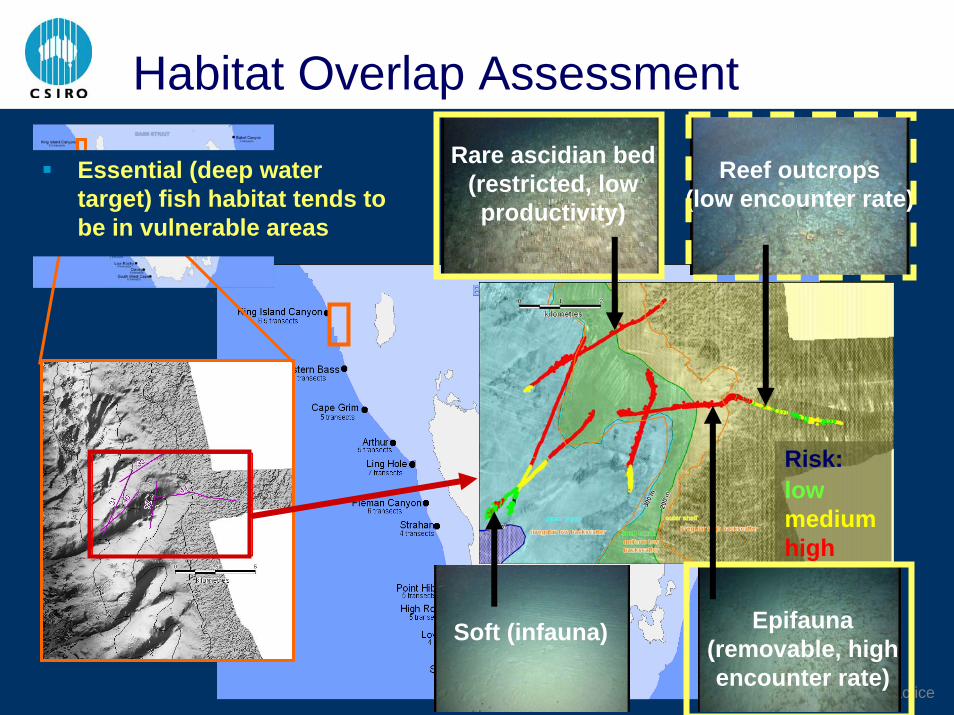
Risk: lowmediumhigh
Habitat Overlap Assessment
Soft (infauna)
Reef outcrops (low encounter rate)
Epifauna(removable, high encounter rate)
Rare ascidian bed (restricted, low productivity)
Essential (deep water target) fish habitat tends to be in vulnerable areas
Australian EBFM: Theory and Practice
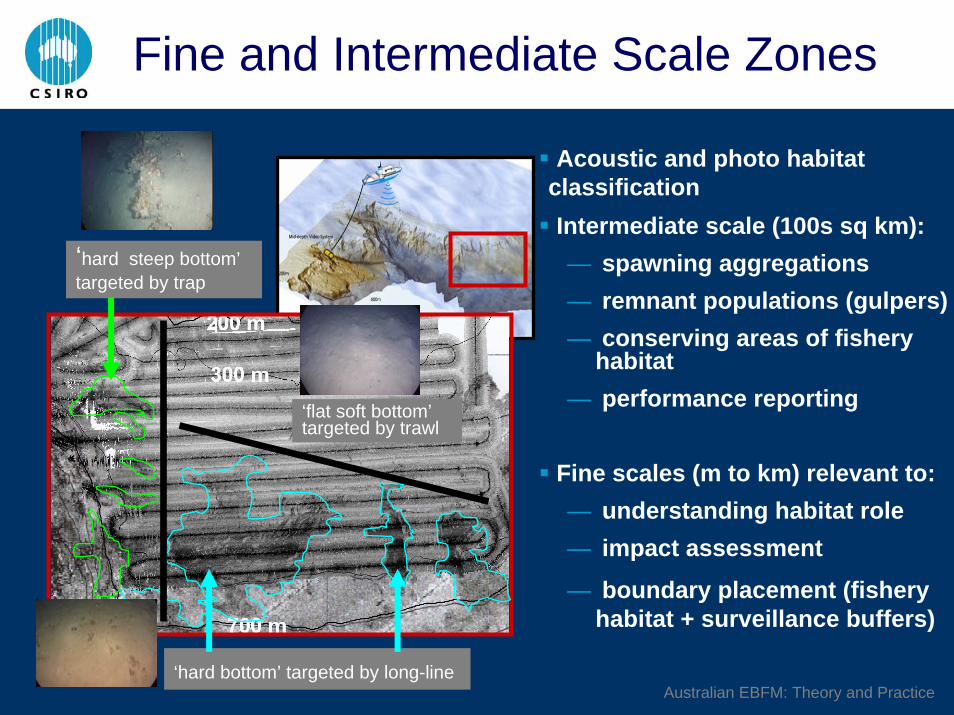
Fine and Intermediate Scale Zones
Acoustic and photo habitat classificationIntermediate scale (100s sq km):— spawning aggregations— remnant populations (gulpers)— conserving areas of fishery
habitat— performance reporting
Fine scales (m to km) relevant to:— understanding habitat role— impact assessment
— boundary placement (fishery habitat + surveillance buffers)
‘hard bottom’ targeted by long-line
‘flat soft bottom’targeted by trawl
‘hard steep bottom’targeted by trap
Australian EBFM: Theory and Practice
Tools For EBFM
Harvest rules
Ecological Risk Assessment
Ecological indicators

Australian EBFM: Theory and Practice
Harvest Rules
Clear decision rules needed (by legislation now implemented)
— standardised (precautionary) harvest strategies
— tiered determination of recommended catch (RBC):
► Tier 1: Robust quantitative assessment RBC(F40, Bcur)
► Tier 2: Quantitative assessment RBC(F=M, Bcur)
► Tier 3: M and F estimates RBC(α*Ccur | F vs M)
► Tier 4: Catch trends RBC = (1 + α*Cslope)*Ccur
— TAC set based on RBC (and discarding, multispecies catch composition)
— ERA ~ Tier 5
Australian EBFM: Theory and Practice
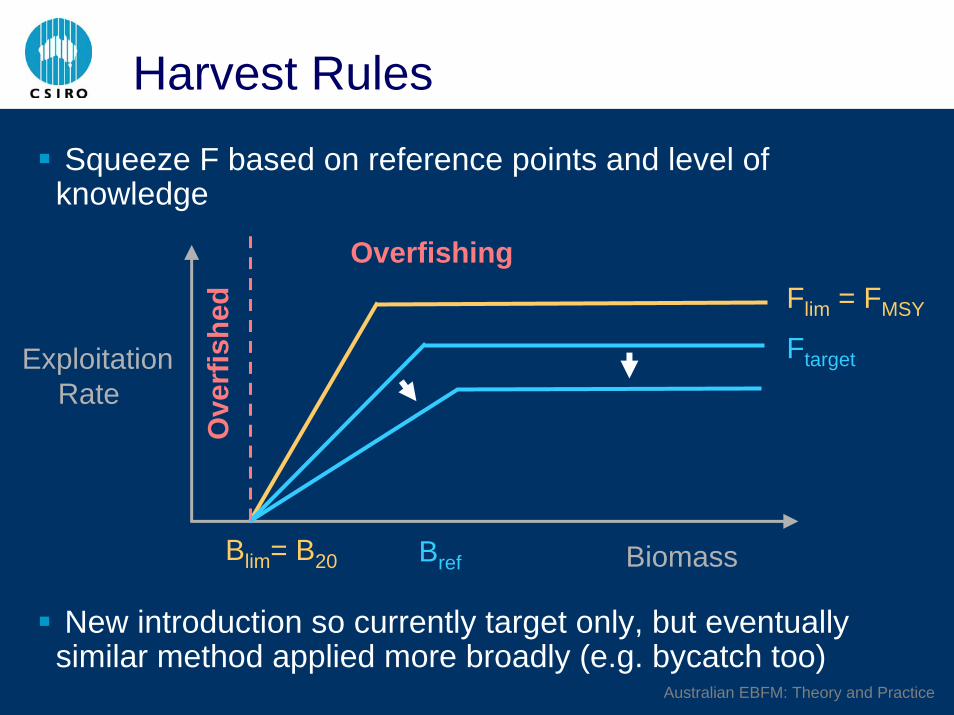
Harvest Rules
Squeeze F based on reference points and level of knowledge
New introduction so currently target only, but eventually similar method applied more broadly (e.g. bycatch too)
Biomass
Exploitation Rate
Flim = FMSY
Blim= B20
Ftarget
Bref
OverfishingO
verf
ishe
d

Australian EBFM: Theory and Practice
Aussie Indicators in Practice
Still under development (MSE testing)
Value of data collection has been recognised (surveys have begun)
Tactical management will still involve single species assessments (e.g. harvest rules start there)
ERA = strategic, but can focus more tactical actions too
— pragmatic researchers are seeing value of qualitative tools (and straightforward use of “unmolested” data)
Indicators also strategic, but put tactical management in context (check for wider unanticipated effects)
Australian EBFM: Theory and Practice
Aussie EBFM in PracticeStill under development tool wise, but sector management structure in place
Beyond ecology
— integrated across sectors ultimately (new institutions needed?)
— ecological focus in talk, but socio-economics explicitly considered too (costs, revenue, access, stability etc)
Stakeholders in from the ground level
— Industry, NGO, management, scientists, economists etc all on advisory councils and assessment groups
— ownership has eased the path somewhat (e.g. collaborations)