Embed Size (px)
Citation preview

U.S. Department of the InteriorU.S. Geological Survey
Scientific Investigations Report 2006–5183
In cooperation with the Medina County Health Department
Assessment of the Use of Selected Chemical and Microbiological Constituents as Indicators of Wastewater in Curtain Drains From Home Sewage- Treatment Systems in Medina County, Ohio

Assessment of the Use of Selected Chemical and Microbiological Constituents as Indicators of Wastewater in Curtain Drains From Home Sewage-Treatment Systems in Medina County, Ohio
By Denise H. Dumouchelle
In cooperation with the Medina County Health Department
Scientific Investigations Report 2006–5183
U.S. Department of the InteriorU.S. Geological Survey
U.S. Department of the InteriorDIRK KEMPTHORNE, Secretary
U.S. Geological SurveyP. Patrick Leahy, Acting Director
U.S. Geological Survey, Reston, Virginia: 2006
For product and ordering information: World Wide Web: http://www.usgs.gov/pubprod Telephone: 1-888-ASK-USGS
For more information on the USGS--the Federal source for science about the Earth, its natural and living resources, natural hazards, and the environment: World Wide Web: http://www.usgs.gov Telephone: 1-888-ASK-USGS
Any use of trade, product, or firm names is for descriptive purposes only and does not imply endorsement by the U.S. Government.
Although this report is in the public domain, permission must be secured from the individual copyright owners to reproduce any copyrighted materials contained within this report.
Suggested citation:Dumouchelle, D.H, 2006, Assessment of the use of selected chemical and microbiological constituents as indicators of wastewater in curtain drains from home sewage-treatment systems in Medina County, Ohio: U.S. Geological Survey Scientific Investigations Report 2006−5183, 20 p.

iii
Contents
Abstract .......................................................................................................................................................... 1Introduction.................................................................................................................................................... 1
Purpose and Scope ............................................................................................................................. 2Description of Home Sewage-Treatment Systems ........................................................................ 3Selection of Constituents for Study .................................................................................................. 4
Methods of Data Collection and Analysis ................................................................................................ 4Chemical Constituents ........................................................................................................................ 7Microbiological Constituents ............................................................................................................. 8
Occurrence of Chemical and Microbiological Constituents ................................................................. 8Nutrients ................................................................................................................................................ 8Chloride and Bromide........................................................................................................................ 10
Chloride....................................................................................................................................... 10Bromide ...................................................................................................................................... 11Chloride/Bromide Ratios .......................................................................................................... 11
Coliphage............................................................................................................................................. 13E. coli Bacteria ................................................................................................................................... 14
Utility of Study Approaches and Inferences From Available Data ..................................................... 14Summary and Conclusions ........................................................................................................................ 17Acknowledgments ...................................................................................................................................... 18References Cited......................................................................................................................................... 18
Figures 1. Map showing location of sampled home sewage-treatment systems ............................. 2 2. Schematic of leach-line septic system .................................................................................... 4 3. Construction sketches of gravel leach trench, gravelless leach trench, and
curtain drain ................................................................................................................................. 5 4. Diagram showing design of the evaporation-transpiration-absorption (ETA) system
used in Medina County, Ohio ..................................................................................................... 6 5. Photographs showing typical sampling points at curtain drains in Medina
County, Ohio .................................................................................................................................. 7 6. Graph showing relation of chloride concentration to chloride-bromide ratios for
water from home sewage-treatment systems (HSTSs), HSTS curtain drain, and domestic-supply wells, Medina County, Ohio ....................................................................... 12
7. Example of results of rep-PCR analysis showing six isolates and multiple measure-ments of a single isolate, demonstrating the reproducibility of results ........................... 15

iv
Tables 1. Site information for home sewage-treatment systems sampled in Medina
County, Ohio .................................................................................................................................. 3 2. Results of analyses of samples from wells and home sewage-treament systems
in Medina County, Ohio ............................................................................................................... 9 3. Chloride/bromide ratios in samples collected from home sewage-treatment system,
associated curtain drains, and two residential wells in Medina County, Ohio ............... 11 4. Results of analyses of bacteria and coliphage in samples from wells and home
sewage-treatment systems in Medina County, Ohio ........................................................... 13 5. Sites and numbers of isolates in those operational taxonomic units (OTU) found
from more than one source from samples in Medina County, Ohio .................................. 16 6. Summary of the utility of indicators used in this study for indicating the movement
of partially untreated wastewater from home sewage-treatment systems to associated curtain drain ........................................................................................................... 17
Conversion Factors
Multiply By To obtain
Length
inch (in.) 25.4 millimeter (mm)
foot (ft) 0.3048 meter (m)
Specific conductance is given in microsiemens per centimeter at 25 degrees Celsius (µS/cm at 25°C).
Concentrations of chemical constituents in water are given either in milligrams per liter (mg/L) or micrograms per liter (µg/L).
Concentrations of bacteria in water are given in colonies per 100 milliliters (col/100 mL).
Concentrations of coliphage in water are given in plaques per 100 milliliters (plaques/100 mL).

Assessment of the Use of Selected Chemical and Microbiological Constituents as Indicators of Wastewater in Curtain Drains From Home Sewage-Treatment Systems in Medina County, Ohio
By Denise H. Dumouchelle
AbstractMany home sewage-treatment systems (HSTS) in Ohio
use curtain or perimeter drains to depress the level of the sub-surface water in and around the systems. These drains could possibly intercept partially untreated wastewater and release potential pathogens to ground-water and surface-water bod-ies. The quality of water in curtain drains from two different HSTS designs in Medina County, Ohio, was investigated using several methods. Six evaporation-transpiration-absorption (ETA) and five leach-line (LL) systems were investigated by determining nutrient concentrations, chloride/bromide ratios (Cl/Br), Escherichia coli (E. coli) concentrations, coliphage genotyping, and genetic fingerprinting of E. coli. Water samples were collected at 11 sites and included samples from curtain drains, septic tanks, and residential water wells.
Nitrate concentrations in the curtain drains ranged from 0.03 to 3.53 mg/L (milligrams per liter), as N. Concentrations of chloride in 10 of the 11 curtain drains ranged from 5.5 to 21 mg/L; the chloride concentration in the eleventh curtain drain was 340 mg/L. Bromide concentrations in 11 curtain drains ranged from 0.01 to 0.22 mg/L. Cl/Br ratios ranged from 86 to 2,000. F-specific coliphage were not found in any curtain-drain samples. Concentrations of E. coli in the curtain drains ranged from 1 to 760 colonies per 100 milliliters.
The curtain-drain water-quality data were evaluated to determine whether HSTS-derived water was present in the curtain drains. Nutrient concentrations were too low to be of use in the determination. The Cl/Br ratios appear promising. Coliphage was not detected in the curtain drains, so geno-typing could not be attempted. E. coli concentrations in the curtain drains were all less than those from the corresponding HSTS; only one sample exceeded the Ohio secondary-contact water-quality standard. The genetic fingerprinting data were inconclusive because multiple links between unrelated sites were found.
Although the curtain-drain samples from the ETA systems showed somewhat more evidence of the presence of HSTS water than did the LL systems, most of the approaches
were inconclusive by themselves. The best evidence of HSTS water, from the Cl/Br ratios, indicates that the water in 10 of the 11 curtain drains, at both HSTS types, was a mixture of dilute ground water and HSTS-derived water; the 11th drain also show some effects of the HSTS, although road salt-affected water may be present. Therefore, it appears that there is no difference between the ETA and LL systems with respect to the water quality in curtain drains.
IntroductionOnsite or home sewage-treatment systems (HSTSs) are
widely used in many areas of Ohio. The soils in Ohio are commonly unsuitable for traditional leach-line (LL) systems (Mancl and Slater, 2001), and as a result, various HSTS designs are used in the State. Many of these systems involve curtain drains, which are perforated pipes installed in trenches around the perimeter of the HSTS leaching area. These drains are typically 5 to 10 ft from and not connected to the HSTS. The drains are intended to depress the shallow ground water in and around an HSTS. However, there are concerns that these drains could release partially treated wastewater and potential pathogens to ground-water and surface-water bodies.
A conventional LL system consists of a septic tank and a series of perforated pipes that discharge the wastewater to soil for treatment. Another type of HSTS, one that requires less land than an LL system, is the evaporation-transpiration-absorption (ETA) system. ETA systems are being used in a few counties in Ohio. The ETA system consists of a mound-covered trench with trees and other plants on the mound above the trench. The ETA design is considered an alternative or experimental system in Ohio, and the performance of these systems in clay-rich soils is not well documented. Approxi-mately 1,200 ETA systems, with curtain drains, have been installed in Medina County, Ohio.
The U.S. Geological Survey (USGS), in cooperation with the Medina County Health Department (MCHD), sampled
Introduction 1

2 Indicators of Wastewater in Curtain Drains From Home Sewage-Treatement Systems, Medina County, Ohio
water from curtain drains from ETA systems and LL sys-tems to obtain a better understanding of whether wastewater migrates from either HSTS design to the curtain drains. The objectives of the study were to evaluate several approaches to test for the presence of HSTS-derived water in curtain drains, to compare the approaches, and to describe the results with respect to two types of HSTS. This study builds on a series of previous USGS studies (Dumouchelle and Stoeckel, 2005; Jagucki and Darner, 2001; multiple references in Stoeckel, 2005) involving water quality or microbiological data as lines of evidence in identifying sources of contamination.
Purpose and Scope
This report presents data and results from the study described previously. The study area was Medina County, in northeastern Ohio (fig. 1). Water samples were collected at 11 HSTS sites in late June 2004. The samples were collected from curtain drains, septic tanks, and two residential water wells. Samples were analyzed for nutrients, chloride, bromide, coliphage, and Escherichia coli (E. coli) bacteria. Six ETA and five LL systems were investigated.
82o 1”
81o 8”
41o 0”
41o 2”
0 10
0
20 MILES
20 KILOMETERS
MEDINA COUNTY
County location
OHIO
Geauga County
EXPLANATION
MD-16
MD-17 MD-18
MD-15
MD-20
MD-19MD-21
MD-23MD-22
MD-24
MD-25
MD-17
MD-16 Evaporation-transpiration- absorption system
Leach-line system
U.S. 42
Interstate 71Interstate 76
Inter
state 271
Figure 1. Location of sampled home sewage-treatment systems.
Description of Home Sewage-Treatment Systems
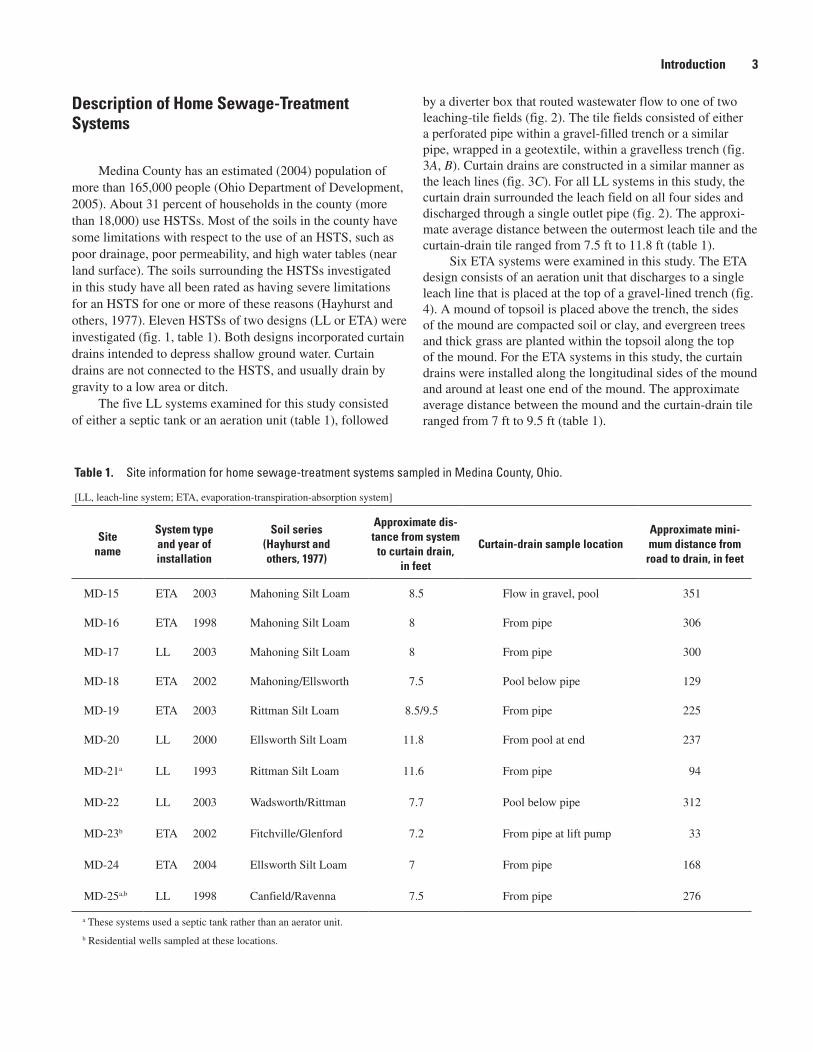
Medina County has an estimated (2004) population of more than 165,000 people (Ohio Department of Development, 2005). About 31 percent of households in the county (more than 18,000) use HSTSs. Most of the soils in the county have some limitations with respect to the use of an HSTS, such as poor drainage, poor permeability, and high water tables (near land surface). The soils surrounding the HSTSs investigated in this study have all been rated as having severe limitations for an HSTS for one or more of these reasons (Hayhurst and others, 1977). Eleven HSTSs of two designs (LL or ETA) were investigated (fig. 1, table 1). Both designs incorporated curtain drains intended to depress shallow ground water. Curtain drains are not connected to the HSTS, and usually drain by gravity to a low area or ditch.
The five LL systems examined for this study consisted of either a septic tank or an aeration unit (table 1), followed
by a diverter box that routed wastewater flow to one of two leaching-tile fields (fig. 2). The tile fields consisted of either a perforated pipe within a gravel-filled trench or a similar pipe, wrapped in a geotextile, within a gravelless trench (fig. 3A, B). Curtain drains are constructed in a similar manner as the leach lines (fig. 3C). For all LL systems in this study, the curtain drain surrounded the leach field on all four sides and discharged through a single outlet pipe (fig. 2). The approxi-mate average distance between the outermost leach tile and the curtain-drain tile ranged from 7.5 ft to 11.8 ft (table 1).
Six ETA systems were examined in this study. The ETA design consists of an aeration unit that discharges to a single leach line that is placed at the top of a gravel-lined trench (fig. 4). A mound of topsoil is placed above the trench, the sides of the mound are compacted soil or clay, and evergreen trees and thick grass are planted within the topsoil along the top of the mound. For the ETA systems in this study, the curtain drains were installed along the longitudinal sides of the mound and around at least one end of the mound. The approximate average distance between the mound and the curtain-drain tile ranged from 7 ft to 9.5 ft (table 1).
Introduction 3
Table 1. Site information for home sewage-treatment systems sampled in Medina County, Ohio.
[LL, leach-line system; ETA, evaporation-transpiration-absorption system]
Site name
System type and year of installation
Soil series(Hayhurst and others, 1977)
Approximate dis-tance from system
to curtain drain, in feet
Curtain-drain sample locationApproximate mini-mum distance from
road to drain, in feet
MD-15 ETA 2003 Mahoning Silt Loam 8.5 Flow in gravel, pool 351
MD-16 ETA 1998 Mahoning Silt Loam 8 From pipe 306
MD-17 LL 2003 Mahoning Silt Loam 8 From pipe 300
MD-18 ETA 2002 Mahoning/Ellsworth 7.5 Pool below pipe 129
MD-19 ETA 2003 Rittman Silt Loam 8.5/9.5 From pipe 225
MD-20 LL 2000 Ellsworth Silt Loam 11.8 From pool at end 237
MD-21a LL 1993 Rittman Silt Loam 11.6 From pipe 94
MD-22 LL 2003 Wadsworth/Rittman 7.7 Pool below pipe 312
MD-23b ETA 2002 Fitchville/Glenford 7.2 From pipe at lift pump 33
MD-24 ETA 2004 Ellsworth Silt Loam 7 From pipe 168
MD-25a,b LL 1998 Canfield/Ravenna 7.5 From pipe 276
a These systems used a septic tank rather than an aerator unit.
b Residential wells sampled at these locations.

4 Indicators of Wastewater in Curtain Drains From Home Sewage-Treatement Systems, Medina County, Ohio
Selection of Constituents for Study
Samples of water collected from the curtain drains and the HSTSs were analyzed for a selected suite of chemical and microbiological constituents. The presence, or absence, of these constituents in the samples provided multiple lines of evidence as to the source of the water; that is, whether or not it was derived from the HSTSs. The chemical constituents of interest in this study were nutrients, chloride, and bromide; the microbiological constituents of interest were coliphage and E. coli bacteria.
Nutrients are ions or organic compounds that contain nitrogen or phosphorus. Nitrogen concentrations are of con-cern with respect to human-health issues; for drinking water, the Maximum Contaminant Level (MCL) established for nitrite is 1 mg/L (as N), and that for nitrate is 10 mg/L (as N) (U.S. Environmental Protection Agency, 2004). Nitrogen fer-tilizers and sewage are common sources of nitrogen contami-nation in waters. Nitrate, the main form of nitrogen in ground water, is very mobile. Nitrogen from HSTSs generally enters the soil as organic nitrogen, nitrate, or ammonia. In the soil, above the water table, oxidation converts the various nitro-gen forms to nitrate, and bacterial systems or redox reactions convert the nitrate to nitrogen and nitrous oxide. Nitrogen and nitrous oxide can be lost to the atmosphere and, if dissolved, are not harmful in drinking water (Freeze and Cherry, 1979, p. 413−415).
The ratio of chloride to bromide (Cl/Br) concentrations has been used to identify or confirm sources of ground-water contamination (Davis and others, 1998; Eberts and others,
1990; Jagucki and Darner, 2001; Thomas, 2000). These con-stituents can be useful because they are both soluble in water and conservative; that is, they are not prone to adsorption to sediment or redox alterations (Hem, 1989; Davis and others, 1998).
Microbiological constituents of interest in this study were coliphage and E. coli. Coliphage are viruses that infect bacteria, including E. coli. Coliphage are an indicator of fecal contamination and are sometimes used as a surrogate for the subsurface transport of fecal-origin human viruses. Samples from HSTSs were analyzed for both somatic and F-specific coliphage. Genotyping analysis of coliphage, to determine human as opposed to nonhuman sources, can be done only on F-specific RNA-based coliphage, so these were of most inter-est for detection of the transport of any partially treated waste-water between an HSTS and curtain drains. E. coli is itself a longstanding indicator of fecal contamination, although E. coli detection alone does not address the source of the contamina-tion. However, repetitive DNA element polymerase chain reac-tion (rep-PCR) has been used to indicate the source of E. coli (Dombeck and others, 2000; Carson and others, 2003).
Methods of Data Collection and Analysis
Sites were selected by the MCHD to represent a combi-nation of ETA and LL HSTSs throughout the county. Water samples were collected by the USGS at 11 properties. Samples were collected from curtain-drain outfalls and within the HSTSs; samples also were collected from the faucets in two homes supplied with water from their own wells. The wells were completed in sandstone, with open intervals from 62 to 100 ft (below ground) and 35 to 78 ft.
Most of the curtain-drain outfalls (fig. 5) were partly buried and (or) produced minimal flows; so, in some cases, the area beneath the outfall pipe was dug out to create a pool for sample collection. When possible, samples were collected from the outfall by placing a collection bottle underneath the pipe or by using a peristaltic pump and sterile tubing from within the pipe. Other curtain-drain samples were collected from a pool near the outfall discharge with a peristaltic pump and sterile tubing (table 1). Samples from the HSTSs were col-lected post aerator (when present), either from within the tank or from the diverter box using a peristaltic pump and sterile, weighted tubing. In addition, one known sample from surface scat (dog) was collected for E. coli analysis using methods described in Dumouchelle and Stoeckel (2005)
Replicate samples and one field blank were collected for quality control. These samples were analyzed to identify any variability in analytical results that might be associated with sample-collection or laboratory methods.
Inactiveleach line
Diverterbox
Curtain drain
Tank
Not to scale
to discharge point
Activeleach line
Figure 2. Schematic of leach-line septic system.

Backfill
Gravel
Perforated pipe2 inches minimum
4 inches minimum
A. Gravel leach trench.
Preappliedfilterfabric
Backfill
Holes
8 or 10 inches
6 inches minimum
18 - 24 inches
0 - 2 inches
B. Gravelless leach trench.
18 - 36 inches
Perforatedpipe
Gravel
C. Curtain drain.
10 inches minimumTrench width
Backfill
Figure 3. Construction sketches: A, Gravel leach trench. B, Gravelless leach trench. C, Curtain drain.
Methods of Data Collection and Analysis 5

6 Indicators of Wastewater in Curtain Drains From Home Sewage-Treatement Systems, Medina County, Ohio
8 feet 8 feet3 feet
2 feet
18 - 24 inches
Topsoil
Lift station
Pump line
Aerobic treatment unit
Placement of tree
Curtain drain
Curtain drain
Trench perimeter
Leach line
To curtain drain lift station or discharge point
Compacted spoil subsoilfrom trench
Excavated earth backfill
Curtain drain
Curtain drain trench
Gravel
Leach tubing Curtain drain
Cross section
Schematic
Gravel
not to scale
Figure 4. Diagram showing design of the evaporation-transpiration-absorption (ETA) system used in Medina County, Ohio

Chemical Constituents
Water samples from the 11 curtain drains, 2 HSTSs, and 2 wells were analyzed for nutrients, chloride, and bromide. Samples were transferred from a common collection bottle to the analysis bottles by use of a peristaltic pump with an inline filter on the tubing. Sampling tubing was cleaned with nonphosphate detergent and deionized water, followed by sterilization in an autoclave. The samples were shipped to the USGS National Water-Quality Laboratory (NWQL) in Denver, Colo. The nutrient samples were analyzed for concentrations
of ammonia, nitrite, nitrite plus nitrate, and orthophosphate (Fishman, 1993); the reporting limits, respectively, for these constituents were 0.04, 0.008, 0.06, and 0.018 mg/L. Nitrate concentrations were calculated by subtracting the concentra-tion of nitrite from the concentration of nitrate plus nitrite. Nitrate and nitrite concentrations are reported as nitrogen (as N). Chloride analysis was done by ion-exchange chromatog-raphy (Fishman and Friedman, 1989) and at a reporting limit of 1 mg/L. The bromide analysis was done by fluorescein colorimetry (Fishman and Friedman, 1989); the reporting limit for this method was 0.02 mg/L.
Figure 5. Photographs showing typical sampling points at curtain drains in Medina County, Ohio.
MD-15 MD-23
MD-24
Methods of Data Collection and Analysis 7
� Indicators of Wastewater in Curtain Drains From Home Sewage-Treatement Systems, Medina County, Ohio
Two replicate samples were collected for analysis of nutrients, chloride, and bromide. Analytical results of the replicate samples were compared qualitatively with those of the field samples. The analytical results of the two sample sets were comparable (less than 5 percent difference) except those for one ammonia and one nitrite sample. The replicate ammonia analysis had a concentration of 0.057 mg/L as com-pared to less than 0.04 mg/L. The replicate nitrite analysis had a concentration of less than 0.008 mg/L as compared to an estimated concentration of 0.005 mg/L. A blank sample for analysis of nutrients, chloride, and bromide was collected by pumping blank water from the supply bottle into the sample bottle; no analytes were detected in the blank sample.
Microbiological Constituents
Water samples for microbiological analyses were col-lected with the same tubing used for chemical-constituents sampling. The tubing was cleaned with nonphosphate deter-gent and deionized water, followed by sterilization in an autoclave. Samples were analyzed for F-specific and somatic coliphage and E. coli. Selected E. coli isolates were subjected to rep-PCR analysis. These analyses were done in the USGS Ohio Water Microbiology Lab (OWML). Standard operat-ing procedures, quality assurance, and quality control were followed and are detailed in Francy and others (2004) and Dumouchelle and Stoeckel (2005).
Water samples for analyses of F-specific and somatic coliphage were collected from the curtain drains and HSTSs at all 11 sites. The water from the HSTS was analyzed first, and the curtain-drain sample was analyzed only if F-specific coliphage was found in the HSTS sample. Samples were ana-lyzed for coliphage by use of a quantitative, single-agar-layer method (U.S. Environmental Protection Agency, 2001). The intent was to genotype the coliphage if it was found in both the curtain drains and the HSTS. Coliphage genotyping methods are described in Hsu and others (1995) and Beekwilder and others (1996). Genotyping of F-specific coliphage can be used to help distinguish between human and nonhuman sources (Noble and others, 2003). Coliphage were not detected in any samples from curtain drains; therefore, no genotyping was done.
Water samples were plated to measure E. coli concentra-tions from the 11 curtain drains, 11 HSTSs, and 2 wells. Plat-ing was done within 24 hours of sampling by use of the mem-brane filtration method with mTEC agar (U.S. Environmental Protection Agency, 2000). Nonstandard collection methods were required to obtain water samples from the HSTSs for E. coli analysis; these methods are described in Dumouchelle and Stoeckel (2005).
E. coli isolates, individual colonies isolated from the agar plate, were characterized by rep-PCR genomic analy-sis by a protocol similar to that reported by Rademaker and de Bruijn (1997), modified and standardized by Bacterial Barcodes (2004). Dumouchelle and Stoeckel (2005) describe
these methods and related quality assurance/quality control procedures in detail. The rep-PCR method measures an index of genetic similarity but does not give information on species, so operational taxonomic units (OTU) were defined to assign genetically similar isolates to groups; isolates in an OTU had at least 96 percent genetic similarity by the procedures used. At least 10 percent of each OTU were tested to confirm that the OTU belonged to the species E. coli. Because of the clonal nature of E. coli populations (Whittam, 1989) and the diversity of E. coli reported in literature studies (Caugant and others, 1981; Johnson and others, 2004; Kariuki and others, 1999; McLellan, 2004; and Yang and others, 2004), all E. coli iso-lates belonging to the same OTU were assumed to have come from the same source.
Three replicate samples were collected for E. coli analy-sis; because of the wide range of variability in concentrations in microbiological analyses, quality-assurance analysis is frequently done with log
10 transformed data (D.S. Francy,
U.S. Geological Survey, oral commun., 2005). Two of the replicate analyses had less than 1 percent difference in E. coli counts between the (log-transformed) standard and replicate samples. The difference in the third (log-transformed) rep-licate analysis was only 10 percent, which is not considered significant (particularly because the replicate sample count of 16 col/100 mL was below the ideal range). One replicate sample for coliphage was analyzed. The standard sample had a count of 6,000 plaques/100 mL, and the replicate had a count of 8,000 plaques/100 mL, yielding a log-transformed difference of 18 percent. Given the difficulty in counting such a large number of plaques, the large percent difference is not unexpected.
Occurrence of Chemical and Microbiological Constituents
To determine whether HSTS-derived water was present in the curtain drains, data from several indicators were evaluated to provide multiple lines of evidence: the occurrence and con-centrations of nutrient, chloride and bromide ratios, and E. coli; Cl/Br ratios; genotyping of coliphage; and genetic fingerprinting of E. coli. Differences in the composition of water in the drains at ETA and LL systems were evaluated qualitatively.
Nutrients
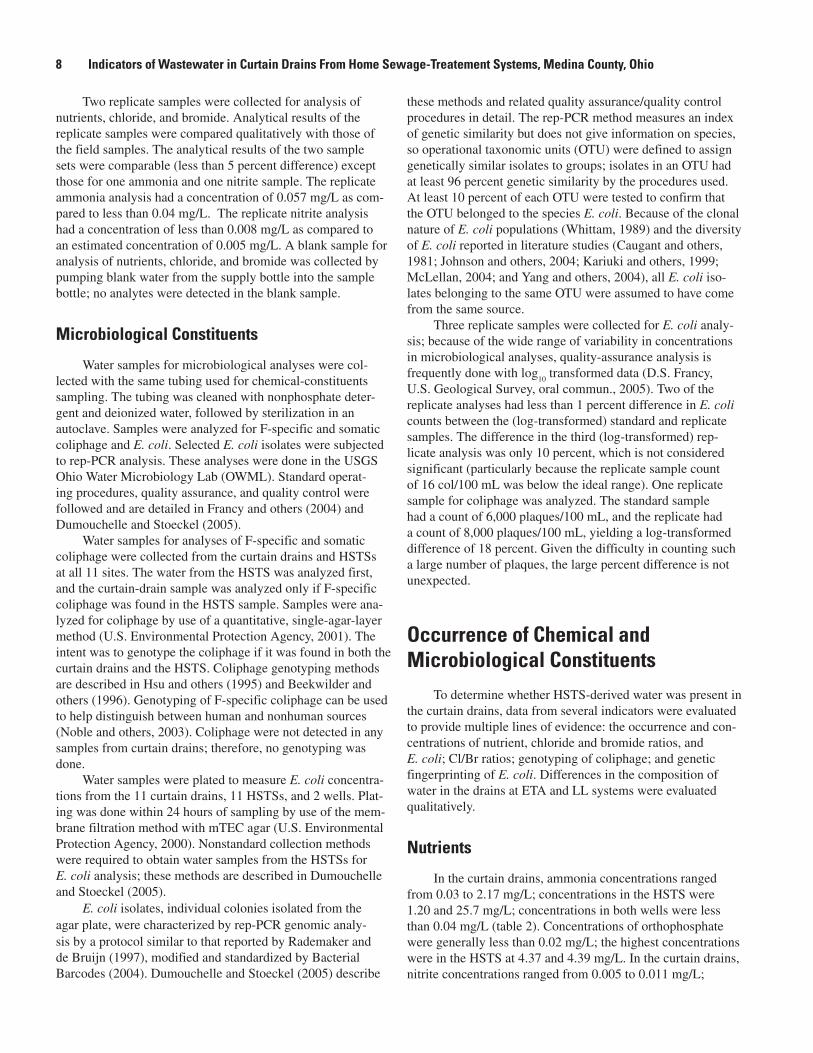
In the curtain drains, ammonia concentrations ranged from 0.03 to 2.17 mg/L; concentrations in the HSTS were 1.20 and 25.7 mg/L; concentrations in both wells were less than 0.04 mg/L (table 2). Concentrations of orthophosphate were generally less than 0.02 mg/L; the highest concentrations were in the HSTS at 4.37 and 4.39 mg/L. In the curtain drains, nitrite concentrations ranged from 0.005 to 0.011 mg/L;
Tabl
e 2.
Re
sults
of a
naly
ses
of s
ampl
es fr
om w
ells
and
hom
e se
wag
e-tre
atm
ent s
yste
ms
in M
edin
a Co
unty
, Ohi
o.
[HST
S, h
ome
sew
age-
trea
tmen
t sys
tem
; CD
, cur
tain
dra
in; W
E, r
esid
entia
l wat
er w
ell;
µS/c
m, m
icro
siem
ens
per
cent
imet
er a
t 25
degr
ees
Cel
sius
; mg/
L, m
illig
ram
s pe
r lit
er; <
, les
s th
an; -
-, n
o da
ta; E
, es
timat
ed v
alue
]
Site
nam
eD
ate
Sam
ple
sour
ce
pH(s
tand
ard
units
)
Spec
ific
cond
ucta
nce
(µS/
cm)
Am
mon
ia(m
g/L
as N
)
Nitr
ite
+ ni
trat
e(m
g/L
as N
)
Nitr
ite(m
g/L
as N
)
Nitr
ate,
calc
ulat
ed
(mg/
Las
N)
Ort
hoph
os-
phat
e(m
g/L
as P
)
Chlo
ride
,di
ssol
ved
(mg/
L)
Bro
mid
e,di
ssov
led
(mg/
L)
Evap
orat
ion-
trans
pira
tion-
abso
rptio
n sy
stem
s (E
TA)
MD
-15
6-21
-200
4C
D7.
380
1E
.03
3.54
< 0
.008
3.53
< 0
.02
150.
05
MD
-16
6-21
-200
4 C
D8.
063
2<
.04
1.34
< .0
081.
33<
.02
21.1
0
MD
-18
6-22
-200
4H
STS
----
25.7
.99
.635
.36
4.39
35.0
3
CD
7.7
703
<.0
4.6
6.0
11.6
5<
.02
13.0
4
MD
-19
6-22
-200
4H
STS
----
1.20
4.24
3.77
.47
4.37
41.0
8
CD
6.9
863
<.0
4.0
6E
.006
E .0
5<
.02
13.0
6a
MD
-23
6-23
-200
4 C
D6.
718
80E
.03
2.25
.009
2.24
.20
340
.17
WE
----
<.0
41.
67<
.008
1.66
< .0
245
.03
MD
-24
6-24
-200
4 C
D6.
565
12.
17<
.06
E .0
05E
< .0
6<
.02
19.2
2
Leac
h-lin
e sy
stem
s (L
L)
MD
-17
6-21
-200
4C
D--
350
<0.
041.
37<
0.0
081.
36<
0.0
25.
5E
.01
MD
-20
6-22
-200
4C
D7.
458
2.0
6.4
6E
.006
E .4
5<
.02
8.3
.03
MD
-21
6-22
-200
4C
D--
428
.20
E .0
4<
.008
E .0
3.0
414
.06
MD
-22
6-23
-200
4C
D--
642
.14
.50
.010
.49
< .0
211
.04
MD
-25
6-24
-200
4C
D7.
048
0<
.04
1.50
< .0
081.
49<
.02
11.0
4
WE
----
<.0
4.6
7<
.008
.66
< .0
248
.05
a Con
cent
ratio
n is
fro
m a
rep
licat
e sa
mpl
e be
caus
e th
e re
gula
r sa
mpl
e w
as n
ot a
naly
zed
for
brom
ide.
Occurrence of Chemical and Microbiological Constituents 9

10 Indicators of Wastewater in Curtain Drains From Home Sewage-Treatement Systems, Medina County, Ohio
concentrations in the HSTS were 0.635 and 3.77 mg/L; con-centrations in the wells were less than 0.008 mg/L. Calculated nitrate concentrations in the curtain drains ranged from 0.03 to 3.53 mg/L; concentrations in the HSTS were 0.36 and 0.47 mg/L, and concentrations in the wells were 0.66 and 1.66 mg/L.
Baker and others (1989) analyzed 16,166 samples of water from private wells throughout Ohio. They considered nitrate concentrations1 of 0.3 mg/L (as N) or less as represen-tative of background concentrations, concentrations of 3.1 to 10 mg/L (as N) as possibly indicating effects of human activ-ity, and concentrations greater than 10 mg/L (as N) as being most likely due to human activity. In the spring of 1987 and spring 1988, water samples from 182 private wells in Medina County were analyzed; 75 percent (136 wells) had nitrate concentrations less than 0.3 mg/L; 7 percent (13 wells) had concentrations between 3.0 and 10 mg/L; 2 percent (4 wells) had concentrations greater than 10 mg/L (Baker and others, 1989).
The highest concentration of nitrate detected in this study, 3.53 mg/L in a sample from the curtain drain at MD-15 (table 2), was well below the MCL of 10 mg/L. Nitrate concentra-tions from curtain drains at the 6 ETA systems ranged from less than 0.05 to 3.53 mg/L, with a median concentration of 0.99 mg/L. Nitrate concentrations from curtain drains at 5 LL systems ranged from 0.03 to 1.49 mg/L, with a median con-centration of 0.49 mg/L.
In a similar study by the Ohio Department of Health (ODH), 28 samples were collected from 21 curtain drains (all LL systems) in 2 counties (J. Caudill, Ohio Department of Health, written commun., 2005). The ODH-reported nitrite plus nitrate concentrations ranged from less than 1 to 3.64 mg/L, with a median of 0.43 mg/L. In comparison, the nitrite plus nitrate concentrations in curtain-drain samples from the Medina County LL systems ranged from 0.04 to 1.5 mg/L, with a median of 0.5 mg/L; concentrations in curtain-drain samples from the Medina County ETA systems ranged from less than 0.06 to 3.54 mg/L, with a median of 1.0 mg/L. Although the concentrations in curtain-drain samples from the Medina County ETA systems have a slightly larger range and higher median value than those in samples from the LL systems, the concentrations from the curtain drains at both systems were, with one exception, below the range that Baker and others (1989) thought indicative of possible anthropogenic effects.
Phosphorus, a component of sewage, is an essential nutrient for plant growth; phosphorus enrichment, however, can lead to algal blooms and eutrophication of water bodies. In water samples, orthophosphate is the most stable form of phosphorus. Phosphorus tends to precipitate out of solution, so dissolved phosphorus added to soils from an HSTS may not remain available for long periods (Hem, 1989). No standards
1 Nitrite plus nitrate concentrations were referred to as “nitrate” in their study.
have been established for phosphorus in the Ohio Water Qual-ity Standards; however, large-volume point-source discharges in the Lake Erie basin have a permit limit of 1.0 mg/L in the final effluent (Ohio Environmental Protection Agency, 2003a). Orthophosphate concentrations above the detection limit were found only in the HSTS samples at MD-18 and MD-19 (table 2). There were no meaningful differences between ETA and LL systems with respect to orthophosphate concentrations in curtain drains.
Chloride and Bromide
Concentrations of chloride in 10 of the 11 curtain drains sampled ranged from 5.5 to 21 mg/L; the chloride concentra-tion in the 11th curtain drain was 340 mg/L (table 2). Chloride concentrations in the samples from the HSTS were 35 and 41 mg/L and from the water wells, 45 and 48 mg/L. It should be noted that the homes at which the HSTS water samples were collected for the analyses of chloride and bromide used city-supplied water with an average chloride concentration of 20 parts per million (parts per million are roughly equivalent to milligrams per liter).
The bromide concentration in one curtain drain sample, MD-19, was not determined; fortunately, a replicate sample was collected at that site, so the results of the replicate analysis is reported. Bromide concentrations in the 11 curtain drains ranged from 0.01 to 0.22 mg/L. Bromide concentrations in the HSTSs were 0.03 and 0.08 mg/L; concentrations in the wells were 0.03 and 0.05 mg/L. Bromide analyses were not avail-able for the city water supply.
ChlorideChloride concentrations in sewage are frequently elevated
relative to natural waters but the degree to which HSTS efflu-ent affected the chloride concentrations in curtain drains in this study cannot be definitively determined. On the basis of data on chloride concentrations in septic effluent, road salt runoff, and background concentrations in ground water, however, it may be possible to identify some HSTS effects on the qual-ity of water in the drains. Panno and others (2006) reported chloride concentrations in 29 samples from septic systems ranged 21 to 5,620 mg/L; with a median concentration of 91 mg/L. The two samples collected from the septic tanks in this study had chloride concentrations of 35 and 41 mg/L (table 2), within the range reported by Panno and others (2006).
Elevated chloride concentrations also could result from road salt contamination. Panno and others (2006) reported chloride concentrations in 13 wells affected by road salt ranged from 44 to 416 mg/L, which was similar to the range of chloride concentrations, 40 to 116 mg/L, they reported in 3 wells affected by septic contamination. The highest chloride concentration detected in Medina County, 340 mg/L, was in the sample from the curtain drain at MD-23. The HSTS is
close to the road at MD-23, with the curtain drain as close as 33 ft from the road (table 1). In addition, a water softener was known to be in use at the site. The relatively high chloride concentration could be the result of road salt or HSTS-derived water or a combination of both.
The curtain drains are not within material that would be considered an aquifer but rather in clay-rich, glacially derived soils. Background or reference chloride concentrations used for comparison should reflect such conditions. Dumouchelle and Stoeckel (2005) noted that reported chloride concentra-tions in glacial sediments in Ohio and southeastern Michi-gan ranged from 1.0 to 544 mg/L, with the median values for datasets ranging from 4 to 79 mg/L. Given these ranges, Dumouchelle and Stoeckel (2005) used a chloride concen-tration of 200 mg/L as a conservative indicator that water sampled from piezometers a few feet from HSTS leach lines was likely affected by HSTS effluent.
Although the range in and median concentrations of chloride in samples from the ETA system curtain drains (13 to 340 mg/L; 17 mg/L) were larger than those for the LL systems (5.5 to 14 mg/L; 11 mg/L), the concentrations in all but one of the samples were less than 22 mg/L (table 2). In the study by the ODH mentioned earlier (J. Caudill, Ohio Department of Health, written commun., 2005), chloride concentrations ranged from less than 5 mg/L to 2,380 mg/L, with a median of 14 mg/L. Considering the data from both studies, no differ-ence could be determined between ETA and LL systems with respect to chloride concentrations.
Bromide Bromide concentrations are naturally low; concentrations
in rainwater and snow range from about 0.005 to 0.15 mg/L (Hem, 1989) and typically are about 0.02 mg/L in streams (Drever, 1988). The ranges of reported bromide concentrations for various sources of water overlap, making it difficult to use bromide itself as an indicator of the source of water. Bromide values can be useful in ratio with chloride values, however, because small changes in bromide concentrations can give rise to large variations in the Cl/Br ratio.
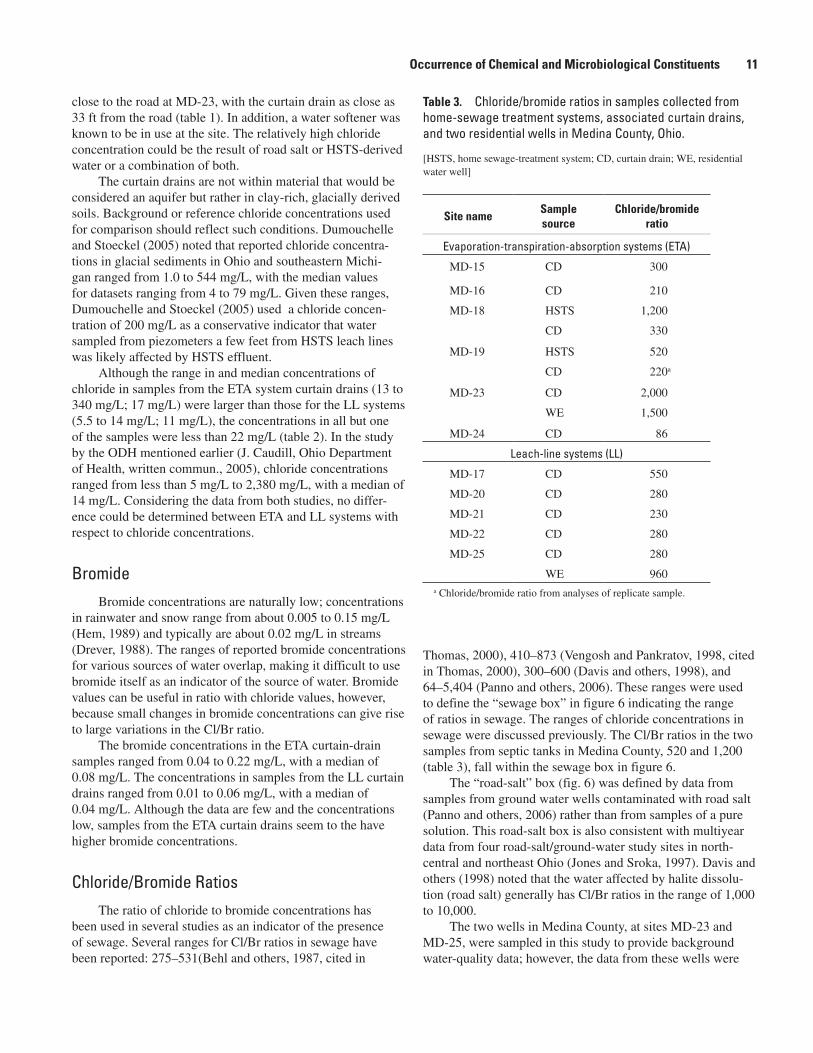
The bromide concentrations in the ETA curtain-drain samples ranged from 0.04 to 0.22 mg/L, with a median of 0.08 mg/L. The concentrations in samples from the LL curtain drains ranged from 0.01 to 0.06 mg/L, with a median of 0.04 mg/L. Although the data are few and the concentrations low, samples from the ETA curtain drains seem to the have higher bromide concentrations.
Chloride/Bromide RatiosThe ratio of chloride to bromide concentrations has
been used in several studies as an indicator of the presence of sewage. Several ranges for Cl/Br ratios in sewage have been reported: 275–531(Behl and others, 1987, cited in
Thomas, 2000), 410–873 (Vengosh and Pankratov, 1998, cited in Thomas, 2000), 300–600 (Davis and others, 1998), and 64–5,404 (Panno and others, 2006). These ranges were used to define the “sewage box” in figure 6 indicating the range of ratios in sewage. The ranges of chloride concentrations in sewage were discussed previously. The Cl/Br ratios in the two samples from septic tanks in Medina County, 520 and 1,200 (table 3), fall within the sewage box in figure 6.
The “road-salt” box (fig. 6) was defined by data from samples from ground water wells contaminated with road salt (Panno and others, 2006) rather than from samples of a pure solution. This road-salt box is also consistent with multiyear data from four road-salt/ground-water study sites in north- central and northeast Ohio (Jones and Sroka, 1997). Davis and others (1998) noted that the water affected by halite dissolu-tion (road salt) generally has Cl/Br ratios in the range of 1,000 to 10,000.
The two wells in Medina County, at sites MD-23 and MD-25, were sampled in this study to provide background water-quality data; however, the data from these wells were
Table 3. Chloride/bromide ratios in samples collected from home-sewage treatment systems, associated curtain drains, and two residential wells in Medina County, Ohio.
[HSTS, home sewage-treatment system; CD, curtain drain; WE, residential water well]
Site nameSample source
Chloride/bromide ratio
Evaporation-transpiration-absorption systems (ETA)
MD-15 CD 300
MD-16 CD 210
MD-18 HSTS 1,200
CD 330
MD-19 HSTS 520
CD 220a
MD-23 CD 2,000
WE 1,500
MD-24 CD 86
Leach-line systems (LL)
MD-17 CD 550
MD-20 CD 280
MD-21 CD 230
MD-22 CD 280
MD-25 CD 280
WE 960a Chloride/bromide ratio from analyses of replicate sample.
Occurrence of Chemical and Microbiological Constituents 11
12 Indicators of Wastewater in Curtain Drains From Home Sewage-Treatement Systems, Medina County, Ohio
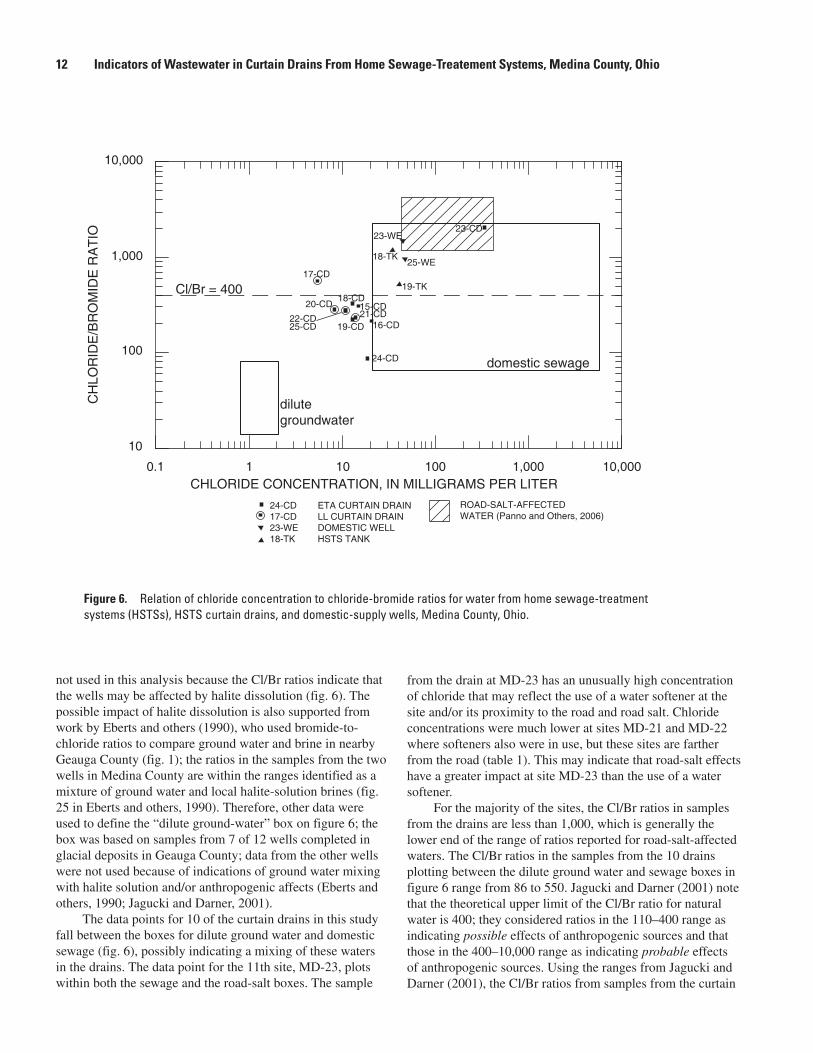
not used in this analysis because the Cl/Br ratios indicate that the wells may be affected by halite dissolution (fig. 6). The possible impact of halite dissolution is also supported from work by Eberts and others (1990), who used bromide-to-chloride ratios to compare ground water and brine in nearby Geauga County (fig. 1); the ratios in the samples from the two wells in Medina County are within the ranges identified as a mixture of ground water and local halite-solution brines (fig. 25 in Eberts and others, 1990). Therefore, other data were used to define the “dilute ground-water” box on figure 6; the box was based on samples from 7 of 12 wells completed in glacial deposits in Geauga County; data from the other wells were not used because of indications of ground water mixing with halite solution and/or anthropogenic affects (Eberts and others, 1990; Jagucki and Darner, 2001).
The data points for 10 of the curtain drains in this study fall between the boxes for dilute ground water and domestic sewage (fig. 6), possibly indicating a mixing of these waters in the drains. The data point for the 11th site, MD-23, plots within both the sewage and the road-salt boxes. The sample
from the drain at MD-23 has an unusually high concentration of chloride that may reflect the use of a water softener at the site and/or its proximity to the road and road salt. Chloride concentrations were much lower at sites MD-21 and MD-22 where softeners also were in use, but these sites are farther from the road (table 1). This may indicate that road-salt effects have a greater impact at site MD-23 than the use of a water softener.
For the majority of the sites, the Cl/Br ratios in samples from the drains are less than 1,000, which is generally the lower end of the range of ratios reported for road-salt-affected waters. The Cl/Br ratios in the samples from the 10 drains plotting between the dilute ground water and sewage boxes in figure 6 range from 86 to 550. Jagucki and Darner (2001) note that the theoretical upper limit of the Cl/Br ratio for natural water is 400; they considered ratios in the 110–400 range as indicating possible effects of anthropogenic sources and that those in the 400–10,000 range as indicating probable effects of anthropogenic sources. Using the ranges from Jagucki and Darner (2001), the Cl/Br ratios from samples from the curtain
0.1 1 10 100 1,000 10,000
10
100
1,000
10,000
domestic sewage
15-CD
16-CD
17-CD
18-CD
19-CD
20-CD21-CD22-CD
23-CD
24-CD
25-CD
25-WE
23-WE
18-TK
19-TK
dilutegroundwater
Cl/Br = 400
CH
LOR
IDE
/BR
OM
IDE
RA
TIO
CHLORIDE CONCENTRATION, IN MILLIGRAMS PER LITER24-CD ETA CURTAIN DRAIN17-CD LL CURTAIN DRAIN23-WE DOMESTIC WELL18-TK HSTS TANK
ROAD-SALT-AFFECTEDWATER (Panno and Others, 2006)
Figure 6. Relation of chloride concentration to chloride-bromide ratios for water from home sewage-treatment systems (HSTSs), HSTS curtain drains, and domestic-supply wells, Medina County, Ohio.

drains (table 3, fig. 6) at sites MD-15, MD-16, MD-18, MD-19, MD-20, MD-21, MD-22 and MD-25, indicate possible anthropogenic sources, whereas the samples from sites MD-17 and MD-23 indicate probable anthropogenic sources. Cl/Br ratios indicating possible or probable anthropogenic sources in curtain-drain samples were virtually the same for both ETA and LL systems. There was no meaningful difference between ETA and LL systems with respect to Cl/Br ratios.
Coliphage
Somatic coliphage was detected in seven HSTSs, but F-specific coliphage was detected in only two HSTSs, MD-16 and MD-22 (table 4). Somatic coliphage was detected in one of the two curtain-drain samples tested. No F-specific coli-phage was detected in either of the two curtain-drain samples tested.
Occurrence of Chemical and Microbiological Constituents 13
Table 4. Results of analyses of bacteria and coliphage in samples from wells and home sewage-treatment system sites in Medina County, Ohio.
[CD, curtain drain; HSTS, home sewage-treatment system; WE, residential water well; col/100 mL, colonies per 100 milliliters; plaq/100 mL, plaques per 100 milliliters; <, less than; --, no data; E, estimated]
Site name Sample source DateE. coli
(col/100 mL)
Somatic coliphage
(plaq/100 mL)
F-specific coliphage
(plaq/100 mL)
Evaporation-transpiration-absorption systems (ETA)
MD-15 CD 6-21-2004 110 -- --
HSTS 160,000 < 1 < 1
MD-16 CD 6-21-2004 300 -- < 1
HSTS 96,000 < 1 69,000
MD-18 CD 6-22-2004 760 -- --
HSTS 830 1,600 < 1
MD-19 CD 6-22-2004 47 -- --
HSTS 12,000 < 1 < 1
MD-23 CD 6-23-2004 61 -- --
HSTS 16,000 67 < 1
WE <1 -- --
MD-24 CD 6-24-2004 22 6,000 --
HSTS 250 27 < 1
Leach-line systems (LL)
MD-17 CD 6-21-2004 14 -- --
HSTS 29,000 < 1 < 1
MD-20 CD 6-22-2004 30 -- --
HSTS 350 70 < 1
MD-21 CD 6-22-2004 230 -- --
HSTS 620 17 < 1
MD-22 CD 6-23-2004 60 < 1 < 1
HSTS 720 200 28
MD-25 CD 6-24-2004 E 1 -- --
HSTS 11,000 453 < 1
WE <1 -- --
14 Indicators of Wastewater in Curtain Drains From Home Sewage-Treatement Systems, Medina County, Ohio
On the basis of findings in a USGS study in Oregon in which F-specific coliphage was detected in 19 out of 51 samples (S.R. Hinkle, U.S. Geological Survey, oral commun., 2004), it was expected that sufficient coliphage would be detected in this study for genotyping analysis. However, only 2 of the 11 sites had detectable levels of F-specific coliphage in the HSTS, and none was detected in the curtain drains at these sites; therefore, no genotyping analyses were possible.
E. coli Bacteria
Concentrations of E. coli in the HSTSs ranged from 250 to 160,000 col/100 mL, with a median of 11,000 col/100 mL (table 4). Concentrations of E. coli in the curtain drains ranged from 1 to 760 col/100 mL, with a median of 60 col/100 mL. At all sites, the concentrations of E. coli in the curtain drains were less than those in the HSTS. With respect to median concentrations, there was an order of magnitude reduction between the HSTS and curtain drains at LL systems (720 to 30 col/100 mL) and three orders of magnitude reduction at ETA systems (14,000 to 80 col/100 mL). No E. coli were detected in the well-water samples.
Of the 11 samples from curtain drains, only 2 had concentrations of E. coli exceeding the single-sample bath-ing-water standard of 235 col/100 mL (Ohio Environmental Protection Agency, 2003b). Only one site had a concentration exceeding the more relevant standard of 576 col/100 mL for secondary contact such as wading, which could occur if, for example, children were to play at or near the curtain-drain outfalls (fig. 5).
Concentrations of E. coli in the drains from the six ETA systems ranged from an estimated 22 to 760 col/100 mL, with a median concentration of 86 col/100 mL. Concentrations in the drains from the five LL systems ranged from an estimated 1 to 230 col/100 mL, with a median concentration of 30 col/100 mL. Although it appears that the E. coli concentrations at LL systems were generally lower than at ETA systems, the small number of samples makes it impossible to evaluate rela-tive concentrations with certainty. For example, if the curtain-drain sample from MD-18 (highest E. coli concentration) had not been collected, the range and median of the remaining five ETA curtain-drain samples would have been 22 to 300 col/100 mL and 61 col/100 mL—comparable to the LL systems. Although there is no reason to discount the MD-18 sample, the differences between the two systems would have to be consid-erable to be significant given so few samples.
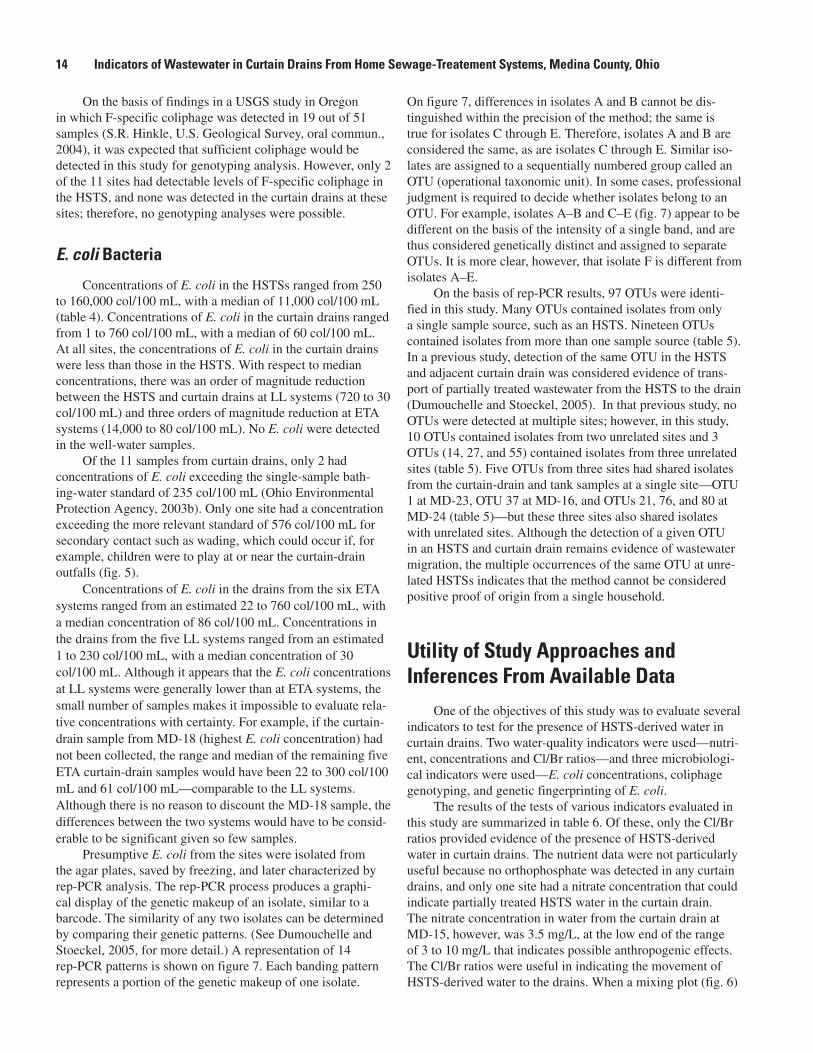
Presumptive E. coli from the sites were isolated from the agar plates, saved by freezing, and later characterized by rep-PCR analysis. The rep-PCR process produces a graphi-cal display of the genetic makeup of an isolate, similar to a barcode. The similarity of any two isolates can be determined by comparing their genetic patterns. (See Dumouchelle and Stoeckel, 2005, for more detail.) A representation of 14 rep-PCR patterns is shown on figure 7. Each banding pattern represents a portion of the genetic makeup of one isolate.
On figure 7, differences in isolates A and B cannot be dis-tinguished within the precision of the method; the same is true for isolates C through E. Therefore, isolates A and B are considered the same, as are isolates C through E. Similar iso-lates are assigned to a sequentially numbered group called an OTU (operational taxonomic unit). In some cases, professional judgment is required to decide whether isolates belong to an OTU. For example, isolates A–B and C–E (fig. 7) appear to be different on the basis of the intensity of a single band, and are thus considered genetically distinct and assigned to separate OTUs. It is more clear, however, that isolate F is different from isolates A–E.
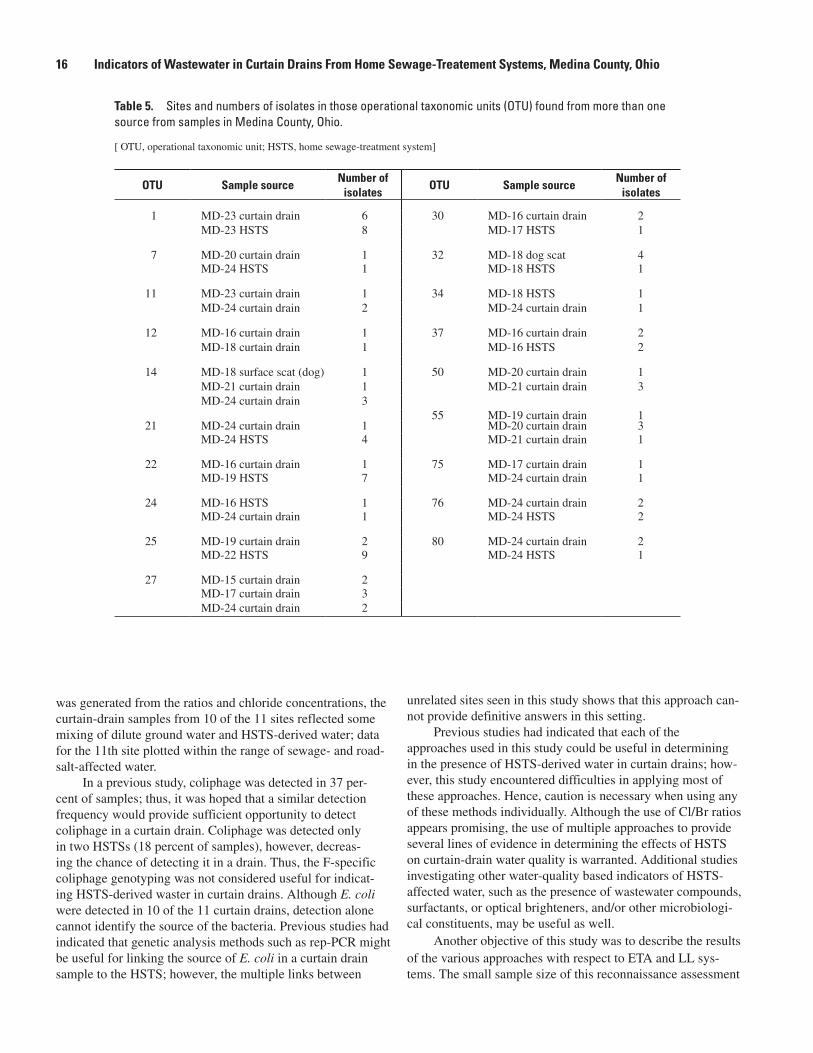
On the basis of rep-PCR results, 97 OTUs were identi-fied in this study. Many OTUs contained isolates from only a single sample source, such as an HSTS. Nineteen OTUs contained isolates from more than one sample source (table 5). In a previous study, detection of the same OTU in the HSTS and adjacent curtain drain was considered evidence of trans-port of partially treated wastewater from the HSTS to the drain (Dumouchelle and Stoeckel, 2005). In that previous study, no OTUs were detected at multiple sites; however, in this study, 10 OTUs contained isolates from two unrelated sites and 3 OTUs (14, 27, and 55) contained isolates from three unrelated sites (table 5). Five OTUs from three sites had shared isolates from the curtain-drain and tank samples at a single site—OTU 1 at MD-23, OTU 37 at MD-16, and OTUs 21, 76, and 80 at MD-24 (table 5)—but these three sites also shared isolates with unrelated sites. Although the detection of a given OTU in an HSTS and curtain drain remains evidence of wastewater migration, the multiple occurrences of the same OTU at unre-lated HSTSs indicates that the method cannot be considered positive proof of origin from a single household.
Utility of Study Approaches and Inferences From Available Data
One of the objectives of this study was to evaluate several indicators to test for the presence of HSTS-derived water in curtain drains. Two water-quality indicators were used—nutri-ent, concentrations and Cl/Br ratios—and three microbiologi-cal indicators were used—E. coli concentrations, coliphage genotyping, and genetic fingerprinting of E. coli.
The results of the tests of various indicators evaluated in this study are summarized in table 6. Of these, only the Cl/Br ratios provided evidence of the presence of HSTS-derived water in curtain drains. The nutrient data were not particularly useful because no orthophosphate was detected in any curtain drains, and only one site had a nitrate concentration that could indicate partially treated HSTS water in the curtain drain. The nitrate concentration in water from the curtain drain at MD-15, however, was 3.5 mg/L, at the low end of the range of 3 to 10 mg/L that indicates possible anthropogenic effects. The Cl/Br ratios were useful in indicating the movement of HSTS-derived water to the drains. When a mixing plot (fig. 6)

The bars labeled A–F are individual isol ates. The banding patterns on the bars represent a portion of genetic information for the isolate. The bars labeled Rare repeated measurements of a control strain (E. coli ATCC 25922). Thepercent similarity of these control measurements is indicated by the lines to theleft of the bars—the controls are greater than 97 percent similar. The dashedline indicates the precision of the analytical method as determined by therepeated measurements (R).
The measurement precision (dashed line) and professional judgment are usedto assign the isolates A-F to an arbitrary operational taxonomic unit (OTU).Based on the similarity of the banding patterns, isolates A and B are assigned to OTU 1, isolates C, D and E are assigned to OTU 2, and isolate F is assigned to OTU 3.
75 5908 09 10085Percent similarity
IsolateABCDEFRRRRRRRR
OTU
1
2
3
Figure 7. Example of results of rep-PCR analysis showing six isolates and multiple measurements of a single isolate, demonstrating the reproducibility of results.
Utility of Study Approaches and Inferences From Available Data 15
16 Indicators of Wastewater in Curtain Drains From Home Sewage-Treatement Systems, Medina County, Ohio
was generated from the ratios and chloride concentrations, the curtain-drain samples from 10 of the 11 sites reflected some mixing of dilute ground water and HSTS-derived water; data for the 11th site plotted within the range of sewage- and road-salt-affected water.
In a previous study, coliphage was detected in 37 per-cent of samples; thus, it was hoped that a similar detection frequency would provide sufficient opportunity to detect coliphage in a curtain drain. Coliphage was detected only in two HSTSs (18 percent of samples), however, decreas-ing the chance of detecting it in a drain. Thus, the F-specific coliphage genotyping was not considered useful for indicat-ing HSTS-derived waster in curtain drains. Although E. coli were detected in 10 of the 11 curtain drains, detection alone cannot identify the source of the bacteria. Previous studies had indicated that genetic analysis methods such as rep-PCR might be useful for linking the source of E. coli in a curtain drain sample to the HSTS; however, the multiple links between
unrelated sites seen in this study shows that this approach can-not provide definitive answers in this setting.
Previous studies had indicated that each of the approaches used in this study could be useful in determining in the presence of HSTS-derived water in curtain drains; how-ever, this study encountered difficulties in applying most of these approaches. Hence, caution is necessary when using any of these methods individually. Although the use of Cl/Br ratios appears promising, the use of multiple approaches to provide several lines of evidence in determining the effects of HSTS on curtain-drain water quality is warranted. Additional studies investigating other water-quality based indicators of HSTS-affected water, such as the presence of wastewater compounds, surfactants, or optical brighteners, and/or other microbiologi-cal constituents, may be useful as well.
Another objective of this study was to describe the results of the various approaches with respect to ETA and LL sys-tems. The small sample size of this reconnaissance assessment
Table 5. Sites and numbers of isolates in those operational taxonomic units (OTU) found from more than one source from samples in Medina County, Ohio.
[ OTU, operational taxonomic unit; HSTS, home sewage-treatment system]
OTU Sample sourceNumber of
isolatesOTU Sample source
Number of isolates
1 MD-23 curtain drain 6 30 MD-16 curtain drain 2MD-23 HSTS 8 MD-17 HSTS 1
7 MD-20 curtain drain 1 32 MD-18 dog scat 4MD-24 HSTS 1 MD-18 HSTS 1
11 MD-23 curtain drain 1 34 MD-18 HSTS 1MD-24 curtain drain 2 MD-24 curtain drain 1
12 MD-16 curtain drain 1 37 MD-16 curtain drain 2MD-18 curtain drain 1 MD-16 HSTS 2
14 MD-18 surface scat (dog) 1 50 MD-20 curtain drain 1MD-21 curtain drain 1 MD-21 curtain drain 3MD-24 curtain drain 3
55 MD-19 curtain drain 121 MD-24 curtain drain 1 MD-20 curtain drain 3
MD-24 HSTS 4 MD-21 curtain drain 1
22 MD-16 curtain drain 1 75 MD-17 curtain drain 1MD-19 HSTS 7 MD-24 curtain drain 1
24 MD-16 HSTS 1 76 MD-24 curtain drain 2MD-24 curtain drain 1 MD-24 HSTS 2
25 MD-19 curtain drain 2 80 MD-24 curtain drain 2MD-22 HSTS 9 MD-24 HSTS 1
27 MD-15 curtain drain 2MD-17 curtain drain 3MD-24 curtain drain 2

precludes rigorous statistical comparisons; therefore, only simple comparisons between the two systems could be made. Although the nitrate concentrations in curtain-drain samples from the ETA systems had a slightly larger range and median value than did samples from the LL systems, the values for both systems were, with one exception, below the range that can be considered indicative of possible anthropogenic effects; therefore, the differences were not particularly meaningful. There were no differences between the two systems with respect to the chloride-bromide ratios, nor were there differ-ences with respect to chloride concentrations. The curtain-drain samples from the ETA systems had somewhat higher bromide concentrations, but the reason for this was unclear. E. coli bacteria were found in the curtain-drain samples from both systems, with ETA systems having higher concentrations, though the difference between both systems is not statisti-cally significant. Although only ETA sites showed a link between the HSTS and curtain-drain samples on the basis of the rep-PCR analysis, the numerous links between unrelated
sites in this study means that such links were ambiguous. Therefore, although the curtain-drain samples from the ETA systems appear to show slightly more evidence of the presence of HSTS-derived water than do samples from the LL systems (table 6), the best evidence is from the Cl/Br ratios, and both ETA and LL systems reflect the presence of HSTS-derived water. Therefore, with the data from this reconnaissance study, it is not possible to state definitively whether there are any dif-ferences between the ETA and LL systems with respect to the water quality in curtain drains.
Summary and ConclusionsA variety of home sewage-treatment system (HSTS)
designs are used in Ohio. Many of these systems use curtain or perimeter drains to depress the level of the subsurface water in and around the HSTS. There are concerns that these drains could release untreated wastewater and potential pathogens to
Table 6. Summary of the utility of indicators used in this study for indicating the movement of partially untreated wastewater from home sewage-treatment systems to associated curtain drain.
[>, greater than; mg/L, milligrams per liter; HSTS, home sewage-treatment systems; rep-PCR, repetitive DNA element polymerase chain reaction; x, indicates evidence of untreated wastewater movement; --, no evidence of untreated wastewater movement]
Site number
Nitrate concentra-tion a
> 3 mg/L
Chloride / bromide ratio aE. coli
detectedin curtain
draind
Indication of a link between the HSTS and
curtain drainby way of rep-PCR
x-yplotb 110 – 400c > 400 c
Evaporation-transpiration-absorption systems (ETA)
MD-15 x x x -- x --
MD-16 -- x x -- x x
MD-18 -- x x -- x --
MD-19 -- x x -- x --
MD-23 -- x -- x x x
MD-24 -- -- -- x xe
Leach-line systems (LL)
MD-17 -- x -- x x --
MD-20 -- x x -- x --
MD-21 -- x x -- x --
MD-22 -- x x -- x --
MD-25 -- x x -- --f --aSee text for explanation of why the Cl/Br ratio and these concentrations are used as indicators.
bBased on chloride/bromide plot in figure 6.
cRange of 110–400 indicates possible anthropogenic effects; values of ratio greater than 400 indicates probable effects.
dThe presence of E. coli indicates fecal contamination but does not indicate the source of contamination.
eIndication of a link between the curtain drain and HSTS by more than one operational taxonomic unit (OTU).
fEstimated concentration of 1 colony per 100 milliliters.
Summary and Conclusions 17
1� Indicators of Wastewater in Curtain Drains From Home Sewage-Treatement Systems, Medina County, Ohio
ground-water and surface-water bodies. The quality of water from two different HSTS designs in Medina County, Ohio, was investigated in this reconnaissance study, in coopera-tion with the Medina County Health Department. Several approaches were evaluated in this study for testing for the presence of HSTS-derived water in the curtain drains. Water samples were collected at 11 sites from curtain drains, septic tanks and residential water wells (at 2 of the 11 sites) and analyzed for nutrients, chloride, bromide, coliphage, and E. coli bacteria. In addition, genetic fingerprinting (rep-PCR) was used to determine whether bacteria in the curtain drains could be linked to the HSTS. Six evaporation-transpira-tion-absorption (ETA) and five leach-line (LL) systems were investigated.
Nitrate concentrations in the curtain drains ranged from an estimated 0.03 to 3.53 mg/L. Concentrations of chloride in 10 of the 11 curtain drains ranged from 5.5 to 21 mg/L; the chloride concentration in the 11th curtain drain was 340 mg/L. Bromide concentrations in the curtain drains ranged from an estimated 0.01 to 0.22 mg/L. Chloride-bromide (Cl/Br) ratios ranged from 86 to 2,000. No F-specific coliphage was found in any curtain-drain samples. Concentrations of E. coli in all of the curtain drains ranged from an estimated 1 to 760 col/100 mL; the Ohio secondary-contact water-quality standard of 576 col/100 mL was exceeded in only one sample.
Nutrient concentrations, Cl/Br ratios, genotyping of coliphage, E. coli concentrations, and genetic fingerprinting of bacteria were evaluated for their usefulness in determin-ing whether partially treated wastewater was present in the curtain drains. Nutrient concentrations were too low to be useful indicators. The chloride-bromide ratios were useful and reflected a mixture of ground water and HSTS-derived water in 10 of the 11 the sampled drains; the water in the 11th drain may be affected by road-salt contamination. Coliphage was not detected in the curtain drains, so genotyping could not be attempted.
Although it appeared from multiple lines of evidence that the curtain-drain samples from the ETA systems showed slightly more evidence of the presence of HSTS water than did the LL systems, the most promising evidence is from the Cl/Br ratios, which indicate that both ETA and LL systems were affected by the presence of HSTS-derived water. Therefore, with the data from this reconnaissance study, it is not possible to state definitively whether there are any differences between the ETA and LL systems with respect to the water quality in curtain drains.
AcknowledgmentsThe author thanks the numerous property owners who
allowed access to their HSTS and yards.
References Cited
ASTM International, 2002, Standard practice for installation of thermoplastic pipe and corrugated pipe in septic tank leach fields: West Conshohocken, Pa., ASTM F481-97 (2002).
Bacterial Barcodes, 2004, DiversiLab protocols and applica-tion profiles, accessed December 8, 2004, at http://www.bacbarcodes.com/dl_application_profile.htm
Baker, B.B, Wallrabenstein, L,K., Richards, R.P., and Creamer, N.L, 1989, Nitrate and pesticides in private wells of Ohio, a state atlas: Tiffin, Ohio, Heidelberg College, Water Quality Laboratory, part 1, 71 p.
Beekwilder, J., Nieuwenhuizen, R., Havelaar, A.H., and van Duin, J., 1996, An oligonucleotide hybridization assay for the identification and enumeration of F-specific RNA phages in surface water: Journal of Applied Bacteriology, v. 80, p. 1791–86.
Behl, E., Davis, S.N., and Goldowitz, J., 1987, Cl/Br ratios as an environmental tracer of anthropogenically altered waters: Geological Society of America Abstracts with Programs, v. 19, p. 585.
Carson, C.A., Shear, B.L., Ellersieck, M.R., and Schnell, J.D., 2003, Comparison of ribotyping and repetitive extragenic palindromic-PCR for identification of fecal Escherichia coli from humans and animals: Applied and Environmental Microbiology, v. 69, no. 3, p. 1836–1839.
Caugant, D.A., Levin, B.R., and Selander, R.K., 1981, Genetic diversity and temporal variation in the E. coli population of a human host: Genetics, v. 98, p. 467–490.
Davis, S.N, Whittemore, D.O., and Fabryka-Martin, June, 1998, Uses of chloride/bromide ratios in studies of potable water: Ground Water, v. 36, no. 2, p. 338–350.
Dombek, P.E., Johnson, L.K., Zimmerley, S.T., and Sadowsky, M.J., 2000, Use of repetitive DNA sequences and the PCR to differentiate Escherichia coli isolates from human and animal sources: Applied and Environmental Microbiology, v. 66, no. 6, p. 2572–2577.
Drever, J.I., 1988, The geochemistry of natural waters (2d ed.): Englewood Cliffs, N.J., Prentice Hall, p. 329.
Dumouchelle, D.H., and Stoeckel, D.M., 2005, Preliminary investigation of wastewater-related contaminants near home sewage treatment systems in Ohio: U.S. Geological Survey Open-File Report 2005–1282, 31 p.
Eberts, S.M., Bair, E.S., and de Roche, J.T., 1990, Geohydrol-ogy, ground-water quality, and simulated ground-water flow, Geauga County, Ohio: U.S. Geological Survey Water-Resources Investigations Report 90–4026, 117 p.
Fishman, M.J., ed., 1993, Methods of analysis by the U.S. Geological Survey National Water Quality Laboratory—Determination of inorganic and organic constituents in water and fluvial sediments: U.S. Geological Survey Open-File Report 93–125, 217 p.
Fishman, M.J., and Friedman, L.C., eds., 1989, Methods for determination of inorganic substances in water and fluvial sediments: U.S. Geological Survey Techniques of Water-Resources Investigations, book 5, chap. A1, 545 p.
Francy, D.S., Bushon, R.N, Luzano, E.J, Brady, A.M.G., Kephart, C.M, and Stoeckel, D.M., 2004, Quality assurance/quality control manual, Ohio Water Microbiology Labora-tory, accessed December 9, 2004, at http://oh.water.usgs.gov/micro/qcmanual/manual.html
Freeze R.A., and Cherry, J.A., 1979, Groundwater: Englewood Cliffs, N.J., Prentice-Hall, 604 p.
Hayhurst, E.N., Milliron, E.L., and Steiger, J.R., 1977, Soil survey of Medina County: U.S. Department of Agriculture, Soil Conservation Service, 119 p., 53 sheets, scale 1:15,840.
Hem, J.D., 1989, Study and interpretation of the chemical characteristics of natural waters (3d ed.): U.S. Geological Survey Water-Supply Paper 2254, 263 p.
Hsu, F.-C., Shieh, Y.-S., van Duin, J., Beekwilder, M.J., and Sobsey, M.D., 1995, Genotyping male-specific RNA coliphages by hybridization with oligonucleotide probes: Applied and Environmental Microbiology, v. 61, no. 11, p. 3960–3966.
Jagucki, M.L., and Darner, R.A., 2001, Ground-water qual-ity in Geauga County, Ohio—Review of previous studies, status in 1999, and comparision of 1986 and 1999 data: U.S. Geological Survey Water-Resources Investigations Report 01–4160, 60 p.
Johnson, L.K., Brown, M.B., Carruthers, E.A., Ferguson, J.A., Dombek, P.E., and Sadowsky, M.J., 2004, Sample size, library composition, and genotypic diversity among natural populations of Escherichia coli from different animals influ-ence accuracy of determining sources of fecal pollution: Applied and Environmental Microbiology, v. 70, no. 8, p. 4478–4485.
Jones, A.L., and Sroka, B.N., 1997, Effects of highway deicing chemicals on shallow unconsolidated aquifers in Ohio— Interim report, 1988–1993: U.S. Geological Survey Water-Resources Investigations Report 97–4027, 139 p.
Kariuki, S., Gilks, C., Kimari, J., Obanda, A., Muyodi, J., Waiyaki, P., and Hart, C.A., 1999, Genotype analysis of Escherichia coli strains isolated from children and chickens living in close contact: Applied and Environmental Microbi-ology, v. 65, no. 2, p. 472–476.
Mancl, Karen, and Slater, David, 2001, Suitability assessment of Ohio’s soils for soil-based wastewater treatment: Ohio Journal of Science, v. 101, no. 3/4, p. 48–56.
McLellan, S.L., 2004, Genetic diversity of Escherichia coli isolated from urban rivers and beach water: Applied and Environmental Microbiology, v. 70, no. 8, p. 4658–4665.
Noble, R.T., Allen, S.M., Blackwood, A.D., Chu, W., Jiang, S.C., Lovelace, G.L., Sobsey, M.D., Stewart, J.R., and Wait, D.A., 2003, Use of viral pathogens and indicators to differ-entiate between human and non-human fecal contamination in a microbial source tracking comparison study: Journal of Water and Health, v. 1, no. 4, p. 195–207.
Ohio Environmental Protection Agency, 2003a, Biological and water quality study of the Big Walnut Creek Basin, 2000: Technical report DSW/EAS 2003-11-10, accessed June 2005 at http://www.epa.state.oh.us/dsw/documents/BigWalnutCreekTSD.pdf
Ohio Environmental Protection Agency, 2003b, Water use definitions and statewide criteria: Ohio Administrative code, chap. 3745–1–07, July 1, 2003, 31 p.
Ohio Department of Development, 2005, Annual estimates of the population for Ohio counties, April 1, 2000, to July 1, 2004, accessed September 2005 at http://www.odod.state.oh.us/research/files/p100000004.pdf
Panno S.V., Hackley, K.C., Hwang, H.H., Greenberg, S., Krapac, I.G., Landsberger, S., and O’Kelly, D.J., 2002, Source identification of sodium and chloride contamination in natural waters—Preliminary results, in Illinois Ground-water Consortium annual conference, 12th, April 20, 2002, Proceedings: Accessed Feburary 2004 at http//:www.siu.edu/orda/igc/proceedings/02/panno.pdf
Panno, S.V., Hackley, K.C., Hwang, H.H., Greenberg, S.E., Krapac, I.G., Landsberger, S., and O’Kelly, D.J., 2006, Characterization and identification of Na-Cl sources in ground water: Ground Water, v. 44, no. 2, p. 176–187.
Rademaker, J.L.W,, and de Bruijn, F.J., 1997, Charcteriza-tion and classification of microbes by REP-PCR genomic fingerprinting and computer assisted pattern analysis, in Caetano-Anolles, G., and Gresshoff, P.M., eds., DNA mark-ers—Protocols, applications, and overviews: New York, Wiley-Liss, p. 151–172.
Stoeckel, D.M., 2005, Application of microbial source track-ing tools for water-quality investigations: U.S. Geological Survey Techniques and Methods, book 2, chap. 3A, 49 p.
Thomas, M.A, 2000, The effect of residential development on ground-water quality near Detroit, Michigan: Journal of the American Water Resources Association, v. 36, no. 5, p. 1023–1038.
References Cited 19
20 Indicators of Wastewater in Curtain Drains From Home Sewage-Treatement Systems, Medina County, Ohio
U.S. Environmental Protection Agency, 2000, Improved enu-meration methods for the recreational water quality indica-tors—Enterococci and Escherichia coli: Washington D.C., Office of Science and Technology, 27 p.
U.S. Environmental Protection Agency, 2001, Method 1602–Male-specific (F+) and somatic coliphage in water by single agar layer (SAL) procedure, accessed December 9, 2004, at http://www.epa.gov/nerlcwww/1602ap01.pdf
U.S. Environmental Protection Agency, 2004, List of drinking water contaminants & MCLs, accessed October 20, 2004, at http://www.epa.gov/safewater/mcl.html
Vengosh, Avner, and Pankratov, Irena, 1998, Chloride/bromide and chloride/fluoride ratios of domestic sewage effluents and associated contaminated ground water: Ground Water, v. 36, no. 5, p. 815–824.
Whittam, T.S., 1989, Clonal dynamics of Escherichia coli in its natural habitat: Antonie van Leeuwenhoek, v. 55, p. 23–32.
Whittmore, D.O., 1998, Bromide as a tracer in groundwater studies—Geochemistry and analytical determination, in National Water Well Association, Ground Water Geochem-istry Conference, Denver, Colo., February 16–18, 1998, Proceedings: p. 339–359.
Yang, H.H., Vonopal, R.T., Grasso, Dominco, and Smets, B.F., 2004, High diversity among environmental Escherichia coli isolates from a bovine feedlot: Applied and Environmental Microbiology, v. 70, no. 3, p. 1528–1536.

Denise H. Dumouchelle—
Assessm
ent of the Use of Selected Chem
ical and Microbiological Constituents as Indicators of W
astewater in Curtain D
rains From
Hom
e Sewage-Treatm
ent Systems in M
edina County, Ohio—
Scientific Investigations Report 2006–5183
Printed on recycled paper