Embed Size (px)
Citation preview
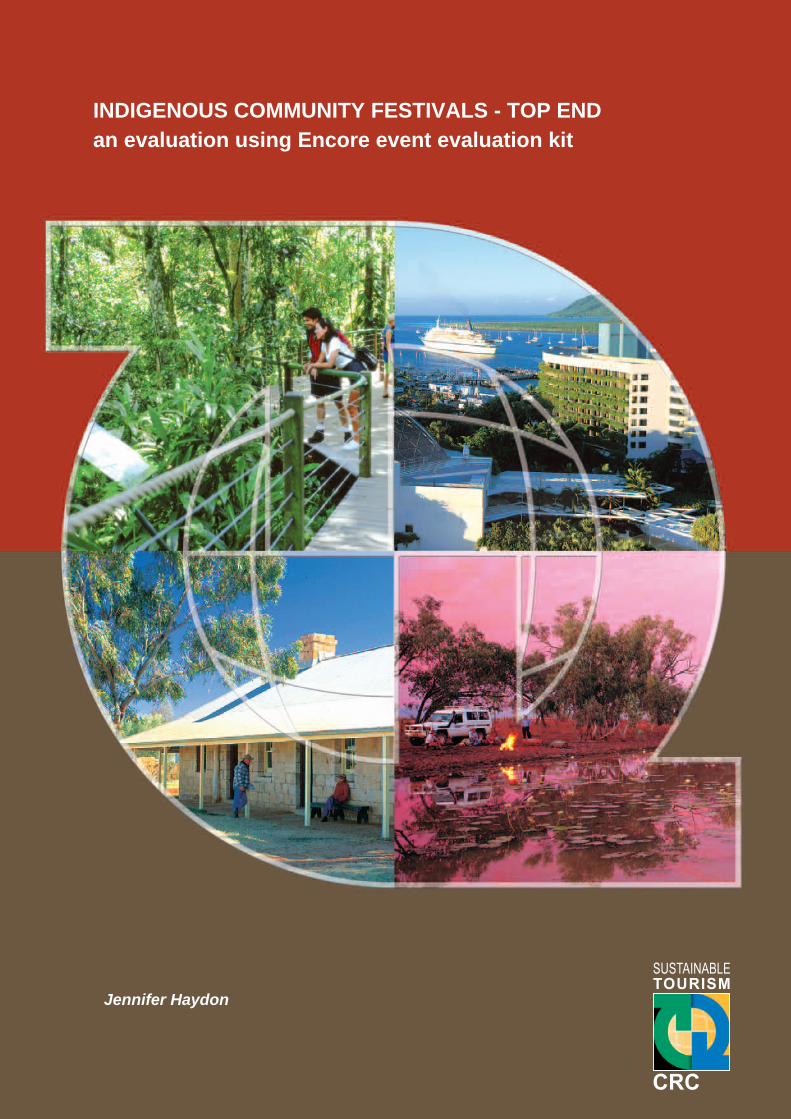
Jennifer Haydon
INDIGENOUS COMMUNITY FESTIVALS - TOP ENDan evaluation using Encore event evaluation kit
An Evaluation Using Encore Event Evaluation Kit
ii
Technical Reports The technical report series present data and its analysis, meta-studies and conceptual studies, and are considered to be of value to industry, government and researchers. Unlike the Sustainable Tourism Cooperative Research Centre’s Monograph series, these reports have not been subjected to an external peer review process. As such, the scientific accuracy and merit of the research reported here is the responsibility of the authors, who should be contacted for clarification of any content. Author contact details are at the back of this report. Editors Prof Chris Cooper University of Queensland Editor-in-Chief Prof Terry De Lacy Sustainable Tourism CRC Chief Executive Prof Leo Jago Sustainable Tourism CRC Director of Research National Library of Australia Cataloguing-in-Publication Haydon, Jennifer. Indigenous community festivals – Top End: an evaluation using Encore event evaluation kit. Bibliography. ISBN 9781920965174. 1. Culture and tourism – Northern Territory – Evaluation. 2. Festivals – Northern Territory – Evaluation. 3. Festivals – Economic aspects – Northern Territory. 4. Aboriginal Australians – Northern Territory – Social life and customs. I. Cooperative Research Centre for Sustainable Tourism. Encore event evaluation kit. II. Title. 338.47919429 Copyright © CRC for Sustainable Tourism Pty Ltd 2007 All rights reserved. Apart from fair dealing for the purposes of study, research, criticism or review as permitted under the Copyright Act, no part of this book may be reproduced by any process without written permission from the publisher. Any enquiries should be directed to General Manager Communications & Industry Extension [[email protected]] or Publishing Manager [[email protected]].
INDIGENOUS COMMUNITY FESTIVALS – TOP END
iii
CONTENTS
SUMMARY ____________________________________________________________________________ VI OBJECTIVES OF STUDY___________________________________________________________________ VI METHODOLOGY ________________________________________________________________________ VI KEY FINDINGS _________________________________________________________________________ VI FUTURE ACTION________________________________________________________________________ VI
CHAPTER 1 INDIGENOUS COMMUNITY FESTIVALS _____________________________________ 1 OVERVIEW OF FESTIVALS ________________________________________________________________ 1
Merrepen Arts Festival ________________________________________________________________ 1 Barunga Sports and Cultural Festival _____________________________________________________ 1 Walking with Spirits Festival ___________________________________________________________ 1 Gunbalanya Open Day ________________________________________________________________ 1 Mahbilil Festival _____________________________________________________________________ 2
CHAPTER 2 THE SURVEY ______________________________________________________________ 3 ACCESS TO COMMUNITIES ________________________________________________________________ 3 NUMBER OF VISITORS ___________________________________________________________________ 3
CHAPTER 3 DEMOGRAPHIC DATA______________________________________________________ 5 GENDER ______________________________________________________________________________ 5 AGE _________________________________________________________________________________ 6 DO YOU IDENTIFY AS ABORIGINAL OR TORRES STRAIT ISLANDER? _________________________________ 7 WHAT WAS YOUR MAIN REASON FOR ATTENDING THE FESTIVAL? __________________________________ 8 WHERE ARE YOU FROM? ________________________________________________________________ 10
Daly River Region – Merrepen Arts Festival ______________________________________________ 10 Katherine Region – Barunga Festival and Walking with Spirits Festival _________________________ 10 Kakadu Region – Gunbalanya Open Day and Mahbilil Festival________________________________ 10
CHAPTER 4 ECONOMIC DATA _________________________________________________________ 13 VISITOR EXPENDITURE IN REGION _________________________________________________________ 13
Accommodation ____________________________________________________________________ 13 Meals, Food and Drink _______________________________________________________________ 14 Event Tickets_______________________________________________________________________ 14 Other Entertainment _________________________________________________________________ 15 Transport Costs _____________________________________________________________________ 15 Personal Services____________________________________________________________________ 16 Other Expenditure ___________________________________________________________________ 16
CHAPTER 5 MARKETING DATA _______________________________________________________ 17 HOW DID YOU FIRST FIND OUT ABOUT THIS EVENT? ____________________________________________ 17 WHO DID YOU ATTEND THIS EVENT WITH?___________________________________________________ 18 HOW MANY PEOPLE, INCLUDING YOURSELF, WERE IN YOUR GROUP AT THIS EVENT?___________________ 19 HOW MANY TIMES HAVE YOU BEEN TO THIS EVENT BEFORE?_____________________________________ 19 WHAT OTHER ACTIVITIES DID YOU (OR WILL YOU) UNDERTAKE WHILST IN THE REGION? _______________ 20 HOW SATISFIED WERE YOU WITH THIS EVENT?________________________________________________ 21 ARE YOU LIKELY TO ATTEND THIS EVENT NEXT TIME IT IS HELD? _________________________________ 22 ARE YOU LIKELY TO RECOMMEND THIS EVENT TO FRIENDS AND FAMILY?___________________________ 22 ARE YOU LIKELY TO RETURN TO THE REGION?________________________________________________ 23 HOW MANY INDIGENOUS CULTURAL EVENTS HAVE YOU ATTENDED IN THE LAST 12 MONTHS? ___________ 24 WHERE DID YOU ATTEND THESE EVENTS? ___________________________________________________ 24 CONCLUDING QUESTIONS _______________________________________________________________ 24
CHAPTER 6 CONCLUSION _____________________________________________________________ 25
An Evaluation Using Encore Event Evaluation Kit
iv
APPENDIX A: NOTES REGARDING USE OF THE ENCORE EVENT EVALUATION KIT _______ 26
APPENDIX B: EXPENDITURE CATEGORIES IN THE VARIOUS FESTIVALS ________________ 29
AUTHOR______________________________________________________________________________ 31 LIST OF FIGURES Figure 1: Gender by number/festival __________________________________________________________ 5 Figure 2: Gender by percentage/festival ________________________________________________________ 5 Figure 3: Age groups by festival______________________________________________________________ 6 Figure 4: Aboriginal or Torres Strait Islander respondents by festival _________________________________ 8 Figure 5: Motives for attending – Merrepen and Barunga Festivals___________________________________ 9 Figure 6: Motives for attending – Wugularr, Gunbalanya and Mahbilil Festivals ________________________ 9 Figure 7: Origin by festival_________________________________________________________________ 10 Figure 8: Percentage by origin ______________________________________________________________ 11 Figure 9: Percentage by festival _____________________________________________________________ 12 Figure 10: Accommodation average expenditure by person by origin ________________________________ 13 Figure 11: Average expenditure on meals, food and drink by person by origin _________________________ 14 Figure 12: Average transport expenditures per person by origin ____________________________________ 15 Figure 13: Average ‘other expenditures’ by person by origin ______________________________________ 16 Figure 14: Promotion and advertising_________________________________________________________ 17 Figure 15: Advertising and promotions _______________________________________________________ 18 Figure 16: Who did you attend this event with? _________________________________________________ 18 Figure 17: Number of people in group ________________________________________________________ 19 Figure 18: Previous attendance at event _______________________________________________________ 20 Figure 19: Number involved in other activities by festival_________________________________________ 20 Figure 20: Percentage involved by activity_____________________________________________________ 21 Figure 21: Satisfaction ____________________________________________________________________ 21 Figure 22: Future attendance________________________________________________________________ 22 Figure 23: Recommendation to friends and family_______________________________________________ 23 Figure 24: Likely to return to region__________________________________________________________ 23 Figure 25: Attendance at other indigenous events _______________________________________________ 24 Figure 26: Where other events were attended___________________________________________________ 24 LIST OF TABLES Table 1: Age groups by festival ______________________________________________________________ 6 Table 2: Aboriginal or Torres Strait Islander respondents by festival__________________________________ 7 Table 3: Aboriginal or Torres Strait Islander respondents by gender __________________________________ 7 Table 4: Reasons for attending the festival ______________________________________________________ 8 Table 5: Origin by festival _________________________________________________________________ 10 Table 6: Entry charges ____________________________________________________________________ 14 Table 7: Average transport expenditure by origin – Wugularr ______________________________________ 15 Table 8: Average ‘other expenditure’ by origin – Wugularr________________________________________ 16 Table 9: Satisfaction ______________________________________________________________________ 21 Table 10: Recommendation to friends and family _______________________________________________ 22
INDIGENOUS COMMUNITY FESTIVALS – TOP END
v
Abstract For the last 20 years, annual festivals of varying sizes have been held by a number of indigenous communities in the Northern Territory’s Top End. Until now little analysis has been conducted of their planning, organisation, management, marketing and contribution to tourism. This study analyses data collected from attendees at five small community festivals in the Northern Territory’s Top End. The survey instrument was modelled using the demographic, marketing and economic modules of STCRC’s Encore Event Evaluation Kit, at the request of the then Northern Territory Tourist Commission (now Tourism NT).
It was found that although an increasing number of tourists are now participating in what were originally conceived as community events, their total expenditure did not represent a large net economic injection to individual communities, due to limited opportunities to spend on food, fuel and accommodation in remote locations. It is also evident that few tourists are drawn to the regions specifically to attend festivals, although they are reasonably well attended by those who visit for other reasons. As such festivals are valuable arenas for the promotion of the Northern Territory as a leading destination for ‘unique and authentic’ indigenous experiences, other aspects might prove valuable for tourism.
Acknowledgements The Sustainable Tourism Cooperative Research Centre, an Australian Government initiative, funded this research.
The author would like to thank Ian Ford, Manager Strategic Research, Northern Territory Tourist Commission and Janice McEwen from Top End Arts Marketing (TEAM) for their invaluable assistance and funding support. Volunteer interviewers recruited by TEAM were Aaron Watson, Jenny Milne, Kerone Byrne, Kristi Stinson and Sarah Norbury. Thanks also to Jan Carter who substituted as an interviewer on one occasion.
An Evaluation Using Encore Event Evaluation Kit
vi
SUMMARY
For the last 20 years, annual festivals of varying sizes have been held by a number of indigenous communities in the Northern Territory’s Top End. Until now little analysis has been conducted of their planning, organisation, management, marketing and contribution to tourism. The Northern Territory Tourist Commission (NTTC), Top End Arts Marketing and the Sustainable Tourism CRC (STCRC), of which Charles Darwin University is a partner, is undertaking an evaluation and comparison of the contribution of community festivals to tourism using the Encore Festival and Event Evaluation Kit (Encore) developed by the STCRC.
This research project, the first of its kind in Aboriginal communities in the Top End, commenced by undertaking visitor surveys at five community festivals in 2005. The five communities that participated in the project were Nauiyu (Merrepen Arts Festival), Barunga (Barunga Sports and Cultural Festival), Wugularr (Walking with Spirits Festival), Gunbalanya (Gunbalanya Open Day), and Jabiru (Mahbilil Festival).
Objectives of Study The key objectives of the research project were: • To obtain quantifiable data to assist festival organisers to plan future events and provide information that
can potentially assist them to secure future tourism-related sponsorship and funding; • To build tourism knowledge in indigenous communities by working collaboratively with festival organisers
and other community members in the research process; • To facilitate, through the use of Encore, increased independence, professionalism and validity in future
tourism research conducted by community festival organisers; and • To provide the NTTC with an estimate of the direct and attributable economic contribution of tourism to
community festivals so they can assess future needs such as marketing, product development and infrastructure.
Methodology Volunteers recruited by Top End Arts Marketing approached attendees at the festival and requested to interview anyone over the age 18 years who did not reside in the host community. Their introduction was as follows:
Would you mind spending 10 minutes of your time to complete a short survey on behalf of festival organisers? This survey will help identify and quantify the benefits of [NAME] Festival to [NAME] Community and the [NAME] Region and assist with improvements for future festivals. The information you will provide will be completely confidential and the results of the survey will only be released in aggregate form so that there is no chance of you being identified.
Upon consenting to the above, respondents were asked a series of demographic, marketing and economic questions from a survey form developed using Encore. The aggregated responses to these questions are the subject of this report.
Key Findings At this time there is little indication that festivals attract tourists to the region in significant numbers. They can, however, be attractive to tourists who are in the region at the time and are a valuable showcase for indigenous art, craft and talent.
With the exception of the Walking with Spirits Festival at Wugularr, all of the festivals surveyed originated prior to tourism links had been recognised or valued. They are now at a phase of development where original perspectives and priorities need to be reconsidered in view of the growing realisation of the value of tourism to small regional economies.
Future Action The NTTC’s ‘Share Our Story’ marketing strategy is permeated by indigenous imagery, innuendo and symbolism. The development of small community festivals aligns well with the strategy as they provide some of the few opportunities for tourists to experience indigenous culture in settings that approximate their perceptions of integrity and authenticity. It is clear that what small communities do to share their stories adds weight to what are otherwise vague promises of unique interactions with indigenous people in the Northern Territory.
Data collected at community festivals during 2005, although valuable, was relatively meagre in statistical terms and therefore provides an imperfect understanding of visitor motives and satisfaction levels. It would be prudent to continue researching the interrelationship between tourists and community festivals. Improvements
INDIGENOUS COMMUNITY FESTIVALS – TOP END
vii
could be made to the 2005 study by: • Improving the survey instrument in 2006 in accordance with observations of deficiency or impracticality
found in 2005; • Concentrating on gathering contact details so comprehensive surveys can be conducted after the event, when
participants can comment on their total experience and make a more accurate assessment of expenditure; • Using newly purchased PDAs and SNAP survey software to streamline data collection and processing,
making the process less cumbersome and thereby reducing reliance on volunteer interviewers; and • Building on a closer working relationship with festival organisers now that initial contact has been
established and offers of assistance well received.

An Evaluation Using Encore Event Evaluation Kit
viii
INDIGENOUS COMMUNITY FESTIVALS – TOP END
1
Chapter 1
INDIGENOUS COMMUNITY FESTIVALS
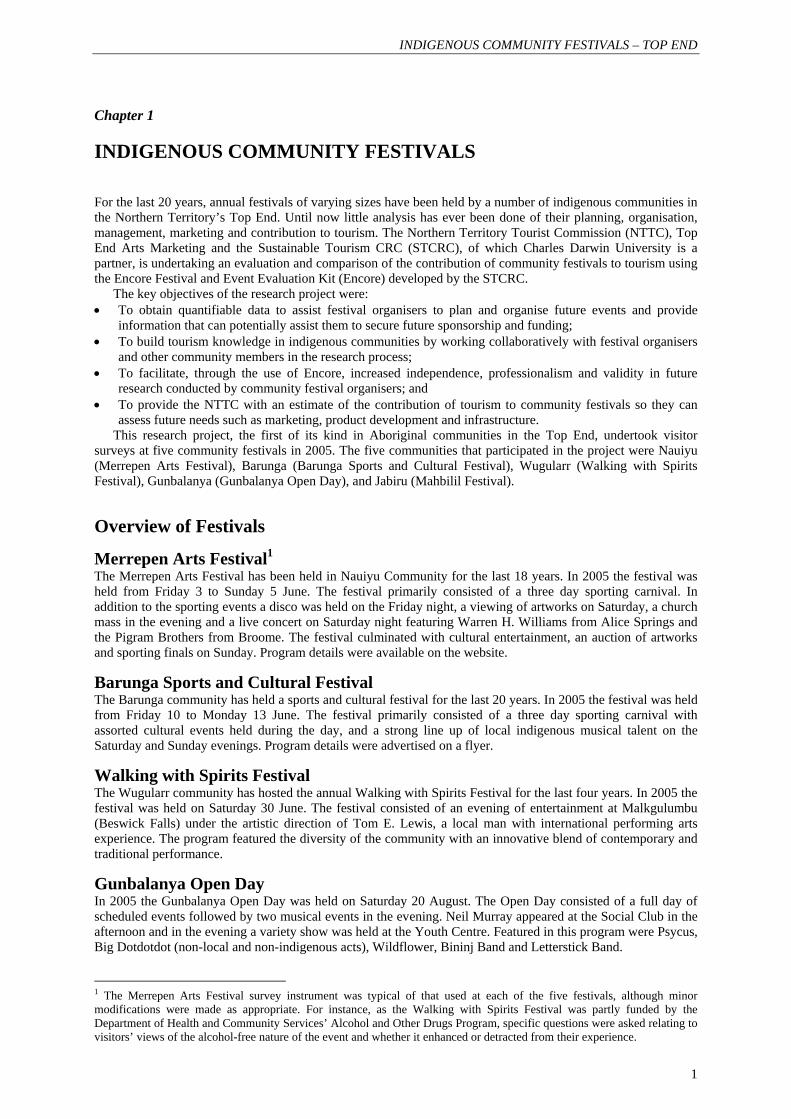
For the last 20 years, annual festivals of varying sizes have been held by a number of indigenous communities in the Northern Territory’s Top End. Until now little analysis has ever been done of their planning, organisation, management, marketing and contribution to tourism. The Northern Territory Tourist Commission (NTTC), Top End Arts Marketing and the Sustainable Tourism CRC (STCRC), of which Charles Darwin University is a partner, is undertaking an evaluation and comparison of the contribution of community festivals to tourism using the Encore Festival and Event Evaluation Kit (Encore) developed by the STCRC.
The key objectives of the research project were: • To obtain quantifiable data to assist festival organisers to plan and organise future events and provide
information that can potentially assist them to secure future sponsorship and funding; • To build tourism knowledge in indigenous communities by working collaboratively with festival organisers
and other community members in the research process; • To facilitate, through the use of Encore, increased independence, professionalism and validity in future
research conducted by community festival organisers; and • To provide the NTTC with an estimate of the contribution of tourism to community festivals so they can
assess future needs such as marketing, product development and infrastructure. This research project, the first of its kind in Aboriginal communities in the Top End, undertook visitor
surveys at five community festivals in 2005. The five communities that participated in the project were Nauiyu (Merrepen Arts Festival), Barunga (Barunga Sports and Cultural Festival), Wugularr (Walking with Spirits Festival), Gunbalanya (Gunbalanya Open Day), and Jabiru (Mahbilil Festival).
Overview of Festivals
Merrepen Arts Festival1 The Merrepen Arts Festival has been held in Nauiyu Community for the last 18 years. In 2005 the festival was held from Friday 3 to Sunday 5 June. The festival primarily consisted of a three day sporting carnival. In addition to the sporting events a disco was held on the Friday night, a viewing of artworks on Saturday, a church mass in the evening and a live concert on Saturday night featuring Warren H. Williams from Alice Springs and the Pigram Brothers from Broome. The festival culminated with cultural entertainment, an auction of artworks and sporting finals on Sunday. Program details were available on the website.
Barunga Sports and Cultural Festival The Barunga community has held a sports and cultural festival for the last 20 years. In 2005 the festival was held from Friday 10 to Monday 13 June. The festival primarily consisted of a three day sporting carnival with assorted cultural events held during the day, and a strong line up of local indigenous musical talent on the Saturday and Sunday evenings. Program details were advertised on a flyer.
Walking with Spirits Festival The Wugularr community has hosted the annual Walking with Spirits Festival for the last four years. In 2005 the festival was held on Saturday 30 June. The festival consisted of an evening of entertainment at Malkgulumbu (Beswick Falls) under the artistic direction of Tom E. Lewis, a local man with international performing arts experience. The program featured the diversity of the community with an innovative blend of contemporary and traditional performance.
Gunbalanya Open Day In 2005 the Gunbalanya Open Day was held on Saturday 20 August. The Open Day consisted of a full day of scheduled events followed by two musical events in the evening. Neil Murray appeared at the Social Club in the afternoon and in the evening a variety show was held at the Youth Centre. Featured in this program were Psycus, Big Dotdotdot (non-local and non-indigenous acts), Wildflower, Bininj Band and Letterstick Band.
1 The Merrepen Arts Festival survey instrument was typical of that used at each of the five festivals, although minor modifications were made as appropriate. For instance, as the Walking with Spirits Festival was partly funded by the Department of Health and Community Services’ Alcohol and Other Drugs Program, specific questions were asked relating to visitors’ views of the alcohol-free nature of the event and whether it enhanced or detracted from their experience.
An Evaluation Using Encore Event Evaluation Kit
2
Mahbilil Festival Although informally originated by the Office of the Chief Scientist approximately 20 years ago as a community BBQ and kite-flying event, control and management of the festival passed to the traditional owners in 2004. Feature performers included Wildflower and Shellie Morris. Unfortunately another featured band Narbalek was unable to attend. Other highlights of the event were a spectacular fireworks show above the lake. In 2005 the festival was held on Saturday 3 September. A program of scheduled events commenced at 2pm in the afternoon and concluded at around 11pm.
Please refer to individual Festival Reports for further details.
INDIGENOUS COMMUNITY FESTIVALS – TOP END
3
Chapter 2
THE SURVEY
Volunteers recruited by Top End Arts Marketing approached attendees at the festival and requested to interview anyone over the age 18 years who did not reside in the host community. Their introduction was as follows:
Would you mind spending 10 minutes of your time to complete a short survey on behalf of festival organisers? This survey will help identify and quantify the benefits of [NAME] Festival to [NAME] Community and the [NAME] Region and assist with improvements for future festivals. The information you will provide will be completely confidential and the results of the survey will only be released in aggregate form so that there is no chance of you being identified.
Upon consenting to the above, respondents were asked a series of demographic, marketing and economic questions from a survey form developed using Encore. The aggregated responses to these questions are the subject of this report.
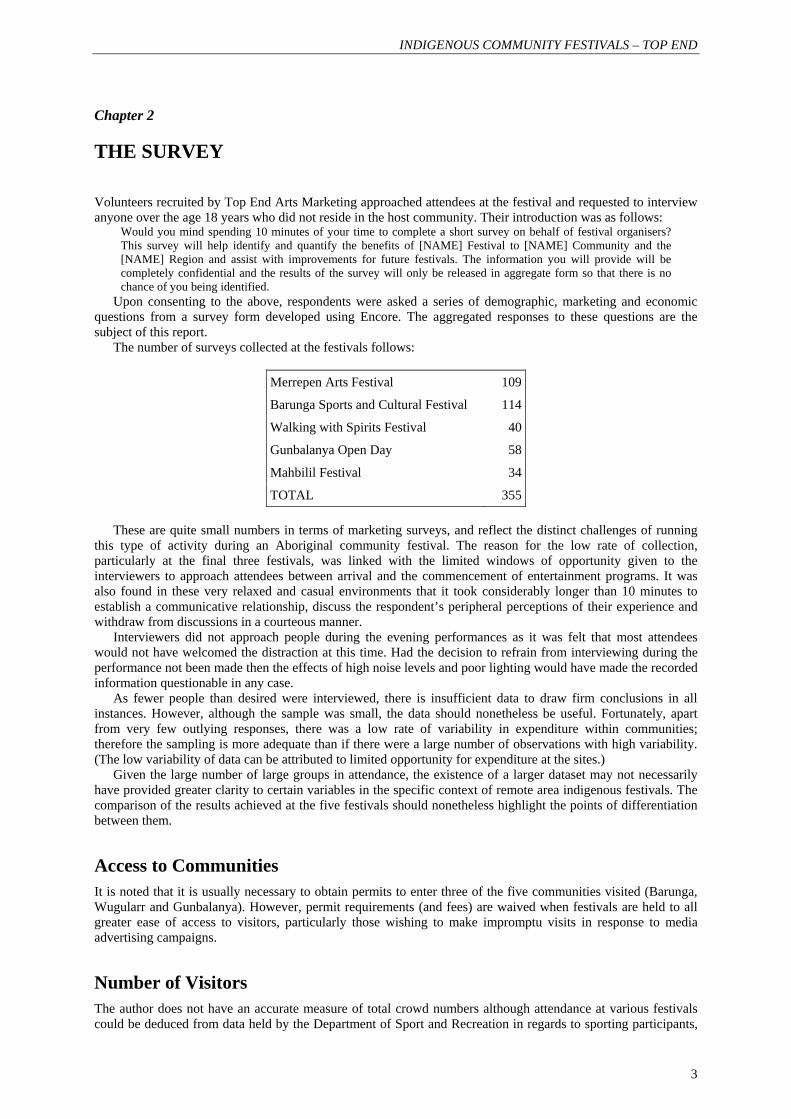
The number of surveys collected at the festivals follows:
Merrepen Arts Festival 109
Barunga Sports and Cultural Festival 114
Walking with Spirits Festival 40
Gunbalanya Open Day 58
Mahbilil Festival 34
TOTAL 355
These are quite small numbers in terms of marketing surveys, and reflect the distinct challenges of running this type of activity during an Aboriginal community festival. The reason for the low rate of collection, particularly at the final three festivals, was linked with the limited windows of opportunity given to the interviewers to approach attendees between arrival and the commencement of entertainment programs. It was also found in these very relaxed and casual environments that it took considerably longer than 10 minutes to establish a communicative relationship, discuss the respondent’s peripheral perceptions of their experience and withdraw from discussions in a courteous manner.
Interviewers did not approach people during the evening performances as it was felt that most attendees would not have welcomed the distraction at this time. Had the decision to refrain from interviewing during the performance not been made then the effects of high noise levels and poor lighting would have made the recorded information questionable in any case.
As fewer people than desired were interviewed, there is insufficient data to draw firm conclusions in all instances. However, although the sample was small, the data should nonetheless be useful. Fortunately, apart from very few outlying responses, there was a low rate of variability in expenditure within communities; therefore the sampling is more adequate than if there were a large number of observations with high variability. (The low variability of data can be attributed to limited opportunity for expenditure at the sites.)
Given the large number of large groups in attendance, the existence of a larger dataset may not necessarily have provided greater clarity to certain variables in the specific context of remote area indigenous festivals. The comparison of the results achieved at the five festivals should nonetheless highlight the points of differentiation between them.
Access to Communities It is noted that it is usually necessary to obtain permits to enter three of the five communities visited (Barunga, Wugularr and Gunbalanya). However, permit requirements (and fees) are waived when festivals are held to all greater ease of access to visitors, particularly those wishing to make impromptu visits in response to media advertising campaigns.
Number of Visitors The author does not have an accurate measure of total crowd numbers although attendance at various festivals could be deduced from data held by the Department of Sport and Recreation in regards to sporting participants,

An Evaluation Using Encore Event Evaluation Kit
4
and in some cases ticket sales (Wugularr and Mahbilil Festivals). Although a small number of surveys were taken at each festival, it was felt that the five interviewers were able to access a sufficiently large percentage of the overall non-indigenous attendees. No attempt was made to interview a large proportion of the indigenous participants as they were generally attending for social reasons (such as visiting friends and relatives) and not able to respond to many questions because they belonged to large groups with very similar demographic profiles and expenditure patterns for individuals within the groups.
In most communities it was easy to discern visitors from community residents (by appearance); however this was not the case at Jabiru which has a large resident population of non-indigenous people. Judging from the screening question used to determine eligibility to participate in the survey, there were a high number of local residents in attendance that were necessarily excluded from questioning.
INDIGENOUS COMMUNITY FESTIVALS – TOP END
5
Chapter 3
DEMOGRAPHIC DATA
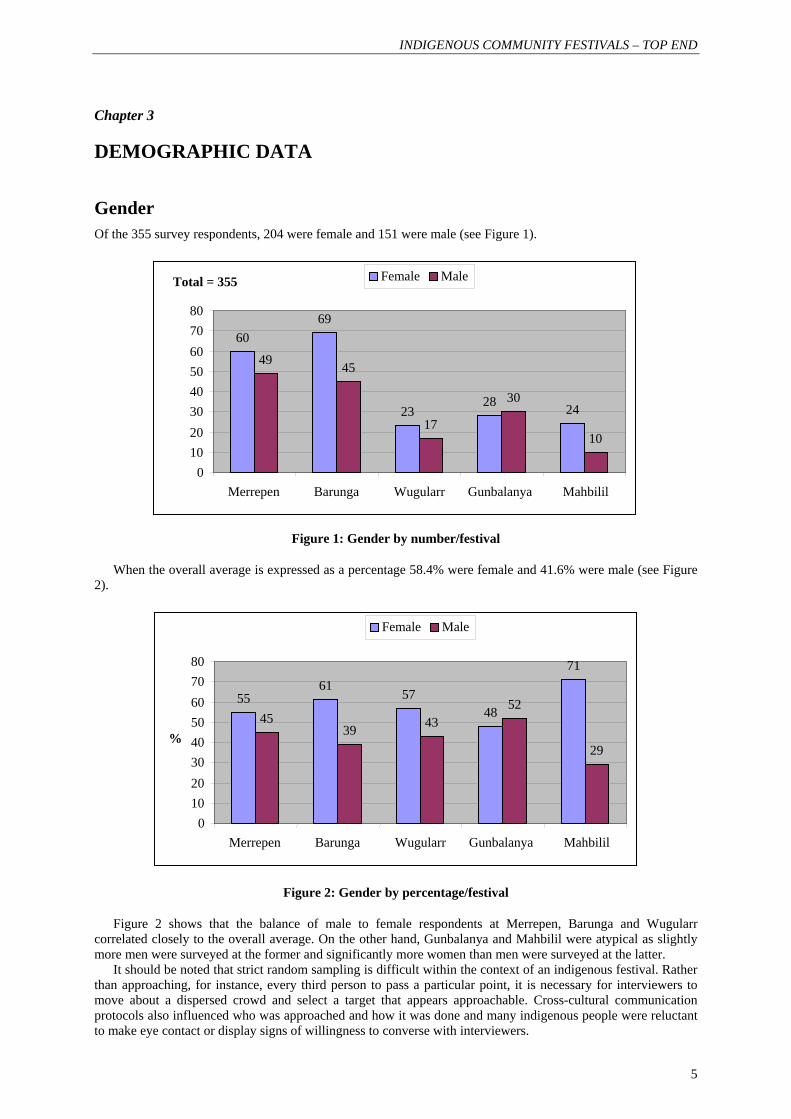
Gender Of the 355 survey respondents, 204 were female and 151 were male (see Figure 1).
Figure 1: Gender by number/festival
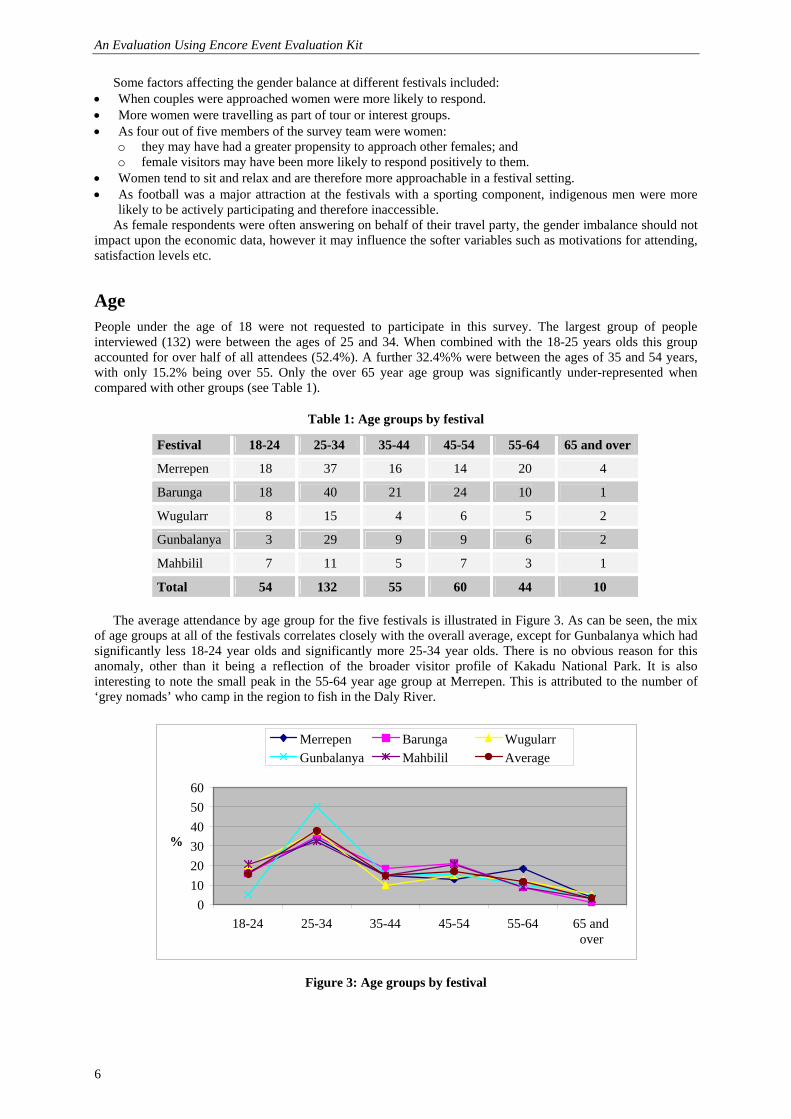
When the overall average is expressed as a percentage 58.4% were female and 41.6% were male (see Figure 2).
Figure 2: Gender by percentage/festival
Figure 2 shows that the balance of male to female respondents at Merrepen, Barunga and Wugularr correlated closely to the overall average. On the other hand, Gunbalanya and Mahbilil were atypical as slightly more men were surveyed at the former and significantly more women than men were surveyed at the latter.
It should be noted that strict random sampling is difficult within the context of an indigenous festival. Rather than approaching, for instance, every third person to pass a particular point, it is necessary for interviewers to move about a dispersed crowd and select a target that appears approachable. Cross-cultural communication protocols also influenced who was approached and how it was done and many indigenous people were reluctant to make eye contact or display signs of willingness to converse with interviewers.
6069
2328 24
49 45
17
30
10
01020304050607080
Merrepen Barunga Wugularr Gunbalanya Mahbilil
Total = 355 Female Male
5561
5748
71
4539 43
52
29
01020304050607080
Merrepen Barunga Wugularr Gunbalanya Mahbilil
%
Female Male
An Evaluation Using Encore Event Evaluation Kit
6
Some factors affecting the gender balance at different festivals included: • When couples were approached women were more likely to respond. • More women were travelling as part of tour or interest groups. • As four out of five members of the survey team were women:
o they may have had a greater propensity to approach other females; and o female visitors may have been more likely to respond positively to them.
• Women tend to sit and relax and are therefore more approachable in a festival setting. • As football was a major attraction at the festivals with a sporting component, indigenous men were more
likely to be actively participating and therefore inaccessible. As female respondents were often answering on behalf of their travel party, the gender imbalance should not
impact upon the economic data, however it may influence the softer variables such as motivations for attending, satisfaction levels etc.
Age People under the age of 18 were not requested to participate in this survey. The largest group of people interviewed (132) were between the ages of 25 and 34. When combined with the 18-25 years olds this group accounted for over half of all attendees (52.4%). A further 32.4%% were between the ages of 35 and 54 years, with only 15.2% being over 55. Only the over 65 year age group was significantly under-represented when compared with other groups (see Table 1).
Table 1: Age groups by festival
Festival 18-24 25-34 35-44 45-54 55-64 65 and over
Merrepen 18 37 16 14 20 4
Barunga 18 40 21 24 10 1
Wugularr 8 15 4 6 5 2
Gunbalanya 3 29 9 9 6 2
Mahbilil 7 11 5 7 3 1
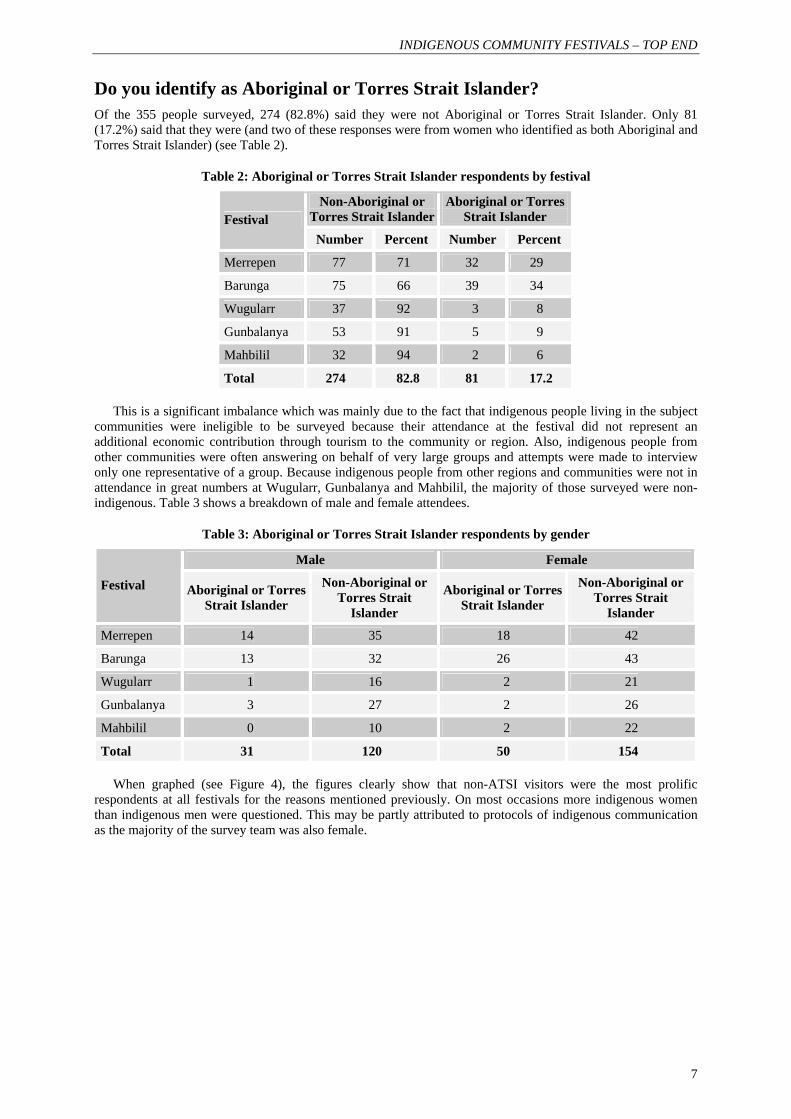
Total 54 132 55 60 44 10 The average attendance by age group for the five festivals is illustrated in Figure 3. As can be seen, the mix
of age groups at all of the festivals correlates closely with the overall average, except for Gunbalanya which had significantly less 18-24 year olds and significantly more 25-34 year olds. There is no obvious reason for this anomaly, other than it being a reflection of the broader visitor profile of Kakadu National Park. It is also interesting to note the small peak in the 55-64 year age group at Merrepen. This is attributed to the number of ‘grey nomads’ who camp in the region to fish in the Daly River.
Figure 3: Age groups by festival
0 102030405060
18-24 25-34 35-44 45-54 55-64 65 andover
%
Merrepen Barunga WugularrGunbalanya Mahbilil Average
INDIGENOUS COMMUNITY FESTIVALS – TOP END
7
Do you identify as Aboriginal or Torres Strait Islander? Of the 355 people surveyed, 274 (82.8%) said they were not Aboriginal or Torres Strait Islander. Only 81 (17.2%) said that they were (and two of these responses were from women who identified as both Aboriginal and Torres Strait Islander) (see Table 2).
Table 2: Aboriginal or Torres Strait Islander respondents by festival
Non-Aboriginal or Torres Strait Islander
Aboriginal or Torres Strait Islander Festival
Number Percent Number Percent
Merrepen 77 71 32 29
Barunga 75 66 39 34
Wugularr 37 92 3 8
Gunbalanya 53 91 5 9
Mahbilil 32 94 2 6
Total 274 82.8 81 17.2
This is a significant imbalance which was mainly due to the fact that indigenous people living in the subject communities were ineligible to be surveyed because their attendance at the festival did not represent an additional economic contribution through tourism to the community or region. Also, indigenous people from other communities were often answering on behalf of very large groups and attempts were made to interview only one representative of a group. Because indigenous people from other regions and communities were not in attendance in great numbers at Wugularr, Gunbalanya and Mahbilil, the majority of those surveyed were non-indigenous. Table 3 shows a breakdown of male and female attendees.
Table 3: Aboriginal or Torres Strait Islander respondents by gender
Male Female
Festival Aboriginal or Torres Strait Islander
Non-Aboriginal or Torres Strait
Islander
Aboriginal or Torres Strait Islander
Non-Aboriginal or Torres Strait
Islander
Merrepen 14 35 18 42
Barunga 13 32 26 43
Wugularr 1 16 2 21
Gunbalanya 3 27 2 26
Mahbilil 0 10 2 22
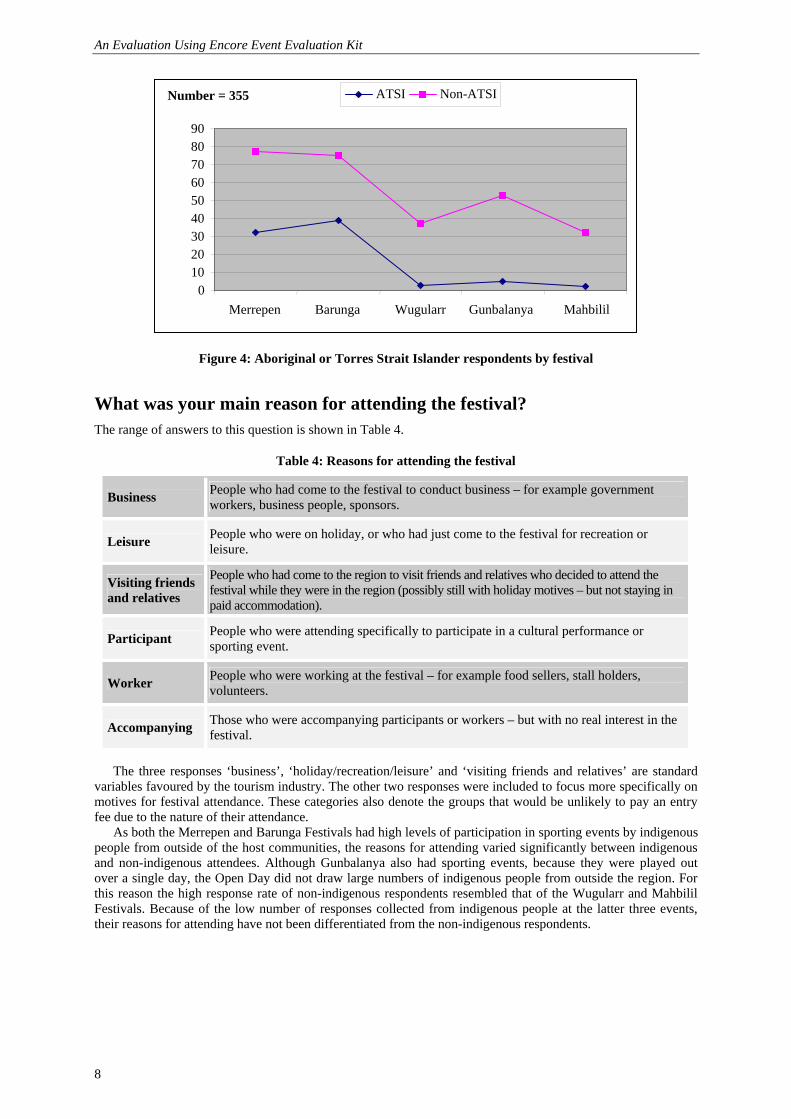
Total 31 120 50 154 When graphed (see Figure 4), the figures clearly show that non-ATSI visitors were the most prolific
respondents at all festivals for the reasons mentioned previously. On most occasions more indigenous women than indigenous men were questioned. This may be partly attributed to protocols of indigenous communication as the majority of the survey team was also female.
An Evaluation Using Encore Event Evaluation Kit
8
Figure 4: Aboriginal or Torres Strait Islander respondents by festival
What was your main reason for attending the festival? The range of answers to this question is shown in Table 4.
Table 4: Reasons for attending the festival
Business People who had come to the festival to conduct business – for example government workers, business people, sponsors.
Leisure People who were on holiday, or who had just come to the festival for recreation or leisure.
Visiting friends and relatives
People who had come to the region to visit friends and relatives who decided to attend the festival while they were in the region (possibly still with holiday motives – but not staying in paid accommodation).
Participant People who were attending specifically to participate in a cultural performance or sporting event.
Worker People who were working at the festival – for example food sellers, stall holders, volunteers.
Accompanying Those who were accompanying participants or workers – but with no real interest in the festival.
The three responses ‘business’, ‘holiday/recreation/leisure’ and ‘visiting friends and relatives’ are standard
variables favoured by the tourism industry. The other two responses were included to focus more specifically on motives for festival attendance. These categories also denote the groups that would be unlikely to pay an entry fee due to the nature of their attendance.
As both the Merrepen and Barunga Festivals had high levels of participation in sporting events by indigenous people from outside of the host communities, the reasons for attending varied significantly between indigenous and non-indigenous attendees. Although Gunbalanya also had sporting events, because they were played out over a single day, the Open Day did not draw large numbers of indigenous people from outside the region. For this reason the high response rate of non-indigenous respondents resembled that of the Wugularr and Mahbilil Festivals. Because of the low number of responses collected from indigenous people at the latter three events, their reasons for attending have not been differentiated from the non-indigenous respondents.
0102030405060708090
Merrepen Barunga Wugularr Gunbalanya Mahbilil
Number = 355 ATSI Non-ATSI
INDIGENOUS COMMUNITY FESTIVALS – TOP END
9
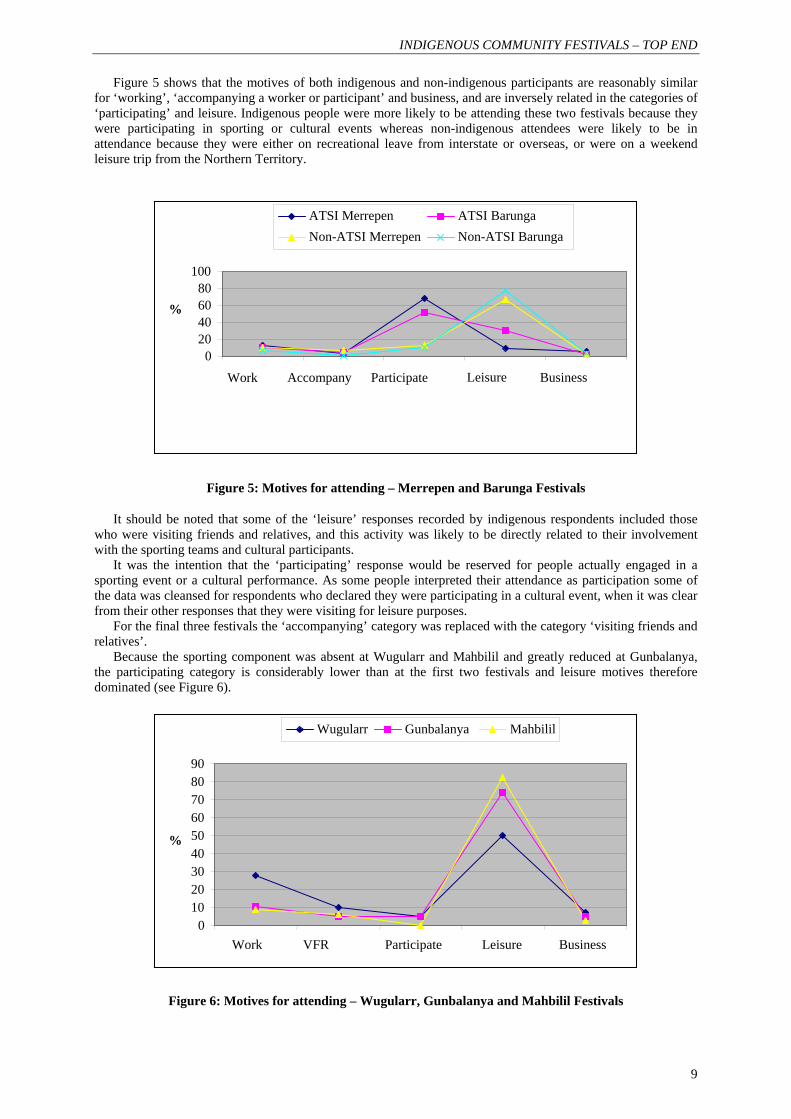
Figure 5 shows that the motives of both indigenous and non-indigenous participants are reasonably similar for ‘working’, ‘accompanying a worker or participant’ and business, and are inversely related in the categories of ‘participating’ and leisure. Indigenous people were more likely to be attending these two festivals because they were participating in sporting or cultural events whereas non-indigenous attendees were likely to be in attendance because they were either on recreational leave from interstate or overseas, or were on a weekend leisure trip from the Northern Territory.
Figure 5: Motives for attending – Merrepen and Barunga Festivals
It should be noted that some of the ‘leisure’ responses recorded by indigenous respondents included those who were visiting friends and relatives, and this activity was likely to be directly related to their involvement with the sporting teams and cultural participants.
It was the intention that the ‘participating’ response would be reserved for people actually engaged in a sporting event or a cultural performance. As some people interpreted their attendance as participation some of the data was cleansed for respondents who declared they were participating in a cultural event, when it was clear from their other responses that they were visiting for leisure purposes.
For the final three festivals the ‘accompanying’ category was replaced with the category ‘visiting friends and relatives’.
Because the sporting component was absent at Wugularr and Mahbilil and greatly reduced at Gunbalanya, the participating category is considerably lower than at the first two festivals and leisure motives therefore dominated (see Figure 6).
Figure 6: Motives for attending – Wugularr, Gunbalanya and Mahbilil Festivals
0 20406080
100
Work Accompany Participate Leisure Business
%
ATSI Merrepen ATSI BarungaNon-ATSI Merrepen Non-ATSI Barunga
0102030405060708090
Work VFR Participate Leisure Business
%
Wugularr Gunbalanya Mahbilil
An Evaluation Using Encore Event Evaluation Kit
10
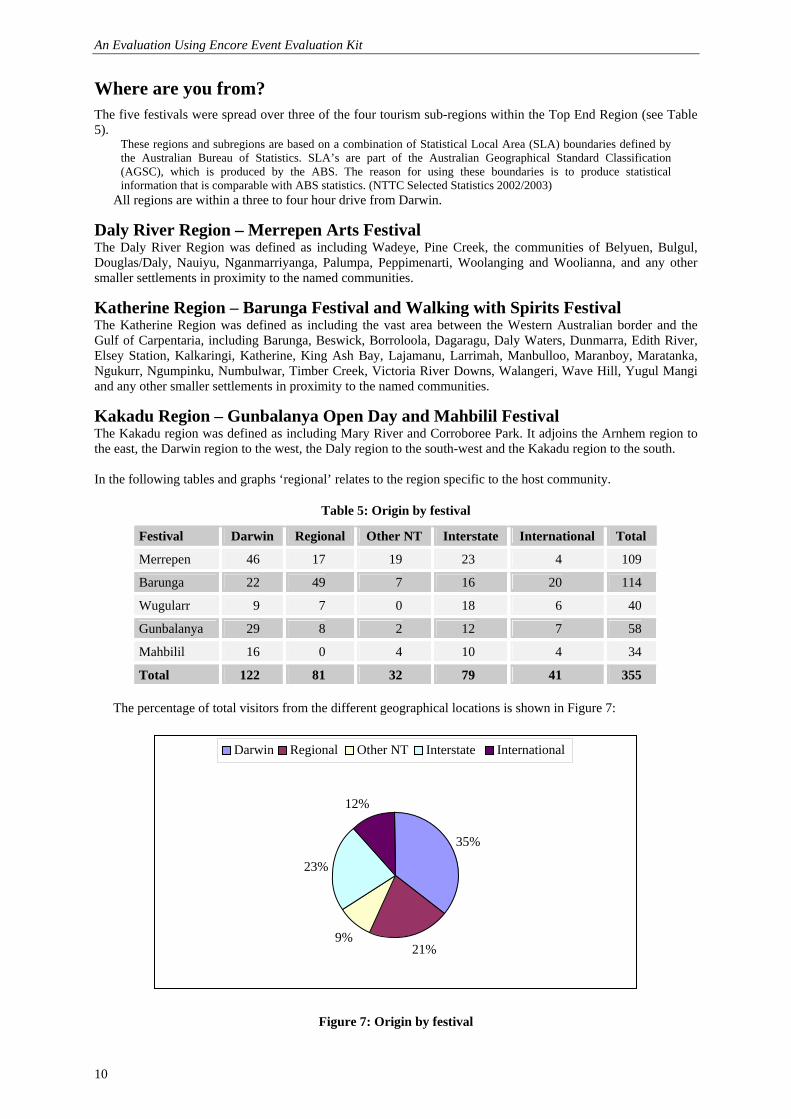
Where are you from? The five festivals were spread over three of the four tourism sub-regions within the Top End Region (see Table 5).
These regions and subregions are based on a combination of Statistical Local Area (SLA) boundaries defined by the Australian Bureau of Statistics. SLA’s are part of the Australian Geographical Standard Classification (AGSC), which is produced by the ABS. The reason for using these boundaries is to produce statistical information that is comparable with ABS statistics. (NTTC Selected Statistics 2002/2003)
All regions are within a three to four hour drive from Darwin.
Daly River Region – Merrepen Arts Festival The Daly River Region was defined as including Wadeye, Pine Creek, the communities of Belyuen, Bulgul, Douglas/Daly, Nauiyu, Nganmarriyanga, Palumpa, Peppimenarti, Woolanging and Woolianna, and any other smaller settlements in proximity to the named communities.
Katherine Region – Barunga Festival and Walking with Spirits Festival The Katherine Region was defined as including the vast area between the Western Australian border and the Gulf of Carpentaria, including Barunga, Beswick, Borroloola, Dagaragu, Daly Waters, Dunmarra, Edith River, Elsey Station, Kalkaringi, Katherine, King Ash Bay, Lajamanu, Larrimah, Manbulloo, Maranboy, Maratanka, Ngukurr, Ngumpinku, Numbulwar, Timber Creek, Victoria River Downs, Walangeri, Wave Hill, Yugul Mangi and any other smaller settlements in proximity to the named communities.
Kakadu Region – Gunbalanya Open Day and Mahbilil Festival The Kakadu region was defined as including Mary River and Corroboree Park. It adjoins the Arnhem region to the east, the Darwin region to the west, the Daly region to the south-west and the Kakadu region to the south. In the following tables and graphs ‘regional’ relates to the region specific to the host community.
Table 5: Origin by festival
Festival Darwin Regional Other NT Interstate International Total
Merrepen 46 17 19 23 4 109
Barunga 22 49 7 16 20 114
Wugularr 9 7 0 18 6 40
Gunbalanya 29 8 2 12 7 58
Mahbilil 16 0 4 10 4 34
Total 122 81 32 79 41 355
The percentage of total visitors from the different geographical locations is shown in Figure 7:
Figure 7: Origin by festival
35%
21%9%
23%
12%
Darwin Regional Other NT Interstate International
INDIGENOUS COMMUNITY FESTIVALS – TOP END
11
Some factors relating to Table 5 and Figure 7 were: • The majority of total respondents surveyed at all festivals came from Darwin. This is indicative of a high
propensity for Darwin residents to spend weekends away at regional centres. • The percentage of regional visitors is swelled by the number of indigenous people who were attending the
festivals to participate in events. Therefore visitation by regional visitors for general interest purposes was relatively low.
• There were a low number of visitors from other parts of the Northern Territory as the festivals were not in comfortable driving distance for a weekend visit and Territorians from the Red Centre do not tend to seek out indigenous experiences if holidaying in the Top End.
• Interstate visitors were suitably represented. In most cases this was due to the population of interstate holiday makers who happened to be in the regions at the time of the festivals, rather than travellers who had come to the Northern Territory specifically to attend the events. The noticeable exceptions to this rule were performers from Melbourne who had come to participate in performances (e.g. musicians, puppeteers etc) at the Walking with Spirits Festival (and therefore do not qualify as tourists) and some music lovers that had specifically flown to the Northern Territory to attend the Barunga Festival as a result of their attendance in previous years.
• The number of international visitors was low, but they were generally well represented in terms of the numbers travelling throughout the Territory.
In the case of most tourists who ‘happen to be in the area’, they found that there is very little alternative entertainment on offer in the region. Therefore, if the events are adequately promoted there is a high likelihood that people will attend, whether or not they profess a prior interest in indigenous culture.
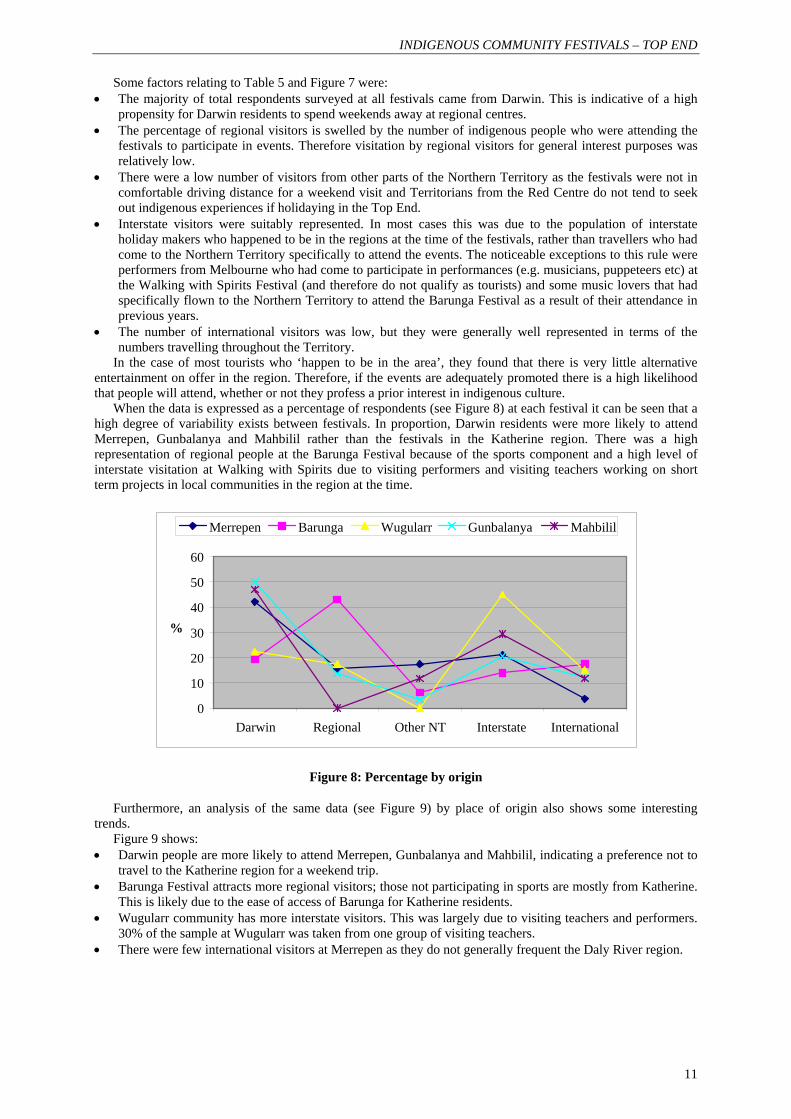
When the data is expressed as a percentage of respondents (see Figure 8) at each festival it can be seen that a high degree of variability exists between festivals. In proportion, Darwin residents were more likely to attend Merrepen, Gunbalanya and Mahbilil rather than the festivals in the Katherine region. There was a high representation of regional people at the Barunga Festival because of the sports component and a high level of interstate visitation at Walking with Spirits due to visiting performers and visiting teachers working on short term projects in local communities in the region at the time.
Figure 8: Percentage by origin
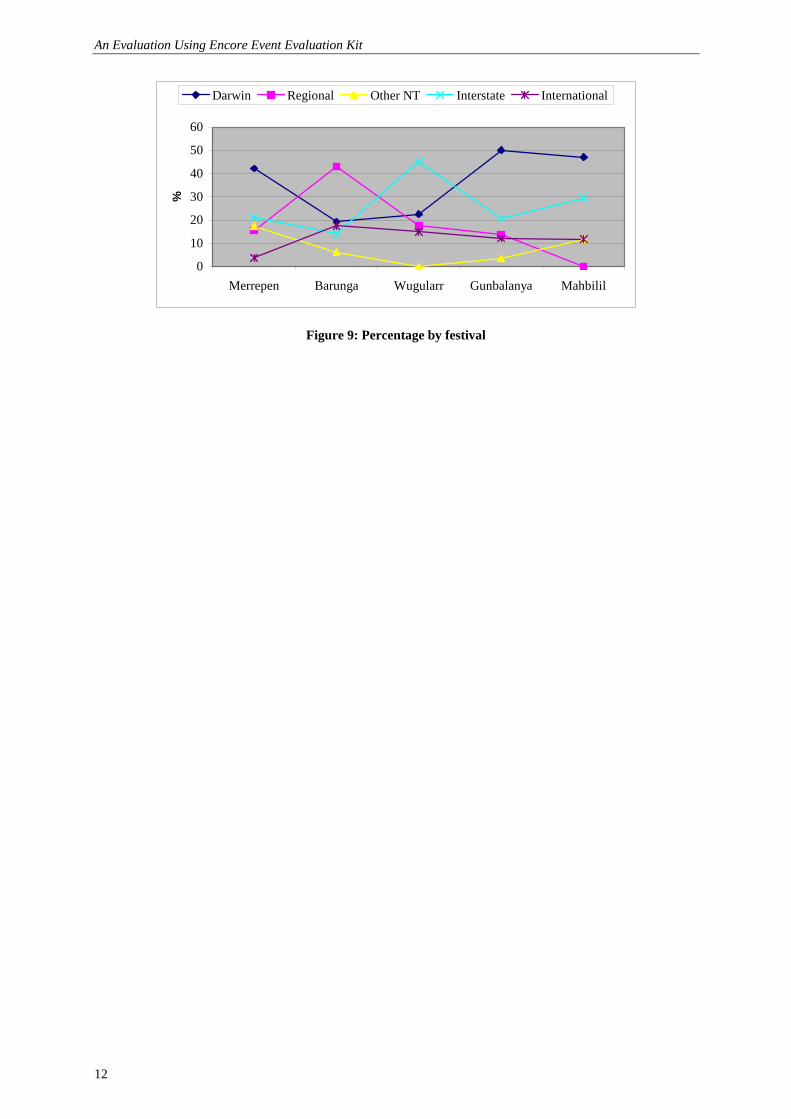
Furthermore, an analysis of the same data (see Figure 9) by place of origin also shows some interesting trends.
Figure 9 shows: • Darwin people are more likely to attend Merrepen, Gunbalanya and Mahbilil, indicating a preference not to
travel to the Katherine region for a weekend trip. • Barunga Festival attracts more regional visitors; those not participating in sports are mostly from Katherine.
This is likely due to the ease of access of Barunga for Katherine residents. • Wugularr community has more interstate visitors. This was largely due to visiting teachers and performers.
30% of the sample at Wugularr was taken from one group of visiting teachers. • There were few international visitors at Merrepen as they do not generally frequent the Daly River region.
0
10
20
30
40
50
60
Darwin Regional Other NT Interstate International
%
Merrepen Barunga Wugularr Gunbalanya Mahbilil
An Evaluation Using Encore Event Evaluation Kit
12
Figure 9: Percentage by festival
0
10
20
30
40
50
60
Merrepen Barunga Wugularr Gunbalanya Mahbilil
%
Darwin Regional Other NT Interstate International

INDIGENOUS COMMUNITY FESTIVALS – TOP END
13
Chapter 4
ECONOMIC DATA
Economic data was collected for both regional and community expenditure, when possible. An accurate estimation of regional expenditure was sometimes problematic due to the vast size and lack of agreement of the boundaries of Northern Territory tourism regions across visitor types. Although interviewers were informed of the boundaries of the regions, there was no guarantee that respondents were sufficiently aware of these boundaries when providing their responses.
Visitor Expenditure in Region The survey and Encore produced a table of average expenditure, per person, per day, but owing to the very small sample size (especially the poor response rate on expenditures questions), and doubts about the accuracy of the data given, the averages included could be misleading. For some festivals, it was not possible to produce average expenditures per person per day, and some of the calculations are tentative. Although comparisons across festivals should be treated with care, it is useful to briefly demonstrate that expenditure patterns vary widely across festivals, and this is the objective of Figures 10 to 13. In each category expenditure is based on regional data, and is inclusive of expenditure in the community. The methodological background, some limitations and detailed tables with expenditures including total and average expenditures per category and for each festival can be found in Appendix B.
Accommodation Accommodation options included free camping in communities, cheap camping at nearby campgrounds, or other commercial accommodation such as hotels, motels or visitor hostels in nearby towns. The distance to the various accommodation options varied from location to location. The Mahbilil Festival was the only venue that did not offer the free camping option due to an abundance of commercial accommodation choices available in Jabiru.
International visitors who attended community festivals kept average expenditure on accommodation low by using a combination of free (and low cost) camping, campervans and backpacker accommodation. The majority of international respondents surveyed were budget travellers, including those who were doing short term contract work within the park, and possibly benefiting from subsidised or free accommodation.
As several international respondents at Wugularr specified where they were staying, rather than their expenditure, rates at Coco’s backpackers in Katherine were estimated at $20 per person per night.
Interstate travellers generally paid more per person per night than any other group (with the exception of visitors from Darwin at Jabiru). The average expenditure per person per day was minimised by the high volume of self-drive visitors with their own caravans and campervans. It is doubtful that all camping fees were declared as the self-drive/caravan market may not have interpreted this as accommodation costs.
Figure 10: Accommodation average expenditure by person by origin
0
5
10
15
20
25
International Interstate Darwin Other NT Regional
$ per person per dayMerrepen Barunga Wugularr Gunbalanya Mahbilil
An Evaluation Using Encore Event Evaluation Kit
14
Several interstate respondents at Wugularr declared no accommodation costs because ‘work pays’. Accommodation rates for these people were therefore estimated at $50 per person per day. As these people were working in the area in any case, their estimated accommodation costs did not represent an extra economic benefit to the region as a result of the festival.
Darwin visitors were generally on short duration trips, specifically to attend the festival in question. As noted above, they tended to spend more on accommodation at Jabiru as there was no free camping.
It is not surprising that higher accommodation costs were experienced by all sectors at Mahbilil as this was the only festival that did not offer free camping.
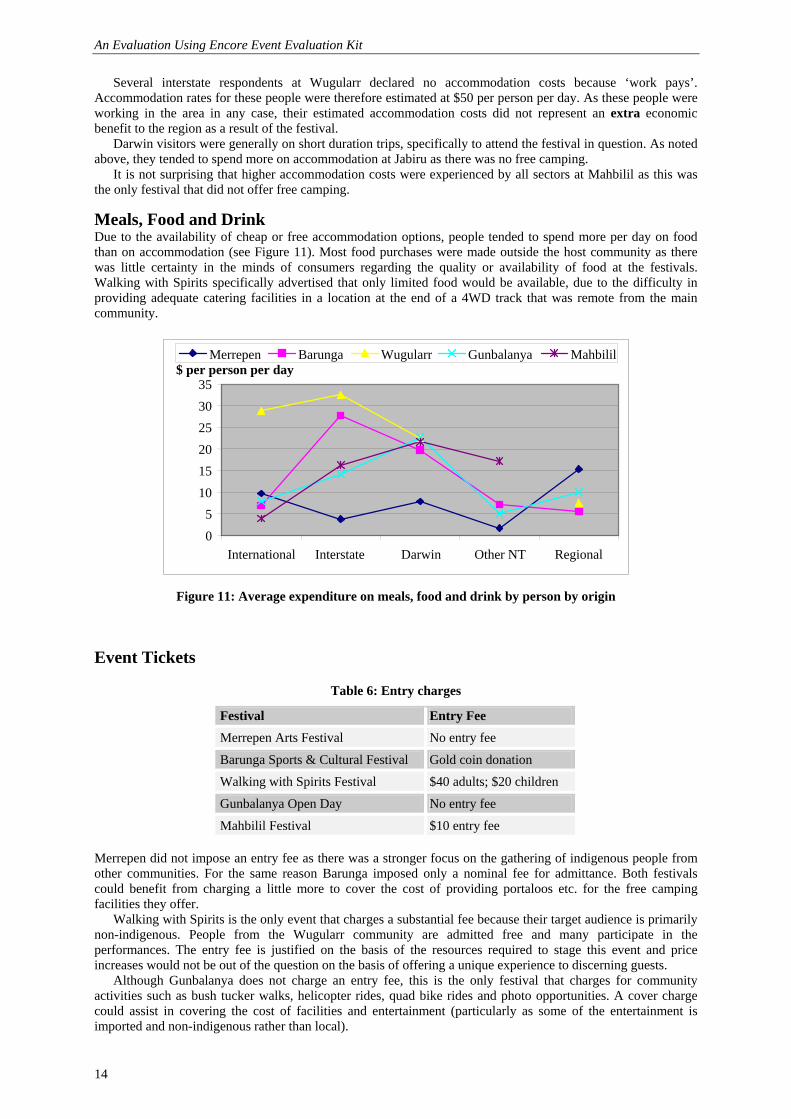
Meals, Food and Drink Due to the availability of cheap or free accommodation options, people tended to spend more per day on food than on accommodation (see Figure 11). Most food purchases were made outside the host community as there was little certainty in the minds of consumers regarding the quality or availability of food at the festivals. Walking with Spirits specifically advertised that only limited food would be available, due to the difficulty in providing adequate catering facilities in a location at the end of a 4WD track that was remote from the main community.
Figure 11: Average expenditure on meals, food and drink by person by origin
Event Tickets
Table 6: Entry charges
Festival Entry Fee
Merrepen Arts Festival No entry fee
Barunga Sports & Cultural Festival Gold coin donation
Walking with Spirits Festival $40 adults; $20 children
Gunbalanya Open Day No entry fee
Mahbilil Festival $10 entry fee
Merrepen did not impose an entry fee as there was a stronger focus on the gathering of indigenous people from other communities. For the same reason Barunga imposed only a nominal fee for admittance. Both festivals could benefit from charging a little more to cover the cost of providing portaloos etc. for the free camping facilities they offer.
Walking with Spirits is the only event that charges a substantial fee because their target audience is primarily non-indigenous. People from the Wugularr community are admitted free and many participate in the performances. The entry fee is justified on the basis of the resources required to stage this event and price increases would not be out of the question on the basis of offering a unique experience to discerning guests.
Although Gunbalanya does not charge an entry fee, this is the only festival that charges for community activities such as bush tucker walks, helicopter rides, quad bike rides and photo opportunities. A cover charge could assist in covering the cost of facilities and entertainment (particularly as some of the entertainment is imported and non-indigenous rather than local).
0 5
101520253035
International Interstate Darwin Other NT Regional
$ per person per dayMerrepen Barunga Wugularr Gunbalanya Mahbilil
INDIGENOUS COMMUNITY FESTIVALS – TOP END
15
The $10 entry fee at Mahbilil would go towards covering the cost of the evening entertainment, although it is apparent from the spectacular fireworks display that Jabiru is uniquely situated in its ability to attract major sponsorship from stakeholders involved in local industry.
Other Entertainment As there is very little opportunity to incur other entertainment costs in the host communities, most responses in this category related to regional expenditure. Even at a regional level, expenditure was low as those who attended were generally budget travellers or self-drivers who contained their costs over extended periods, thereby exhibiting very low average daily expenditures.
Those attending the Merrepen Arts Festival had very little expenditure in this category due to the lack of alternative entertainment in the area. People who came to the region specifically to go on a paid fishing charter did not attend the festival. The people surveyed were more likely to have their own fishing boat, therefore the cost of fuel fell into the transport category, rather than other entertainment.
Interstate and international visitors to Barunga and Beswick were likely to cite expenditure on gorge tours etc. as other entertainment expenses, whereas visitors from Darwin may have included the cost of a night out at a restaurant or hotel. However, most Darwin respondents travelled directly to and from the festivals without stopping over in Katherine.
Although there is a greater opportunity to expend money of other entertainment within the Kakadu region on tours, the propensity to do so was not illuminated in the small samples taken at the Gunbalanya Open Day and Mahbilil. As the festivals are held in the dry season, most sites are accessible by the self-drive traveller and those on tours did not attend Gunbalanya in great numbers.
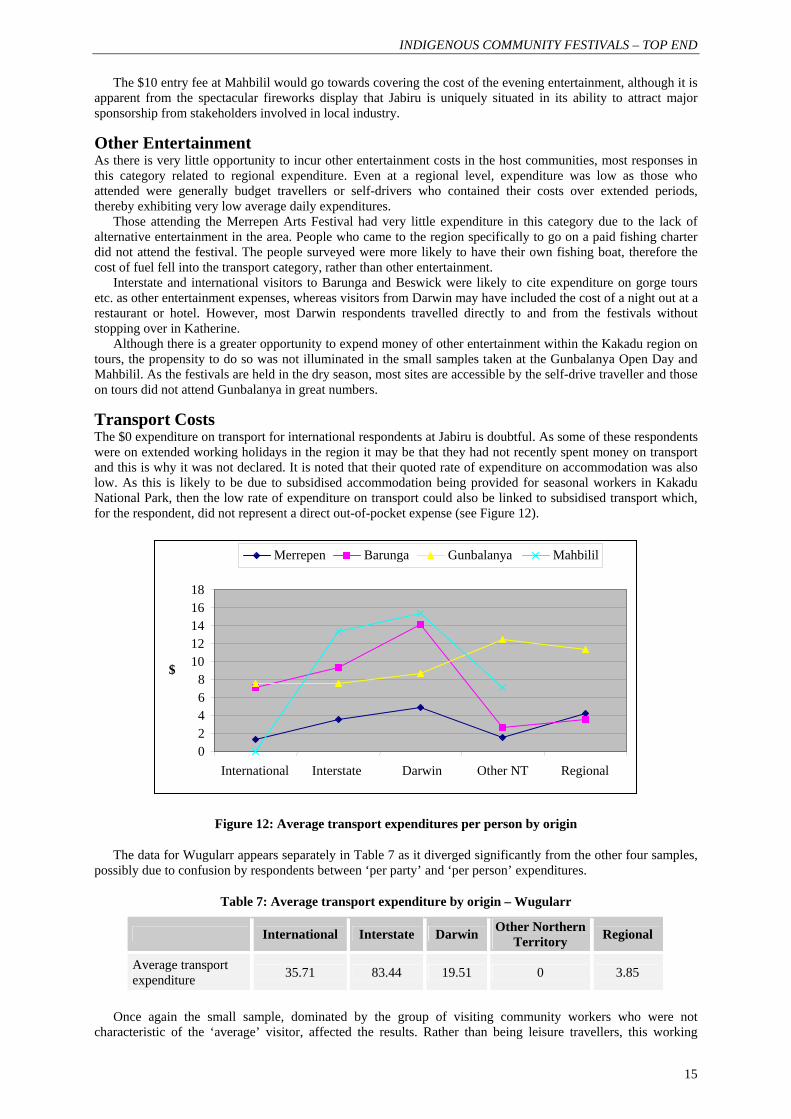
Transport Costs The $0 expenditure on transport for international respondents at Jabiru is doubtful. As some of these respondents were on extended working holidays in the region it may be that they had not recently spent money on transport and this is why it was not declared. It is noted that their quoted rate of expenditure on accommodation was also low. As this is likely to be due to subsidised accommodation being provided for seasonal workers in Kakadu National Park, then the low rate of expenditure on transport could also be linked to subsidised transport which, for the respondent, did not represent a direct out-of-pocket expense (see Figure 12).
Figure 12: Average transport expenditures per person by origin
The data for Wugularr appears separately in Table 7 as it diverged significantly from the other four samples, possibly due to confusion by respondents between ‘per party’ and ‘per person’ expenditures.
Table 7: Average transport expenditure by origin – Wugularr
International Interstate Darwin Other Northern Territory Regional
Average transport expenditure 35.71 83.44 19.51 0 3.85
Once again the small sample, dominated by the group of visiting community workers who were not
characteristic of the ‘average’ visitor, affected the results. Rather than being leisure travellers, this working
02468
1012141618
International Interstate Darwin Other NT Regional
$
Merrepen Barunga Gunbalanya Mahbilil
An Evaluation Using Encore Event Evaluation Kit
16
group expended considerably more on fuel while in the region than would normally be the case for a traveller passing through or camping for extended periods in one or more locations.
Personal Services Although Encore included a question for expenditure relating to personal services such as hairdressing, this question was eliminated from all surveys due to the lack of services of this nature in the communities visited. Even if such services existed, it would be highly unlikely they would operate during the festival, or be utilised by attendees who would not be expecting to have access to them.
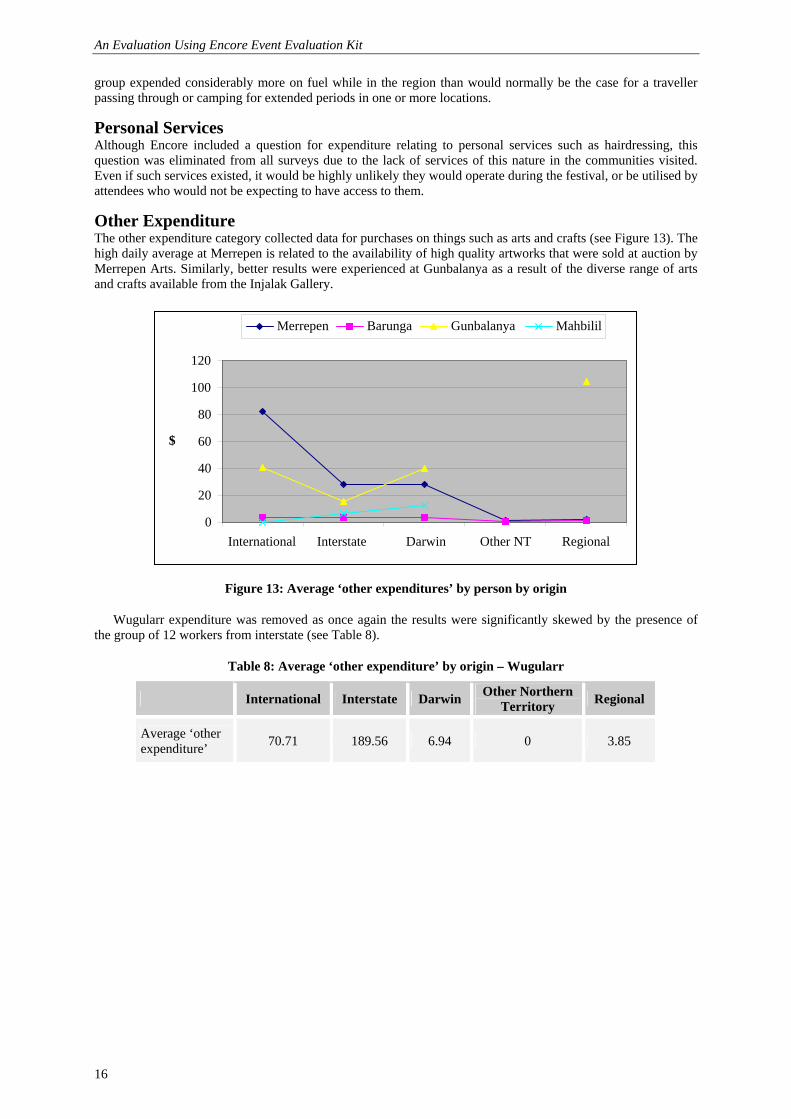
Other Expenditure The other expenditure category collected data for purchases on things such as arts and crafts (see Figure 13). The high daily average at Merrepen is related to the availability of high quality artworks that were sold at auction by Merrepen Arts. Similarly, better results were experienced at Gunbalanya as a result of the diverse range of arts and crafts available from the Injalak Gallery.
Figure 13: Average ‘other expenditures’ by person by origin
Wugularr expenditure was removed as once again the results were significantly skewed by the presence of the group of 12 workers from interstate (see Table 8).
Table 8: Average ‘other expenditure’ by origin – Wugularr
International Interstate Darwin Other Northern Territory Regional
Average ‘other expenditure’ 70.71 189.56 6.94 0 3.85
0
20
40
60
80
100
120
International Interstate Darwin Other NT Regional
$
Merrepen Barunga Gunbalanya Mahbilil
INDIGENOUS COMMUNITY FESTIVALS – TOP END
17
Chapter 5
MARKETING DATA
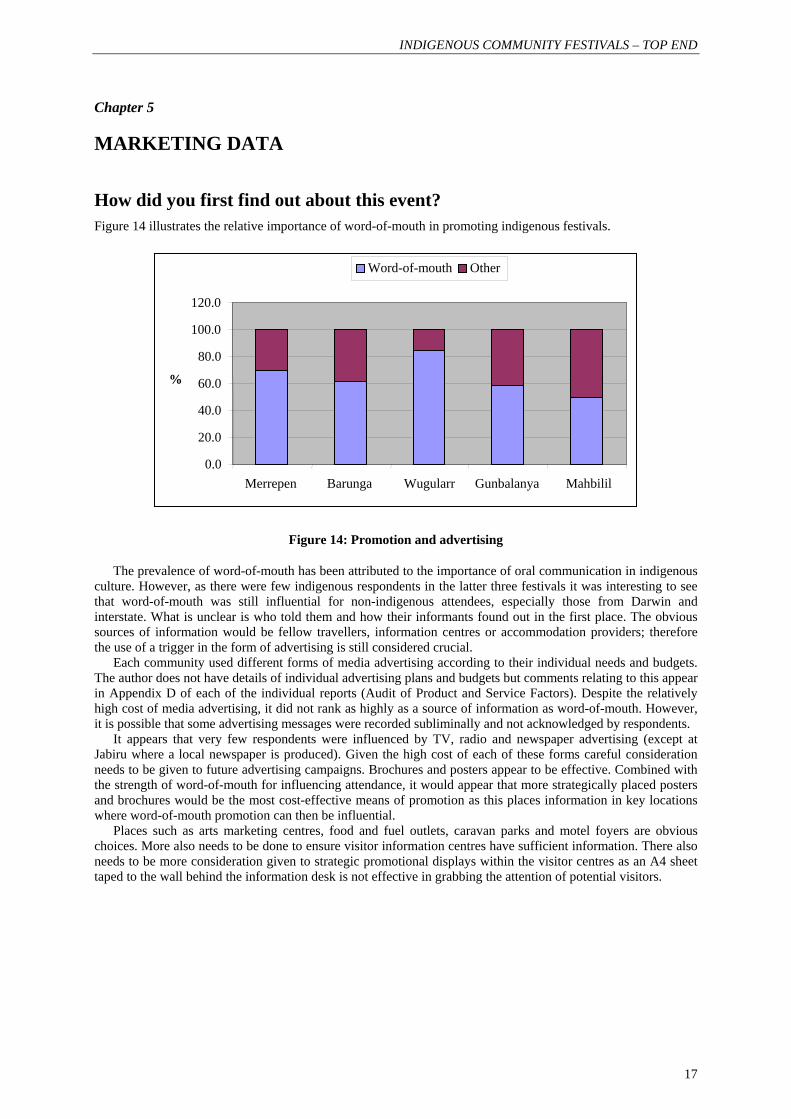
How did you first find out about this event? Figure 14 illustrates the relative importance of word-of-mouth in promoting indigenous festivals.
Figure 14: Promotion and advertising
The prevalence of word-of-mouth has been attributed to the importance of oral communication in indigenous culture. However, as there were few indigenous respondents in the latter three festivals it was interesting to see that word-of-mouth was still influential for non-indigenous attendees, especially those from Darwin and interstate. What is unclear is who told them and how their informants found out in the first place. The obvious sources of information would be fellow travellers, information centres or accommodation providers; therefore the use of a trigger in the form of advertising is still considered crucial.
Each community used different forms of media advertising according to their individual needs and budgets. The author does not have details of individual advertising plans and budgets but comments relating to this appear in Appendix D of each of the individual reports (Audit of Product and Service Factors). Despite the relatively high cost of media advertising, it did not rank as highly as a source of information as word-of-mouth. However, it is possible that some advertising messages were recorded subliminally and not acknowledged by respondents.
It appears that very few respondents were influenced by TV, radio and newspaper advertising (except at Jabiru where a local newspaper is produced). Given the high cost of each of these forms careful consideration needs to be given to future advertising campaigns. Brochures and posters appear to be effective. Combined with the strength of word-of-mouth for influencing attendance, it would appear that more strategically placed posters and brochures would be the most cost-effective means of promotion as this places information in key locations where word-of-mouth promotion can then be influential.
Places such as arts marketing centres, food and fuel outlets, caravan parks and motel foyers are obvious choices. More also needs to be done to ensure visitor information centres have sufficient information. There also needs to be more consideration given to strategic promotional displays within the visitor centres as an A4 sheet taped to the wall behind the information desk is not effective in grabbing the attention of potential visitors.
0.0
20.0
40.0
60.0
80.0
100.0
120.0
Merrepen Barunga Wugularr Gunbalanya Mahbilil
%
Word-of-mouth Other
An Evaluation Using Encore Event Evaluation Kit
18
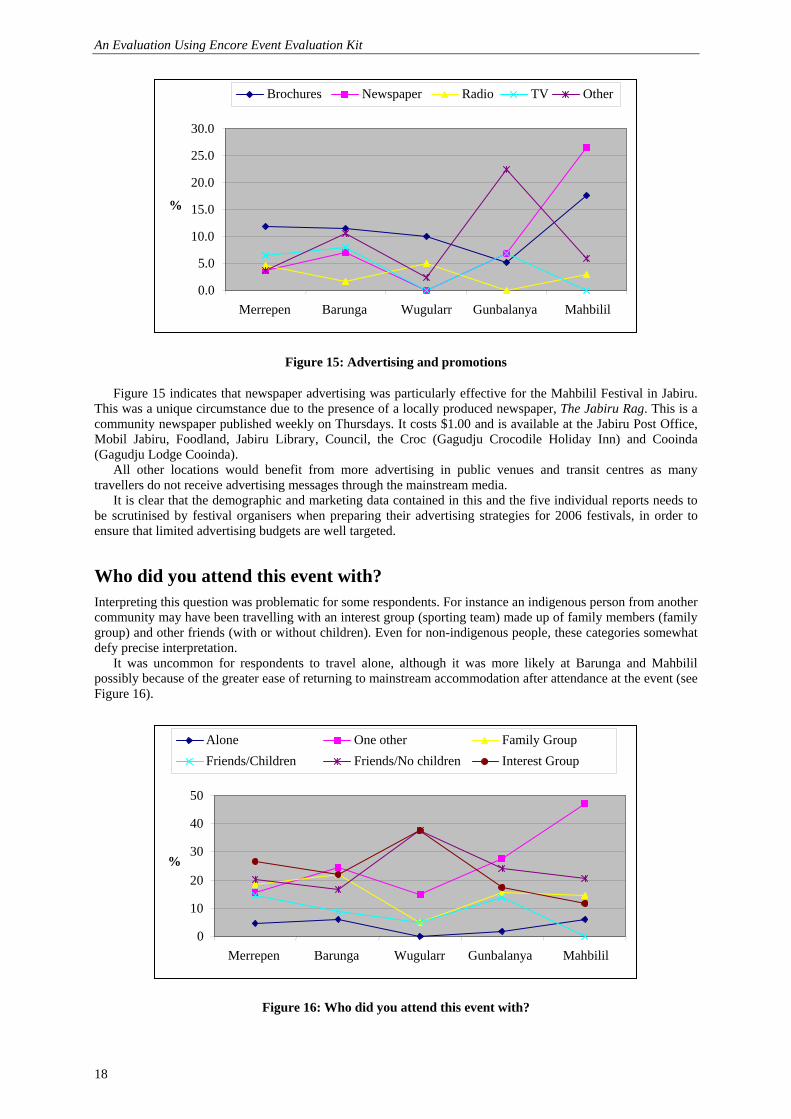
Figure 15: Advertising and promotions
Figure 15 indicates that newspaper advertising was particularly effective for the Mahbilil Festival in Jabiru. This was a unique circumstance due to the presence of a locally produced newspaper, The Jabiru Rag. This is a community newspaper published weekly on Thursdays. It costs $1.00 and is available at the Jabiru Post Office, Mobil Jabiru, Foodland, Jabiru Library, Council, the Croc (Gagudju Crocodile Holiday Inn) and Cooinda (Gagudju Lodge Cooinda).
All other locations would benefit from more advertising in public venues and transit centres as many travellers do not receive advertising messages through the mainstream media.
It is clear that the demographic and marketing data contained in this and the five individual reports needs to be scrutinised by festival organisers when preparing their advertising strategies for 2006 festivals, in order to ensure that limited advertising budgets are well targeted.
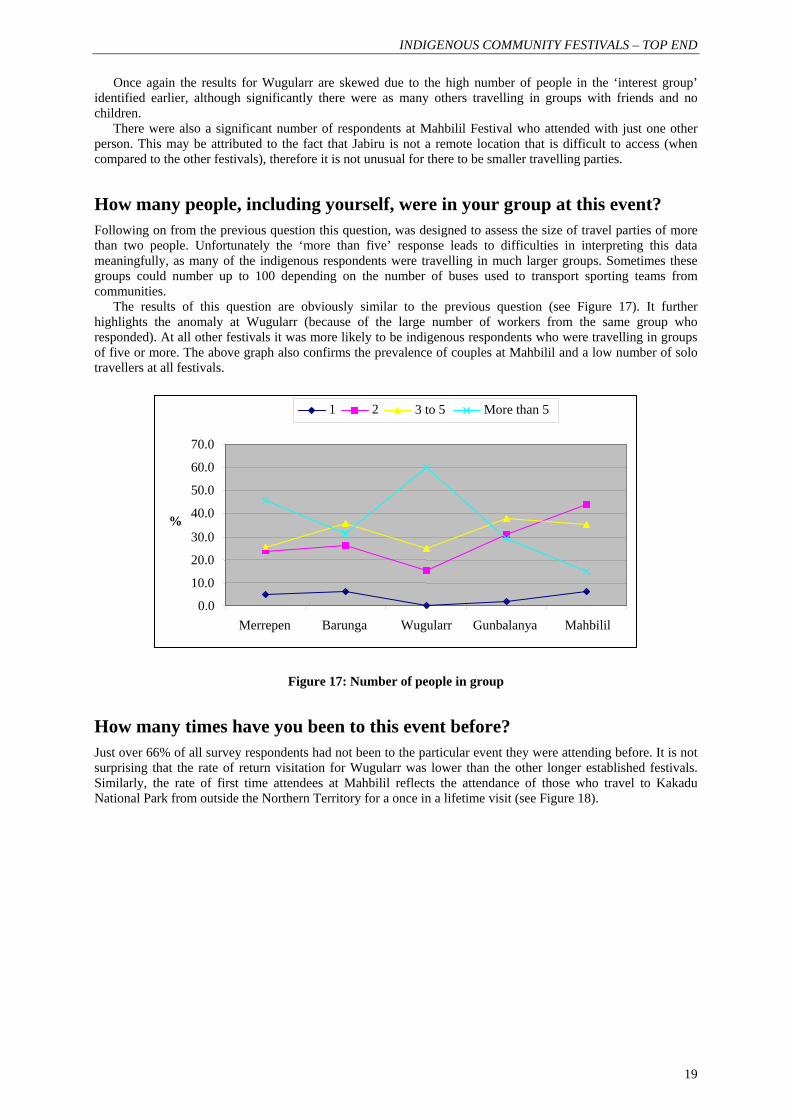
Who did you attend this event with? Interpreting this question was problematic for some respondents. For instance an indigenous person from another community may have been travelling with an interest group (sporting team) made up of family members (family group) and other friends (with or without children). Even for non-indigenous people, these categories somewhat defy precise interpretation.
It was uncommon for respondents to travel alone, although it was more likely at Barunga and Mahbilil possibly because of the greater ease of returning to mainstream accommodation after attendance at the event (see Figure 16).
Figure 16: Who did you attend this event with?
0.0
5.0
10.0
15.0
20.0
25.0
30.0
Merrepen Barunga Wugularr Gunbalanya Mahbilil
%
Brochures Newspaper Radio TV Other
0
10
20
30
40
50
Merrepen Barunga Wugularr Gunbalanya Mahbilil
%
Alone One other Family GroupFriends/Children Friends/No children Interest Group
INDIGENOUS COMMUNITY FESTIVALS – TOP END
19
Once again the results for Wugularr are skewed due to the high number of people in the ‘interest group’ identified earlier, although significantly there were as many others travelling in groups with friends and no children.
There were also a significant number of respondents at Mahbilil Festival who attended with just one other person. This may be attributed to the fact that Jabiru is not a remote location that is difficult to access (when compared to the other festivals), therefore it is not unusual for there to be smaller travelling parties.
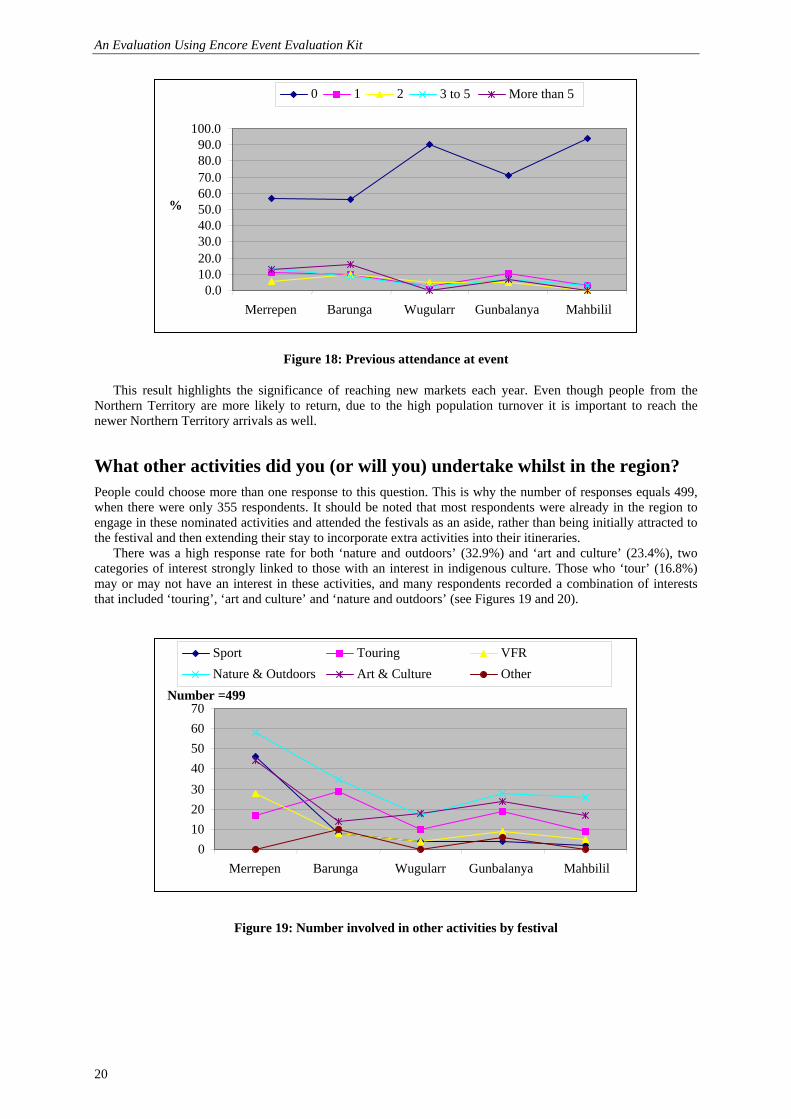
How many people, including yourself, were in your group at this event? Following on from the previous question this question, was designed to assess the size of travel parties of more than two people. Unfortunately the ‘more than five’ response leads to difficulties in interpreting this data meaningfully, as many of the indigenous respondents were travelling in much larger groups. Sometimes these groups could number up to 100 depending on the number of buses used to transport sporting teams from communities.
The results of this question are obviously similar to the previous question (see Figure 17). It further highlights the anomaly at Wugularr (because of the large number of workers from the same group who responded). At all other festivals it was more likely to be indigenous respondents who were travelling in groups of five or more. The above graph also confirms the prevalence of couples at Mahbilil and a low number of solo travellers at all festivals.
Figure 17: Number of people in group
How many times have you been to this event before? Just over 66% of all survey respondents had not been to the particular event they were attending before. It is not surprising that the rate of return visitation for Wugularr was lower than the other longer established festivals. Similarly, the rate of first time attendees at Mahbilil reflects the attendance of those who travel to Kakadu National Park from outside the Northern Territory for a once in a lifetime visit (see Figure 18).
0.0
10.0
20.0
30.0
40.0
50.0
60.0
70.0
Merrepen Barunga Wugularr Gunbalanya Mahbilil
%
1 2 3 to 5 More than 5
An Evaluation Using Encore Event Evaluation Kit
20
Figure 18: Previous attendance at event
This result highlights the significance of reaching new markets each year. Even though people from the Northern Territory are more likely to return, due to the high population turnover it is important to reach the newer Northern Territory arrivals as well.
What other activities did you (or will you) undertake whilst in the region? People could choose more than one response to this question. This is why the number of responses equals 499, when there were only 355 respondents. It should be noted that most respondents were already in the region to engage in these nominated activities and attended the festivals as an aside, rather than being initially attracted to the festival and then extending their stay to incorporate extra activities into their itineraries.
There was a high response rate for both ‘nature and outdoors’ (32.9%) and ‘art and culture’ (23.4%), two categories of interest strongly linked to those with an interest in indigenous culture. Those who ‘tour’ (16.8%) may or may not have an interest in these activities, and many respondents recorded a combination of interests that included ‘touring’, ‘art and culture’ and ‘nature and outdoors’ (see Figures 19 and 20).
Figure 19: Number involved in other activities by festival
0.0 10.020.030.040.050.060.070.080.090.0
100.0
Merrepen Barunga Wugularr Gunbalanya Mahbilil
%
0 1 2 3 to 5 More than 5
010203040506070
Merrepen Barunga Wugularr Gunbalanya Mahbilil
Number =499
Sport Touring VFRNature & Outdoors Art & Culture Other
INDIGENOUS COMMUNITY FESTIVALS – TOP END
21
Figure 20: Percentage involved by activity
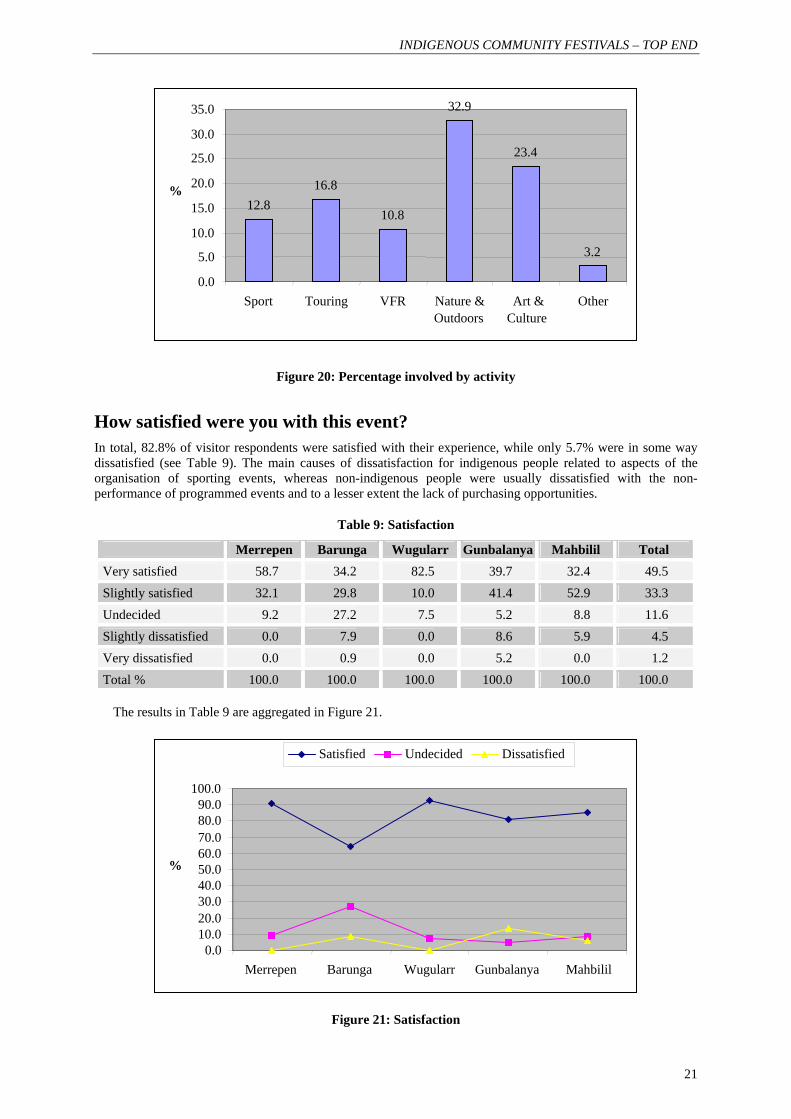
How satisfied were you with this event? In total, 82.8% of visitor respondents were satisfied with their experience, while only 5.7% were in some way dissatisfied (see Table 9). The main causes of dissatisfaction for indigenous people related to aspects of the organisation of sporting events, whereas non-indigenous people were usually dissatisfied with the non-performance of programmed events and to a lesser extent the lack of purchasing opportunities.
Table 9: Satisfaction
Merrepen Barunga Wugularr Gunbalanya Mahbilil Total Very satisfied 58.7 34.2 82.5 39.7 32.4 49.5 Slightly satisfied 32.1 29.8 10.0 41.4 52.9 33.3 Undecided 9.2 27.2 7.5 5.2 8.8 11.6 Slightly dissatisfied 0.0 7.9 0.0 8.6 5.9 4.5 Very dissatisfied 0.0 0.9 0.0 5.2 0.0 1.2 Total % 100.0 100.0 100.0 100.0 100.0 100.0
The results in Table 9 are aggregated in Figure 21.
Figure 21: Satisfaction
12.816.8
10.8
32.9
23.4
3.2
0.0
5.0
10.0
15.0
20.0
25.0
30.0
35.0
Sport Touring VFR Nature &Outdoors
Art &Culture
Other
%
0.0 10.020.030.040.050.060.070.080.090.0
100.0
Merrepen Barunga Wugularr Gunbalanya Mahbilil
%
Satisfied Undecided Dissatisfied
An Evaluation Using Encore Event Evaluation Kit
22
The percentage of people satisfied with their experience at Barunga appears to be counteracted by the number who were undecided, although there was a small percentage who were dissatisfied. Often those who were undecided were questioned very early in the festival and had not spent sufficient time there to make an assessment.
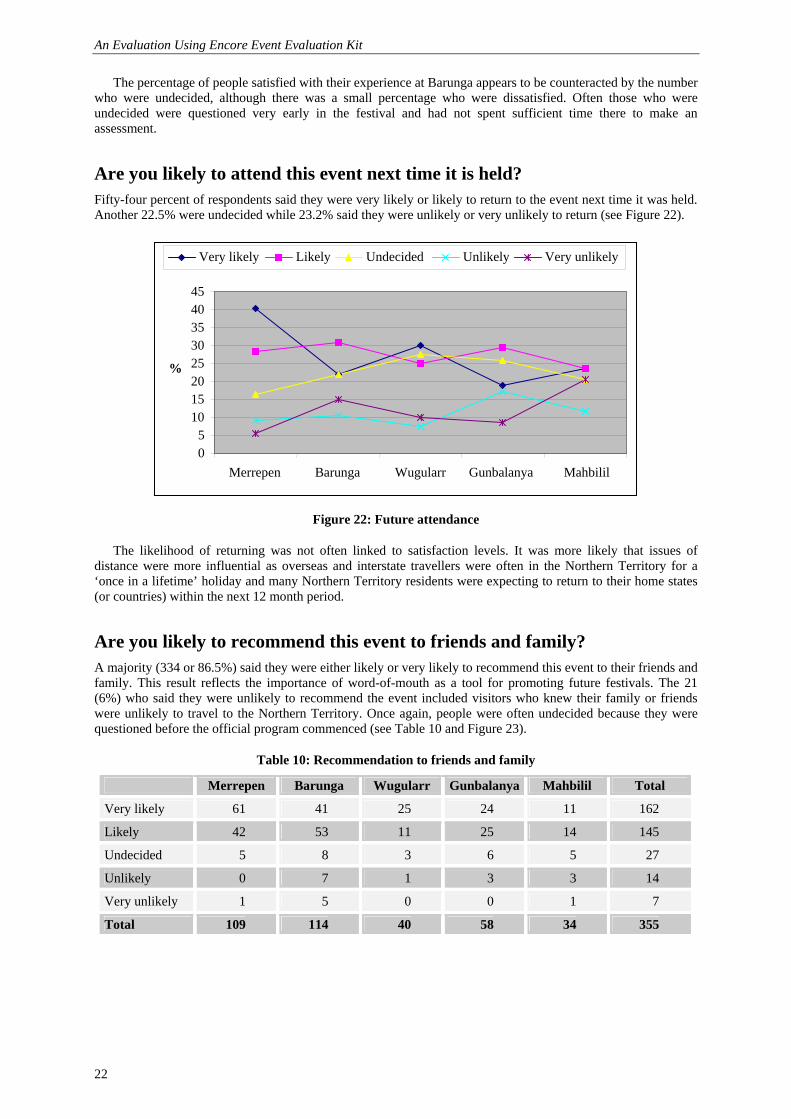
Are you likely to attend this event next time it is held? Fifty-four percent of respondents said they were very likely or likely to return to the event next time it was held. Another 22.5% were undecided while 23.2% said they were unlikely or very unlikely to return (see Figure 22).
Figure 22: Future attendance
The likelihood of returning was not often linked to satisfaction levels. It was more likely that issues of distance were more influential as overseas and interstate travellers were often in the Northern Territory for a ‘once in a lifetime’ holiday and many Northern Territory residents were expecting to return to their home states (or countries) within the next 12 month period.
Are you likely to recommend this event to friends and family? A majority (334 or 86.5%) said they were either likely or very likely to recommend this event to their friends and family. This result reflects the importance of word-of-mouth as a tool for promoting future festivals. The 21 (6%) who said they were unlikely to recommend the event included visitors who knew their family or friends were unlikely to travel to the Northern Territory. Once again, people were often undecided because they were questioned before the official program commenced (see Table 10 and Figure 23).
Table 10: Recommendation to friends and family
Merrepen Barunga Wugularr Gunbalanya Mahbilil Total
Very likely 61 41 25 24 11 162
Likely 42 53 11 25 14 145
Undecided 5 8 3 6 5 27
Unlikely 0 7 1 3 3 14
Very unlikely 1 5 0 0 1 7
Total 109 114 40 58 34 355
05
1015202530354045
Merrepen Barunga Wugularr Gunbalanya Mahbilil
%
Very likely Likely Undecided Unlikely Very unlikely
INDIGENOUS COMMUNITY FESTIVALS – TOP END
23
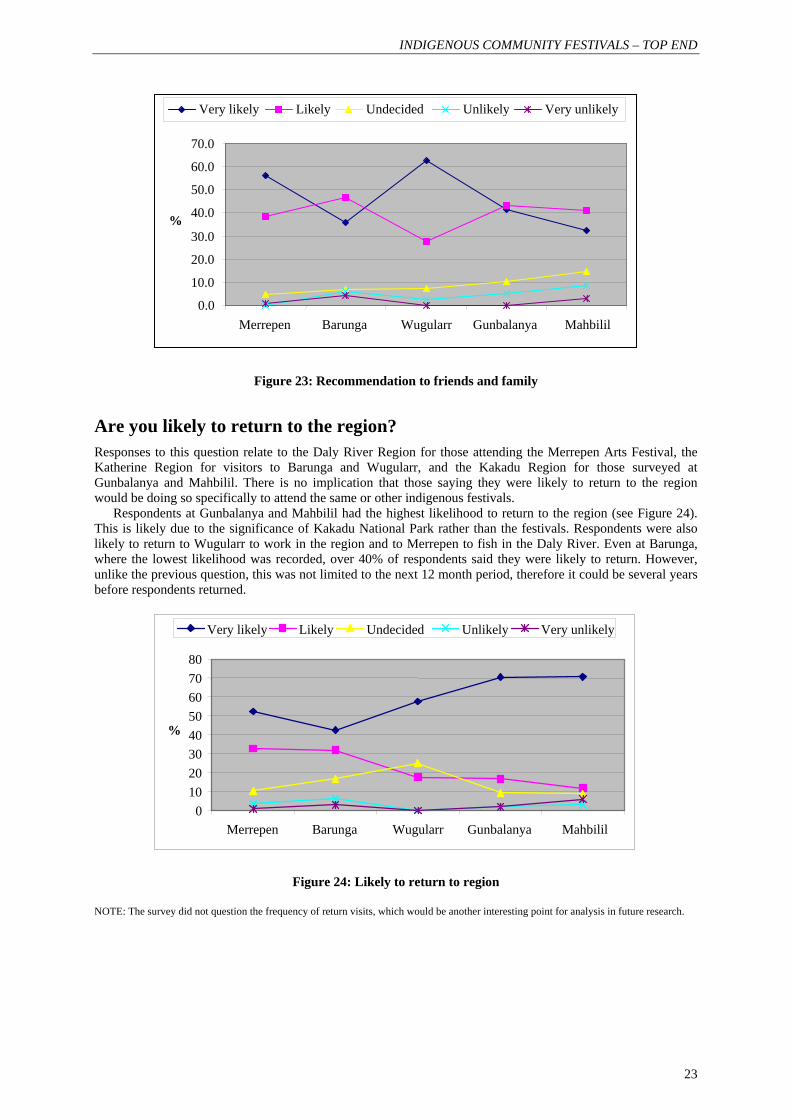
Figure 23: Recommendation to friends and family
Are you likely to return to the region? Responses to this question relate to the Daly River Region for those attending the Merrepen Arts Festival, the Katherine Region for visitors to Barunga and Wugularr, and the Kakadu Region for those surveyed at Gunbalanya and Mahbilil. There is no implication that those saying they were likely to return to the region would be doing so specifically to attend the same or other indigenous festivals.
Respondents at Gunbalanya and Mahbilil had the highest likelihood to return to the region (see Figure 24). This is likely due to the significance of Kakadu National Park rather than the festivals. Respondents were also likely to return to Wugularr to work in the region and to Merrepen to fish in the Daly River. Even at Barunga, where the lowest likelihood was recorded, over 40% of respondents said they were likely to return. However, unlike the previous question, this was not limited to the next 12 month period, therefore it could be several years before respondents returned.
Figure 24: Likely to return to region
NOTE: The survey did not question the frequency of return visits, which would be another interesting point for analysis in future research.
0.0
10.0
20.0
30.0
40.0
50.0
60.0
70.0
Merrepen Barunga Wugularr Gunbalanya Mahbilil
%
Very likely Likely Undecided Unlikely Very unlikely
0 1020304050607080
Merrepen Barunga Wugularr Gunbalanya Mahbilil
%
Very likely Likely Undecided Unlikely Very unlikely
An Evaluation Using Encore Event Evaluation Kit
24
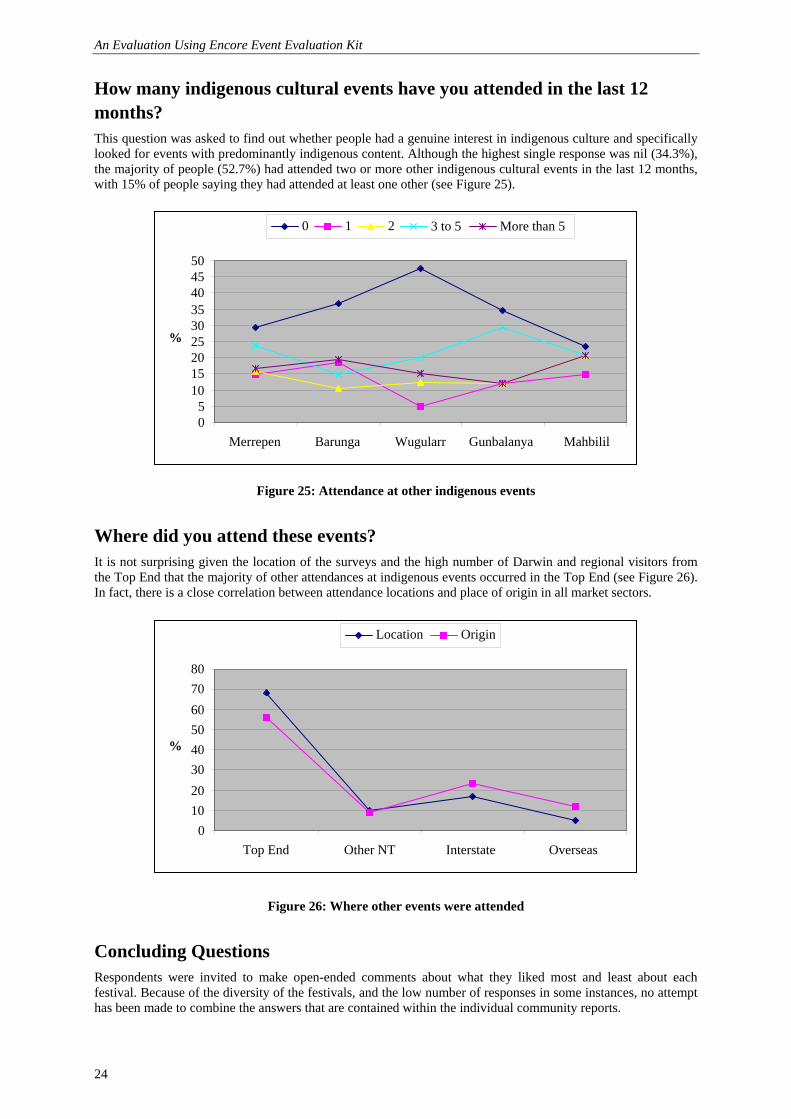
How many indigenous cultural events have you attended in the last 12 months? This question was asked to find out whether people had a genuine interest in indigenous culture and specifically looked for events with predominantly indigenous content. Although the highest single response was nil (34.3%), the majority of people (52.7%) had attended two or more other indigenous cultural events in the last 12 months, with 15% of people saying they had attended at least one other (see Figure 25).
Figure 25: Attendance at other indigenous events
Where did you attend these events? It is not surprising given the location of the surveys and the high number of Darwin and regional visitors from the Top End that the majority of other attendances at indigenous events occurred in the Top End (see Figure 26). In fact, there is a close correlation between attendance locations and place of origin in all market sectors.
Figure 26: Where other events were attended
Concluding Questions Respondents were invited to make open-ended comments about what they liked most and least about each festival. Because of the diversity of the festivals, and the low number of responses in some instances, no attempt has been made to combine the answers that are contained within the individual community reports.
05
101520253035404550
Merrepen Barunga Wugularr Gunbalanya Mahbilil
%
0 1 2 3 to 5 More than 5
01020304050607080
Top End Other NT Interstate Overseas
%
Location Origin
INDIGENOUS COMMUNITY FESTIVALS – TOP END
25
Chapter 6
CONCLUSION
The purpose of this study was to determine the influence of tourists at community festivals and explore the potential for increasing their tourism-related economic contribution through more effective arts marketing. At this time there is little indication that festivals attract tourists to the region in significant numbers. They are, however, attractive to tourists who are in the region at the time and are a valuable showcase for indigenous arts, craft and talent.
With the exception of the Walking with Spirits Festival at Wugularr, all of the festivals surveyed originated prior to tourism links being recognised. They are now at a phase of development where original perspectives and priorities need to be reconsidered in view of the growing realisation of the value of tourism to small regional economies.
The NTTC’s ‘Share Our Story’ marketing strategy is permeated by indigenous imagery, innuendo and symbolism. The development of small community festivals fits well with the strategy as they provide some of the few opportunities for tourists to experience indigenous culture in settings that approximate their perceptions of integrity and authenticity. It is clear that what small communities do to share their stories adds weight to what are otherwise vague promises of unique interactions with indigenous people in the Northern Territory.
The main problem that indigenous people experience when sharing their story is that many are uncomfortable with the prospect of face-to-face interactions with tourists due to significant differences in communication protocols. In the interest of serving demand side exigencies, it is most often the case that indigenous people have to adapt the style of communication to a greater extent than the visitors. This is particularly true in a festival context as mass tourism further erodes the opportunity to deliver integral exchanges between host and visitor. It is clear that efforts need to be made to help the most communicative members of the community address this issue and their current reticence to communicate freely on a more superficial (albeit honest) level with tourists.
Of course, with a more sophisticated approach to arts development and marketing, much of the visitors’ attention could be diverted by performance-based entertainment where direct one-on-one interaction is not paramount. This is an area where the NTTC and Top End Arts Marketing would benefit from closer strategic alignment. Indigenous communities have limited interest in performance based arts development as an entertainment for community members. In many cases their own needs are adequately catered for by contemporary indigenous and non-indigenous acts that do not equate with visitors’ traditionally biased perceptions of indigenous authenticity. When traditional music and dancing is packaged as entertainment at public events, it is done specifically with the tourist in mind. As such, it is an effort by indigenous communities to engage with the economic dimensions of tourism that should be encouraged and supported to a greater extent.
Another problem of staging such events is that communities are burdened with additional product, service and infrastructure needs for short peaks (i.e. a single weekend) without the immediate potential for high level economic returns. The communities do however shoulder the responsibility, and the expense, of providing additional facilities (portaloos for instance) from their meagre funding sources. Logistical problems are exacerbated by the fact that there is no certainty of continued funding from year to year, and funding announcements are often made only a short time before a scheduled event, which limits the capacity of communities to forward plan with accuracy.
This is another area where the NTTC could provide valuable assistance, by using its influence to lobby funding agencies etc. to appropriately value the unique and vital contribution to the Northern Territory tourism strategy and also to promote a greater understanding of the specific logistical problems that eventuate as a result of the sparse and sporadic funding arrangements. Similarly, assistance in promoting a Northern Territory dry-season festival program could help reduce the advertising costs of individual festivals.
An Evaluation Using Encore Event Evaluation Kit
26
APPENDIX A: NOTES REGARDING USE OF THE ENCORE EVENT EVALUATION KIT
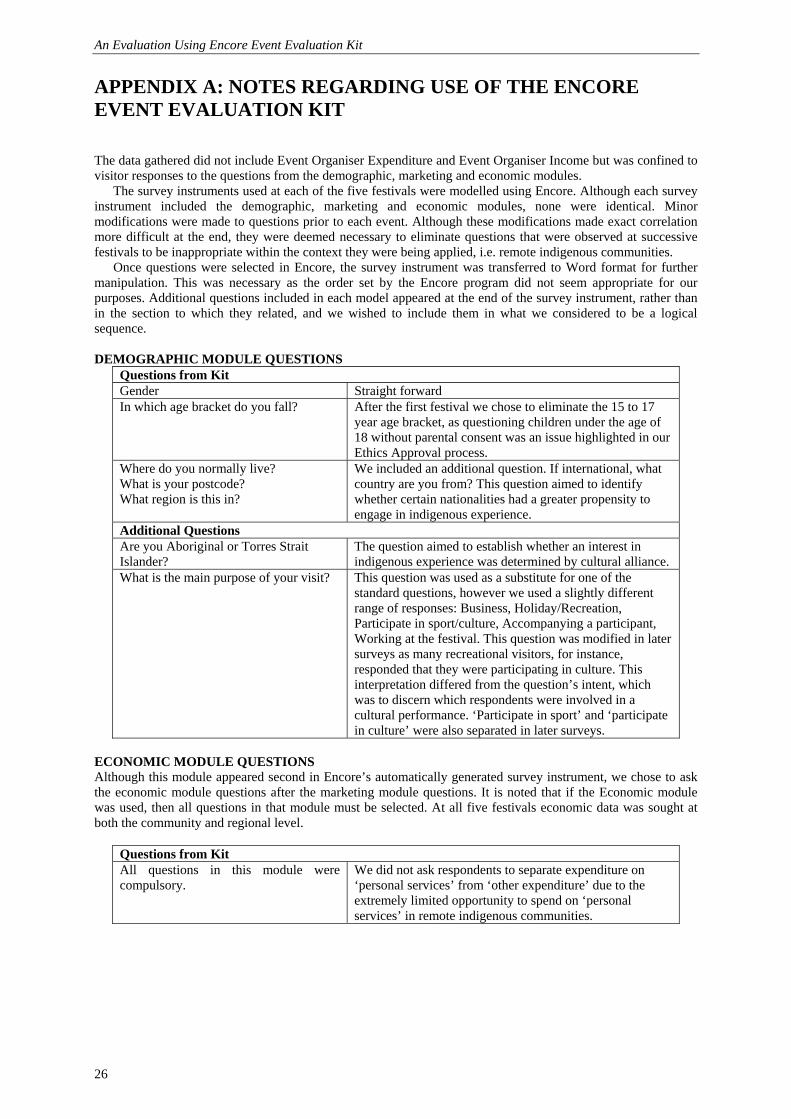
The data gathered did not include Event Organiser Expenditure and Event Organiser Income but was confined to visitor responses to the questions from the demographic, marketing and economic modules.
The survey instruments used at each of the five festivals were modelled using Encore. Although each survey instrument included the demographic, marketing and economic modules, none were identical. Minor modifications were made to questions prior to each event. Although these modifications made exact correlation more difficult at the end, they were deemed necessary to eliminate questions that were observed at successive festivals to be inappropriate within the context they were being applied, i.e. remote indigenous communities.
Once questions were selected in Encore, the survey instrument was transferred to Word format for further manipulation. This was necessary as the order set by the Encore program did not seem appropriate for our purposes. Additional questions included in each model appeared at the end of the survey instrument, rather than in the section to which they related, and we wished to include them in what we considered to be a logical sequence. DEMOGRAPHIC MODULE QUESTIONS
Questions from Kit Gender Straight forward In which age bracket do you fall? After the first festival we chose to eliminate the 15 to 17
year age bracket, as questioning children under the age of 18 without parental consent was an issue highlighted in our Ethics Approval process.
Where do you normally live? What is your postcode? What region is this in?
We included an additional question. If international, what country are you from? This question aimed to identify whether certain nationalities had a greater propensity to engage in indigenous experience.
Additional Questions Are you Aboriginal or Torres Strait Islander?
The question aimed to establish whether an interest in indigenous experience was determined by cultural alliance.
What is the main purpose of your visit? This question was used as a substitute for one of the standard questions, however we used a slightly different range of responses: Business, Holiday/Recreation, Participate in sport/culture, Accompanying a participant, Working at the festival. This question was modified in later surveys as many recreational visitors, for instance, responded that they were participating in culture. This interpretation differed from the question’s intent, which was to discern which respondents were involved in a cultural performance. ‘Participate in sport’ and ‘participate in culture’ were also separated in later surveys.
ECONOMIC MODULE QUESTIONS Although this module appeared second in Encore’s automatically generated survey instrument, we chose to ask the economic module questions after the marketing module questions. It is noted that if the Economic module was used, then all questions in that module must be selected. At all five festivals economic data was sought at both the community and regional level.
Questions from Kit All questions in this module were compulsory.
We did not ask respondents to separate expenditure on ‘personal services’ from ‘other expenditure’ due to the extremely limited opportunity to spend on ‘personal services’ in remote indigenous communities.
INDIGENOUS COMMUNITY FESTIVALS – TOP END
27
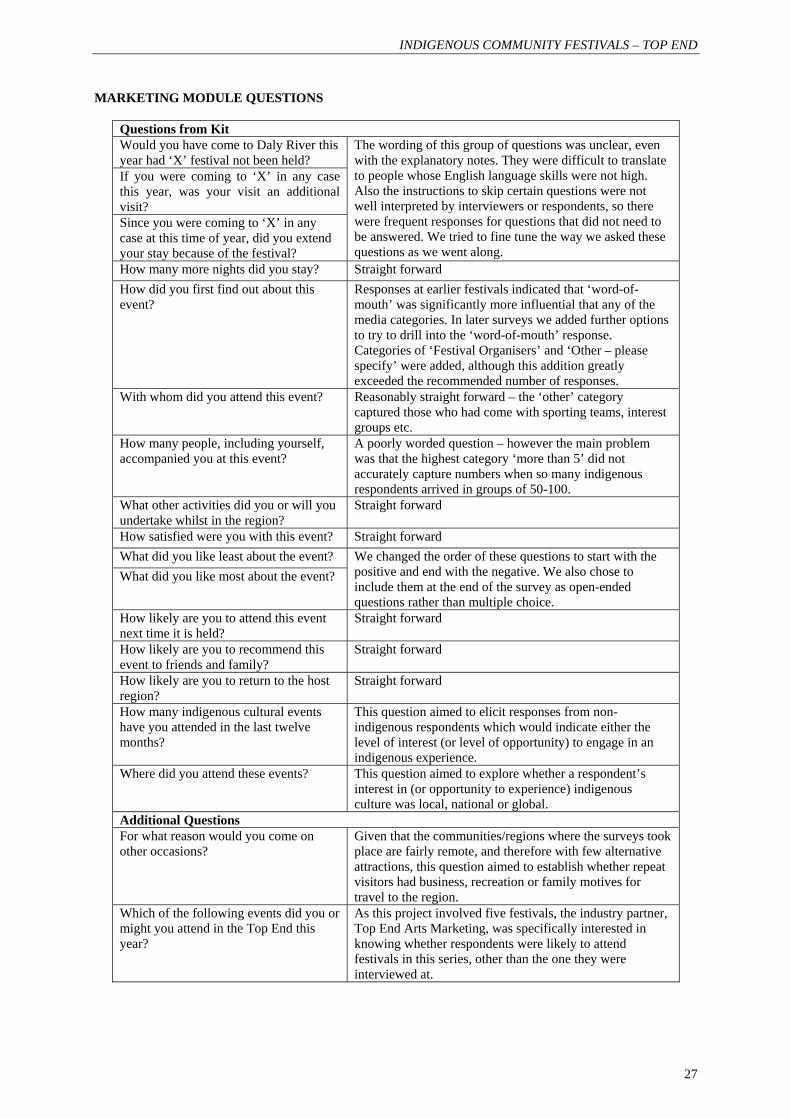
MARKETING MODULE QUESTIONS
Questions from Kit Would you have come to Daly River this year had ‘X’ festival not been held? If you were coming to ‘X’ in any case this year, was your visit an additional visit? Since you were coming to ‘X’ in any case at this time of year, did you extend your stay because of the festival?
The wording of this group of questions was unclear, even with the explanatory notes. They were difficult to translate to people whose English language skills were not high. Also the instructions to skip certain questions were not well interpreted by interviewers or respondents, so there were frequent responses for questions that did not need to be answered. We tried to fine tune the way we asked these questions as we went along.
How many more nights did you stay? Straight forward How did you first find out about this event?
Responses at earlier festivals indicated that ‘word-of-mouth’ was significantly more influential that any of the media categories. In later surveys we added further options to try to drill into the ‘word-of-mouth’ response. Categories of ‘Festival Organisers’ and ‘Other – please specify’ were added, although this addition greatly exceeded the recommended number of responses.
With whom did you attend this event? Reasonably straight forward – the ‘other’ category captured those who had come with sporting teams, interest groups etc.
How many people, including yourself, accompanied you at this event?
A poorly worded question – however the main problem was that the highest category ‘more than 5’ did not accurately capture numbers when so many indigenous respondents arrived in groups of 50-100.
What other activities did you or will you undertake whilst in the region?
Straight forward
How satisfied were you with this event? Straight forward What did you like least about the event? What did you like most about the event?
We changed the order of these questions to start with the positive and end with the negative. We also chose to include them at the end of the survey as open-ended questions rather than multiple choice.
How likely are you to attend this event next time it is held?
Straight forward
How likely are you to recommend this event to friends and family?
Straight forward
How likely are you to return to the host region?
Straight forward
How many indigenous cultural events have you attended in the last twelve months?
This question aimed to elicit responses from non-indigenous respondents which would indicate either the level of interest (or level of opportunity) to engage in an indigenous experience.
Where did you attend these events? This question aimed to explore whether a respondent’s interest in (or opportunity to experience) indigenous culture was local, national or global.
Additional Questions For what reason would you come on other occasions?
Given that the communities/regions where the surveys took place are fairly remote, and therefore with few alternative attractions, this question aimed to establish whether repeat visitors had business, recreation or family motives for travel to the region.
Which of the following events did you or might you attend in the Top End this year?
As this project involved five festivals, the industry partner, Top End Arts Marketing, was specifically interested in knowing whether respondents were likely to attend festivals in this series, other than the one they were interviewed at.
An Evaluation Using Encore Event Evaluation Kit
28
Questions unique to Walking with Spirits Festival, Wugularr As the festival was co-sponsored by the Department of Health and Community Services’ Alcohol and Other Drugs Program, two additional questions were added to the Wugularr survey. 1. Were you aware that this was a grog-free event, and if so how did you find out? 2. Do you consider that being grog-free enhanced your enjoyment of the experience? Individual Reports to Communities At the completion of each survey, data was entered into Encore and standard reports generated. The data was then exported to SPPS for further analysis and a narrative report produced to explain the strengths, weaknesses and implications of the findings.
These reports were provided to individual communities, the Northern Territory Tourist Commission and Top End Arts Marketing. Combined Community Festivals Report The results of all five individual reports were collated into the combined report. As noted, survey questions varied slightly from festival to festival, so collating the five data sets was slightly problematic. Problems could have been eliminated if these minor adjustments to approach were not made during the course of the overall project. However, as stated above, this adjustment process was deemed necessary to improve the comfort of interviewers and respondents during the survey process.
This report was provided to the Northern Territory Tourist Commission, Top End Arts Marketing and the STCRC. General Observations The introductory blurb to the survey instructed interviewers to request ‘5 minutes of your time’. Our interviewers soon started requesting ‘10 minutes’ but in reality many interviews were not conducted in less than 20 minutes. This attributed to the relaxed atmosphere at festivals, where people were often waiting for something to happen and would be willing to engage in lengthy conversations with the interviewers. In the case of some of the indigenous respondents, interviewers took time to observe communication protocols, in order to avoid potential cultural clashes that could arise from speedy approaches, questioning processes and withdrawals.
The issue of whether the individual communities should take charge of their own data collection in future festivals has been considered. Given the inefficiencies of applying standard survey practices within the context of small indigenous community festivals, it is deemed more appropriate to simply collect demographic data and contact details (preferably email or telephone) by means of a collection of coupons included on the festival program. An incentive prize for completion of the coupon would maximise the number of coupons collected. This process would also alleviate the need to ask a long series of economic data questions of people who are obviously not high level spenders at these events (such as participants in sporting events and cultural performances).
The above methodology would allow the researcher to develop a plan for targeted follow-up surveys to be conducted by phone or email after the event. This approach is also considered appropriate as few people in the communities have expressed a desire to be involved in the face-to-face questioning of visitors. This is in one regard a cross-cultural communication issue, but also a human resource issue, as most of the community members with good communication skills are busy attending to the operational and logistical challenges of festival organisation and do not have time for research.
It is also considered that festival communities involved in this current project are not well equipped to adopt Encore for self evaluation at this stage. This is because human resources are scarce and no training has been given in the use of Encore, or techniques for manipulating the survey instrument to suit local needs. As Encore has been developed for national use, components of it are currently inappropriate for simple and direct application to small, regional community festivals.
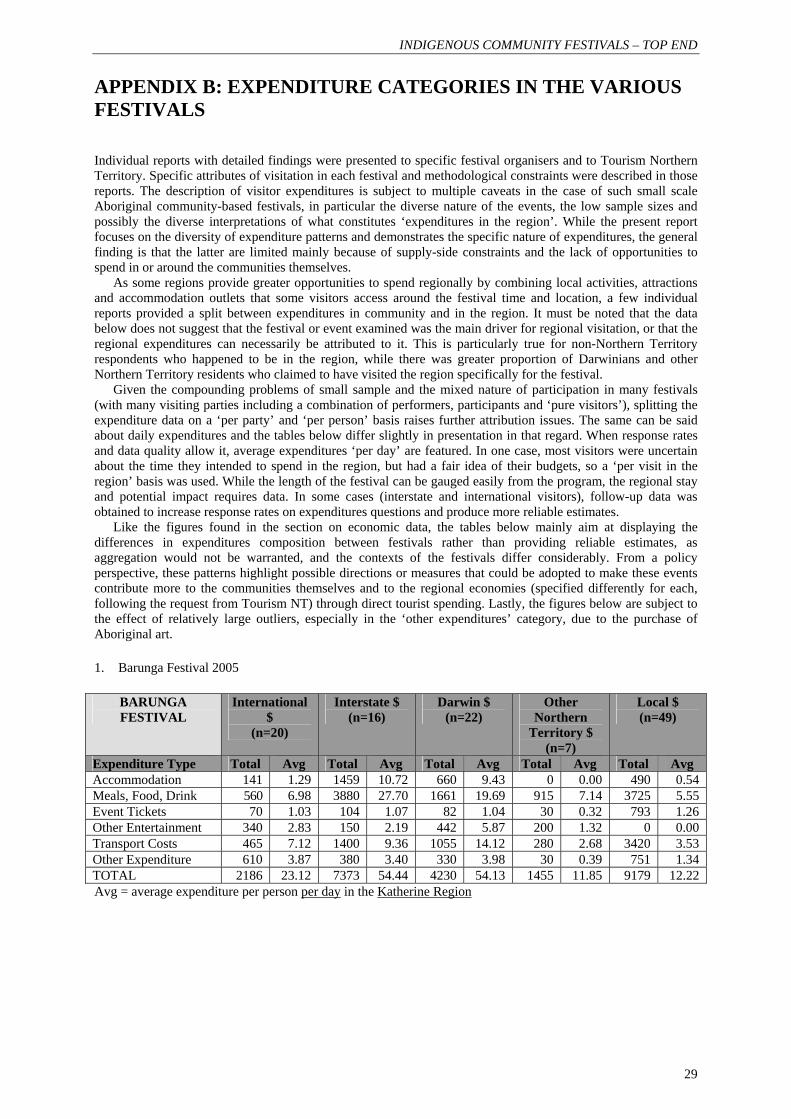
INDIGENOUS COMMUNITY FESTIVALS – TOP END
29
APPENDIX B: EXPENDITURE CATEGORIES IN THE VARIOUS FESTIVALS
Individual reports with detailed findings were presented to specific festival organisers and to Tourism Northern Territory. Specific attributes of visitation in each festival and methodological constraints were described in those reports. The description of visitor expenditures is subject to multiple caveats in the case of such small scale Aboriginal community-based festivals, in particular the diverse nature of the events, the low sample sizes and possibly the diverse interpretations of what constitutes ‘expenditures in the region’. While the present report focuses on the diversity of expenditure patterns and demonstrates the specific nature of expenditures, the general finding is that the latter are limited mainly because of supply-side constraints and the lack of opportunities to spend in or around the communities themselves.
As some regions provide greater opportunities to spend regionally by combining local activities, attractions and accommodation outlets that some visitors access around the festival time and location, a few individual reports provided a split between expenditures in community and in the region. It must be noted that the data below does not suggest that the festival or event examined was the main driver for regional visitation, or that the regional expenditures can necessarily be attributed to it. This is particularly true for non-Northern Territory respondents who happened to be in the region, while there was greater proportion of Darwinians and other Northern Territory residents who claimed to have visited the region specifically for the festival.
Given the compounding problems of small sample and the mixed nature of participation in many festivals (with many visiting parties including a combination of performers, participants and ‘pure visitors’), splitting the expenditure data on a ‘per party’ and ‘per person’ basis raises further attribution issues. The same can be said about daily expenditures and the tables below differ slightly in presentation in that regard. When response rates and data quality allow it, average expenditures ‘per day’ are featured. In one case, most visitors were uncertain about the time they intended to spend in the region, but had a fair idea of their budgets, so a ‘per visit in the region’ basis was used. While the length of the festival can be gauged easily from the program, the regional stay and potential impact requires data. In some cases (interstate and international visitors), follow-up data was obtained to increase response rates on expenditures questions and produce more reliable estimates.
Like the figures found in the section on economic data, the tables below mainly aim at displaying the differences in expenditures composition between festivals rather than providing reliable estimates, as aggregation would not be warranted, and the contexts of the festivals differ considerably. From a policy perspective, these patterns highlight possible directions or measures that could be adopted to make these events contribute more to the communities themselves and to the regional economies (specified differently for each, following the request from Tourism NT) through direct tourist spending. Lastly, the figures below are subject to the effect of relatively large outliers, especially in the ‘other expenditures’ category, due to the purchase of Aboriginal art. 1. Barunga Festival 2005
BARUNGA FESTIVAL
International $
(n=20)
Interstate $ (n=16)
Darwin $ (n=22)
Other Northern
Territory $ (n=7)
Local $ (n=49)
Expenditure Type Total Avg Total Avg Total Avg Total Avg Total Avg Accommodation 141 1.29 1459 10.72 660 9.43 0 0.00 490 0.54 Meals, Food, Drink 560 6.98 3880 27.70 1661 19.69 915 7.14 3725 5.55 Event Tickets 70 1.03 104 1.07 82 1.04 30 0.32 793 1.26 Other Entertainment 340 2.83 150 2.19 442 5.87 200 1.32 0 0.00 Transport Costs 465 7.12 1400 9.36 1055 14.12 280 2.68 3420 3.53 Other Expenditure 610 3.87 380 3.40 330 3.98 30 0.39 751 1.34 TOTAL 2186 23.12 7373 54.44 4230 54.13 1455 11.85 9179 12.22 Avg = average expenditure per person per day in the Katherine Region
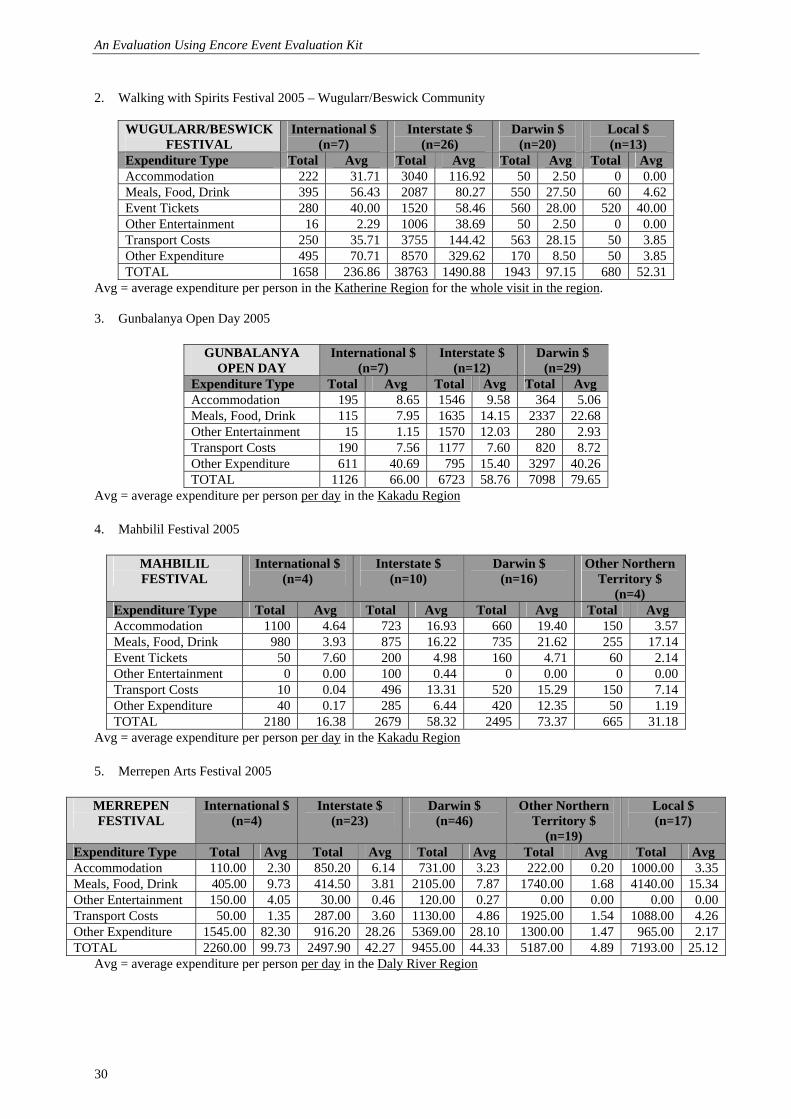
An Evaluation Using Encore Event Evaluation Kit
30
2. Walking with Spirits Festival 2005 – Wugularr/Beswick Community
WUGULARR/BESWICK FESTIVAL
International $ (n=7)
Interstate $ (n=26)
Darwin $ (n=20)
Local $ (n=13)
Expenditure Type Total Avg Total Avg Total Avg Total Avg Accommodation 222 31.71 3040 116.92 50 2.50 0 0.00 Meals, Food, Drink 395 56.43 2087 80.27 550 27.50 60 4.62 Event Tickets 280 40.00 1520 58.46 560 28.00 520 40.00 Other Entertainment 16 2.29 1006 38.69 50 2.50 0 0.00 Transport Costs 250 35.71 3755 144.42 563 28.15 50 3.85 Other Expenditure 495 70.71 8570 329.62 170 8.50 50 3.85 TOTAL 1658 236.86 38763 1490.88 1943 97.15 680 52.31
Avg = average expenditure per person in the Katherine Region for the whole visit in the region. 3. Gunbalanya Open Day 2005
GUNBALANYA OPEN DAY
International $ (n=7)
Interstate $ (n=12)
Darwin $ (n=29)
Expenditure Type Total Avg Total Avg Total Avg Accommodation 195 8.65 1546 9.58 364 5.06 Meals, Food, Drink 115 7.95 1635 14.15 2337 22.68 Other Entertainment 15 1.15 1570 12.03 280 2.93 Transport Costs 190 7.56 1177 7.60 820 8.72 Other Expenditure 611 40.69 795 15.40 3297 40.26 TOTAL 1126 66.00 6723 58.76 7098 79.65
Avg = average expenditure per person per day in the Kakadu Region 4. Mahbilil Festival 2005
MAHBILIL FESTIVAL
International $ (n=4)
Interstate $ (n=10)
Darwin $ (n=16)
Other Northern Territory $
(n=4) Expenditure Type Total Avg Total Avg Total Avg Total Avg Accommodation 1100 4.64 723 16.93 660 19.40 150 3.57 Meals, Food, Drink 980 3.93 875 16.22 735 21.62 255 17.14 Event Tickets 50 7.60 200 4.98 160 4.71 60 2.14 Other Entertainment 0 0.00 100 0.44 0 0.00 0 0.00 Transport Costs 10 0.04 496 13.31 520 15.29 150 7.14 Other Expenditure 40 0.17 285 6.44 420 12.35 50 1.19 TOTAL 2180 16.38 2679 58.32 2495 73.37 665 31.18
Avg = average expenditure per person per day in the Kakadu Region 5. Merrepen Arts Festival 2005 MERREPEN FESTIVAL
International $ (n=4)
Interstate $ (n=23)
Darwin $ (n=46)
Other Northern Territory $
(n=19)
Local $ (n=17)
Expenditure Type Total Avg Total Avg Total Avg Total Avg Total Avg Accommodation 110.00 2.30 850.20 6.14 731.00 3.23 222.00 0.20 1000.00 3.35 Meals, Food, Drink 405.00 9.73 414.50 3.81 2105.00 7.87 1740.00 1.68 4140.00 15.34 Other Entertainment 150.00 4.05 30.00 0.46 120.00 0.27 0.00 0.00 0.00 0.00 Transport Costs 50.00 1.35 287.00 3.60 1130.00 4.86 1925.00 1.54 1088.00 4.26 Other Expenditure 1545.00 82.30 916.20 28.26 5369.00 28.10 1300.00 1.47 965.00 2.17 TOTAL 2260.00 99.73 2497.90 42.27 9455.00 44.33 5187.00 4.89 7193.00 25.12
Avg = average expenditure per person per day in the Daly River Region

INDIGENOUS COMMUNITY FESTIVALS – TOP END
31
AUTHOR
Jennifer Haydon Jennifer Haydon is REDCO Junior Research Fellow and Tourism Research Business Manager with the Tourism Research Group of Charles Darwin University (School of Tourism and Hospitality). She has a Bachelor of Law and Administration, a Graduate Diploma of Aboriginal and Torres Strait Islander Studies and a Masters of Community Development and Management. She has also supported research in tropical knowledge and tourism. Her research interests include law, governance, social policy, Australian indigenous knowledge, knowledge innovation and regional, cultural and heritage tourism development. Email: [email protected]

An Evaluation Using Encore Event Evaluation Kit
32
The Sustainable Tourism Cooperative Research Centre (STCRC) is
established under the Australian Government’s Cooperative Research
Centres Program. STCRC is the world’s leading scientific institution
delivering research to support the sustainability of travel and tourism -
one of the world’s largest and fastest growing industries.
Research Programs
Tourism is a dynamic industry comprising many sectors from accommodation to hospitality, transportation to retail and many
more. STCRC’s research program addresses the challenges faced by small and large operators, tourism destinations and
natural resource managers.
Areas of Research Expertise: Research teams in five discipline areas - modelling, environmental science, engineering &
architecture, information & communication technology and tourism management, focus on three research programs:
Sustainable Resources: Natural and cultural heritage sites serve as a foundation for tourism in Australia. These sites exist
in rural and remote Australia and are environmentally sensitive requiring specialist infrastructure, technologies and
management.
Sustainable Enterprises: Enterprises that adhere to best practices, innovate, and harness the latest technologies will be
more likely to prosper.
Sustainable Destinations: Infrastructural, economic, social and environmental aspects of tourism development are
examined simultaneously.
Website: www.crctourism.com.au I Bookshop: www.crctourism.com.au/bookshop I Email: [email protected]
Postgraduate Students: STCRC’s Education Program recruits high quality postgraduate students and provides scholarships,
capacity building, research training and professional development opportunities.
THE-ICE: Promotes excellence in Australian Tourism and Hospitality Education and facilitates its export to international markets.
Education
STCRC uses its research network, spin-off companies and partnerships to extend knowledge and deliver innovation to the
tourism industry. STCRC endeavours to secure investment in the development of its research into new services, technologies
and commercial operations.
Australia’s CRC Program
The Cooperative Research Centres (CRC) Program brings
together researchers and research users. The program
maximises the benefits of research through an enhanced
process of utilisation, commercialisation and technology
transfer. It also has a strong education component
producing graduates with skills relevant to industry
needs.
Extension & Commercialisation
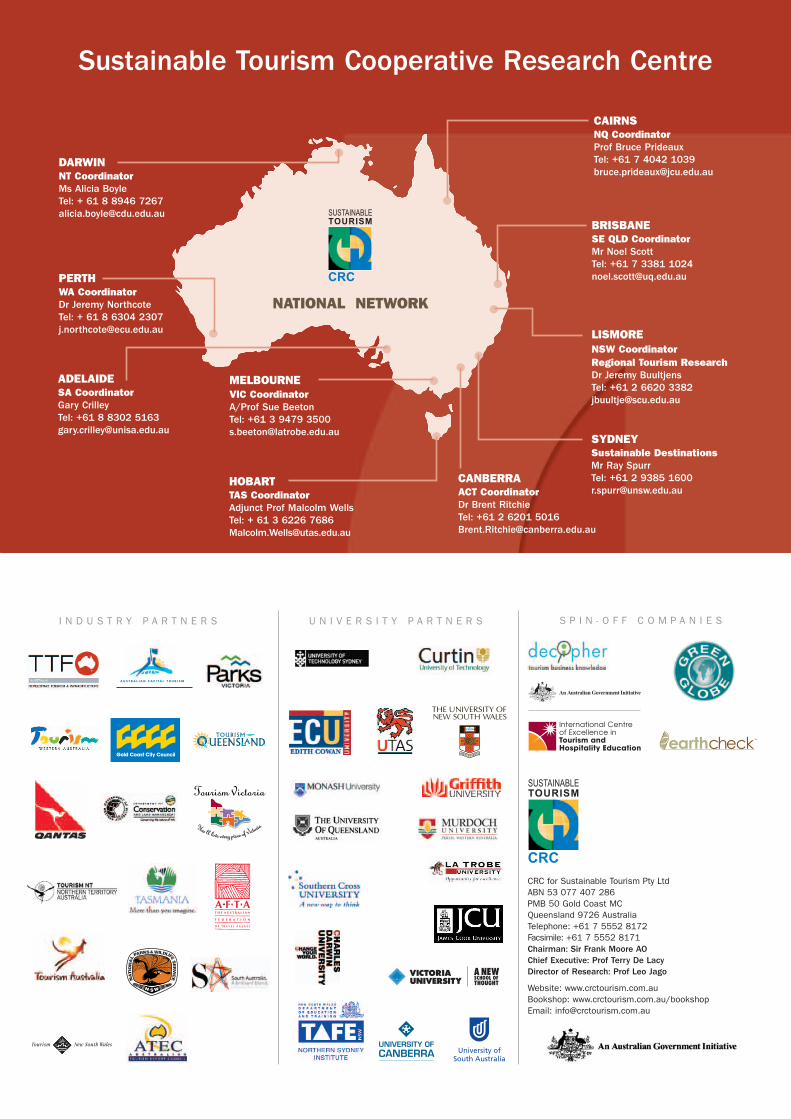
CAIRNSNQ CoordinatorProf Bruce Prideaux
Tel: +61 7 4042 1039
[email protected] CoordinatorMs Alicia Boyle
Tel: + 61 8 8946 7267
[email protected] QLD CoordinatorMr Noel Scott
Tel: +61 7 3381 1024
LISMORENSW CoordinatorRegional Tourism ResearchDr Jeremy Buultjens
Tel: +61 2 6620 3382
SYDNEYSustainable DestinationsMr Ray Spurr
Tel: +61 2 9385 1600
[email protected] CoordinatorAdjunct Prof Malcolm Wells
Tel: + 61 3 6226 7686
CANBERRAACT CoordinatorDr Brent Ritchie
Tel: +61 2 6201 5016
ADELAIDESA CoordinatorGary Crilley
Tel: +61 8 8302 5163
PERTHWA CoordinatorDr Jeremy Northcote
Tel: + 61 8 6304 2307
MELBOURNEVIC CoordinatorA/Prof Sue Beeton
Tel: +61 3 9479 3500
NATIONAL NETWORK
Sustainable Tourism Cooperative Research Centre
A U S T R A L I A N C A P I T A L T O U R I S M
S P I N - O F F C O M P A N I E SU N I V E R S I T Y P A R T N E R SI N D U S T R Y P A R T N E R S
CRC for Sustainable Tourism Pty Ltd
ABN 53 077 407 286
PMB 50 Gold Coast MC
Queensland 9726 Australia
Telephone: +61 7 5552 8172
Facsimile: +61 7 5552 8171
Chairman: Sir Frank Moore AO
Chief Executive: Prof Terry De Lacy
Director of Research: Prof Leo Jago
Website: www.crctourism.com.au
Bookshop: www.crctourism.com.au/bookshop
Email: [email protected]


![[FR] [Festivals] Sonorisez vos festivals et événements avec Tracktl](https://img.pdfslide.net/doc/110x75/55a8ea1b1a28abb20e8b458e/fr-festivals-sonorisez-vos-festivals-et-evenements-avec-tracktl.jpg)