Embed Size (px)
Citation preview

1
Individual and Household-level Determinants of
Malaria Infection in under-5 children from North-
west and Southern Nigeria: a cross-sectional
comparative study based on the 2015 Nigeria
Malaria Indicator Survey
Degree Project for Master program in International Health (30 credits)
International Maternal and Child Health (IMCH)
Department of Women’s and Children’s Health
Uppsala University
Author: Gbemisola Allwell-Brown
Supervisors: Andreas Mårtensson & Carina Källestål
Word count: 13,359

2
Abstract Introduction
Nigeria has the highest malaria burden worldwide. The 2010 and 2015 Nigeria Malaria
Indicator Surveys (NMIS) suggest an improvement in malaria indicators, with the North
West zone lagging behind. This study aimed to identify the individual and household-level
malaria determinants in north-west and southern Nigeria, using Rapid Diagnostic Testing
(RDT) and microscopy for malaria diagnosis.
Methods
Data on 3,358 children aged 6-59 months from north-west and southern Nigeria from the
2015 NMIS was used. The two populations were compared using chi-square tests, and
logistic regression analysis was done for determinants of malaria infection, based on RDT
and microscopic malaria test results.
Results
Malaria prevalence by RDT in the north-west and south was 55.8% and 29.2%, respectively
(37.0% and 14.9%, respectively by microscopy). In both populations, a higher age, positive
RDT in an additional household member and rural residence increased the odds of malaria
infection; while higher education of the head of household and greater household wealth
lowered the odds of malaria infection. Household clustering of RDT-positive cases appeared
to be stronger in the south compared to the north-west. There were no statistically significant
differences between the results using RDT or microscopy.
Conclusion
Irrespective of the diagnostic tool used, malaria determinants were similar in north-west and
southern Nigeria. However, poorer social circumstances were observed in the north-west, and
may account for the delayed progress in malaria control in the region. There may be a need to
intensify malaria control efforts, particularly in the north-west, while awaiting socio-
economic development.

3
Table of Contents Abstract ...................................................................................................................................... 2
List of abbreviations .................................................................................................................. 5
1 Introduction ............................................................................................................................. 6
1.1 Global burden of malaria ................................................................................................. 6
1.2 Malaria causes and presentation ...................................................................................... 7
1.3 Malaria diagnosis ............................................................................................................. 7
1.4 Malaria prevention and treatment .................................................................................... 9
1.5 Malaria burden in Nigeria ................................................................................................ 9
1.6 Individual and household-level determinants of malaria ................................................. 9
1.7 Theoretical framework ................................................................................................... 10
1.8 The Malaria Indicator Survey ........................................................................................ 11
1.9 Justification .................................................................................................................... 12
2 Methods................................................................................................................................. 15
2.1 Study design ................................................................................................................... 15
2.2 Study setting................................................................................................................... 15
2.3 Study population ............................................................................................................ 19
2.3.1 Sampling ................................................................................................................. 20
2.3.2 Eligibility criteria and response rates in the 2015 NMIS ........................................ 20
2.4 Sample size .................................................................................................................... 21
2.5 Data collection ............................................................................................................... 21
2.5.1 Malaria and anaemia testing in the 2015 NMIS ..................................................... 22
2.6 Variables ........................................................................................................................ 22
2.6.1 Outcome variables .................................................................................................. 22
2.6.2 Predictor variables .................................................................................................. 22
2.7 Statistical analysis .......................................................................................................... 25
2.7.1 Data management.................................................................................................... 25
2.7.2 Statistical methods .................................................................................................. 25
2.8 Ethical consideration ...................................................................................................... 26
3 Results ................................................................................................................................... 27
3.1 Malaria prevalence ......................................................................................................... 27
3.2 Characteristics of the study populations ........................................................................ 28
3.3 Determinants of malaria infection by RDT ................................................................... 32

4
3.3.1 Univariate analysis .................................................................................................. 32
3.3.2 Multivariate analysis ............................................................................................... 32
3.4 Determinants of malaria infection by microscopy ......................................................... 34
4 Discussion ............................................................................................................................. 36
4.1 Summary of main findings............................................................................................. 36
4.2 Age ................................................................................................................................. 36
4.3 Education, household wealth and place of residence..................................................... 37
4.4 Positive RDT in an additional household member ........................................................ 37
4.5 Number of de-jure household members ......................................................................... 39
4.6 Bed-nets ......................................................................................................................... 40
4.7 Indoor Residual Spraying (IRS)..................................................................................... 40
4.8 Diagnostic tools ............................................................................................................. 41
4.8.1 Malaria prevalence .................................................................................................. 41
4.8.2 Cross-sectional studies, an opportunity for HRP-2-based RDTs............................ 42
4.8.3 Microscopy-positive, RDT-negative results ........................................................... 42
4.8.4 Malaria diagnostic tools for population-based surveys .......................................... 43
4.9 Seasonal influences ........................................................................................................ 44
4.10 Limitations and strengths ............................................................................................. 44
5 Conclusion ............................................................................................................................ 46
6 Acknowledgements ............................................................................................................... 46
References ................................................................................................................................ 47
Annexe 1: Description of methods for derivation of variables ................................................ 52
Annexe 2: Relationship between fever in the last two weeks in children aged 6-59 months
and malaria test results ............................................................................................................. 56

5
List of abbreviations ACT- Artemisinin-based Combination Therapy
DHS- Demographic and Health Surveys
FCT- Federal Capital Territory
HIV- Human Immunodeficiency Virus
HRP- Histidine-Rich Protein
IRS- Indoor Residual Spraying
ITN- Insecticide-Treated Net
LGA- Local Government Area
LLIN- Long-Lasting Insecticidal Net
LMIC- Low and Middle-Income Country
MDGs- Millennium Development Goals
MICS- Multiple Indicator Cluster Survey
MIS- Malaria Indicator Survey
NMIS- Nigeria Malaria Indicator Survey
PCR- Polymerase Chain Reaction
pLDH- Plasmodium Lactate Dehydrogenase
PMV- Patent Medicine Vendor
RACD- Reactive Case Detection
RDT- Rapid Diagnostic Test
SDGs- Sustainable Development Goals
tMDA- Targeted Massive Drug Administration
WHO- World Health Organisation
6
1 Introduction
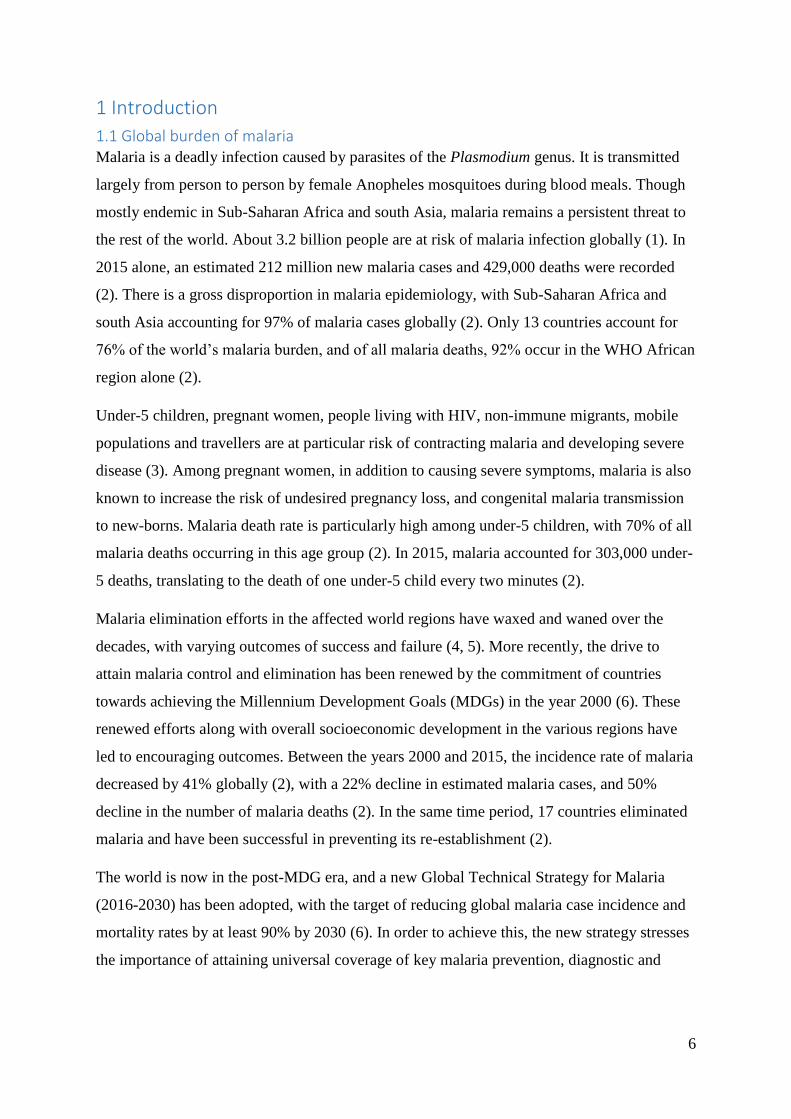
1.1 Global burden of malaria Malaria is a deadly infection caused by parasites of the Plasmodium genus. It is transmitted
largely from person to person by female Anopheles mosquitoes during blood meals. Though
mostly endemic in Sub-Saharan Africa and south Asia, malaria remains a persistent threat to
the rest of the world. About 3.2 billion people are at risk of malaria infection globally (1). In
2015 alone, an estimated 212 million new malaria cases and 429,000 deaths were recorded
(2). There is a gross disproportion in malaria epidemiology, with Sub-Saharan Africa and
south Asia accounting for 97% of malaria cases globally (2). Only 13 countries account for
76% of the world’s malaria burden, and of all malaria deaths, 92% occur in the WHO African
region alone (2).
Under-5 children, pregnant women, people living with HIV, non-immune migrants, mobile
populations and travellers are at particular risk of contracting malaria and developing severe
disease (3). Among pregnant women, in addition to causing severe symptoms, malaria is also
known to increase the risk of undesired pregnancy loss, and congenital malaria transmission
to new-borns. Malaria death rate is particularly high among under-5 children, with 70% of all
malaria deaths occurring in this age group (2). In 2015, malaria accounted for 303,000 under-
5 deaths, translating to the death of one under-5 child every two minutes (2).
Malaria elimination efforts in the affected world regions have waxed and waned over the
decades, with varying outcomes of success and failure (4, 5). More recently, the drive to
attain malaria control and elimination has been renewed by the commitment of countries
towards achieving the Millennium Development Goals (MDGs) in the year 2000 (6). These
renewed efforts along with overall socioeconomic development in the various regions have
led to encouraging outcomes. Between the years 2000 and 2015, the incidence rate of malaria
decreased by 41% globally (2), with a 22% decline in estimated malaria cases, and 50%
decline in the number of malaria deaths (2). In the same time period, 17 countries eliminated
malaria and have been successful in preventing its re-establishment (2).
The world is now in the post-MDG era, and a new Global Technical Strategy for Malaria
(2016-2030) has been adopted, with the target of reducing global malaria case incidence and
mortality rates by at least 90% by 2030 (6). In order to achieve this, the new strategy stresses
the importance of attaining universal coverage of key malaria prevention, diagnostic and

7
treatment interventions. The need for quality surveillance data is also strongly advocated for,
amongst others (6).
1.2 Malaria causes and presentation Five Plasmodium species are principally known to cause malaria in humans- P. falciparum,
P. vivax, P. ovale, P. malariae, and P. knowlesi. Plasmodium falciparum is predominant in
Sub-Saharan Africa, and known to cause the most severe forms of the disease, often leading
to death. In 2015, 99% of all malaria deaths were from P. falciparum infections (2). P. vivax,
while being virtually non-existent in Sub-Saharan Africa, is the most predominant species in
other regions (3).
Malaria infection may manifest in a variety of ways, ranging from infected individuals being
completely asymptomatic, to exhibiting symptoms of severe malaria which may result in
death. In-between these extremes are a wide variety of non-specific symptoms such as fever,
malaise, vomiting, and headache, which are difficult to differentiate from other common
febrile illnesses. Symptomatic malaria is obviously relevant globally, being a direct cause of
malaria deaths. Asymptomatic malaria on the other hand, though not directly leading to
malaria deaths remains a silent culprit in malaria transmission, particularly in endemic areas
where continued exposure to malaria infection results in the development of partial immunity
to malaria (7, 8). As more countries move towards malaria elimination, greater emphasis is
being laid on the importance of identifying and treating all infected persons, including the
asymptomatic (9), to ensure sustained reduction of malaria transmission.
1.3 Malaria diagnosis The WHO supports the use of microscopy and rapid diagnostic testing as the mainstay of
malaria diagnosis, and discourages the practice of solely relying on clinical diagnosis except
on the grounds that it is impossible to carry out a blood test for malaria (3).
Microscopy is the oldest recognised laboratory technique for malaria diagnosis, and involves
the visual identification of malaria parasites in Giemsa-stained thick and thin blood smears. It
is particularly widely accepted and used in low and middle income countries due to its low
cost, simple technology (10), and usefulness in the diagnosis of other common parasitic
infections. Microscopy is often regarded as the “gold standard” for malaria diagnosis, as it
enables the technician to quantify the level of parasitemia, and also distinguish between
parasite species (10, 11). Its specificity and sensitivity however are highly dependent on the
level of expertise of the microscopist. For an average microscopist, parasite detection

8
capacity is at about 50-100 parasites per microliter of blood, but an experienced microscopist
may be able to detect parasitemia at levels as low as five parasites per microliter of blood (10,
11).
Major pitfalls of microscopy are that it is time-consuming, requires a degree of expertise for
operation, and results are highly subject to human error and the level of skill of the
technician. Furthermore, it has been described that microscopy sensitivity reduces with
decreasing malaria transmission (12), possibly due to increasing levels of low-density
parasitemia and a likely decline in skill of microscopists as they get to see fewer cases of
malaria (10, 12). In addition, the loss of some parasites during the staining process has been
noted to contribute to false negative microscopy results (12, 13), especially in infections
where the original host parasite density is low (13).
The malaria Rapid Diagnostic Test (RDT) is a more recent development, and has gained wide
popularity and acceptance over the past decade. It is an immunochromatographic technique
based on the detection of malaria antigens in the host’s blood, which react with antibodies
that have been pre-impregnated on a test strip (14). The antigen-antibody complex formed
shows up as a visible line on the test strip, indicating a positive result. This method for
malaria diagnosis delivers rapid results within the space of 15-30 minutes (15), and requires
minimal training for its operation. It is particularly useful in remote areas which lack the
technology or expertise required for microscopy. The parasite detection capacity for RDTs is
similar to that of an average microscopist under field conditions, at 50-100 parasites per
microliter of blood (10).
Two main antigens are typically targeted by RDTs: histidine-rich protein-2 (HRP-2),
produced by P. falciparum (14), and plasmodium lactate dehydrogenase (pLDH), which is
produced by all human-infecting Plasmodium species (16). HRP-2-based RDTs are capable
of detecting only P. falciparum, and have been found to be more heat-stable (17, 18) and
sensitive (18, 19) than pLDH-based RDTs. On the other hand, the less common pLDH-based
RDTs have shown greater specificity (18), and are capable of detecting multiple plasmodium
species (14).
Molecular diagnostic methods such as Polymerase Chain Reaction (PCR) techniques are
more sensitive and specific (detecting parasite levels as low as 1-5 parasites per microliter of
blood (10), but are expensive and require a high degree of expertise to operate. For these
reasons, such diagnostic methods are often reserved for scientific studies, confirmation of

9
malaria diagnosis in research labs, identification of species and quantification of parasites at
low parasite density levels (10). Other less common malaria diagnostic methods have also
been described (10, 11, 14) but are outside the scope of this paper.
1.4 Malaria prevention and treatment Measures advocated for in the prevention of malaria include the use of long-lasting
insecticidal nets (LLINs), scaling up of indoor residual spraying (IRS) of insecticide (3), and
preventive chemotherapies (malaria chemoprophylaxis in pregnancy, seasonal malaria
chemoprevention in areas with highly seasonal malaria transmission, and intermittent
preventive therapy for infants in some parts of Sub-Saharan Africa) (20).
Malaria treatment is largely based on the use of Artemisinin-based Combination Therapy
(ACT). However, the success of ACT in malaria treatment is being threatened by the
emergence of Artemisinin resistance in five countries in south Asia (the Greater Mekong
Sub-region) (3). Measures are currently underway to speed up malaria elimination in the
region so as to ensure an end to the transmission of the resistant strains (3, 4).
1.5 Malaria burden in Nigeria Nigeria has the highest malaria burden globally, accounting for 29% of all malaria cases and
26% of all malaria deaths globally (2). Every year, about 110 million clinically diagnosed
malaria cases and 300,000 malaria-related childhood deaths occur in Nigeria (21).
Plasmodium falciparum is the most predominant malaria parasite in Nigeria, accounting for
over 95% of infections (21). P. malariae and P. ovale are also found in Nigeria but at much
lower levels (21).
Malaria exerts great pressure on Nigeria’s health system, being responsible for about 60% of
outpatient visits and 30% of hospital admissions, and contributing up to 11% of maternal
mortality and 30% of under-5 mortality (21). The disease also causes huge economic losses
in terms of out-of-pocket payment, prevention costs, and loss of man hours (21, 22).
1.6 Individual and household-level determinants of malaria Several recent population-based studies have identified various individual and household-
level factors that may be associated with malaria infection.
Studies on under-5 populations have shown evidence of malaria positivity increasing with
age, with the children under one year generally being protected (23-25). Gender appears to
show no significant association with malaria positivity in under-5 children (23-25), but
studies on older individuals have suggested higher odds of malaria positivity amongst males

10
(26-29), and this has been largely attributed to males being exposed to more malaria risk-
incurring outdoor activities (28, 29).
Socioeconomic status and education have also been identified by several studies to be
significant predictors of malaria infection, with a protective association seen in the richer (23,
26, 28, 30, 31) and more highly educated groups (24, 27, 28, 30), and increased odds of
malaria positivity in poorer populations (24, 32). In some studies however, socioeconomic
status (33-35) and education (9, 29, 32, 33, 36, 37) were not shown to be statistically
significant predictors of malaria infection.
Regarding malaria prevention measures, bed-net use has shown mixed effects on malaria
infection status, with evidence suggestive of a protective association seen in some studies
(24, 30-32, 38, 39) and no association in others (9, 26, 35, 36, 40). Bed-net ownership appears
to be an even less important malaria predictor than bed-net use, as several studies have been
unable to demonstrate a significant association with malaria positivity (23, 28, 32, 41). A
number of studies that have investigated the effect of IRS have failed to show a protective
association (23, 28, 35, 40). One study however showed that not having DDT sprayed in the
12 months preceding the survey increased the odds of malaria infection (39).
A higher number of occupants in households has been shown to increase the odds of malaria
positivity in household members in some studies (24, 28), while some others have been
unable to demonstrate any such effect (32, 41).
Some other malaria determinants that have been identified include the household building
material (for walls, roof, and floor) (28, 29, 31, 34, 35, 37-39), presence of electricity (28),
type of toilet facility (32), and living in a household with at least one additional malaria-
infected member (41).
1.7 Theoretical framework Due to the complex nature of interactions between the possible factors associated with
malaria infection, an ecological model was chosen for this thesis. An ecological model has
been described as a “model of health that emphasizes the linkages and relationships among
multiple factors (or determinants) affecting health” (42). According to the ecological model,
health determinants are often classified according to levels of “proximity” to the individual,
with complex interactions occurring between factors in the various levels. Figure 1 shows a
simplified version of the socioecological framework (43). For the purposes of this thesis, the
“Relationship” level determinants (Fig.1) are referred to as “Household” level determinants.

11
Figure 1: Socioecological framework. (Adapted from: https://www.cdc.gov/violenceprevention/overview/social-
ecologicalmodel.html)
The malaria determinants at the individual and household levels are the main focus of this
thesis, and are classified as such in subsequent sections. Occasional reference may however
be made to factors on the community and societal levels. A comprehensive list of all
variables in this study and their classification according to the ecological model (Fig. 1) can
be found under the heading “Variables” in the Methods section.
1.8 The Malaria Indicator Survey The Malaria Indicator Survey (MIS) is a stand-alone household survey that was developed as
an offshoot of Roll Back Malaria, an organization that coordinates global efforts to combat
malaria (44). The MIS is co-chaired by the Demographic and Health Surveys (DHS)
Program, and its implementation is largely based on tools and materials adapted from the
DHS and Multiple Indicator Cluster Surveys (MICS) (44).
Malaria Indicator Surveys are conducted periodically in malaria-endemic countries during the
malaria season, and involve the collection of data on internationally recognized malaria
indicators- ownership and use of insecticide-treated nets, intermittent preventive treatment for
malaria in pregnancy, treatment of fever in under-5 children, IRS, diagnostic blood testing of
under-5 children with fever, amongst others (44).
The first Malaria Indicator Survey in Nigeria was conducted in 2010, after a massive
Insecticide-Treated Net (ITN) distribution campaign (45). The 2015 Nigeria MIS which this
thesis is based on, is the second MIS conducted in Nigeria, conducted with the main
objectives of providing “information on malaria indicators and malaria prevalence, both at
the national level and in each of the country’s 36 states and the Federal Capital Territory”
(21).
The 2015 Nigeria Malaria Indicator Survey (2015 NMIS) was implemented by the National
Malaria Elimination Programme (NMEP), the National Population Commission (NPopC),

12
and the National Bureau of Statistics (NBS) from October 2015 through November 2015
(21).
1.9 Justification Nigeria has experienced a modest reduction in malaria mortality over the past 15 years.
Evidence from the 2010 and 2015 Nigeria Malaria Indicator Surveys suggest that disparities
exist in malaria gains being made, with progress appearing to be occurring at a slower pace in
the north, in comparison to the south (Figures 2 and 3). In particular, the North West
geopolitical zone stands out, as it appears to lag behind all other zones, with the highest
malaria prevalence in both surveys, despite recording the highest proportion of LLIN users
(21).
Figure 2: Malaria prevalence (microscopy) in Nigerian geopolitical zones in 2010. (Source: 2015 Nigeria
Malaria Indicator Survey (NMIS) Atlas of Key Indicators)

13
Figure 3: Malaria prevalence (microscopy) in Nigerian geopolitical zones 2015. (Source: 2015 Nigeria Malaria
Indicator Survey (NMIS) Atlas of Key Indicators). Note: Only three of nine enumeration zones were visited for
fieldwork in Borno State (North East) due to the state of insecurity in the state at the time of data. No
enumeration areas in Rural Borno State were visited.
As Nigeria strives to attain a malaria pre-elimination status, it becomes more important to
identify factors that are associated with malaria transmission in the population so as to better
channel malaria control efforts. Furthermore, in line with the SDG commitment to “leave no
one behind”, it is pertinent to identify factors which contribute to slowing the progress in
Nigeria’s North West geopolitical zone compared to the rest of the country.
The aim of this study is to identify individual and household level determinants of malaria
infection in under-5 children living in north-west and southern Nigeria.
The objectives of the study are:
To determine if there are significant differences in background characteristics of
relevance to malaria transmission between the populations in north-west and southern
Nigeria
To identify and compare the individual and household level determinants of malaria
infection in under-5 children living in north-west and southern Nigeria as determined
by microscopy

14
To identify and compare the individual and household level determinants of malaria
infection in under-5 children living in north-west and southern Nigeria as determined
by RDT
15
2 Methods
2.1 Study design This is a cross-sectional study based on secondary analysis of data from the 2015 Nigeria
Malaria Indicator Survey (NMIS).
2.2 Study setting The 2015 Nigeria Malaria Indicator Survey (2015 NMIS) was conducted in all Nigerian
States and the Federal Capital Territory between October and November, 2015 (21).
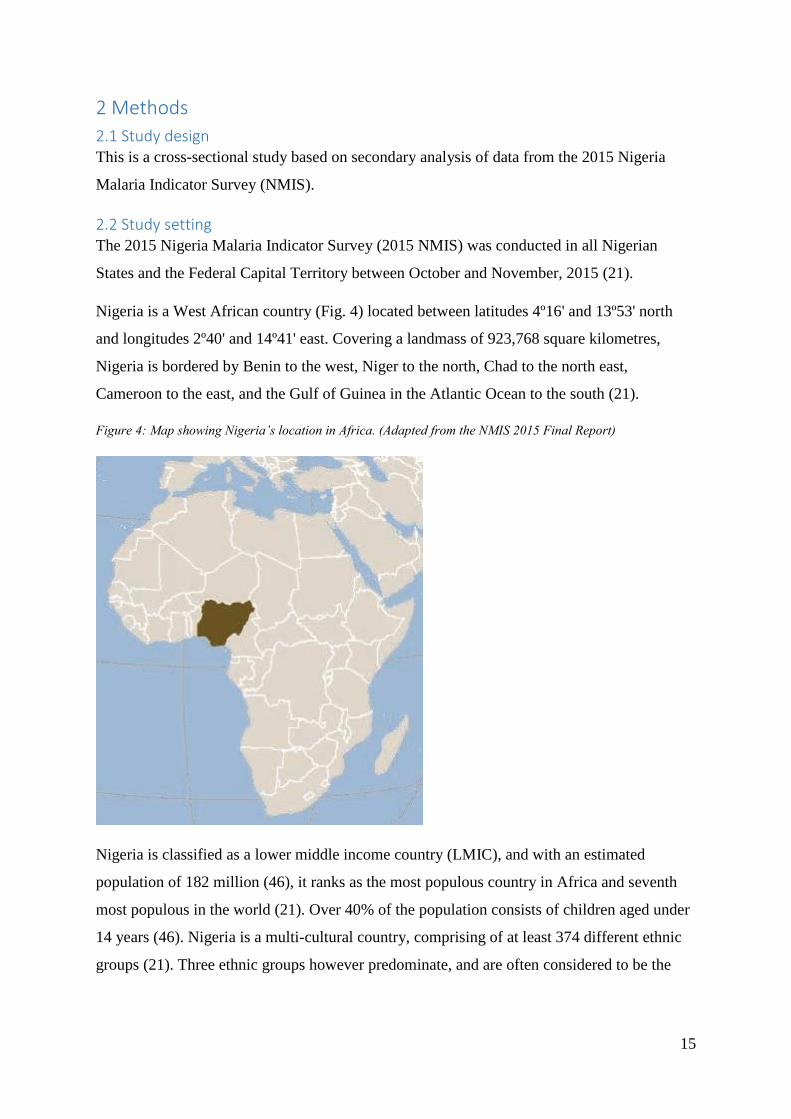
Nigeria is a West African country (Fig. 4) located between latitudes 4º16' and 13º53' north
and longitudes 2º40' and 14º41' east. Covering a landmass of 923,768 square kilometres,
Nigeria is bordered by Benin to the west, Niger to the north, Chad to the north east,
Cameroon to the east, and the Gulf of Guinea in the Atlantic Ocean to the south (21).
Figure 4: Map showing Nigeria’s location in Africa. (Adapted from the NMIS 2015 Final Report)
Nigeria is classified as a lower middle income country (LMIC), and with an estimated
population of 182 million (46), it ranks as the most populous country in Africa and seventh
most populous in the world (21). Over 40% of the population consists of children aged under
14 years (46). Nigeria is a multi-cultural country, comprising of at least 374 different ethnic
groups (21). Three ethnic groups however predominate, and are often considered to be the
16
major ethnic groups- the Igbo and Yoruba predominant in the south, and the Hausa in the
north.
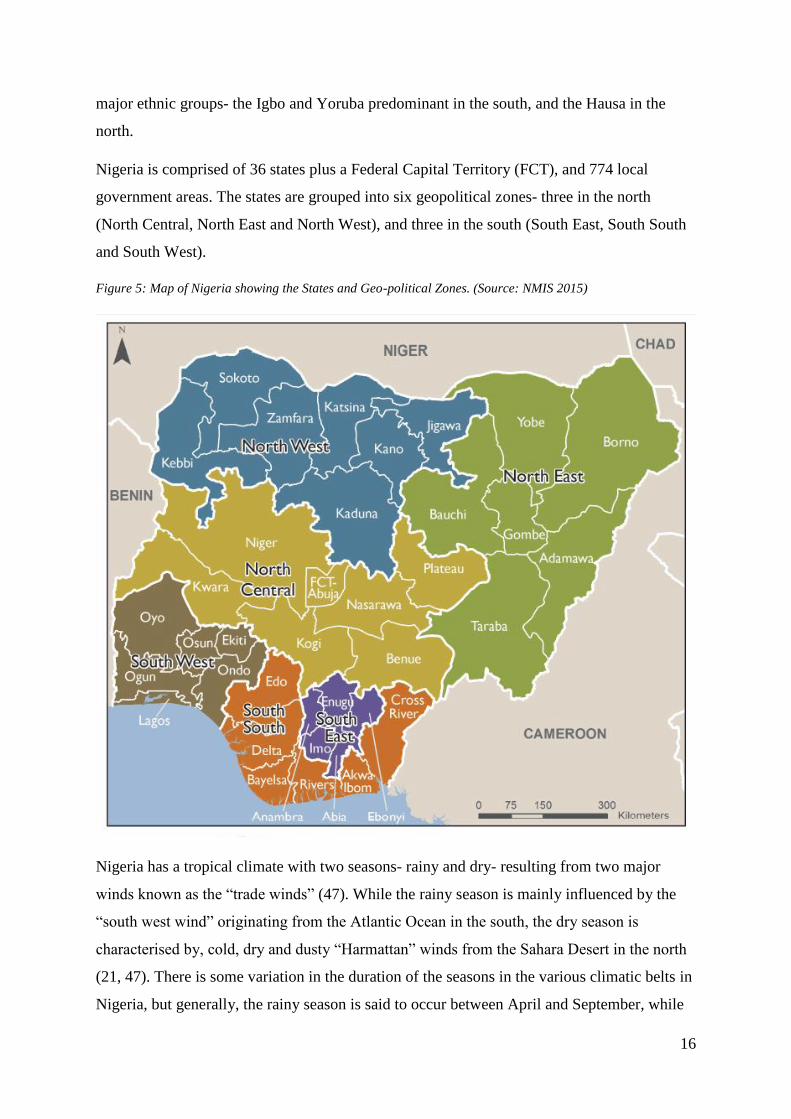
Nigeria is comprised of 36 states plus a Federal Capital Territory (FCT), and 774 local
government areas. The states are grouped into six geopolitical zones- three in the north
(North Central, North East and North West), and three in the south (South East, South South
and South West).
Figure 5: Map of Nigeria showing the States and Geo-political Zones. (Source: NMIS 2015)
Nigeria has a tropical climate with two seasons- rainy and dry- resulting from two major
winds known as the “trade winds” (47). While the rainy season is mainly influenced by the
“south west wind” originating from the Atlantic Ocean in the south, the dry season is
characterised by, cold, dry and dusty “Harmattan” winds from the Sahara Desert in the north
(21, 47). There is some variation in the duration of the seasons in the various climatic belts in
Nigeria, but generally, the rainy season is said to occur between April and September, while

17
the dry season spans October to March (21). The vegetation is influenced by these climatic
conditions and consists of “belts” of mangrove swamp and rainforest in the south, with Sahel
savannah grasslands in northern parts of the country. Temperatures fluctuate between 25°C
and 40°C, and rainfall is between 2,650 millimetres in the southeast to less than 600
millimetres in some parts of the north (21). The topography is also diverse, with altitudes
ranging from less than 20 meters in coastal areas to up to 1,300 meters in the highlands (21).
Malaria is transmitted perennially in most of southern Nigeria, but the duration of the malaria
season decreases as one moves northward. In the north-eastern region, the malaria season can
be as short as three months (21) ( Fig. 6). About three-quarters of the Nigerian population
reside in areas of high malaria transmission (>1 case per 1000 population), with the rest of
the population living in low transmission areas(0-1 cases per 1,000 population) (1).
Figure 6: Map of Nigeria showing duration of malaria transmission season. (Source: NMIS 2010)
Between the years 2000 and 2013, Nigeria implemented three National Malaria Strategic
Plans, and evidence from successive DHS and Malaria Indicator Surveys suggest that these
efforts have yielded encouraging results in terms of malaria indicators. The percentage of
households owning at least one ITN) increased from a mere 2% in the 2003 Nigeria DHS to

18
42% in 2010 (Fig. 7), and 69% in the 2015 NMIS. In the same surveys, the proportion of
under-5 children reported to have slept under ITNs the night before the survey increased from
1% in 2003 to 29% in 2010 and 44% in 2015(Fig. 8). Between 2010 and 2015, the proportion
of children with fever in the two weeks preceding the survey who had blood tests done
(presumably for malaria) increased from 5% to 13% (21). The South West zone recorded the
highest proportion of tested children in 2015 (29%), while the North West zone had the least
(11%). ACT use in febrile children also increased from 6% in 2010 to 38% in 2015 (21).
Figure 7: Trends in ownership of ITNs (2003-2010): Percentage of households with at least one ITN (Source:
NMIS 2010)
Figure 8: Trends in bed-net use among under-5 children (2003-2010). (Source: NMIS 2010)
Regarding malaria mortality statistics, results have been modest but encouraging. Between
2000 and 2013, the number of under-5 deaths dropped from 1 035,000 to 804,000 with the

19
proportion of under-5 deaths attributed to malaria dropping from 24% to 21% (48). Malaria
still remains the leading cause of under-5 mortality in Nigeria (48).
Nigeria is currently implementing her fourth National Malaria Strategic Plan (NMSP 2014-
2020) with the vision of “a malaria-free Nigeria and the goal of reducing malaria burden to
pre-elimination levels and bringing malaria-related mortality to zero” (49). It aims to achieve
this through a combination of objectives including the attainment of universal coverage of
malaria prevention measures (mass distribution of ITNs and scaling up of Indoor Residual
Spraying), malaria testing by RDT and/or microscopy, and malaria treatment with
appropriate medicines. Among the other objectives are improved exposure of the populace to
behavioural change messages, and improved reporting on malaria (49).
2.3 Study population This thesis is based on the population of under-5 children with available data in the 2015
NMIS. For the purposes of this study, only four geopolitical zones were selected for analysis-
one from the north (North West), and all three southern geopolitical zones. For the north, the
North West geopolitical zone was selected because it recorded the highest malaria prevalence
(NMIS 2015 final report). Regarding the south, all zones were selected so as to have a
comparable sample size to the North West zone. Furthermore, it was difficult to determine
which of the southern geopolitical zones had the lowest malaria prevalence, as the results
were close, and varied with type of malaria screening done (microscopy versus RDT). (Table
1).
Table 1: Percentage of children aged 6-59 months in the 2015 NMIS classified as having malaria according to
RDT and microscopy, by background characteristics (Adapted from: Nigeria Malaria indicator Survey 2015
Key Indicators)
Because malaria tests were performed only on children aged 6-59 months, children less than
six months old at the time of the survey were excluded from this study along with children

20
whose ages were not available. The flowchart (Fig. 9) in the Results section illustrates the
flow of participants.
2.3.1 Sampling
The sample for the 2015 NMIS was “designed in such a way as to provide the majority of the
survey indicators for the country as a whole, for urban and rural areas separately, and for each
of the country’s six geopolitical zones” (21). The sampling frame was based on the National
Population and Housing Census (NPHC) of 2006 (21).
Nigeria is divided into 36 states which are in turn divided into Local Government Areas
(LGAs). The LGAs are further divided into localities, which were subdivided into census
Enumeration Areas, according to the 2006 housing census. These enumeration areas were
considered as the primary sampling unit (cluster) for the 2015 NMIS (21).
A two-stage sampling strategy was used for the 2015 NMIS. In the first stage, nine clusters
were selected from each state “in such a way that it was representative of each state” (21).
This yielded a total of 333clusters- 138 urban and 195 rural (21). This was followed by a
complete listing of households in all sampled clusters, and a global positioning system (GPS)
mapping of the clusters. In the second stage, 25 households were selected per cluster by
“equal probability systematic sampling” (21). 8148 households were thus found to be eligible
for the 2015 NMIS.
2.3.2 Eligibility criteria and response rates in the 2015 NMIS
In the 2015 NMIS, all women aged 15-49 years from the sampled households were eligible
for individual interviews, and all children aged 6-59 months were eligible for malaria and
anaemia testing (21).
Of the 8,148 households that were sampled, 7,841 were occupied. Interviews were
successfully conducted in 7,745 households, yielding a response rate of 99% at household
level. In households where interviews were conducted, a total of 8,106 women were found to
be eligible for individual interviews, with 8,034 of them being successfully interviewed. This
translates to a response rate of 99% for the women (21).
6,316 children were found to be eligible for blood testing. Of these, 95% were tested for
malaria using the rapid diagnostic test, with blood smears for microscopic malaria diagnosis
collected for 91% (21).

21
2.4 Sample size The sample size for the 2015 NMIS was said to have been “selected to guarantee that key
survey indicators could be produced for each of the country’s six geopolitical zones, with
approximately 1,338 women in each zone expected to complete interviews” (21), and “in
order to produce some of the survey indicators at the state level for each of the 36 states and
the FCT, interviews were expected to be completed with approximately 217 women per
state” (21).
2.5 Data collection Data collection for the 2015 NMIS was done by 37 teams, each consisting of one supervisor,
two interviewers (one of whom was a nurse), a laboratory scientist, and one driver. Details on
training of field staff can be found in the 2015 NMIS final report (21).
The interviews were conducted using three questionnaires:
The Household Questionnaire was used to list all usual members and visitors in the
selected households, and to collect basic information on the characteristics of each
person listed, such as age, sex, education, and relationship to the head of the
household. Information on characteristics of the household’s dwelling unit such as the
source of water, type of toilet facilities, materials used in the construction of the
house, ownership of assets, and ownership and use of mosquito nets was also
collected using this questionnaire. Data on age and sex of household members was
used to identify women who were eligible for the individual interview. A household
in the 2015 NIMS was defined as “a person or a group of persons, related or
unrelated, who live together, have common cooking and eating arrangements, and
acknowledge one adult member as the head of the household” (21).
The Woman’s Questionnaire was administered to all women age 15-49 in the selected
households, and was used to collect information on their background characteristics
such as education level and media exposure, as well information on birth history and
child mortality, antenatal care and malaria prevention for most recent birth and
pregnancy, malaria prevention and treatment, and general knowledge about malaria
(21).
The Biomarker Questionnaire was used to record the results of the malaria and
anaemia testing, along with the signatures of the fieldworker and the respondent who
gave consent (21).

22
The questionnaires, originally in English, were translated into the three major Nigerian
languages: Hausa, Igbo, and Yoruba. The questionnaires were programmed on tablet
computers, and were administered using computer-assisted personal interviewing (CAPI)
(21).
2.5.1 Malaria and anaemia testing in the 2015 NMIS
Finger or heel-prick blood samples were collected from children aged 6-59 months for on-
the-spot malaria and anaemia testing after written informed consent was obtained from the
child’s parent or guardian. Rapid diagnostic testing for malaria was done using the SD
Bioline Malaria Ag P.f (HRP-II) ™ RDT for detection of histidine rich protein-2 (HRP2), an
RDT capable of identifying only P. falciparum. Thick and thin blood smears were also
prepared on the field for reading in the laboratory, where microscopy was performed to
determine the presence of malaria parasites and to identify the parasite species. Microscopic
malaria diagnosis was done at the African Network for Drugs and Diagnostics Innovation
(ANDI) Centre of Excellence for Malaria Diagnosis, College of Medicine, University of
Lagos, with slide validation performed at the University of Calabar Teaching Hospital.
Further details can be found in the 2015 NMIS final report (21).
Children who tested positive for malaria were given a complete course of anti-malarial
medication, according to national guidelines. Similarly, children who had haemoglobin levels
less than 8mg/dl were appropriately referred to hospitals (21).
2.6 Variables
2.6.1 Outcome variables
There were two outcome variables- malaria test results (positive/negative) as determined by
microscopy, and malaria test results (positive/negative) as determined by RDT.
2.6.2 Predictor variables
The majority of the potential predictor variables used in this study were determined from
previous studies, and were categorised into individual, household, community and societal
factors using the ecological model earlier described. A detailed description of the
methodology used in obtaining these variables from the original datasets, as well as
information on sub-groups contained in the categories used can be found in Annexe 1.
Individual-level factors
Factors directly related to the index child were considered as individual level factors. They
include the following:
Child’s age in months categorised as 6-12m, 13-24m, 25-36m, 37-48m, and 49-59m

23
Child’s sex categorised as male or female
Child slept under LLIN: participants were asked if the index child slept under a
mosquito net the night before the interview. The type of mosquito net was verified by
the interviewers.
Child had fever in the last two weeks: mothers were asked if the child was sick with
fever at any time in the last two weeks preceding the interview.
Treatment of fever in the last two weeks: for individuals with a positive history of
fever in the last two weeks, the respondent was asked if they received any treatment
for the fever.
Place first sought treatment: for individuals who sought treatment for fever in the last
two weeks, respondents were asked for the place where treatment was first sought.
The responses were categorised as government hospital, government health
centre/clinic, private facilities, chemist, and other sources of treatment.
Child with positive RDT suffers from any symptom: Regarding children who had
positive malaria RDT results, respondents were asked if the child suffered from any of
the following symptoms which may indicate severe malaria: extreme weakness, heart
problems, loss of consciousness, rapid breathing, seizures, bleeding, jaundice or dark
urine. Children who had any of these symptoms were referred to health facilities for
treatment.
Household level factors
Number of de jure household members: Respondents were asked for the number of
individuals that usually live in the household. This was categorised as 1-4, 5-7, and >7
according to previous literature (24, 41).
Level of education of head of household: categorised as no education/preschool,
primary, secondary, or higher education.
Maternal education: categorised as no education, primary, secondary or higher
education.
Wealth index: This is a composite measure of a household's cumulative living
standard and is grouped into 5 quintiles namely, poorest, poorer, middle, richer and
richest. Further information can be found in the NMIS 2015 final report (21).
Type of toilet facility in household categorised as flush toilet, pit toilet latrine, and no
facility/others.
Main material of floor categorised as natural, rudimentary, and finished.

24
Main material of walls categorised as natural, rudimentary, and finished.
Main material of roof categorised as natural, rudimentary, and finished.
Household has electricity: respondents were asked whether or not the household has
electricity.
Household has mosquito net for sleeping: respondents were asked if the household
had any mosquito nets.
Number of household members per mosquito net: This variable was derived by
dividing the number of de jure household members by the number of bed-nets in the
household, and categorised as 0-2 persons per mosquito net, >2persons per net, and
no bed-net.
Children under 5 slept under bed-net: This variable describes the proportion of the
under-5 children in the household who slept under a bed-net the night before the
interview and is categorised as- no child, all children, some children, and no net in the
household.
IRS in the last 12 months: respondents were asked if anyone had come into the
dwelling to spray the walls against mosquitoes within the 12 months preceding the
interview.
Fever in any other household member in the last 2 weeks: This variable describes
whether or not any household member apart from the index child had a positive
history of fever in the two weeks preceding the interview.
Positive RDT in an additional household member: This variable describes whether or
not any household member apart from the index child had a positive RDT.
Community level factors
Type of place of residence: rural or urban.
Cluster altitude in meters: Households are typically in clusters. This variable
describes the altitude of the cluster of households from which index households were
selected.
Societal level factors
Region: This is the geopolitical zone of residence. This variable only applies to the
“South” dataset which is comprised of South East, South South, and South West
geopolitical zones. It is not applicable to the “North West” dataset since this is only
one geopolitical zone.

25
2.7 Statistical analysis
2.7.1 Data management
For this thesis, data was downloaded from the DHS website and analysed using the R
statistical software (version 2.3-0). Three datasets were used, namely the Child Recode,
Household Member Recode, and Household Recode. The Child Recode was used as the base,
and was merged with data from the other two datasets (See Annexe). Children who were not
alive at the time of the study, along with those aged less than six months or with missing age
were excluded. Two separate datasets for each of the groups being studied (“North West” and
“South”) were then created, excluding children from the North Central and North East
geopolitical zones. See flowchart (Fig. 9).
2.7.2 Statistical methods
Chi-square tests were carried out on all the potential predictors to test for significant
differences between the two studied populations, in line with the first objective of this study.
Univariate logistic regression analyses were then carried out on all potential predictors
against the two outcome variables (data not shown), followed by chi-square tests between the
predictors to identify possible sources of multicollinearity (data not shown).
For the multivariate analysis, the majority of predictor variables that showed multicollinearity
were excluded. Examples are the variables describing the main material of the floor, walls
and roof, and whether the household had electricity, which were associated with household
wealth index (p<0.001). Another example is “Maternal education”, which was excluded due
to multicollinearity with “Education of head of household” (p<0.001). Furthermore, potential
predictors with data only on subsets of the study population were excluded. Examples are the
variables “Treatment of fever in the last two weeks” and “Place first sought treatment”,
which excluded children who did not have a history of fever in the last two weeks. Finally,
the variable “Child had fever in the last two weeks” was also excluded due to its close
proximity to the outcome and its potential to “dampen” likely associations. The relationship
between fever history in the children and malaria test results was however considered in
separate analyses (Annexe 2).
Apart from the variables excluded for the above reasons, all predictor variables with a p-
value of <0.25 in the univariate analysis were included in the multivariate analysis. The level
of significance was set at p<0.05, and confidence interval of 95%.
26
2.8 Ethical consideration The survey protocol for the 2015 NMIS was approved by the National Health Research
Ethics Committee of the Federal Ministry of Health (NHREC), as well as the review board of
ICF International (21).
Participation was entirely voluntary, and questionnaires were administered only after written
informed consent was taken from prospective participants. Confidentiality was guaranteed,
and participants were free to skip questions they did not feel comfortable answering, or
withdraw from participating at any point in the survey (21).
Written informed consent was also obtained from parents or guardians of under-5 children
before blood samples were taken for malaria and anaemia testing. Results of rapid malaria
tests and haemoglobin levels were provided to parents and guardians on the spot, and
children who tested positive (who were not already on treatment, and have not taken ACT in
the preceding two weeks) were given full courses of ACT according to national guidelines.
Those with suspected severe malaria or anaemia (haemoglobin <8mg/dl) were given
appropriate referral. In addition, brochures explaining the causes and prevention of anaemia
were left with the caregivers of such children (21).

27
3 Results A total of 6,524 children were surveyed in the 2015 NMIS. However, for this study, after
excluding children from the North-central and North-east geopolitical zones, those with
missing data on age or age less than 6 months, and those not alive at the time of the survey, a
total of 3,358 children were analysed. See flowchart (Fig. 9).
Figure 9: Flowchart showing the flow of participants, based on a baseline population of all children studied in
the 2015 NMIS
3.1 Malaria prevalence The prevalence of malaria infection by microscopy was 37.0% and 14.9% in the north-west
and southern populations respectively (55.8% and 29.2% respectively by RDT) (Table 2).
The prevalence of the various Plasmodium species was not determined in this study.

28
However, according to the NMIS 2015 final report, P. falciparum was the most dominant
species, with a prevalence of about 95% in both study populations. Mixed infections with two
or more Plasmodium species (P. falciparum, P. ovale and P. malariae) accounted for 2.7% of
infections in the north-west and 4-6% in southern Nigeria (21).
Table 2: Malaria test results of children aged 6-59 months from north-west and southern Nigeria with data
available from the 2015 Nigeria Malaria Indicator Survey. (P. values obtained from chi-square tests have been
included to show where statistically significant differences are found between the regions.)
Variable North West (N=1402) n (%)
South (N=1956) n (%)
p value
Final result of malaria from blood smear test
Negative Positive
NA
745 (53.1) 519 (37.0) 138 (9.8)
1485 (75.9) 292 (14.9) 179 (9.2)
< 0.001
Result of RDT Negative Positive
NA
549 (39.2) 783 (55.8) 70 (5.0)
1300 (66.5) 571 (29.2) 85 (4.3)
< 0.001
A total of 3,036 children were tested for malaria by both microscopy and RDT. Of these,
1,321 (43.5%) tested positive in one or both tests. 52.7% of the 1,321 tested positive by both
microscopy and RDT, 38.6% tested positive by RDT alone, and 8.7% tested positive by
microscopy alone (data not shown).
3.2 Characteristics of the study populations Table 3 shows the background characteristics of the participating children by geopolitical
area of residence.
There were similar proportions of male and female children in both study populations, with a
slight preponderance of male children (Table 3). Compared to the southern study population,
the north-western population was significantly poorer, more rural, and with higher
proportions of mothers and heads of households with little or no education (Table 3).
Housing in the north-west was of significantly lower quality, with higher proportions of
dwellings made of natural or rudimentary materials, and lacking improved toilet facilities.
71.0% of households in the north-west lacked electricity, compared to 24.8% lacking
electricity in the south. Household occupancy was higher in the north-west, with close to half
of the participants (46.6%) being from households with more than seven de-jure residents. In
the south, most (53.2%) participants were from households comprised of 5-7 members.

29
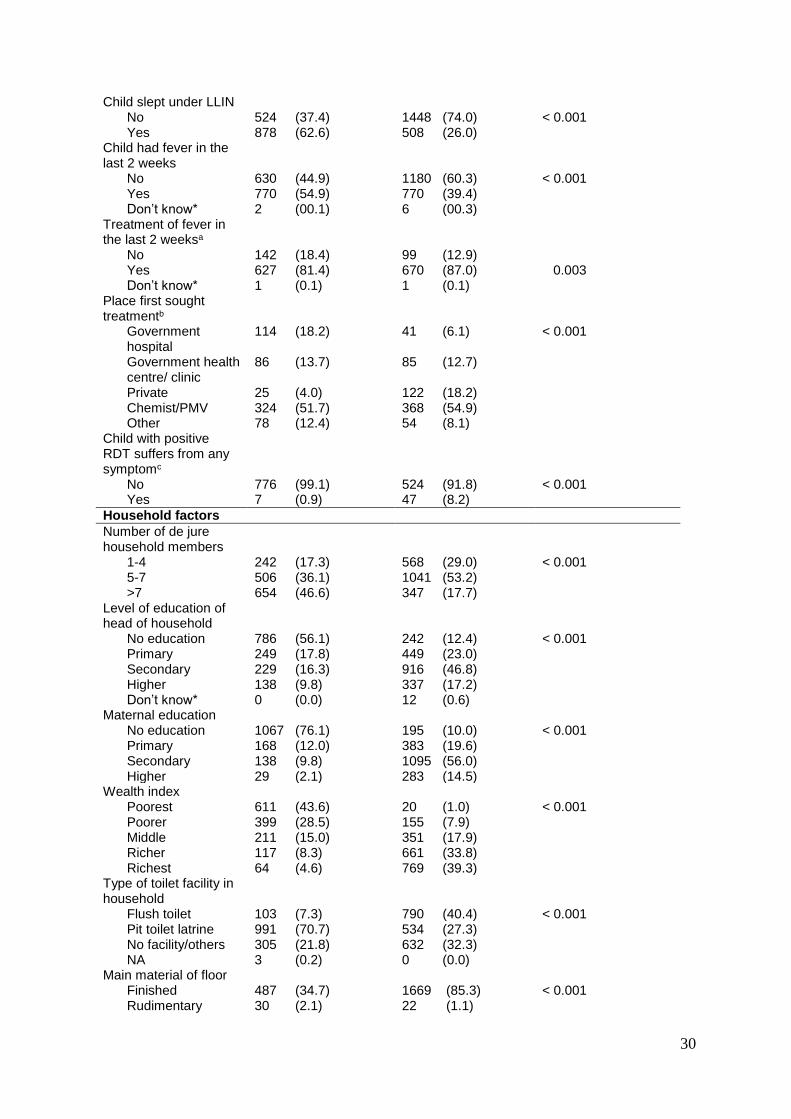
Bed-net ownership was significantly higher in the north-west, with only 7.1% of households
reporting a lack of bed-nets, compared to about 28.6% of households that lacked bed-nets in
the south (Table 3). The north-west population also reported significantly higher bed-net use
than the south. 53.7% of north-western households reported the use of bed-nets for all under-
5 children the night before the survey, while 25.2% did so in the south. LLIN use in the
surveyed children was also significantly higher in the north-west (62.6%) compared to the
south (26.0%).
Fever in the two weeks preceding the survey was reported in 54.9% of children in the north-
west, compared to 39.4% in the south (Table 3). The proportion of children who had received
treatment for fever, though over 80% in both populations, was significantly higher in the
south. In both populations, over half of those who sought fever treatment first did so from a
chemist or patent medicine vendor (PMV), with fewer proportions first seeking fever care
from government facilities. Care seeking from private facilities was commoner in the south
(18.2%) than the north-west (4.0%).
Children who tested positive for malaria by RDT in the north-west were less likely reported
to have had symptoms suggestive of severe malaria (0.9%) compared to their southern
counterparts (8.2%). Children with household members that reported a history of fever in the
two weeks prior to the survey were significantly higher in proportion in the north-west
(77.2%) than in the south (60.3%). Similarly, the proportion children with additional
household members that tested positive to malaria by RDT was significantly higher in the
north-west (46.1%) than in the south (19.9%) (Table 3).
The two study populations were similar in terms of prevalence of indoor residual spraying
(Table 3).
Table 3: Background characteristics of children aged 6-59 months from north-west and southern Nigeria with
data available from the 2015 Nigeria MIS. (P. values obtained from chi-square tests have been included to show
where statistically significant differences are found between the regions.)
Variable North West (N=1402) n (%)
South (N=1956) n (%)
p value
Individual factors
Child’s age in months 6-12m 13-24m 25-36m 37-48m 49-59m
154 (11.0) 310 (22.1) 300 (21.4) 331 (23.6) 307 (21.8)
312 (16.0) 452 (23.1) 408 (20.9) 404 (20.7) 380 (19.4)
<0.001
Child’s sex Male Female
725 (51.7) 677 (48.3)
1015 (51.9) 941 (48.1)
0.918
30
Child slept under LLIN No Yes
524 (37.4) 878 (62.6)
1448 (74.0) 508 (26.0)
< 0.001
Child had fever in the last 2 weeks
No Yes Don’t know*
630 (44.9) 770 (54.9) 2 (00.1)
1180 (60.3) 770 (39.4) 6 (00.3)
< 0.001
Treatment of fever in the last 2 weeksa
No Yes Don’t know*
142 (18.4) 627 (81.4) 1 (0.1)
99 (12.9) 670 (87.0) 1 (0.1)
0.003
Place first sought treatmentb
Government hospital Government health centre/ clinic Private Chemist/PMV Other
114 (18.2) 86 (13.7) 25 (4.0) 324 (51.7) 78 (12.4)
41 (6.1) 85 (12.7) 122 (18.2) 368 (54.9) 54 (8.1)
< 0.001
Child with positive RDT suffers from any symptomc
No Yes
776 (99.1) 7 (0.9)
524 (91.8) 47 (8.2)
< 0.001
Household factors
Number of de jure household members
1-4 5-7 >7
242 (17.3) 506 (36.1) 654 (46.6)
568 (29.0) 1041 (53.2) 347 (17.7)
< 0.001
Level of education of head of household
No education Primary Secondary Higher Don’t know*
786 (56.1) 249 (17.8) 229 (16.3) 138 (9.8) 0 (0.0)
242 (12.4) 449 (23.0) 916 (46.8) 337 (17.2) 12 (0.6)
< 0.001
Maternal education No education Primary Secondary Higher
1067 (76.1) 168 (12.0) 138 (9.8) 29 (2.1)
195 (10.0) 383 (19.6) 1095 (56.0) 283 (14.5)
< 0.001
Wealth index Poorest Poorer Middle Richer Richest
611 (43.6) 399 (28.5) 211 (15.0) 117 (8.3) 64 (4.6)
20 (1.0) 155 (7.9) 351 (17.9) 661 (33.8) 769 (39.3)
< 0.001
Type of toilet facility in household
Flush toilet Pit toilet latrine No facility/others NA
103 (7.3) 991 (70.7) 305 (21.8) 3 (0.2)
790 (40.4) 534 (27.3) 632 (32.3) 0 (0.0)
< 0.001
Main material of floor Finished Rudimentary
487 (34.7) 30 (2.1)
1669 (85.3) 22 (1.1)
< 0.001

31
Natural 885 (63.1) 265 (13.5) Main material of walls
Finished Rudimentary Natural Other*
446 (31.8) 755 (53.9) 200 (14.3) 1 (0.1)
1657 (84.7) 217 (11.1) 79 (4.0) 3 (0.2)
< 0.001
Main material of roof Finished Rudimentary Natural Other*
870 (62.1) 213 (15.2) 318 (22.7) 1 (0.1)
1785 (91.3) 89 (4.6) 75 (3.8) 7 (0.4)
< 0.001
Household has electricity
No Yes
995 (71.0) 407 (29.0)
486 (24.8) 1470 (75.2)
< 0.001
Has mosquito net for sleeping
No Yes
100 (7.1) 1302 (92.9)
560 (28.6) 1396 (71.4)
< 0.001
Number of household members per mosquito net
0-2 persons >2persons No bed-net
422 (30.1) 880 (62.8) 100 (7.1)
484 (24.7) 912 (46.6) 560 (28.6)
< 0.001
Children under 5 slept under bed-net
No children All children Some children No net NA
298 (21.3) 753 (53.7) 250 (17.8) 99 (7.1) 2 (0.1)
766 (39.2) 492 (25.2) 132 (6.7) 554 (28.3) 12 (0.6)
< 0.001
IRS in the last 12 months
No Yes Don’t know*
1392 (99.3) 10 (0.7) 0 (0.0)
1908 (97.5) 22 (1.1) 26 (1.3)
0.213
Fever in any other household member in the last 2 weeks
No Yes
319 (22.8) 1083 (77.2)
777 (39.7) 1179 (60.3)
< 0.001
Positive RDT in an additional household member
No Yes
756 (53.9) 646 (46.1)
1566 (80.1) 390 (19.9)
< 0.001
Community factors
Type of place of residence
Urban Rural
337 (24.0) 1065 (76.0)
1045 (53.4) 911 (46.6)
< 0.001
Cluster altitude (in meters)d
Minimum 1st quartile Median Mean 3rd quartile Maximum
148 315 445 430 513 770
0 14 62 131 197 623
Not applicable

32
Societal factors
Region ( not applicable to North West)
South-East South-South South-West
563 (28.8) 680 (34.8) 713 (36.5)
* recoded as NA (not available) for chi-square test; a
N=770; b N=627 (for North West) and 670 (for South);
c N=783 (for North West) and 571 (for South); d Numerical variable
3.3 Determinants of malaria infection by RDT
3.3.1 Univariate analysis
For both populations, all predictors except the child’s sex, child sleeping under LLIN the
night before the survey, number of household members per mosquito net, IRS in the 12
months preceding the survey, and fever in any other household member in the two weeks
preceding the survey were significant at p<0.05 (Table 4).
3.3.2 Multivariate analysis
With the exception of the determinant “number of de jure household members”, all variables
that were statistically significant in the crude analysis remained so in the multivariate analysis
(Table 4) and are described as follows:
Individual-level factors
Compared to the youngest children, those aged 25 months and above in the north-west
showed increased odds of being RDT positive. For children from the south, the odds were
significantly higher for all age groups from 13 months upwards (Table 4). A non-significant
trend of increasing odds of RDT positivity with increasing age was seen in both populations.
Household and community-level factors
Both populations showed that higher education of the head of household significantly
lowered the odds of RDT positivity compared to groups in which the heads of households
had no education. In the south, a non-significant trend of decreasing odds of malaria infection
with increasing education was seen (Table 4).
Being in the “richer” and “richest” wealth quintiles was significantly associated with lower
odds of malaria infection in both populations, compared to the “poorest” quintiles. Both
groups showed trends of decreasing odds of malaria infection with increasing wealth (Table
4).
Children from households in which at least one additional member tested positive to malaria
by RDT had significantly higher odds of also being malaria-positive, OR=1.913 (95% CI:
1.478-2.480) in the north-west and OR=4.229 (95% CI: 3.248-5.524) in the south (Table 4).
33
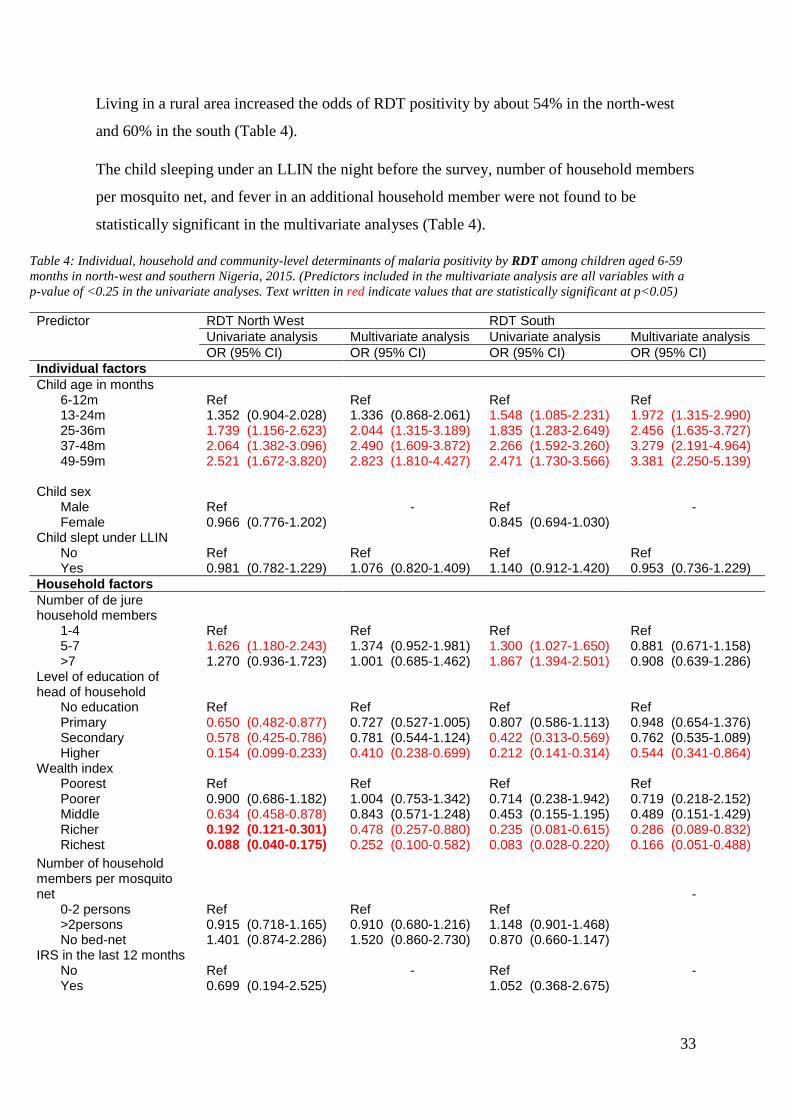
Living in a rural area increased the odds of RDT positivity by about 54% in the north-west
and 60% in the south (Table 4).
The child sleeping under an LLIN the night before the survey, number of household members
per mosquito net, and fever in an additional household member were not found to be
statistically significant in the multivariate analyses (Table 4).
Table 4: Individual, household and community-level determinants of malaria positivity by RDT among children aged 6-59
months in north-west and southern Nigeria, 2015. (Predictors included in the multivariate analysis are all variables with a
p-value of <0.25 in the univariate analyses. Text written in red indicate values that are statistically significant at p<0.05)
Predictor RDT North West RDT South
Univariate analysis Multivariate analysis Univariate analysis Multivariate analysis
OR (95% CI) OR (95% CI) OR (95% CI) OR (95% CI)
Individual factors
Child age in months 6-12m 13-24m 25-36m 37-48m 49-59m
Ref 1.352 (0.904-2.028) 1.739 (1.156-2.623) 2.064 (1.382-3.096) 2.521 (1.672-3.820)
Ref 1.336 (0.868-2.061) 2.044 (1.315-3.189) 2.490 (1.609-3.872) 2.823 (1.810-4.427)
Ref 1.548 (1.085-2.231) 1.835 (1.283-2.649) 2.266 (1.592-3.260) 2.471 (1.730-3.566)
Ref 1.972 (1.315-2.990) 2.456 (1.635-3.727) 3.279 (2.191-4.964) 3.381 (2.250-5.139)
Child sex Male Female
Ref 0.966 (0.776-1.202)
-
Ref 0.845 (0.694-1.030)
-
Child slept under LLIN No Yes
Ref 0.981 (0.782-1.229)
Ref 1.076 (0.820-1.409)
Ref 1.140 (0.912-1.420)
Ref 0.953 (0.736-1.229)
Household factors
Number of de jure household members
1-4 5-7 >7
Ref 1.626 (1.180-2.243) 1.270 (0.936-1.723)
Ref 1.374 (0.952-1.981) 1.001 (0.685-1.462)
Ref 1.300 (1.027-1.650) 1.867 (1.394-2.501)
Ref 0.881 (0.671-1.158) 0.908 (0.639-1.286)
Level of education of head of household
No education Primary Secondary Higher
Ref 0.650 (0.482-0.877) 0.578 (0.425-0.786) 0.154 (0.099-0.233)
Ref 0.727 (0.527-1.005) 0.781 (0.544-1.124) 0.410 (0.238-0.699)
Ref 0.807 (0.586-1.113) 0.422 (0.313-0.569) 0.212 (0.141-0.314)
Ref 0.948 (0.654-1.376) 0.762 (0.535-1.089) 0.544 (0.341-0.864)
Wealth index Poorest Poorer Middle Richer Richest
Ref 0.900 (0.686-1.182) 0.634 (0.458-0.878) 0.192 (0.121-0.301) 0.088 (0.040-0.175)
Ref 1.004 (0.753-1.342) 0.843 (0.571-1.248) 0.478 (0.257-0.880) 0.252 (0.100-0.582)
Ref 0.714 (0.238-1.942) 0.453 (0.155-1.195) 0.235 (0.081-0.615) 0.083 (0.028-0.220)
Ref 0.719 (0.218-2.152) 0.489 (0.151-1.429) 0.286 (0.089-0.832) 0.166 (0.051-0.488)
Number of household members per mosquito net
0-2 persons >2persons No bed-net
Ref 0.915 (0.718-1.165) 1.401 (0.874-2.286)
Ref 0.910 (0.680-1.216) 1.520 (0.860-2.730)
Ref 1.148 (0.901-1.468) 0.870 (0.660-1.147)
-
IRS in the last 12 months No Yes
Ref 0.699 (0.194-2.525)
-
Ref 1.052 (0.368-2.675)
-

34
Fever in any other household member in the last 2 weeks
No Yes
Ref 1.177 (0.905-1.530)
Ref 1.056 (0.785-1.418)
Ref 1.183 (0.965-1.451)
Ref 1.088 (0.852-1.391)
Positive RDT in an additional household member
No Yes
Ref 2.233 (1.786-2.797)
Ref 1.913 (1.478-2.480)
Ref 5.167 (4.084-6.555)
Ref 4.229 (3.248-5.524)
Community factors
Type of place of residence
Urban Rural
Ref 3.381 (2.604-4.409)
Ref 1.543 (1.060-2.241)
Ref 2.313 (1.893-2.832)
1.596 (1.236-2.063)
Cluster altitude in meters (numerical variable)
1.000 (0.999-1.000) 1.001 (1.000-1.002) 1.002 (1.001-1.002) 1.002 (1.001-1.003)
3.4 Determinants of malaria infection by microscopy Logistic regression analyses were also carried out with microscopy results as the outcome
and produced similar findings (Table 5).
There were no statistically significant differences in odds ratios obtained using RDT and
microscopy results as outcome variables (Tables 4 and 5).
Table 5: Individual, household and community-level determinants of malaria positivity by microscopy among children
aged 6-59 months in north-west and southern Nigeria, 2015. (Predictors included in the multivariate logistic
regression analysis are all variables with a p-value of <0.25 in the univariate analyses. Text written in red indicate
values that are statistically significant at p<0.05)
Predictor North West South
Univariate analysis Multivariate analysis Univariate analysis Multivariate analysis
OR (95% CI) OR (95% CI) OR (95% CI) OR (95% CI)
Individual factors
Child’s age in months
6-12m 13-24m 25-36m 37-48m 49-59m
Ref 1.452 (0.935-2.286) 1.709 (1.097-2.696) 1.655 (1.069-2.598) 2.592 (1.673-4.077)
Ref 1.291 (0.811-2.076) 1.634 (1.022-2.642) 1.570 (0.987-2.526) 2.348 (1.476-3.782)
Ref 1.086 (0.682-1.752) 1.742 (1.118-2.765) 1.866 (1.201-2.956) 1.974 (1.263-3.142)
Ref 1.198 (0.719-2.018) 2.294 (1.410-3.803) 2.454 (1.508-4.070) 2.681 (1.638-4.470)
Child’s sex Male Female
Ref 0.994 (0.794-1.244)
-
Ref 0.906 (0.703-1.165)
-
Child slept under LLIN
No Yes
Ref 0.744 (0.591-0.938)
Ref 0.775 (0.590-1.018)
Ref 1.386 (1.051-1.818)
Ref 1.193 (0.872-1.623)
Household factors
Number of de jure household members
1-4 5-7 >7
Ref 1.532 (1.102-2.140) 1.162 (0.845-1.605)
Ref 1.155 (0.795-1.682) 0.894 (0.600-1.331)
Ref 1.209 (0.892-1.653) 1.920 (1.336-2.764)
Ref 0.780 (0.552-1.106) 0.778 (0.504-1.194)

35
Level of education of head of household
No education Primary Secondary Higher
Ref 0.647 (0.472-0.882) 0.608 (0.441-0.832) 0.215 (0.130-0.341)
Ref 0.803 (0.573-1.122) 0.934 (0.646-1.348) 0.533 (0.289-0.957)
Ref 0.775 (0.532-1.134) 0.404 (0.284-0.580) 0.206 (0.120-0.342)
Ref 0.892 (0.580-1.382) 0.709 (0.469-1.082) 0.556 (0.305-0.994)
Wealth index Poorest Poorer Middle Richer Richest
Ref 0.772 (0.589-1.011) 0.547 (0.388-0.764) 0.336 (0.207-0.534) 0.094 (0.032-0.217)
Ref 0.917 (0.686-1.225) 0.867 (0.582-1.290) 0.982 (0.508-1.888) 0.362 (0.111-0.993)
Ref 0.458 (0.157-1.266) 0.238 (0.084-0.641) 0.162 (0.058-0.431) 0.039 (0.013-0.107)
Ref 0.428 (0.136-1.299) 0.255 (0.082-0.760) 0.205 (0.066-0.606) 0.074 (0.023-0.228)
Number of household members per mosquito net
0-2 persons >2persons No bednet
Ref 1.184 (0.922-1.522) 1.536 (0.960-2.456)
Ref 1.023 (0.761-1.376) 1.045 (0.596-1.830)
Ref 0.980 (0.720-1.341) 0.882 (0.622-1.251)
-
IRS in the last 12 months
No Yes
Ref 0.957 (0.244-3.365)
-
Ref 0.255 (0.014-1.230)
-
Fever in any other household member in the last 2 weeks
No Yes
Ref 1.448 (1.101-1.913)
Ref 1.229 (0.910-1.665)
Ref 1.213 (0.936-1.580)
Ref 1.112 (0.818-1.520)
Positive RDT in an additional household member
No Yes
Ref 2.050 (1.634-2.576)
Ref 1.773 (1.367-2.303)
Ref 5.323 (4.053-6.993)
Ref 4.104 (3.027-5.573)
Community factors
Type of place of residence
Urban Rural
Ref 3.340 (2.483-4.545)
Ref 2.083 (1.388-3.165)
Ref 2.328 (1.801-3.020)
Ref 1.399 (1.027-1.910)
Cluster altitude in meters (numerical variable)
0.998 (0.997-0.998) 0.998 (0.997-0.999) 1.001 (1.000-1.002) 1.001 (1.000-1.002)

36
4 Discussion It is acknowledged that factors that influence malaria transmission are complex, ranging from
micro-level peculiarities of individuals, to macro-level factors on national, international and
global scales. For practical purposes, this study was focussed only on individual and
household-level factors affecting malaria transmission. However, to emphasize the
significance of the macro-level factors and better situate the findings of this study in reality,
an ecological model was employed.
4.1 Summary of main findings The results of this study showed that the north-west study population differed significantly
from the southern population in that the north-west was more rural, with poorer housing
facilities, lower education among mothers and heads of households and a higher proportion of
the population in the “poorer” and “poorest” wealth quintiles. In spite of these differences in
background characteristics, the two groups showed a similarity in terms of the malaria
determinants that were found to be of statistical significance. In both groups, the children’s
age, level of education of the head of household, household wealth index, positive RDT in an
additional household member, and place of residence were found to be significant
determinants of malaria infection. There were no statistically significant differences observed
between odds ratios obtained using RDT results as outcome variable compared to those
obtained by microscopy.
4.2 Age This study found that an older age was significantly associated with higher odds of malaria
infection in both populations, with a trend of increasing odds with higher age seen in the
north-west (RDT) and southern populations (RDT and microscopy). These findings are in
line with those of other researchers that have studied malaria determinants in under-5
populations (23-25). Roberts and Matthews in Uganda (2016) who studied the association
using the child’s age as a numerical predictor found similar results, with the odds of malaria
infection increasing by about 3% with every month of increase in the children’s age (OR
1.028, 95 % CI 1.023–1.033) (50).
It has been suggested that the youngest children are often protected from malaria by acquired
immunity from their mothers, and that this acquired immunity gradually fades as the children
grow (8, 51, 52). This explanation, coupled with the likelihood of a more proactive attitude
towards malaria prevention among caregivers for the youngest children may explain why the
older ones tend to be more susceptible to malaria infection.

37
4.3 Education, household wealth and place of residence Level of education of the head of household, household wealth, and place of residence (urban
or rural) are quite intricately interlinked, and were all found to be significantly associated
with malaria infection in the children from both populations. These findings are similar to
those of some other studies (23, 24, 26-28, 30-32).
Although the interaction between these factors can often go both ways, the socio-economic
status or wealth index probably plays the most central role, acting as the “umbrella factor” for
the others. Dickinson et al (2012) suggested three pathways through which individual and
household socio-economic status relate to malaria and subsequent health status (53). The first
pathway was that of socio-economic status affecting access to malaria prevention, the second
was that of SES being a fundamental cause of malaria, through for example poor housing
quality and increased psychological stress, which is linked to lower immunity and subsequent
susceptibility to infection. The third pathway they proposed was that of socio-economic
status affecting “access to accurate diagnosis and effective malaria treatment” (53).
The role of socio-economic development in malaria transmission cannot be overemphasised.
Sachs and Malaney in 2002 highlighted a “striking and unmistakable correlation between
malaria and poverty” at national level (54). Moreover, improved socio-economic
circumstances has been listed as one of the major driving forces for success among the 34
malaria-eliminating countries between 2000 and 2010 (55).
This study showed marked socio-economic differences between the north-west and southern
populations. It goes without saying that these inherent differences may be the main
underlying factor responsible for the delayed progress in malaria outcomes in the north-west,
and progress may remain slow as long as the social circumstances of the north-westerners
remain poor.
4.4 Positive RDT in an additional household member Having an additional household member that tested positive to malaria by RDT increased the
odds of being malaria infected in both study populations. This predictor was the only one for
which an appreciable difference in the strength of association was seen between the north-
west and southern populations. The odds of being malaria-positive were more than four times
higher in the southern population for individuals with an additional household member being
RDT-positive when compared to those who had no other RDT-positive household member.

38
In the north-west, the increase in odds was more modest at 77 to 91 percent by microscopy
and RDT respectively.
It has been said concerning malaria that “as transmission declines, it often becomes
increasingly focal” (56), with the majority of cases being more and more concentrated among
certain high risk geographical areas (“hotspots”) (56, 57) and population groups (“hotpops”)
(55-57). Malaria hotspots exist in both high and low transmission settings, but are perhaps
more discernible in low transmission settings (57). In settings where malaria transmission is
moderate to high on the other hand, the hotspots being greater in number often appear to
coalesce, presenting a more homogenous picture of malaria transmission (56).
Pongvongsa et al (2016) in a relatively low malaria transmission setting in Lao Peoples’
Democratic Republic (Lao PDR), demonstrated household clustering of malaria infections in
their study of 870 individuals from 236 households in 10 villages (41). Malaria prevalence in
their study was 6% (78.8% attributed to P. falciparum), and they reported an odds ratio of
24.33 (95%CI: 10.15-58.32) for the association between malaria infection in participants and
having an additional RDT-positive household member. In their study, only 40 households had
at least one infected member, and of these, nine households were responsible for 40% of all
malaria infections (41). Although malaria transmission is high in Nigeria compared to the
study setting in Lao PDR, this thesis highlights trends that suggest similarities between the
two studies- malaria household clustering was more obvious in the south where malaria
transmission is lower. These results suggest that Nigeria, though yet to achieve malaria
control, may be experiencing a gradual positive shift in malaria epidemiology.
Rulisa et al in Rwanda (2013) found that “having malaria among health centre attendees was
significantly predictive of finding at least one malaria-infected case among his or her
household members (OR = 2.4, P value - 0.001)” (58). In their study, they proposed health
facility-based passive case identification combined with active detection of malaria in
household members as a feasible means of identifying malaria hotspots within communities
(58). This suggested facility-based “reactive case detection” (RACD) (56) method would
involve a high cost in tracing contacts of each diagnosed malaria case, and for this reason, it
has been suggested to be better suited for low transmission settings, or targeted at high risk
areas where resources are limited (56).
A less demanding, but also less explored strategy that has been suggested is “targeted
massive drug administration” (tMDA) (56), an approach whereby household members and

39
neighbours of individuals diagnosed with malaria are treated without necessarily being tested
for malaria. This strategy is particularly worthy of exploration, as it may circumvent the
problem of conventional diagnostic tools failing to detect sub-patent parasitemia (56).
Björkman et al (2017) in Zanzibar screened 5,278 individuals for malaria and found that
0.2% of the population were malaria positive by RDT, and 2.3% by PCR (59). In their study,
the PCR-diagnosed cases tended to be clustered around RDT-positive cases, living in the
same household (OR= 7.4, 95% CI: 2.8–19.9), or within a 300m radius (OR=1.64; 95% CI:
1.0–2.8; P = .06) (59). This suggests that in the absence of more sensitive diagnostic tools,
tMDA based on RDT-detected cases may be a potentially beneficial strategy in malaria
elimination.
Malaria transmission in Nigeria is still moderate to high, and the country currently adopts a
passive malaria surveillance strategy, based on diagnosis and treatment of individuals who
themselves present for care at health facilities. Although RACD and tMDA appear promising,
these strategies would obviously be considered too capital and labour-intensive to be carried
out successfully in present-day Nigeria. They may however be considered as later steps
towards malaria elimination as transmission declines.
A more practical approach in Nigeria may be to build upon existing net distribution
campaigns, by including a health facility-based component. Individuals who are found to be
malaria-positive at health centres may be given several LLINs for members of their
households as part of malaria “treatment”. This strategy may better help to target LLIN
distribution to areas where they are most needed, and may improve compliance with regular
LLIN use. Furthermore, it may even serve as incentive for neighbours to report to health
centres for screening and obtaining LLINs.
4.5 Number of de-jure household members The number of household residents was not found to be associated with malaria positivity in
either population. In theory, the odds of malaria infection in household members are said to
increase with increasing numbers of household occupants due to increased levels of emitted
human volatiles that attract mosquitoes (60). Studies have however shown mixed findings,
with some corroborating this hypothesis (24, 28), and others not being able to demonstrate
statistical significance (32, 41). There remains a need for clarity on the subject, especially as
it may have implications for malaria transmission in dwellings such as prisons, barracks and
boarding school dormitories which often house large numbers of occupants at the same time.

40
4.6 Bed-nets Insecticide treated bed nets have been said to be “a highly prominent and effective malaria
control measure particularly in high endemic areas” (61). However, this study was unable to
demonstrate a significant association between bed-net ownership or use with malaria
infection.
The north-western population, though reporting significantly higher bed-net ownership and
use, had a higher malaria prevalence than the south. It is possible that the relationship
between bed-net use and malaria status may be such that it is the malaria transmission
intensity that influences the level of adherence to bed-net use, rather than the other way
round. The high malaria transmission in the north-west may mean that members of this
population are likely to have witnessed more malaria morbidities and deaths, and may
therefore be more “on their toes” regarding malaria prevention measures compared to the
population in the south, where malaria risk perception may be lower.
Other possible reasons why an association was not seen may have been the lack of
information on consistency of bed-net use and failure to link available data on the integrity of
the individual bed-nets to the children who had slept under them.
That being said, the inability of this study to demonstrate a significant protective association
with LLIN use may be an indicator that LLINs, though proven to be effective may not be
sufficient if malaria control is to be expedited. LLINs are typically protective indoors, but
factors such as inconvenience experienced in setting up (62), entering and exiting the bed-
nets (62, 63), discomfort associated with heat (62-64), and low malaria risk perception (63,
64) have been shown to contribute to a lack of consistency in their use. In addition, it has
been suggested that changing feeding habits of mosquitoes to favour outdoor biting may also
limit the protective capacity of mosquito nets (28). Individuals residing in rural areas are at
particular risk of exposure to outdoor biting, as factors such as the absence of electricity for
indoor lighting and the discomfort of indoor heat may force individuals to stay out longer at
dusk, or even sleep outside (62). Furthermore, the absence of toilet facilities at home, or
outdoor toilet facilities with rudimentary walls and roofing may also expose individuals to
mosquito bites.
4.7 Indoor Residual Spraying (IRS) IRS coverage in both populations was low, and this may largely account for why a significant
association was not seen with malaria outcomes. Several similar studies that have

41
investigated the association of IRS with malaria infection suffer from the same set-back and
have not been able to show any statistical significant association (23, 35, 40). According to a
Cochrane review, IRS had a protective effect in areas with unstable malaria transmission, but
its role in areas with stable transmission was not clear due to an inadequate number of trials
(65). Nevertheless, as IRS has proved to be an effective tool in the past, it is currently being
promoted as more countries commit to malaria elimination efforts.
4.8 Diagnostic tools
4.8.1 Malaria prevalence
Malaria prevalence by RDT in the north-west and south was 55.8% and 29.2%, respectively
(37.0% and 14.9%, respectively by microscopy). It is recognised that these are likely
underestimated values, as the diagnostic tools used are not sufficiently capable of detecting
infection at very low parasitemia levels (11) (that is, sub-patent infections at less than 50-100
parasites per microliter of blood). However, since malaria transmission is still relatively high
in Nigeria, the malaria prevalence figures obtained by microscopy may be assumed to be
fairly close to the truth, as the sensitivity is likely to be higher in high transmission settings
(12), where sub-patent infections probably play a less significant role in malaria transmission
(12, 56, 66).
Sub-patent infections account for up to 20-50% of human-to-mosquito transmissions in very
low transmission settings (66). However, in high transmission settings such as in many parts
of Nigeria, there is a likelihood of “more frequent reinfection, higher multiplicity of infection,
and lower rates of symptoms and treatment per infection” (12), which may mean that most
infections in these settings are likely to be of higher parasitemia levels that would be
detectable by RDT and microscopy.
Okell et al (2009) in a systematic review found that “in studies where the PCR prevalence in
the study population was <10%, microscopy detected only 12.0% of the infections that were
identified by PCR (95% CI, 4.8%–29.9%), whereas in studies in which the PCR prevalence
was ⩾75%, microscopy detected 74.5% of infections (95% CI, 67.1%–82.8%)” (12).
Although they did not investigate RDT, they proposed that the results would likely have been
similar to their findings on microscopy, since both tools were similar in sensitivity.
An additional reason why the malaria prevalence figures obtained in this study may be
believable despite the absence of PCR diagnosis has to do with the age group of the study
population. A higher age has been linked with lower parasite densities, with sub-microscopic

42
infections tending to be more common in adults (66). Because only children were tested for
malaria in this study, it is more likely that the parasitemia levels were high enough to have
been detected by microscopy or RDT.
4.8.2 Cross-sectional studies, an opportunity for HRP-2-based RDTs
The RDT brand used in this study detects histidine rich protein-2 (HRP-2), an antigen
produced by P. falciparum (14). While HRP-2-based RDTs are found to be highly sensitive
compared to pLDH-based RDTs, a drawback commonly associated with them is the
persistent HRP-2 antigenemia after malaria treatment (14). It has been demonstrated in a
number of studies, that, several weeks after successful completion of malaria treatment,
individuals continued to test positive by HRP-2-based RDTs (67, 68). This is often regarded
as a limitation, contributing to false positive results (67, 69), and making these types of RDTs
unsuitable for monitoring therapeutic response (14), or detecting recurrent infections within a
short space of time (68).
It has been suggested that cross sectional studies could play a more important role in
identifying malaria hotspots if the malaria diagnostic tools used in such surveys were capable
of identifying recent past as well as ongoing infection (4). Thus, a potential advantage exists
for the use of HRP-2-based RDTs in studies such as this, where it is important to identify not
just current infection, but also to give evidence of recent past exposure to malaria infection.
Initial host parasite density may be associated with the eventual duration of persistence of
HRP-2 antigens after treatment (67). This implies that using HRP-2-based RDTs for these
types of surveys may be better suited for areas of moderate to high transmission, where
parasitemia levels are assumed to be generally higher.
4.8.3 Microscopy-positive, RDT-negative results
RDT sensitivity can be comparable to that of quality field microscopy. However in this study,
8.7% (n=115) of all malaria infections (diagnosed by either or both tools) were missed by
RDT. A proportion of these missed diagnoses may have been as a result of the use of an
HRP-2-specific RDT for the study, which, being capable of detecting only P. falciparum,
would have failed to detect non-falciparum infections.
Other common explanations for false negative RDT results include problems with product
design or quality (19), antibody degradation due to poor transport or storage conditions (19),
operator errors (19, 70), and extremes of host parasite density (very low or very high parasite
load) (19). Very low density parasitemia has been mentioned as a likely cause of microscopy-

43
positive, RDT-negative results (71), as expert microscopy may still be able to identify
parasites below RDT threshold (10, 71). The effect seen with extremely high parasite
densities, known as the “prozone effect”, is a phenomenon whereby false-negative results are
observed in antigen-antibody immunological reactions, due to an excess of either antigens or
antibodies (72).
Another possible explanation could be the failure of the parasites to express the P. falciparum
HRP-2 and, or HRP-3 antigens (19). Evidence for these gene deletions is strongest in South
America (19), but there have been reports, albeit at lower prevalence, in west Africa (Senegal
(73) and Mali(74)), and more recently in central east Africa (Rwanda) (71). Though evidence
for the occurrence of such parasite strains in Nigeria is lacking, the possibility should not be
completely ruled out. However, being a moderate to high malaria transmission setting, the
greater probability of high parasite densities (19, 71) and high rates of co-infection with
multiple strains (19, 71, 74) in Nigeria would make this an unlikely major cause for false
negative HRP-2-based RDT results.
Finally, a possible cause for the discrepancy could be false positive microscopy results, due
for example to the presence of artefacts which may be difficult for even expert microscopists
to differentiate from malaria parasites (11). The likelihood for this in this study is however
low, due to slide verification that was carried out in the 2015 NMIS.
4.8.4 Malaria diagnostic tools for population-based surveys
Although malaria prevalence in this study differed with diagnostic tool, there were no
statistically significant differences in odds ratios obtained by logistic regression analysis
using either tool as outcome, and the determinants that were shown to be statistically
significant were the same. This suggests that for population-based studies in malaria
transmission settings such as this, where the sensitivity of these tools are judged to be high
and resources are limited, one of these two diagnostic tools may be sufficient.
Faced with a choice between the two tools for such studies, RDTs appear gain the upper
hand, as they are less labour intensive, less time consuming, provide on-the-spot results
enabling the immediate treatment of individuals that test positive, give less room for
vulnerability to human errors due to fatigue, and offer the additional advantage of giving
evidence of current as well as recent past exposure to malaria infection. Relying solely on
RDTs for population-based studies should however be with caution for reasons earlier
mentioned. There is a need for mapping of relevant gene deletions, and proper training of

44
field workers to avoid operator errors. To guard against the influence of manufacturer errors,
microscopy may be performed alongside for a smaller proportion of randomly selected
participants as a form of quality control.
In low transmission settings, due to the higher proportion of low density parasitemia, there is
still a need for a combination of diagnostic tools, albeit more sensitive ones, as many factors
affecting transmission dynamics are still unknown, and the identification of the very last
cases is crucial.
4.9 Seasonal influences There was a lack of data on the climatic conditions in the various regions at the time of the
survey, and this makes it challenging to make inferences on the effect that seasonality may
have had on the results of this study.
The rainy season in Nigeria is usually between April and October, but is shorter in the north,
with the north-west typically experiencing delayed onset and early cessation of rains (75).
The 2015 NMIS was conducted in October and November, and it is likely that this may have
been a transition period from the end of the rainy season to the start of the dry season.
Evidence from data on rainfall in Nigeria gathered over a 90-year period suggests that the dry
season sets in in the north in October, while the south is still experiencing considerable
rainfall; and that the rains start to decline in the south in November, by which time the dry
season is well under way in the north, with almost no precipitation (76).
If these assumptions hold true, it may be inferred that there were seasonal differences
between the regions at the time of the survey, such that the south was experiencing
considerably more rainfall than the north. This would imply that differences in malaria
prevalence between north-west and south observed in this study may have been dampened, so
that more glaring differences may have been observed if the rainfall in the north had been
comparable to that in the south. It could be suggested that for better comparison, and for
clearer trends to be seen, perhaps future surveys could be carried out in the dry season.
4.10 Limitations and strengths Malaria transmission is complex, and transmission intensity can vary significantly, between
regions, communities, and even households. Attempting to study malaria transmission on a
national scale would no doubt mask some of the subtleties in malaria transmission dynamics
at lower levels. However, such large-scale studies, taking advantage of a large and nationally-
representative sample size, bring to light socio-demographic trends that are vital to malaria

45
transmission, but which may not be appreciated in smaller scale studies. Because the 2015
NMIS was based on data gathered by two-step cluster sampling, it is acknowledged that this
study would have benefitted from more advanced analytical methods that take into account
the effect of cluster.
It is known that asymptomatic malaria infection plays a significant role in malaria
transmission, and to get a clear picture of malaria transmission, it is important that persons in
all age groups should be tested. In the 2015 NMIS however, only under-5 children were
tested for malaria. An attempt was made in this study to capture the influence of possible
malaria infection in older persons by using the history of fever in other household members
as proxy, but this was not found to be a statistically significant determinant of malaria
infection. This could have been as a result of a high proportion of asymptomatic infections in
the older age groups.
Another limitation was that apart from data on altitude, other data on climatic and
environmental conditions such as rainfall, humidity and temperature (which are commonly
adjusted for in similar studies) were not available and so were not considered in the statistical
models. However, because the geographical areas with likely climatic differences were
considered separately in this study, the inclusion of these variables in the models is unlikely
to have significantly altered the results.
As earlier mentioned, the reliance in this study on RDT and microscopy for malaria diagnosis
means that a proportion of participants with sub-patent infections may have been missed, and
therefore, the malaria prevalence figures obtained in this study are likely to have been
underestimated.
Finally, as this was a cross-sectional study, no assumption of causality can be made.
The strengths of this study include its low cost and the use of high quality data with a
nationally representative sample. Studying separately the areas at the extremes of malaria
transmission makes this study generalizable to Nigeria, as well as other sub-Saharan African
countries with malaria transmission intensity within this range. Comparing malaria
determinants in different geopolitical zones as done in this study enabled the underlining of
the socio-economic disadvantage of the North West geopolitical zone, an issue that may have
policy implications. Finally, the separate analyses done using the two malaria diagnostic tools
has important implications for cost-saving in future surveys.
46
5 Conclusion The determinants of malaria infection were similar in north-west and southern Nigeria,
irrespective of the diagnostic tool used. However, poorer social circumstances were observed
in the north-west, and may account for the delayed progress in malaria control in the region.
There may therefore be a need to intensify malaria control efforts, particularly in the north-
west, while awaiting socio-economic development.
6 Acknowledgements I wish to acknowledge the Demographic and Health Surveys (DHS) Program for providing
free access to the data used for this study.
I thank all my teachers at various stages in the master’s programme, particularly Andreas
Mårtensson and Carina Källestål who provided support and guidance throughout the writing
process, and Lars Åke Persson for his constructive feedback.
I am grateful to my colleagues, all of whom I have had the privilege of working with and
learning from at different points in the master’s programme. Special thanks to Anna
Backlund, Helen Sandegård, Ida Enskär, Lisa Umlauff, Marcella Olaya Bucaro, Ninnie
Abrahamsson, and Paula Andrea Moreno Gutierrez (members of the thesis discussion group
to which I belonged), for their critique and positive contribution throughout the writing
process.
Finally, I would like to thank my family and friends for their support.

47
References
1. WHO. World Malaria Report 2015 [Internet]. [cited 2017 Apr 5]. Available from:
http://apps.who.int/iris/bitstream/10665/200018/1/9789241565158_eng.pdf.
2. WHO. World Malaria Report 2016 [Internet]. [cited 2017 Apr 17]. Available from:
http://apps.who.int/iris/bitstream/10665/252038/1/9789241511711-eng.pdf?ua=1.
3. WHO. Malaria fact sheet [Internet]. 2016 [cited 2017 Mar 24]. Available from:
http://www.who.int/mediacentre/factsheets/fs094/en/.
4. Tanner M, Greenwood B, Whitty CJM, Ansah EK, Price RN, Dondorp AM, et al.
Malaria eradication and elimination: Views on how to translate a vision into reality. BMC
Medicine. 2015;13(1).
5. Moonen B, Shiff C. Should we commit to eradicating malaria worldwide? BMJ.
2017;356.
6. WHO. Global technical strategy for malaria 2016-2030 [Internet]. [cited 2017 Jan
15]. Available from:
http://apps.who.int/iris/bitstream/10665/176712/1/9789241564991_eng.pdf?ua=1&ua=1.
7. Singh R, Godson II, Singh S, Singh RB, Isyaku NT, Ebere UV. High prevalence of
asymptomatic malaria in apparently healthy schoolchildren in Aliero, Kebbi state, Nigeria.
Journal of Vector Borne Diseases. 2014;51(2):128-32.
8. Strøm GE, Tellevik MG, Fataki M, Langeland N, Blomberg B. No asymptomatic
malaria parasitaemia found among 108 young children at one health facility in Dar es
Salaam, Tanzania. Malaria Journal. 2013;12(1).
9. Owusu EDA, Buabeng V, Dadzie S, Brown CA, Grobusch MP, Mens P.
Characteristics of asymptomatic Plasmodium spp. parasitaemia in Kwahu-Mpraeso, a malaria
endemic mountainous district in Ghana, West Africa. Malaria Journal. 2016;15(1).
10. Tangpukdee N, Duangdee C, Wilairatana P, Krudsood S. Malaria Diagnosis: A Brief
Review. The Korean Journal of Parasitology. 2009;47(2):93-102.
11. Wongsrichanalai C, Barcus MJ, Muth S, Sutamihardja A, Wernsdorfer WH. A review
of malaria diagnostic tools: Microscopy and rapid diagnostic test (RDT). American Journal of
Tropical Medicine and Hygiene. 2007;77(SUPPL. 6):119-27.
12. Okell LC, Ghani AC, Lyons E, Drakeley CJ. Submicroscopic infection in
plasmodium falciparum-endemic populations: A systematic review and meta-analysis.
Journal of Infectious Diseases. 2009;200(10):1509-17.
13. Payne D. Use and limitations of light microscopy for diagnosing malaria at the
primary health care level. Bulletin of the World Health Organization. 1988;66(5):621-6.
14. Moody A. Rapid Diagnostic Tests for Malaria Parasites. Clinical Microbiology
Reviews. 2002;15(1):66-78.
15. WHO. Malaria Rapid Diagnostic Tests [Internet]. 2016 [cited 2017 Apr 19].
Available from: http://www.who.int/malaria/areas/diagnosis/rapid_diagnostic_tests/en/.
16. McCutchan TF, Piper RC, Makler MT. Use of malaria rapid diagnostic test to identify
Plasmodium knowlesi infection. Emerging Infectious Diseases. 2008;14(11):1750-2.
17. WHO. Malaria Rapid Diagnostic Test Performance. Results of WHO product testing
of malaria RDTs: Round 3 (2010-2011) [Internet]. [cited 2017 Apr 19]. Available from:
http://www.who.int/tdr/publications/documents/rdt3.pdf.
18. Abba K, Deeks JJ, Olliaro P, Naing CM, Jackson SM, Takwoingi Y, et al. Rapid
diagnostic tests for diagnosing uncomplicated P. falciparum malaria in endemic countries.
Cochrane database of systematic reviews (Online). 2011(7).
48
19. Cheng Q, Gatton ML, Barnwell J, Chiodini P, McCarthy J, Bell D, et al. Plasmodium
falciparum parasites lacking histidine-rich protein 2 and 3: A review and recommendations
for accurate reporting. Malaria Journal. 2014;13(1).
20. WHO. Malaria Preventive Therapies [Internet]. 2017 [cited 2017 April 19]. Available
from: http://www.who.int/malaria/areas/preventive_therapies/en/.
21. National Malaria Elimination Programme (NMEP), National Population Commission
(NPopC), National Bureau of Statistics (NBS) and ICF International. Nigeria Malaria
Indicator Survey 2015. Abuja, Nigeria, and Rockville, Maryland, USA: 2016.
22. Onwujekwe O, Uguru N, Etiaba E, Chikezie I, Uzochukwu B, Adjagba A. The
Economic Burden of Malaria on Households and the Health System in Enugu State Southeast
Nigeria. PLOS ONE. 2013;8(11):e78362.
23. Gosoniu L, Msengwa A, Lengeler C, Vounatsou P. Spatially explicit Burden
estimates of malaria in Tanzania: Bayesian geostatistical modeling of the malaria indicator
survey data. PLoS ONE. 2012;7(5).
24. Samadoulougou S, Maheu-Giroux M, Kirakoya-Samadoulougou F, De Keukeleire M,
Castro MC, Robert A. Multilevel and geo-statistical modeling of malaria risk in children of
Burkina Faso. Parasites and Vectors. 2014;7(1).
25. Ferrari G, Ntuku HMT, Ross A, Schmidlin S, Kalemwa DM, Tshefu AK, et al.
Identifying risk factors for Plasmodium infection and anaemia in Kinshasa, Democratic
Republic of Congo. Malaria Journal. 2016;15(1).
26. Kepha S, Nikolay B, Nuwaha F, Mwandawiro CS, Nankabirwa J, Ndibazza J, et al.
Plasmodium falciparum parasitaemia and clinical malaria among school children living in a
high transmission setting in western Kenya. Malaria Journal. 2016;15(1).
27. Khaireh BA, Briolant S, Pascual A, Mokrane M, MacHault V, Travaillé C, et al.
Plasmodium vivax and Plasmodium falciparum infections in the Republic of Djibouti:
Evaluation of their prevalence and potential determinants. Malaria Journal. 2012;11.
28. Kateera F, Mens PF, Hakizimana E, Ingabire CM, Muragijemariya L, Karinda P, et al.
Malaria parasite carriage and risk determinants in a rural population: A malariometric survey
in Rwanda. Malaria Journal. 2015;14(1).
29. Haque U, Sunahara T, Hashizume M, Shields T, Yamamoto T, Haque R, et al.
Malaria prevalence, risk factors and spatial distribution in a Hilly forest area of Bangladesh.
PLoS ONE. 2011;6(4).
30. Baragatti M, Fournet F, Henry MC, Assi S, Ouedraogo H, Rogier C, et al. Social and
environmental malaria risk factors in urban areas of Ouagadougou, Burkina Faso. Malaria
Journal. 2009;8(1).
31. Ndiath M, Faye B, Cisse B, Ndiaye JL, Gomis JF, Dia AT, et al. Identifying malaria
hotspots in Keur Soce health and demographic surveillance site in context of low
transmission. Malaria Journal. 2014;13(1).
32. Dawaki S, Al-Mekhlafi HM, Ithoi I, Ibrahim J, Atroosh WM, Abdulsalam AM, et al.
Is Nigeria winning the battle against malaria? Prevalence, risk factors and KAP assessment
among Hausa communities in Kano State. Malaria Journal. 2016;15(1).
33. Jenkins R, Omollo R, Ongecha M, Sifuna P, Othieno C, Ongeri L, et al. Prevalence of
malaria parasites in adults and its determinants in malaria endemic area of Kisumu County,
Kenya. Malaria Journal. 2015;14(1).
34. Woyessa A, Deressa W, Ali A, Lindtjørn B. Malaria risk factors in Butajira area,
south-central Ethiopia: A multilevel analysis. Malaria Journal. 2013;12(1).
35. Coalson JE, Walldorf JA, Cohee LM, Ismail MD, Mathanga D, Cordy RJ, et al. High
prevalence of Plasmodium falciparum gametocyte infections in school-age children using
molecular detection: patterns and predictors of risk from a cross-sectional study in southern
Malawi. Malaria Journal. 2016;15(1):1-17.

49
36. Sifft KC, Geus D, Mukampunga C, Mugisha JC, Habarugira F, Fraundorfer K, et al.
Asymptomatic only at first sight: malaria infection among schoolchildren in highland
Rwanda. Malaria Journal. 2016;15(1):1-10.
37. Kaur G. Predictors of malaria among Malaysian aborigines. Asia-Pacific Journal of
Public Health. 2009;21(2):205-15.
38. Baidjoe AY, Stevenson J, Knight P, Stone W, Stresman G, Osoti V, et al. Factors
associated with high heterogeneity of malaria at fine spatial scale in the Western Kenyan
highlands. Malaria Journal. 2016;15(1).
39. Abate A, Degarege A, Erko B. Community knowledge, attitude and practice about
malaria in a low endemic setting of Shewa Robit Town, northeastern Ethiopia. BMC public
health. 2013;13(1).
40. Pinchoff J, Chaponda M, Shields TM, Sichivula J, Muleba M, Mulenga M, et al.
Individual and household level risk factors associated with malaria in Nchelenge District, a
region with perennial transmission: A serial cross-sectional study from 2012 to 2015. PLoS
ONE. 2016;11(6).
41. Pongvongsa T, Nonaka D, Iwagami M, Nakatsu M, Phongmany P, Nishimoto F, et al.
Household clustering of asymptomatic malaria infections in Xepon district, Savannakhet
province, Lao PDR. Malaria Journal. 2016;15(1).
42. Gebbie KM, Rosenstock L, Hernandez LM. Who will keep the public healthy?
Educating public health professionals for the 21st century. Washington, D.C: National
Academy Press; 2003.
43. CDC. The Social-Ecological Model: A Framework for Prevention [Internet]. 2015
[cited 2017 April 19]. Available from:
https://www.cdc.gov/violenceprevention/overview/social-ecologicalmodel.html.
44. USAID. Malaria Indicator Survey overview [Internet]. [cited 2017 Apr 10].
Available from: http://dhsprogram.com/What-We-Do/Survey-Types/MIS.cfm.
45. National Population Commission (NPC) [Nigeria], National Malaria Control
Programme (NMCP) [Nigeria], and ICF International. Nigeria Malaria Indicator Survey
2010. Abuja, Nigeria: 2012.
46. National Population Commission. Nigeria's population now 182 million [Internet].
2017 [cited 2017 Feb 2]. Available from: http://www.population.gov.ng/index.php/80-
publications/216-nigeria-s-population-now-182-million-dg-npopc.
47. Wikipedia. Geography of Nigeria [Internet]. 2017 [cited 2017 Feb 2]. Available from:
https://en.wikipedia.org/wiki/Geography_of_Nigeria.
48. WHO. World Health Statistics 2015 [Internet]. [cited 2017 Apr 14]. Available from:
http://apps.who.int/iris/bitstream/10665/170250/1/9789240694439_eng.pdf?ua=1&ua=1.
49. USAID. President's Malaria Initiative Nigeria Malaria Operational Plan FY 2015
[Internet]. [cited 2017 Apr 10]. Available from: https://www.pmi.gov/docs/default-
source/default-document-library/malaria-operational-plans/fy-15/fy-2015-nigeria-malaria-
operational-plan.pdf?sfvrsn=6.
50. Roberts D, Matthews G. Risk factors of malaria in children under the age of five years
old in Uganda. Malaria Journal. 2016;15(1).
51. Snow RW, Nahlen B, Palmer A, Donnelly CA, Gupta S, Marsh K. Risk of severe
malaria among African infants: Direct evidence of clinical protection during early infancy.
Journal of Infectious Diseases. 1998;177(3):819-22.
52. Sitali L, Chipeta J, Miller JM, Moonga HB, Kumar N, Moss WJ, et al. Patterns of
mixed Plasmodium species infections among children six years and under in selected malaria
hyper-endemic communities of Zambia: Population-based survey observations. BMC
Infectious Diseases. 2015;15(1).

50
53. Dickinson KL, Randell HF, Kramer RA, Shayo EH. Socio-economic status and
malaria-related outcomes in Mvomero District, Tanzania. Global Public Health.
2012;7(4):384-99.
54. Sachs J, Malaney P. The economic and social burden of malaria. Nature.
2002;415(6872):680-5.
55. Cotter C, Sturrock HJW, Hsiang MS, Liu J, Phillips AA, Hwang J, et al. The
changing epidemiology of malaria elimination: New strategies for new challenges. The
Lancet. 2013;382(9895):900-11.
56. Sturrock HJW, Hsiang MS, Cohen JM, Smith DL, Greenhouse B, Bousema T, et al.
Targeting Asymptomatic Malaria Infections: Active Surveillance in Control and Elimination.
PLoS Medicine. 2013;10(6).
57. Bousema T, Griffin JT, Sauerwein RW, Smith DL, Churcher TS, Takken W, et al.
Hitting hotspots: Spatial targeting of malaria for control and elimination. PLoS Medicine.
2012;9(1).
58. Rulisa S, Kateera F, Bizimana JP, Agaba S, Dukuzumuremyi J, Baas L, et al. Malaria
Prevalence, Spatial Clustering and Risk Factors in a Low Endemic Area of Eastern Rwanda:
A Cross Sectional Study. PLoS ONE. 2013;8(7).
59. Björkman A, Cook J, Sturrock H, Msellem M, Ali A, Xu W, et al. Spatial Distribution
of Falciparum Malaria Infections in Zanzibar: Implications for Focal Drug Administration
Strategies Targeting Asymptomatic Parasite Carriers. Clinical Infectious Diseases.
2017;64(9):1236-43.
60. Takken W, Knols BGJ. Odor-mediated behavior of Afrotropical malaria mosquitoes.
Annual Review of Entomology1999. p. 131-57.
61. Lengeler C. Insecticide-treated bed nets and curtains for preventing malaria. Cochrane
database of systematic reviews (Online). 2004(2).
62. Galvin KT, Petford N, Ajose F, Davies D. An exploratory qualitative study on
perceptions about mosquito bed nets in the Niger Delta: what are the barriers to sustained
use? Journal of Multidisciplinary Healthcare. 2011;4:73-83.
63. Koenker HM, Loll D, Rweyemamu D, Ali AS. A good night's sleep and the habit of
net use: Perceptions of risk and reasons for bed net use in Bukoba and Zanzibar. Malaria
Journal. 2013;12(1).
64. Ingabire CM, Rulisa A, Van Kempen L, Muvunyi C, Koenraadt CJM, Van Vugt M, et
al. Factors impeding the acceptability and use of malaria preventive measures: implications
for malaria elimination in eastern Rwanda. Malaria Journal. 2015;14(1):136.
65. Pluess B, Tanser FC, Lengeler C, Sharp BL. Indoor residual spraying for preventing
malaria. Cochrane database of systematic reviews (Online). 2010;4.
66. Okell LC, Bousema T, Griffin JT, Ouédraogo AL, Ghani AC, Drakeley CJ. Factors
determining the occurrence of submicroscopic malaria infections and their relevance for
control. Nature Communications. 2012;3:1237.
67. Swarthout TD, Counihan H, Senga RKK, van den Broek I. Paracheck-Pf® accuracy
and recently treated Plasmodium falciparum infections: is there a risk of over-diagnosis?
Malaria Journal. 2007;6(1):58.
68. Aydin-Schmidt B, Mubi M, Morris U, Petzold M, Ngasala BE, Premji Z, et al.
Usefulness of Plasmodium falciparum-specific rapid diagnostic tests for assessment of
parasite clearance and detection of recurrent infections after artemisinin-based combination
therapy. Malaria Journal. 2013;12(1):349.
69. Abeku TA, Kristan M, Jones C, Beard J, Mueller DH, Okia M, et al. Determinants of
the accuracy of rapid diagnostic tests in malaria case management: evidence from low and
moderate transmission settings in the East African highlands. Malaria Journal. 2008;7(1):202.

51
70. Shakely D, Elfving K, Aydin-Schmidt B, Msellem MI, Morris U, Omar R, et al. The
usefulness of rapid diagnostic tests in the new context of low malaria transmission in
Zanzibar. PloS one. 2013;8(9).
71. Kozycki CT, Umulisa N, Rulisa S, Mwikarago EI, Musabyimana JP, Habimana JP, et
al. False-negative malaria rapid diagnostic tests in Rwanda: impact of Plasmodium
falciparum isolates lacking hrp2 and declining malaria transmission. Malaria Journal.
2017;16(1).
72. Gillet P, Mori M, Van Esbroeck M, Ende JVd, Jacobs J. Assessment of the prozone
effect in malaria rapid diagnostic tests. Malaria Journal. 2009;8(1):271.
73. Wurtz N, Fall B, Bui K, Pascual A, Fall M, Camara C, et al. Pfhrp2 and pfhrp3
polymorphisms in Plasmodium falciparum isolates from Dakar, Senegal: Impact on rapid
malaria diagnostic tests. Malaria Journal. 2013;12(1).
74. Koita OA, Doumbo OK, Ouattara A, Tall LK, Konaré A, Diakité M, et al. False-
negative rapid diagnostic tests for malaria and deletion of the histidine-rich repeat region of
the hrp2 gene. American Journal of Tropical Medicine and Hygiene. 2012;86(2):194-8.
75. Ekpoh IJ, Nsa E. Extreme Climatic Variability in North-western Nigeria: An Analysis
of Rainfall Trends and Patterns. Journal of Geography and Geology. 2011;3(1).
76. Ogungbenro SB, Morakinyo TE. Rainfall distribution and change detection across
climatic zones in Nigeria. Weather and Climate Extremes. 2014;5–6:1-6.

52
Annexe 1: Description of methods for derivation of variables
Table 1: Description of methods for derivation of variables
Variable description Numerical/ categorical
Variable name
Dataset source, original variable name, and modifications/ derivation if applicable
Child’s age in months
6-12m
13-24m
25-36m
37-48m
49-59m
NA
Categorical (originally numerical)
AGEKID Household member recode variable HML16A
Original numerical variable categorised as shown and renamed “AGEKID”
Child’s sex
Male
Female
Categorical HV104 Household member recode variable HV104 (no modification)
Child slept under LLIN
No
Yes
Categorical HML20 Household member recode variable HML20 (no modification)
Child had fever in the last 2 weeks
No
Yes
Don’t know
Categorical SH13 Household member recode variable SH13 (no modification)
Treatment of fever in the last 2 weeks
No
Yes
Don’t know
NA
Categorical SH14 Household member recode variable SH14 (no modification)
Place first sought treatment
Government hospital
Government health centre/clinic
Private
Chemist
Other
Categorical RXPLACE Household member recode variable SH15
Original categories were condensed so that: o “Government hospital” refers to the original
category “government hospital” o “Government health centre/ clinic” refers to
two original categories namely “government health center” and “government health clinic”
o “Private” refers to the original categories “private hospital/clinic”, “pharmacy”, “private doctor”, and “mobile clinic”
o “Chemist” refers to the original category “chemist/pmv”
o “Other” refers to the original categories “shop”, “traditional practitioner”, “role model caregiver/community worker”, “drug hawker”, “self treatment at home”, “other” and “don't know”
The variable was renamed “RXPLACE
Child with positive RDT suffers from any symptom
No
Yes
Categorical SH219 Household member recode variable SH219 (no modification)
Number of de jure household members
1-4
5-7
Categorical (originally numerical)
HHSIZE Household member recode variable HV012
Original numerical variable categorised as shown and renamed “HHSIZE”

53
>7
Level of education of head of household
No education, preschool
Primary
Secondary
Higher
Don’t know
Categorical EDUHHH Household member recode dataset.
A separate household member dataset was used, subset for only heads of households.
The variable HV106 (level of education of household member) from this dataset was then merged with the base dataset, using cluster number and household ID as common merging variables.
Maternal education
No education
Primary
Secondary
Higher
NA
Categorical HC61 Household member recode variable HC61 (no modification)
Wealth index
Poorest
Poorer
Middle
Richer
Richest
Categorical HV270 Household member recode variable HV270 (no modification)
Type of toilet facility in household
Flush toilet
Pit toilet latrine
No facility/others
Categorical TOILET Household member recode variable HV205
Original categories were condensed so that: o “Flush toilet” refers to flush to piped sewer
system, flush to septic tank, flush to pit latrine, flush to somewhere else, and flush to don't know where
o “Pit toilet latrine” refers to Ventilated Improved Pit latrine (VIP), pit latrine with slab, and pit latrine without slab/open pit
o “No facility” refers to no facility/bush/field, composting toilet, bucket toilet, hanging toilet/latrine, and others
Main material of floor
Natural
Rudimentary
Finished
Categorical FLOOR Household member recode variable HV213
Original categories were condensed so that: o “Natural” refers to Earth, sand, and dung o “Rudimentary” refers to wood planks, palm,
and bamboo o “Finished” refers to parquet, polished wood,
vinyl, asphalt strips, ceramic tiles, cement, and carpet
Main material of walls
Natural
Rudimentary
Finished
Categorical WALL Household member recode variable HV214
Original categories were condensed so that: o “Natural” refers to no walls, cane/palm/trunks,
and dirt o “Rudimentary” refers to bamboo with mud,
stone with mud, uncovered adobe, plywood, cardboard, and reused wood
o “Finished” refers to cement, stone with lime/cement, bricks, cement blocks, covered adobe, and wood planks/shingles
Main material of roof
Natural
Rudimentary
Finished
Categorical ROOF Household member recode variable HV215
Original categories were condensed so that: o “Natural” refers to no roof, thatch/palm leaf or
sod o “Rudimentary” refers to rustic mat,
palm/bamboo, wood planks, cardboard
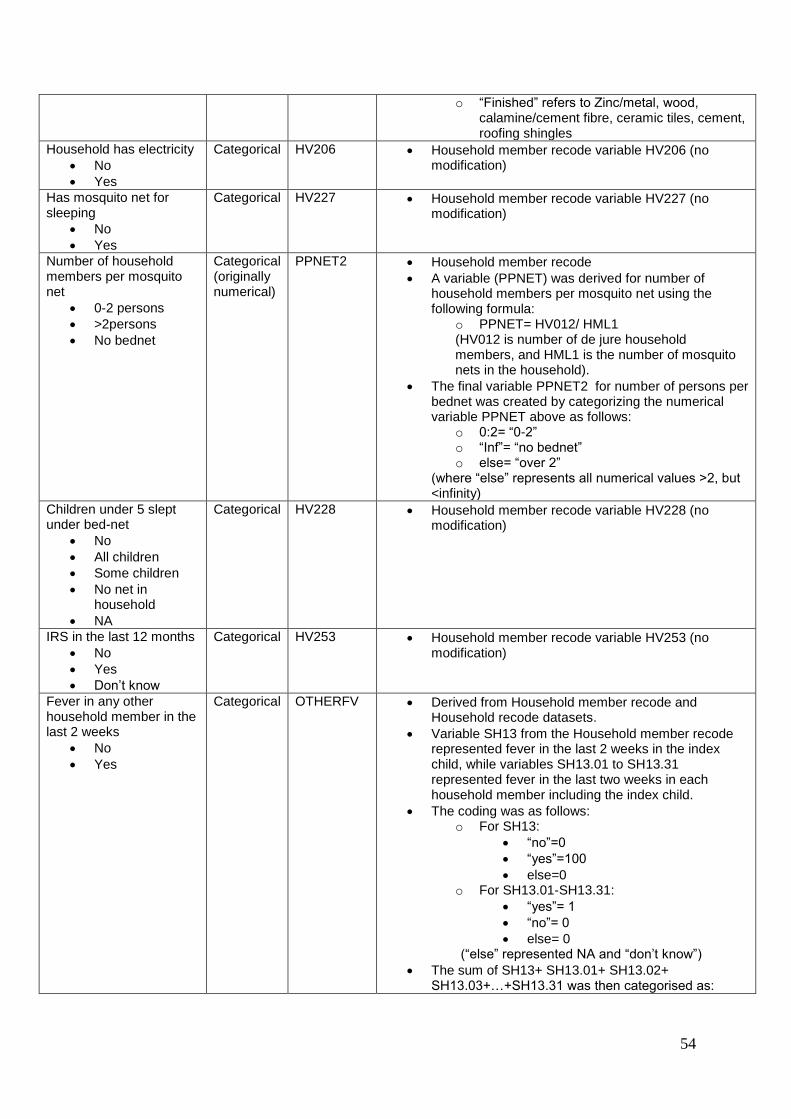
54
o “Finished” refers to Zinc/metal, wood, calamine/cement fibre, ceramic tiles, cement, roofing shingles
Household has electricity
No
Yes
Categorical HV206 Household member recode variable HV206 (no modification)
Has mosquito net for sleeping
No
Yes
Categorical HV227 Household member recode variable HV227 (no modification)
Number of household members per mosquito net
0-2 persons
>2persons
No bednet
Categorical (originally numerical)
PPNET2 Household member recode
A variable (PPNET) was derived for number of household members per mosquito net using the following formula:
o PPNET= HV012/ HML1 (HV012 is number of de jure household members, and HML1 is the number of mosquito nets in the household).
The final variable PPNET2 for number of persons per bednet was created by categorizing the numerical variable PPNET above as follows:
o 0:2= “0-2” o “Inf”= “no bednet” o else= “over 2”
(where “else” represents all numerical values >2, but <infinity)
Children under 5 slept under bed-net
No
All children
Some children
No net in household
NA
Categorical HV228 Household member recode variable HV228 (no modification)
IRS in the last 12 months
No
Yes
Don’t know
Categorical HV253 Household member recode variable HV253 (no modification)
Fever in any other household member in the last 2 weeks
No
Yes
Categorical OTHERFV Derived from Household member recode and Household recode datasets.
Variable SH13 from the Household member recode represented fever in the last 2 weeks in the index child, while variables SH13.01 to SH13.31 represented fever in the last two weeks in each household member including the index child.
The coding was as follows: o For SH13:
“no”=0
“yes”=100
else=0 o For SH13.01-SH13.31:
“yes”= 1
“no”= 0
else= 0 (“else” represented NA and “don’t know”)
The sum of SH13+ SH13.01+ SH13.02+ SH13.03+…+SH13.31 was then categorised as:

55
o 0= No fever in any household member/ NA/ don’t know
o 1-99= Fever in household member other than index child
o 100 or 101= Fever in index child alone o 102-199= Fever in child and any other
household member
The final variable (OTHERFV) was then obtained, for fever in any other household member. For this, scores of 1-99, and 102-99 were regarded as “yes”, while scores 0 and 100-101 were recoded as “no”.
Positive RDT in an additional household member
No
Yes
Categorical OTHERRDT Derived from Household member recode and Household recode datasets.
Variable HML35 from the Household member recode represented RDT result of the index child, while variables HML35.01 to HML35.31 represented RDT results for each household member, including the index child.
The coding was as follows: o For HML35:
“negative”= 0 “positive”= 100 else= 0
o For HML35.01-HML35.31: “positive”= 1 “negative”= 0 else= 0
(“else” represented NA and “don’t know”)
The sum of HML35+ HML35.01+ HML35.02+ HML35.03+ … + HML35.31 was then categorised as:
o 0= No positive RDT in any household member/ NA
o 1-99=Positive RDT in household member other than index child
o 100 or 101=Positive RDT in index child alone o 102-199= Positive RDT in child and any other
household member
The final variable (OTHERRDT) was then obtained, for positive RDT in any other household member. For this, scores of 1-99, and 102-99 were regarded as “yes”, while scores 0 and 100-101 were recoded as “no”.
Type of place of residence
Rural
Urban
Categorical HV025 Household member recode variable HV025 (no modification)
Cluster altitude (meters) Numerical HV040 Household member recode variable HV040 (no modification)
Region ( not applicable to North West)
South-East
South-South
South-West
Categorical HV024 Household member recode variable HV024 (no modification)
Final result of malaria from blood smear test
Negative
Positive
NA
Categorical HML32 Household member recode variable HML32 (no modification)

56
Result of RDT
Negative
Positive
NA
Categorical HML35 Household member recode variable HML35 (no modification)
Annexe 2: Relationship between fever in the last two weeks in
children aged 6-59 months and malaria test results
Table 1: Two-way table showing the relationship between fever in the last two weeks in children aged 6-59
months from the 2015 NMIS and RDT result (north-western Nigeria). P values were determined by chi-square
test.
RDT result
Fever in the last two weeks
p value No
n (%)
Yes
n (%)
Negative 297 (49.7) 252 (34.3) < 0.001
Positive 301 (50.3) 482 (65.7)
Total 598 (100.0) 734 (100.0)
Table 2: Two-way table showing the relationship between fever in the last two weeks in children aged 6-59
months from the 2015 NMIS and microscopy result (north-western Nigeria). P values were determined by chi-
square test.
Microscopy
result
Fever in the last two weeks
p value No
n (%)
Yes
n (%)
Negative 370 (64.6) 375 (54.3) < 0.001
Positive 203 (35.4) 316 (45.7)
Total 573 (100.0) 691 (100.0)
Table 3: Two-way table showing the relationship between fever in the last two weeks in children aged 6-59
months from the 2015 NMIS and RDT result (southern Nigeria). P values were determined by chi-square test.
RDT result
Fever in the last two weeks
p value No
n (%)
Yes
n (%)
Negative 848 (76.0) 449 (59.9) < 0.001
Positive 268 (24.0) 301 (40.1)
Total 1116 (100.0) 750 (100.0)

57
Table 4: Two-way table showing the relationship between fever in the last two weeks in children aged 6-59
months from the 2015 NMIS and microscopy result (southern Nigeria). P values were determined by chi-square
test
Microscopy
result
Fever in the last two weeks
p value No
n (%)
Yes
n (%)
Negative 930 (86.2) 551 (79.5) < 0.001
Positive 149 (13.8) 142 (20.5)
Total 1079 (100.0) 693 (100.0)