Embed Size (px)
Citation preview
if)
I • : a LU
OS hH
p O, H
1—1 Q (-. C/D CO LU LU
ESD-TDR-64-85 MTS-11
INDIVIDUAL DIFFERENCES IN ANGULAR ESTIMATION AS A
FUNCTION OF METHOD OF STIMULUS PRESENTATION AND
MODE OF RESPONSE
TECHNICAL DOCUMENTARY REPORT NO. ESD-TDR-64-95
MAY 1964
E. A. Garvin
Prepared for
DIRECTORATE OF COMPUTERS
ELECTRONIC SYSTEMS DIVISION
AIR FORCE SYSTEMS COMMAND
UNITED STATES AIR FORCE
L. G. Hanscom Field, Bedford, Massachusetts
Project 704. 0
Prepared by
THE MITRE CORPORATION Bedford, Massachusetts
Contract AF19(628)-2390
ESD RECORD COPY RETURN TO
SCIENTIFIC & 0RMATI0N DIVISION 'I), BUILDING 1211
EDDCTAB DPROJOrncER D ACCE«ION MASTER FILe
G-___ __^
DATE_^UNXL]%4
ESTI CONTROL NfiALY^Sf
CYi
Copies available at Office of Technical Services, Department of Commerce.
Qualified requesters may obtain copies from DDC. Orders will be expedited if placed through the librarian or other person designated to request documents from DDC.
When US Government drawings, specifications, or other data are used for any purpose other than a definitely related government procurement operation, the government thereby incurs no responsibility nor any obligation whatsoever; and the fact that the government may have formulated, furnished, or in any way supplied the said drawings, specifications, or other data is not to be regarded by implication or otherwise, as in any manner licensing the holder or any other person or corporation, or conveying any rights or permission to manufacture, use, or sell any patented invention that may in any way be related thereto.
Do not return this copy. Retain or destroy.
ESD-TDR-64-95 MTS-11
INDIVIDUAL DIFFERENCES IN ANGULAR ESTIMATION AS A
FUNCTION OF METHOD OF STIMULUS PRESENTATION AND
MODE OF RESPONSE
TECHNICAL DOCUMENTARY REPORT NO. ESD-TDR-64-95
MAY 1964
E. A. Garvin
Prepared for
DIRECTORATE OF COMPUTERS
ELECTRONIC SYSTEMS DIVISION
AIR FORCE SYSTEMS COMMAND
UNITED STATES AIR FORCE
L. G. Hanscom Field, Bedford, Massachusetts
Project 704. 0
Prepared by
THE MITRE CORPORATION Bedford, Massachusetts
Contract AF19(628)-2390

ABSTRACT
Four studies of factors influencing accuracy as well as magnitude and direction of
constant bias in angular estimation are reported. The parameters investigated were:
method of presenting stimuli and mode of subject's response. Ambiguities in the results
of previous similar investigations are discussed, and previous results compared with
those obtained in the present study.
It was found that subjects could be classified as either high- or low-accuracy in
angular estimation. The high-accuracy group showed no difference in level of accuracy
in the four experiments, maintaining approximately 80% accuracy of judgment regardless
of mode of response or method of presentation. The low-accuracy group was more accurate
when there was a reference standard and when the response mode was manual adjustment
rather than verbal. The low-accuracy group just reached the 75% accuracy level, using
the knob (manual-adjustment) mode of response, and was much below this level using
other methods.
No significant constant bias was found in the high-accuracy group for any of the
four experimental methods. In the low-accuracy group, significant underestimations and
variability of judgment were noted. The low-accuracy group had the least constant error
when using a manual-adjustment (knob) mode of response with reference standard.
A control is described that is necessary for accurate determination of direction
of constant bias in experiments involving three-dimensional stimuli for angular estimation.
Criteria for identification of characteristically high-accuracy subjects are given. Methods
for obtaining highly accurate angular estimations for an unselected population are
recommended.
REVIEW AND APPROVAL
This technical documentary report has been reviewed and is approved.
SEYMOUR JEEPEI Major, USAF Project Officer
iii


CONTENTS
Page
Introduction ; 1
Experiment I 2
Experiment II .... 4
Experiment III 4
Experiment IV 7
Results 10
General Discussion _ 19
Appendix - Tabular Data 23
References , 39

INTRODUCTION
It is difficult to determine from the literature reporting studies into angular esti-
mation what conditions of observation and presentation of angles to the human operator
encourages the highest accuracy in judging and reporting angles. Jones, in a review of
the literature (1962), ^ found "perennial incongruities in terminologies, data measures,
and methodologies." Integration of the results of previous studies is difficult because
the experimenters used a variety of methods of presenting the angulations, modes of
subject response, subject populations, criteria of accuracy and other variables of possible
importance.
The methods of presentation have involved the use of radarscopes,*-2^ viewing screens
or cards,*■** a stereoscope/4^ and photographs.^ The conditions of presentation of
the stimulus have included a standard stimulus^ and sometimes not/7-' various distances
between the standard and the comparison stimulus/ J variation in size of stimulus/9^
and stimulus presented horizontally^10^ or vertically.^11J The stimulus for angular position
estimation has usually consisted of straight lines, broken or unbroken1^ geometric
forms, ^ or random shapes. J The mode of the subject's response has been verbal
estimate,^ written estimate, 13J manual adjustment,'■14J or push button.^
Individual subject differences within an experiment have been reported on many
occasions. Smith'-3^ found that the two populations in his study were different in level
of accuracy of their judgments, and that method of presentation influenced accuracy level.
Lichte1- J concluded that the large individual differences found in his experiment "may
have been related to uncontrolled differences in attitudes." Other factors that have been
mentioned to account for individual differences in accuracy of judgment are: practice
effects, shifts in apparent orientation, and differences in sensory efficiency.
The present study attempts to reconcile some of these diverse results, selecting
for investigation two important parameters that appear to influence the accuracy of re-
porting and the response bias of subjects' judgments. These parameters are: the method
by which the stimulus is presented, and the mode of the subject's response.
The two most prevalent methods of presenting the stimulus have been used, namely,
straight lines presented on cards, and three-dimensional rectangular targets. Straight-
line stimuli were presented both with and without a reference standard. The three-
dimensional stimulus was presented with response by manual adjustment, and was also
contrasted with a straight-line, two-dimensional stimulus with response by manual adjust-
ment . With the manual-adjustment mode, a reference standard was presented.
—-
The two most-used modes of subject response, verbal report and manual adjustment,
also have been chosen to be varied. To control ambiguity resulting from subject differ-
ences, which have, in past studies, made interpretation of results inconclusive, the same
subjects have been used for the four experiments.
The four experiments in which the variables mentioned above were manipulated
are reported. The procedure of each experiment is described in detail. Since the studies
were planned for comparison of different methods of presenting angled stimuli, integrated
results and discussion sections are presented after the procedures of all experiments
have been described.
The following conditions were standard for all experiments in this study. Six
volunteer subjects from The MITRE staff were used in the four experiments. Their age
range was from 23 to 40. There were four male and two female subjects. The subjects were
tested with an eye- and hand-dominance test developed by Crovitz and Zener (1962V15'
On the basis of this test, five of the subjects were classified right-eye and right-hand
dominant, and one subject was right-eye and left-hand dominant. All subjects professed
either normal vision or normal vision with correction. None of the subjects had had
prolonged experience, beyond that of their everyday life, in judging angular stimuli.
All sessions were held with individual subjects; there were no group sessions. No
knowledge of results was given to the subjects during any of the four experiments.
The subject was seated before the viewing apparatus. The stimulus was at eye
level. The source of ambient illumination was overhead diffused fluorescent lights.
EXPERIMENT I: Angular judgments verbally reported in terms of normal compass
degree headings.
Procedure
The viewing stand and a microphone were on a table approximately 18 inches from
the subject's head at eye level. The stand was in the vertical position, not tilted.
Illumination at the stimulus card averaged 1.95 log ft-L. The subject's responses were
recorded on a tape recorder.
The stimulus material consisted of 21 angles, each presented on a 3- by 5- inch white
unlined card. The angles were first drawn with a black pencil, and 11 copies of each
angle were then reproduced by the Xerox method. Thus, the angles were black on white
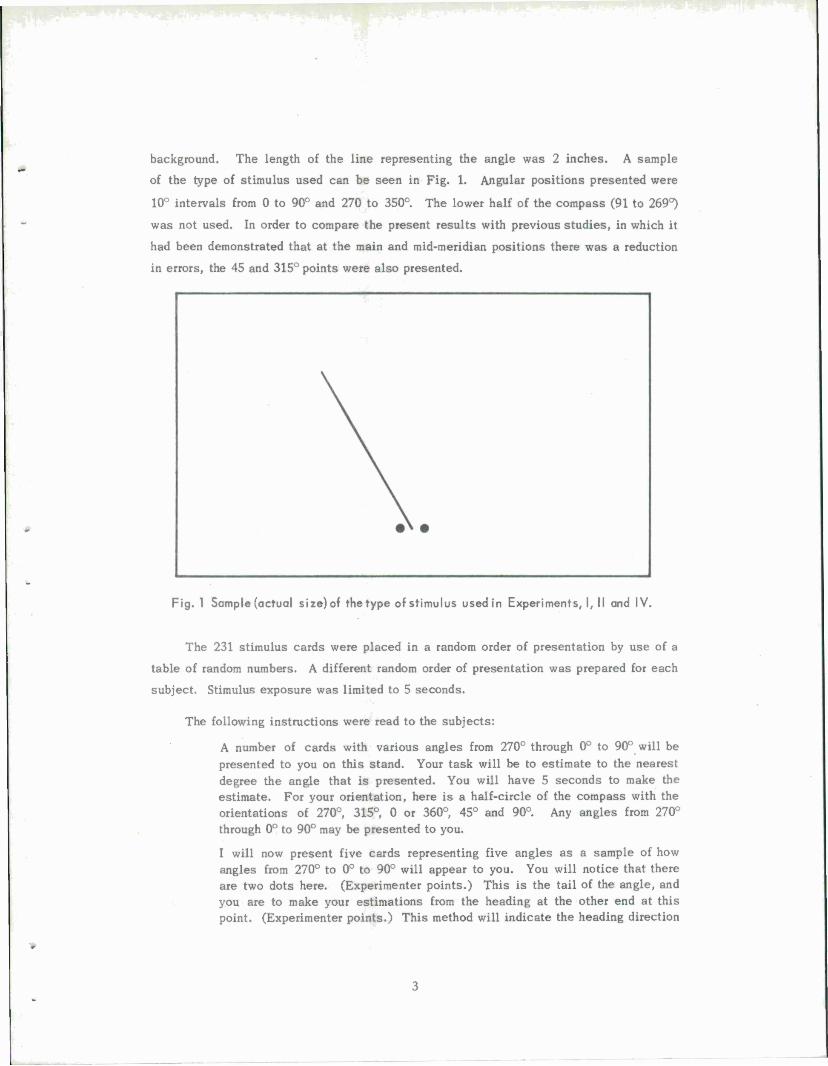
background. The length of the line representing the angle was 2 inches. A sample
of the type of stimulus used can be seen in Fig. 1. Angular positions presented were
10° intervals from 0 to 90° and 270 to 350°. The lower half of the compass (91 to 269°)
was not used. In order to compare the present results with previous studies, in which it
had been demonstrated that at the main and mid-meridian positions there was a reduction
in errors, the 45 and 315° points were also presented.
Fig. 1 Sample (actual size) of the type of stimulus used in Experiments, I, II and IV.
The 231 stimulus cards were placed in a random order of presentation by use of a
table of random numbers. A different random order of presentation was prepared for each
subject. Stimulus exposure was limited to 5 seconds.
The following instructions were read to the subjects:
A number of cards with various angles from 270° through 0° to 90° will be presented to you on this stand. Your task will be to estimate to the nearest degree the angle that is presented. You will have 5 seconds to make the estimate. For your orientation, here is a half-circle of the compass with the orientations of 270°, 315°, 0 or 360°, 45° and 90°. Any angles from 270° through 0° to 90° may be presented to you.
I will now present five cards representing five angles as a sample of how angles from 270° to 0° to 90° will appear to you. You will notice that there are two dots here. (Experimenter points.) This is the tail of the angle, and you are to make your estimations from the heading at the other end at this point. (Experimenter points.) This method will indicate the heading direction
of the angle. The angles from 91 to 269 will not be presented. The same angle may be presented more than once during the session. Be as accurate as you can in your estimates, and you must make an estimate for every presen- tation. Since your answer is being recorded on tape, please speak clearly at your normal voice level for adequate recording.
Remember, your one task is to estimate to the nearest degree the angle you believe has been presented to you within the 5 second period. You must make the best choice you can for each presentation. The experiment will take approximately 15 minutes. Any questions?
The five sample cards and the reference card were removed before the experimental
stimuli were presented.
The experimenter then presented the cards, one at a time, on the stand before the
subject. Exposure time of the card was controlled by the experimenter, using a stop
watch as a guide. The subject's estimations were recorded on a tape recorder and
retranscribed onto paper data sheets.
EXPERIMENT II: Angular judgments verbally reported in terms of 0 to 90° quadrant
numerals.
Procedure
The hypothesis in this experiment was that accuracy in reporting angular judgments
will be improved when the numerals used in reporting are the same for both 90° quadrants.
This hypothesis is a recognition of the possibility of conflict of orientation in the require-
ment that the subject report in different numerals for the two 90° quadrants, as in
Experiment I. The subjects were asked, therefore, in this experiment, to report their
numerical estimates on the basis of 0 to 90° numerals for both quadrants, rather than
0 to 90° for the quadrant to the right of zero and 270 to 359° for the quadrant to the left
of zero, as in Experiment I. All other conditions were identical to those of the first
experiment.
EXPERIMENT III: Angular judgments reported by manual adjustment, with a reference
standard and the addition of a third dimension to the stimulus.
Procedure
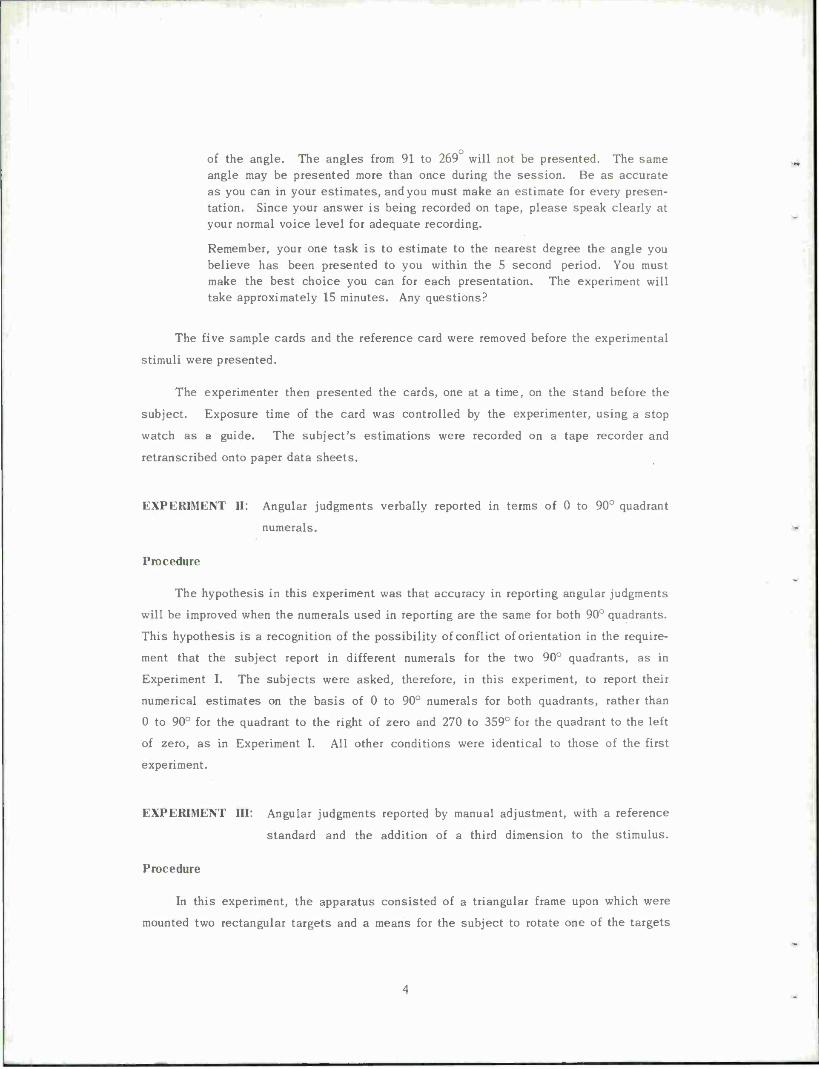
In this experiment, the apparatus consisted of a triangular frame upon which were
mounted two rectangular targets and a means for the subject to rotate one of the targets
(see Fig. 2). The apparatus was a modification of one used by Lichte.11-' The modifi-
cations were in the size of the targets, the distance between the targets, the distance
between the subject and the targets and between the targets and the background, and
elimination of the side panels and introduction of a head mount.
Fig. 2 Apparatus used in Experiment III.
The targets were flat-black cardboard, cut to 5 inches high and 3 inches wide.
They were mounted on dowels 0.25 inch in diameter. The distance between the targets
was 2-3/4 inches (edge to edge) when the targets were placed at 90° to the subject.
At 0° to the subject, the distance between the cards was 5-9/16 inches. The distance
from the subject's head to the targets was 46 inches. The targets were placed so that
they were equidistant from the subject's line-of-sight.
The following average brightness levels were obtained from the targets used in the
experiment: at 27° left rotation, 0.98 log ft-L; at 27° right rotation, 1.1 log ft-L; at 45°
left rotation 0.82 log ft-L; at 45° right rotation, 0.88 log ft-L; at 90° rotation, 0.6 log ft-L.
During the time the subject was adjusting the variable stimulus, the experimenter remained
beyond the line-of-sight of the subject so that a clear, homogeneous background was
available for the adjustment.
Each target was connected to a knob at the subject's position by means of a string
wound around a shaft attached to the dowel upon which the target was mounted. Attached
to the dowel at the bottom of each target and below the front piece so the subject could
not see it, was a needle. The needle responded to rotation of the dial by the subject.
Underneath the needle was a protractor fastened to the base of the apparatus. A needle
and protractor were also positioned in the same way for the other target. The needle,
protractor and target were calibrated before each session so that all three parts were
in alignment. The experimenter read the subject's dial setting, as recorded on the pro-
tractor, to the nearest 1/2°.
The top part of the apparatus was covered (cover is not shown in Fig. 2) so that
the subject could not pick up cues of the extent of movement from the excursion of the
strings attached to the targets. The position of the chair upon which the subject was
seated was fixed to maintain a constant distance from the subject to the targets. A
head rest also helped maintain this constant position and was a control for head movement
during positioning of the target by the subject.
The subject's task was to rotate the variable stimulus by turning the dial until
the variable shape equaled the standard shape in angle of rotation. A 5-second time
limit was imposed on the subject for each setting.
The exact instructions to the subject were as follows:
This is an experiment to determine how accurately you can adjust one of these shapes to equal the standard shape. Your task is, by means of this knob which rotates the variable shape, to make the shape you rotate equal in angle of rotation to the standard. Try to maintain the same basis for adjusting the variable to the standard throughout the experiment. There is a 5-second time limit to make this adjustment. If you have not made an adjust- ment at the end of the 5-second period, you will be asked to make the best one you can within the next few seconds. Sometime during the experiment, the variable and standard shapes will be interchanged. You will be told of this at the appropriate time. The variable stimulus will be reset by the experimenter to approximately zero after you have made your estimate.
Before each trial, the experimenter adjusted the standard stimulus to the correct
angle. This adjustment was made with a shield in front of the target so that the subject
could not see the adjustment. The variable stimulus was reset to approximately zero
after the subject's setting. An exact zero was not set because a zero angle was among
the stimuli to be presented.
A practice session immediately preceded the experiment for all subjects. They
were read the instructions with the addition that this was to be a practice session. The
practice session continued until a criterion of five successive settings within ±5° of the
standard setting had been met by the subject. This allowed the subject to become
familiar with the apparatus and ensured that all subjects started the experiment at the
same initial level of accuracy. Interchange of standard and variable was accomplished
during the practice session. No subject required more than 15 trials to reach the criterion.
The angles presented were as follows (in degrees from zero): 0, 9, 18, 27, 36,
45, 54, 63, 72, 81, 90. There were four presentations of each angle to the right of zero
and four presentations of each angle to the left of zero. For each angle presented to the
right of zero and to the left of zero, the standard target was changed from either the left
or right position. For example, for a 9° setting on the quadrant to the right of zero,
a subject would be presented the angle twice with the standard target to the left of the
variable and twice with the standard to the right of the variable. This same interchange
of standard and variable targets would also be made for 9° presented to the left of zero
point. Thus, 9° would be presented eight times: four times to the right of zero and four
times to the left of zero. In each quadrant, the standard and variable were interchanged
after two observations at each standard position. Thus, there were eight presentations
each for 11 angles, or 88 adjustments, for the subject to make in the experiment. Experi-
mental sessions usually took about 75 minutes.
The stimuli for a particular quadrant were presented in random order. When adjust-
ments were completed for that quadrant, the experimenter gave the subject a 10-minute
rest period; the standard and variable stimuli were then interchanged for the second half
of the presentations. Zero setting was included in the random order, and four presentations
were given in each half of the experiment. Three subjects started the experiment with
the standard target on the left, and the other three subjects with the standard target on
the right. Starting quadrant was also different for half the subjects.
EXPERIMENT IV: Angular judgments reported by manual adjustment, with standard
stimulus in two dimensions.
Procedure
The apparatus consisted of a variable resistor with a long shaft carrying a needle
at one end and a pointer-type knob at the subject's position. A variable resistor was
used merely because it provided some resistance to turning of the shaft. An aluminum
housing was fitted in front of the resistor, and a blank, white piece of paper covered
the front of the apparatus and acted as the background for the knob. The standard stimuli
were cards placed on a small stand hidden behind the paper, and situated such that only
the card was showing. The knob was the variable stimulus. In back of the housing and
the paper shield a needle was attached to the shaft, which rotated when the subject
rotated the knob. Pasted on the housing just behind the needle was a protractor which
allowed the experimenter to read the subject's setting to the nearest 1/2°. The apparatus
was calibrated before each subject's session so that the knob setting, the needle and
the protractor were coincidental. The stimulus cards, the stand and the paper shield
were also checked for proper orientation before each session. The apparatus was set
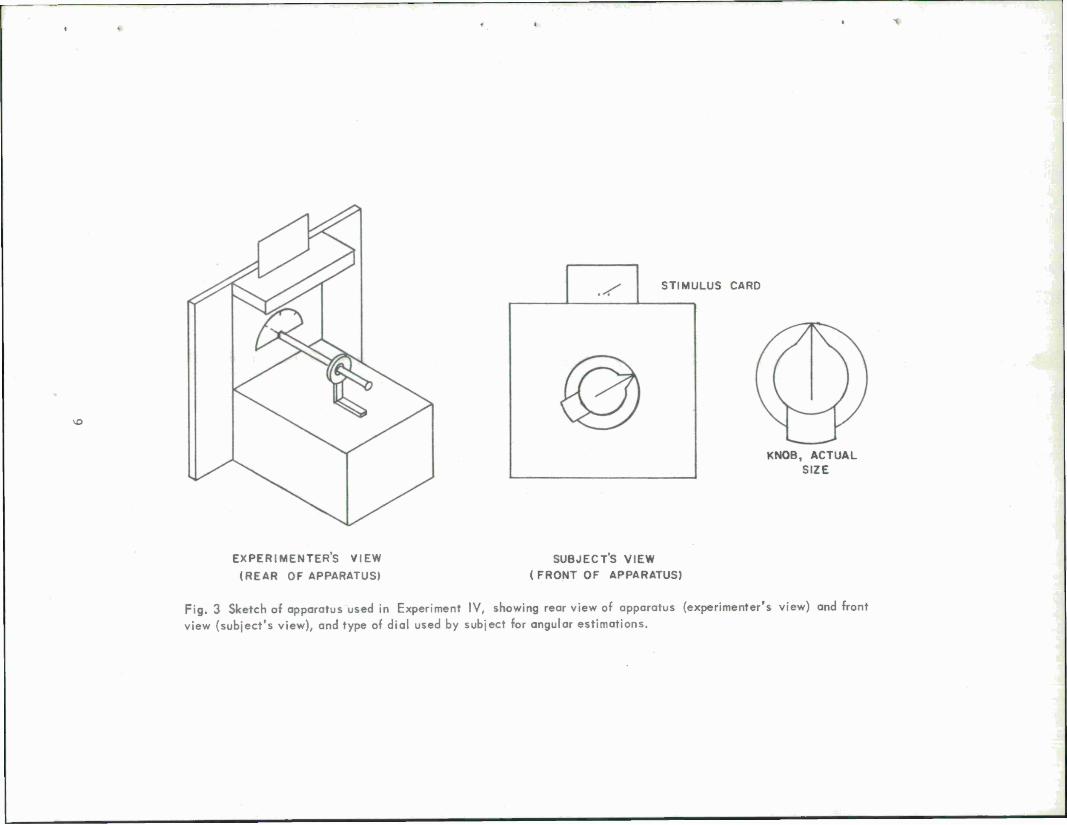
on a table and the subject sat in a comfortable chair in front of the apparatus. A sketch
of the apparatus is shown in Fig. 3. The exact shape of the knob is also shown in actual
size. A white line ran down the center of the black knob from the pointed end.
The stimuli were prepared and presented in the same manner as in Experiments I
and II. The angles presented, however, were the same as in Experiment III. There were
five presentations of each angle instead of four as in Experiment III. Thus, there were
11 angles presented 5 times each to a subject, or 55 estimations for a subject. The
cards containing the angles were put in a different random order for each subject. Room
lighting and conditions of time exposure were as before.
The following instructions were read to the subject:
You will be presented a number of cards on which will be a line like the following examples (experimenter shows sample cards). The inclination or angle of the line will vary randomly from 0 to 90°, right or left of 0°. Notice there are two small dots at one end of the inclined line. This indicates the tail, not the heading, of the line. You are to make your estimate of the angle, using the head of the line with this knob. You have 5 seconds to make a setting and if at the end of that time you have not made one, you will be asked to make a best guess.
The experimenter will make a recording of your estimate by means of a pro- tractor attached to the shaft of the knob. When your setting has been recorded, the experimenter will return the knob to approximately 0°.
Thus, your task is to turn this dial to equal the angle presented on a card on this stand, using the head (opposite the dots) as the reference point.
A typical trial procedure was conducted as follows. The experimenter set the dial
to approximately zero; he then placed the card on the stand, and at the end of 5 seconds,
when the subject had made his setting, removed the card. The subject s setting was
STIMULUS CARD
KNOB, ACTUAL SIZE
EXPERIMENTERS VIEW
(REAR OF APPARATUS)
SUBJECT'S VIEW
( FRONT OF APPARATUS)
Fig. 3 Sketch of apparatus used in Experiment IV, showing rear view of apparatus (experimenter's view) and front
view (subject's view), and type of dial used by subject for angular estimations.
read from the needle over the protractor to the nearest 1/2° by the experimenter, using a
magnifying glass. The knob was then returned by the experimenter to an approximately
zero position for the next stimulus presentation. The subjects were permitted a 10-minute
rest period halfway through the experiment. A session usually lasted 45 minutes.
RESULTS
Accuracy Measures
Although several accuracy class limits were plotted for comparison purposes
(Fig. 8), the ±0—5° (most accurate class) interval was chosen for statistical comparisons
between the main variables. It is consistent with the tolerable error limit for operational
conditions of estimations of bearing.
Accuracy as a Function of Subject Group and of Method
When the 0—5° accuracy classification was used to graph the angular judgments
of the six subjects (Fig. 4), two distinct groups emerged. These subject groups will
henceforth be labeled high- and low-accuracy groups. To vindicate this dichotomy, the
Wilcoxon Test for paired observations was used, and the results showed that the two
groups differed significantly (P< 0.01), from each other on accuracy of angular estimation
with each experimental method. Since there were two distinct populations, the level of
accuracy and direction of constant bias were compared within and between each group
for all experimental methods.
The four experimental methods were dichotomized on two bases: the first, that
Methods I and II required verbal response from the subjects, while Methods III and IV
required a manual adjustment; the second, that Methods HI and IV each had a comparison
stimulus, while in Methods I and II the subject was forced to make a judgment without a
comparison stimulus. It should be noted that Method III was quite different from the
other methods in that the angular stimuli were three- dimensional (rotated rectangular
cards) rather than two- dimensional (a line on a 3- by 5- inch card). The question to be
answered was whether these two types of methods had a differential effect on accuracy of
estimation by the two accuracy groups. Using the Wilcoxon Test again, it was found that
there were no significant differences for the high-accuracy groups among the four experi-
mental methods; for the low-accuracy group, there were two differences: between Methods
I and III (P < 0.01), and between Methods I and IV (P < 0.02). All other comparisons
were not significantly different (P > 0.05, Wilcoxon Test for related samples).
10
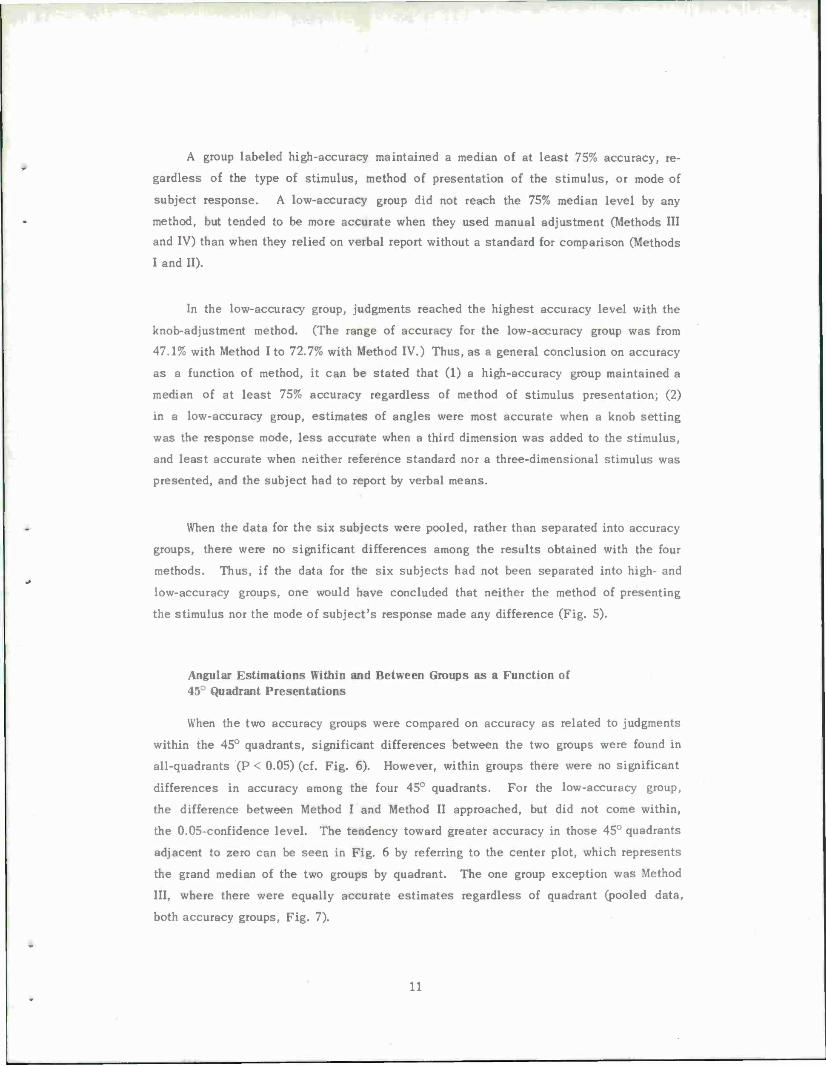
A group labeled high-accuracy maintained a median of at least 75% accuracy, re-
gardless of the type of stimulus, method of presentation of the stimulus, or mode of
subject response. A low-accuracy group did not reach the 75% median level by any
method, but tended to be more accurate when they used manual adjustment (Methods III
and IV) than when they relied on verbal report without a standard for comparison (Methods
I and II).
In the low-accuracy group, judgments reached the highest accuracy level with the
knob-adjustment method. (The range of accuracy for the low-accuracy group was from
47.1% with Method I to 72.7% with Method IV.) Thus, as a general conclusion on accuracy
as a function of method, it can be stated that (1) a high-accuracy group maintained a
median of at least 75% accuracy regardless of method of stimulus presentation; (2)
in a low-accuracy group, estimates of angles were most accurate when a knob setting
was the response mode, less accurate when a third dimension was added to the stimulus,
and least accurate when neither reference standard nor a three-dimensional stimulus was
presented, and the subject had to report by verbal means.
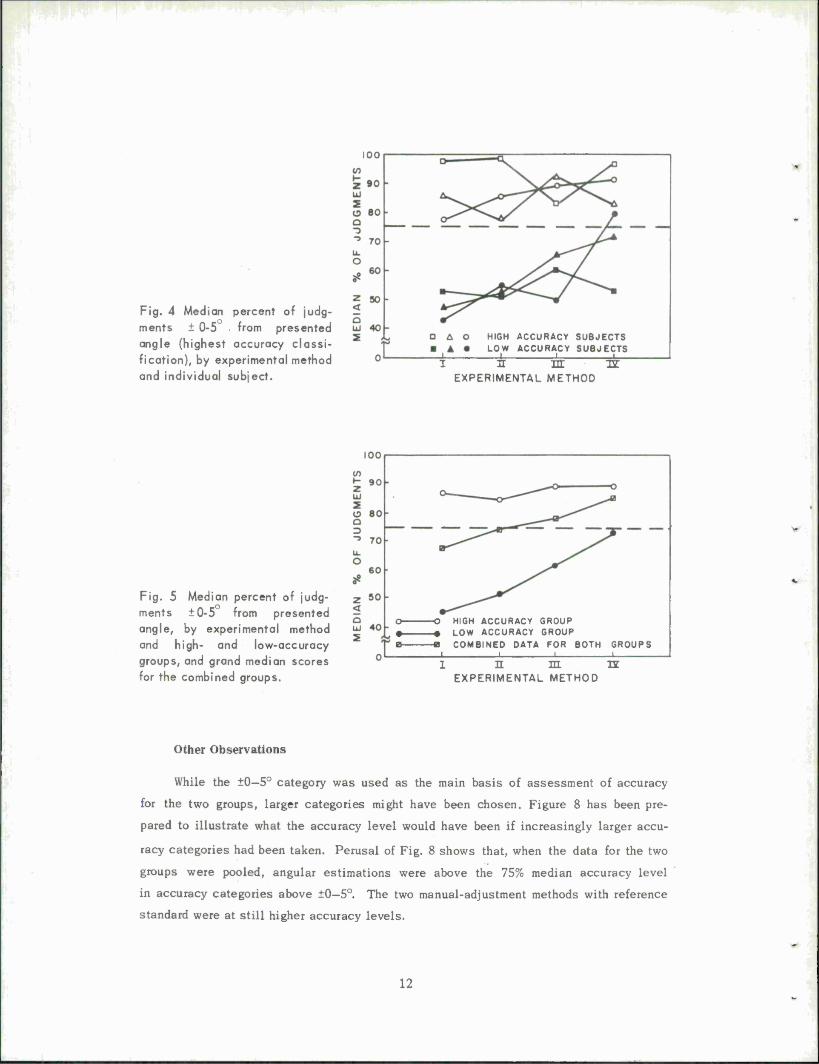
When the data for the six subjects were pooled, rather than separated into accuracy
groups, there were no significant differences among the results obtained with the four
methods. Thus, if the data for the six subjects had not been separated into high- and
low-accuracy groups, one would have concluded that neither the method of presenting
the stimulus nor the mode of subject's response made any difference (Fig. 5).
Angular Estimations Within and Between Groups as a Function of 45° Quadrant Presentations
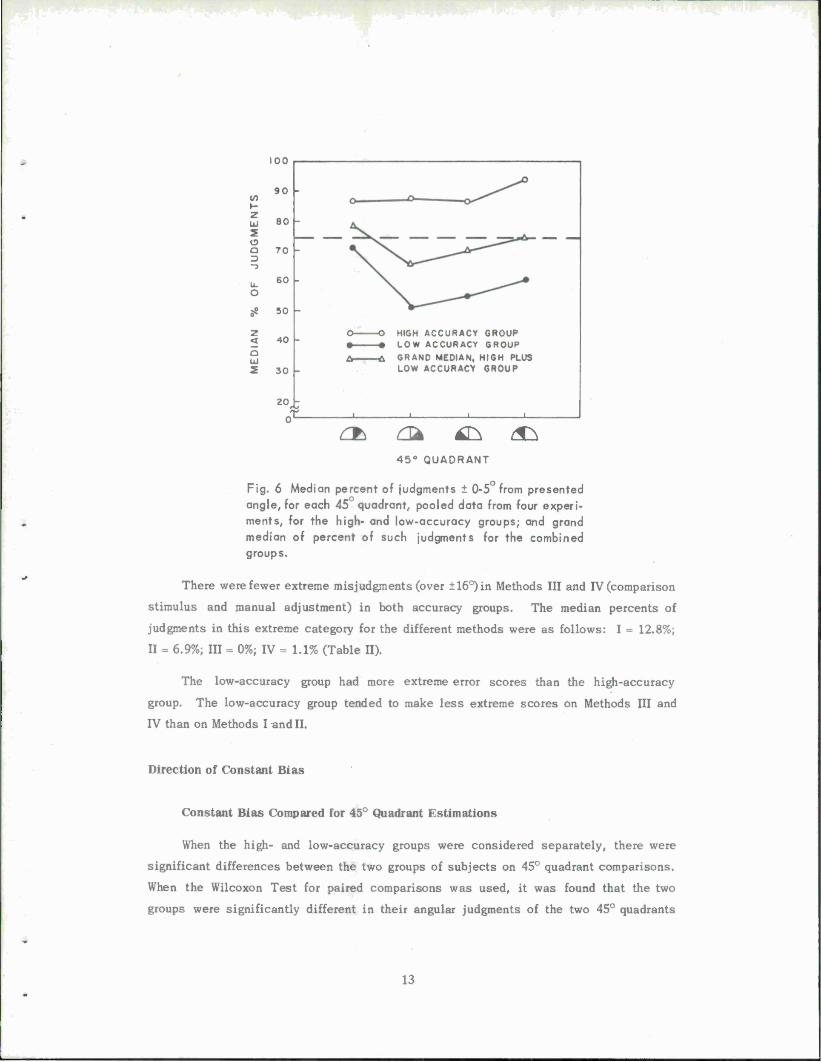
When the two accuracy groups were compared on accuracy as related to judgments
within the 45° quadrants, significant differences between the two groups were found in
all-quadrants (P < 0.05) (cf. Fig. 6). However, within groups there were no significant
differences in accuracy among the four 45° quadrants. For the low-accuracy group,
the difference between Method I and Method II approached, but did not come within,
the 0.05-confidence level. The tendency toward greater accuracy in those 45° quadrants
adjacent to zero can be seen in Fig. 6 by referring to the center plot, which represents
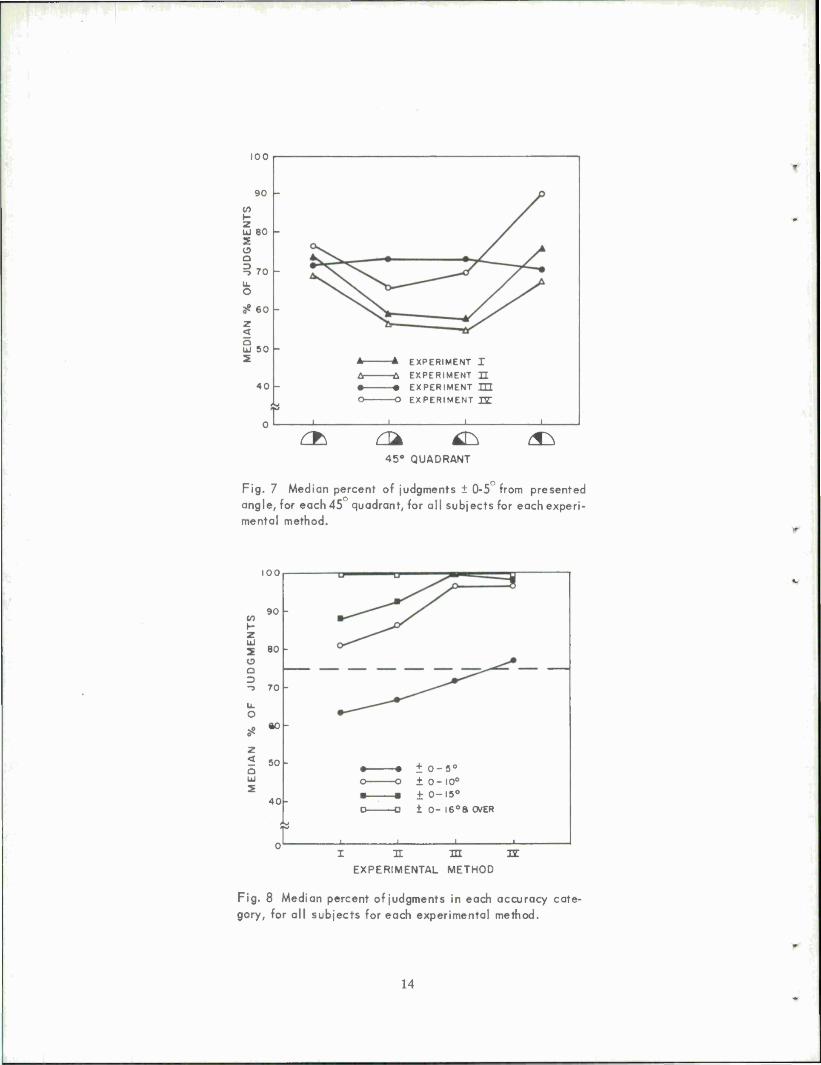
the grand median of the two groups by quadrant. The one group exception was Method
III, where there were equally accurate estimates regardless of quadrant (pooled data,
both accuracy groups, Fig. 7).
11
100
Fig. 4 Median percent of judg-
ments ± 0-5 from presented
angle (highest accuracy classi-
fication), by experimental method
and individual subject.
HIGH ACCURACY SUBJECTS LOW ACCURACY SUBJECTS
_l I L. i s ur JX
EXPERIMENTAL METHOD
Fig. 5 Median percent of judg-
ments ±0-5 from presented
angle, by experimental method
and high- and low-accuracy
groups, and grand median scores
for the combined groups.
o— —O
B B
HIGH ACCURACY GROUP LOW ACCURACY GROUP COMBINED OATA FOR BOTH GROUPS
i n m u EXPERIMENTAL METHOD
Other Observations
While the ±0—5° category was used as the main basis of assessment of accuracy
for the two groups, larger categories might have been chosen. Figure 8 has been pre-
pared to illustrate what the accuracy level would have been if increasingly larger accu-
racy categories had been taken. Perusal of Fig. 8 shows that, when the data for the two
groups were pooled, angular estimations were above the 75% median accuracy level
in accuracy categories above ±0-5°. The two manual-adjustment methods with reference
standard were at still higher accuracy levels.
12
en
100
90 h
80 5 O O 70 D -3
ÜL o
60
S« 30
Z < 40 a
30 -
-O HIGH ACCURACY GROUP -• LOW ACCURACY GROUP -A GRAND MEDIAN, HIGH PLUS
LOW ACCURACY GROUP
o& a* *& tSh 45° QUADRANT
Fig. 6 Median percent of judgments ± 0-5 from presented
angle, for each 45 quadrant, pooled data from four experi-
ments, for the high- and low-accuracy groups; and grand
median of percent of such judgments for the combined groups.
There were fewer extreme misjudgments (over ±16°) in Methods III and IV (comparison
stimulus and manual adjustment) in both accuracy groups. The median percents of
judgments in this extreme category for the different methods were as follows: I = 12.8%;
II = 6.9%; III = 0%; IV = 1.1% (Table II).
The low-accuracy group had more extreme error scores than the high-accuracy
group. The low-accuracy group tended to make less extreme scores on Methods III and
IV than on Methods I and II.
Direction of Constant Bias
Constant Bias Compared for 45° Quadrant Estimations
When the high- and low-accuracy groups were considered separately, there were
significant differences between the two groups of subjects on 45° quadrant comparisons.
When the Wilcoxon Test for paired comparisons was used, it was found that the two
groups were significantly different in their angular judgments of the two 45° quadrants
13
100
90
CO
z UJ 80 5 (9 Q 13 ^> ü. O
70
5? 60 z < Q UJ 50 5
40
£
-A EXPERIMENT I -A EXPERIMENT II -• EXPERIMENT JU —O EXPERIMENT H
_i_ _l_
& <3Ä £& (£^ 45° QUADRANT
Fig. 7 Median percent of judgments ± 0-5 from presented
angle, for each 45 quadrant, for all subjects for each experi-
mental method.
100
2 uü
o o 3
90
80
70
ftO
Ü 50 Q
40
-• ±0-5° -O ±0-10° -m ± 0-15° -O +0- I6°8 OVER
-i_
i n m EXPERIMENTAL METHOD
JX
Fig. 8 Median percent of judgments in each accuracy cate-
gory, for all subjects for each experimental method.
14
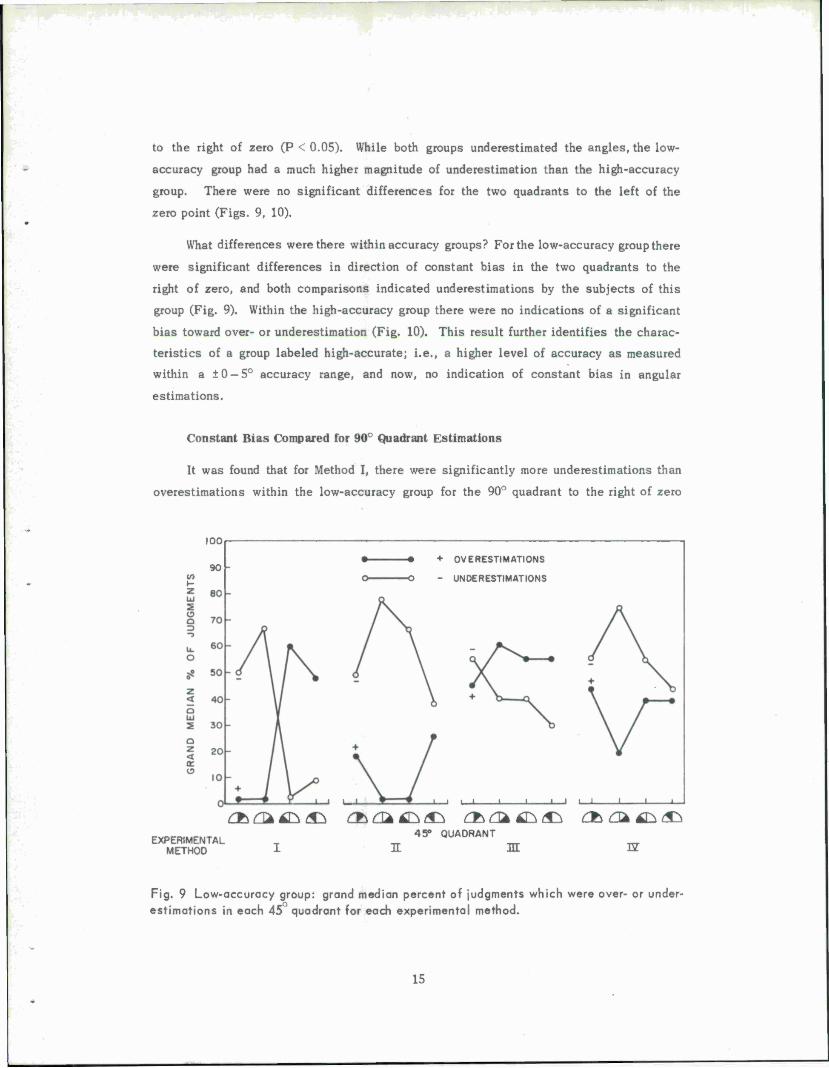
to the right of zero (P < 0.05). While both groups underestimated the angles, the low-
accuracy group had a much higher magnitude of underestimation than the high-accuracy
group. There were no significant differences for the two quadrants to the left of the
zero point (Figs. 9, 10).
What differences were there within accuracy groups? For the low-accuracy group there
were significant differences in direction of constant bias in the two quadrants to the
right of zero, and both comparisons indicated underestimations by the subjects of this
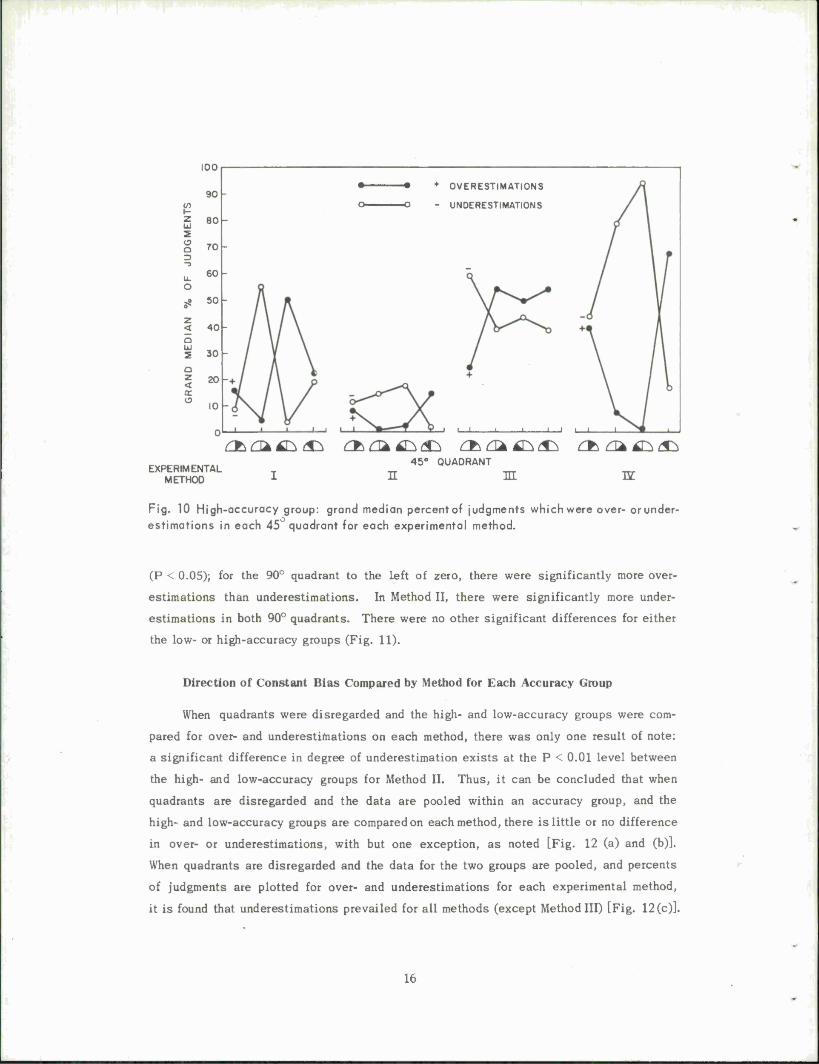
group (Fig. 9). Within the high-accuracy group there were no indications of a significant
bias toward over- or underestimation (Fig. 10). This result further identifies the charac-
teristics of a group labeled high-accurate; i.e., a higher level of accuracy as measured
within a ±0 — 5° accuracy range, and now, no indication of constant bias in angular
estimations.
Constant Bias Compared for 90° Quadrant Estimations
It was found that for Method I, there were significantly more underestimations than
overestimations within the low-accuracy group for the 90° quadrant to the right of zero
100
90 -• + OVERESTIMATIONS
-O - UNDERESTIMATIONS
_l I I L
EXPERIMENTAL METHOD
£££]**fr^ £fe£L**D£^ £fc£**k£^ Ct><3*£&(<& 4S» QUADRANT
I 31 m IE-
Fig. 9 Low-accuracy group: grand median percent of judgments which were over- or under-
estimations in each 45 quadrant for each experimental method.
15
2
O a 3
100
90-
80-
70-
60
z < Q Lü
Q Z < et
50
40
30
20
10
•- O-
♦ OVERESTIMATES
- UNDERESTIMATES
EXPERIMENTAL METHOD
45° QUADRANT
i n m n
Fig. 10 High-accuracy group: grand median percent of judgments which were over- or under- estimates in each 45 quadrant for each experimental method.
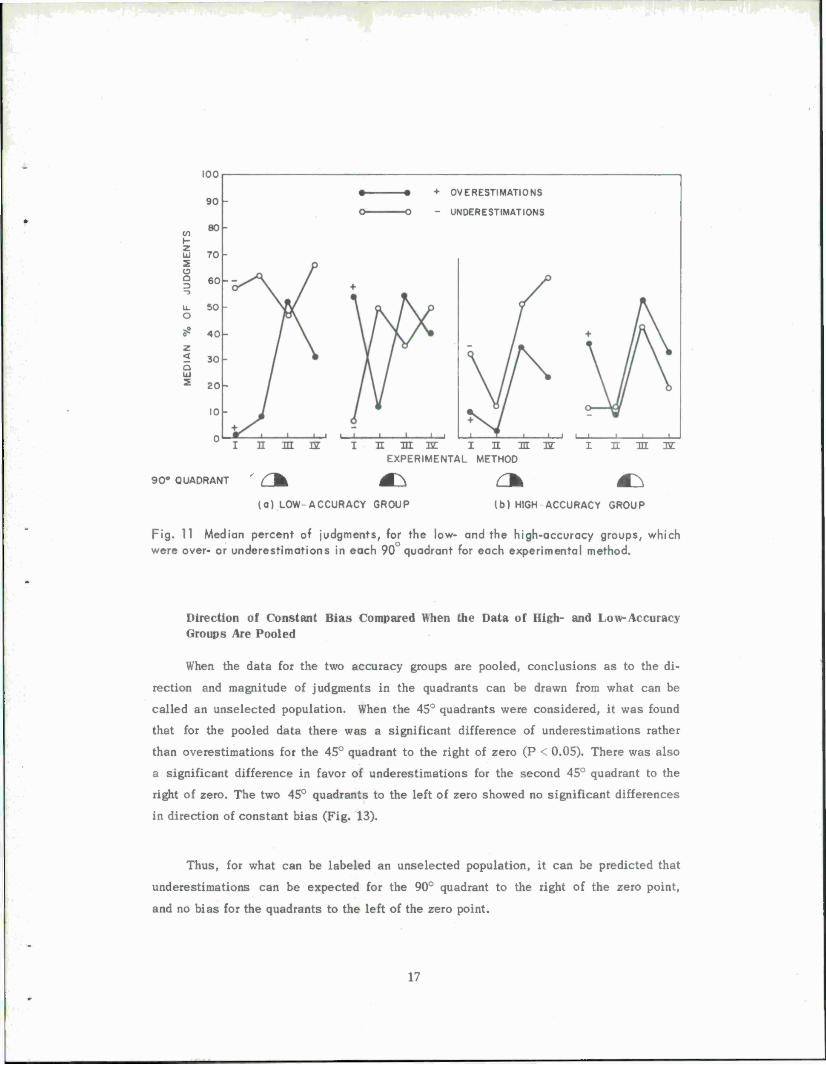
(P < 0.05); for the 90° quadrant to the Left of zero, there were significantly more over-
estimations than underestimations. In Method II, there were significantly more under-
estimations in both 90° quadrants. There were no other significant differences for either
the low- or high-accuracy groups (Fig. 11).
Direction of Constant Bias Compared by Method for Each Accuracy Group
When quadrants were disregarded and the high- and low-accuracy groups were com-
pared for over- and underestimations on each method, there was only one result of note:
a significant difference in degree of underestimation exists at the P < 0.01 level between
the high- and low-accuracy groups for Method II. Thus, it can be concluded that when
quadrants are disregarded and the data are pooled within an accuracy group, and the
high- and low-accuracy groups are compared on each method, there is little or no difference
in over- or underestimations, with but one exception, as noted [Fig. 12 (a) and (b)].
When quadrants are disregarded and the data for the two groups are pooled, and percents
of judgments are plotted for over- and underestimations for each experimental method,
it is found that underestimations prevailed for all methods (except Method III) [Fig. 12(c)].
16
100
90 -
2 UJ
(9 Q 3
80
70
60
50
40
5 30 a UJ 5 20h
10-
90° QUADRANT
-• + OVERESTIMATIONS
-O - UNDERESTIMATIONS
HI IZ n m iz i n m iz EXPERIMENTAL METHOD
HI 3Z
(a) LOW-ACCURACY GROUP (b) HIGH ACCURACY GROUP
Fig. 11 Median percent of judgments, for the low- and the high-accuracy groups, which
were over- or underestimations in each 90 quadrant for each experimental method.
Direction of Constant Bias Compared When the Data of High- and Low-Accuracy Groups Are Pooled
When the data for the two accuracy groups are pooled, conclusions as to the di-
rection and magnitude of judgments in the quadrants can be drawn from what can be
called an unselected population. When the 45° quadrants were considered, it was found
that for the pooled data there was a significant difference of underestimations rather
than overestimations for the 45° quadrant to the right of zero (P < 0.05). There was also
a significant difference in favor of underestimations for the second 45° quadrant to the
right of zero. The two 45° quadrants to the left of zero showed no significant differences
in direction of constant bias (Fig. 13).
Thus, for what can be labeled an unselected population, it can be predicted that
underestimations can be expected for the 90° quadrant to the right of the zero point,
and no bias for the quadrants to the left of the zero point.
17

90
80-
-• + OVERESTIMATIONS -O - UNDERESTIMATES
J I nr is. TU BE M m
(a) LOW-ACCURACY GROUP
EXPERIMENTAL METHOD (b)
HIGH-ACCURACY GROUP (c)
HIGH-AND LOW-ACCURACY GROUPS COMBINED
Fig. 12 Median percent of judgments which were over- or underestimates, for each
experiment, for (a) the low-accuracy group, (b) the high-accuracy group, and (c) the
high- and low-accuracy groups combined.
70
Fig. 13 Median percent of judg-
ments which were over- or
underestimations in each 45
quadrant, pooled data from both
accuracy groups and all experi-
mental methods.
60-
w 5°r-
o a 3 40-
u. O 30
z < o UJ
20
10
+ OVERESTIMATIONS
- UNDERESTIMATIONS
£fc QUADRANT
<5^
18
GENERAL DISCUSSION
It is difficult to deduce from the design of the experiment why it was possible
to dichotomize two groups of subjects on the basis of their accuracy and constant bias.
Lichte1-11^ suggested that accuracy differences between individuals are due to attitude
of the subject. Lichte's conclusion would imply that one factor in accuracy of reporting
is the influence of self-imposed standards. For the low-accuracy group in this experi-
ment, the level of accuracy markedly improved with the dial-estimation method and when
a third-dimension was added to the stimulus. In both of these methods the subject had
a reference standard, while in the other two methods no reference standard was physically
present. Although the method of presenting the stimulus significantly improved the level
of judgment of the low-accuracy group, those subjects never reached the accuracy level
of the high-accuracy group by any method of stimulus presentation or mode of response.
These results lead to a conclusion that the accuracy level of a group labeled low-accurate
can be significantly improved by use of reference standards and of manual-adjustment
techniques, but that some subjects will be highly accurate in their judgments of angles,
regardless of whether there is a reference standard, whether the stimulus is two- or three-
dimensional, or whether they must report their estimations verbally or by manual adjust-
ment. Quite probably, also, knowledge of results might, with practice, bring the low-
accuracy group up to the level of the high-accuracy group of this experiment, although
there are instances when method of presentation is more important than practice (Grether,
1949)A J The conditions under which each of these factors can effect important incre-
ments in level of accuracy are not completely known at this time.
It was found that accuracy among low-accuracy subjects was better for the two
45° quadrants adjacent to zero than for the two 45° quadrants farther away from zero.
These results are consistent with the results of many previous studies. In her review
of the literature on this aspect of accuracy, Jones *■ * found that many studies showed
that error size and variability increased as the distance increased from the standard to
the variable stimulus. Jones reviews the past use of the standard stimulus as an "anchor,"
i.e., a reference point to compare to the variable stimulus. It is worthwhile to note
that in Method III (manual adjustment based on angular judgment with a reference standard
and the addition of a third dimension to the stimulus) this effect did not take place
(Fig. 7). Why this method was insensitive to this effect is not known. The stimulus for
this method was in three dimensions rather than two as in the other three experiments.
There may be something specific about the nature of the stimulus that decreases or
eliminates the effect. Further work is needed to verify this hypothesis.
19
It must be emphasized that the difference in accuracy between near and far quadrants
from zero was characteristic only of the low-accuracy group. As Fig. 6 shows, the high-
accuracy group did not vary significantly in accuracy as a result of the quadrant in which
the stimulus was presented. This would imply that a high-accuracy group might be able
to extend its "anchor" to a much greater "psychological distance" than a low-accuracy
group. A high-accuracy group appears to be better able to maintain comparison of two
stimuli without being seriously affected in judgment of the equality of the two angles
by the physical or "psychological" distance between the two stimuli. This was so,
at least, for the high-accurate group under the conditions of the present experiment.
Needless to say, the experiments in literature and in the present study do not provide
direct evidence to support this hypothesis.
Inspection of subjects' estimates on their raw data sheets showed that, with the
verbal estimate mode of reply, the majority of estimates were quantized ones of 5 or 10°
in Experiments I and II. In Experiments III and IV, where manual adjustment techniques
were used by the subjects, quantizing in 5° intervals was practically nonexistent.
Smith1- and ChapanisL14J also found quantizing in 5° intervals more prevalent for verbal
estimate than for manual adjustment. Such quantizing took place in both accuracy groups
to approximately the same extent.
It was also found that for the low-accuracy group, the manual-adjustment method
was significantly more accurate than verbal estimate. For the high-accuracy group,
there was no difference in accuracy of estimation as a function of response mode. Again,
the basis for this difference must be looked upon as a characteristic of a particular r3i
population. However, Smith1 J found that his high-accuracy group was more accurate
using manual adjustment than verbal estimate. In this experiment, with multiple repli-
cations within each experimental method, high- and low-accuracy groups could be differ-
entiated. While Smith could separate two groups on the basis of accuracy, he did not obtain
the consistency of accuracy in all methods for the high-accuracy group that was obtained
in this experiment.
The data were assessed for a relationship between hand and eye dominance and
direction of bias, and none was found.
Higher accuracy in reporting was found for 0°, 45° and 90° presentations than for
angles presented elsewhere than in the mid-meridian or cardinal points. There was also
less tendency for extreme estimates by the subjects when the former angles were pre-
sented. These results are consistent with many previous investigations.
20

In the matter of direction of constant bias, the studies in the literature are not
consistent when comparing 45 or 90° quadrants. Jones, *■ * in her review of the literature
on direction of constant bias in the different quadrants, listed studies where over-
estimations prevailed, and other studies where underestimations predominated, for the
same quadrants. Usually there was no attempt by the investigator to determine whether
two different accuracy groups could be identified. The problem of constant bias in
individual judgment has been known since the 18th century.* The relationship between
individual subject direction of constant bias and type of angulation task presented
has received little attention in previous investigations. In the present experiment,
combined results from both groups tend to show underestimations [Fig. 12 (c)]. However,
when the stimulus was a three-dimensional rectangular target, both accuracy groups
overestimated in their judgments of the angles. As a control on position of the standard
stimulus relative to the variable stimulus, the standard stimulus was presented to the
right and then to the left of the variable stimulus the same number of times for the same
angular presentations (Method III). Table V (c) (Appendix) shows quite distinctly that
in the 90° quadrant to the right of zero, when the standard was to the left of the variable
stimulus, 70 judgments were overestimated and 43 underestimated; when the standard
was to the right of the variable stimulus in this same quadrant, there were 39 over-
estimations and 73 underestimations, i.e., a complete reversal. The same reversal situation
took place in the 90° quadrant to the left of zero when the standard and variable stimulus
positions were interchanged.
Thus, at least when the angular stimulus was a three-dimensional rectangle, the
90° quadrant and the position of the standard stimulus relative to the variable stimulus
were determinants of the direction of constant bias. This result demonstrates that, in
some experiments, attention to intra-experimental variables may significantly change
direction of constant bias. The position of the standard relative to the variable stimulus
in previous experiments of angular estimations has not been controlled (cf. Lichte).
The main conclusion to be drawn from the results of the four experiments is that
some subjects will be highly accurate in their judgments of angles regardless of con-
ditions of presentation or reporting, while other subjects will be influenced in level of
accuracy by method of presentation of the stimulus and means of making the report of
their judgments. That is, for a low-accuracy group, manual estimations of angle will
♦The astronomer Bessel in the 18th century found a constant bias in the judgments of different astronomers when they reported the passage of a star across a meridian as a function of the magnitude of the star and the rate of movement across the telescope field.
21
produce significantly fewer errors of accuracy and reduce magnitude of constant bias.
By comparison, a group labeled high-accuracy will have a lower magnitude of error and
show no constant bias.
These results can be used for selection and training of operators of systems such
as SAGE, where operators must estimate direction of bearing of objects. For selection
purposes, to identify a subject as belonging to a high- or low-accuracy group, the simplest
test to give is a short series of angles presented on paper at various angles of the compass
and requiring verbal report of angular estimation (Method I). A high accuracy subject
should have judgments within ±5°, 80% of the time. If low-accuracy subjects have to
be accepted, then the dial estimation mode of reporting should be used rather than
verbal estimate.
22
APPENDIX
TABULAR DATA
The data from the four experiments in this study are presented in the following
tables.
Table I is a record of the percent of judgments by each subject by accuracy class
for each experimental method. For example, for Method I for subject H, 58.1 % of his
judgments of the presented angles were accurate within ±0—5°.
Table II shows the percent of all subjects' judgments for each experimental method
for each accuracy category by 45° quadrant. The cumulative percent of each accuracy
class as the error rate goes higher is also shown for each experimental method.
In Table III, (a), (b), (c), and (d), are the data for each individual subject in each
of the four experiments. Each score represents frequency of reporting, or the number
of times a subject made a judgment, within each 45° quadrant for a particular accuracy
classification. For example, in Table III (a), the score 32 for subject H is the number
of times out of the total (N=55) that the subject made a judgment of the presented stimulus
within ±0—5° accuracy.
Table IV, (a) and (b), displays the percent of judgments by the low- and high-
accuracy groups which were overestimated (+ in Table), underestimated (— in Table), or
reported correctly (0 in Table), in each experiment for each 45° quadrant. The median of
each accuracy class and the grand median of each accuracy class are also given.
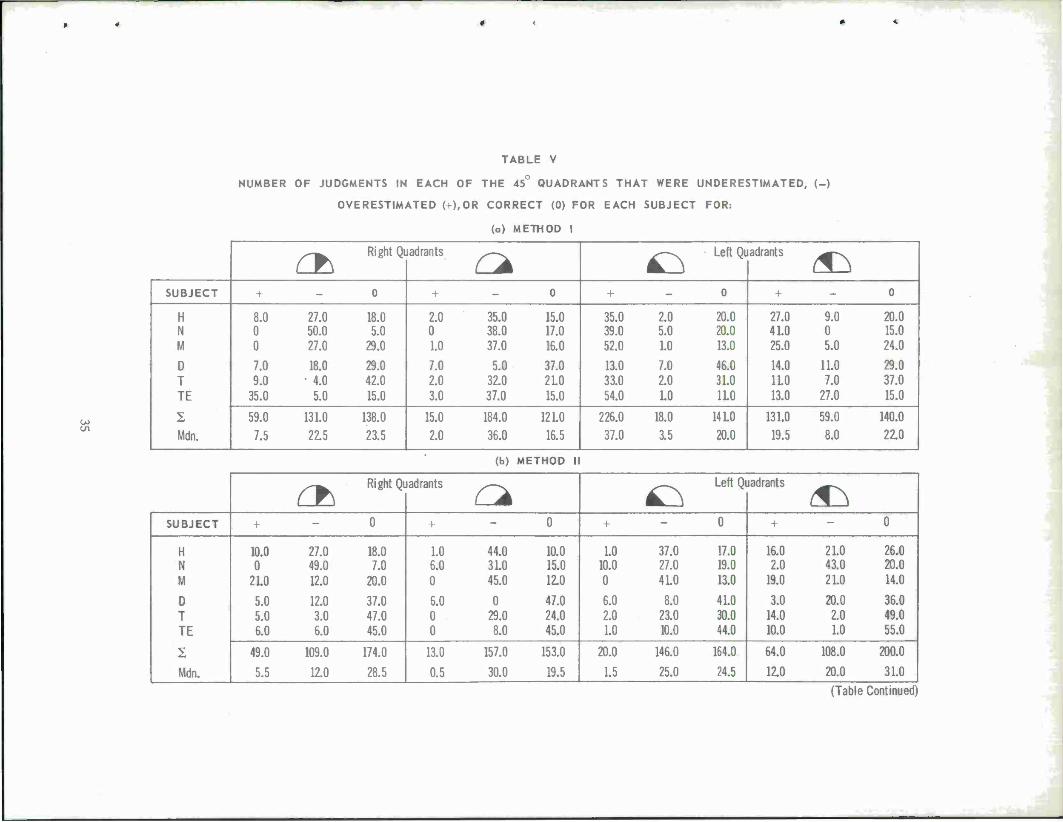
Table V, (a), (b), (c) and (d), shows the number of judgments in each 45° quadrant
which were overestimated, underestimated or reported correctly for each subject for
each method. These data represent frequency of reporting rather than percent of judgments.
23
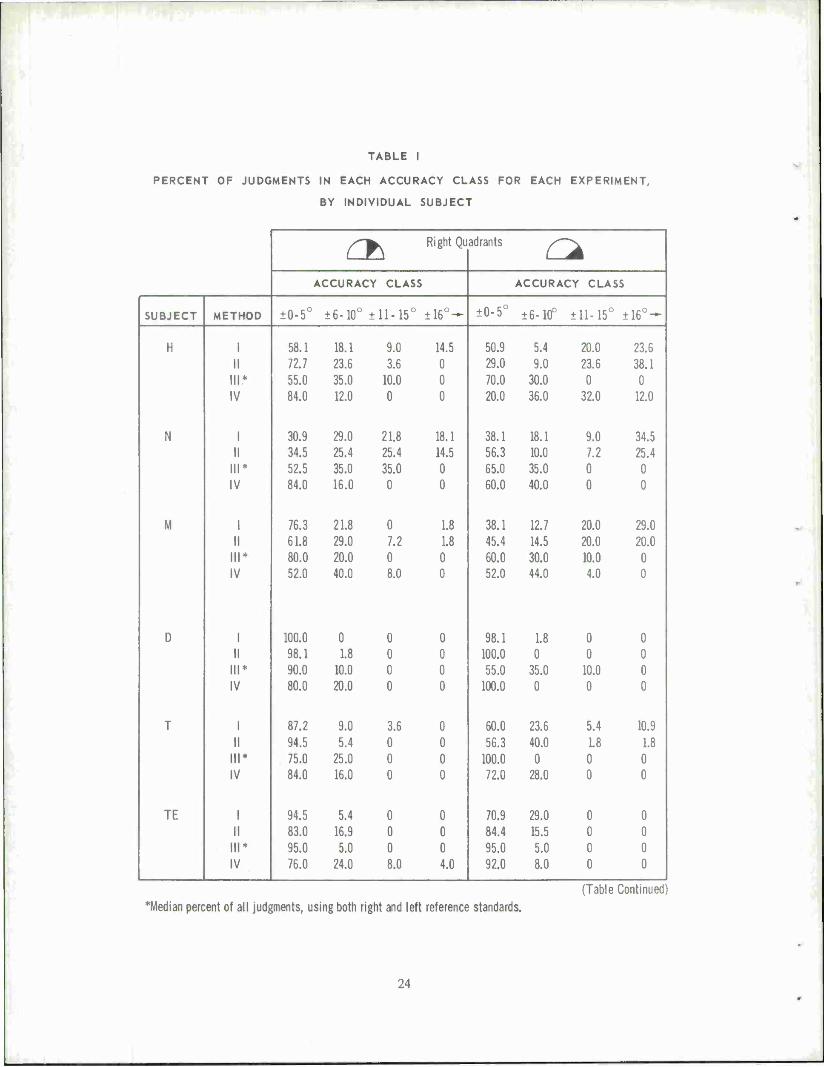
TABLE I
PERCENT OF JUDGMENTS IN EACH ACCURACY CLASS FOR EACH EXPERIMENT,
BY INDIVIDUAL SUBJECT
C£> Right Qu adrants /"~x
ACCURACY CLASS ACCURACY CLASS
SUBJECT METHOD ±0-5° ±6-10° ±11-15° ±16°- ±0-5° ±6-10° ±11-15° ±16°-
H 1 58.1 18.1 9.0 14.5 50.9 5.4 20.0 23.6 II 72.7 23.6 3.6 0 29.0 9.0 23.6 38.1
III* 55.0 35.0 10.0 0 70.0 30.0 0 0 IV 84.0 12.0 0 0 20.0 36.0 32.0 12.0
N 1 30.9 29.0 21.8 18.1 38.1 18.1 9.0 34.5 II 34.5 25.4 25.4 14.5 56.3 10.0 7.2 25.4
III* 52.5 35.0 35.0 0 65.0 35.0 0 0 IV 84.0 16.0 0 0 60.0 40.0 0 0
M 1 76.3 21.8 0 1.8 38.1 12.7 20.0 29.0 II 61.8 29.0 7.2 1.8 45.4 14.5 20.0 20.0
III* 80.0 20.0 0 0 60.0 30.0 10.0 0 IV 52.0 40.0 8.0 0 52.0 44.0 4.0 0
D 1 100.0 0 0 0 98.1 1.8 0 0 II 98.1 1.8 0 0 100.0 0 0 0
III* 90.0 10.0 0 0 55.0 35.0 10.0 0 IV 80.0 20.0 0 0 100.0 0 0 0
T 1 87.2 9.0 3.6 0 60.0 23.6 5.4 10.9 II 94.5 5.4 0 0 56.3 40.0 L8 1.8
III* 75.0 25.0 0 0 100.0 0 0 0 IV 84.0 16.0 0 0 72.0 28.0 0 0
TE 1 94.5 5.4 0 0 70.9 29.0 0 0 II 83.0 16.9 0 0 84.4 15.5 0 0
III* 95.0 5.0 0 0 95.0 5.0 0 0 IV 76.0 24.0 8.0 4.0 92.0 8.0 0 0
(Table Continued) *Median percent of all judgments, using both right and left reference standards.
24
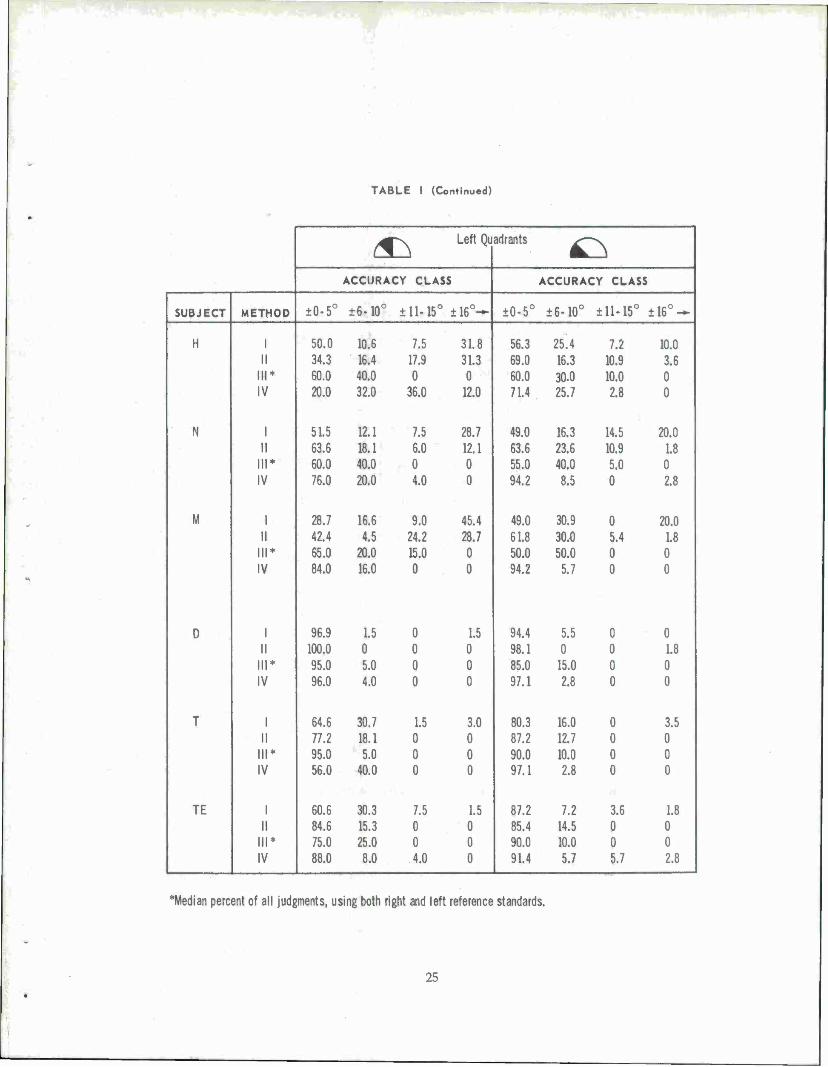
TABLE I (Continued)
£^ Left Qu adrants ^—>^
ACCURACY CLASS ACCURACY CLASS
SUBJECT METHOD ±0-5° ±6-10° ±11-15° ±16°- ±0-5° ±6-10° ±11-15° ±16°-|
H 1 50.0 10.6 7.5 31.8 56.3 25.4 7.2 10.0 II 34.3 16.4 17.9 31.3 69.0 16.3 10.9 3.6
III* 60.0 40.0 0 0 60.0 30.0 10.0 0 IV 20.0 32.0 36.0 12.0 7L4 25.7 2.8 0
N 1 51.5 12.1 7.5 28.7 49.0 16.3 14.5 20.0 II 63.6 18.1 6.0 12.1 63.6 23.6 10.9 1.8
III* 60.0 40.0 0 0 55.0 40.0 5.0 0 IV 76.0 20.0 4.0 0 94.2 8.5 0 2.8
M 1 28.7 16.6 9.0 45.4 49.0 30.9 0 20.0 II 42.4 4.5 24.2 28.7 61.8 30.0 5.4 1.8
III* 65.0 20.0 15.0 0 50.0 50.0 0 0 IV 84.0 16.0 0 0 94.2 5.7 0 0
D 1 96.9 1.5 0 1.5 94.4 5.5 0 0 II 100.0 0 0 0 98.1 0 0 1.8
III* 95.0 5.0 0 0 85.0 15.0 0 0 IV 96.0 4.0 0 0 97.1 2.8 0 0
T 1 64.6 30.7 1.5 3.0 80.3 16.0 0 3.5 II 77.2 18.1 0 0 87.2 12.7 0 0
III* 95.0 5.0 0 0 90.0 10.0 0 0 IV 56.0 40.0 0 0 97.1 2.8 0 0
TE 1 60.6 30.3 7.5 1.5 87.2 7.2 3.6 1.8 II 84.6 15.3 0 0 85.4 14.5 0 0
III* 75.0 25.0 0 0 90.0 10.0 0 0 IV 88.0 8.0 4.0 0 91.4 5.7 5.7 2.8
*Median percent of all judgments, using both right and left reference standards.
25
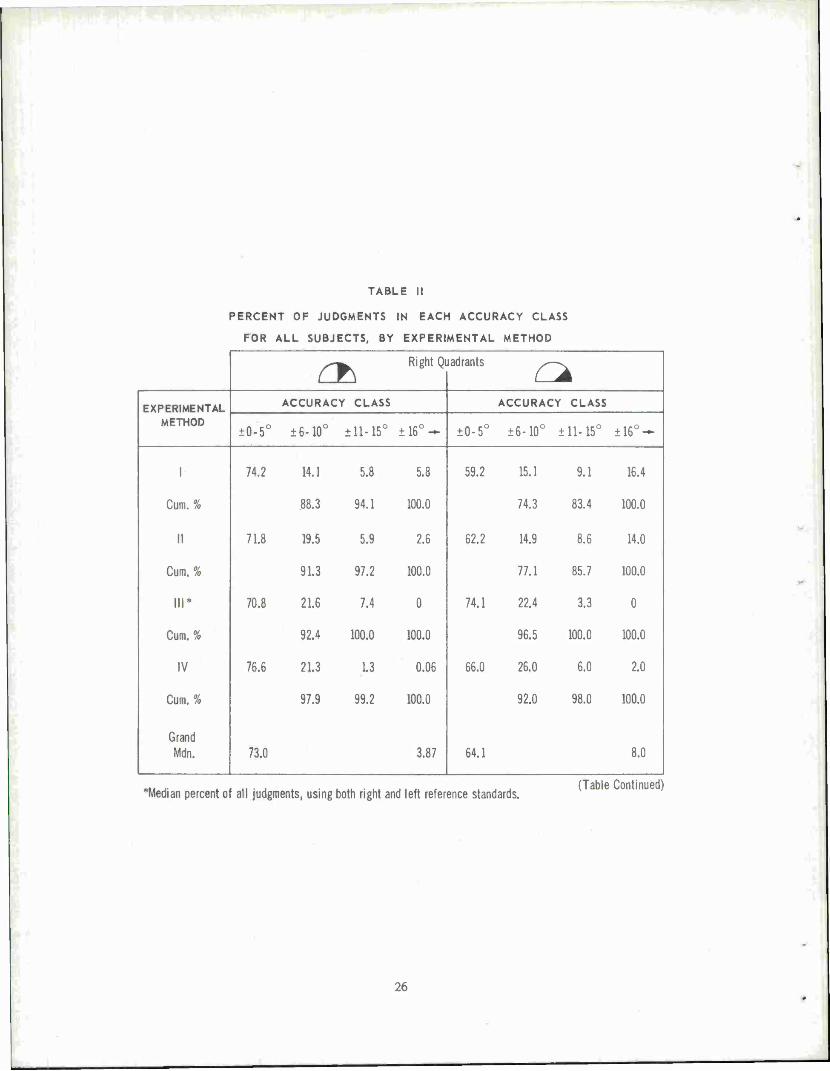
TABLE II
PERCENT OF JUDGMENTS IN EACH ACCURACY CLASS
FOR ALL SUBJECTS, BY EXPERIMENTAL METHOD
EXPERIMENTAL METHOD
Cum. %
II
Cum. %
III*
Cum. %
IV
Cum. %
Grand Mdn.
C*\ Right Quadrants
ACCURACY CLASS
±0-5° ±6-10° ±11-15° ±16°-
74.2
71.8
70.8
76.6
14.1 5.8 5.8
88.3 94.1 100.0
19.5 5.9 2.6
91.3 97.2 100.0
21.6 7.4 0
92.4 100.0 100.0
21.3 1.3 0.06
97.9 99.2 100.0
73.0 3.87
a ACCURACY CLASS
±0-5° ±6-10° ±11-15° ±16°-
59.2
62.2
74.1
66.0
15.1 9.1 16.4
74.3 83.4 100.0
14.9 8.6 14.0
77.1 85.7 100.0
22.4 3.3 0
96.5 100.0 100.0
26.0 6.0 2.0
92.0 98.0 100.0
64.1 8.0
*Median percent of all judgments, using both right and left reference standards. (Table Continued)
26
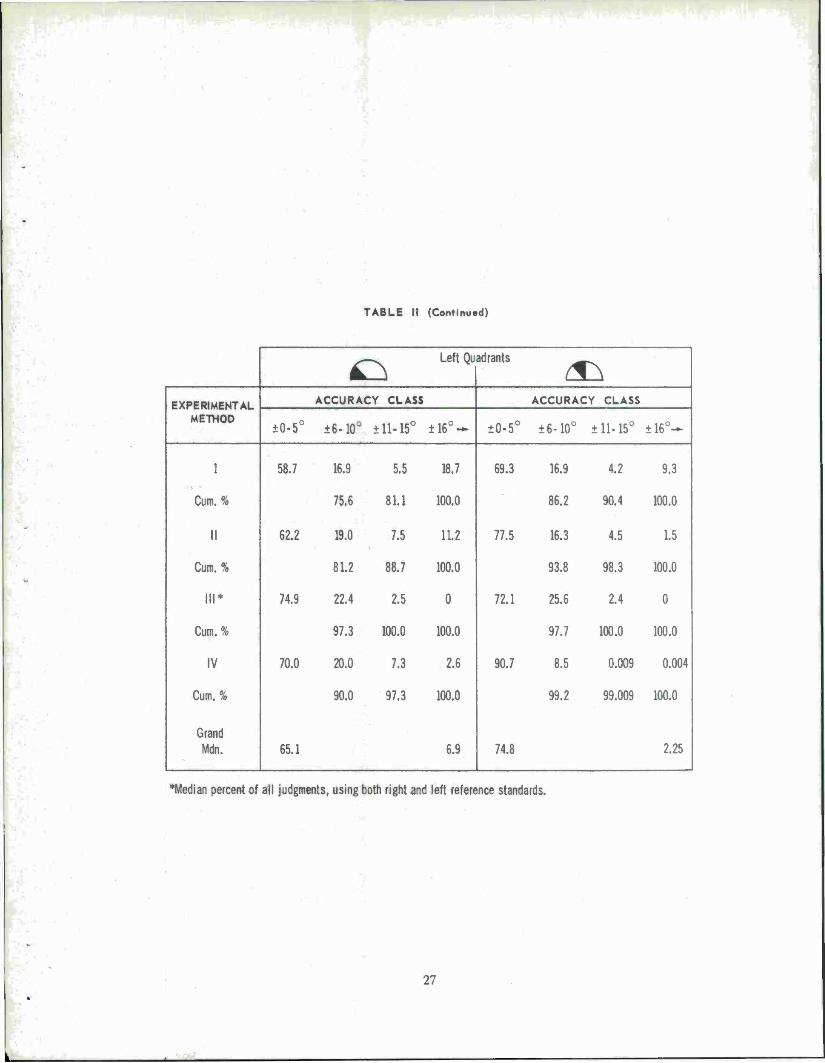
TABLE II (Continued)
<D Left Qu adrants
(TS EXPERIMENTAL ACCURACY CLASS ACCURACY CLASS
METHOD ±0-5° ±6-10° ±11-15° ±16°- ±0-5° ±6-10° ±11-15° ±16°-
1 58.7 16.9 5.5 18.7 69.3 16.9 4.2 9.3
Cum. % 75.6 81.1 100.0 86.2 90.4 100.0
II 62.2 19.0 7.5 11.2 77.5 16.3 4.5 1.5
Cum. % 81.2 88.7 100.0 93.8 98.3 100.0
III* 74.9 22.4 2.5 0 72.1 25.6 2.4 0
Cum. % 97.3 100.0 100.0 97.7 100.0 100.0
IV 70.0 20.0 7.3 2.6 90.7 8.5 0.009 0.004
Cum. % 90.0 97.3 100.0 99.2 99.009 100.0
Grand •
Mdn. 65.1 6.9 74.8 2.25
*Median percent of all judgments, using both right and left reference standards.
27
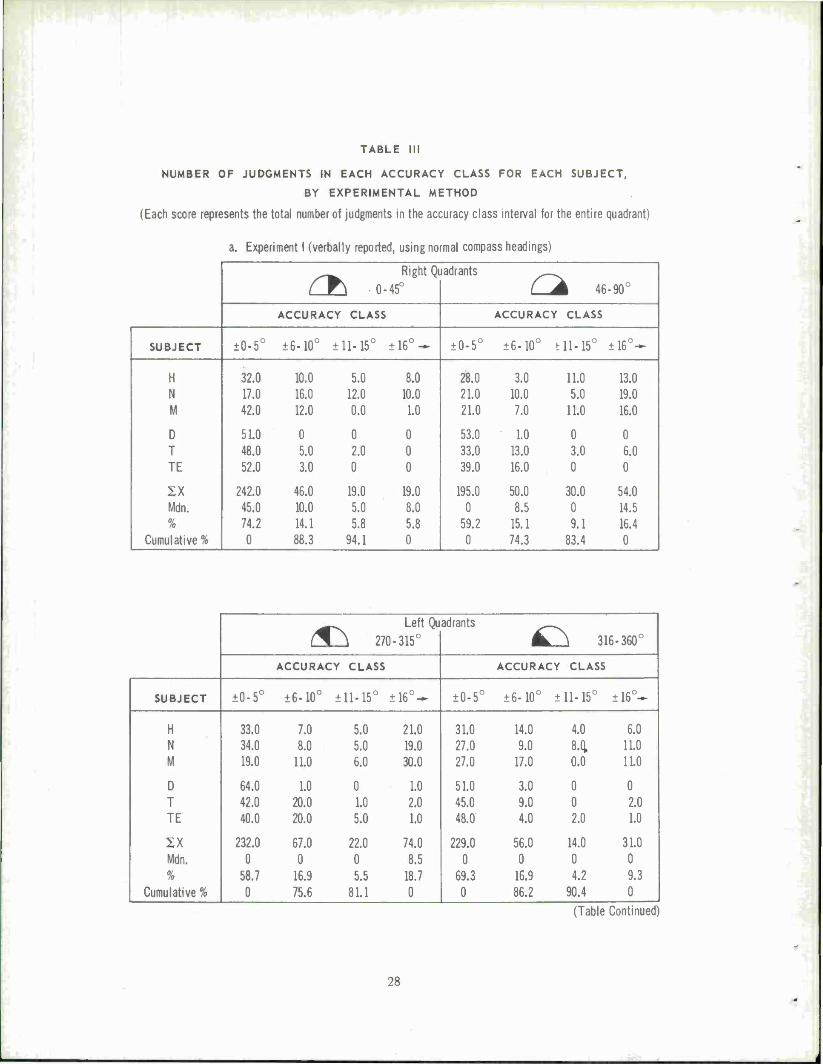
TABLE III
NUMBER OF JUDGMENTS IN EACH ACCURACY CLASS FOR EACH SUBJECT,
BY EXPERIMENTAL METHOD
(Each score represents the total number of judgments in the accuracy class interval for the entire quadrant)
a. Experiment 1 (verbally reported, using normal compass headings)
Right Qi
( T\ 0-4^
ladrants -^
( A 46-90°
ACCURACY CLASS ACCURACY CLASS
SUBJECT ±0-5° ±6-10° ±11-15° ±16°- ±0-5° ±6-10° til-15° ±16°-
H N M
D T TE
SX Mdn. %
Cumulative %
32.0 17.0 42.0
51.0 48.0 52.0
242.0 45.0 74.2 0
10.0 5.0 8.0 16.0 12.0 10.0 12.0 0.0 1.0
0 0 0 5.0 2.0 0 3.0 0 0
46.0 19.0 19.0 10.0 5.0 8.0 14.1 5.8 5.8 88.3 94.1 0
28.0 21.0 21.0
53.0 33.0 39.0
195.0 0
59.2 0
3.0 11.0 10.0 5.0 7.0 11.0
1.0 0 13.0 3.0 16.0 0
50.0 30.0 8.5 0
15.1 9.1 74.3 83.4
13.0 19.0 16.0
0 6.0 0
54.0 14.5 16.4 0
/^\ 270 LeftQu
■315°
ad rants ^^
^_j 316-360°
ACCURACY CLASS ACCURACY CLASS
SUBJECT ±0-5° ±6-10° ±11-15° i :16°- ±0-5° ±6-10° ±11-15° ±16°-
H N M
D T TE
SX Mdn. %
Cumulative %
33.0 34.0 19.0
64.0 42.0 40.0
232.0 0
58.7 0
7.0 5.0 8.0 5.0
11.0 6.0
1.0 0 20.0 1.0 20.0 5.0
67.0 22.0 0 0
16.9 5.5 75.6 81.1
21.0 19.0 30.0
1.0 2.0 1.0
74.0 8.5
18.7 0
31.0 27.0 27.0
51.0 45.0 48.0
229.0 0
69.3 0
14.0 4.0 6.0 9.0 84 1L0
17.0 0.0 11.0
3.0 0 0 9.0 0 2.0 4.0 2.0 1.0
56.0 14.0 31.0 0 0 0
16.9 4.2 9.3 86.2 90.4 0
(Table Continued)
28
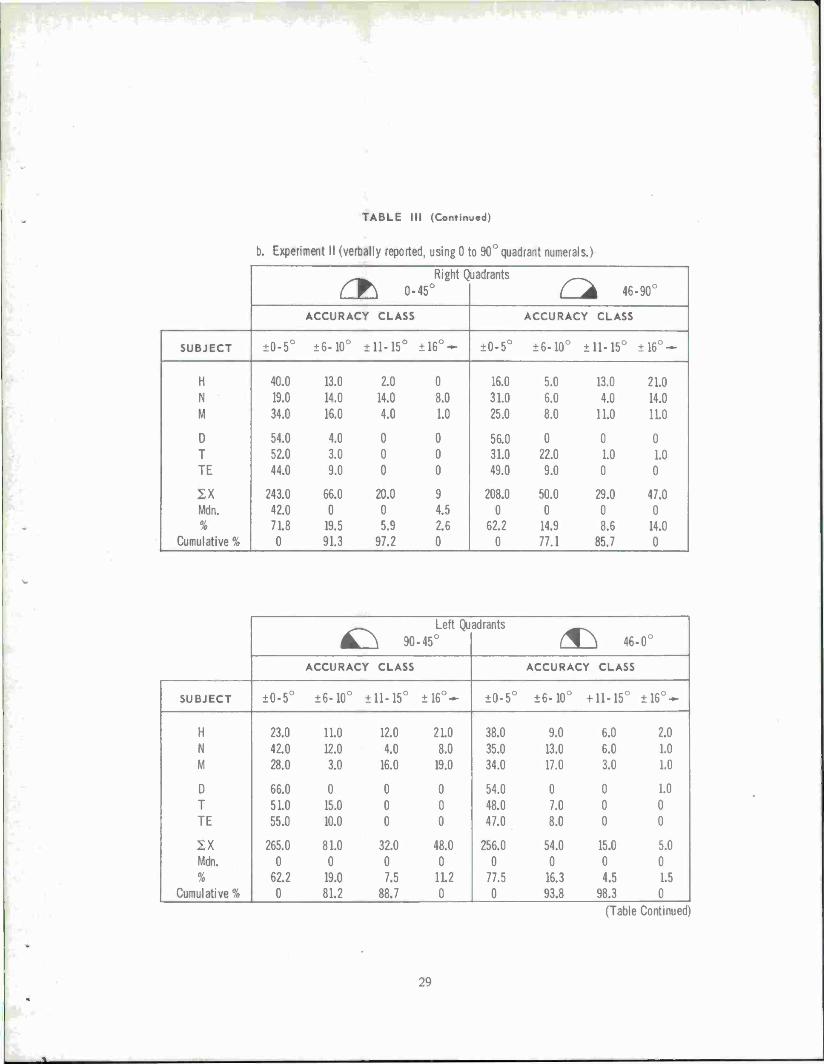
TABLE III (Continued)
b. Experiment II (verbally reported, using 0 to 90° quadrant numerals.)
rr\ o. Right Q
45° uadrants
r^A 46-90° ACCURACY CLASS ACCURACY CLASS
SUBJECT ±0-5° ±6-10° ±11-15° ±16°- ±0-5° ±6-10° ±11-15° ±16°-
H N M
D T TE
IX Mdn. %
Cumulative %
40.0 19.0 34.0
54.0 52.0 44.0
243.0 42.0 71.8 0
13.0 2.0 14.0 14.0 16.0 4.0
4.0 0 3.0 0 9.0 0
66.0 20.0 0 0
19.5 5.9 91.3 97.2
0 8.0 1.0
0 0 0
9 4.5 2.6 0
16.0 31.0 25.0
56.0 31.0 49.0
208.0 0
62.2 0
5.0 13.0 6.0 4.0 8.0 11.0
0 0 22.0 1.0 9.0 0
50.0 29.0 0 0
14.9 8.6 77.1 85.7
21.0 14.0 1L0
0 1.0 0
47.0 0
14.0 0
^~ Left Qu ^J\ 90-45°
adrants f^\ 46-0
0
ACCURACY CLASS ACCURACY CLASS
SUBJECT ±0-5° ±6-10° ±11-15° ±16°- ±0-5° ±6-10° +11-15° ± 16°-
H N M
D T TE
IX Mdn. %
Cumulative %
23.0 42.0 28.0
66.0 51.0 55.0
265.0 0
62.2 0
11.0 12.0 12.0 4.0 3.0 16.0
0 0 15.0 0 10.0 0
81.0 32.0 0 0
19.0 7.5 81.2 88.7
21.0 8.0
19.0
0 0 0
48.0 0
1L2 0
38.0 35.0 34.0
54.0 48.0 47.0
256.0 0
77.5 0
9.0 6.0 13.0 6.0 17.0 3.0
0 0 7.0 0 8.0 0
54.0 15.0 0 0
16.3 4.5 93.8 98.3
2.0 1.0 1.0
1.0 0 0
5.0 0 1.5 0
(Table Continued)
29
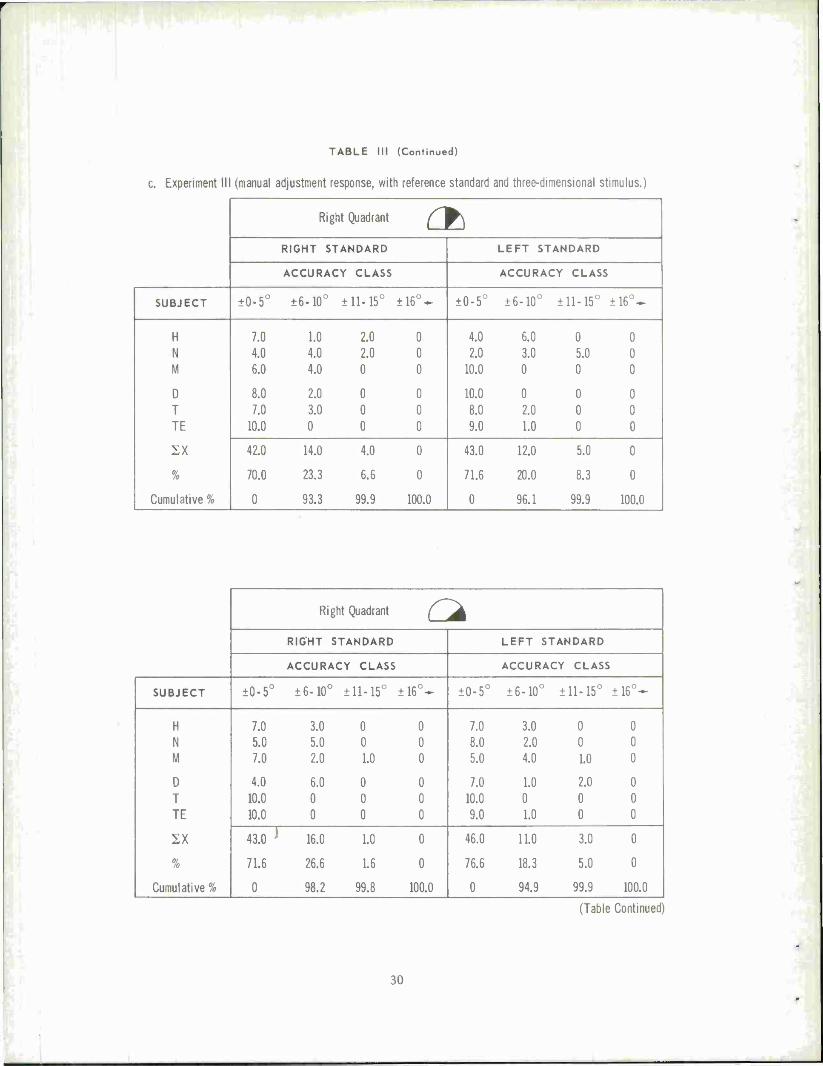
TABLE III (Continued)
c. Experiment III (manual adjustment response, with reference standard and three-dimensional stimulus.'
Right Quadrant Ob RIGHT STANDARD LEFT STANDARD
ACCURACY CLASS ACCURACY CLASS
SUBJECT ±0-5° ±6-10° ±11-15° ±16°- ±0-5° ±6-10° ±11-15° i 16°*
H N M
D T TE
IX
%
Cumulative %
7.0 4.0 6.0
8.0 7.0
10.0
1.0 2.0 4.0 2.0 4.0 0
2.0 0 3.0 0 0 0
0 0 0
0 0 0
4.0 2.0
10.0
10.0 8.0 9.0
6.0 0 3.0 5.0 0 0
0 0 2.0 0 1.0 0
0 0 0
0 0 0
42.0
70.0
0
14.0 4.0
23.3 6.6
93.3 99.9
0
0
100.0
43.0
71.6
0
12.0 5.0
20.0 8.3
96.1 99.9
0
0
100.0
Right Quadrant CÄ RIGHT STANDARD LEFT STANDARD
ACCURACY CLASS ACCURACY CLASS
SUBJECT ±0-5° ±6-10° ±11-15° t 16°- ±0-5° ±6-10° ±11-15° i :16°-
H N M
D T TE
XX
%
Cumulative %
7.0 5.0 7.0
4.0 10.0 10.0
3.0 0 5.0 0 2.0 1.0
6.0 0 0 0 0 0
0 0 0
0 0 0
7.0 8.0 5.0
7.0 10.0 9.0
3.0 0 2.0 0 4.0 1.0
1.0 2.0 0 0 1.0 0
0 0 0
0 0 0
43.0 j
71.6
0
16.0 1.0
26.6 1.6
98.2 99.8
0
0
100.0
46.0
76.6
0
11.0 3.0
18.3 5.0
94.9 99.9
0
0
100.0
(Table Continued)
30
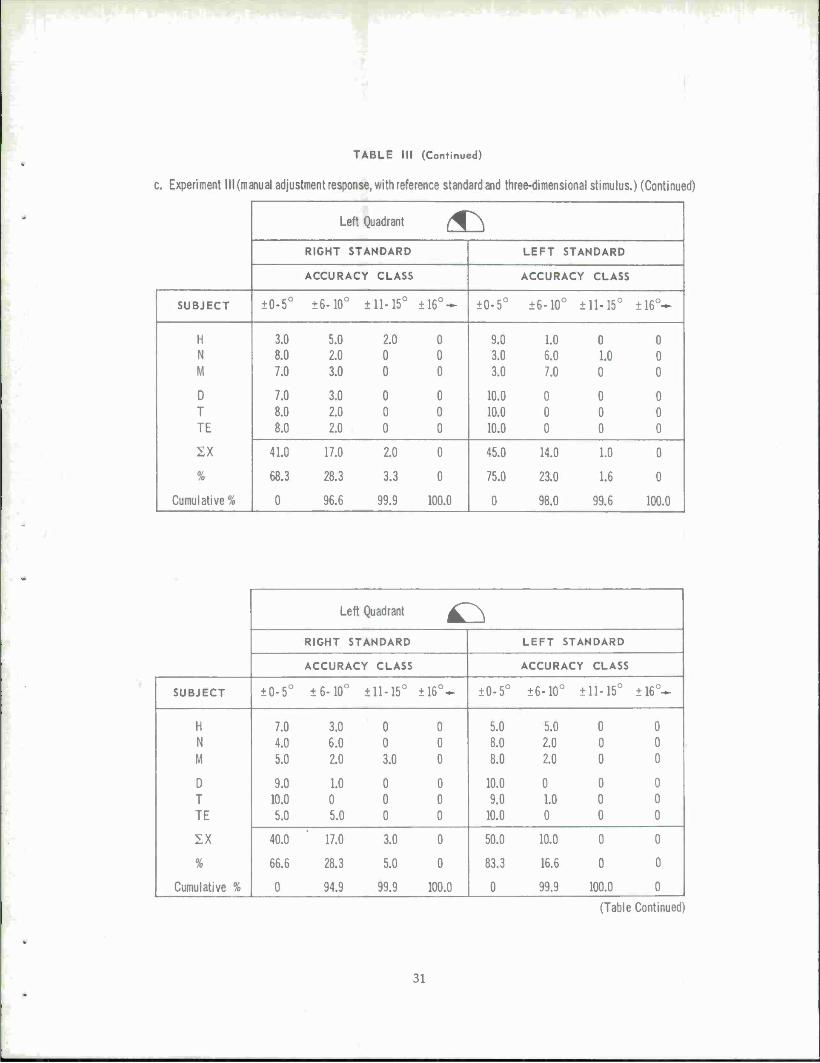
TABLE III (Continued)
c. Experiment III (manual adjustment response, with reference standard and three-dimensional stimulus.) (Continued)
Left Quadrant <£} RIGHT STANDARD LEFT STANDARD
ACCURACY CLASS ACCURACY CLASS
SUBJECT ±0-5° ±6-10° ±11-15° ±16°- ±0-5° ±6-10° ±11-15° ±16°-
H N M
D T TE
IX
%
Cumulative %
3.0 8.0 7.0
7.0 8.0 8.0
5.0 2.0 2.0 0 3.0 0
3.0 0 2.0 0 2.0 0
0 0 0
0 0 0
9.0 3.0 3.0
10.0 10.0 10.0
1.0 0 6.0 1.0 7.0 0
0 0 0 0 0 0
0 0 0
0 0 0
41.0
68.3
0
17.0 2.0
28.3 3.3
96.6 99.9
0
0
100.0
45.0
75.0
0
14.0 1.0
23.0 1.6
98.0 99.6
0
0
100.0
Left Quadrant 4^ RIGHT STANDARD LEFT STANDARD
ACCURACY CLASS ACCURACY CLASS
SUBJECT ±0-5° ±6-10° ±11-15° ±16°- ±0-5° ±6-10° ±11-15° ±16°-
H N M
D T TE
IX
%
Cumulative %
7.0 4.0 5.0
9.0 10.0 5.0
3.0 0 6.0 0 2.0 3.0
1.0 0 0 0 5.0 0
0 0 0
0 0 0
5.0 8.0 8.0
10.0 9.0
10.0
5.0 0 2.0 0 2.0 0
0 0 1.0 0 0 0
0 0 0
0 0 0
40.0
66.6
0
17.0 3.0
28.3 5.0
94.9 99.9
0
0
100.0
50.0
83.3
0
10.0 0
16.6 0
99.9 100.0
0
0
0
(Table Continued)
31
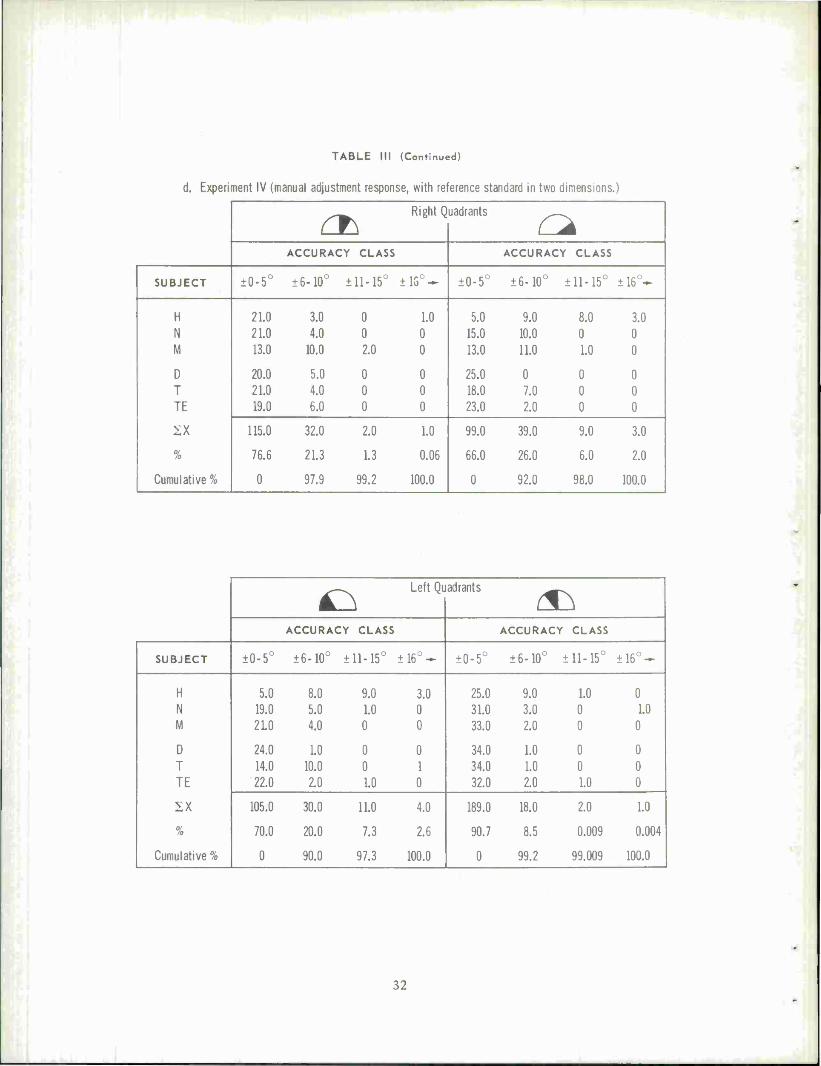
TABLE III (Continued)
d. Experiment IV (manual adjustment response, with reference standard in two dimensions.)
£fc Right Quadrants
CÄ ACCURACY CLASS ACCURACY CLASS
SUBJECT ±0-5° ±6-10° ±11-15° ±15°- ±0-5° ±6-10° ±11-15° ±16°-
H N M
D T TE
SX
%
Cumulative %
21.0 21.0 13.0
20.0 21.0 19.0
3.0 0 4.0 0
10.0 2.0
5.0 0 4.0 0 6.0 0
1.0 0 0
0 0 0
5.0 15.0 13.0
25.0 18.0 23.0
9.0 8.0 10.0 0 11.0 1.0
0 0 7.0 0 2.0 0
3.0 0 0
0 0 0
115.0
76.6
0
32.0 2.0
21.3 1.3
97.9 99.2
1.0
0.06
100.0
99.0
66.0
0
39.0 9.0
26.0 6.0
92.0 98.0
3.0
2.0
100.0
^-^ Left Qu adrants
(3^ ACCURACY CLASS ACCURACY CLASS
SUBJECT ±0-5° ±6-10° ±11-15° il6°- ±0-5° ±6-10° ±11-15° ±16°-
H N M
D T TE
XX
%
Cumulative %
5.0 19.0 21.0
24.0 14.0 22.0
8.0 9.0 5.0 LO 4.0 0
1.0 0 10.0 0 2.0 LO
3.0 0 0
0 1 0
25.0 31.0 33.0
34.0 34.0 32.0
9.0 1.0 3.0 0 2.0 0
1.0 0 LO 0 2.0 LO
0 1.0
0
0 0 0
105.0
70.0
0
30.0 11.0
20.0 7.3
90.0 97.3
4.0
2.6
100.0
189.0
90.7
0
18.0 2.0
8.5 0.009
99.2 99.009
1.0
0.004
100.0
32
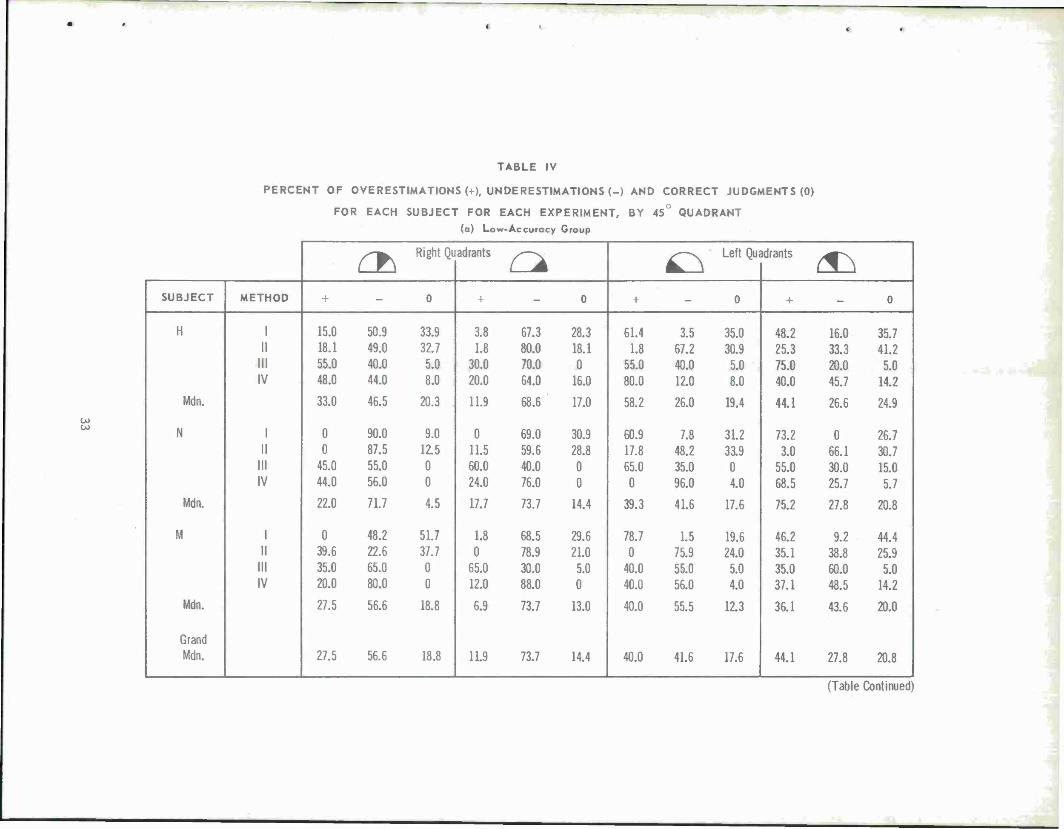
TABLE IV
PERCENT OF OVERESTIMATIONS (+), UNDERESTIMATES (-) AND CORRECT JUDGMENTS (0)
FOR EACH SUBJECT FOR EACH EXPERIMENT, BY 45° QUADRANT
s
(a) Lov '-Accuracy Group
Cf\ Right Qu adrants s—^ C> Left Quadrants (%T\ SUBJECT METHOD + - 0 + - 0 + - 0 + - 0
H 1 15.0 50.9 33.9 3.8 67.3 28.3 61.4 3.5 35.0 48.2 16.0 35.7 II 18.1 49.0 32.7 1.8 80.0 18.1 1.8 67.2 30.9 25.3 33.3 41.2
III 55.0 40.0 5.0 30.0 70.0 0 55.0 40.0 5.0 75.0 20.0 5.0 IV 48.0 44.0 8.0 20.0 64.0 16.0 80.0 12.0 8.0 40.0 45.7 14.2
Mdn. 33.0 46.5 20.3 11.9 68.6 17.0 58.2 26.0 19.4 44.1 26.6 24.9
N 1 0 90.0 9.0 0 69.0 30.9 60.9 7.8 31.2 73.2 0 26.7 II 0 87.5 12.5 11.5 59.6 28.8 17.8 48.2 33.9 3.0 66.1 30.7
III 45.0 55.0 0 60.0 40.0 0 65.0 35.0 0 55.0 30.0 15.0 IV 44.0 56.0 0 24.0 76.0 0 0 96.0 4.0 68.5 25.7 5.7
Mdn. 22.0 71.7 4.5 17.7 73.7 14.4 39.3 41.6 17.6 75.2 27.8 20.8
M 1 0 48.2 51.7 1.8 68.5 29.6 78.7 1.5 19.6 46.2 9.2 44.4 II 39.6 22.6 37.7 0 78.9 21.0 0 75.9 24.0 35.1 38.8 25.9
III 35.0 65.0 0 65.0 30.0 5.0 40.0 55.0 5.0 35.0 60.0 5.0 IV 20.0 80.0 0 12.0 88.0 0 40.0 56.0 4.0 37.1 48.5 14.2
Mdn. 27.5 56.6 18.8 6.9 73.7 13.0 40.0 55.5 12.3 36.1 43.6 20.0
Grand Mdn. 27.5 56.6 18.8 11.9 73.7 14.4 40.0 41.6 17.6 44.1 27.8 20.8
(Table Continued)
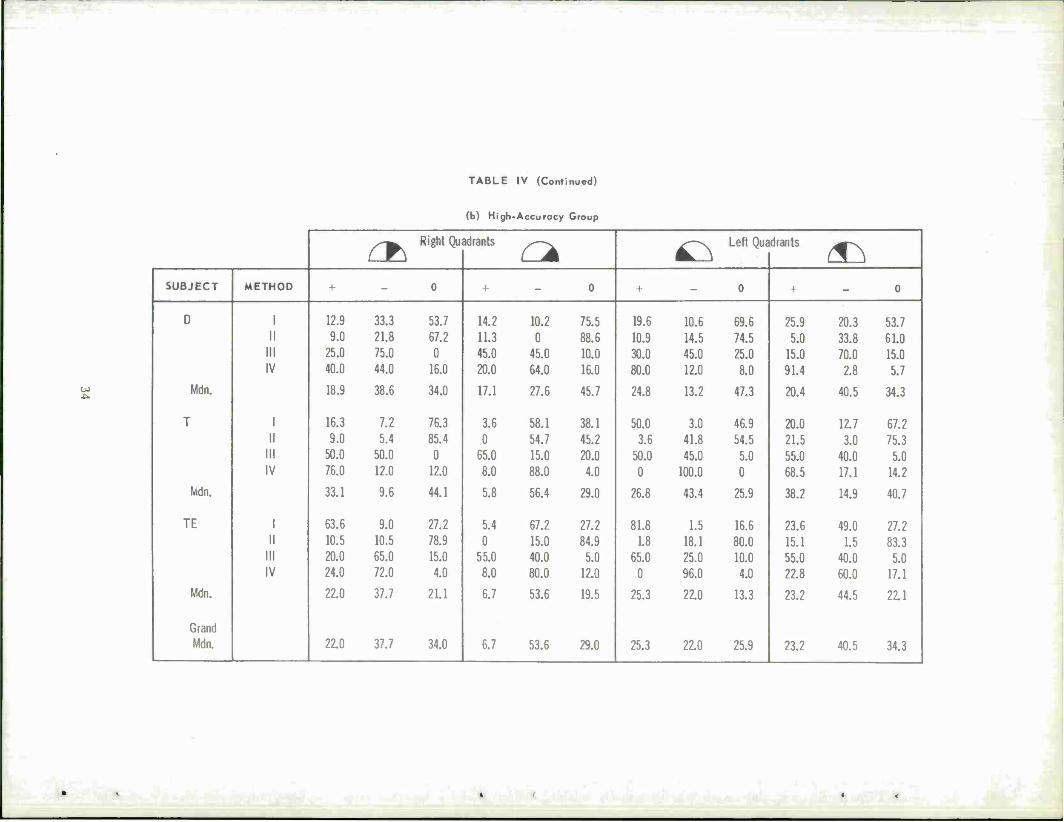
TABLE IV (Continued)
u>
(b) High ■Accuracy Group
CT\ Right Qu adrants ^—v 4^ Left Quadrants (%T\
SUBJECT METHOD + - 0 + - 0 + - 0 + - 0
D 1 12.9 33.3 53.7 14.2 10.2 75.5 19.6 10.6 69.6 25.9 20.3 53.7 II 9.0 21.8 67.2 11.3 0 88.6 10.9 14.5 74.5 5.0 33.8 6L0
III 25.0 75.0 0 45.0 45.0 10.0 30.0 45.0 25.0 15.0 70.0 15.0 IV 40.0 44.0 16.0 20.0 64.0 16.0 80.0 12.0 8.0 91.4 2.8 5.7
Mdn. 18.9 38.6 34.0 17.1 27.6 45.7 24.8 13.2 47.3 20.4 40.5 34.3
T 1 16.3 7.2 76.3 3.6 58.1 38.1 50.0 3.0 46.9 20.0 12.7 67.2 II 9.0 5.4 85.4 0 54.7 45.2 3.6 41.8 54.5 21.5 3.0 75.3
III 50.0 50.0 0 65.0 15.0 20.0 50.0 45.0 5.0 55.0 40.0 5.0 IV 76.0 12.0 12.0 8.0 88.0 4.0 0 100.0 0 68.5 17.1 14.2
Mdn. 33.1 9.6 44.1 5.8 56.4 29.0 26.8 43.4 25.9 38.2 14.9 40.7
TE 1 63.6 9.0 27.2 5.4 67.2 27.2 81.8 1.5 16.6 23.6 49.0 27.2 II 10.5 10.5 78.9 0 15.0 84.9 1.8 18.1 80.0 15.1 1.5 83.3
III 20.0 65.0 15.0 55.0 40.0 5.0 65.0 25.0 10.0 55.0 40.0 5.0 IV 24.0 72.0 4.0 8.0 80.0 12.0 0 96.0 4.0 22.8 60.0 17.1
Mdn. 22.0 37.7 21.1 6.7 53.6 19.5 25.3 22.0 13.3 23.2 44.5 22.1
Grand Mdn. 22.0 37.7 34.0 6.7 53.6 29.0 25.3 22.0 25.9 23.2 40.5 34.3
K
TABLE V o
NUMBER OF JUDGMENTS IN EACH OF THE 45 QUADRANTS THAT WERE UNDERESTIMATED, (-)
OVERESTIMATED (+),OR CORRECT (0) FOR EACH SUBJECT FOR:
(a) METHOD I
rr\ Right Qi J ad rants ^—^ d Left Quadrants (T\ SUBJECT + - 0 + - 0 + - 0 + - 0
H N M
D T TE
2 Mdn.
8.0 0 0
7.0 9.0
35.0
27.0 50.0 27.0
18.0 • 4.0
5.0
18.0 5.0
29.0
29.0 42.0 15.0
2.0 0 1.0
7.0 2.0 3.0
35.0 38.0 37.0
5.0 32.0 37.0
15.0 17.0 16.0
37.0 21.0 15.0
35.0 39.0 52.0
13.0 33.0 54.0
2.0 5.0 1.0
7.0 2.0 1.0
20.0 20.0 13.0
46.0 31.0 1L0
27.0 41.0 25.0
14.0 11.0 13.0
9.0 0 5.0
11.0 7.0
27.0
20.0 15.0 24.0
29.0 37.0 15.0
59.0 7.5
131.0 22.5
138.0 23.5
15.0 2.0
184.0 36.0
121.0 16.5
226.0 37.0
18.0 3.5
14 L0 20.0
131.0 19.5
59.0 8.0
140.0 22.0
(b) METHOD II
rt\ Right Qi jadrants ^—. ^
Left Quadrants
rt^ SUBJECT + - 0 + - 0 + - 0 + - 0
H 10.0 27.0 18.0 1.0 44.0 10.0 1.0 37.0 17.0 16.0 2L0 26.0 N 0 49.0 7.0 6.0 31.0 15.0 10.0 27.0 19.0 2.0 43.0 20.0 M 2L0 12.0 20.0 0 45.0 12.0 0 4L0 13.0 19.0 2L0 14.0
D 5.0 12.0 37.0 6.0 0 47.0 6.0 8.0 41.0 3.0 20.0 36.0 T 5.0 3.0 47.0 0 29.0 24.0 2.0 23.0 30.0 14.0 2.0 49.0 TE
2 6.0 6.0 45.0 0 8.0 45.0 1.0 10.0 44.0 10.0 1.0 55.0
49.0 109.0 174.0 13.0 157.0 153.0 20.0 146.0 164.0 64.0 108.0 200.0
Mdn. 5.5 12.0 28.5 0.5 30.0 19.5 1.5 25.0 24.5 12.0 20.0 31.0 (Table Continued)
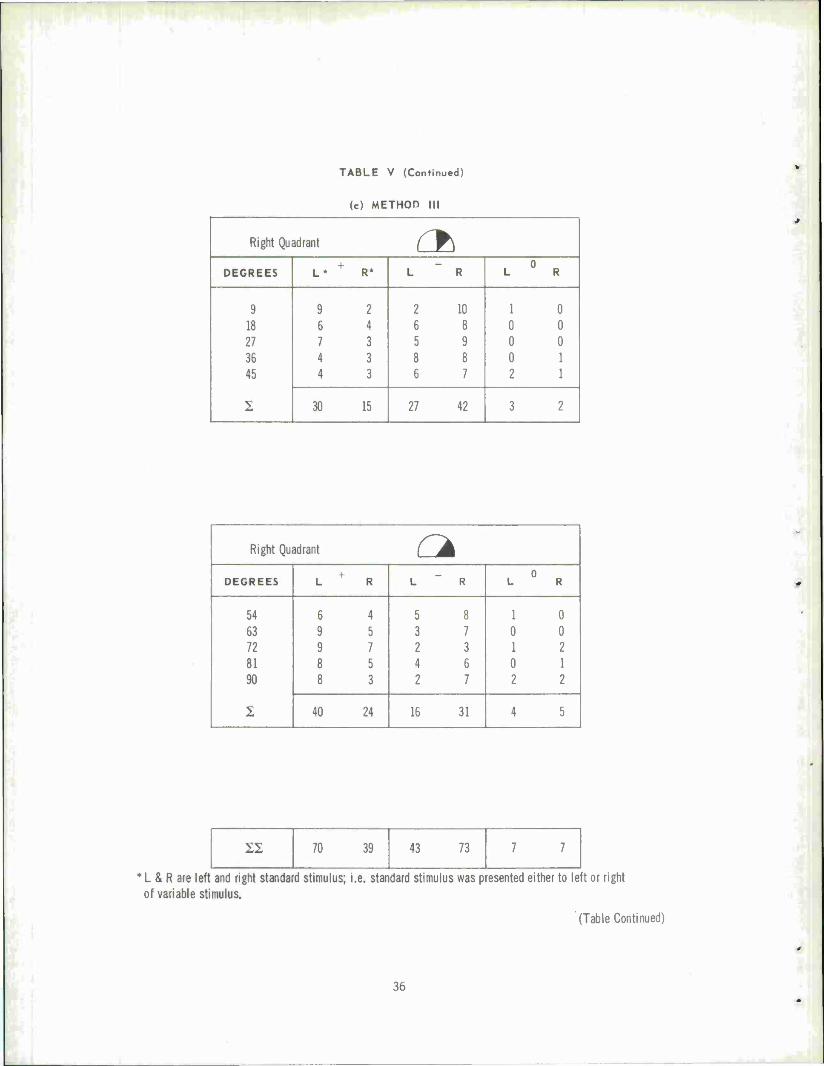
TABLE V (Continued)
(c) METHOD II!
Right Quadrant Ob 4 _ c
DEGREES L* R* L R L R
9 9 2 2 10 1 0 18 6 4 6 8 0 0 27 7 3 5 9 0 0 36 4 3 8 8 0 1 45
2
4 3 6 7 2 1
30 15 27 42 3 2
Right Quadrant Ck DEGREES L + R L " R L ° R
54 6 4 5 8 1 0 63 9 5 3 7 0 0 72 9 7 2 3 1 2 81 8 5 4 6 0 1 90
2
8 3 2 7 2 2
40 24 16 31 4 5
22 70 39 43 73 7 7
*L & R are left and right standard stimulus; i.e. standard stimulus was presented either to left or right of variable stimulus.
(Table Continued)
36
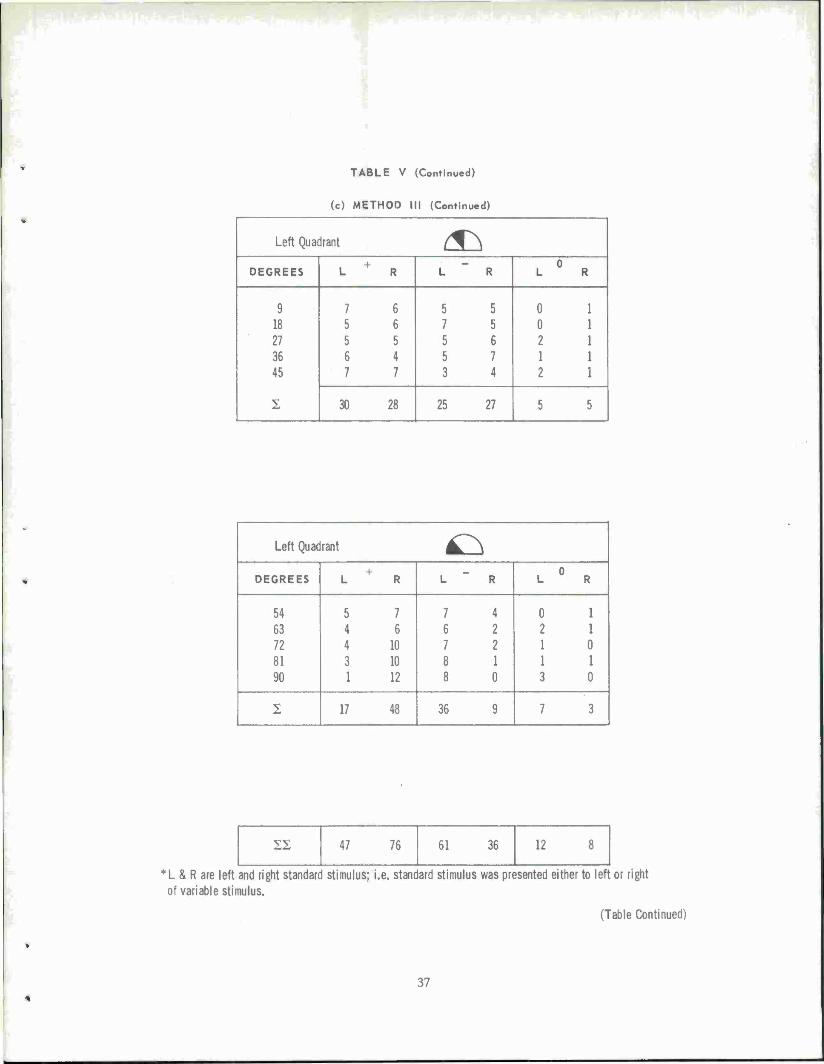
TABLE V (Continued)
(c) METHOO III (Continued)
Left Quadrant ^ + _ 0
DEGREES L R L R L R
9 7 6 5 5 0 18 5 6 7 5 0 27 5 5 5 6 2 36 6 4 5 7 1 45
1
7 7 3 4 2
30 28 25 27 5 5
Left Quadrant £^ DEGREES L < R L R R
54 5 7 7 4 0 1 63 4 6 6 2 2 1 72 4 10 7 2 1 0 81 3 10 8 1 1 1 90 1 12 8 0 3 0
1 17 48 36 9 7 3
22 47 76 61 36 12
*L & R are left and right standard stimulus; i.e. standard stimulus was presented either to left or right of variable stimulus.
(Table Continued)
37
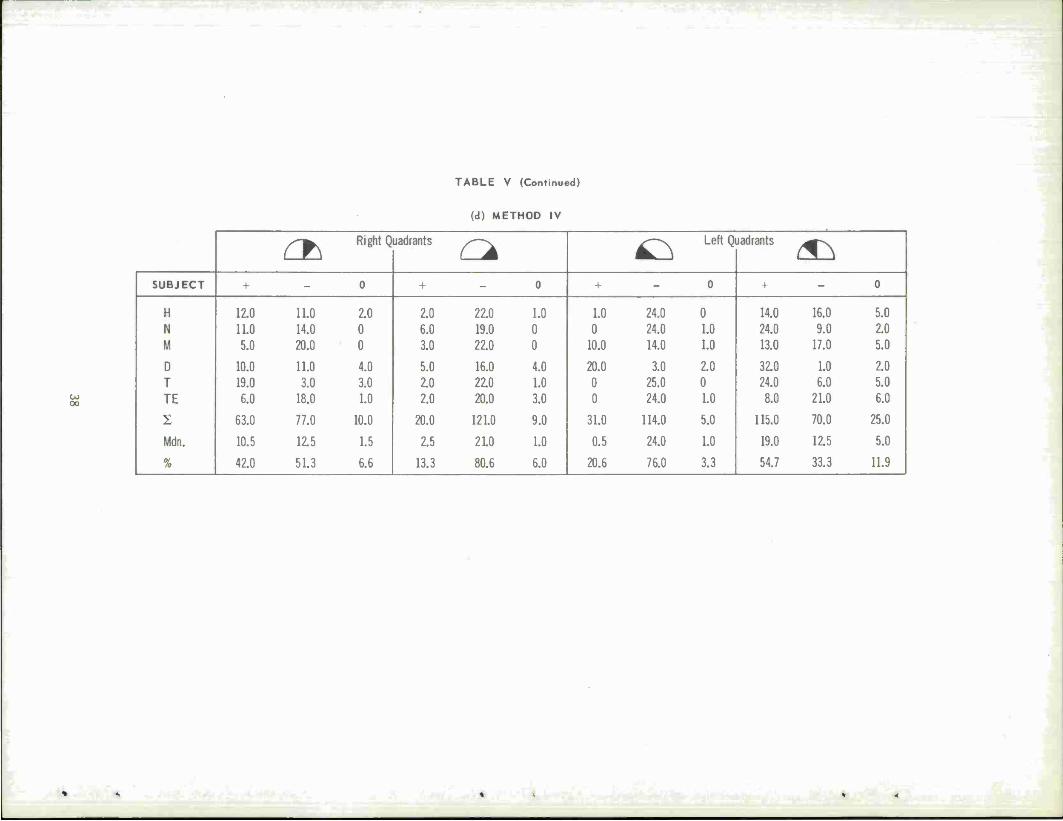
TABLE V (Continued)
DC
(d) METHOD IV
rt\ Right Quadrants a *^ Left Quadrants
^
SUBJECT + - 0 + 0 + - 0 + - 0
H 12.0 11.0 2.0 2.0 2Z0 1.0 1.0 24.0 0 14.0 16.0 5.0 N 11.0 14.0 0 6.0 19.0 0 0 24.0 1.0 24.0 9.0 2.0 M 5.0 20.0 0 3.0 22.0 0 10.0 14.0 1.0 13.0 17.0 5.0
D 10.0 11.0 4.0 5.0 16.0 4.0 20.0 3.0 2.0 32.0 1.0 2.0 T 19.0 3.0 3.0 2.0 2Z0 1.0 0 25.0 0 24.0 6.0 5.0 TE 6.0 18.0 1.0 2.0 20.0 3.0 0 24.0 1.0 8.0 21.0 6.0
2 63.0 77.0 10.0 20.0 121.0 9.0 31.0 114.0 5.0 115.0 70.0 25.0
Mdn. 10.5 12.5 1.5 2.5 21.0 1.0 0.5 24.0 1.0 19.0 12.5 5.0
% 42.0 51.3 6.6 13.3 80.6 6.0 20.6 76.0 3.3 54.7 33.3 11.9
«
REFERENCES
*Mari Jones, "A Review of the Literature on Human Discrimination of Angular Position."
Unpublished manuscript. The MITRE Corporation 1962.
2C. A. Baker and W. F. Grether, "Visual Presentation of Material." USAF, WADC
Technical Report No. 54-160, August 1954.
3S. L. Smith, "Angular Estimation," Journal of Applied Psychology, 1962, 46, 240-246.
4E. A. Garvin, "Estimations of the Angle of Apparent Rotation of a Rectangular Target
by the Stereoscopic Method as a Function of Difference in Width of the Targets."
Unpublished manuscript. 1963.
5H. Leibowitz, T. Bussey and P. McGuire, "Shape and Size Constancy in Photographic
Reproductions," Journal of the Optical Society of America, 1957, 47, 658-661.
6J. Beck and J. J. Gibson, "The Relation of Apparent Shape to Apparent Slant in the
Perception of Objects," Journal of Experimental Psychology, 1955, 50, 125-133.
J. Langdon, "The Perception of Changing Shape," Quarterly Journal of Experimental
Psychology, 1951, 3, 157-165.
8H. E. Gruber and W. C. Clark, "Perception of Slanted Surfaces," Perceptual and Motor
Skills, 1956, 6, 97-106.
9Bertha K. Stravrianos, "The Relation of Shape-Perception to Explicit Judgments of
Inclination," Archives of Psychology, 296, 1945.
W. W. Moore, "Experiments on the Constancy of Shape," British Journal of Psychology,
1938, 29, 104-116.
nW. H. Lichte, "Shape Constancy: Dependence upon Angle of Rotation. Individual
Differences," Journal of Experimental Psychology, 1952, 43, 49-57.
J. Coules and M. A. Lekarczyk, "Form Constancy of Irregular Shapes of Varying
Complexity." Paper presented at Eastern Psychological Association, April 1963.
13S. Rogers, J. Volkmann, R. W. Reese and E. L. Kaufman, "Accuracy and Variability
of Direct Estimates of Bearing from Large Display Screens." ONR Special Devices
Center Technical Report No. 166-I-MHC-l, May 1947.
39
REFERENCES (Continued)
14A. Chapanis, "Studies of Manual Rotary Positioning Movements: II. The Accuracy
of Estimating the Position of an Indicator Knob," Journal of Psychology. 1951, 31, 65-71.
H. F. Crovitz and K. Zener, "A Group-test for Assessing Hand- and Eye- Dominance."
American Journal of Psychology, 1962, 75, 271-276.
16W. F. Grether, "Instrument Reading: I. The Design of Long Scale Indicators for
Speed and Accuracy of Quantitative Reading," Journal of Applied Psychology, 1949,
33, 363-372.
40