Embed Size (px)
Citation preview

IZA DP No. 3404
Individual Incentives in Program Participation:Splitting up the Process in Assignment and Enrollment
Andrea Weber
DI
SC
US
SI
ON
PA
PE
R S
ER
IE
S
Forschungsinstitutzur Zukunft der ArbeitInstitute for the Studyof Labor
March 2008

Individual Incentives in Program
Participation: Splitting up the Process in Assignment and Enrollment
Andrea Weber RWI Essen, UC Berkeley,
IHS Vienna, CESifo and IZA
Discussion Paper No. 3404 March 2008
IZA
P.O. Box 7240 53072 Bonn
Germany
Phone: +49-228-3894-0 Fax: +49-228-3894-180
E-mail: [email protected]
Any opinions expressed here are those of the author(s) and not those of IZA. Research published in this series may include views on policy, but the institute itself takes no institutional policy positions. The Institute for the Study of Labor (IZA) in Bonn is a local and virtual international research center and a place of communication between science, politics and business. IZA is an independent nonprofit organization supported by Deutsche Post World Net. The center is associated with the University of Bonn and offers a stimulating research environment through its international network, workshops and conferences, data service, project support, research visits and doctoral program. IZA engages in (i) original and internationally competitive research in all fields of labor economics, (ii) development of policy concepts, and (iii) dissemination of research results and concepts to the interested public. IZA Discussion Papers often represent preliminary work and are circulated to encourage discussion. Citation of such a paper should account for its provisional character. A revised version may be available directly from the author.

IZA Discussion Paper No. 3404 March 2008
ABSTRACT
Individual Incentives in Program Participation: Splitting up the Process in Assignment and Enrollment*
In this paper we investigate two stages in the process that leads to participation in ALMP programs. We use unique administrative data from the Austrian unemployment registers which allow us to distinguish between caseworker assignment and actual program enrollment. Although 25% of newly unemployed workers are assigned to a program, only half of them enroll and participate in the program longer than 5 days. This difference between assignment and enrollment rates cannot be explained by job entries, program cancelations, or rejected program applications alone. Therefore we analyze the influence of observable characteristics on each stage of the participation process. We find that beside policy regulations individual worker incentives play an important role in determining program participation. JEL Classification: J24, J68 Keywords: unemployment, active labor market policy, evaluation Corresponding author: Andrea Weber UC Berkeley 549 Evans Hall #3880 Berkeley, CA 94720-3880 USA E-mail: [email protected]
* Financial support for this research was provided by the Austrian National Bank, Jubilaeumsfonds grant no. 10823. All errors and opinions are the author's sole responsibility.
1 Introduction
In the literature on empirical evaluation of social programs the problem of non-
random selection of participants has a central role. Yet, detailed information on
the participation process is rarely available and so the underlying identification
assumptions remain largely un-testable. In this paper we use unique data that
provide information on assignments as well as enrollments into programs of
active labor market policy (ALMP) in Austria. This allows us to decompose
the participation process in two separate stages: the assignment stage where the
unemployed worker receives notice of an open program slot, and the enrollment
stage which starts when the worker actually enrolls and participates in the
assigned program. We use the analytical framework developed by Heckman
and Smith (2004) to separately analyze the empirical determinants at each
stage of the participation process.
A detailed analysis of the participation process in is important for several rea-
sons. First and most general, it provides insights on inequalities in the alloca-
tion of public benefits, which might not only depend on eligibility rules but also
on differential access and take-up across the population (Currie, 2006). Our
approach allows us not only to compare participation rates of different demo-
graphic groups but also to analyze at which stage in the process the differences
occur.
Second, a common finding in empirical evaluation studies is that program ef-
fects are heterogeneous and that ALMP programs are only beneficial for certain
groups. For the policy maker it is thus important to efficiently allocate unem-
ployed workers to programs and the individual worker to the right type of
program. An approach to investigate the efficiency of program allocations is to
compare caseworker assignments with more refined statistical assignment mech-
anisms (Behncke et al., 2007; Dehejia, 2005; Lechner and Smith, 2007; Staghoj
et al., 2007). However, in these studies it is usually assumed that the official
1

assignment is binding, which means that policy rules can be enforced and that
the individual workers do not influence the participation decision. By using
more detailed data and splitting up the participation process we can examine
to what extent workers interfere in the participation process or do not comply
with the official assignment.
Third, a closer examination of the participation process can also be helpful in
the choice of evaluation strategies (Heckman et al., 1999). Here, a broad dis-
tinction between empirical approaches can be made regarding the assumptions
about the observability of factors determining selection. On the one hand,
matching and propensity score methods are based on the “selection on ob-
servables“ assumption, which implies that the researcher is able to observe
all information that determines program participation and also influences the
outcomes (Dehejia and Whaba, 1999; Heckman and Smith, 1999). The argu-
ment usually made in favor of this assumption is that with the availability of
longitudinal administrative data the researcher observes roughly the same infor-
mation as the caseworker, and is hence able to model the caseworker’s decision.
This should be the case if the participation decision depends exclusively on the
caseworker. If, on the other hand, the individual worker is able to influence the
participation process, “selection on observables“ is less credible. The individual
might have important private information that determines both participation
and labor market outcomes, but is not shared with either the caseworker or the
researcher. In this case we have “selection on unobservables“ and an evaluation
strategy that relies on an exogenous exclusion restrictions by, for example, mak-
ing use of particularities of the participation process may be more appropriate
(Angrist et al., 1996; Heckman, 1997).
In this paper we follow new entrants into unemployment over their unemploy-
ment spell and record all program assignments and enrollments. We find that
while almost 25% of unemployed are assigned to a program relatively early in
their unemployment spells only 12% enroll. To explain this attrition we exam-
2

ine job entries, program cancelations, and rejections of program applications.
Further we investigate the empirical determinants of the probabilities to be
assigned and to be enrolled conditional on assignment. Our analysis provides
strong evidence in favor of the individual worker’s influence over the participa-
tion process.
The rest of the paper is organized as follows. The next section gives a brief
overview of active labor market policy in Austria and the different program
types available. Section 3 describes the data and provides summary statistics on
program assignments and enrollments. Section 4 discusses incentives involved
at each stage of the participation process and examines in detail the empirical
determinants at both stages. The last section concludes.
2 Active Labor Market Policy in Austria
In Austria like in many other European countries, the active component of
labor market policy has increased in importance over the last 2 decades, with
government spending on ALMP now amounting to about 0.6% of GDP (OECD,
2007). A major change in the types of policies offered and subsequently in par-
ticipation rates occurred during 1999/2000, when job search programs where
introduced on a relatively large scale (Hofer and Weber, 2006). These programs,
designed to improve search efficiency, were meant to complement existing train-
ing and employment subsidy programs that are oriented toward human capital
improvements. Further, the intention of job search programs was to reach out
to unemployed workers in early stages of unemployment, to make them fa-
miliar with the ALMP programs offered, to develop structured training plans,
and to provide a better screening device for the more costly training programs
(Arbeitsmarktservice Osterreich, 2001).
The access to active labor market programs is provided exclusively by regional
employment offices, while the courses are held by private contractors. In gen-
3

eral, the Austrian employment office (AMS) provides counseling and job place-
ment for unemployed workers, and it administers unemployment insurance ben-
efits and ALMP. A worker requesting services can approach the office by reg-
istering as unemployed or searching for a job, and claim benefit payments if
eligible. A registered worker attends regular meetings with caseworkers, where
job offers, job search strategies, and available ALMP options are discussed. In
order to get assigned to a program the worker can either submit an application
through the caseworker or she is directly assigned by the caseworker. During the
period following assignment the application is reviewed and the worker waits
for the start of the program. If the application is accepted and if the worker
is still unemployed at the program start they formally enroll and participate in
the program.
In this paper we use administrative data on individual assignments and en-
rollments to training, job search, and public sector employment programs that
were administered by the employment office. We do not consider private sector
employment subsidies, because they follow a different system. Private employ-
ment programs are wage subsidies paid to the employer for hiring an eligible
worker. Vacancies for employment subsidies get posted at the employment office
and workers apply for those like for regular jobs. Therefore there is no formal
assignment procedure as in the case of the course-related program types.1
3 Data
Our data come from two sources: the Austrian Social Security Database (ASSD)
and the unemployment registers of the Austrian public employment office (AMS).
We use detailed information on employment, unemployment, and wages from
daily records in the ASSD, which are available for the years 1972-2004. Two1Compared to other European countries, private sector employment subsidies play a minor
role in the Austrian ALMP system (Hofer and Weber, 2006).
4
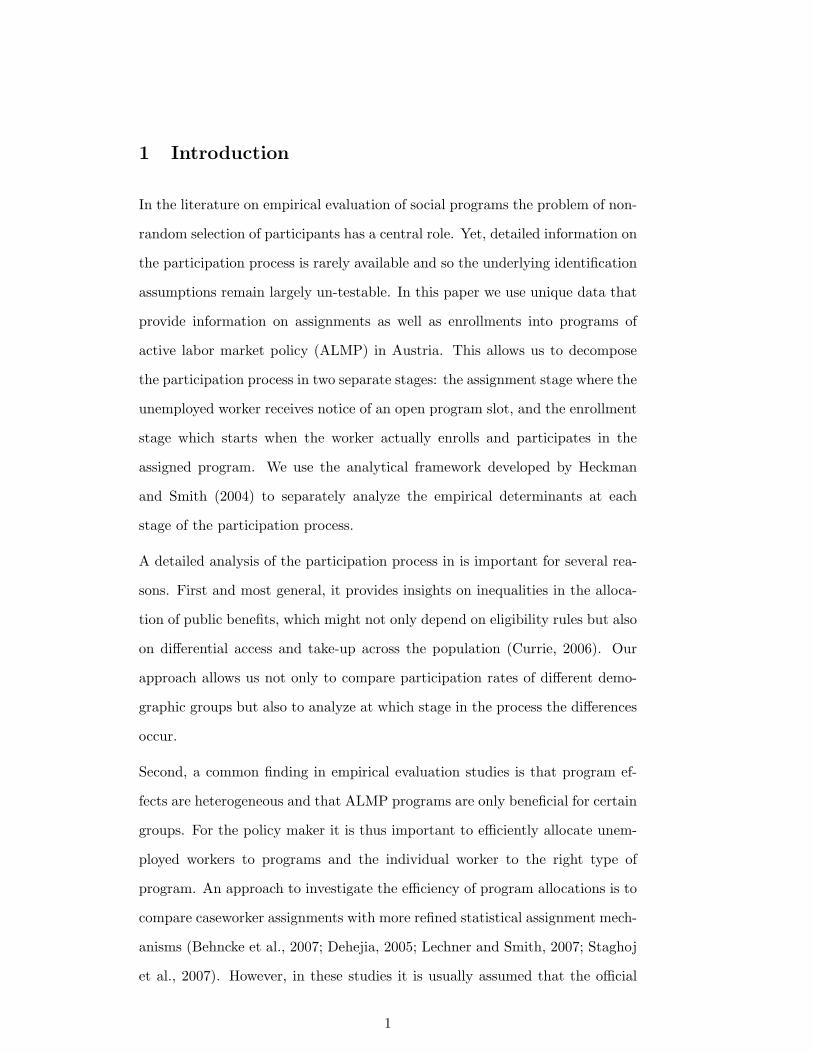
separate databases from the unemployment registers provide information on
program assignments and enrollment. The assignment data include the date
of assignment, a program number, the planned starting date of the program,
and the result from assignment (participation or non-participation plus the rea-
son why no participation occurred). The enrollment data include the program
number, as well as dates of entry into and exit from the program.
Our observation sample consists of the inflow into unemployment between
March and August 2001. We define an individual’s inflow into unemployment
by the start of her first unemployment spell. We restrict unemployment spells
to be longer than one day. Further, we restrict individuals to be between 16 and
60 years of age and we drop individuals who were unemployed within 30 days
prior to the start of the inflow spell. From the enrollment data we select all
programs, which start during the first year of the unemployment spell or before
the individual enters a new job. We only consider an individual as enrolled if
she participates in a program for more than 5 consecutive days. For individ-
uals who are enrolled in multiple programs we select the program that starts
first. The program number gives us access to additional information about the
program like program type and the total number of participants. Our analysis
distinguishes between training, job search, and public employment programs.2
In the ASSD we can define unemployment by either benefit recipience or reg-
istration with the unemployment office. We allow for unemployment spells
of either status, but for defining the inflow date into unemployment the spell
can only start after the individual has exited employment. To get an accurate
record of program assignments, however, we take into account that workers
anticipating unemployment may actually register with the employment office
before their job has ended. We call workers who register as searching for a new
job while still employed ”early searchers” and consider all program assignments2This means we drop all individuals receiving start up grants (UGP) or Arbeitsstiftungen.
Participations in BBE (Beratungs- und Betreuungseinrichtungen) are excluded, because theylast only for one day.
5

from the assignment database which take place from the first contact to the
employment office preceding the inflow into unemployment. Using these defini-
tions we are able to match 99% of enrollments in the enrollment database with
a corresponding assignment from the assignment database. Cross-checking the
information on the result of program assignment in the assignment database
with the the actual enrollment gives a perfect overlap.
The full sample includes 226,621 individuals and; their descriptive characteris-
tics are shown in table 1. Information on program assignments and enrollments
are given in table 2. We see that 25% of workers are assigned to a program at
least once during their unemployment spell, while only 12% enroll in at least
one program. It is not uncommon that workers are assigned to programs mul-
tiple times. Workers who are assigned receive on average 1.7 assignments, and
workers who enroll got on average 2 assignments. Enrollment in more than one
program is not so common as we only consider the first 12 months after inflow
into unemployment.
Table 3 provides some information about the timing of program assignment
and enrollment during the unemployment spell. It takes the average worker 151
days to find a new job, the median nonemployment duration is about 3 months.
(Note that spells are censored at 365 days.) Workers who are assigned to at
least one program are out of employment much longer than the average worker.
The median worker with assignment takes almost 10 months to find a job,
although the assignment already occurs in the second month of unemployment.
The median time from assignment to the projected program start is 3 weeks.
It is clear that workers enrolling in a program take longer to start with a new
job, because of the time they spend on the program, which is 44 days for the
median worker. The median enrolled worker gets her first assignment in the
second month of unemployment, but does not enroll in a program until about
2 months later.
6

In this context is interesting to see whether assigned individuals do not enroll
in the program, because they find a job before the program starts. Only 13% of
assigned workers enter employment before the planned program start. We have
seen in table 2, however, that it is not uncommon, that workers who do not
enroll in the first program get re-assigned to a different program with a later
starting date. Therefore we also consider all individuals who start a job within
2 months of the first assignment date. With this measure the rate of job entry
after assignment is 28%, but it is still lower than the enrollment rate of 50%
among assigned workers.
Table 4 gives an overview of the results from the first program assignment.
We see that only 30% of individuals participate in the first program they are
assigned to. As mentioned above, 13% take up a job before the program would
have started. The rate of individual rejections to enroll in the program is
particularly high with 30%, while rejections of program applications by the
employment office are less common with 7%. Finally, the remaining 20% do
not enroll, because the their program is canceled by the unemployment office,
maybe because of a too low number of participants.3
Program types of the first assignment and enrollment per individual are given
in table 5. The majority of both assignments and enrollments are to job search
programs. The second important category are training programs. Orientation
programs, a sub-category of training, which support unemployed workers to
get organized and to develop training and career plans, and public sector em-
ployment programs are less used. The enrollment rates (number of enrollments
over number of assignments) are higher to training programs with 77% than to
job search programs with 61%. We further note that for a large share (28%)
of assignments the program type is unspecified. The majority (84%) of the
unspecified programs are canceled, because they have no enrolled participants.3We identify canceled programs by program numbers with zero enrolled participants in the
data.
7

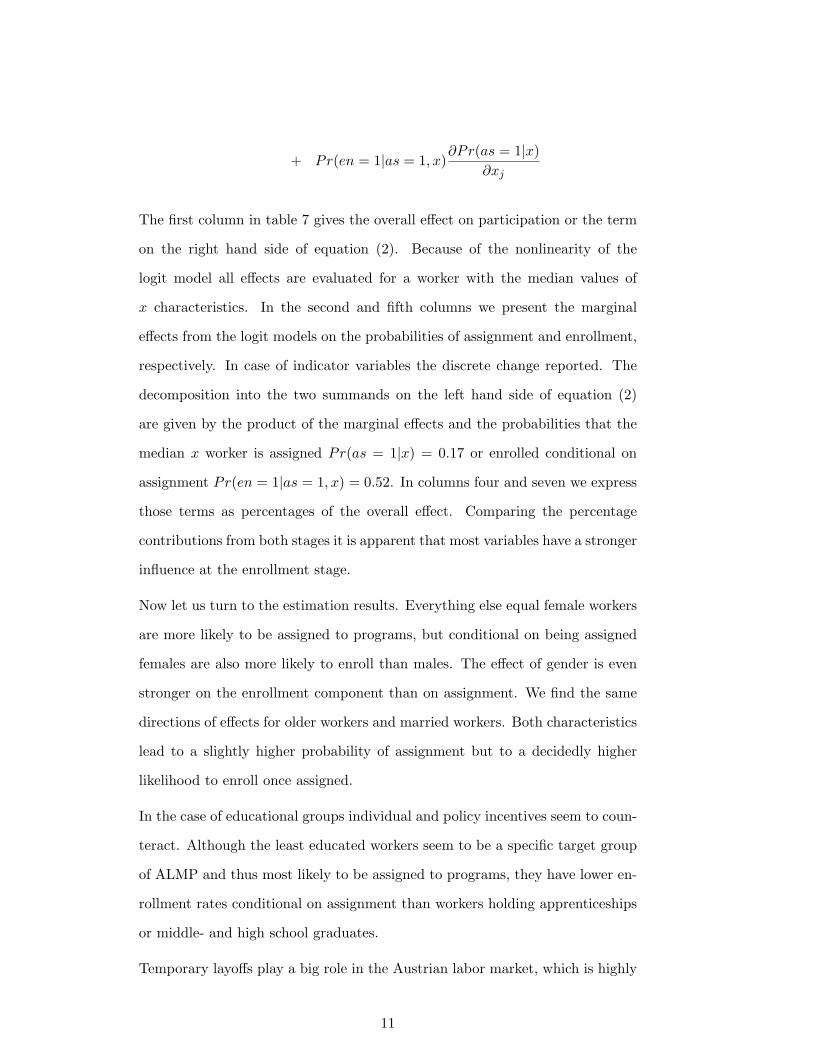
We would like to point out that the descriptive statistic based on the mean or
median workers as presented above may hide some underlying patterns. Fig-
ure 1 shows the distribution of the time from the start of the unemployment
spell to first program assignment for all workers who were assigned to a pro-
gram in the first year of unemployment. The huge spike in the graph at time
zero reflects that 20% of assigned workers (5% of the full sample) receive an
assignment already on the first day when they register with the employment of-
fice. Reasons for these direct assignments seem to be incompatibilities between
the numbers of caseloads and slots for caseworker meetings. Schernhammer
and Adam (2002) discuss that in 2000 the official guidelines recommended that
program participation in job search programs should be preceded by a series of
monthly meetings with the caseworker where the worker is informed about the
program and invited to participate. In several employment offices, however, the
density of caseloads did not permit to schedule the required number of meet-
ings. According to the report local employment offices sought different ways
out of these incompatibilities and thus some offices made assignments already
on the first contact day, while others postponed the assignment to a later date.4
4 Stages in the Program Participation Process
The descriptive analysis in the last section makes clear that beside rejected ap-
plications, job entries, or program cancelations also individual rejections play
a considerable role in explaining the difference between assignment and enroll-
ment rates in the data. In addition, we found that repeated program assign-
ments are relatively common and many workers receive multiple assignments
before they enroll in the first program. This indicates that individual work-
ers are strongly involved in the participation process and seem to have some
leverage in negotiations with caseworkers. Therefore, our next step is to ana-4For further details see (Weber, 2008).
8

lyze the influence of individual characteristics at each stage of the participation
process. This will allow to distinguish between government rules regulating pro-
gram access and caseworker incentives on the one hand, and individual worker
incentives on the other hand.
Before going into details about empirical findings we start with a discussion
about the incentives of the different parties involved in the decision making
at each stage of the participation process. The caseworker assigning an unem-
ployed to a program follows government eligibility regulations and policy guide-
lines as well as strategies outlined at the local employment office. In addition,
he forms his own private assessment from personal contact with the client. The
worker can influence the assignment decision by approaching the caseworker
with the explicit wish to apply for a certain program. In such cases the final
application will still be guided by caseworker recommendations, however.
At the enrollment stage the probability to enroll conditional on assignment is
influenced by three main factors. First, the unemployment office is involved by
accepting or rejecting the worker’s application. In case of a rejection, the worker
may re-apply or be re-assigned to a different course though. Second, we have
seen that some programs are canceled, presumably because of low enrollment
rates. We argue that program cancelations can be regarded as a random com-
ponent in the enrollment process, because they do not depend on the individual
worker. Third, the worker has several means to influence the likelihood of en-
rollment. She can manipulate the job entry by either taking a job quickly or
delaying entry into employment until after the program.5 Further, the worker
can reject program enrollment. Although most programs are compulsory and
non-compliance may result in benefit sanctions, the worker can find excuses or
at least negotiate a later program entry with the caseworker.
Overall, the discussion suggests that the assignment stage the decision is likely5For an investigation of the effect of program assignment on job entry rates see (Weber,
2008).
9

to be dominated by policy regulations and employment office strategies, while
at the enrollment stage the individual worker’s incentives play a more domi-
nant role. Examining the effects of observable factors on the assignment and
enrollment probabilities separately will reveal to what extent official policies
are reinforced or counteracted by individual incentives.
To examine the effect of various observable characteristics on each stage of the
participation process we decompose the probability to participate Pr(par =
1|x) given a set observable characteristics x into the probability to be assigned
Pr(as = 1|x) and the probability to enroll conditional on assignment Pr(en =
1|as = 1, x) by
Pr(par = 1|x) = Pr(en = 1|as = 1, x)Pr(as = 1|x). (1)
We then estimate simple logit models for the probabilities to enter both stages.
Estimation results are presented in Table 6. The first column shows determi-
nants of program assignment, while the third column shows the determinants
of enrollment conditional on assignment. A first inspection of the results makes
clear that individual characteristics are strongly influencing the process at both
stages and often with offsetting effects.6 The coefficient estimates on regional
dummy variables indicate considerable variation in assignment strategies as
well as supply of ALMP programs at the regional level. We also estimated
models controlling for fixed effects at the local employment office level which
demonstrate this even more convincingly.7
To focus on the magnitude of the effects, we decompose the overall effect of
variable xj on program participation into the effect due to assignment and due
to enrollment
∂Pr(par = 1|x)∂xj
=∂Pr(en = 1|as = 1, x)
∂xjPr(as = 1|x) (2)
6Results estimated for women and men separately are shown in tables 8 and 9.7Results from a model with 94 local employment office dummies are available on request.
10
+ Pr(en = 1|as = 1, x)∂Pr(as = 1|x)
∂xj
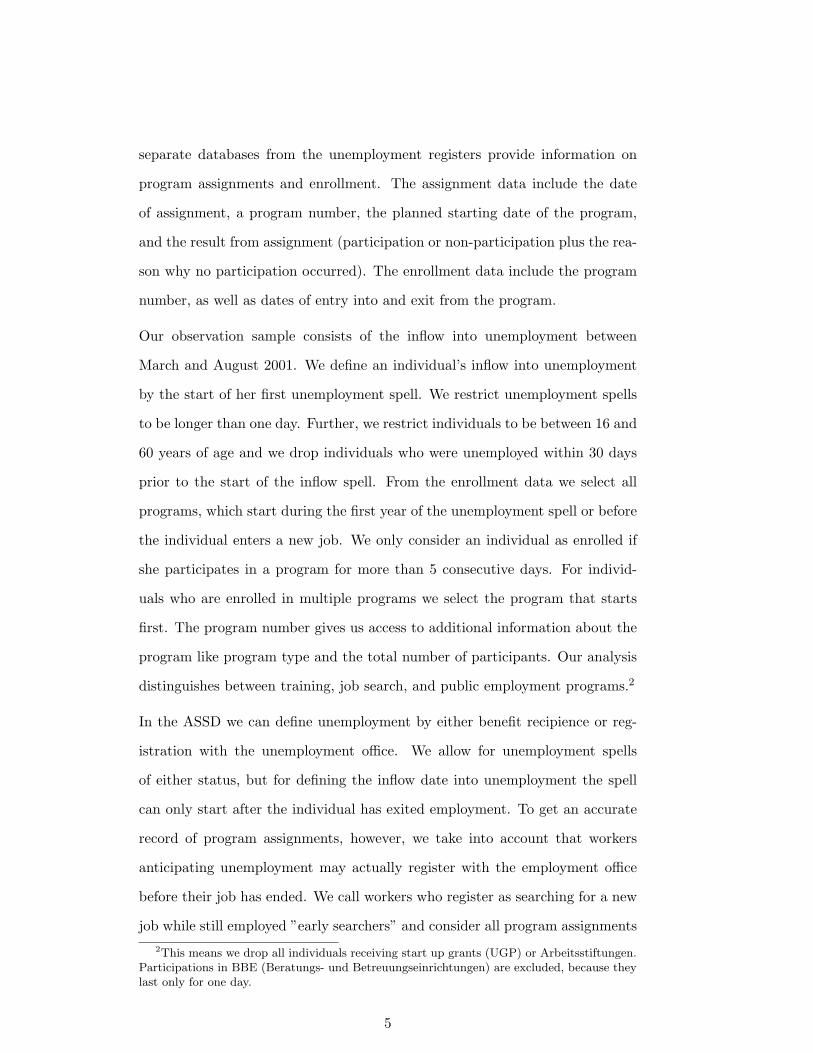
The first column in table 7 gives the overall effect on participation or the term
on the right hand side of equation (2). Because of the nonlinearity of the
logit model all effects are evaluated for a worker with the median values of
x characteristics. In the second and fifth columns we present the marginal
effects from the logit models on the probabilities of assignment and enrollment,
respectively. In case of indicator variables the discrete change reported. The
decomposition into the two summands on the left hand side of equation (2)
are given by the product of the marginal effects and the probabilities that the
median x worker is assigned Pr(as = 1|x) = 0.17 or enrolled conditional on
assignment Pr(en = 1|as = 1, x) = 0.52. In columns four and seven we express
those terms as percentages of the overall effect. Comparing the percentage
contributions from both stages it is apparent that most variables have a stronger
influence at the enrollment stage.
Now let us turn to the estimation results. Everything else equal female workers
are more likely to be assigned to programs, but conditional on being assigned
females are also more likely to enroll than males. The effect of gender is even
stronger on the enrollment component than on assignment. We find the same
directions of effects for older workers and married workers. Both characteristics
lead to a slightly higher probability of assignment but to a decidedly higher
likelihood to enroll once assigned.
In the case of educational groups individual and policy incentives seem to coun-
teract. Although the least educated workers seem to be a specific target group
of ALMP and thus most likely to be assigned to programs, they have lower en-
rollment rates conditional on assignment than workers holding apprenticeships
or middle- and high school graduates.
Temporary layoffs play a big role in the Austrian labor market, which is highly
11
seasonal. We cannot directly control for temporary layoff status, but we use
the fact that the worker is recalled to the previous employer as a proxy. As we
can see being on recall has a strongly negative influence on the probability of
being assigned. This is because the caseworkers keep track of recall agreements
with employers and lower the level of counseling for temporary layoffs. But also
workers who plan to return to their previous employer have lower enrollment
rates once they get assigned. We see the same pattern for occupations in the
seasonal industries like tourism and construction, where most of the temporary
layoffs occur. A higher probability to be assigned is faced by individuals working
in manufacturing, sales, office, and technical occupations. These workers are
also more likely to enroll.
Benefit recipients are more likely to be assigned to programs and they are also
more likely to enroll once they get assigned. This could be, because they face
pressure from benefit sanctions or because program applications of non-benefit
recipients who are not a primary policy target group are more likely to be
rejected. Workers who enter unemployment from out of the labor force are
less likely to get assigned to programs but conditional on assignment they have
higher attendance rates. This indicates that in the case of individuals who
register with AMS to become eligible for ALMP programs to some extent also
the decision to be assigned might be driven by individual incentives. Another
group of workers who might be highly motivated to participate in programs are
those who register early with AMS before their job ends. For these workers we
see particularly high enrollment rates conditional on assignment.
Past program participation could indicate that workers are on some kind of
training schedule which continues when they re-enter unemployment. We find
that program participation in the 18 months before getting unemployed is a
strong indicator for assignment and that enrollment conditional on assignment
is also higher for individuals with recent program experience.
12

Labor market histories, and especially the unemployment experience in recent
years are important determinants of program participation. While the time
spent in unemployment in the past years increases the probabilities to be as-
signed and to enroll in a program, a higher number of unemployment spells
lowers the probability to be assigned but still increases the conditional enroll-
ment probability. Repeated employment spells have negative effects on both
probabilities, which indicates that workers who have more contacts in the labor
market are less dependent on the public services. Results on pre-unemployment
wages seem to resemble the finding for educational groups: namely, although
low wage workers are more likely to be assigned, higher wages positively influ-
ence the conditional enrollment rates.
We find differential patterns on assignment and enrollment probabilities by the
month of inflow into unemployment and by region. Here it is interesting that
in regions where assignment probabilities are high, like in Vienna and most
Eastern Austrian regions, enrollment rates are considerably lower. This hints
at differential assignment strategies at the local employment office level.
5 Conclusion
The objective of this article was to investigate two stages in the process that
leads to participation in ALMP programs using special Austrian data that allow
us to distinguish caseworker assignment from actual program enrollment. A first
inspection of the data shows that although 25% of newly unemployed workers
in 2001 are assigned to a program only half of them actually enroll. A close
examination of unemployment durations, job entries of assigned workers, and
the reasons for non-enrollment shows that the difference between assignment
and enrollment rates cannot be explained by job entries, program cancelations,
or rejected applications alone. This leads us to further analyze the influence of
individual characteristics on each stage of the participation process using the
13

decomposition framework developed by Heckman and Smith (2004). As the
data provide a wide range of personal characteristics and labor market histories,
this approach allows us to distinguish between incentives at the official policy
or employment office level and the incentives at the individual worker level.
Our results show that observable characteristics have a strong influence at ei-
ther stage of the participation process. In several ways individual workers either
reinforce selection decisions taken at the official level or counteract them. For
example, women, married, and older workers, as well as workers with a lot of
unemployment in the past have higher probabilities to be assigned to programs.
But conditional on assignment, they are also more likely to enroll. On the other
hand, workers with the lowest levels of education and low wages are more likely
to be assigned but less likely to enroll than workers with at least an appren-
ticeship degree or higher wages. Similarly, workers who enter unemployment
from a job face lower assignment rates but they are more likely to enroll once
assigned.
We conclude, that these results demonstrate a high degree of dependence of the
participation process on individual incentives. Individual workers have some
potential to influence the process at the assignment stage: for example, non-
labor market participants approaching the employment to get access to publicly
funded training programs, as well as workers registering early with the AMS
before their jobs ends. But their influence is even more important on the
enrollment stage where individual workers have the options to negotiate with
caseworkers, delay program entry, or simply by not to comply with policy rules.
Overall our findings imply that selection is not confined to the caseworker as-
signment decision. This has important implications for the design of optimal
program assignment strategies, where it should be taken into account that ob-
served enrollment rates do not perfectly correspond to caseworker assignment
decisions. It may be the case that because of the involvement of individual work-
14

ers’ interests the caseworker’s tasks are indeed more complicated than generally
assumed and that they are not so easily outperformed by statistical assignment
mechanisms.
Further, the evidence in favor of a strong individual component in the par-
ticipation decision casts doubts on the credibility of selection on observables
assumptions. It might be the case that neither the caseworker nor the re-
searcher are able to observe all information that jointly influences participation
and the outcome variables. Research designs that exploit exogenous variation
in program participation might therefore provide more reliable results. One po-
tential approach in this direction, would be to examine the considerable degree
of heterogeneity in assignment and conditional enrollment rates (in other words
program availability) at the local employment office level, which we find in the
Austrian data. It indicates that program availability and ALMP strategies vary
more or less exogenously across relatively small regions, and offers interesting
strategies for additional research.
15

References
Angrist, J. D., Imbens, G. W., Rubin, D. B., 1996. Identification of causal effects
using instrumental variables. Journal of the American Statistical Association
91, 444–455.
Arbeitsmarktservice Osterreich, 2001. Geschaftsbericht 2000, Wien.
Behncke, S., Froehlich, M., Lechner, M., 2007. Targeting labour market pro-
grams: results from a randomized experiment. IZA Discussion Paper (3085).
Currie, J., 2006. The take-up of social benefits. In: Auerbach, A., Card, D.,
Quigley, J. (Eds.), Poverty, the Distribution of Income, and Public Policy.
Russell Sage, New York.
Dehejia, R., 2005. Program evaluation as a decision problem. Journal of Econo-
metrics 125, 141–173.
Dehejia, R. H., Whaba, S., 1999. Causal effects in nonexperimental studies:
Reevaluating the evaluation of training programs. Journal of the American
Statictical Association 94, 1053–1062.
Heckman, J., 1997. Instrumental variables: a study of implicit behavioral as-
sumptions in one widely used estimator for program evaluations. Journal of
Human Resources 32, 441–462.
Heckman, J., Lalonde, R., Smith, J., 1999. The economics and econometrics of
active labor market programs. In: Ashenfelter, O., Card, D. (Eds.), Hand-
book of Labor Economics. Vol. 3a. North Holland, Amsterdam.
Heckman, J. J., Smith, J. A., 1999. The pre-programme earnings dip and the
determinants of participation in a social programme. implications for simple
programme evaluation strategies. Economic Journal 109, 313–348.
16

Heckman, J. J., Smith, J. A., 2004. The determinants of participation in a
social program: Evidence from a prototypical job training program. Journal
of Labor Economics 22, 243–298.
Hofer, H., Weber, A., 2006. Active labor market policy in Austria: Practice
and evaluation results. DIW Quarterly Journal of Economic Research 75,
155–167.
Lechner, M., Smith, J., 2007. What is the value added by caseworkers? Labour
Economics 14, 135–151.
OECD, 2007. Statistical Annex. OECD Employment Outlook 2006,
http://www.oecd.org/dataoecd/29/27/38749309.pdf.
Schernhammer, B., Adam, U., 2002. Evaluierung von Jobcoaching 2000. AMS
Report (31).
Staghoj, J., Svarer, M., Rosholm, M., 2007. A statistical programme assignment
model. IZA Discussion Paper (3165).
Weber, A., 2008. Direct assignment and the evaluation of active labor market
policy. Unpublished Manuscript, UC Berkeley.
17

Figure 1: Distribution of the time to first program assignment0
.01
.02
.03
.04
Den
sity
0 100 200 300 400Days until first program assignment
Notes: 2001 inflow into unemployment individuals assigned to at least one programduring the first year of unemployment.
18

Table 1: Sample Characteristics
All Workers Female Workers
Mean Std.Dev. Mean Std.Dev.
Assigned to a program 0.252 0.434 0.271 0.444Enrolled in a program 0.122 0.327 0.135 0.342Female 0.487 0.500Age 33.4 10.4 33.2 10.2Married or Living Together 0.422 0.494 0.379 0.485Education
Compulsory or less 0.392 0.488 0.407 0.491Apprenticeship 0.378 0.485 0.312 0.463Middle School 0.106 0.308 0.141 0.349High School 0.052 0.221 0.072 0.258Vocational High School 0.041 0.197 0.031 0.172University Degree 0.031 0.174 0.037 0.188
OccupationAgriculture 0.012 0.110 0.009 0.094Manufacturing 0.254 0.435 0.129 0.335Construction 0.075 0.264 0.002 0.048Sales 0.154 0.361 0.172 0.377Tourism 0.197 0.398 0.253 0.435Service 0.069 0.253 0.109 0.312Technical 0.033 0.179 0.012 0.110Office 0.136 0.342 0.209 0.407Health 0.070 0.256 0.104 0.306
Recalled to previous employer 0.181 0.385 0.200 0.400Benefit recipient 0.843 0.364 0.826 0.379Registers with AMS before job ends 0.116 0.320 0.128 0.334
Employed within 30 days before unemployment starts 0.720 0.449 0.715 0.452Employed within 90 days before unemployment starts 0.770 0.421 0.752 0.432Employed within 180 days before unemployment starts 0.806 0.396 0.780 0.414Employed within 360 days before unemployment starts 0.865 0.342 0.830 0.375
Duration of last Job (months) 15.9 28.0 15.9 27.3Monthly wage on last job 1,386.1 646.5 1,172.9 578.6Program participations
within 6 months before unemployment 0.031 0.172 0.034 0.182within 12 months before unemployment 0.055 0.229 0.059 0.235within 18 months before unemployment 0.046 0.209 0.046 0.209within 24 months before unemployment 0.022 0.146 0.022 0.147within 30 months before unemployment 0.011 0.106 0.011 0.106within 36 months before unemployment 0.005 0.067 0.005 0.067
Percentage employed1st year before unemployment 0.622 0.362 0.601 0.3752nd year before unemployment 0.598 0.386 0.553 0.4013rd year before unemployment 0.575 0.400 0.521 0.4124th year before unemployment 0.550 0.410 0.487 0.4195th year before unemployment 0.521 0.419 0.455 0.425
Percentage unemployed1st year before unemployment 0.158 0.220 0.156 0.2192nd year before unemployment 0.169 0.246 0.161 0.2423rd year before unemployment 0.162 0.250 0.154 0.2484th year before unemployment 0.150 0.244 0.141 0.2425th year before unemployment 0.135 0.234 0.125 0.231
Number of employment spells1st year before unemployment 1.624 1.318 1.503 1.2602nd year before unemployment 1.484 1.305 1.326 1.216
Continued on next page.
19

Table 1 — continued from previous page.
All Workers Female Workers
Mean Std.Dev. Mean Std.Dev.
3rd year before unemployment 1.352 1.236 1.196 1.1674th year before unemployment 1.244 1.189 1.082 1.1145th year before unemployment 1.157 1.159 0.987 1.056
Number of unemployment spells1st year before unemployment 0.855 1.068 0.815 1.0392nd year before unemployment 0.926 1.199 0.854 1.1443rd year before unemployment 0.837 1.172 0.765 1.1244th year before unemployment 0.762 1.132 0.688 1.0815th year before unemployment 0.694 1.107 0.612 1.006
Average monthly wage1st year before unemployment 1,197.7 710.3 970.2 629.82nd year before unemployment 1,130.8 736.1 890.7 650.33rd year before unemployment 1,062.3 753.3 827.7 659.94th year before unemployment 999.6 762.8 771.8 665.35th year before unemployment 946.3 777.2 722.4 675.9
Percentage on Maternity Leave1st year before unemployment 0.026 0.149 0.053 0.2082nd year before unemployment 0.040 0.182 0.082 0.2543rd year before unemployment 0.040 0.178 0.081 0.2474th year before unemployment 0.044 0.189 0.089 0.2625th year before unemployment 0.045 0.194 0.093 0.269
Month of inflow into unemploymentMarch 0.179 0.383 0.164 0.370April 0.221 0.415 0.232 0.422May 0.185 0.388 0.182 0.386June 0.132 0.339 0.128 0.334July 0.160 0.366 0.169 0.375August 0.123 0.328 0.125 0.331
RegionVienna 0.232 0.422 0.201 0.401Lower Austria 0.146 0.353 0.144 0.351Upper Austria 0.140 0.347 0.143 0.350Salzburg 0.073 0.260 0.078 0.268Tirol 0.121 0.327 0.137 0.343Vorarlberg 0.042 0.200 0.045 0.208Burgenland 0.028 0.166 0.028 0.166Styria 0.138 0.345 0.141 0.348Carinthia 0.080 0.271 0.082 0.275
Observations 226,621 110,260
Note: Sample includes all workers entering unemployment March - August 2001 with a spell of unemploy-ment longer than 1 day and no unemployment during the 30 days prior to this spell, aged 15-65. Averagewages are calculated as the average of monthly wages (in Euro, year 2000 prices) in all jobs during theyear, and set zero if no wage is reported.
20

Table 2: Program Assignment and Enrollment
All WorkersAssigned at least once 25%Enrolled at least once 12%
Mean Std.devNumber of assignments per individual 0.43 0.92Number of enrollments per individual 0.14 0.42Individuals 226,621Workers assigned at least onceNumber of assignments per individual 1.70 1.09Enrolled programs per individual 0.57 0.67Individuals 57,020Workers enrolled at least onceNumber of assignments per individual 2.03 1.28Number of enrollments per individual 1.18 0.45Individuals 27,570
Notes: Sample includes all workers entering unemployment March - August 2001 witha spell of unemployment longer than 1 day and no unemployment during the 30 daysprior to this spell, aged 15-65. Assignment occurs if the unemployed receives notice of aprogram slot, enrollment if the worker participates for more than 5 days in s program.All assignments and enrollments are observed during the first year of the unemploymentspell.
21

Table 3: Timing of program assignment and enrollment
Mean Median Std.devAll WorkersTime to next job (in days) 151 88 136Individuals 226,621Workers assigned at least onceTime to next job (in days) 245 287 127Time until first assignment 83 47 97Time from first assignment to planned program start 39 21 64Fraction leaving for a job before planned program start 13%Fraction leaving for a job within 2 months of assignment 28%Individuals 57,020Workers enrolled at least onceTime to next job (in days) 277 352 109Time until first assignment 85 55 92Time until first enrollment 138 111 100Time from successful assignment to enrollment 26 18 25Program duration 74 44 75Individuals 27,570
Notes: Sample includes all workers entering unemployment March - August 2001 with a spell of unem-ployment longer than 1 day and no unemployment during the 30 days prior to this spell, aged 15-65. Alldurations are measured in days. Time to next job is censored at 365 days. For workers who are enrolledat least once assignment and enrollment correspond to the first assignment or enrollment, respectively,in the unemployment spell. If the worker receives multiple assignments before the first enrollment thetime between first assignment date and planned first program start does in general not coincide with thetime between first assignment date and first enrollment date. In this case the assignment that leads toan enrollment is called the successful assignment. Program duration is the number of days the workerparticipated in the program.
Table 4: Potential outcomes from first program assignment
Fraction of workers who after the first assignment
Enroll in the program 29.72Move to a job before the program starts 12.75Reject participation at the individual level 29.36Application is rejected 7.26Course is canceled 20.92
Total 100
Notes: Observations from 57,020 individuals who are assigned to participate in a programat least once during their unemployment spell. Programs with zero enrolled participantsare defined as canceled. Workers who do not enroll in the program or move to a job mayget re-assigned to another program later in their unemployment spell.
22

Table 5: Program types of assignments and enrollments
Assignment Enrollment
Orientation 5,418 9.5% 3,300 12.0%Training program 12,727 22.3% 9,740 35.3%Job search program 19,621 34.4% 12,006 43.6%Public employment program 3,172 5.6% 1,465 5.3%Program type unspecified 16,082 28.2% 1,059 3.8%
Total 57,020 100 27,570 100
Notes: Program type refers to the first assignment or enrollment, respectively, during anindividual’s unemployment spell. The program type is unspecified for 84% of assignmentsto programs that have no enrolled participants and are thus defined as cancelled.
23

Table 6: Determinants of program participation
Assignment Enrollment
Coefficient Std.Err. Coefficient Std.Err.
Female 0.196 (0.013)** 0.158 (0.022)**Age 0.018 (0.004)** 0.042 (0.006)**Age squared 0.000 (0.000)** 0.000 (0.000)**Married or Living Together 0.073 (0.013)** 0.166 (0.021)**Education (Compulsory or less)Apprenticeship -0.127 (0.013)** 0.079 (0.021)**Middle School -0.051 (0.018)* 0.067 (0.029)*High School -0.213 (0.025)** 0.071 (0.041)Vocational High School -0.334 (0.029)** -0.084 (0.047)University Degree -0.367 (0.033)** -0.114 (0.055)*
Recalled to previous employer -1.209 (0.021)** -0.428 (0.041)**Occupation (Agriculture)Manufacturing 0.184 (0.050)** 0.017 (0.084)Construction -0.243 (0.053)** -0.094 (0.091)Sales 0.263 (0.050)** -0.080 (0.085)Tourism -0.403 (0.051)** -0.267 (0.087)**Service -0.127 (0.053)* -0.286 (0.089)**Technical 0.554 (0.056)** 0.432 (0.093)**Office 0.525 (0.051)** 0.216 (0.085)*Health -0.064 (0.053) 0.137 (0.090)
Benefit recipient 0.502 (0.016)** 0.227 (0.028)**Employed within 30 days before unemploy-ment starts
-0.216 (0.018)** 0.066 (0.029)*
Registers with AMS before job ends 0.059 (0.017)** 0.645 (0.029)**Program participationwithin 6 months before unemployment -0.013 (0.033) 0.266 (0.049)**within 12 months before unemployment 0.266 (0.027)** 0.249 (0.039)**within 18 months before unemployment 0.162 (0.028)** 0.188 (0.041)**within 24 months before unemployment 0.049 (0.038) 0.080 (0.057)within 30 months before unemployment 0.082 (0.053) 0.056 (0.079)within 36 months before unemployment 0.055 (0.076) 0.081 (0.113)Percentage employed1st year before unemployment 0.048 (0.031) -0.011 (0.050)2nd year before unemployment -0.091 (0.028)** 0.021 (0.047)3rd year before unemployment -0.040 (0.029) -0.054 (0.047)4th year before unemployment 0.013 (0.030) -0.009 (0.048)5th year before unemployment -0.013 (0.025) -0.013 (0.041)Percentage unemployed1st year before unemployment 0.160 (0.037)** 0.229 (0.057)**2nd year before unemployment 0.134 (0.036)** -0.051 (0.055)3rd year before unemployment 0.218 (0.036)** -0.059 (0.055)4th year before unemployment 0.211 (0.036)** -0.099 (0.055)5th year before unemployment 0.167 (0.034)** -0.053 (0.052)Number of employment spells1st year before unemployment -0.097 (0.007)** -0.063 (0.011)**2nd year before unemployment -0.034 (0.007)** -0.013 (0.011)3rd year before unemployment -0.030 (0.007)** -0.041 (0.012)**4th year before unemployment -0.012 (0.008) -0.031 (0.013)*5th year before unemployment -0.032 (0.008)** -0.008 (0.012)Number of unemployment spells1st year before unemployment -0.100 (0.009)** 0.028 (0.014)*2nd year before unemployment -0.021 (0.008)* 0.004 (0.013)3rd year before unemployment -0.060 (0.009)** 0.001 (0.014)4th year before unemployment -0.025 (0.009)* 0.030 (0.014)*
Continued on next page.
24

Table 6 — continued from previous page.
Assignment Enrollment
Coefficient Std.Err. Coefficient Std.Err.
5th year before unemployment -0.005 (0.009) -0.003 (0.014)Average monthly wage1st year before unemployment -0.036 (0.013)* 0.071 (0.021)**2nd year before unemployment -0.045 (0.014)** -0.011 (0.023)3rd year before unemployment 0.013 (0.015) 0.004 (0.024)4th year before unemployment -0.006 (0.015) 0.048 (0.024)*5th year before unemployment -0.022 (0.014) -0.040 (0.022)Month of inflow (August)March 0.104 (0.019)** -0.042 (0.031)April -0.021 (0.019) -0.119 (0.031)**May -0.041 (0.019)* -0.109 (0.031)**June -0.036 (0.020) -0.061 (0.032)July -0.030 (0.019) 0.010 (0.031)Region (Carinthia)Vienna 1.093 (0.023)** -0.093 (0.041)*Lower Austria 0.609 (0.024)** -0.614 (0.043)**Upper Austria 0.083 (0.025)** 0.075 (0.046)Salzburg -0.408 (0.034)** -0.184 (0.062)**Tirol -0.560 (0.031)** -0.073 (0.058)Vorarlberg 0.292 (0.034)** -0.151 (0.059)*Burgenland 0.429 (0.036)** 0.143 (0.062)*Styria 0.412 (0.025)** -0.089 (0.044)*
Constant -1.687 (0.085)** -1.225 (0.142)**
Observations 226,621 57,020
Note: Estimation results from logit models of assignment and enrollment conditional on assignment onindividual characteristics. The sample includes all workers entering unemployment March - August 2001with a spell of unemployment longer than 1 day and no unemployment during the 30 days prior to thisspell, aged 15-65. Average wages are calculated as the average of monthly wages (in Euro, year 2000 prices)in all jobs during the year, and set zero if no wage is reported.
25

Table 7: Contributions of the Assignment and Enrollment Stagetowards Program Participation
Overall Assignment Enrollment
Marginal Marginal Std.Err. Percent Marginal Std.Err. PercentEffect Effect of Overall Effect of Overall
Female 0.026 0.030 (0.002)** 20% 0.039 (0.005)** 80%Age 0.006 0.003 (0.001)** 8% 0.010 (0.002)** 92%Age squared 0.000 0.000 (0.000)** 11% 0.000 (0.000)** 89%Married or Living Together 0.023 0.011 (0.002)** 8% 0.041 (0.005)** 92%Education (Compulsory or less)Apprenticeship 0.007 -0.017 (0.002)** -42% 0.020 (0.005)** 142%Middle School 0.007 -0.007 (0.003)* -17% 0.017 (0.007)* 117%High School 0.004 -0.028 (0.003)** -115% 0.018 (0.010) 215%Vocational High School -0.018 -0.043 (0.004)** 41% -0.021 (0.012) 59%University Degree -0.023 -0.047 (0.004)** 35% -0.028 (0.014)* 65%
Recalled to previous employer -0.075 -0.115 (0.005)** 26% -0.106 (0.010)** 74%Occupation (Agriculture)Manufacturing 0.007 0.028 (0.007)** 69% 0.004 (0.021) 31%Construction -0.018 -0.032 (0.007)** 31% -0.023 (0.023) 69%Sales -0.003 0.041 (0.007)** -212% -0.020 (0.021) 312%Tourism -0.043 -0.050 (0.007)** 20% -0.067 (0.022)** 80%Service -0.040 -0.017 (0.007)* 8% -0.071 (0.022)** 92%Technical 0.071 0.094 (0.009)** 23% 0.105 (0.023)** 77%Office 0.043 0.088 (0.008)** 36% 0.053 (0.021)* 64%Health 0.016 -0.009 (0.008) -10% 0.034 (0.022) 110%
Benefit recipient 0.040 0.061 (0.003)** 26% 0.057 (0.007)** 74%Employed within 30 daysbefore unemployment starts 0.003 -0.033 (0.003)** -202% 0.017 (0.007)* 302%Registers with AMSbefore job ends 0.082 0.009 (0.003)** 2% 0.154 (0.007)** 98%Program participationwithin 6 months before 0.034 -0.002 (0.005) -1% 0.066 (0.012)** 101%within 12 months before 0.039 0.042 (0.005)** 18% 0.061 (0.010)** 82%within 18 months before 0.029 0.024 (0.004)** 15% 0.047 (0.010)** 85%within 24 months before 0.012 0.007 (0.006) 11% 0.020 (0.014) 89%within 30 months before 0.009 0.012 (0.008) 23% 0.014 (0.020) 77%within 36 months before 0.012 0.008 (0.011) 12% 0.020 (0.028) 88%Percentage employed1st year before unemployment 0.000 0.007 (0.004) -498% -0.003 (0.013) 598%2nd year before unemployment 0.001 -0.013 (0.004)** -444% 0.005 (0.012) 544%3rd year before unemployment -0.008 -0.006 (0.004) 13% -0.013 (0.012) 87%4th year before unemployment -0.001 0.002 (0.004) -39% -0.002 (0.012) 139%5th year before unemployment -0.002 -0.002 (0.004) 17% -0.003 (0.010) 83%Percentage unemployed1st year before unemployment 0.034 0.023 (0.005)** 12% 0.057 (0.014)** 88%2nd year before unemployment -0.003 0.019 (0.005)** -102% -0.013 (0.014) 202%3rd year before unemployment -0.002 0.031 (0.005)** -237% -0.015 (0.014) 337%4th year before unemployment -0.008 0.030 (0.005)** -69% -0.025 (0.014) 169%5th year before unemployment -0.003 0.024 (0.005)** -148% -0.013 (0.013) 248%Number of employment spells1st year before unemployment -0.011 -0.014 (0.001)** 23% -0.016 (0.003)** 77%2nd year before unemployment -0.003 -0.005 (0.001)** 33% -0.003 (0.003) 67%3rd year before unemployment -0.006 -0.004 (0.001)** 12% -0.010 (0.003)** 88%4th year before unemployment -0.004 -0.002 (0.001) 7% -0.008 (0.003)* 93%5th year before unemployment -0.002 -0.005 (0.001)** 43% -0.002 (0.003) 57%Number of unemployment spells
Continued on next page.
26

Table 7 - continued from previous page.
Overall Assignment Enrollment
Marginal Marginal Std.Err. Percent Marginal Std.Err. PercentEffect Effect of Overall Effect of Overall
1st year before unemployment 0.001 -0.014 (0.001)** -229% 0.007 (0.004)* 329%2nd year before unemployment 0.000 -0.003 (0.001)* 1011% 0.001 (0.003) -911%3rd year before unemployment -0.001 -0.009 (0.001)** 111% 0.000 (0.003) -11%4th year before unemployment 0.003 -0.004 (0.001)* -19% 0.008 (0.003)* 119%5th year before unemployment -0.001 -0.001 (0.001) 22% -0.001 (0.003) 78%Average monthly wage1st year before unemployment 0.008 -0.005 (0.002)* -11% 0.018 (0.005)** 111%2nd year before unemployment -0.003 -0.007 (0.002)** 44% -0.003 (0.006) 56%3rd year before unemployment 0.001 0.002 (0.002) 35% 0.001 (0.006) 65%4th year before unemployment 0.006 -0.001 (0.002) -2% 0.012 (0.006)* 102%5th year before unemployment -0.006 -0.003 (0.002) 10% -0.010 (0.006) 90%Month of inflow (August)March -0.003 0.016 (0.003)** -97% -0.010 (0.008) 197%April -0.016 -0.003 (0.003) 3% -0.030 (0.008)** 97%May -0.015 -0.006 (0.003)* 7% -0.027 (0.008)** 93%June -0.009 -0.005 (0.003) 10% -0.015 (0.008) 90%July 0.001 -0.004 (0.003) -129% 0.002 (0.008) 229%Region (Carinthia)Vienna 0.025 0.212 (0.006)** 150% -0.023 (0.010)* -50%Lower Austria -0.060 0.105 (0.005)** -30% -0.150 (0.011)** 130%Upper Austria 0.012 0.012 (0.004)** 18% 0.019 (0.011) 82%Salzburg -0.033 -0.051 (0.005)** 27% -0.046 (0.016)** 73%Tirol -0.021 -0.066 (0.005)** 55% -0.018 (0.015) 45%Vorarlberg -0.012 0.046 (0.006)** -68% -0.038 (0.015)* 168%Burgenland 0.031 0.070 (0.007)** 40% 0.035 (0.015)* 60%Styria 0.000 0.067 (0.004)** 24958% -0.022 (0.011)* -24858%
Observations 226,621 226,621 57,020
Note: Marginal effects from logit models of assignment and enrollment conditional on individual charac-teristics in columns 3 and 6. Marginal effects evaluated at the median worker characteristics. See text forthe calculation of the overall effect in column 1. Columns 5 and 8 give the percentage share of the effectsat the assignment and enrollment stages in the overall effect. The sample includes all workers entering un-employment March - August 2001 with a spell of unemployment longer than 1 day and no unemploymentduring the 30 days prior to this spell, aged 15-65. Average wages are calculated as the average of monthlywages (in Euro, year 2000 prices) in all jobs during the year, and set zero if no wage is reported.
27

Table 8: Determinants of female program participation
Assignment Enrollment
Coefficient Std.Err. Coefficient Std.Err.
Age 0.021 (0.006)** 0.070 (0.010)**Age squared 0.000 (0.000)** -0.001 (0.000)**Married or Living Together 0.071 (0.019)** 0.124 (0.030)**Education (Compulsory or less)Apprenticeship -0.113 (0.019)** 0.070 (0.031)*Middle School -0.071 (0.023)** 0.043 (0.037)High School -0.256 (0.032)** -0.001 (0.051)Vocational High School -0.365 (0.044)** -0.077 (0.071)University Degree -0.318 (0.044)** -0.047 (0.072)Occupation (Agriculture)Manufacturing 0.273 (0.080)** -0.098 (0.135)Construction 0.226 (0.163) -0.126 (0.271)Sales 0.362 (0.079)** -0.154 (0.134)Tourism -0.271 (0.080)** -0.363 (0.136)*Service -0.084 (0.081) -0.431 (0.136)**Technical 0.686 (0.098)** 0.525 (0.160)**Office 0.619 (0.079)** 0.108 (0.133)Health 0.012 (0.081) -0.017 (0.137)
Recalled to previous employer -1.337 (0.031)** -0.494 (0.059)**Benefit recipient 0.363 (0.024)** 0.180 (0.041)**Registers with AMS before job ends 0.012 (0.023) 0.624 (0.039)**Employed within 30 days before unemploy-ment starts
-0.204 (0.027)** 0.082 (0.043)
Program participationswithin 6 months before unemployment -0.036 (0.045) 0.207 (0.068)**within 12 months before unemployment 0.285 (0.038)** 0.267 (0.057)**within 18 months before unemployment 0.151 (0.040)** 0.142 (0.059)*within 24 months before unemployment 0.071 (0.054) -0.029 (0.080)within 30 months before unemployment 0.142 (0.075) 0.052 (0.110)within 36 months before unemployment -0.120 (0.110) 0.094 (0.168)Percentage employed1st year before unemployment 0.079 (0.048) -0.108 (0.077)2nd year before unemployment -0.007 (0.044) -0.046 (0.073)3rd year before unemployment -0.074 (0.046) 0.017 (0.075)4th year before unemployment 0.073 (0.047) -0.088 (0.077)5th year before unemployment -0.051 (0.039) 0.099 (0.064)Percentage unemployed1st year before unemployment 0.129 (0.055)* 0.103 (0.086)2nd year before unemployment 0.203 (0.054)** -0.146 (0.085)3rd year before unemployment 0.174 (0.055)** -0.093 (0.085)4th year before unemployment 0.258 (0.056)** -0.230 (0.086)*5th year before unemployment 0.147 (0.052)* -0.044 (0.080)Percentage on maternity leave1st year before unemployment 0.073 (0.061) -0.111 (0.094)2nd year before unemployment 0.269 (0.067)** -0.151 (0.105)3rd year before unemployment -0.009 (0.061) -0.001 (0.096)4th year before unemployment 0.129 (0.061)* -0.112 (0.096)5th year before unemployment 0.025 (0.048) -0.088 (0.076)Number of employment spells1st year before unemployment -0.093 (0.011)** -0.077 (0.017)**2nd year before unemployment -0.022 (0.011)* -0.014 (0.017)3rd year before unemployment -0.042 (0.012)** -0.080 (0.020)**4th year before unemployment 0.013 (0.012) -0.011 (0.019)5th year before unemployment -0.047 (0.013)** -0.039 (0.020)Number of unemployment spells
Continued on next page.
28

Table 8 — continued from previous page.
Assignment Enrollment
Coefficient Std.Err. Coefficient Std.Err.
1st year before unemployment -0.152 (0.014)** 0.037 (0.021)2nd year before unemployment -0.052 (0.012)** 0.012 (0.020)3rd year before unemployment -0.057 (0.013)** 0.060 (0.021)*4th year before unemployment -0.039 (0.013)* 0.031 (0.021)5th year before unemployment -0.025 (0.014) 0.020 (0.023)Average monthly wage1st year before unemployment -0.037 (0.020) 0.099 (0.033)**2nd year before unemployment -0.031 (0.022) -0.025 (0.036)3rd year before unemployment 0.021 (0.023) 0.048 (0.037)4th year before unemployment -0.039 (0.024) -0.004 (0.037)5th year before unemployment -0.023 (0.022) -0.072 (0.035)*Month of inflow (August)March 0.187 (0.027)** -0.028 (0.043)April 0.035 (0.026) -0.136 (0.042)**May 0.011 (0.027) -0.131 (0.043)**June 0.006 (0.028) -0.086 (0.044)July -0.001 (0.026) -0.047 (0.042)Region (Carinthia)Vienna 0.833 (0.032)** -0.185 (0.053)**Lower Austria 0.377 (0.033)** -0.668 (0.057)**Upper Austria -0.079 (0.034)* 0.000 (0.059)Salzburg -0.469 (0.044)** -0.260 (0.080)**Tirol -0.617 (0.041)** -0.228 (0.075)**Vorarlberg 0.360 (0.044)** -0.256 (0.074)**Burgenland 0.252 (0.049)** 0.031 (0.082)Styria 0.364 (0.033)** -0.155 (0.057)*Constant -1.482 (0.128)** -1.050 (0.214)**Observations 110,260 29,834
Note: Estimation results from logit models of assignment and enrollment conditional on assignment onindividual characteristics. The sample includes all female workers entering unemployment March - August2001 with a spell of unemployment longer than 1 day and no unemployment during the 30 days prior tothis spell, aged 15-65. Average wages are calculated as the average of monthly wages (in Euro, year 2000prices) in all jobs during the year, and set zero if no wage is reported.
29

Table 9: Determinants of male program participation
Assignment Enrollment
Coefficient Std.Err. Coefficient Std.Err.
Age 0.001 (0.005) 0.042 (0.009)**Age squared 0.000 (0.000) 0.000 (0.000)Married or Living Together 0.142 (0.018)** 0.166 (0.030)**Education (Compulsory or less)Apprenticeship -0.160 (0.018)** 0.079 (0.030)*Middle School 0.002 (0.029) 0.067 (0.048)*High School -0.098 (0.043)* 0.071 (0.069)*Vocational High School -0.298 (0.039)** -0.084 (0.064)University Degree -0.419 (0.052)** -0.114 (0.086)**Occupation (Agriculture)Manufacturing 0.138 (0.064)* 0.017 (0.109)Construction -0.324 (0.066)** -0.094 (0.113)Sales 0.200 (0.066)** -0.080 (0.112)Tourism -0.492 (0.068)** -0.267 (0.118)Service 0.052 (0.075) -0.286 (0.127)Technical 0.521 (0.071)** 0.432 (0.118)**Office 0.486 (0.068)** 0.216 (0.115)*Health -0.039 (0.075) 0.137 (0.129)*
Recalled to previous employer -1.072 (0.030)** -0.428 (0.058)**Benefit recipient 0.574 (0.025)** 0.227 (0.044)**Registers with AMS before job ends 0.110 (0.025)** 0.645 (0.043)**Employed within 30 days before unemploy-ment starts
-0.253 (0.024)** 0.066 (0.039)
Program participationswithin 6 months before unemployment 0.059 (0.048) 0.266 (0.071)**within 12 months before unemployment 0.270 (0.038)** 0.249 (0.055)**within 18 months before unemployment 0.173 (0.038)** 0.188 (0.057)**within 24 months before unemployment 0.073 (0.055) 0.080 (0.081)*within 30 months before unemployment 0.035 (0.076) 0.056 (0.113)within 36 months before unemployment 0.217 (0.106)* 0.081 (0.154)Percentage employed1st year before unemployment 0.149 (0.044)** -0.011 (0.073)2nd year before unemployment 0.041 (0.042) 0.021 (0.070)3rd year before unemployment -0.033 (0.043) -0.054 (0.073)4th year before unemployment 0.002 (0.044) -0.009 (0.073)5th year before unemployment 0.003 (0.037) -0.013 (0.062)Percentage unemployed1st year before unemployment 0.292 (0.053)** 0.229 (0.082)**2nd year before unemployment 0.257 (0.052)** -0.051 (0.082)3rd year before unemployment 0.227 (0.054)** -0.059 (0.085)4th year before unemployment 0.210 (0.055)** -0.099 (0.086)5th year before unemployment 0.181 (0.051)** -0.053 (0.078)Number of employment spells1st year before unemployment -0.096 (0.009)** -0.063 (0.015)**2nd year before unemployment -0.044 (0.009)** -0.013 (0.014)3rd year before unemployment -0.022 (0.009)* -0.041 (0.015)4th year before unemployment -0.029 (0.010)* -0.031 (0.017)*5th year before unemployment -0.025 (0.010)* -0.008 (0.016)Number of unemployment spells1st year before unemployment -0.058 (0.012)** 0.028 (0.019)2nd year before unemployment 0.011 (0.011) 0.004 (0.017)3rd year before unemployment -0.062 (0.012)** 0.001 (0.018)*4th year before unemployment -0.017 (0.012) 0.030 (0.019)5th year before unemployment 0.005 (0.012) -0.003 (0.018)Average monthly wage
Continued on next page.
30

Table 9 — continued from previous page.
Assignment Enrollment
Coefficient Std.Err. Coefficient Std.Err.
1st year before unemployment -0.008 (0.017) 0.071 (0.027)2nd year before unemployment -0.038 (0.019)* -0.011 (0.030)3rd year before unemployment -0.008 (0.020) 0.004 (0.032)4th year before unemployment 0.012 (0.020) 0.048 (0.033)*5th year before unemployment -0.032 (0.019) -0.040 (0.030)Month of inflow (August)March 0.015 (0.027) -0.042 (0.045)April -0.083 (0.027)** -0.119 (0.045)*May -0.086 (0.027)** -0.109 (0.045)June -0.076 (0.028)* -0.061 (0.047)July -0.055 (0.027)* 0.010 (0.045)Region (Carinthia)Vienna 1.368 (0.035)** -0.093 (0.064)Lower Austria 0.869 (0.037)** -0.614 (0.069)**Upper Austria 0.269 (0.039)** 0.075 (0.073)*Salzburg -0.341 (0.053)** -0.184 (0.100)Tirol -0.493 (0.049)** -0.073 (0.094)Vorarlberg 0.199 (0.054)** -0.151 (0.099)Burgenland 0.636 (0.054)** 0.143 (0.096)**Styria 0.471 (0.039)** -0.089 (0.071)Constant -1.867 (0.118)** -1.225 (0.200)**
Observations 116,361 27,186
Note: Estimation results from logit models of assignment and enrollment conditional on assignment onindividual characteristics. The sample includes all male workers entering unemployment March - August2001 with a spell of unemployment longer than 1 day and no unemployment during the 30 days prior tothis spell, aged 15-65. Average wages are calculated as the average of monthly wages (in Euro, year 2000prices) in all jobs during the year, and set zero if no wage is reported.
31