Embed Size (px)
Citation preview
ASPRS 2008 Annual Conference Portland, Oregon April 28 - May 2, 2008
INDIVIDUAL TREE SPECIES IDENTIFICATION USING LIDAR INTENSITY DATA
Sooyoung Kim Gerard Schreuder
University of Washington College of Forest Resources
PO BOX 352100 Seattle, WA 98195-2100
[email protected] [email protected]
Robert J. McGaughey USDA Forest Service
Pacific Northwest Research Station University of Washington
PO BOX 352100 Seattle, WA, 98195-2100 [email protected]
Hans-Erik Andersen USDA Forest Service
Pacific Northwest Research Station Anchorage Forestry Sciences Laboratory
3301 C Street, Suite 200 Anchorage, AK 99503 [email protected]
ABSTRACT Tree species identification is important for a variety of natural resource management and monitoring activities including riparian buffer characterization, wildfire risk assessment, biodiversity monitoring, and wildlife habitat assessment. Intensity data recorded for each laser point in a LIDAR system is related to the spectral reflectance of the target material and thus may be useful for differentiating materials and ultimately tree species. The aim of this study is to test if LIDAR intensity data can be used to differentiate tree species. Leaf-off and leaf-on LIDAR data were obtained in the Washington Park Arboretum, Seattle, Washington, USA. Field work was conducted to measure tree locations, tree species and heights, crown base heights, and crown diameters of individual trees for eight broadleaved species and seven coniferous species. LIDAR points from individual trees were identified using the field-measured tree location. Points from adjacent trees were excluded using a new method introduced in this paper. Mean intensity values of laser returns within individual tree crowns were compared between species. We found that the intensity values for different species were related not only to reflective properties of the vegetation, but also to a presence or absence of foliage and the arrangement of foliage and branches within individual tree crowns. Broadleaved and coniferous species showed better classification accuracy using leaf-off data than using leaf-on data. The differences in intensity from different species possibly increase the potential application to describing forest characteristics.
INTRODUCTION Light Detection and Ranging (LIDAR) offers an advantage over most other remote sensing technologies: its ability to capture 3-dimensional measurements over large areas. LIDAR intensity is a measure of the return signal strength associated with each return. It provides a measure of the peak amplitude of return pulses as they are reflected back from the target to the detector of the LIDAR system. Intensity values vary depending on the flying height, atmospheric conditions, directional reflectance properties, the reflectivity of the target, and the laser settings (Baltsavias, 1999). Most commercial LIDAR systems that are designed for topographic mapping use lasers in the

ASPRS 2008 Annual Conference Portland, Oregon April 28 - May 2, 2008
near infrared range of the electromagnetic spectrum (often 1064nm). LIDAR intensity data appears to contain valuable information relating to forest type and condition. LIDAR intensity data have not been used as much as the three dimensional structure data of laser returns. However, intensity data have been used in conjunction with other variables in some studies. Brandtberg et al. (2003) used indices derived from laser reflectance data as well as height of branches to classify three deciduous species. Holmgren and Persson (2004) used two groups of variables, crown shape-based metrics and intensity-based metrics, to differentiate Norway spruce and Scots pine. They discussed that the density of crowns and gaps within the crowns affected different mean intensity values and standard deviations for the two species. A new approach using a well-defined directed graph (digraph) (Brandtberg, 2007) improved the classification accuracy markedly compared with a previous study (Brandtberg et al., 2003) using both intensity data and more reliable shape prediction. Some researchers have used intensity data as their main basis for classification. Song et al., (2002) applied filters to a gridded representation of intensity data and evaluated its potential to classify different materials such as asphalt, grass, roof, and trees. They concluded that LIDAR intensity can be used for land-cover classification and also reported that the relative intensity of broadleaved trees was almost twice that of conifers. Moffiet et al. (2005) conducted exploratory data analysis to assess the potential of laser return type and return intensity as variables for classification of individual trees or forest stands according to species. They found that discrimination at the individual tree level between white cypress pine (Callitrus glaucophylla) and poplar box (Eucalyptus populnca) was not always possible while the discrimination was reliable at the stand level. They also indicated that return intensity statistics for the forest canopy, such as average and standard deviation, were related not only to the reflective properties of the vegetation, but also to the larger scale properties of the forest such as canopy openness and the spacing and type of foliage components within individual tree crowns. Hasegawa (2006) investigated the characteristics of LIDAR intensity data for land cover classification and concluded that old asphalt and grass were separable, but found that zinc, brick, and trees were not easy to differentiate. Brennan and Webster (2006) utilized LIDAR height and intensity data to classify various land cover types using an object-oriented approach. They concluded that through the use of spectral and spatial attributes of LIDAR data they were able to classify a variety of land cover types using derived surfaces, image object segmentation, and rule-based classification techniques. Recently, LIDAR intensity data was found to be directly related to spectral reflectance of the target materials (Ahokas et al., 2006). These authors studied the relationship between calibration of laser scanner intensity and known brightness targets and concluded that intensity values were directly related to target reflectance from a variety of altitudes (200 m, 1000 m, and 3000 m) after correcting range, incidence angle (both Bidirectional Reflectance Distribution Function, BRDF, and range correction), atmospheric transmittance, attenuation using dark object addition and transmitted power (difference in Pulse Repetition Frequency, PRF, will lead to different transmitter power values). Given that most tree species classification using passively sensed data relies on the spectral reflectance characteristics of foliage and branches, LIDAR intensity data should provide a basis to differentiate between individual tree species or species groups. Because spectral reflectance changes depending on the time of a year for deciduous species (Gates, 1980), acquiring LIDAR datasets in leaf-on and leaf-off conditions could provide additional information useful for species differentiation. By analyzing intensity values of various tree species with different foliage characteristics, such as a presence or absence of foliage, and the spacing and type of foliage components within individual tree crowns, the relative importance of the effect of these characteristics on LIDAR-based species classification can be evaluated. The objective of this research is to test if LIDAR intensity data can be used to differentiate individual tree species and ultimately, classify forested areas into species groups using LIDAR intensity data.
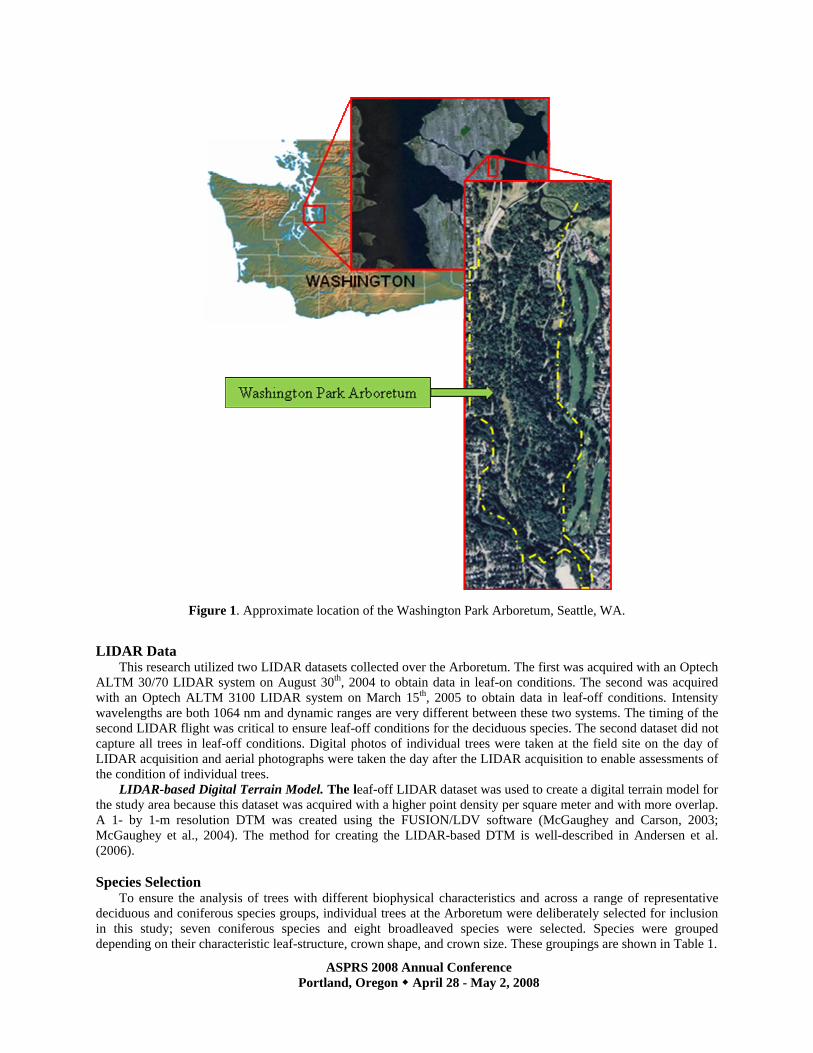
STUDY SITE The study area is the Washington Park Arboretum, an urban green space on the shores of Lake Washington just east of downtown Seattle, WA (see Figure 1). The area covers 93 hectares and it is a suitable field site to study forest parameters at the individual tree level due to the fact that individual trees can be easily detected and measured, and in many cases, tree crowns are not severely overlapped.
ASPRS 2008 Annual Conference Portland, Oregon April 28 - May 2, 2008
Figure 1. Approximate location of the Washington Park Arboretum, Seattle, WA.
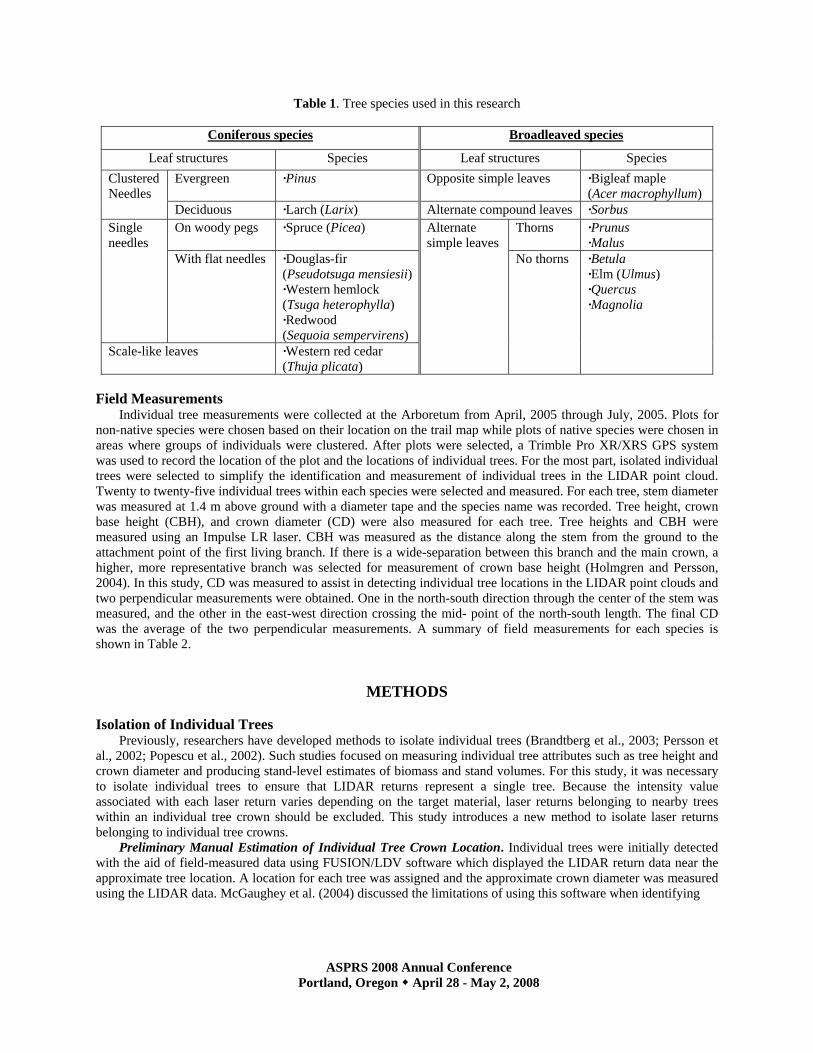
LIDAR Data This research utilized two LIDAR datasets collected over the Arboretum. The first was acquired with an Optech ALTM 30/70 LIDAR system on August 30th, 2004 to obtain data in leaf-on conditions. The second was acquired with an Optech ALTM 3100 LIDAR system on March 15th, 2005 to obtain data in leaf-off conditions. Intensity wavelengths are both 1064 nm and dynamic ranges are very different between these two systems. The timing of the second LIDAR flight was critical to ensure leaf-off conditions for the deciduous species. The second dataset did not capture all trees in leaf-off conditions. Digital photos of individual trees were taken at the field site on the day of LIDAR acquisition and aerial photographs were taken the day after the LIDAR acquisition to enable assessments of the condition of individual trees. LIDAR-based Digital Terrain Model. The leaf-off LIDAR dataset was used to create a digital terrain model for the study area because this dataset was acquired with a higher point density per square meter and with more overlap. A 1- by 1-m resolution DTM was created using the FUSION/LDV software (McGaughey and Carson, 2003; McGaughey et al., 2004). The method for creating the LIDAR-based DTM is well-described in Andersen et al. (2006). Species Selection To ensure the analysis of trees with different biophysical characteristics and across a range of representative deciduous and coniferous species groups, individual trees at the Arboretum were deliberately selected for inclusion in this study; seven coniferous species and eight broadleaved species were selected. Species were grouped depending on their characteristic leaf-structure, crown shape, and crown size. These groupings are shown in Table 1.
ASPRS 2008 Annual Conference Portland, Oregon April 28 - May 2, 2008
Table 1. Tree species used in this research
Coniferous species Broadleaved species
Leaf structures Species Leaf structures Species Evergreen ·Pinus Opposite simple leaves ·Bigleaf maple
(Acer macrophyllum) Clustered Needles
Deciduous ·Larch (Larix) Alternate compound leaves ·Sorbus On woody pegs ·Spruce (Picea) Thorns ·Prunus
·Malus Single needles
With flat needles ·Douglas-fir (Pseudotsuga mensiesii) ·Western hemlock (Tsuga heterophylla) ·Redwood (Sequoia sempervirens)
Scale-like leaves ·Western red cedar (Thuja plicata)
Alternate simple leaves
No thorns
·Betula ·Elm (Ulmus) ·Quercus ·Magnolia
Field Measurements Individual tree measurements were collected at the Arboretum from April, 2005 through July, 2005. Plots for non-native species were chosen based on their location on the trail map while plots of native species were chosen in areas where groups of individuals were clustered. After plots were selected, a Trimble Pro XR/XRS GPS system was used to record the location of the plot and the locations of individual trees. For the most part, isolated individual trees were selected to simplify the identification and measurement of individual trees in the LIDAR point cloud. Twenty to twenty-five individual trees within each species were selected and measured. For each tree, stem diameter was measured at 1.4 m above ground with a diameter tape and the species name was recorded. Tree height, crown base height (CBH), and crown diameter (CD) were also measured for each tree. Tree heights and CBH were measured using an Impulse LR laser. CBH was measured as the distance along the stem from the ground to the attachment point of the first living branch. If there is a wide-separation between this branch and the main crown, a higher, more representative branch was selected for measurement of crown base height (Holmgren and Persson, 2004). In this study, CD was measured to assist in detecting individual tree locations in the LIDAR point clouds and two perpendicular measurements were obtained. One in the north-south direction through the center of the stem was measured, and the other in the east-west direction crossing the mid- point of the north-south length. The final CD was the average of the two perpendicular measurements. A summary of field measurements for each species is shown in Table 2.
METHODS Isolation of Individual Trees Previously, researchers have developed methods to isolate individual trees (Brandtberg et al., 2003; Persson et al., 2002; Popescu et al., 2002). Such studies focused on measuring individual tree attributes such as tree height and crown diameter and producing stand-level estimates of biomass and stand volumes. For this study, it was necessary to isolate individual trees to ensure that LIDAR returns represent a single tree. Because the intensity value associated with each laser return varies depending on the target material, laser returns belonging to nearby trees within an individual tree crown should be excluded. This study introduces a new method to isolate laser returns belonging to individual tree crowns. Preliminary Manual Estimation of Individual Tree Crown Location. Individual trees were initially detected with the aid of field-measured data using FUSION/LDV software which displayed the LIDAR return data near the approximate tree location. A location for each tree was assigned and the approximate crown diameter was measured using the LIDAR data. McGaughey et al. (2004) discussed the limitations of using this software when identifying
ASPRS 2008 Annual Conference Portland, Oregon April 28 - May 2, 2008
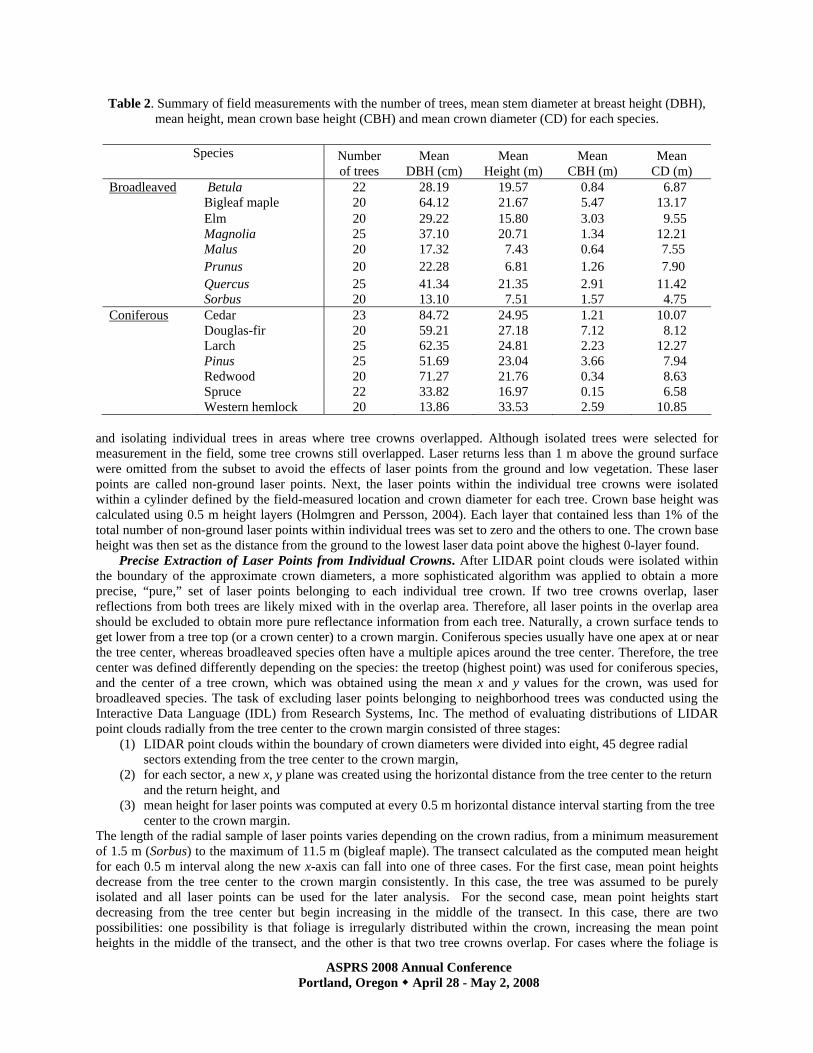
Table 2. Summary of field measurements with the number of trees, mean stem diameter at breast height (DBH), mean height, mean crown base height (CBH) and mean crown diameter (CD) for each species.
Species
Number of trees
Mean DBH (cm)
Mean Height (m)
Mean CBH (m)
Mean CD (m)
Broadleaved Betula 22 28.19 19.57 0.84 6.87 Bigleaf maple 20 64.12 21.67 5.47 13.17 Elm 20 29.22 15.80 3.03 9.55 Magnolia 25 37.10 20.71 1.34 12.21 Malus 20 17.32 7.43 0.64 7.55 Prunus 20 22.28 6.81 1.26 7.90 Quercus 25 41.34 21.35 2.91 11.42 Sorbus 20 13.10 7.51 1.57 4.75
Coniferous Cedar 23 84.72 24.95 1.21 10.07 Douglas-fir 20 59.21 27.18 7.12 8.12 Larch 25 62.35 24.81 2.23 12.27 Pinus 25 51.69 23.04 3.66 7.94 Redwood 20 71.27 21.76 0.34 8.63 Spruce 22 33.82 16.97 0.15 6.58 Western hemlock 20 13.86 33.53 2.59 10.85
and isolating individual trees in areas where tree crowns overlapped. Although isolated trees were selected for measurement in the field, some tree crowns still overlapped. Laser returns less than 1 m above the ground surface were omitted from the subset to avoid the effects of laser points from the ground and low vegetation. These laser points are called non-ground laser points. Next, the laser points within the individual tree crowns were isolated within a cylinder defined by the field-measured location and crown diameter for each tree. Crown base height was calculated using 0.5 m height layers (Holmgren and Persson, 2004). Each layer that contained less than 1% of the total number of non-ground laser points within individual trees was set to zero and the others to one. The crown base height was then set as the distance from the ground to the lowest laser data point above the highest 0-layer found. Precise Extraction of Laser Points from Individual Crowns. After LIDAR point clouds were isolated within the boundary of the approximate crown diameters, a more sophisticated algorithm was applied to obtain a more precise, “pure,” set of laser points belonging to each individual tree crown. If two tree crowns overlap, laser reflections from both trees are likely mixed with in the overlap area. Therefore, all laser points in the overlap area should be excluded to obtain more pure reflectance information from each tree. Naturally, a crown surface tends to get lower from a tree top (or a crown center) to a crown margin. Coniferous species usually have one apex at or near the tree center, whereas broadleaved species often have a multiple apices around the tree center. Therefore, the tree center was defined differently depending on the species: the treetop (highest point) was used for coniferous species, and the center of a tree crown, which was obtained using the mean x and y values for the crown, was used for broadleaved species. The task of excluding laser points belonging to neighborhood trees was conducted using the Interactive Data Language (IDL) from Research Systems, Inc. The method of evaluating distributions of LIDAR point clouds radially from the tree center to the crown margin consisted of three stages:
(1) LIDAR point clouds within the boundary of crown diameters were divided into eight, 45 degree radial sectors extending from the tree center to the crown margin,
(2) for each sector, a new x, y plane was created using the horizontal distance from the tree center to the return and the return height, and
(3) mean height for laser points was computed at every 0.5 m horizontal distance interval starting from the tree center to the crown margin.
The length of the radial sample of laser points varies depending on the crown radius, from a minimum measurement of 1.5 m (Sorbus) to the maximum of 11.5 m (bigleaf maple). The transect calculated as the computed mean height for each 0.5 m interval along the new x-axis can fall into one of three cases. For the first case, mean point heights decrease from the tree center to the crown margin consistently. In this case, the tree was assumed to be purely isolated and all laser points can be used for the later analysis. For the second case, mean point heights start decreasing from the tree center but begin increasing in the middle of the transect. In this case, there are two possibilities: one possibility is that foliage is irregularly distributed within the crown, increasing the mean point heights in the middle of the transect, and the other is that two tree crowns overlap. For cases where the foliage is

ASPRS 2008 Annual Conference Portland, Oregon April 28 - May 2, 2008
irregularly distributed, the tree crown can be considered as being isolated. For cases where tree crowns overlap, laser points within the overlap area should be deleted. Therefore, criteria to separate these two cases should be considered. If the trend of mean point heights increases in the middle of the transect consecutively over a certain distance threshold, the tree crown was assumed to overlap in that sector and this sector was excluded. Otherwise, the tree was regarded as being isolated and all laser points were used for later analysis. Three different scales were applied to each sector for individual trees depending on the crown size: 1) if average crown radius was less than 3 meters and the mean point heights increase more than two intervals (1 meter), the sector was excluded, 2) if average crown radius was between 3 and 6 meters and the mean point heights increase for more than three intervals (1.5 meters), the sector was excluded, and 3) if average crown radius was over 6 meters and the mean point heights increase more than four intervals (2 meters), the sector was excluded. For the third case, mean point heights start decreasing from the tree center but begin increasing over the last few intervals. In this case, two trees were assumed to overlap around the edge of tree crowns and only the last intervals where mean point heights increase were excluded. Again, three different scales were applied to each sector of individual trees depending on the crown size: 1) if average crown radius was less than 3 meters, the marginal intervals were deleted up to two intervals (1 meter), 2) if average crown radius was between 3 and 6 meters, the marginal intervals were deleted up to three intervals (1.5 meters), and 3) if average crown radius was over 6 meters, the marginal intervals were deleted up to four intervals (2 meters). Computation of Variables Using samples of laser points belonging to individual trees, variables were computed to analyze intensity data for each tree species. All variables were derived using laser returns that were located above the crown base height. Mean intensity values were computed for the whole crown, upper crown and crown surface within individual tree crowns in both leaf-on and leaf-off datasets. The role of upper canopy to estimate forest stand level parameters has been emphasized and laser returns from the upper crown are less affected by overlapped areas than those from the whole crown. The uppermost 3 meters of the crown observed in the field was isolated in this dataset. Therefore, an upper crown was defined as laser points within 3 meters (vertical distance) of the highest laser point. Some individual trees of Prunus, Malus and Sorbus had crown lengths less than 3 meters. In these cases, laser points for the whole crown were the same as those for the upper crown. Laser points representing the crown surface were extracted after creating a canopy surface model using FUSION/LDV software. A 0.5- by 0.5-meter grid was overlaid onto the point data. Within each grid cell, the elevation of the highest laser point was assigned to the center of the grid cell. The resulting surface model drapes over the laser points. However, the surface may be slightly lower than many of the highest returns since the horizontal location of the grid cell center will not be the same as the location of the high points. Attributes of laser returns within 1-meter and 0.5-meter of the surface were compared. Returns close to the crown surface are more likely to represent leaves in leaf-on data, and therefore the intensity of the crown surface might better represent leaf intensity values. Therefore, the two buffer sizes were used to obtain samples containing returns representing foliage without eliminating too many laser points. Because there was little difference between the 1-meter and 0.5-meter buffers when comparing mean intensity values, the 1-m buffer was used for computing variables. In most cases, first returns have the highest intensity values when compared to other returns in the same pulse. Intensity values for first returns are most easily interpreted since they represent a direct, albeit uncalibrated, measurement of the reflectivity of the target material (McGaughey et al., 2007). Mean first return intensity values were computed for the whole crown, upper crown and the crown surface. To compare the variability of intensity among species, coefficient of variation (CV) was computed. The CV, defined as the ratio of the standard deviation to the mean, is useful when comparing variability between data with different means. Proportion of first returns was also computed. Finally, the following nine variables were derived in leaf-on and leaf-off datasets using isolated laser returns within individual tree crowns: (1) mean intensity values for the whole crown using all returns (whole_all), (2) mean intensity values for the whole crown using first returns (whole_1), (3) mean intensity values for the upper crown using all returns (upper_all), (4) mean intensity values for the upper crown using first returns (upper_1), (5) mean intensity values for the crown surface using all returns (surface_all), (6) mean intensity values for the crown surface using first returns (surface_1), (7) coefficient of variation of all return intensity for the whole crown (cv_all), (8) coefficient of variation of first return intensity for the whole crown (cv_1), and (9) proportion of first returns. Statistical Analysis Student’s t-test. In addition to comparing mean intensity values for each tree species, Student’s t-test was used to compare the mean intensity values for the pairs of all species. Discriminant Analysis. Linear discriminant analysis was conducted using the discrim function in S-Plus to test the classification accuracy for coniferous species and broadleaved species.
ASPRS 2008 Annual Conference Portland, Oregon April 28 - May 2, 2008
Principal Component Analysis. Principal component analysis (PCA) is a technique used to reduce multidimensional datasets to lower dimensions for analysis. Before carrying out the discriminant analysis, PCA was conducted to reduce the number of correlated variables and simplify later analyses. The new variables are derived in decreasing order of importance so that the first few principal components (PCs) retain most of the variation present in all of the original variables (Jolliffe, 2002), comparing unit variances of each principal component (lk) and retaining only those PCs whose variances lk exceed the cut-off level, l*= 0.7. After the number of components is determined, variables from the unchosen set are added to the chosen set according to which has the greatest absolute coefficient value on the component. In this study, principal component analysis was conducted using the R statistical package.
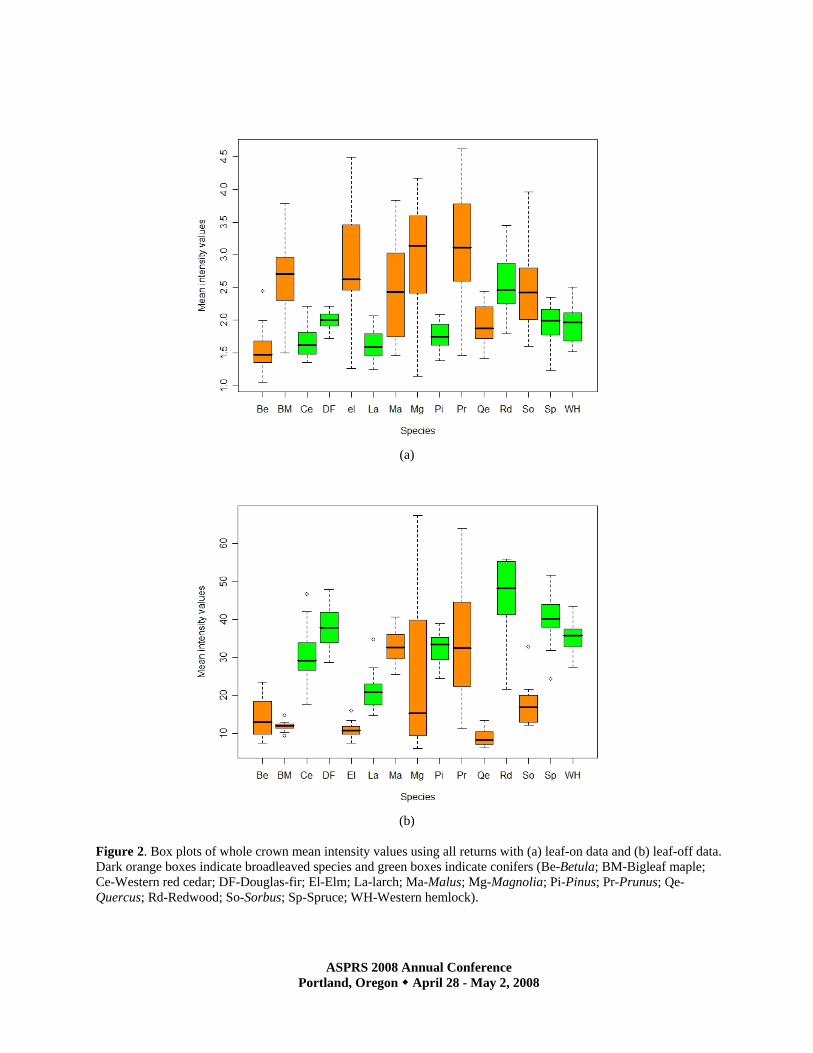
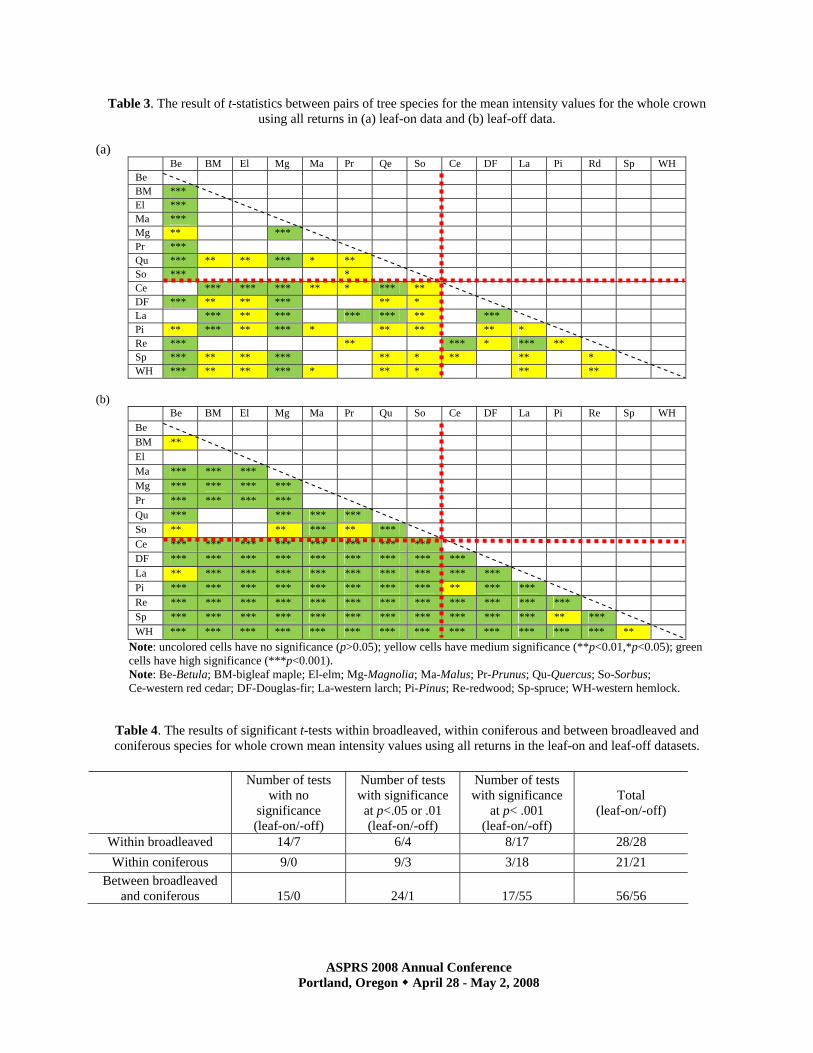
RESULTS Intensity analysis among Species Box plots of mean intensity values for the whole crown using all returns among species are shown in Figure 2 with (a) leaf-on data and (b) leaf-off data. Dark orange boxes indicate broadleaved species and green boxes indicate conifers. The range of mean intensity values was 1.5 to 3.4 in leaf-on data while in leaf-off data, it was 9.0 to 50.7. The difference between the intensity values of the leaf-on and leaf-off data demonstrates the differences that can be expected given that intensity values are not calibrated and can vary depending on the sensor used for the acquisition. The result among coniferous species in leaf-off data was similar to that in leaf-on data. In both datasets, larch, cedar and Pinus showed lower mean intensity values than the other coniferous species. In leaf-on data, generally, broadleaved species showed higher mean intensity values than coniferous species. Prunus showed highest mean intensity values among all species. Magnolia, elm, and bigleaf maple showed high mean intensity values following Prunus. These four have higher mean values than any of the conifers. Betula had the lowest intensity values among broadleaved species studied. In leaf-off data, Quercus, bigleaf maple and elm which had no foliage at the time of data acquisition resulted in very low intensity values compared with other species. Some individuals of deciduous broadleaved species, Betula and Sorbus, and those of deciduous conifer, larch, had leaves that were emerging at the time of leaf-off data acquisition in March. These species had slightly higher mean intensity values than deciduous trees without foliage, bigleaf maple, elm and Quercus. In addition, three species, Prunus, Malus and Magnolia, had flowers at the time of leaf-off data acquisition and also showed relatively high intensity values. Significance Tests To assess whether mean intensity values between two species are significantly different, a two-sample Student’s t-test was used. The results of the t-test for mean intensity values for the whole crown are shown in Table 3 with (a) leaf-on data and (b) leaf-off data. In Table 3, cells with no color have no significant differences (p>0.05), yellow cells have medium significance (** p<0.01, * p<0.05) and green cells have high significance (*** p<0.001). Eight broadleaved species and seven coniferous species were coded alphabetically: Be-Betula, BM-bigleaf maple, El-elm, Mg-Magnolia, Ma-Malus, Pr-Prunus, Qe-Quercus, So-Sorbus, Ce-cedar, DF-Douglas-fir, La-larch, Pi-Pinus, Rd-redwood, Sp-spruce, and WH-western hemlock. Table 4 shows the results of significant t-tests within broadleaved, within coniferous, and between broadleaved and coniferous species in the leaf-on and leaf-off datasets. It should be noted that while this table provides an indication of relative separability between species, it does not account for experimentwise error, and therefore the statistical significance of these differences is inflated in these results. Generally, pairs between broadleaved species and coniferous species showed better separability than pairs within broadleaved species or within coniferous species. Most pairs in leaf-off conditions were significantly different. With the exception of several pairs within the broadleaved species group, each pair was highly significant in leaf-off data (p<0.001). In leaf-on data, even pairwise differences between broadleaved species and coniferous species were not always significantly different (p>0.05). Interestingly, Betula (Be), which showed much lower mean intensity values than other broadleaved species in leaf-on data, was significantly different from all other broadleaved species, while it was not significantly different from some coniferous species, such as cedar and larch, which showed the lowest mean intensity values among conifers in leaf-on data.
ASPRS 2008 Annual Conference Portland, Oregon April 28 - May 2, 2008
(a)
(b)
Figure 2. Box plots of whole crown mean intensity values using all returns with (a) leaf-on data and (b) leaf-off data. Dark orange boxes indicate broadleaved species and green boxes indicate conifers (Be-Betula; BM-Bigleaf maple; Ce-Western red cedar; DF-Douglas-fir; El-Elm; La-larch; Ma-Malus; Mg-Magnolia; Pi-Pinus; Pr-Prunus; Qe-Quercus; Rd-Redwood; So-Sorbus; Sp-Spruce; WH-Western hemlock).
ASPRS 2008 Annual Conference Portland, Oregon April 28 - May 2, 2008
Table 3. The result of t-statistics between pairs of tree species for the mean intensity values for the whole crown using all returns in (a) leaf-on data and (b) leaf-off data.
(a)
Be BM El Mg Ma Pr Qe So Ce DF La Pi Rd Sp WH Be BM *** El *** Ma *** Mg ** *** Pr *** Qu *** ** ** *** * ** So *** * Ce *** *** *** ** * *** ** DF *** ** ** *** ** * La *** ** *** *** *** ** *** Pi ** *** ** *** * ** ** ** * Re *** ** *** * *** ** Sp *** ** ** *** ** * ** ** * WH *** ** ** *** * ** * ** **
(b)
Be BM El Mg Ma Pr Qu So Ce DF La Pi Re Sp WH Be BM ** El Ma *** *** *** Mg *** *** *** *** Pr *** *** *** *** Qu *** *** *** *** So ** ** *** ** *** Ce *** *** *** *** *** *** *** *** DF *** *** *** *** *** *** *** *** *** La ** *** *** *** *** *** *** *** *** *** Pi *** *** *** *** *** *** *** *** ** *** *** Re *** *** *** *** *** *** *** *** *** *** *** *** Sp *** *** *** *** *** *** *** *** *** *** *** ** *** WH *** *** *** *** *** *** *** *** *** *** *** *** *** **
Note: uncolored cells have no significance (p>0.05); yellow cells have medium significance (**p<0.01,*p<0.05); green cells have high significance (***p<0.001). Note: Be-Betula; BM-bigleaf maple; El-elm; Mg-Magnolia; Ma-Malus; Pr-Prunus; Qu-Quercus; So-Sorbus; Ce-western red cedar; DF-Douglas-fir; La-western larch; Pi-Pinus; Re-redwood; Sp-spruce; WH-western hemlock.
Table 4. The results of significant t-tests within broadleaved, within coniferous and between broadleaved and coniferous species for whole crown mean intensity values using all returns in the leaf-on and leaf-off datasets.
Number of tests
with no significance (leaf-on/-off)
Number of tests with significance at p<.05 or .01 (leaf-on/-off)
Number of tests with significance
at p< .001 (leaf-on/-off)
Total
(leaf-on/-off)
Within broadleaved 14/7 6/4 8/17 28/28 Within coniferous 9/0 9/3 3/18 21/21
Between broadleaved and coniferous
15/0
24/1
17/55
56/56
ASPRS 2008 Annual Conference Portland, Oregon April 28 - May 2, 2008
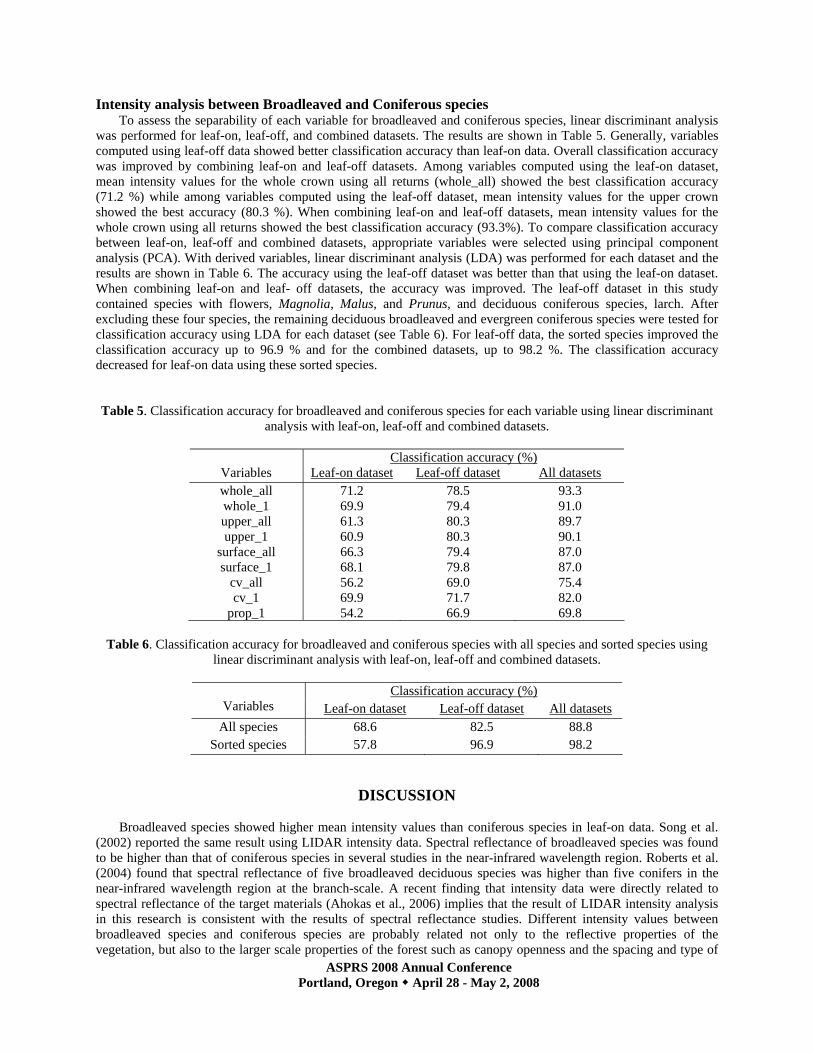
Intensity analysis between Broadleaved and Coniferous species To assess the separability of each variable for broadleaved and coniferous species, linear discriminant analysis was performed for leaf-on, leaf-off, and combined datasets. The results are shown in Table 5. Generally, variables computed using leaf-off data showed better classification accuracy than leaf-on data. Overall classification accuracy was improved by combining leaf-on and leaf-off datasets. Among variables computed using the leaf-on dataset, mean intensity values for the whole crown using all returns (whole_all) showed the best classification accuracy (71.2 %) while among variables computed using the leaf-off dataset, mean intensity values for the upper crown showed the best accuracy (80.3 %). When combining leaf-on and leaf-off datasets, mean intensity values for the whole crown using all returns showed the best classification accuracy (93.3%). To compare classification accuracy between leaf-on, leaf-off and combined datasets, appropriate variables were selected using principal component analysis (PCA). With derived variables, linear discriminant analysis (LDA) was performed for each dataset and the results are shown in Table 6. The accuracy using the leaf-off dataset was better than that using the leaf-on dataset. When combining leaf-on and leaf- off datasets, the accuracy was improved. The leaf-off dataset in this study contained species with flowers, Magnolia, Malus, and Prunus, and deciduous coniferous species, larch. After excluding these four species, the remaining deciduous broadleaved and evergreen coniferous species were tested for classification accuracy using LDA for each dataset (see Table 6). For leaf-off data, the sorted species improved the classification accuracy up to 96.9 % and for the combined datasets, up to 98.2 %. The classification accuracy decreased for leaf-on data using these sorted species. Table 5. Classification accuracy for broadleaved and coniferous species for each variable using linear discriminant
analysis with leaf-on, leaf-off and combined datasets.
Classification accuracy (%) Variables Leaf-on dataset Leaf-off dataset All datasets whole_all 71.2 78.5 93.3 whole_1 69.9 79.4 91.0 upper_all 61.3 80.3 89.7 upper_1 60.9 80.3 90.1
surface_all 66.3 79.4 87.0 surface_1 68.1 79.8 87.0
cv_all 56.2 69.0 75.4 cv_1 69.9 71.7 82.0
prop_1 54.2 66.9 69.8
Table 6. Classification accuracy for broadleaved and coniferous species with all species and sorted species using linear discriminant analysis with leaf-on, leaf-off and combined datasets.
Classification accuracy (%)
Variables Leaf-on dataset Leaf-off dataset All datasets All species 68.6 82.5 88.8
Sorted species 57.8 96.9 98.2
DISCUSSION Broadleaved species showed higher mean intensity values than coniferous species in leaf-on data. Song et al. (2002) reported the same result using LIDAR intensity data. Spectral reflectance of broadleaved species was found to be higher than that of coniferous species in several studies in the near-infrared wavelength region. Roberts et al. (2004) found that spectral reflectance of five broadleaved deciduous species was higher than five conifers in the near-infrared wavelength region at the branch-scale. A recent finding that intensity data were directly related to spectral reflectance of the target materials (Ahokas et al., 2006) implies that the result of LIDAR intensity analysis in this research is consistent with the results of spectral reflectance studies. Different intensity values between broadleaved species and coniferous species are probably related not only to the reflective properties of the vegetation, but also to the larger scale properties of the forest such as canopy openness and the spacing and type of

ASPRS 2008 Annual Conference Portland, Oregon April 28 - May 2, 2008
foliage components within individual tree crowns. For example, laser pulses probably have a greater chance of passing through needles or scale-like leaves than broad leaves. A pulse passing deeper into the crown would generate multiple returns for each echo and consequently mean intensity values would be lower within the crown and more likely associated with branches. In contrast, broadleaved species showed lower mean intensity values than coniferous species in leaf-off data. This result is supported by Roberts et al. (2004) who reported that bark has a lower spectral reflectance than leaves. In leaf-off conditions, most laser pulses would reflect from woody materials such as stems, branches and bark lowering reflectance of deciduous species relative to non-deciduous species. In the leaf-on data analysis, Betula showed very low intensity values among broadleaved species probably because Betula has relatively sparse foliage increasing the chance that laser pulses reflect from branches. In contrast, Prunus showed the highest mean intensity values in leaf-on data probably because foliage is distributed densely within the crown, laser pulses would most likely reflect from the crown surface which is mostly composed of leaves rather than branches, resulting in higher intensity values. Among coniferous species, Douglas-fir, western hemlock, redwood and spruce showed higher intensity values than larch, cedar and Pinus in both leaf-on and leaf-off data. This result seems to be related to their leaf structures. The former four species have single needles, whereas Pinus and larch have clustered needles and cedar has small scale-like needles. Species with single needles showed higher intensity than those with clustered needles probably because clustered needles allow bare branches to be exposed between needle clusters, which would raise the chance of laser pulses reflecting from branches. Overall, pairs of tree species showed very significant differences for the mean intensity values for the whole crown in leaf-off data, even within broadleaved species and within coniferous species. Foliar conditions of evergreen coniferous species are not very different between two datasets, however, the pair-wise significance tests among coniferous species in leaf-on data showed poorer separability than in leaf-off data. This is probably because two LIDAR datasets were acquired using different laser scanners operated by different vendors. The laser scanner system used to acquire leaf-off data, Optech ALTM 3100, with a higher pulse repetition frequency, higher point density per square meter and more overlap between flight lines, could differentiate each species better than that used to acquire leaf-on data, Optech ALTM 30/70. The result of discriminant analysis implies that combining leaf-on and leaf-off data would result in better overall classification accuracies for broadleaved species and coniferous species than using data from one season. However, trade-offs should be considered between the cost of acquiring additional LIDAR data and the improvement in the classification accuracy. In fact, combining leaf-on and leaf-off data didn’t improve classification accuracy substantially compared with using the leaf-off data only. Therefore, for the purpose of classifying these two species groups, using LIDAR data acquired in leaf-off conditions is recommended. The LIDAR dataset obtained in mid-March didn’t represent ideal leaf-off conditions for some species. Predictably, classification accuracy was improved by deleting three broadleaved species that were flowering at the time of the acquisition, Magnolia, Malus and Prunus, and one deciduous coniferous species, larch, using the leaf-off data. This result implies that if LIDAR data could be acquired during the winter with complete leaf-off conditions, the distinction between leaf-on and leaf-off conditions would be more reliable, resulting in better classification accuracy for broadleaved and coniferous species. Or, because trees with leaves or those without leaves could be recognized via aerial photographs and photos taken at the field at the time of the LIDAR data acquisition on March 17th, if we restricted our investigation to these clearly distinguished species, with leaves or without leaves, the analysis using leaf-on and leaf-off conditions would be more reliable. The classification accuracy decreased without these four species in the leaf-on dataset. This is probably because these species are not different from the others in late summer and only reduced the overall sample size. The presence or absence of foliage in deciduous species changes seasonally and the time of blooming varies depending on species. It would be helpful to know when each species blooms prior to selecting the date for data acquisition.
CONCLUSIONS AND FUTURE WORK
The overall results showed that LIDAR intensity data could distinguish broadleaved species from conifers and further distinguish various tree species within these broad groups. Different intensity values between species were related not only to reflective properties of the vegetation, but also to a presence or absence of foliage and the arrangement of foliage and branches within individual tree crowns. Two different seasonal LIDAR datasets resulted in different relative intensity values among species with better separation using leaf-off data than leaf-on data, albeit with two different LIDAR sensors. Future directions for this study will include acquiring LIDAR data in both summer and winter, using the same LIDAR system to control for system effects. This will lead to more reliable

ASPRS 2008 Annual Conference Portland, Oregon April 28 - May 2, 2008
classification results with better differentiation between tree species and also improve the classification accuracy between broadleaved species and coniferous species.
REFERENCES Ahokas, E., S. Kaasalainen, J. Hyyppä, and J. Sauomalainen, 2006. Calibration of the Optech ALTM 3100 laser scanner intensity data using brightness targets, ISPRS Commission I Symposium, July 3-6, 2006, Marne- la-Vallee, France, International Archives of Photogrammetry, Remote Sensing and Spatial Information Science, 36(A1), CD-ROM. Andersen, H.-E., S.E. Reutebuch, and R. J. McGaughey, 2006. A rigorous assessment of tree height measurements obtained using airborne lidar and conventional field methods, Canadian Journal of Remote Sensing, 32(5): 355-366. Baltsavias, E. P., 1999. Airborne laser scanning: basic relations and formulas, ISPRS Journal of Photogrammetry & Remote Sensing 54: 199-214. Brandtberg, T., T. Warner, R. E. Landenberger, and J. B. McGraw, 2003. Detection and analysis of individual leaf-off tree crowns in small footprint, high sampling density lidar data from the eastern deciduous forest in North America, Remote Sensing of Environment, 85(3): 290-303. Brantberg, T. (2007). Classifying individual tree species under leaf-off and leaf-on conditions using airborne lidar. ISPRS Journal of Photogrammetry and Remote Sensing, 61(5): 325-340. Brennan, R. and T. L. Webster, 2006. Object-oriented land cover classification of lidar-derived surfaces, Canadian
Journal of Remote Sensing, 32(2): 162-172. Gates, D. M., 1980. Biophysical Ecology, Springer-Verlag. New York. Hasegawa, H., 2006. Evaluations of LIDAR reflectance amplitude sensitivity towards land cover conditions, Bulletin of the Geographical Survey Institute, Vol. 53 March, 2006. Holmgren, J. and Å. Persson, 2004. Identifying species of individual trees using airborne laser scanner, Remote Sensing of Environment, 90(4): 415-423. Hyyppä, J., O. Kelle, M. Lehikoinen, and M. Inkinen, 2001. A segmentation-based method to retrieve stem volume estimates from 3-D tree height models produced by laser scanners, IEEE Transactions on Geosceince and Remote Sensing, 39(5): 969-975. Jolliffe, I. T., 2002. Principal component analysis, Springer-Verlag, New York. McGaughey, R. J. and W. W. Carson, 2003. Fusing LIDAR data, photographs, and other data using 2D and 3D visualization techniques, In: Proceedings of Terrain Data: Applications and Visualization –Making the Connection, October 28-30, 2003. pp: 16-24. McGaughey, R. J., W. W. Carson, S. E. Reutebuch, and H.- E. Andersen, 2004. Direct measurement of individual tree characteristics from LIDAR data, In: Proceedings of the 2004 Annual ASPRS Conference, May 23-28 2004; Denver, Colorado: Bethesda, MD: American Society for Photogrammetry and Remote Sensing. McGaughey, R. J., S. E. Reutebuch, and H.- E. Andersen, 2007. Creation and use of LIDAR intensity images for natural resource applications, 21st Biennial Workshop on Aerial Photography, Videography, and High Resolution Digital Imagery for Resource Assessment, May 15-17, 2007. Terre Haute, Indiana. Moffiet, T., K .Mengersen, C. Witte, R. King, and R. Denham, 2005. Airborne laser scanning: exploratory data analysis indicates potential variables for classification of individual trees or forest stands according to species, ISPRS Journal of Photogrammetry and Remote Sensing, 59 (5), 289–309. Song, J-H., S. H. Han, K. Yu, and Y. L. Kim, 2002. Assessing the possibility of land-cover classification using
LIDAR intensity data, ISPRS Commission III, Vol. 34 Part 3B, “Photogrammetric Computer Vision”, Garz. Popescu, S. C., R. H. Wynne, and R.F.Nelson, 2002. Estimating plot-level tree heights with lidar: local filtering with
a canopy-height based variable window size, Computers and Electronics in Agriculture, 37: 71-95. Roberts, D. A., S. L. Ustin, S. Ogunjemiyo, J. Greenberg, S. Z. Dobrowski, J. Chen, and T. M. Hinckley, 2004.
Spectral and Structural Measures of Northwest Forest Vegetation at Leaf to Landscape Scales, Ecosystems, 7:545-562.