Embed Size (px)
Citation preview

Age and Ageing 1998; 27: 31 I -319
Individuality and responsiveness ofbiochemical indices of dehydration inhospitalized elderly patientsMARCEL G. M. OLDE RJKKERT, MARTIN A. VAN'T HOF1, HENK BAADENHUYSEN2,
WlLUBRORD H. L HOEFNAGELS
Departments of Geriatric Medicine and 'Medical Informatics, Epidemiology and Statistics, University of Nijmegen,PO Box 9101, 6500 HB Nijmegen, The Netherlands2 Laboratory of Clinical Chemistry, University Hospital Nijmegen, The Netherlands
Address correspondence to: M. G. M Olde Rikkert Fax (+31) 24 361 7408
Abstract
Background: dehydration is common in elderly patients, but difficult to detect, by either an initial assessment offluid balance or by monitoring fluid balance over time. In clinical chemistry, population-based reference ranges arconly of value for monitoring individual patients if within-subject variability in serial test results over time is largerthan between-subject variability. This may have important implications in monitoring fluid balance.Ainu to assess the within- and between-subject variability of serial laboratory test results in euvolaemia and theirresponsiveness to dehydration in elderly patients.Methods: over 16 months, 218 patients were admitted to the geriatric department and 53 consented to participate.Fluid balance was assessed twice a week by physical examination, laboratory tests and weighing. Changes in fluidbalance were quantified by measuring total body and extracellular water applying deuterium- and bromide-dilutiontechniques. Within- and between-subject variability in euvolaemia and responsiveness indexes (RI) for dehydrationwere calculated for haematocrit, serum sodium, urea and creatinine concentrations and for the urea/creatinineratio.Results: during hospitalization 14 patients suffered from dehydration and 27 remained euvolaemic. Data from 12overhydrated patients were excluded. In a mean study period of 30 days, each patient's fluid balance was assessed6.3 (1.9) times. This resulted in 1084 laboratory tests and 271 assessments of fluid balance. In all quantities within-subject variability was much smaller than between-subject variability in euvolaemia. Responsiveness of creatinine(mean RI = 2.5) was best and similar to the RI of serial weights (mean RI = 2.9).Conclusion: population-based reference ranges are of limited value in monitoring fluid balance. Repeatedlymeasuring plasma creatinine, combined with physical examination and weighing is the best way to monitor fluidbalance in elderly patients.
Keywords: clinical chemistry, dehydration, reference ranges, responsiveness, variability
IntroductionMany diseases may disturb fluid balance, which isalready compromised by age-related loss of total bodywater (TBW), renal function and the responsiveness ofthirst to dehydration. Signs of dehydration (particularlyreduced skin turgor and orthostatic hypotension) areoften present in normally hydrated older people [1,2]and so have a limited sensitivity and specificity indiagnosing mild and moderate dehydration during theinitial assessment of new patients [3, 4]. Hence, inresearch as well as in clinical practice, the diagnosis of
dehydration is commonly based on raised serumconcentrations of sodium, urea and creatinine,increased urea/creatinine ratio and increased osmo-lality [3-6]. However, there are important limitations inthe use of biochemical indices of dehydration. Firstly,population-based reference ranges (PBRRs) of theseindices show clinically relevant changes with increas-ing age [7] but the PBRRs which are often used in dailypractice were determined in a non-aged population.Secondly, diagnosing dehydration simply on the basis ofhypernatraemia may be incorrect because hyperna-traemia may also be caused by an age-related increase in
31 I
Dow
nloaded from https://academ
ic.oup.com/ageing/article-abstract/27/3/311/17099 by guest on 11 April 2019

M. G. M. Olde Rikkert et al.
osmality [8]. Moreover, it may be unwise to rely on ureaand creatinine concentrations or urea/creatinine ratiosfor the assessment of fluid balance since there may beage- or disease-related loss in renal function [9-11].
As laboratory indices of dehydration in euvolaemicnursing-home patients are highly variable betweenindividuals but stable over time within an individual[12], we questioned whether this individuality ineuvolaemic laboratory test results would also befound in hospitalized elderly patients. If this were thecase, the interpretation of laboratory tests might beimproved by applying subject-specific reference ranges(SSRRs) instead of PBRRs, as has been advocated forhealthy elderly subjects [13-15]. Up until now, therehave been no reports on constructing SSRRs ingeriatric patients, although many physicians performa similar analysis by intuition when judging seriallaboratory measurements.
In monitoring fluid balance the value of theindividual laboratory tests is uncertain: in particularthe value of measuring serum urea concentrations hasbeen questioned [6]. In general, diagnostic instrumentsused in monitoring can be compared quantitativelyby their responsiveness to clinically relevant changes[16, 17]. To differentiate between the usefulness ofrepeatedly measuring haematocrit, serum sodium, ureaand creatinine concentrations and urea/creatinineratios, this study aims to quantify the responsivenessof these factors to dehydration in elderly patients.
Methods
This study was part of a larger non-therapeutic researchproject aimed at the validation of diagnostic measuresin monitoring fluid balance in geriatric patients. Theresearch protocol was approved of by the localcommittee on human experimentation. All 218patients admitted to the 22-bed department of geriatricmedicine of the University Hospital Nijmegen between1 September 1994 and 31 December 1995 werescreened for eligibility. Only subjects who werejudged capable of giving informed consent (n = 89',Clinical Dementia Rating scale ^ 1 [18]) and were notterminally ill •were included in this non-therapeuticstudy. Patients with an acute confusional state onadmission were reassessed for capacity to consent afterdelirium had resolved. Written informed consent wasobtained from 53 (68%) of the 78 invited eligiblesubjects.
Fluid balance assessment
During hospitalization a geriatrician assessed eachpatient's fluid balance twice a week, based on astandardized physical examination, weighing, labora-tory tests, relevant data from medical history and theobservations of the nurse in charge of the patient. Twogeriatricians assessed fluid balance, but individual
patients' assessments were carried out by a singlegeriatrician. These geriatricians were unaware that thisstudy focused on within- and between-subject varia-bility of biochemical indices. Physical examinationconsisted of determining the Boston heart failure score[19] and the assessment of the indicators of dehydra-tion that correlate with dehydration regardless of age:tongue dryness, longitudinal tongue furrows, drynessof the mucous membranes of the mouth, upper bodymuscle weakness, confusion, sunken eyes and axillarymoisture [3, 4]. Venous blood samples were drawntwice a week under identical conditions (in themorning, just after waking and before clinical assess-ment). Serum sodium, urea and creatinine concentra-tions and the haematocrit were measured on eachoccasion, but results only were available 1 day afterclinical examination. Following this rigorous clinicalassessment each patient was judged as dehydrated,overhydrated or euvolaemic.
Dehydration and overhydration were defined asconditions characterized by a clinically relevant short-age or overload of TBW, indicating a need fortherapeutic adjustments (rehydration and diureticdrugs, respectively) and resulting in a change inclinical signs, weight and/or laboratory values. In theabsence of dehydration or overhydration, a patient wasjudged as euvolaemic. Fluid balance assessments werereconsidered after monitoring the effects of therapy,because this judgement over time is probably the mostsensitive indicator of dehydration [20].
Body composition analysis
Body composition analysis was carried out twice perpatient by using deuterium oxide- and potassiumbromide-dilution techniques to quantify clinicallyrelevant changes in TBW and extracellular fluid(ECF). It was carried out 1 day after obtaining informedconsent and repeated whenever a patient's fluidbalance changed from euvolaemia, dehydration oroverhydration. In patients who stayed euvolaemicduring hospitalization, body composition analysis wascarried out again just before discharge.
For each analysis a cocktail of 10.0 g deuteriumoxide and 900 mg potassium bromide was given orally.After 3.5 h dilution time a venous blood sample wasdrawn. After sublimation of the plasma, the deuteriumconcentration was determined in the sublimate byinfrared spectroscopy analysis [21]. TBW was calcu-lated from the given dose and the tracer concentrationdetermined in plasma, using a correction of 5% for non-aqueous dilution [22]. Bromide in plasma was deter-mined after ultra-filtration by high pressure liquidchromatography [23]. A correction of 5% was used forthe Donnan effect (i.e. the unequal distribution ofions at living cell membranes because of the intra-cellular presence of impermeate anion proteinates)and a correction of 10% for non-extracellular dilution
312
Dow
nloaded from https://academ
ic.oup.com/ageing/article-abstract/27/3/311/17099 by guest on 11 April 2019
Serial laboratory tests for monitoring fluid balance
[22]. Analytical measurement errors in bromide- anddeuterium-dilution methods, as measured by within-run and between-run variability in two pairs ofidentical blood samples, were 2.2% and 2.5%. Thevalidity of these dilution methods in measuring bodyfluid compartments is similar to that of other dilutionmethods [22].
Statistical methodsAll statistical analyses were performed using SPSS forWindows, version 6.1. All the variables studied areoften used in PBRRs since 'normality' holds true. Insome cases a log-transformation was applied to obtain amore normal distribution. Standard deviations (SD) arepresented in parentheses, unless indicated otherwise.Significance of changes in TBW and ECF was testedwith paired Kests. Serial laboratory tests of thedehydrated subjects were split into test resultsobtained in dehydrated and in euvolaemic state.Results obtained in a period in which no clear clinicalassessment could be made were excluded from theanalysis. All euvolaemic test results and the initialvalues of the dehydrated period were used in furtheranalysis.
The within-subject variability in the repeated labora-tory test results of the observations during euvolaemiawas expressed as the within-subject SD (SDW), pooledover all patients. Before calculating the within-subjectvariability, the precondition that SDW should not berelated to the magnitude of the measurement waschecked by calculating Kendall's test [24]. In variablesshowing proportionality of within-subject SDs, logtransformation was carried out (and proportionalitywas checked again afterwards) [25]. Subsequently,within-subject variability was calculated by usinganalysis of variance (ANOVA). The within-subjectvariability was expressed relative to the mean euvo-laemic level by presenting within-subject coefficientsof variation (CVW in %). Between-subject variabilitywas calculated using the mean-squares of the sameANOVA procedures in which the subjects were thesource of variation. Between-subject variability wasalso presented in coefficients of variation (CVB).
The ratio of within- and between-subject variability(CVW/CVB ) is called the index of individuality <J{) [26].A low I] means high individuality. If I, is <0.6, the PBRRwill be almost always insensitive to statisticallysignificant changes from an individual's own meanvalue [27]. As Ir increases above 0.6, the probabilitythat such a deviation will fall outside the PBRRincreases until for I[> 1.4; this probability is very high(/>>0.95) [27]. These criteria are based on theassumption that an individual's serial test results willshow a normal distribution. This assumption isgenerally satisfied for measurements such as plasmaurea, creatinine and urea concentrations and forhaematocrit where some sort of homeostatic control
exists [28]. Sensitivity and specificity of the laboratorytests in detecting dehydration were calculated applyingthe PBRR of our hospital [sodium, 137-144 mmol/1;urea, 3-0-7.0 mmol/1; creatinine, 60- 110/miol/l (male),50-90/imol/l (female); haematocrit, 0.39-0.511/1(male), 0.34-0.461/1 (female)].
For patients in whom an episode of dehydrationoccurred during hospitalization SSRRs were con-structed. SSRRs can be calculated based on a subject'smean value of the euvolaemic tests performed so farand the group's within-subject variability in euvolaemia.Adapting formulae developed by Fraser et al to thisstudy [13], SSRRs were calculated, when the upper andlower limits of the SSRR were required (for sodium), as:
mt ± 2 x SDw X ^[{k + l)fe],
and, when only the upper limits were required (forurea, creatinine, urea/creatinine ratio and haemato-crit), as:
mk + l.64xSDwxwhere k is the number of euvolaemic measurementson which the subject's mean, m>, was based.
The assumption of normality that underlies thisformula is usually satisfied in patients' serial biochemi-cal and haematological analyses [28]. These SSRRscould only be calculated realistically in subjects inwhom a period of euvolaemia preceded dehydration.
To be able to use all dehydration episodes in thecomparison of the selected analyses, responsivenessindexes (RIs) were calculated. An RI is the clinicallyrelevant change (A) relative to the SD of changesamong stable subjects
RI = A/V(2X MSE),
where MSE is the mean square error [16, 17].In this study, the differences between the first
observation (in the case of dehydration) and themean of a subject's observations (in the state ofeuvolaemia) were seen as the clinically relevantchanges. The sign test was used to determine whetherRIs were significantly >1, which means that theclinically relevant changes were larger than noiselevel in euvolaemia.
Results
Of the 53 subjects included in the study, 27 (51%) wereeuvolaemic during their stay. Of the 14 (26%) patientswho had had an episode of dehydration during thestudy period, 10 were dehydrated on admission andfour were euvolaemic on admission. Data for theremaining 12 overhydrated subjects were not analysed.
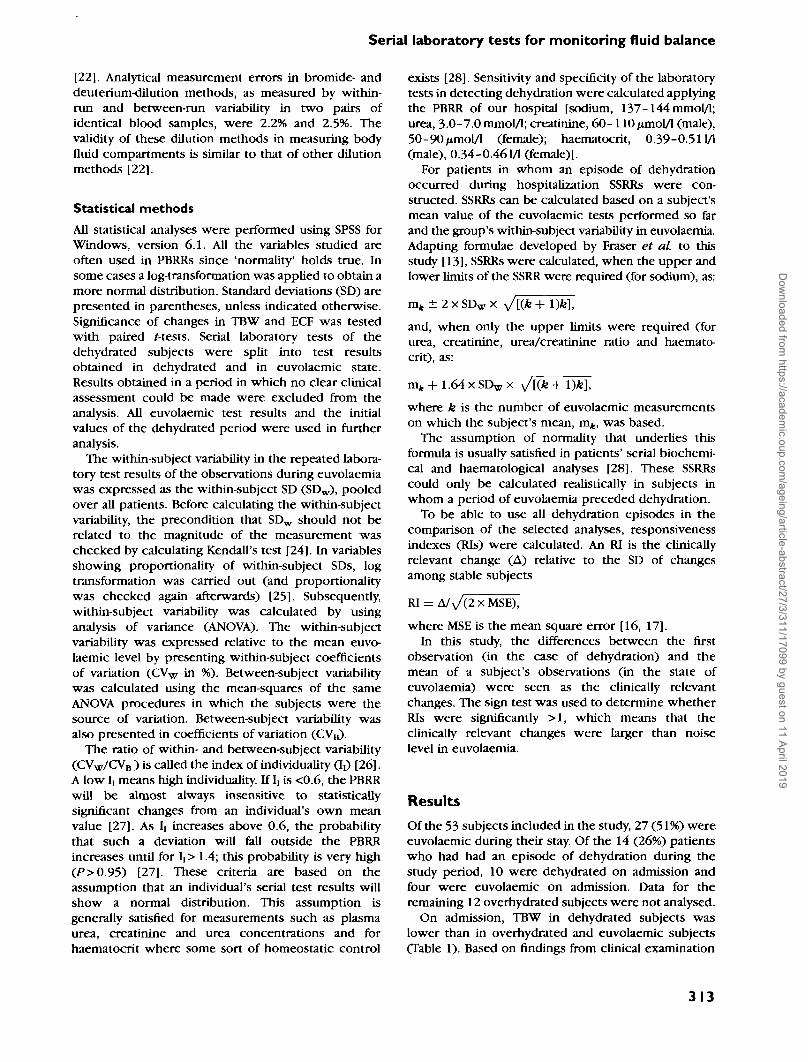
On admission, TBW in dehydrated subjects waslower than in overhydrated and euvolaemic subjects(Table 1). Based on findings from clinical examination
313
Dow
nloaded from https://academ
ic.oup.com/ageing/article-abstract/27/3/311/17099 by guest on 11 April 2019
M. G. M. Olde Rikkert et of.
Table I. Physical characteristics in means and standard deviations of euvolaeraic and dehydrated patients asmeasured at admission
No. of subjectsAge (years)Hospitalization (days)Height (cm)Weight (kg)Body mass index (kg/m2)Total body water (1)Extracellular fluid (I)
Mean value (and
Euvolaemic
Female
2078.4 (5.7)35 (30)
158(6)63.5 (9.8)'25.4 (5.2)a
32.9 C4.4f16.2 (2.7)
SD) by patient group
Male
778.7 (5.8)34 (19)
167 (6)64.8 (10.5)23.2 (3.5)37.0 (4.6)b
19.7 (1.7)
Dehydrated
Female
782.9(6.1)55 (39)
155 (5)52.2 (7.7)21.7(2.5)27.6(4.1)15.0 (4.0)
Male
780.9 (2.5)39(17)
169 (4)60.4 (8.9)21.1 (3.0)26.8 (4.3)18.0 (4.3)
Comparison of euvolaemic and dehydrated patients within each sex by Mests: *P < 0 01; bP < 0.001.
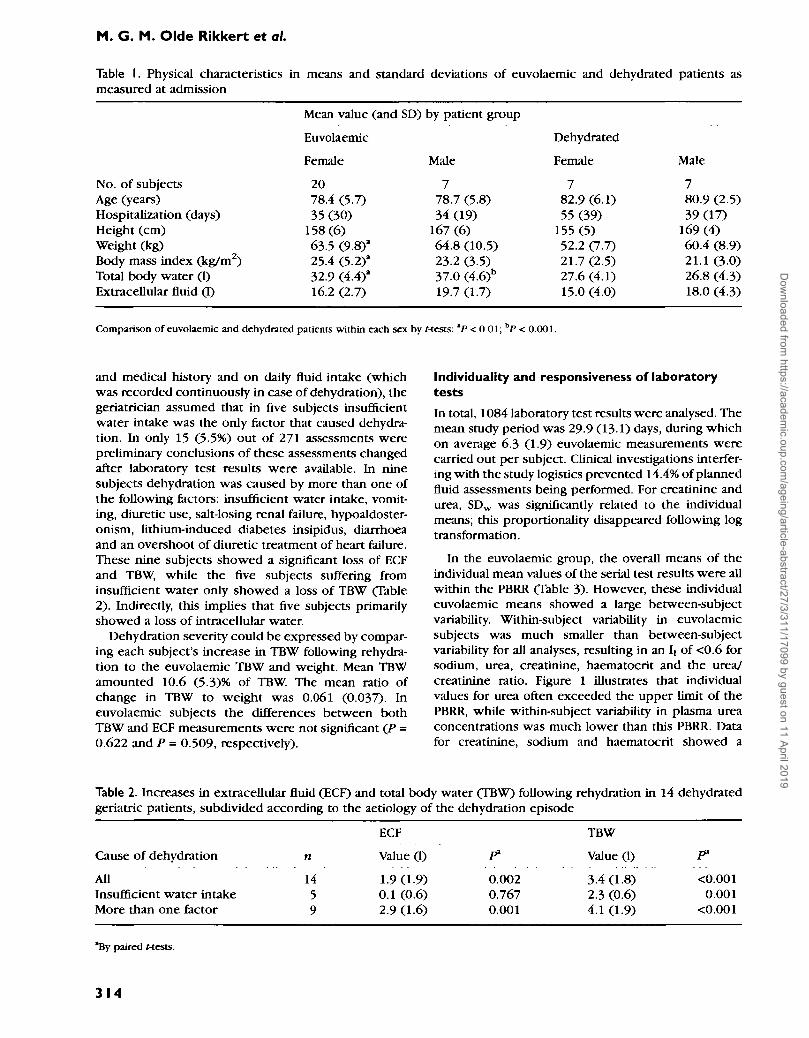
and medical history and on daily fluid intake (which•was recorded continuously in case of dehydration), thegeriatrician assumed that in five subjects insufficientwater intake was the only factor that caused dehydra-tion. In only 15 (5.5%) out of 271 assessments werepreliminary conclusions of these assessments changedafter laboratory test results were available. In ninesubjects dehydration was caused by more than one ofthe following factors: insufficient water intake, vomit-ing, diuretic use, salt-losing renal failure, hypoaldoster-onism, lithium-induced diabetes insipidus, diarrhoeaand an overshoot of diuretic treatment of heart failure.These nine subjects showed a significant loss of ECFand TBW, while the five subjects suffering frominsufficient water only showed a loss of TBW (Table2). Indirectly, this implies that five subjects primarilyshowed a loss of intracellular water.
Dehydration severity could be expressed by compar-ing each subject's increase in TBW following rehydra-tion to the euvolaemic TBW and weight. Mean TBWamounted 10.6 (5.3)% of TBW. The mean ratio ofchange in TBW to weight was 0.061 (0.037). Ineuvolaemic subjects the differences between bothTBW and ECF measurements were not significant (P -0.622 and P = 0.509, respectively).
Individuality and responsiveness of laboratorytests
In total, 1084 laboratory test results were analysed. Themean study period was 29.9 (13.1) days, during whichon average 6.3 (1.9) euvolaemic measurements werecarried out per subject. Clinical investigations interfer-ing with the study logistics prevented 14.4% of plannedfluid assessments being performed. For creatinine andurea, SDW was significantly related to the individualmeans; this proportionality disappeared following logtransformation.
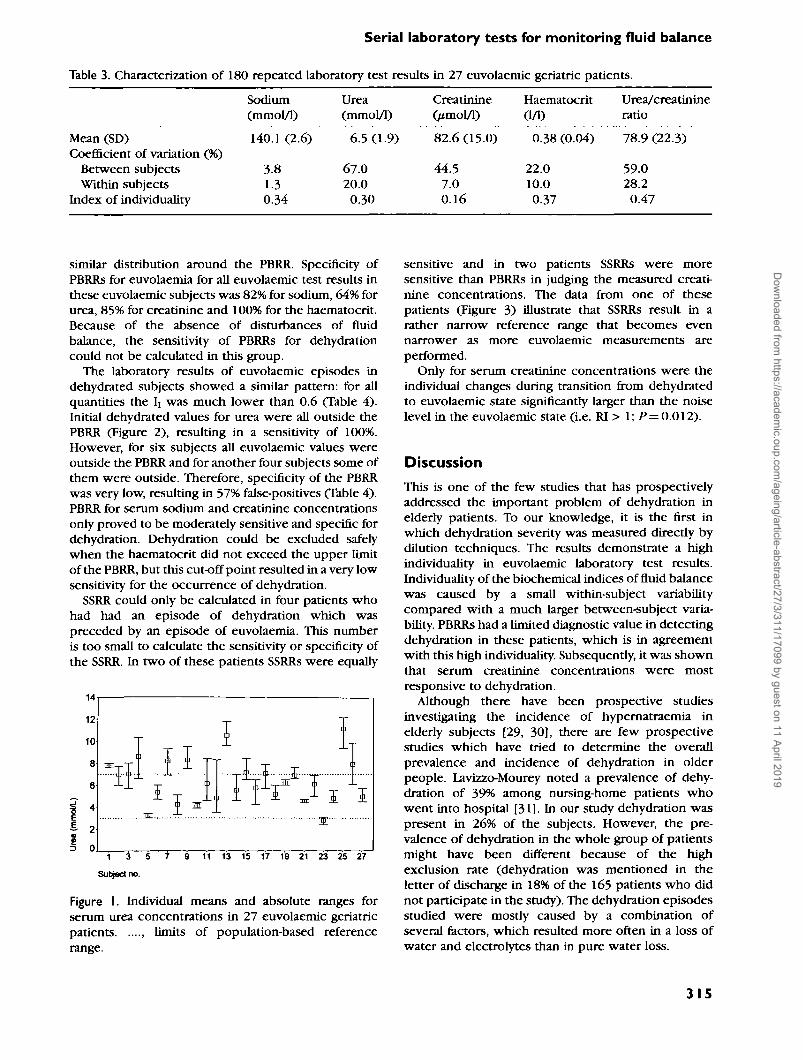
In the euvolaemic group, the overall means of theindividual mean values of the serial test results were allwithin the PBRR (Table 3). However, these individualeuvolaemic means showed a large between-subjectvariability. Within-subject variability in euvolaemicsubjects was much smaller than between-subjectvariability for all analyses, resulting in an Ii of <0.6 forsodium, urea, creatinine, haematocrit and the urea/creatinine ratio. Figure 1 illustrates that individualvalues for urea often exceeded the upper limit of thePBRR, while within-subject variability in plasma ureaconcentrations was much lower than this PBRR. Datafor creatinine, sodium and haematocrit showed a
Table 2. Increases in extracellular fluid (ECF) and total body water (TBW) following rehydration in 14 dehydratedgeriatric patients, subdivided according to the aetiology of the dehydration episode
Cause of dehydration
AllInsufficient water intakeMore than one factor
n
1459
ECF
Value (1)
1.9(19)0.1 (0.6)2.9(1.6)
0.0020.7670.001
TBW
Value (1)
3.4(1.8)2.3 (0.6)4.1 (1.9)
P1
<0.0010.001
<0.001
*By paired Mests.
314
Dow
nloaded from https://academ
ic.oup.com/ageing/article-abstract/27/3/311/17099 by guest on 11 April 2019
Serial laboratory tests for monitoring fluid balance
Table 3. Characterization of 180 repeated laboratory test results in 27 euvolaemic geriatric patients.
Mean (SD)Coefficient of variation (%)
Between subjectsWithin subjects
Index of individuality
Sodium(mmol/1)
140.1 (2.6)
3.81.30.34
Urea(mmol/1)
6.5 (1.9)
67.020.00.30
Creatinine(/imol/1)
82.6 (15.0)
44.57.00.16
Haematocrit(1/D
0.38 (0.04)
22.010.00.37
Urea/creatinineratio
78.9 (22.3)
59.028.20.47
similar distribution around the PBRR. Specificity ofPBRRs for euvolaemia for all euvolaemic test results inthese euvolaemic subjects was 82% for sodium, 64% forurea, 85% for creatinine and 100% for the haematocrit.Because of the absence of disturbances of fluidbalance, the sensitivity of PBRRs for dehydrationcould not be calculated in this group.
The laboratory results of euvolaemic episodes indehydrated subjects showed a similar pattern: for allquantities the lt was much lower than 0.6 (Table 4).Initial dehydrated values for urea were all outside thePBRR (Figure 2), resulting in a sensitivity of 100%.However, for six subjects all euvolaemic values wereoutside the PBRR and for another four subjects some ofthem were outside. Therefore, specificity of the PBRRwas very low, resulting in 57% false-positives (Table 4).PBRR for serum sodium and creatinine concentrationsonly proved to be moderately sensitive and specific fordehydration. Dehydration could be excluded safelywhen the haematocrit did not exceed the upper limitof the PBRR, but this cut-off point resulted in a very lowsensitivity for the occurrence of dehydration.
SSRR could only be calculated in four patients whohad had an episode of dehydration which waspreceded by an episode of euvolaemia. This numberis too small to calculate the sensitivity or specificity ofthe SSRR. In two of these patients SSRRs were equally
Figure I. Individual means and absolute ranges forserum urea concentrations in 27 euvolaemic geriatricpatients , limits of population-based referencerange.
sensitive and in two patients SSRRs were moresensitive than PBRRs in judging the measured creati-nine concentrations. The data from one of thesepatients (Figure 3) illustrate that SSRRs result in arather narrow reference range that becomes evennarrower as more euvolaemic measurements areperformed.
Only for serum creatinine concentrations were theindividual changes during transition from dehydratedto euvolaemic state significantly larger than the noiselevel in the euvolaemic state (i.e. RI > 1; P— 0.012).
Discussion
This is one of the few studies that has prospectivelyaddressed the important problem of dehydration inelderly patients. To our knowledge, it is the first inwhich dehydration severity was measured directly bydilution techniques. The results demonstrate a highindividuality in euvolaemic laboratory test results.Individuality of the biochemical indices of fluid balancewas caused by a small within-subject variabilitycompared with a much larger between-subject varia-bility. PBRRs had a limited diagnostic value in detectingdehydration in these patients, which is in agreementwith this high individuality. Subsequently, it was shownthat serum creatinine concentrations were mostresponsive to dehydration.
Although there have been prospective studiesinvestigating the incidence of hypernatraemia inelderly subjects [29, 30], there are few prospectivestudies -which have tried to determine the overallprevalence and incidence of dehydration in olderpeople. Lavizzo-Mourey noted a prevalence of dehy-dration of 39% among nursing-home patients whowent into hospital [31]. In our study dehydration waspresent in 26% of the subjects. However, the pre-valence of dehydration in the whole group of patientsmight have been different because of the highexclusion rate (dehydration was mentioned in theletter of discharge in 18% of the 165 patients who didnot participate in the study). The dehydration episodesstudied were mostly caused by a combination ofseveral factors, which resulted more often in a loss ofwater and electrolytes than in pure water loss.
315
Dow
nloaded from https://academ
ic.oup.com/ageing/article-abstract/27/3/311/17099 by guest on 11 April 2019

M. G. M. Olde Rikkert et al.
Table 4. Characteristics of 91 serial laboratory test results obtained in dehydrated and euvolaemic episodes of 14elderly patients
DehydrationMean3
RangeMean euvolaemia*Coefficient of variation (%)
Between subjectsWithin subjects
Index of individualityPopulation-based reference range
Sensitivity (%)Specificity (%)
Responsiveness index"
Sodium(nunol/1)
135.6 (8.4)118-148138.3 (4.1)
6.31.50.24
64680.98 (2.2)
Urea(mmol/1)
15.8(12.5)8.4-51.7
10.2 (9.6)
22314.00.06
100430.14 (0.1)
CreatinineOmol/1)
165.8 (137)89-609
116.7(119)
2465.00.02
57712.5 (2.0)
Haematocrit0/1)
0.41 (0.06)0.35-0.540.36 (0.05)
326.80.21
796
1.1 (0.7)
Urea/creatinineratio
95.5 (15.9)61.4-121.589.0 (28.4)
71.613.20.18
b
b
0.13 (0.73)
"Standard deviation in parentheses.""Not available.
The ratio of TBW to weight in the 27 euvolaemicgeriatric patients was 0.52 for women and 0.57 formen. This is in agreement with the general decline ofTBW with age. Euvolaemic ECF was 49% of TBW forwomen and 53% of TBW for men, which is williin thewide range of 43-52% reported for the ECF/TBW ratioin elderly subjects [22, 32-35]. The wide publishedrange for these ratios can be explained by largedifferences in the techniques used in assessing bodycomposition. The clinical assessment of fluid balancewas confirmed by the considerable increase in TBW(+11%) in the dehydrated patients after rehydrationtherapy and the very small changes in TBW and ECF inthe euvolaemic patients.
28 29 30 31 32 33 34 35 38 37 38 39 40 41
Figure 2. Initial urea concentrations of dehydrationepisodes (*) and individual means and absolute rangesof urea concentrations of euvolaemic episodes in 14geriatric patients , upper limit of population-basedreference range.
Within-subject variability in euvolaemiaWithin-subject variability in euvolaemic test results ofall laboratory quantities was comparable to resultsobtained in other studies. Fraser and co-workersmeasured a similar CVW in 27 healthy subjects aged70-83 years (sodium, 1.1%; urea, 10.6%; creatinine,5.1%; haematocrit, 2.8%) [14, 15] and demonstratedthat age had no effect on the within-subject variabilityin these quantities. This implies that euvolaemicwithin-subject variability of these analyses in geriatricpatients is not widened by age or comorbidity.
Based on measurements of the analytical variability
1 i iMeauirement no.
Figure 3. Serial creatinine concentrations from patientno. 30 (a 78-year-old man). —, patient's meaneuvolaemic creatinine concentration; - -, patient'supper limit of subject-specific reference range; ....,upper limit of population-based reference range; • ,creatinine concentrations in euvolaemia; • Dehydra-tion, initial creatinine concentration in dehydratedepisode.
316
Dow
nloaded from https://academ
ic.oup.com/ageing/article-abstract/27/3/311/17099 by guest on 11 April 2019

Serial laboratory tests for monitoring fluid balance
at all ages and estimations of the biological within-subject variability, the Central Clinical ChemistryLaboratory of the University Hospital Nijmegen calcu-lated within-subject variability for the most frequentlydetermined analyses. These non-age specific referencevalues of within-subject coefficients of variation forlonger than 1 week are 1.0, 12.3, 158 and 4.2% forsodium, urea, creatinine and haematocrit, respectively.These figures are close to the within-subject variabil-ities found in this study, except for the even lowerwithin-subject variability in creatinine in geriatricpatients. Therefore, homeostatic properties of geriatricpatients do not seem to be compromised on the basisof these laboratory analyses, provided that dataobtained during episodes in which fluid balance wasdisturbed are excluded.
In our data, CVW for sodium was smallest, whichmay be explained by the endocrine system maintainingthe sodium level within strict ranges around theindividual set point. CVW values for haematocrit andcreatinine were also small, probably because haemato-logical parameters are also subject to homeostaticcontrol mechanisms and the daily creatinine produc-tion is relatively constant. However, daily urea forma-tion is highly dependent on the same day's diet andmuscle catabolism [10, 36]. The latter may beincreased by fever, corticosteroid therapy or muscledamage. Moreover, the presence of blood in thegastrointestinal tract raises the serum urea level, asdo glomerular diseases and dehydration. This explainsthe large within-subject variability found in serum ureaconcentrations and the urea/creatinine ratio.
Individuality and responsivenessIn general, most quantities in clinical chemistry havemarked individuality, and serial values for an individualspan only part of the PBRR [27, 37]. Even in chronicrenal failure within-subject variability in 15 biochemi-cal analyses was much smaller than between-subjectvariability [38]. The individuality for sodium, urea,creatinine and haematocrit in hospitali2ed geriatricpatients found in this study was even more pro-nounced than that described for healthy elderlysubjects [14, 15]. This was caused by a much largerbetween-subject variability in geriatric patients, whichcan be explained by the high prevalence of multiplediseases that influences baseline values characteristicof the internal milieu in this population.
The disappointing diagnostic characteristics ofPBRRs in this study are in agreement with the limitedvalue of these reference ranges predicted by the lowindexes of individuality. However, the alternative —calculating SSRRs—could only be performed in a fewsubjects. More research is needed to compare thediagnostic properties of SSRRs and PBRRs and toquantify the clinical implications and cost-effectivenessof medical decision-making based on these different
types of reference ranges. PBRRs will remain necessaryin the initial assessment of the fluid balance of newpatients. However, their sensitivity and specificity maybe improved by using reference populations consistingof elderly subjects. This may result in raising the upperlimits of reference ranges for creatinine and urea andlowering the lower limit for serum sodium concentra-tion [7]. In their prospective study on blood urea levelsin the elderly, Bowker et al reported a PBRR of 1.4-13.2mmol/l, which is considerably wider than therange applied in this study (3-0-7.0mmol/1) [10].
Serum creatinine concentrations were most respon-sive to the development of dehydration. Serum sodiumand urea concentrations and urea/creatinine ratios hada very low responsiveness in monitoring fluid balance.This questions the widespread use of sodium and ureaconcentrations and urea/creatinine ratio as indicatorsof dehydration in elderly subjects.
Limitations of this studySome caution in interpreting these results is neededbecause clinical diagnoses were not blinded forpatients' laboratory test results, but were partly basedon these data. However, more important in clinicalassessment was the fact that conclusions about fluidbalance could be changed after having monitored theeffects of rehydration therapy on the patients' weightsand symptoms. Serial examinations in the same patient,as used here, are probably more valid in assessingdehydration than a single examination [20].
It may be argued that the external validity of thisstudy is limited, because only 24% of all patientsadmitted in the 16 month period were included.However, subjects were excluded primarily becauseof the restrictions in subject selection dictated by theethical guidelines for non-therapeutic research. Conse-quently, the presence of moderate or severe dementiawas the main reason for exclusion.
We do not know whether the exclusion of this groupof subjects had any effect on our results but have foundno clear evidence that the external validity of the studywas jeopardized by the high exclusion rate. Gross et al.did not discuss the possible effects of dementia ondiagnosing dehydration, although nearly three-quartersof their sample had reduced mental capacity [3].O'Neill et al. did not find a relationship betweenmental status and osmolality in elderly female patientsin continuing care [8] and we found only one smallstudy (n = 18) suggesting that serum osmolality couldbe more responsive to dehydration in patients sufferingfrom Alzheimer's disease [39].
Finally, responsiveness to minimal relevant changesin fluid balance could not be determined in all patients,although this procedure has been recommended byGuyatt [16]. Instead we calculated responsiveness indetecting a loss of 11% of TBW: this relatively largechange may well be the minimally detectable change
317
Dow
nloaded from https://academ
ic.oup.com/ageing/article-abstract/27/3/311/17099 by guest on 11 April 2019

M. G. M. Olde Rikkert et al.
and reflect the difficult clinical assessment of fluidbalance in elderly subjects.
Conclusions
We have confirmed that laboratory indices of dehydra-tion in hospitalized geriatric patients are, like those ofnursing-home patients [12], highly variable betweensubjects but stable over time within subjects. Thisstudy also introduced the concepts of individuality,responsiveness and reference ranges that are subject-specific. Because of the high individuality in thelaboratory analyses studied, it may be profitable tocalculate SSRR •when repeated laboratory tests areavailable. Within-subject variability in elderly patientsis probably no different from within-subject variabilityin other populations. Therefore, the within-subjectvariability measures of elderly subjects available fromthe literature or variability measures of youngerpopulations measured by the local clinical chemistrylaboratory may be used in calculating SSRR.
Dehydration can be diagnosed best by applyingreference ranges for serial serum creatinine concentra-tions that are age- and, if possible, subject-specific andby repeatedly examining and weighing patients.
Key points• Population-based reference ranges of biochemical
indices of dehydration are of limited value inmonitoring fluid balance in elderly patients.
• Monitoring individual patients for the developmentof dehydration should be based on repeatedmeasurements of serum creatinine concentrationand weight, combined with physical examination.
AcknowledgementsWe would like to thank F. J. M. Schouten of theDepartment of Human Nutrition, Wageningen Agricul-tural University, for measuring the plasma concentra-tions of deuterium and bromide. We also thank the staffof the department of geriatric medicine of theUniversity Hospital of Nijmegen for their help withthis study. This work was supported by The Nether-lands Programme for Research on Aging, NESTOR,funded by the Ministry of Education, Culture andSciences and the Ministry of Health, Welfare andSports.
References1. Shuster S, Black MM, McVitie E. Influence of age and sexon skin thickness, skin collagen and density. Br J Dermatol1975; 93: 639-43.
2. Lipsitz L. Orthostatic hypotension in the elderly. N Engl JMed 1989; 321: 952-7.
3. Gross CR, Iindquist RD, WooUey AC, Granieri R, Allard K,Webster B. Clinical indicators of dehydration severity inelderly patients. J Emerg Med 1992; 10: 267-74.
4. Eaton D, Bannister P, Mulley GP, Connolly MJ. Axillarysweating in clinical assessment of dehydration in ill elderlypatients. Br Med J 1994; 308: 1271.
5. Verspijck PH, Maathuis R. Uremia by dehydration. [InDutch]. Ned Tijdschr Geneeskd 1933; 77: 2016-24.
6. Rijn HJM van, Hene RJ, Struyvenberg A. An end to routineurea determinations. [In Dutch]. Ned Tijdschr Geneeskd1990; 134: 1177-9.
7. Faulkner WR, Meites S eds. Geriatric Clinical Chemistry:reference values. Washington: AACC Press, 1993-
8. O'Neill PA, Davies I, Wears R, Barrett JA. Elderly femalepatients in continuing care: why are they hyperosmolar?Gerontology 1989; 35: 205-9.
9. lindeman RD, Tobin J, Shock NW. Longitudinal studies onthe rate of decline in renal function with age. J Am Geriatr Soc1985; 43: 278-85.
10. Bowker LK, Briggs RSJ, Gallagher PJ, Roberson RC.Raised blood urea in the elderly: a clinical and pathologicalstudy. Postgrad Med 1992; 68: 174-9.
11. Rowe JW, Andres R, Tobin JD, Norris AH, Shock NW. Theeffect of age on creatinine clearance in men: a cross-sectionaland longitudinal study. J Gerontol 1976; 31: 155-63.
12. Weinberg AD, Pals JK, Mclinchey-Berroth R, Minaker KL.Indices of dehydration among frail nursing home patients:highly variable but stable over time. J Am Geriatr Soc 1994;42: 1070-3.
13- Fraser CG. Age-related changes in laboratory test results.Drugs Aging 1993; 3: 246-57.
14. Fraser CG, Wilkinson FAACB, Neville RG, Knox JDE, KingJF, MacWalter RS. Biological variation of common hematolo-gic laboratory quantities in the elderly. Am J Clin Pathol 1989;92: 465-70. \
15. Fraser CG, Cummings ST, Wilkinson SP et al Biologicalvariability of 26 clinical chemistry analytes in elderly people.Clin Chem 1989; 35: 783-6.
16. Guyatt G, Walter S, Norman G. Measuring change overtime: assessing usefulness of evaluative instruments. J ChronDis 1987; 40: 171-8.
17. Deyo RA, Diehr P, Patrick DL Reproducibility andresponsiveness of health status measures. Controlled ClinTrial 1991; 12: 142S-58S.
18. Berg L. Clinical dementia rating. Psychopharmacol Bull1988; 24: 637-9.
19. Carlson KJ, Lee DCS, Goroll AH, Leahy M, Johnson RA.An analysis of physicians' reasons for prescribing long-term digitalis therapy in outpatients. J Chron Dis 1985; 9:733-9.
20. Chung H-M, Kluge R, Schrier RW, Anderson RJ. Clinicalassessment of extracellular fluid volume in hyponatremia. AmJ Med 1987; 83: 905-8.
21. Lukaski HC, Johnson PE. A simple inexpensive methodof determining total body water using a tracer dose of D2O
318
Dow
nloaded from https://academ
ic.oup.com/ageing/article-abstract/27/3/311/17099 by guest on 11 April 2019

Serial laboratory tests for monitoring fluid balance
and infrared absorption of biological fluids. Am J Clin Nutr1985; 41: 63-70.
22. Forbes GB. Human Body Composition. London: Springer-Verlag, 1987.
23. Miller ME, Cappon CJ. Anion exchange chromatographicdetermination of bromide in serum. Clin Chem 1984; 30:781-3.
24. Bland JM, Altaian DG. Measurement error. BrMedJ 1996;312: 1654.
25. Bland JM, Altaian DG. Measurement error proportionalto the mean. Br Med J 1996; 313: 106.
26. Fraser CG, Harris EK. Generation and application of dataon biological variation in clinical chemistry. Crit Rev Clin LabSci 1989; 27: 409-37.
27. Williams GZ, Widdowson GH, Penton J. Individualcharacter of variation in time-series studies of healthypeople n. Differences in values for clinical chemical analytesin serum among demographic groups, by age and sex. ClinChem 1978; 24: 313-20.
28. Harris EK, Cooil BK, Shakarji G, Williams, GZ. On the useof statistical models of within-person variation in long-termstudies of healthy individuals. Clin Chem 1980; 26: 383-91.
29. Himmelstein DU, Jones AA, Woolhandler S. Hyper-natremic dehydration in nursing home patients: an indicatorof neglect. J Am Geriatr Soc 1983; 31: 466-71.
30. Snyder NA, Feigal DW, Arieff AI. Hypernatremia in elderlypatients: a heterogeneous, morbid and iatrogenic entity. AnnInt Med 1987; 107: 309-19.
31. Lavizzo-Mourey R, Johnson J, Stolley P Risk factors for Received 14 May 1997
dehydration among elderly nursing home residents. J AmGeriatr Soc 1988; 36: 213-8.
32. Visser M, Deurenberg P, van Staveren WA. Multi-frequency bioelectrical impedance for assessing total bodywater and extracellular water in elderly subjects. Eur J ClinNutr 1995; 49: 256-66.
33. Steen B, Isaksson B, Svanborg A. Body composition at 70and 75 years of age. A longitudinal population study. J ClinExp Gerontol 1979; 1: 185-200.
34. Baumgartner RN, Stauber PM, McHugh D, Koechler KM,Garry PJ. Cross-sectional age differences in body compositionin persons 60+ years of age. J Gerontol 1995; 50: M307-16.
35- Yasumura S, Conn SH, Ellis KJ. Measurement of extra-cellullar space by total body neutron activation. Am J Physiol1983; 244: R36-4O.
36. Dossetor JB. Creatininemia versus uremia. Ann Int Med1966; 65: 1287-99.
37. Harris EK, Cooll BK, Shakarji G, Williams GZ. On the useof statistical models of within-person variation in long-term studies of healthy individuals. Clin Chem 1980; 26:383-91.
38. Holzel WGE. Intra-individual variation of some analytesin serum of patients with chronic renal failure. CUn Chem1987; 33: 670-3.
39- Albert SG, Nakra BRS, Grossberg GT, Caminal, ER.Vasopressin response to dehydration in Alzheimer's disease.J Am Geriatr Soc 1989; 37: 843-7.
319
Dow
nloaded from https://academ
ic.oup.com/ageing/article-abstract/27/3/311/17099 by guest on 11 April 2019

Sam Tanner.
Dow
nloaded from https://academ
ic.oup.com/ageing/article-abstract/27/3/311/17099 by guest on 11 April 2019