Embed Size (px)
Citation preview
INDO COUNT INDUSTRIES LIMITED
The Global Bed Linen CompanyQ2 FY2016
SAFE HARBOR STATEMENT
THIS PRESENTATION AND THE ACCOMPANYING SLIDES (THE “PRESENTATION”), WHICH HAVE BEEN PREPARED BY INDO COUNT INDUSTRIES LTD (THE “COMPANY”), HAVE BEEN PREPARED SOLELY FOR INFORMATION PURPOSES AND
DO NOT CONSTITUTE ANY OFFER, RECOMMENDATION OR INVITATION TO PURCHASE OR SUBSCRIBE FOR ANY SECURITIES, AND SHALL NOT FORM THE BASIS OR BE RELIED ON IN CONNECTION WITH ANY CONTRACT OR BINDING COMMITMENT WHATSOEVER. NO OFFERING OF SECURITIES OF THE COMPANY WILL BE MADE EXCEPT BY MEANS OF A
STATUTORY OFFERING DOCUMENT CONTAINING DETAILED INFORMATION ABOUT THE COMPANY.
THIS PRESENTATION HAS BEEN PREPARED BY THE COMPANY BASED ON INFORMATION AND DATA WHICH THE COMPANY CONSIDERS RELIABLE, BUT THE COMPANY MAKES NO REPRESENTATION OR WARRANTY, EXPRESS OR
IMPLIED, WHATSOEVER, AND NO RELIANCE SHALL BE PLACED ON, THE TRUTH, ACCURACY, COMPLETENESS, FAIRNESS AND REASONABLENESS OF THE CONTENTS OF THIS PRESENTATION. THIS PRESENTATION MAY NOT BE ALL INCLUSIVE AND MAY NOT CONTAIN ALL OF THE INFORMATION THAT YOU MAY CONSIDER MATERIAL. ANY LIABILITY IN RESPECT
OF THE CONTENTS OF, OR ANY OMISSION FROM, THIS PRESENTATION IS EXPRESSLY EXCLUDED.OF THE CONTENTS OF, OR ANY OMISSION FROM, THIS PRESENTATION IS EXPRESSLY EXCLUDED.
CERTAIN MATTERS DISCUSSED IN THIS PRESENTATION MAY CONTAIN STATEMENTS REGARDING THE COMPANY’S MARKET OPPORTUNITY AND BUSINESS PROSPECTS THAT ARE INDIVIDUALLY AND COLLECTIVELY FORWARD-LOOKING STATEMENTS. SUCH FORWARD-LOOKING STATEMENTS ARE NOT GUARANTEES OF FUTURE PERFORMANCE AND ARE SUBJECT TO KNOWN AND UNKNOWN RISKS, UNCERTAINTIES AND ASSUMPTIONS THAT ARE DIFFICULT TO PREDICT.
THESE RISKS AND UNCERTAINTIES INCLUDE, BUT ARE NOT LIMITED TO, THE PERFORMANCE OF THE INDIAN ECONOMY AND OF THE ECONOMIES OF VARIOUS INTERNATIONAL MARKETS, THE PERFORMANCE OF THE TIRE
INDUSTRY IN INDIA AND WORLD-WIDE, COMPETITION, THE COMPANY’S ABILITY TO SUCCESSFULLY IMPLEMENT ITS STRATEGY, THE COMPANY’S FUTURE LEVELS OF GROWTH AND EXPANSION, TECHNOLOGICAL IMPLEMENTATION, CHANGES AND ADVANCEMENTS, CHANGES IN REVENUE, INCOME OR CASH FLOWS, THE COMPANY’S MARKET
PREFERENCES AND ITS EXPOSURE TO MARKET RISKS, AS WELL AS OTHER RISKS. THE COMPANY’S ACTUAL RESULTS, LEVELS OF ACTIVITY, PERFORMANCE OR ACHIEVEMENTS COULD DIFFER MATERIALLY AND ADVERSELY FROM
RESULTS EXPRESSED IN OR IMPLIED BY THIS PRESENTATION. THE COMPANY ASSUMES NO OBLIGATION TO UPDATE ANY FORWARD-LOOKING INFORMATION CONTAINED IN THIS PRESENTATION. ANY FORWARD-LOOKING STATEMENTS AND PROJECTIONS MADE BY THIRD PARTIES INCLUDED IN THIS PRESENTATION ARE NOT ADOPTED BY THE COMPANY
AND THE COMPANY IS NOT RESPONSIBLE FOR SUCH THIRD PARTY STATEMENTS AND PROJECTIONS.
2
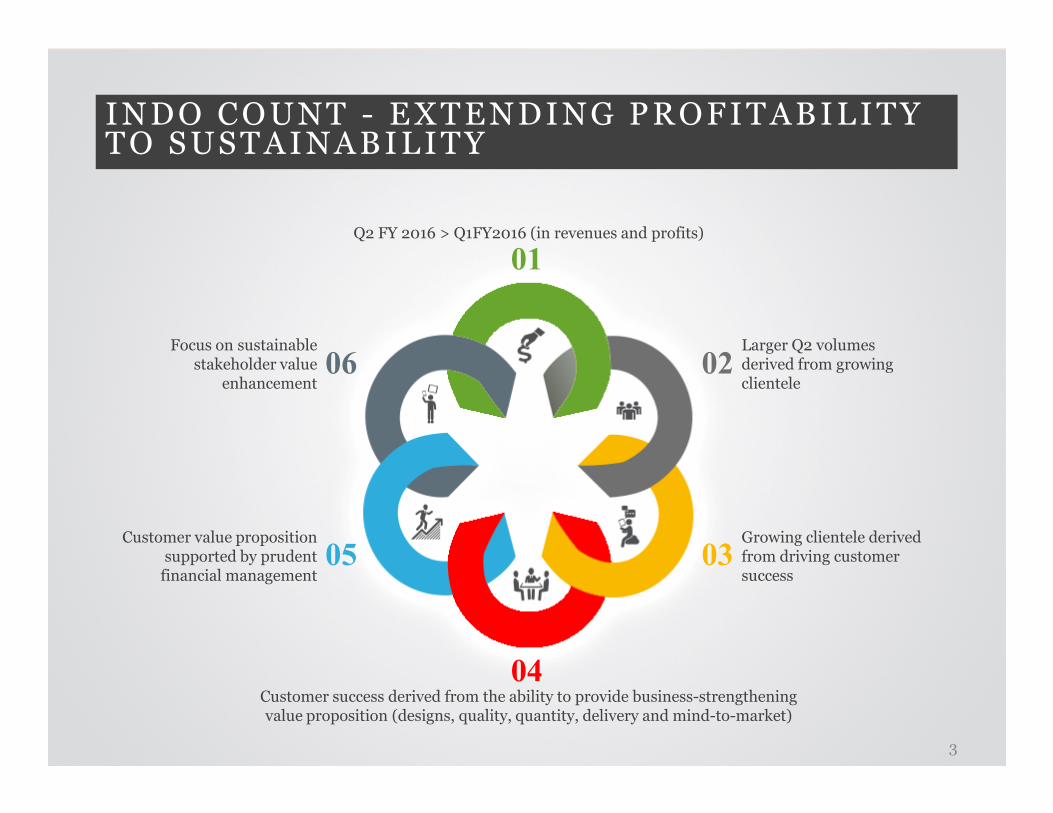
INDO COUNT - EXTENDING PROFITABILITY TO SUSTAINABILITY
01
0206
Q2 FY 2016 > Q1FY2016 (in revenues and profits)
Larger Q2 volumes derived from growing clientele
Focus on sustainable stakeholder value
enhancement
04
0305Growing clientele derived from driving customer success
Customer success derived from the ability to provide business-strengthening value proposition (designs, quality, quantity, delivery and mind-to-market)
Customer value proposition supported by prudent financial management
3

FINANCIAL PERFORMANCEFOR Q2, FY2016
P A R T 1 : O V E R V I E W
REVENUES (RS / CR)
Q2FY2016 Q2FY2015%
GROWTH
582.13 478.83 21.6
EBITDA(RS / CR)
Q2FY2016 Q2FY2015 % GROWTH
124.44 79.87 55.8
TAX(RS / CR)
Q2FY2016 Q2FY2015%
GROWTH
38.66 15.80 144.7
PAT(RS / CR)
Q2FY2016 Q2FY2015%
GROWTH
65.95 42.50 55.2
01
02
06
07
FINANCE CHARGES(RS / CR)
Q2FY2016 Q2FY2015%
GROWTH
15.50 17.91 (13.5)
DEPR(RS / CR)
Q2FY2016 Q2FY2015%
GROWTH
4.35 3.66 19.0
PBT(RS / CR)
Q2FY2016 Q2FY2015%
GROWTH
104.61 58.29 79.5
EPS(RS / SHARE)
Q2FY2016 Q2FY2015%
GROWTH
16.70 11.62 43.7
EBIDTA MARGIN %
Q2FY2016 Q2FY2015BPS
GROWTH
21.4 16.7 470
NETDEBT/EBIDTA**ANNUALISED
Q2FY2016 Q2FY2015%
GROWTH
0.44 0.84 (47.6)
03
04
05
08
09
10
4
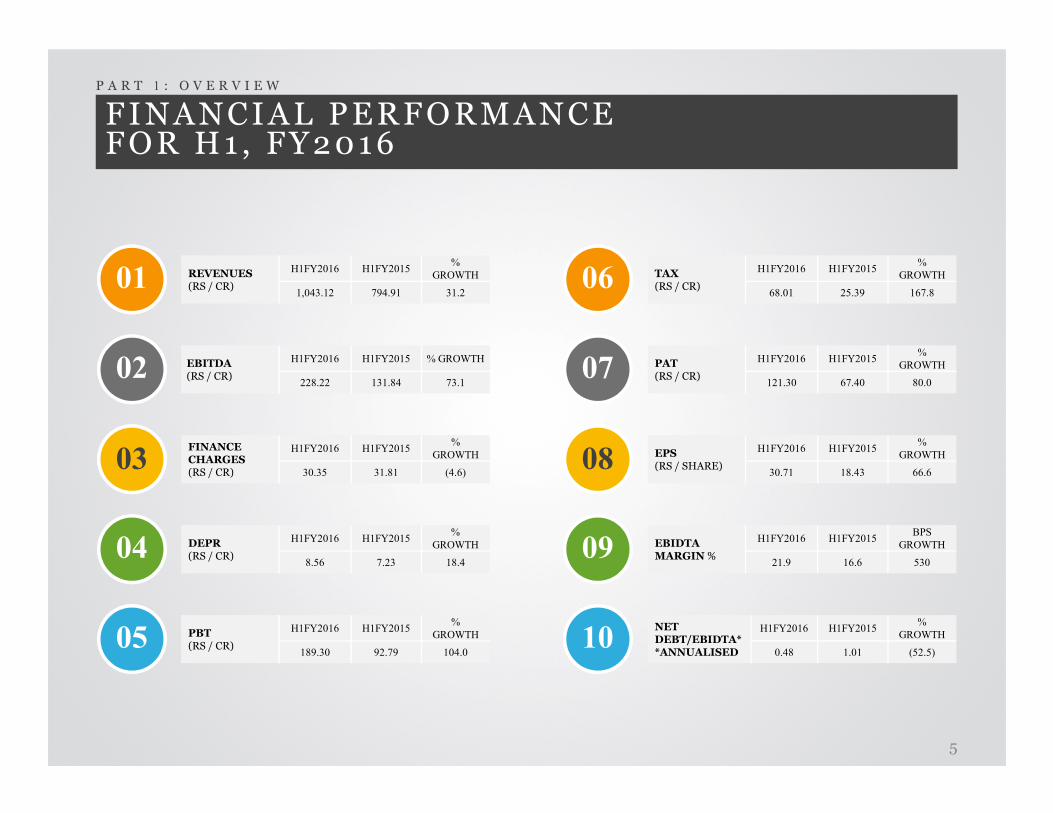
FINANCIAL PERFORMANCEFOR H1 , FY2016
P A R T 1 : O V E R V I E W
REVENUES (RS / CR)
H1FY2016 H1FY2015%
GROWTH
1,043.12 794.91 31.2
EBITDA(RS / CR)
H1FY2016 H1FY2015 % GROWTH
228.22 131.84 73.1
TAX(RS / CR)
H1FY2016 H1FY2015%
GROWTH
68.01 25.39 167.8
PAT(RS / CR)
H1FY2016 H1FY2015%
GROWTH
121.30 67.40 80.0
01
02
06
07
FINANCE CHARGES(RS / CR)
H1FY2016 H1FY2015%
GROWTH
30.35 31.81 (4.6)
DEPR(RS / CR)
H1FY2016 H1FY2015%
GROWTH
8.56 7.23 18.4
PBT(RS / CR)
H1FY2016 H1FY2015%
GROWTH
189.30 92.79 104.0
EPS(RS / SHARE)
H1FY2016 H1FY2015%
GROWTH
30.71 18.43 66.6
EBIDTA MARGIN %
H1FY2016 H1FY2015BPS
GROWTH
21.9 16.6 530
NETDEBT/EBIDTA**ANNUALISED
H1FY2016 H1FY2015%
GROWTH
0.48 1.01 (52.5)
03
04
05
08
09
10
5
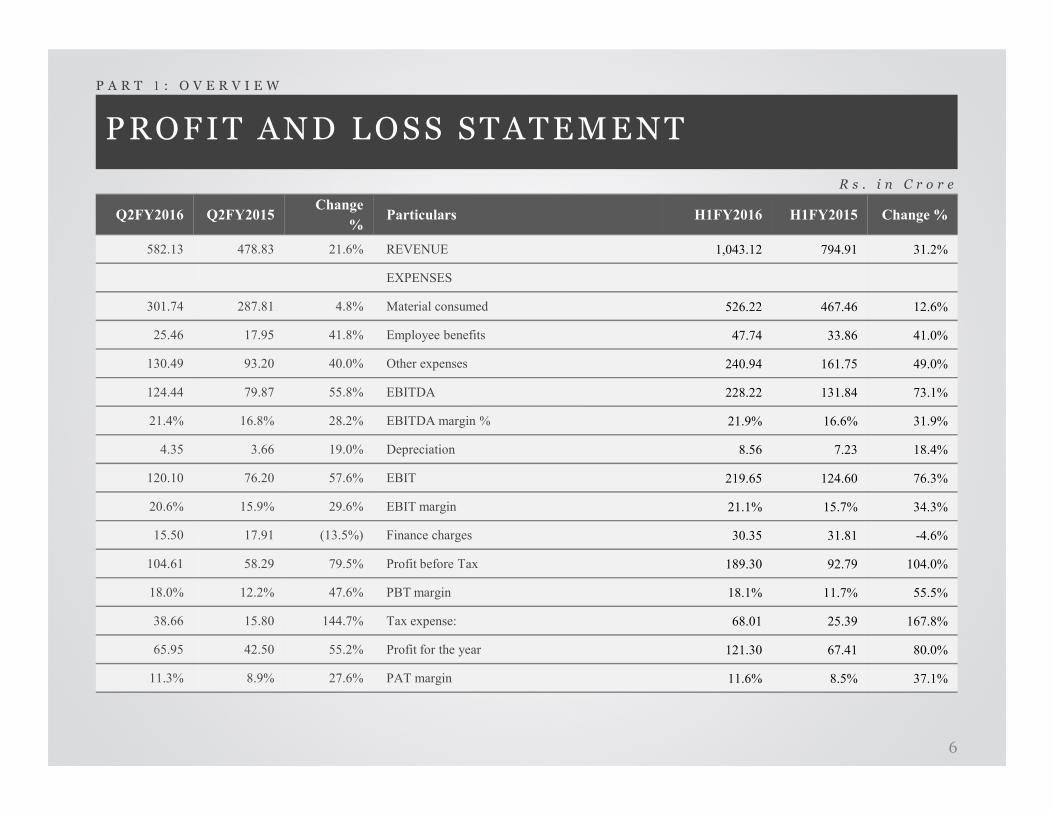
PROFIT AND LOSS STATEMENT
P A R T 1 : O V E R V I E W
R s . i n C r o r e
Q2FY2016 Q2FY2015Change
%Particulars H1FY2016 H1FY2015 Change %
582.13 478.83 21.6% REVENUE 1,043.12 794.91 31.2%
EXPENSES
301.74 287.81 4.8% Material consumed 526.22 467.46 12.6%
25.46 17.95 41.8% Employee benefits 47.74 33.86 41.0%
130.49 93.20 40.0% Other expenses 240.94 161.75 49.0%
124.44 79.87 55.8% EBITDA 228.22 131.84 73.1%
6
21.4% 16.8% 28.2% EBITDA margin % 21.9% 16.6% 31.9%
4.35 3.66 19.0% Depreciation 8.56 7.23 18.4%
120.10 76.20 57.6% EBIT 219.65 124.60 76.3%
20.6% 15.9% 29.6% EBIT margin 21.1% 15.7% 34.3%
15.50 17.91 (13.5%) Finance charges 30.35 31.81 -4.6%
104.61 58.29 79.5% Profit before Tax 189.30 92.79 104.0%
18.0% 12.2% 47.6% PBT margin 18.1% 11.7% 55.5%
38.66 15.80 144.7% Tax expense: 68.01 25.39 167.8%
65.95 42.50 55.2% Profit for the year 121.30 67.41 80.0%
11.3% 8.9% 27.6% PAT margin 11.6% 8.5% 37.1%
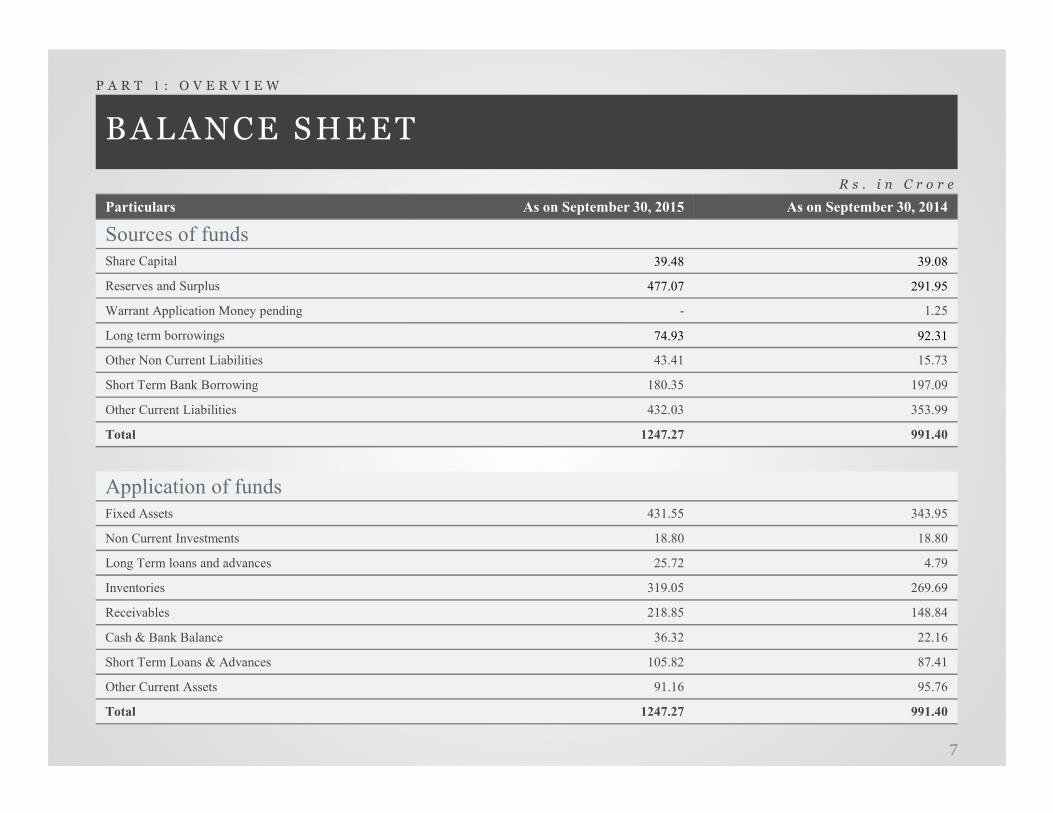
BALANCE SHEET
P A R T 1 : O V E R V I E W
R s . i n C r o r e
Particulars As on September 30, 2015 As on September 30, 2014
Sources of funds
Share Capital 39.48 39.08
Reserves and Surplus 477.07 291.95
Warrant Application Money pending - 1.25
Long term borrowings 74.93 92.31
Other Non Current Liabilities 43.41 15.73
Short Term Bank Borrowing 180.35 197.09
Other Current Liabilities 432.03 353.99
7
Other Current Liabilities 432.03 353.99
Total 1247.27 991.40
Application of funds
Fixed Assets 431.55 343.95
Non Current Investments 18.80 18.80
Long Term loans and advances 25.72 4.79
Inventories 319.05 269.69
Receivables 218.85 148.84
Cash & Bank Balance 36.32 22.16
Short Term Loans & Advances 105.82 87.41
Other Current Assets 91.16 95.76
Total 1247.27 991.40
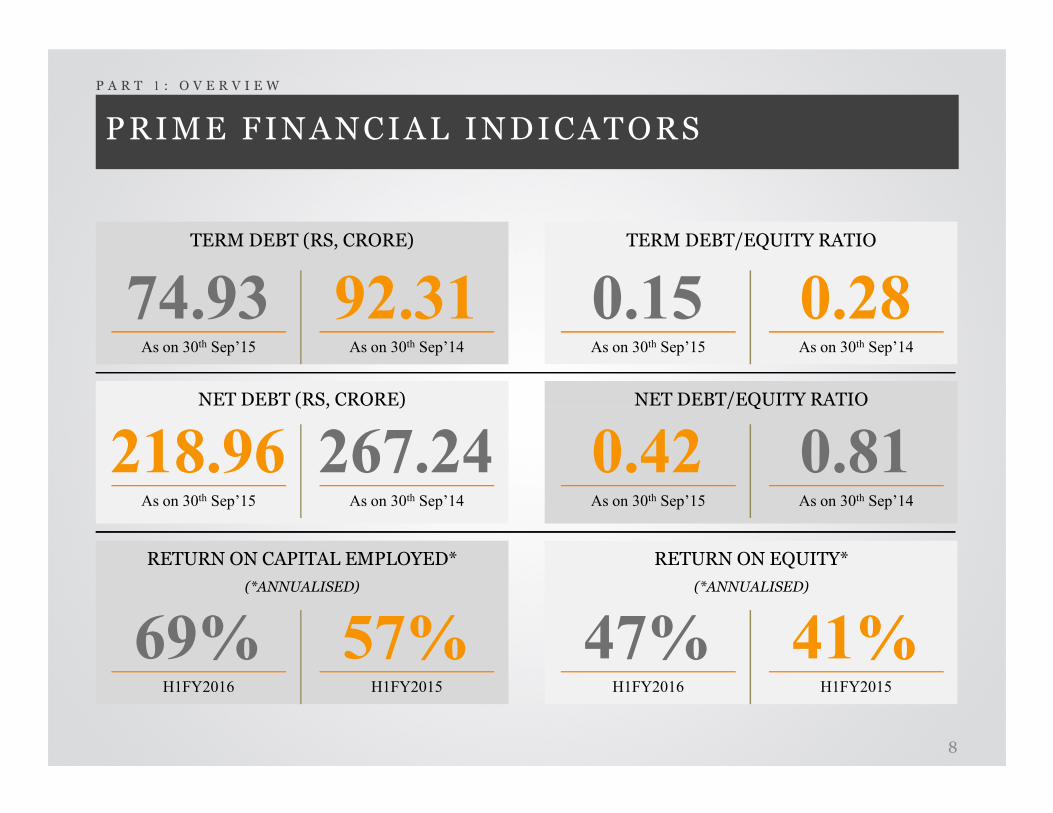
PRIME FINANCIAL INDICATORS
TERM DEBT (RS, CRORE)
As on 30th Sep’15
74.93As on 30th Sep’14
92.31
TERM DEBT/EQUITY RATIO
As on 30th Sep’15
0.15As on 30th Sep’14
0.28
NET DEBT (RS, CRORE) NET DEBT/EQUITY RATIO
P A R T 1 : O V E R V I E W
NET DEBT (RS, CRORE)
As on 30th Sep’15
218.96As on 30th Sep’14
267.24NET DEBT/EQUITY RATIO
As on 30th Sep’15
0.42As on 30th Sep’14
0.81
RETURN ON CAPITAL EMPLOYED*
(*ANNUALISED)
H1FY2016
69%H1FY2015
57%
RETURN ON EQUITY*
(*ANNUALISED)
H1FY2016
47%H1FY2015
41%
8
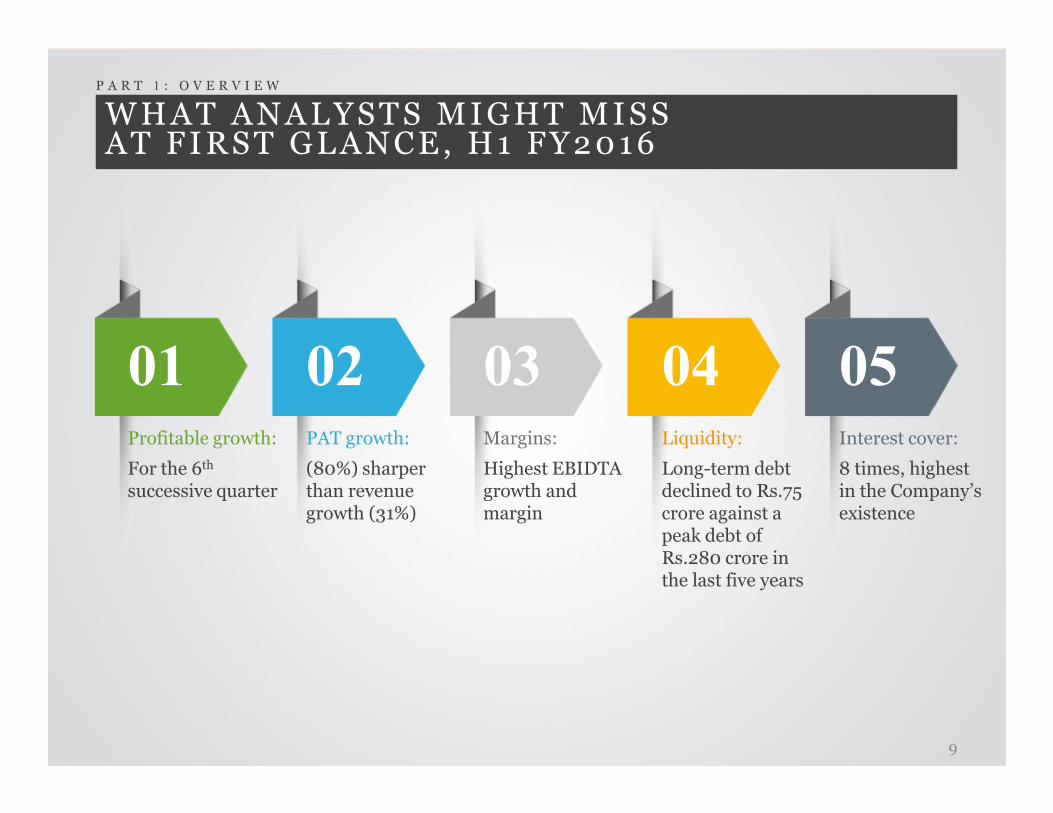
WHAT ANALYSTS MIGHT MISSAT FIRST GLANCE, H1 FY2016
01 02 03 04 05
P A R T 1 : O V E R V I E W
Profitable growth:
For the 6th
successive quarter
PAT growth:
(80%) sharper than revenue growth (31%)
Margins:
Highest EBIDTA growth and margin
Liquidity:
Long-term debt declined to Rs.75 crore against a peak debt of Rs.280 crore in the last five years
Interest cover:
8 times, highest in the Company’s existence
9
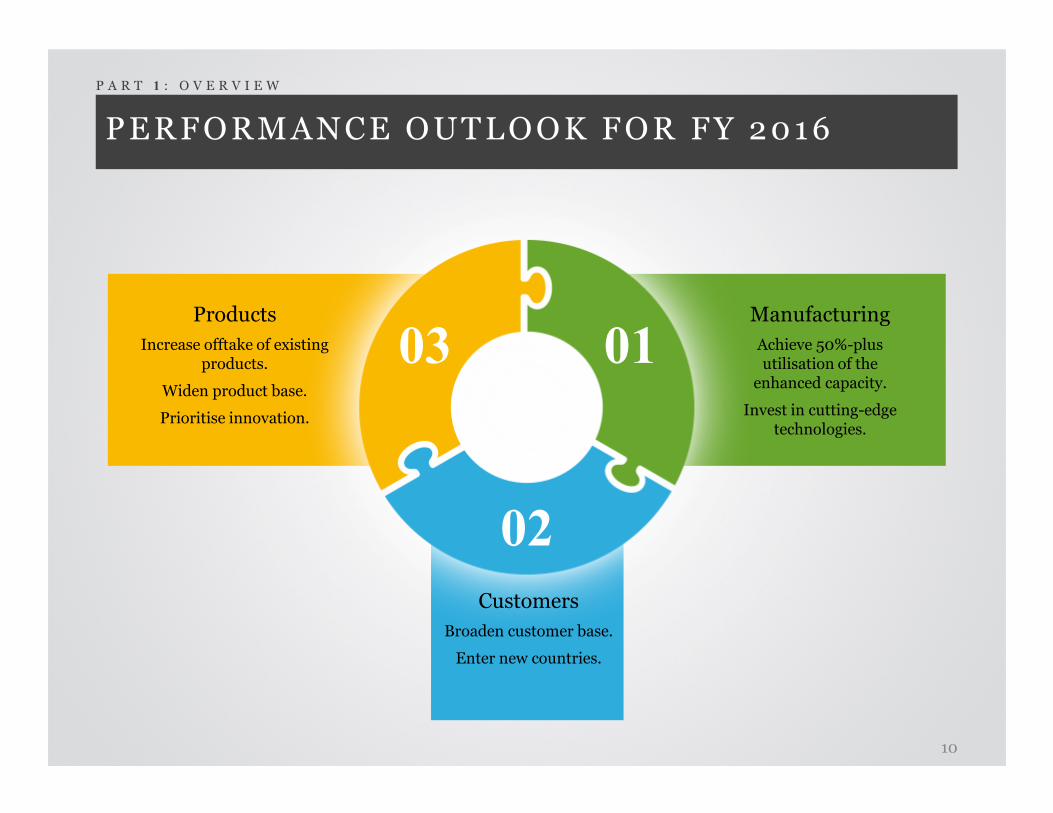
PERFORMANCE OUTLOOK FOR FY 2016
P A R T 1 : O V E R V I E W
0103Manufacturing
Achieve 50%-plus utilisation of the enhanced capacity.
Invest in cutting-edge
Products
Increase offtake of existing products.
Widen product base.
02
Customers
Broaden customer base.
Enter new countries.
Invest in cutting-edge technologies.
Prioritise innovation.
10
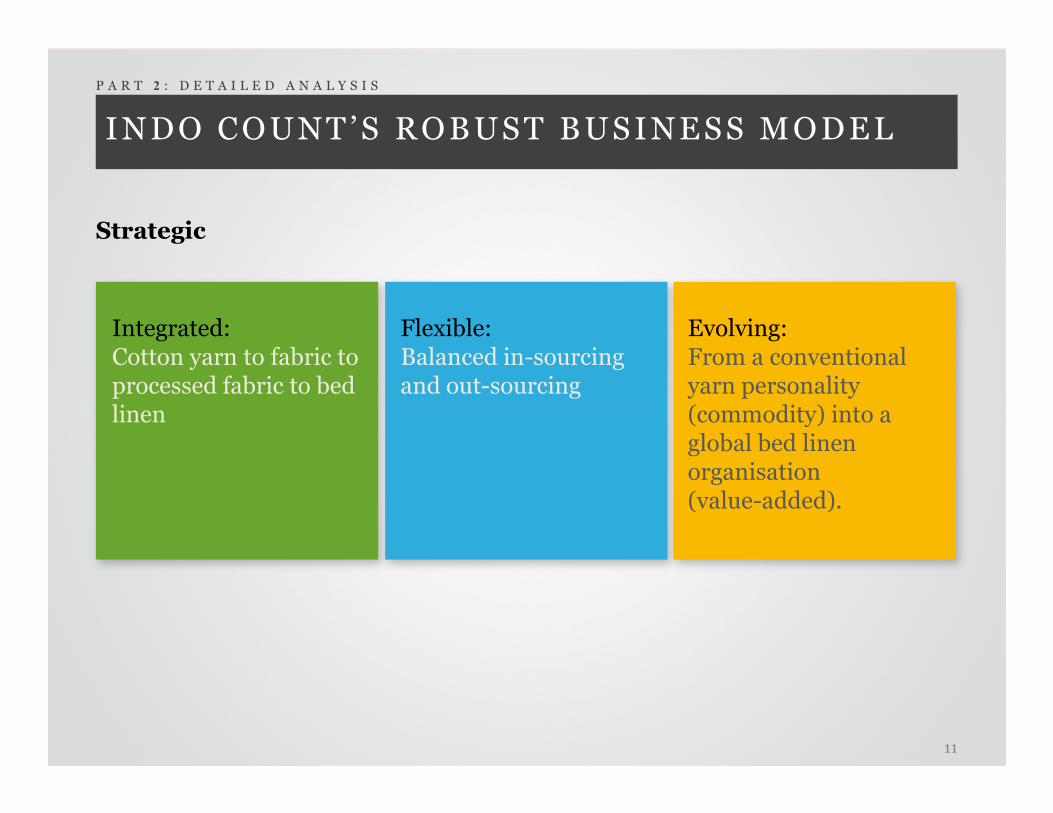
INDO COUNT’S ROBUST BUSINESS MODEL
Strategic
P A R T 2 : D E T A I L E D A N A L Y S I S
Integrated:Cotton yarn to fabric to processed fabric to bed linen
Flexible:Balanced in-sourcing and out-sourcing
Evolving:From a conventional yarn personality (commodity) into a linen (commodity) into a global bed linen organisation(value-added).
11
INDO COUNT’S ROBUST BUSINESS MODEL
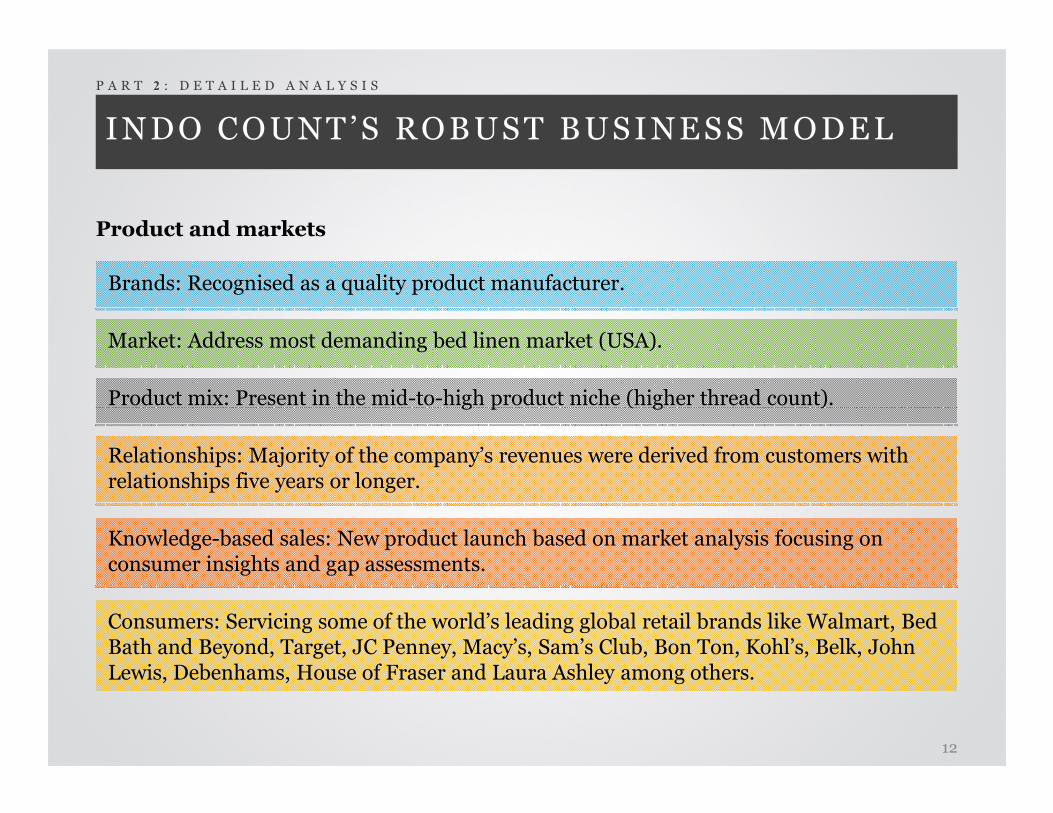
Product and markets
P A R T 2 : D E T A I L E D A N A L Y S I S
Brands: Recognised as a quality product manufacturer.
Market: Address most demanding bed linen market (USA).
Product mix: Present in the mid-to-high product niche (higher thread count). Product mix: Present in the mid-to-high product niche (higher thread count).
Relationships: Majority of the company’s revenues were derived from customers with relationships five years or longer.
Knowledge-based sales: New product launch based on market analysis focusing on consumer insights and gap assessments.
Consumers: Servicing some of the world’s leading global retail brands like Walmart, Bed Bath and Beyond, Target, JC Penney, Macy’s, Sam’s Club, Bon Ton, Kohl’s, Belk, John Lewis, Debenhams, House of Fraser and Laura Ashley among others.
12
INDO COUNT’S ROBUST BUSINESS MODEL
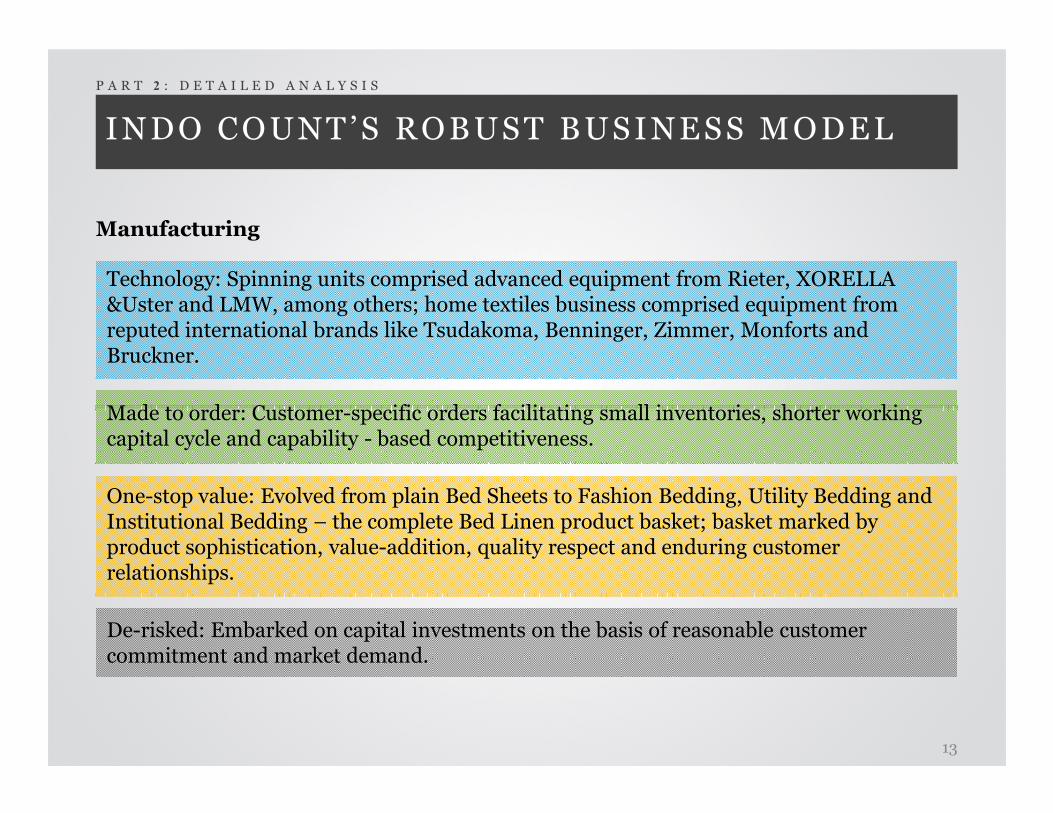
Manufacturing
P A R T 2 : D E T A I L E D A N A L Y S I S
Technology: Spinning units comprised advanced equipment from Rieter, XORELLA &Uster and LMW, among others; home textiles business comprised equipment from reputed international brands like Tsudakoma, Benninger, Zimmer, Monforts and Bruckner.
Made to order: Customer-specific orders facilitating small inventories, shorter working Made to order: Customer-specific orders facilitating small inventories, shorter working capital cycle and capability - based competitiveness.
One-stop value: Evolved from plain Bed Sheets to Fashion Bedding, Utility Bedding and Institutional Bedding – the complete Bed Linen product basket; basket marked by product sophistication, value-addition, quality respect and enduring customer relationships.
De-risked: Embarked on capital investments on the basis of reasonable customer commitment and market demand.
13
DE-RISKINGSTRENGTHENED OUR FINANCIALS
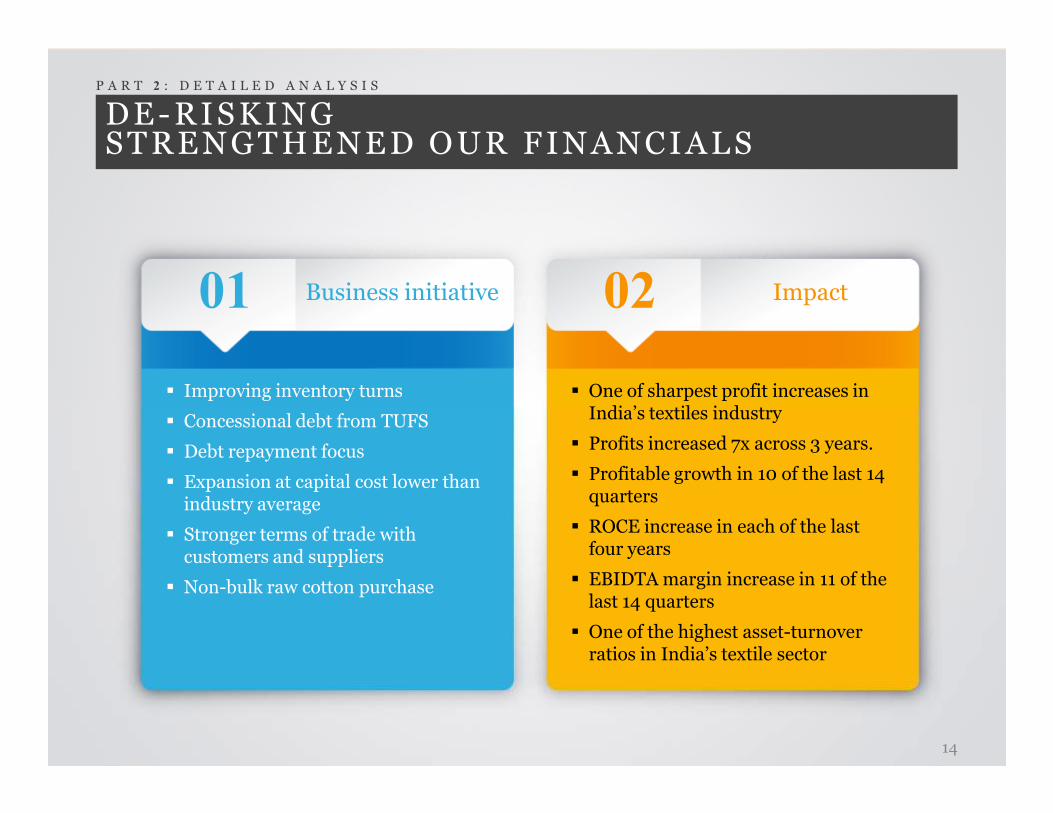
Business initiative
P A R T 2 : D E T A I L E D A N A L Y S I S
Impact01 02
� Improving inventory turns � One of sharpest profit increases in India’s textiles industry
� Concessional debt from TUFS
� Debt repayment focus
� Expansion at capital cost lower than industry average
� Stronger terms of trade with customers and suppliers
� Non-bulk raw cotton purchase
India’s textiles industry
� Profits increased 7x across 3 years.
� Profitable growth in 10 of the last 14 quarters
� ROCE increase in each of the last four years
� EBIDTA margin increase in 11 of the last 14 quarters
� One of the highest asset-turnover ratios in India’s textile sector
14
DE-RISKINGSTRENGTHENED OUR FINANCIALS
P A R T 2 : D E T A I L E D A N A L Y S I S1
.68
1.7
4
1.8
2
1.2
5
0.6
9
0.4
2
10
.66
-2.3
1
29
.52
11
0.3
9
16
1.4
4
24
2.6
9.9
0%
7.8
0%
9.9
0%
12
.60
%
17
.60
%
21
.90
%
7.6
0%
5.8
0%
14
.90
%
25
.40
%
34
.50
%
69
.00
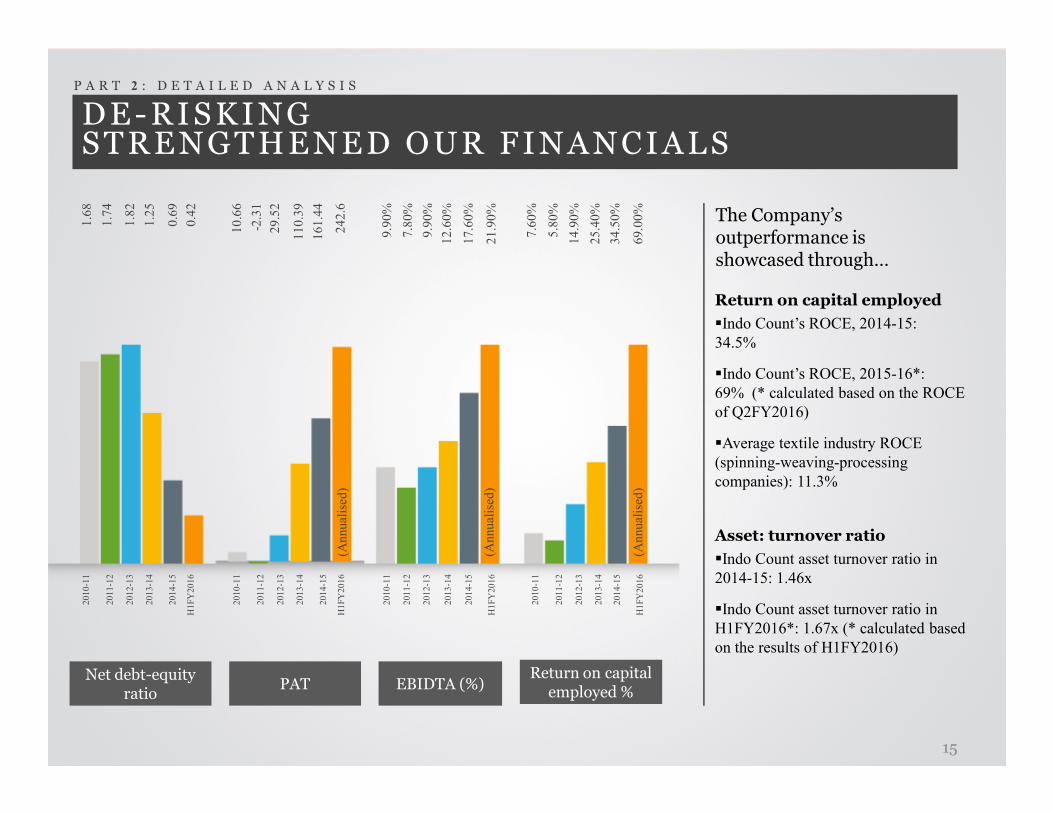
% The Company’s outperformance is showcased through…
Return on capital employed
�Indo Count’s ROCE, 2014-15:
34.5%
�Indo Count’s ROCE, 2015-16*:
69% (* calculated based on the ROCE
of Q2FY2016)
Net debt-equity ratio
PAT EBIDTA (%)Return on capital employed %
20
10
-11
20
11
-12
20
12
-13
20
13
-14
20
14
-15
H1
FY
20
16
of Q2FY2016)
�Average textile industry ROCE
(spinning-weaving-processing
companies): 11.3%
Asset: turnover ratio
�Indo Count asset turnover ratio in
2014-15: 1.46x
�Indo Count asset turnover ratio in
H1FY2016*: 1.67x (* calculated based
on the results of H1FY2016)
15
20
10
-11
20
11
-12
20
12
-13
20
13
-14
20
14
-15
H1
FY
20
16
20
10
-11
20
11
-12
20
12
-13
20
13
-14
20
14
-15
H1
FY
20
16
20
10
-11
20
11
-12
20
12
-13
20
13
-14
20
14
-15
H1
FY
20
16
(Annual
ised
)
(Annual
ised
)
(Annual
ised
)
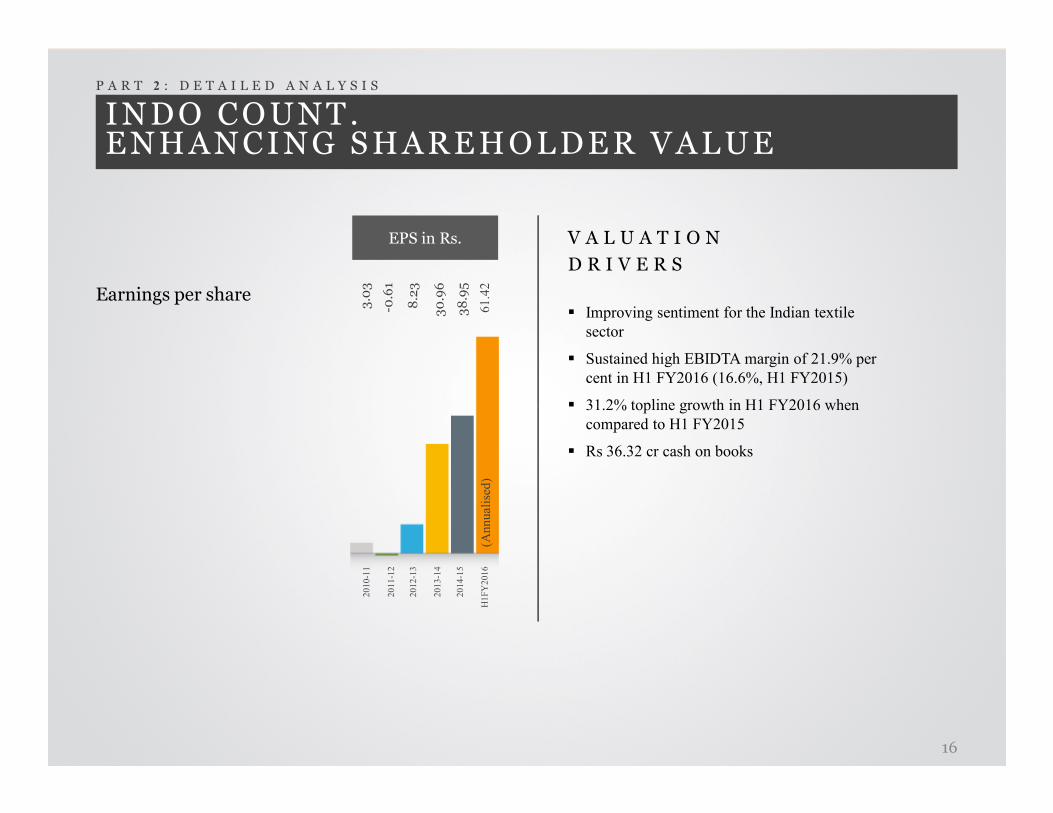
INDO COUNT.ENHANCING SHAREHOLDER VALUE
Earnings per share
P A R T 2 : D E T A I L E D A N A L Y S I S
� Improving sentiment for the Indian textile
sector
� Sustained high EBIDTA margin of 21.9% per
cent in H1 FY2016 (16.6%, H1 FY2015)
� 31.2% topline growth in H1 FY2016 when
EPS in Rs.
3.03
-0.61
8.23
30.96
38.95
61
.42
V A L U A T I O N
D R I V E R S
� 31.2% topline growth in H1 FY2016 when
compared to H1 FY2015
� Rs 36.32 cr cash on books
20
10
-11
20
11
-12
20
12
-13
20
13
-14
20
14
-15
H1
FY
20
16
16
(Annual
ised
)
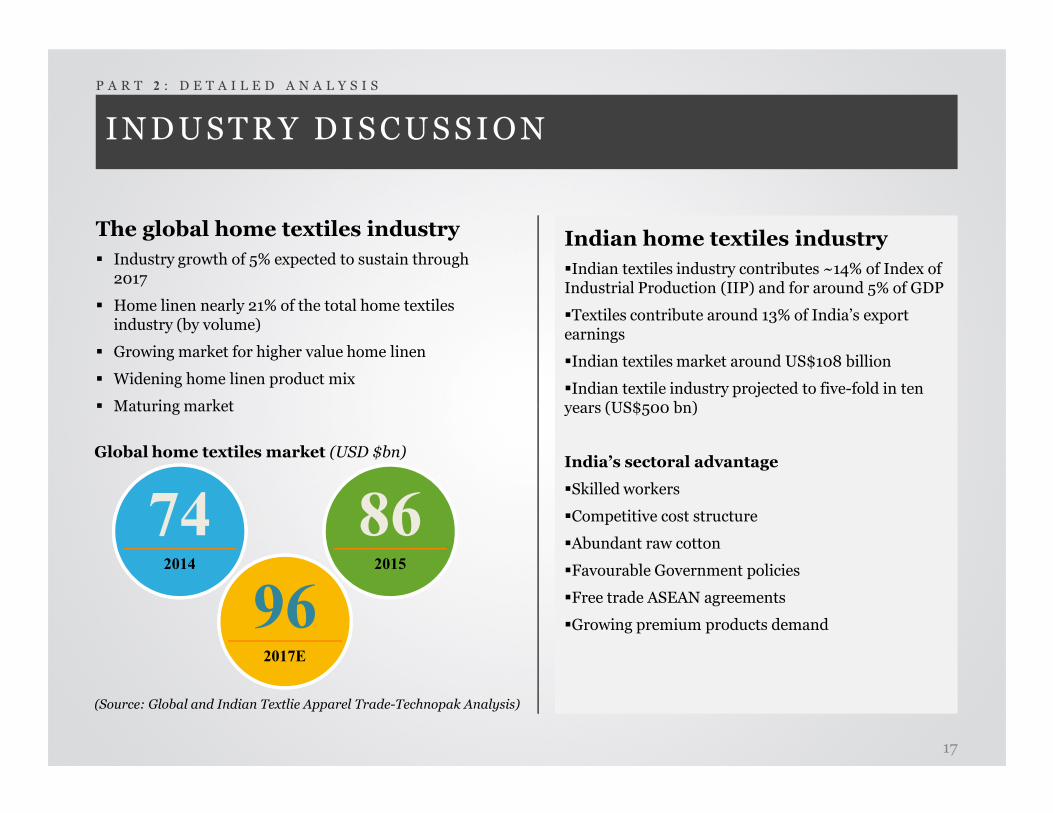
INDUSTRY DISCUSSION
The global home textiles industry
� Industry growth of 5% expected to sustain through 2017
� Home linen nearly 21% of the total home textiles industry (by volume)
� Growing market for higher value home linen
� Widening home linen product mix
� Maturing market
P A R T 2 : D E T A I L E D A N A L Y S I S
Indian home textiles industry
�Indian textiles industry contributes ~14% of Index of Industrial Production (IIP) and for around 5% of GDP
�Textiles contribute around 13% of India’s export earnings
�Indian textiles market around US$108 billion
�Indian textile industry projected to five-fold in ten years (US$500 bn)� Maturing market years (US$500 bn)
India’s sectoral advantage
�Skilled workers
�Competitive cost structure
�Abundant raw cotton
�Favourable Government policies
�Free trade ASEAN agreements
�Growing premium products demand
Global home textiles market (USD $bn)
2014
742015
86
2017E
96
(Source: Global and Indian Textlie Apparel Trade-Technopak Analysis)
17
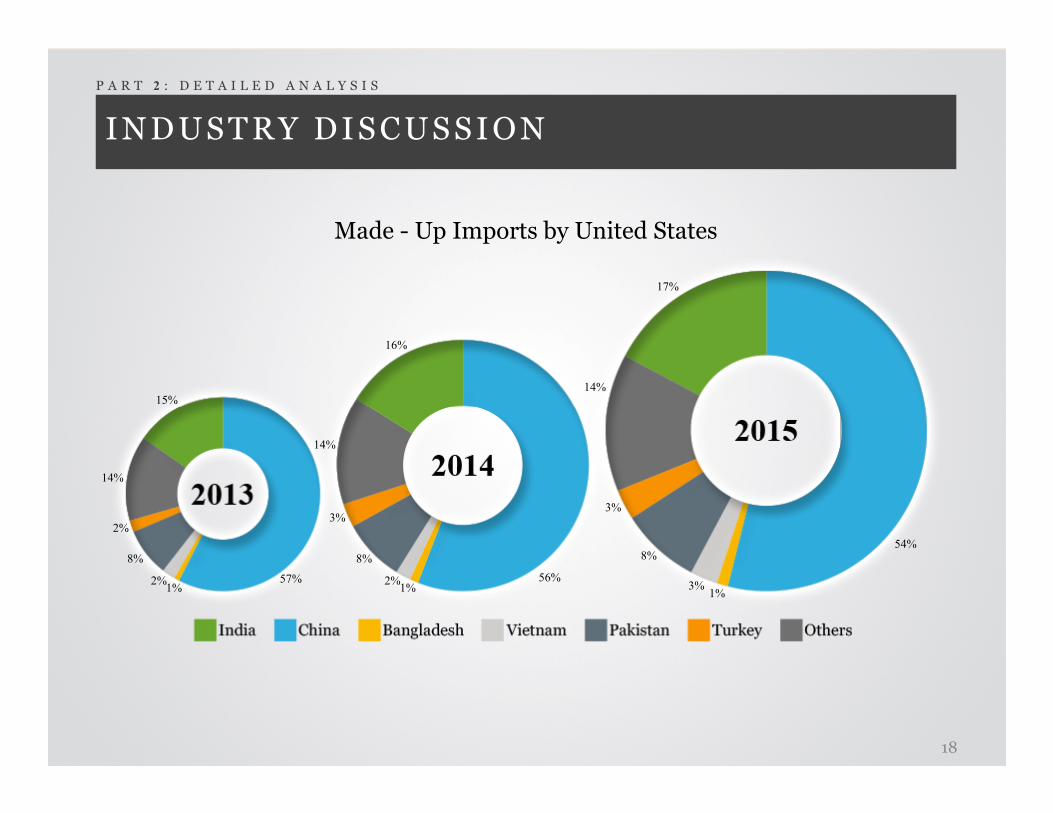
INDUSTRY DISCUSSION
Made - Up Imports by United States
P A R T 2 : D E T A I L E D A N A L Y S I S
15%
16%
14%
17%
57%1%
2%
8%
2%
14%
1%2%
8%
3%
14%
1%3%
8%
3%
18
56%
54%
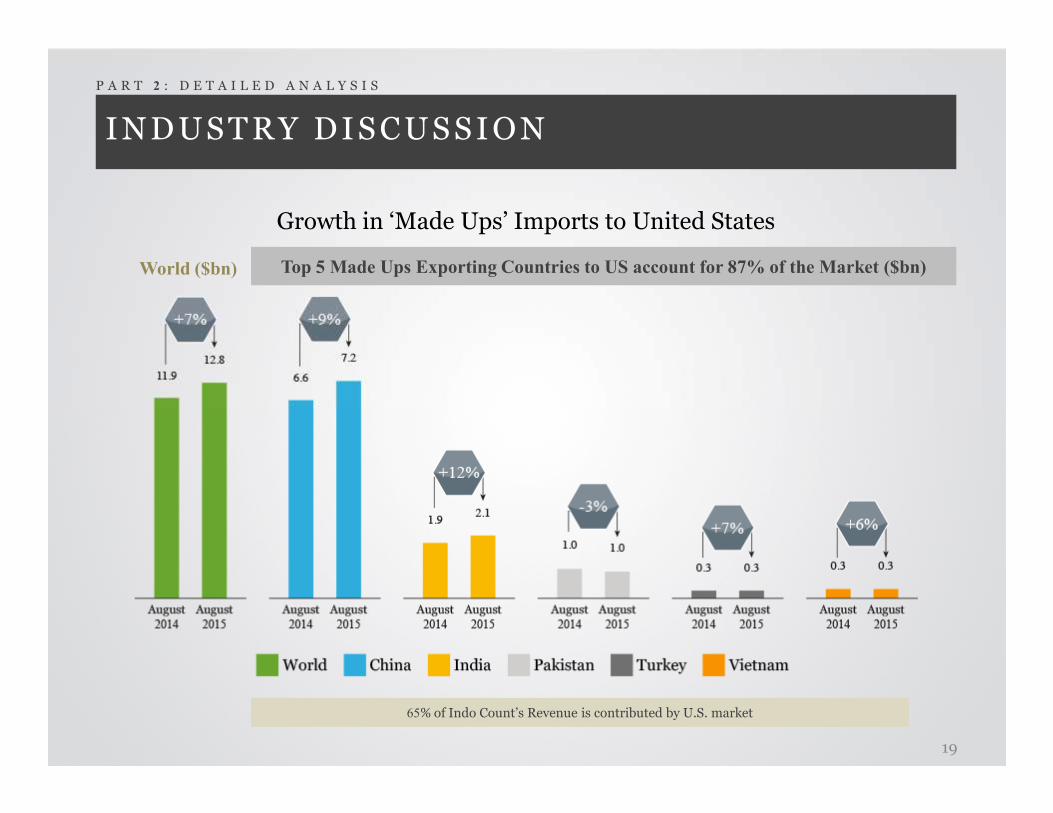
INDUSTRY DISCUSSION
P A R T 2 : D E T A I L E D A N A L Y S I S
Growth in ‘Made Ups’ Imports to United States
Top 5 Made Ups Exporting Countries to US account for 87% of the Market ($bn)World ($bn)
65% of Indo Count’s Revenue is contributed by U.S. market
19
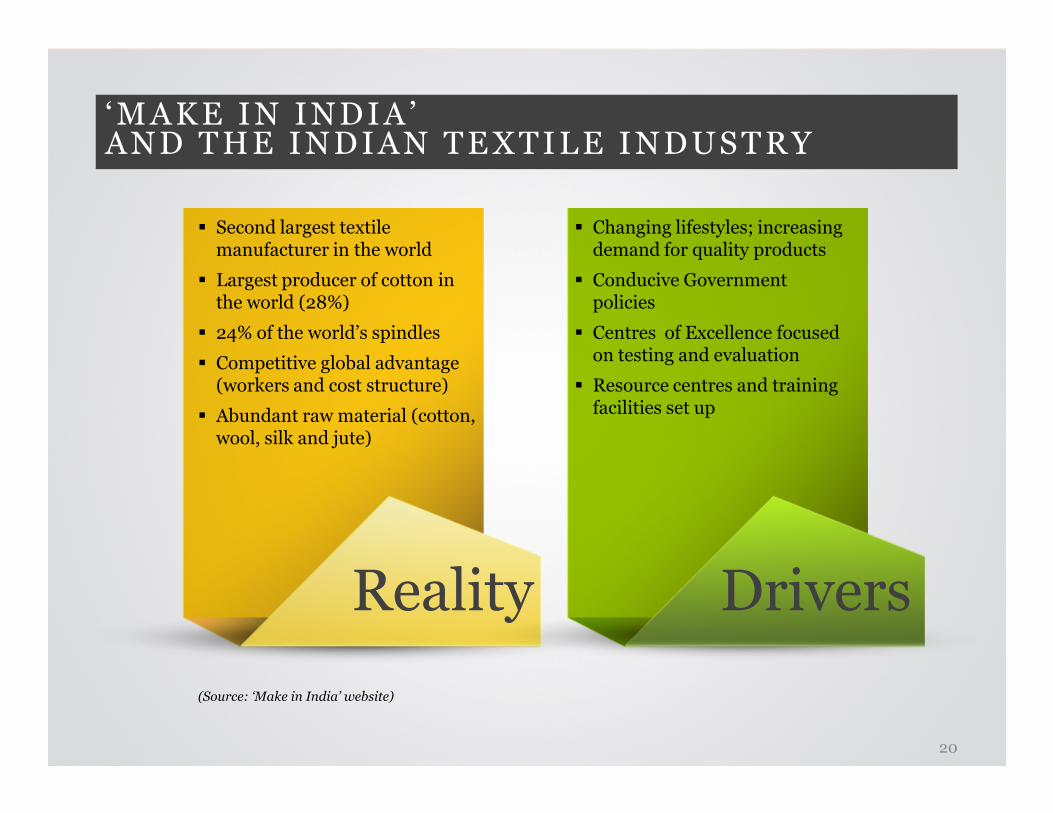
‘MAKE IN INDIA ’AND THE INDIAN TEXTILE INDUSTRY
� Second largest textile manufacturer in the world
� Largest producer of cotton in the world (28%)
� 24% of the world’s spindles
� Competitive global advantage (workers and cost structure)
� Abundant raw material (cotton,
� Changing lifestyles; increasing demand for quality products
� Conducive Government policies
� Centres of Excellence focused on testing and evaluation
� Resource centres and training facilities set up
� Abundant raw material (cotton, wool, silk and jute)
facilities set up
(Source: ‘Make in India’ website)
Reality Drivers
20
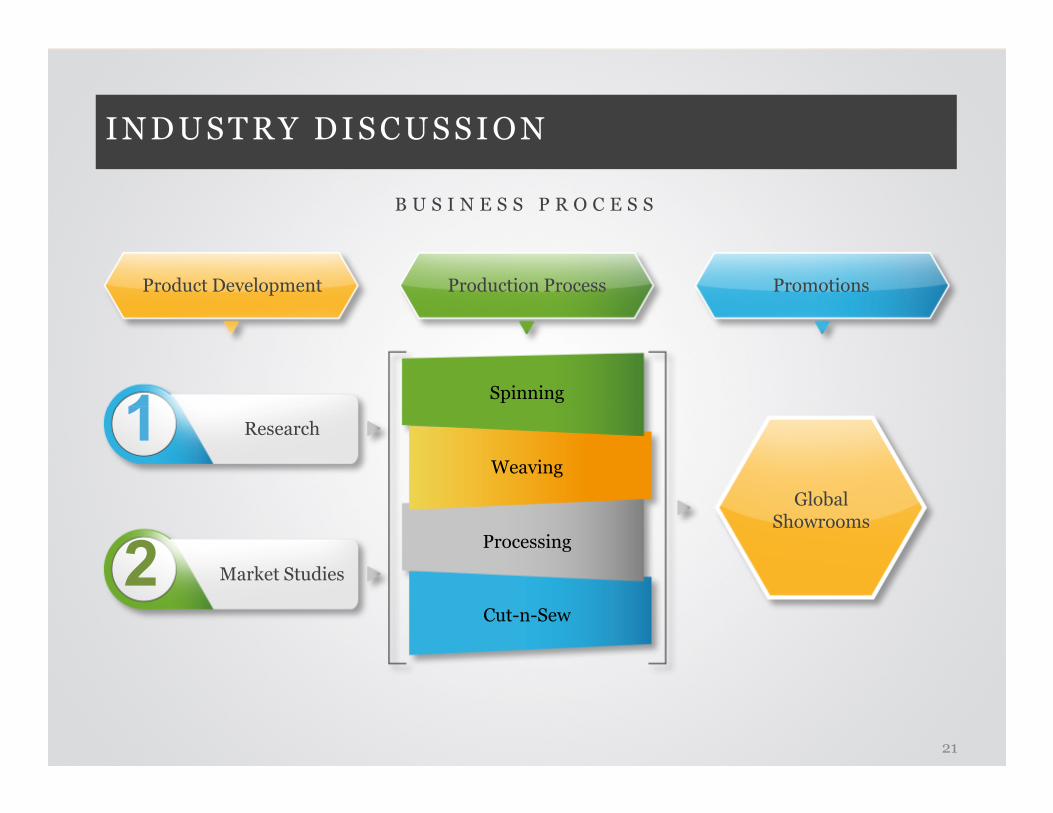
INDUSTRY DISCUSSION
B U S I N E S S P R O C E S S
Product Development Production Process Promotions
Spinning
1
GlobalShowrooms
Weaving
Processing
Cut-n-Sew
Research
Market Studies
1
2
21
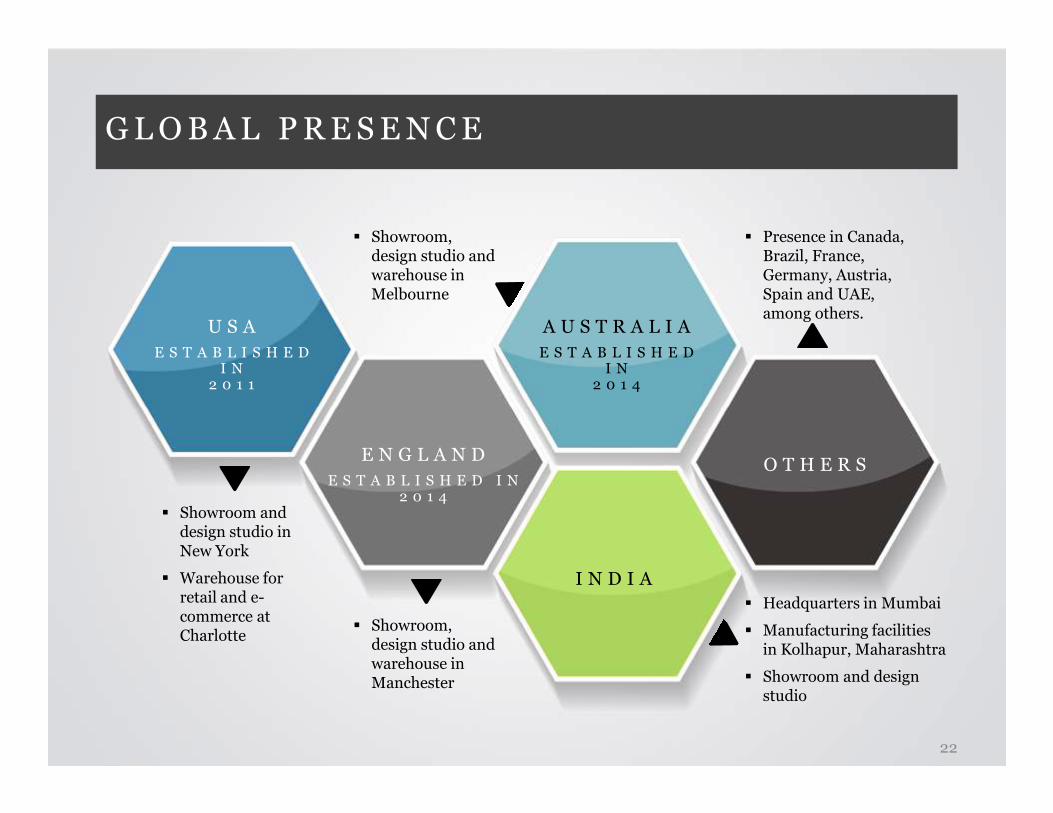
GLOBAL PRESENCE
U S A
E S T A B L I S H E D I N
2 0 1 1
A U S T R A L I A
E S T A B L I S H E D I N
2 0 1 4
� Showroom, design studio and warehouse in Melbourne
� Presence in Canada, Brazil, France, Germany, Austria, Spain and UAE, among others.
� Showroom and design studio in New York
� Warehouse for retail and e-commerce at Charlotte
E N G L A N D
E S T A B L I S H E D I N2 0 1 4
I N D I A
O T H E R S
� Showroom, design studio and warehouse in Manchester
� Headquarters in Mumbai
� Manufacturing facilities in Kolhapur, Maharashtra
� Showroom and design studio
22
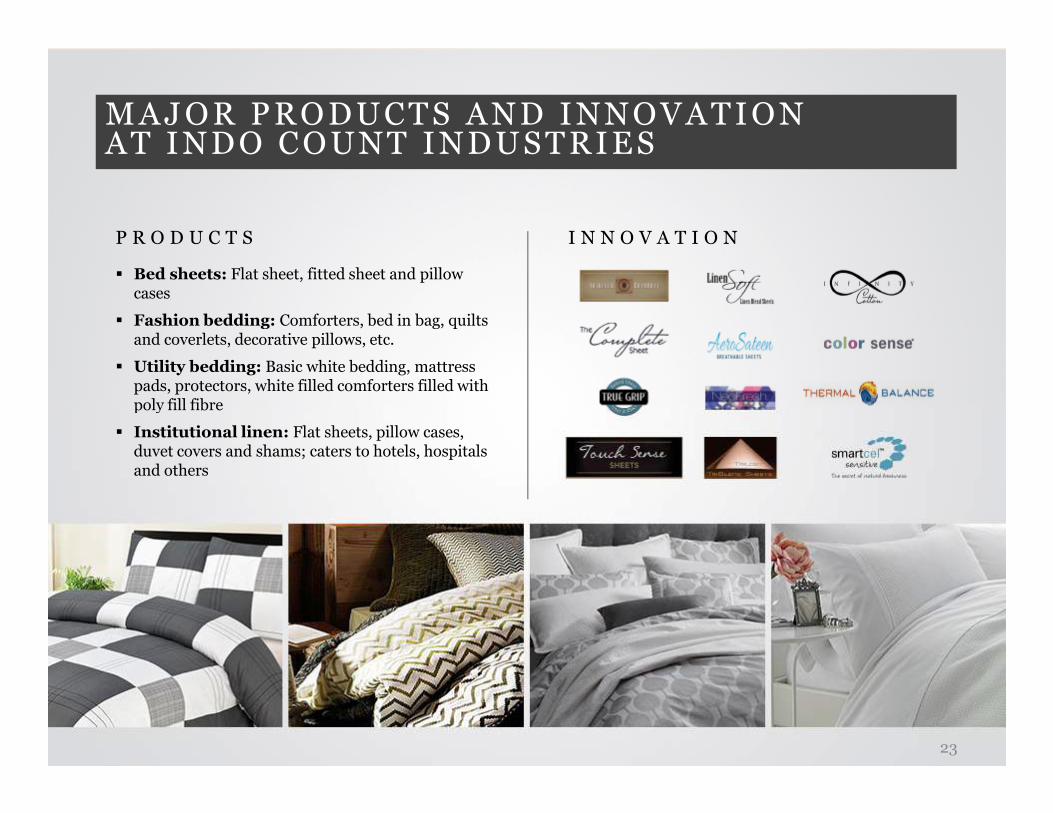
MAJOR PRODUCTS AND INNOVATIONAT INDO COUNT INDUSTRIES
P R O D U C T S
� Bed sheets: Flat sheet, fitted sheet and pillow cases
� Fashion bedding: Comforters, bed in bag, quilts and coverlets, decorative pillows, etc.
� Utility bedding: Basic white bedding, mattress pads, protectors, white filled comforters filled with poly fill fibre
I N N O V A T I O N
poly fill fibre
� Institutional linen: Flat sheets, pillow cases, duvet covers and shams; caters to hotels, hospitals and others
23
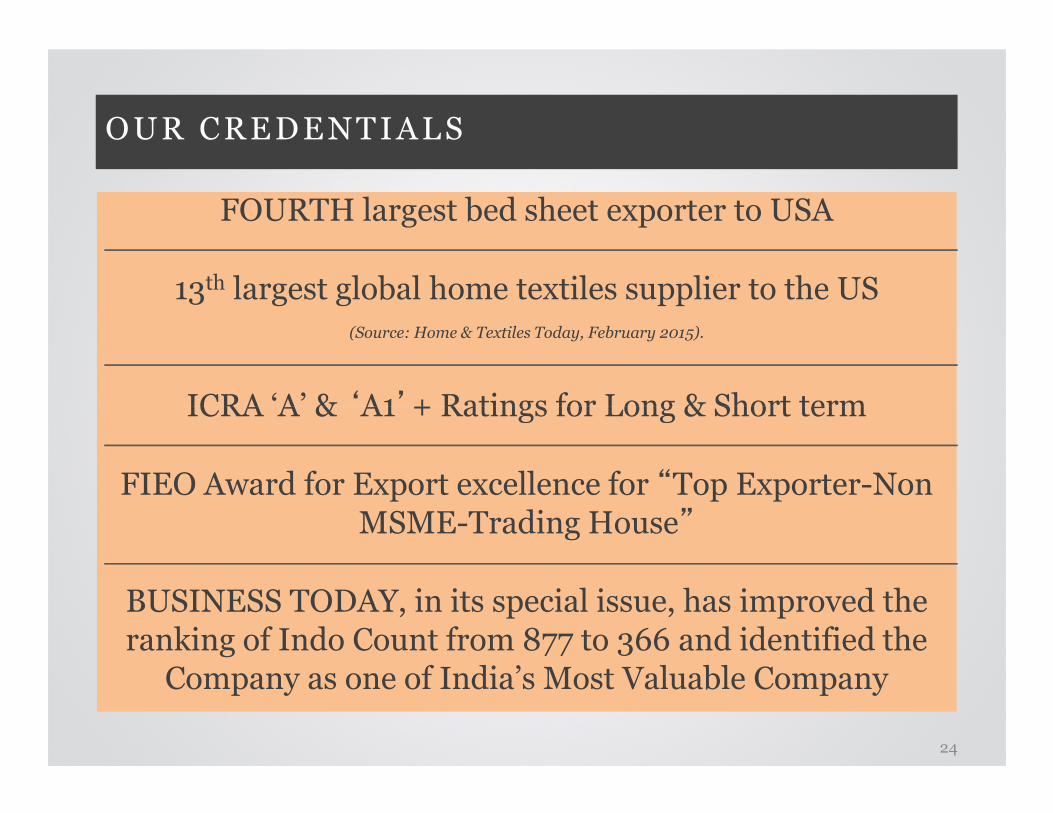
OUR CREDENTIALS
FOURTH largest bed sheet exporter to USA
13th largest global home textiles supplier to the US(Source: Home & Textiles Today, February 2015).
ICRA ‘A’ & ‘A1’+ Ratings for Long & Short termICRA ‘A’ & ‘A1’+ Ratings for Long & Short term
FIEO Award for Export excellence for “Top Exporter-Non MSME-Trading House”
BUSINESS TODAY, in its special issue, has improved the ranking of Indo Count from 877 to 366 and identified the
Company as one of India’s Most Valuable Company
24
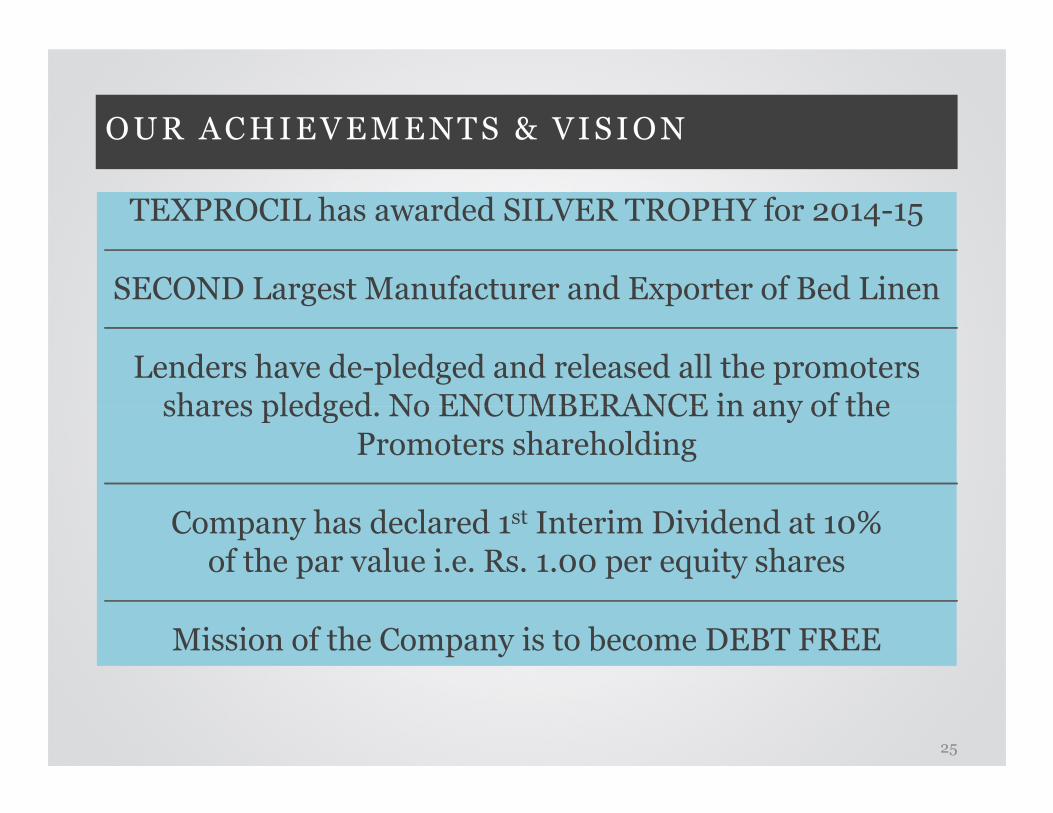
OUR ACHIEVEMENTS & VISION
TEXPROCIL has awarded SILVER TROPHY for 2014-15
SECOND Largest Manufacturer and Exporter of Bed Linen
Lenders have de-pledged and released all the promoters shares pledged. No ENCUMBERANCE in any of the shares pledged. No ENCUMBERANCE in any of the
Promoters shareholding
Company has declared 1st Interim Dividend at 10%of the par value i.e. Rs. 1.00 per equity shares
Mission of the Company is to become DEBT FREE
25
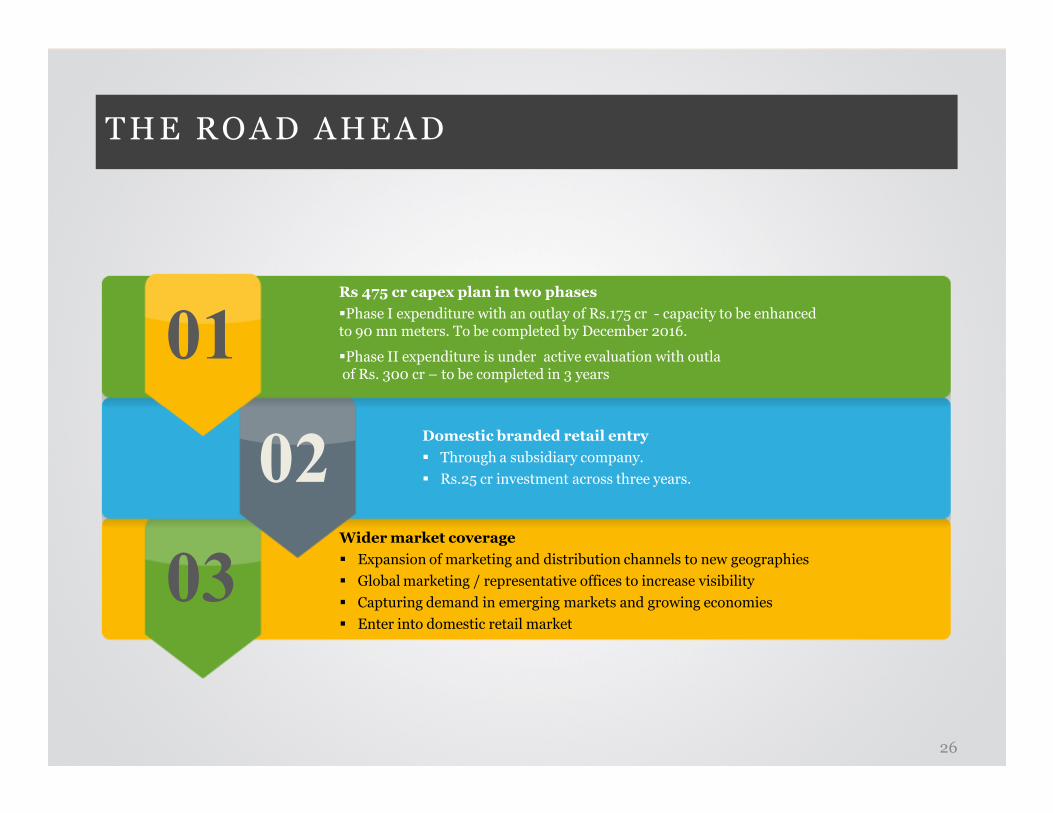
THE ROAD AHEAD
01Rs 475 cr capex plan in two phases
�Phase I expenditure with an outlay of Rs.175 cr - capacity to be enhancedto 90 mn meters. To be completed by December 2016.
�Phase II expenditure is under active evaluation with outlaof Rs. 300 cr – to be completed in 3 years
03
Domestic branded retail entry
� Through a subsidiary company.
� Rs.25 cr investment across three years. 02Wider market coverage
� Expansion of marketing and distribution channels to new geographies
� Global marketing / representative offices to increase visibility
� Capturing demand in emerging markets and growing economies
� Enter into domestic retail market
26
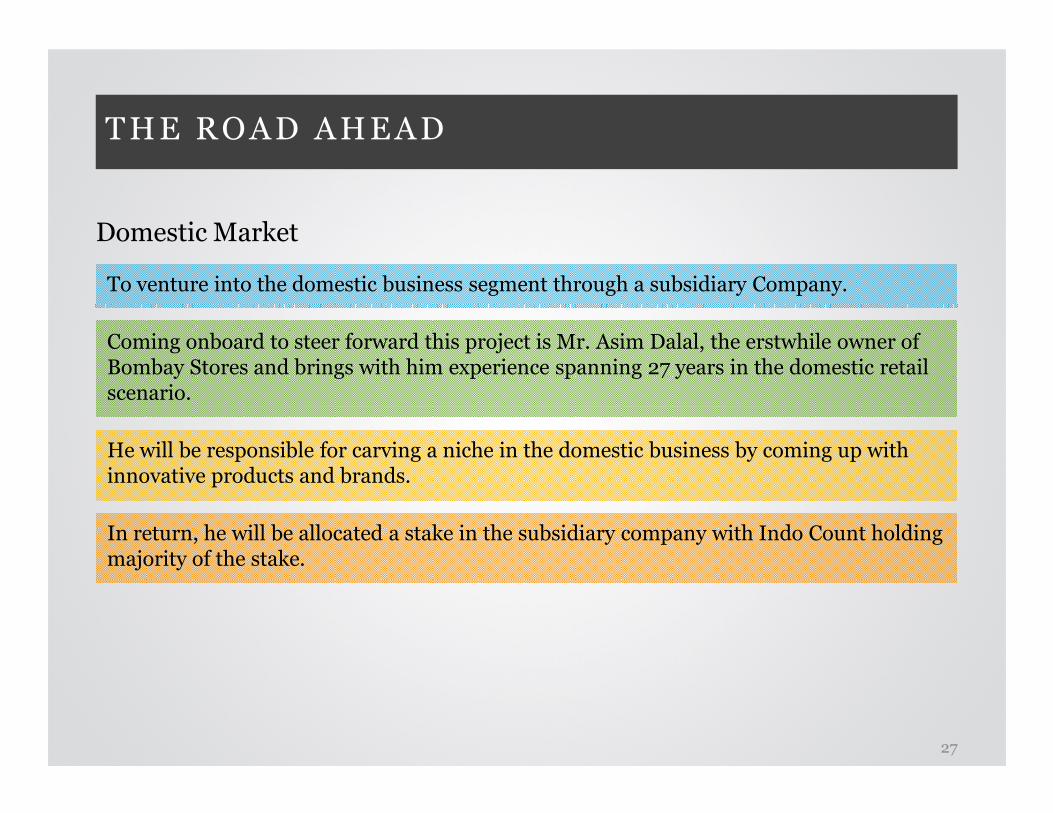
THE ROAD AHEAD
Domestic Market
To venture into the domestic business segment through a subsidiary Company.
Coming onboard to steer forward this project is Mr. Asim Dalal, the erstwhile owner of Bombay Stores and brings with him experience spanning 27 years in the domestic retail scenario.
27
He will be responsible for carving a niche in the domestic business by coming up with innovative products and brands.
In return, he will be allocated a stake in the subsidiary company with Indo Count holding majority of the stake.
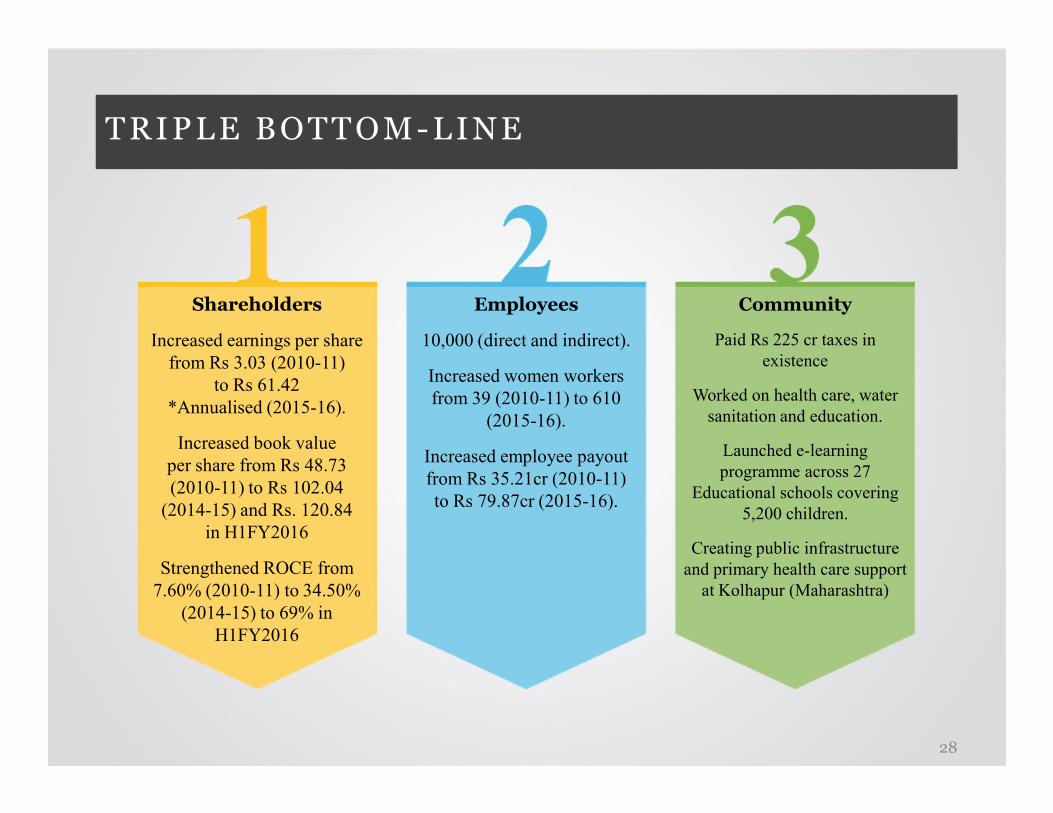
TRIPLE BOTTOM-LINE
Shareholders
Increased earnings per share
from Rs 3.03 (2010-11)
to Rs 61.42
*Annualised (2015-16).
Employees
10,000 (direct and indirect).
Increased women workers
from 39 (2010-11) to 610
Community
Paid Rs 225 cr taxes in
existence
Worked on health care, water
sanitation and education.*Annualised (2015-16).
Increased book value
per share from Rs 48.73
(2010-11) to Rs 102.04
(2014-15) and Rs. 120.84
in H1FY2016
Strengthened ROCE from
7.60% (2010-11) to 34.50%
(2014-15) to 69% in
H1FY2016
from 39 (2010-11) to 610
(2015-16).
Increased employee payout
from Rs 35.21cr (2010-11)
to Rs 79.87cr (2015-16).
sanitation and education.
Launched e-learning
programme across 27
Educational schools covering
5,200 children.
Creating public infrastructure
and primary health care support
at Kolhapur (Maharashtra)
28
INVESTOR CONTACTS
For further information please contact:
Indo Count Industries LimitedCIN: L72200PN1988PLC068972
Mr.KR Lalpuria – Executive [email protected]
Mr. R. Sundaram-Chief Financial [email protected]@indocount.com
www.indocount.com
Investor Relations Advisors:
Strategic Growth Advisors Pvt. Ltd.CIN: U74140MH2010PTC204285
Ms. Neha Shroff/ Ms. Ruchi [email protected] / [email protected]
www.sgapl.net
29