Embed Size (px)
Citation preview
4 © Journal of the Asia Education Teachers’ Association – June 2014
Global Education – Learning Emphasises• Interdependence and globalisation• Identity and cultural diversity
INDONESIA – AUSTRALIAN GEOGRAPHY CURRICULUM
YEAR 3: PLACES ARE SIMILAR AND DIFFERENTDr Susan Bliss
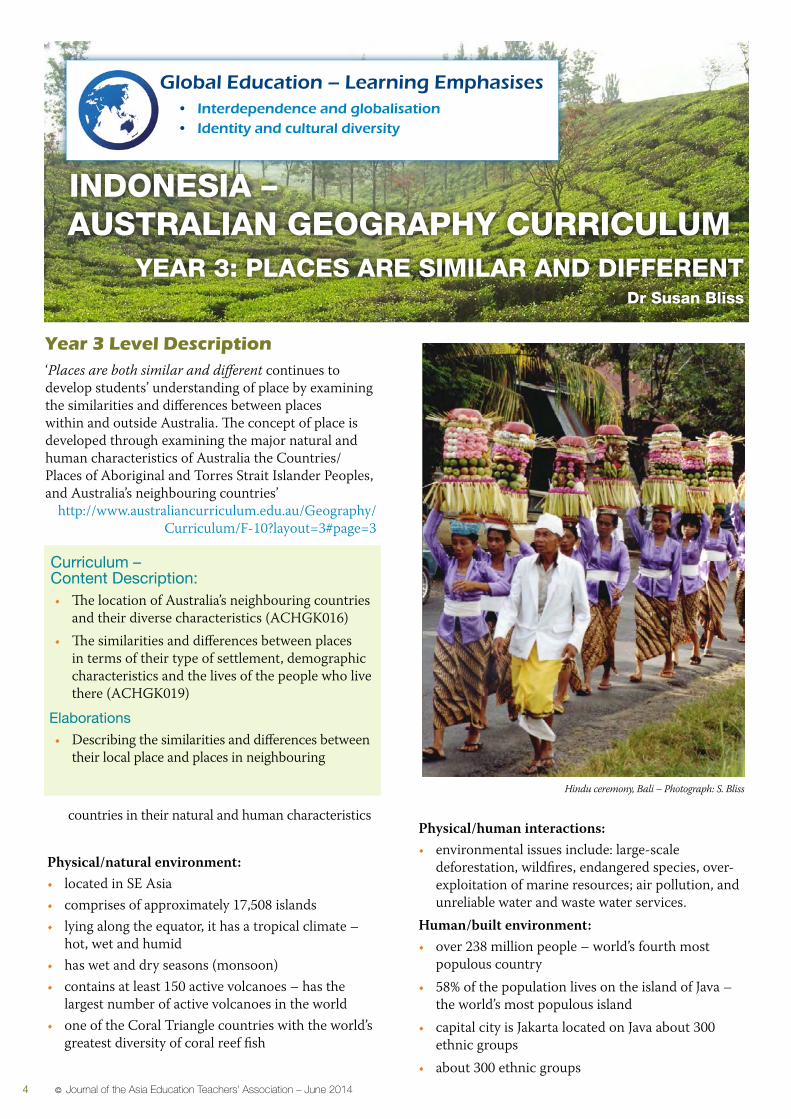
Year 3 level Description‘Places are both similar and differentcontinues to develop students’ understanding of place by examining the similarities and differences between places within and outside Australia. The concept of place is developed through examining the major natural and human characteristics of Australia the Countries/Places of Aboriginal and Torres Strait Islander Peoples, and Australia’s neighbouring countries’
http://www.australiancurriculum.edu.au/Geography/Curriculum/F-10?layout=3#page=3
Curriculum – Content Description: • The location of Australia’s neighbouring countries
and their diverse characteristics (ACHGK016)• The similarities and differences between places
in terms of their type of settlement, demographic characteristics and the lives of the people who live there (ACHGK019)
Elaborations
• Describing the similarities and differences between their local place and places in neighbouring
Hindu ceremony, Bali – Photograph: S. Bliss
countries in their natural and human characteristics
Physical/natural environment:• located in SE Asia• comprises of approximately 17,508 islands• lying along the equator, it has a tropical climate –
hot, wet and humid• has wet and dry seasons (monsoon)• contains at least 150 active volcanoes – has the
largest number of active volcanoes in the world• one of the Coral Triangle countries with the world’s
greatest diversity of coral reef fish
Physical/human interactions:• environmental issues include: large-scale
deforestation, wildfires, endangered species, over-exploitation of marine resources; air pollution, and unreliable water and waste water services.
Human/built environment:• over 238 million people – world’s fourth most
populous country• 58% of the population lives on the island of Java –
the world’s most populous island• capital city is Jakarta located on Java about 300
ethnic groups• about 300 ethnic groups

© ASIA Volume 42 Number 2 5
Geoactivities1. Using newspapers, journals or the internet design a
poster of images of Indonesia2. Label the photographs3. Identify the physical and cultural features on the
photographs4. ICT – Go to http://www.asiaeducation.edu.au/
curriculum_resources/geography/year_3_images_of_indonesia/images_of_indonesia_landing_page.html. a. In pairs explain the similarities and differences
between life in Indonesia and Australia.b. Develop a class mind map that summarises
what students learned about life in Indonesia.
Curriculum: Geographical inquiry and skills• Develop geographical questions about the
location of Australia’s neighbouring countries and their diverse characteristics. For example: Where is Indonesia? Why is it called our neighbour? What are the similarities and differences between Australia’s and Indonesia’s climate? What are the similarities and differences on how people perceive Indonesia? What are the different views on protecting the Indonesian environment? What are the similarities and differences between places in terms of their type of settlement, demographic characteristics and the lives of the people who live there?
• Collect and record relevant geographical data and information, for example, by observing by interviewing, conducting surveys, measuring, or from sources such as maps, photographs, satellite images, the media and the internet
• Represent data by constructing tables and graphs
• Represent the location of places and their features by constructing large-scale maps that conform to cartographic conventions including scale, legend, title and north point, and describe their location using simple grid references, compass direction and distance
• Interpret geographical data to identify distributions and patterns and draw conclusions
• Present findings in a range of communication forms, for example, written, oral, digital, graphic, tabular, and visual, and use geographical terminology
• Reflect on their learning to propose individual action in response to a contemporary geographical challenge and identify the expected effects of the proposal
inDonEsia – austRalian GEoGRaPhY cuRRiculum
Curriculum: Maps and Globe • Represent the location of places and their
features by constructing large-scale maps that conform to cartographic conventions including scale, legend, title and north point, and describe their location using simple grid references, compass direction and distance (ACHGS022)
• using a globe to locate New Zealand, the Pacific Island nations, Papua New Guinea, Timor-Leste and Indonesia, labelling them on a map, and identifying the direction of each country from Australia
What should a map on Indonesia contain?
Source of sketches: Keys to Geography 2nd ed + CD, Australian Geography Teachers’ Association, page 2, and http://www.
slideshare.net/yaryalitsa/boltss-mapping-geography
Every map should have BOLTSS:B order: line around itOrientation: direction such as North (use of
compass)Legend: symbols such as green for trees and blue
for riversTitle: name of mapScale: measurement between the map and the real
world. Is the map 100 or 20 times smaller?Source (sometimes included)
Additionally information– maps should be neat and names printed
Source: http://www.slideshare.net/yaryalitsa/boltss-mapping-geography

6 © Journal of the Asia Education Teachers’ Association – June 2014
inDonEsia – austRalian GEoGRaPhY cuRRiculum
Teachers ICT• YouTube: Map Essentials – http://www.youtube.
com/watch?v=E5ltL5J85cY• Textbooks – Map Essentials Year 1 – Year 6
National Geographic Learning – http://ngsptechnology.com/tabid/585/Default.aspx
Locating places –Where do you live?
Alphanumerical – when locating places on a map alphabet is along one line and numbers along the other line
Source of sketch: Keys to Geography 2nd ed + CD - Australian Geography Teachers` Association, page 16
In A1 there are 3 trees, D4 a windmill and C2 a railway station.
GeoactivitiesWhat is at?1. F1…………………….2. C5…………………….3. C2…………………….4. F4……………………..
Source https://maps.google.com.au/maps?q=indonesia+map&ie=UTF-8&hq=&hnear=0x2c4c07d7496404b7:0xe37b4de71badf485,Indonesia&gl=au&ei=stT2UoGKBY6jiQfNsYCIAQ&sqi=2&ved=0CCYQ8gEwAA
location of indonesia* using simple grid references – alphanumerical
Geoactivities*Indonesia is outlined in brown on the map. 1. What is the name of the map?2. What Indonesian city is located in C6?3. What Indonesian city is located in D6?4. What Sea is located in C6 and D6?
1
2
3
4
5
6
7
A B C D E F
Left: Ancient hand drawn map of Volpaia, Italy
5. Name one Sea located between Indonesia and Australia
6. Is there a scale on the map? Yes/No7. Why do you need to have a scale on a map?8. If I wanted to travel to Indonesia from Australia
name two types of transport you could take
N
© ASIA Volume 42 Number 2 7
inDonEsia – austRalian GEoGRaPhY cuRRiculum
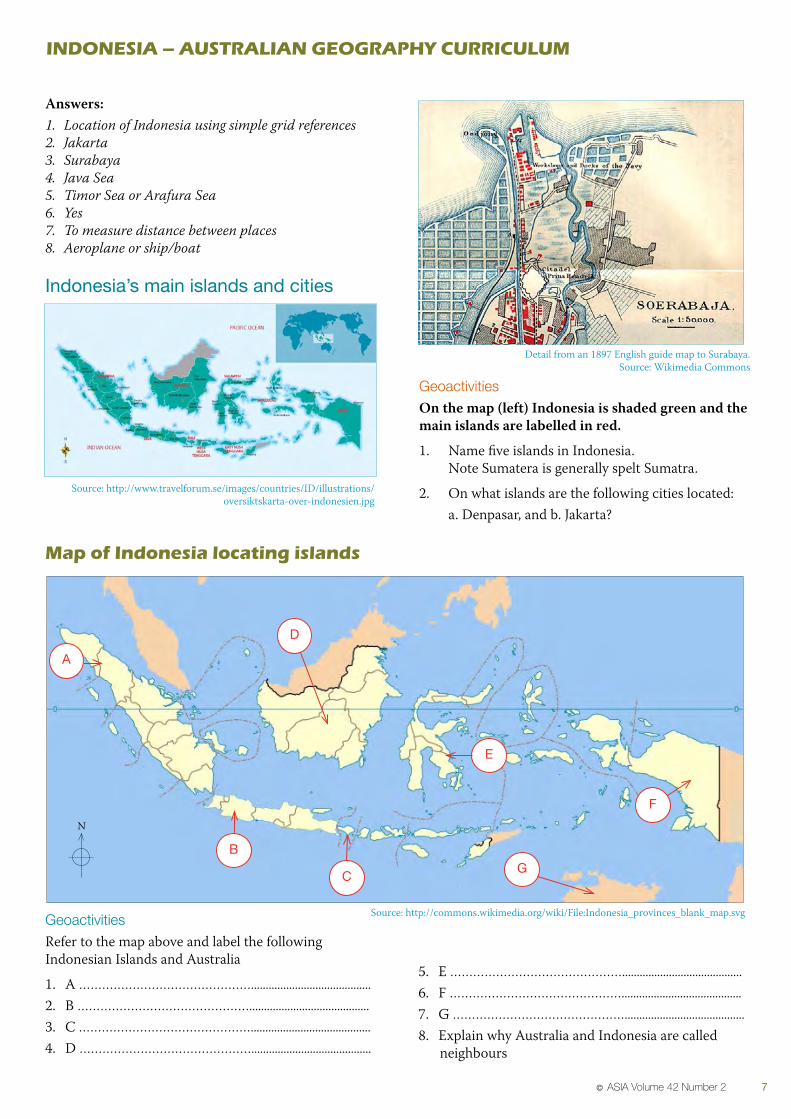
Answers:1. Location of Indonesia using simple grid references2. Jakarta3. Surabaya4. Java Sea5. Timor Sea or Arafura Sea6. Yes7. To measure distance between places8. Aeroplane or ship/boat
Indonesia’s main islands and cities
Source: http://www.travelforum.se/images/countries/ID/illustrations/oversiktskarta-over-indonesien.jpg
GeoactivitiesOn the map (left) Indonesia is shaded green and the main islands are labelled in red.
1. Name five islands in Indonesia. Note Sumatera is generally spelt Sumatra.
2. On what islands are the following cities located: a. Denpasar, and b. Jakarta?
map of indonesia locating islands
N
A
B
C
D
E
F
G
Source: http://commons.wikimedia.org/wiki/File:Indonesia_provinces_blank_map.svgGeoactivitiesRefer to the map above and label the following Indonesian Islands and Australia
1. A ……………………………………….........................................2. B ……………………………………….........................................3. C ……………………………………….........................................4. D ……………………………………….........................................
5. E ……………………………………….........................................6. F ……………………………………….........................................7. G ……………………………………….........................................8. Explain why Australia and Indonesia are called
neighbours
Detail from an 1897 English guide map to Surabaya. Source: Wikimedia Commons

© ASIA Volume 42 Number 2 7
inDonEsia – austRalian GEoGRaPhY cuRRiculum
Answers:1. Location of Indonesia using simple grid references2. Jakarta3. Surabaya4. Java Sea5. Timor Sea or Arafura Sea6. Yes7. To measure distance between places8. Aeroplane or ship/boat
Indonesia’s main islands and cities
Source: http://www.travelforum.se/images/countries/ID/illustrations/oversiktskarta-over-indonesien.jpg
GeoactivitiesOn the map (left) Indonesia is shaded green and the main islands are labelled in red.
1. Name five islands in Indonesia. Note Sumatera is generally spelt Sumatra.
2. On what islands are the following cities located: a. Denpasar, and b. Jakarta?
map of indonesia locating islands
N
A
B
C
D
E
F
G
Source: http://commons.wikimedia.org/wiki/File:Indonesia_provinces_blank_map.svgGeoactivitiesRefer to the map above and label the following Indonesian Islands and Australia
1. A ……………………………………….........................................2. B ……………………………………….........................................3. C ……………………………………….........................................4. D ……………………………………….........................................
5. E ……………………………………….........................................6. F ……………………………………….........................................7. G ……………………………………….........................................8. Explain why Australia and Indonesia are called
neighbours
Detail from an 1897 English guide map to Surabaya. Source: Wikimedia Commons
© ASIA Volume 42 Number 2 9
inDonEsia – austRalian GEoGRaPhY cuRRiculum
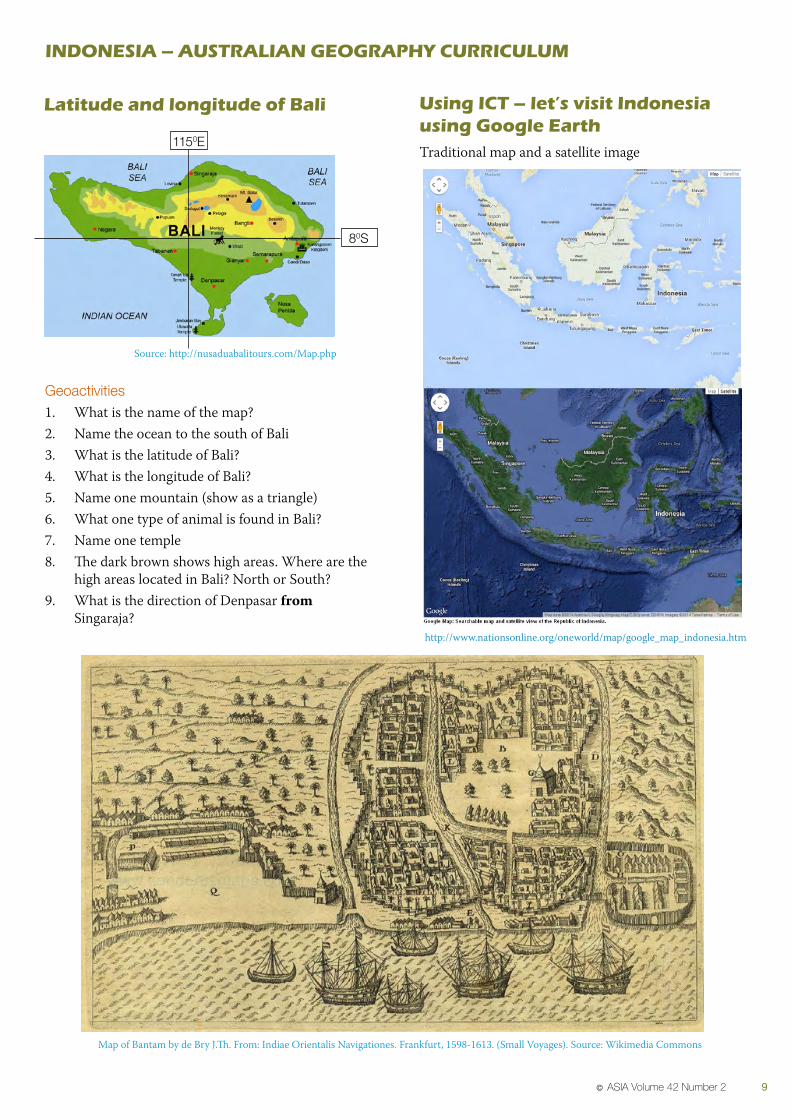
latitude and longitude of bali
80S
1150E
Source: http://nusaduabalitours.com/Map.php
Geoactivities1. What is the name of the map? 2. Name the ocean to the south of Bali 3. What is the latitude of Bali? 4. What is the longitude of Bali? 5. Name one mountain (show as a triangle) 6. What one type of animal is found in Bali? 7. Name one temple8. The dark brown shows high areas. Where are the
high areas located in Bali? North or South? 9. What is the direction of Denpasar from
Singaraja?
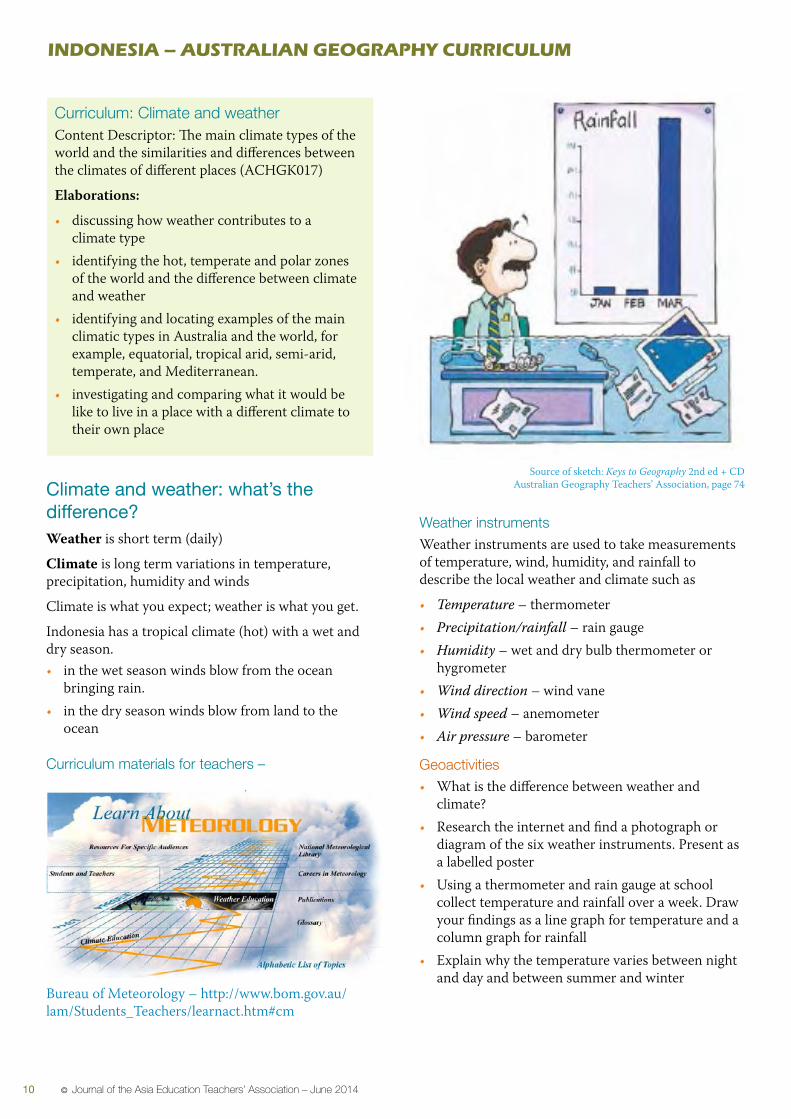
using ict – let’s visit indonesia using Google EarthTraditional map and a satellite image
http://www.nationsonline.org/oneworld/map/google_map_indonesia.htm
Map of Bantam by de Bry J.Th. From: Indiae Orientalis Navigationes. Frankfurt, 1598-1613. (Small Voyages). Source: Wikimedia Commons
10 © Journal of the Asia Education Teachers’ Association – June 2014
inDonEsia – austRalian GEoGRaPhY cuRRiculum
Curriculum: Climate and weatherContent Descriptor: The main climate types of the world and the similarities and differences between the climates of different places (ACHGK017)
Elaborations:
• discussing how weather contributes to a climate type
• identifying the hot, temperate and polar zones of the world and the difference between climate and weather
• identifying and locating examples of the main climatic types in Australia and the world, for example, equatorial, tropical arid, semi-arid, temperate, and Mediterranean.
• investigating and comparing what it would be like to live in a place with a different climate to their own place
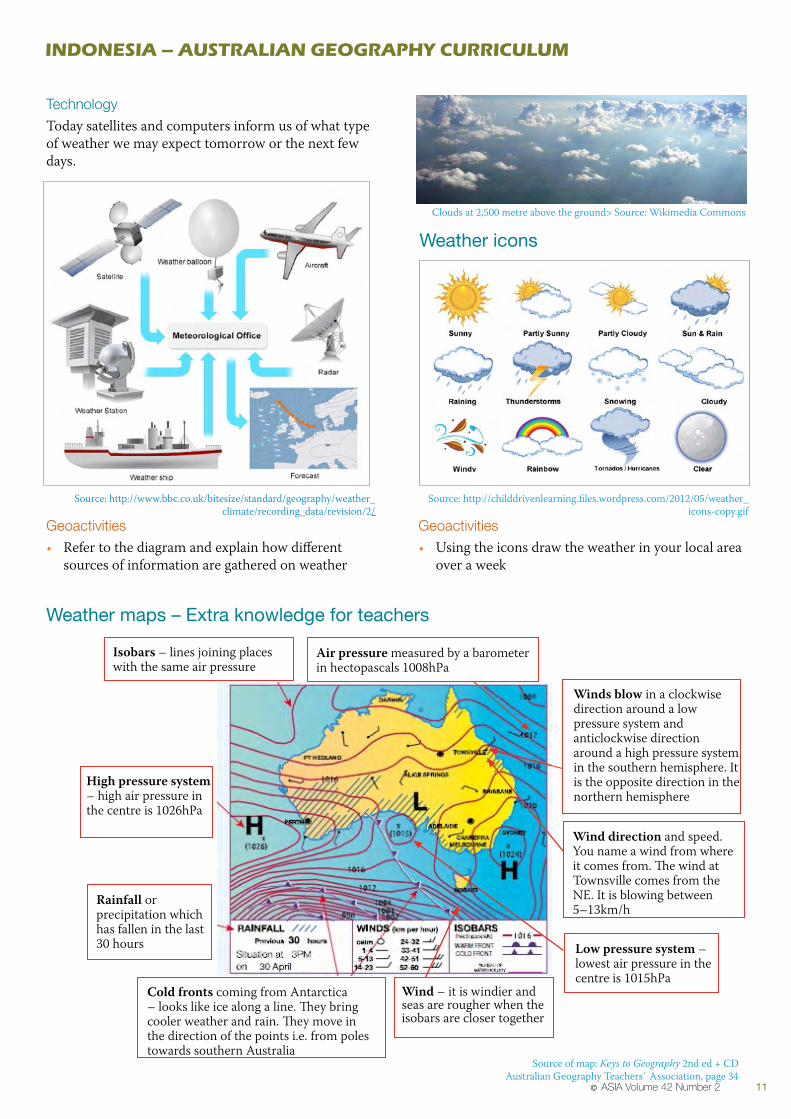
Source of sketch: Keys to Geography 2nd ed + CD Australian Geography Teachers’ Association, page 74Climate and weather: what’s the
difference?Weather is short term (daily)
Climate is long term variations in temperature, precipitation, humidity and winds
Climate is what you expect; weather is what you get.
Indonesia has a tropical climate (hot) with a wet and dry season. • in the wet season winds blow from the ocean
bringing rain. • in the dry season winds blow from land to the
ocean
Curriculum materials for teachers –
Weather instruments Weather instruments are used to take measurements of temperature, wind, humidity, and rainfall to describe the local weather and climate such as
• Temperature – thermometer• Precipitation/rainfall – rain gauge • Humidity – wet and dry bulb thermometer or
hygrometer• Wind direction – wind vane• Wind speed – anemometer• Air pressure – barometer
Geoactivities• What is the difference between weather and
climate?• Research the internet and find a photograph or
diagram of the six weather instruments. Present as a labelled poster
• Using a thermometer and rain gauge at school collect temperature and rainfall over a week. Draw your findings as a line graph for temperature and a column graph for rainfall
• Explain why the temperature varies between night and day and between summer and winter
Bureau of Meteorology – http://www.bom.gov.au/lam/Students_Teachers/learnact.htm#cm
© ASIA Volume 42 Number 2 11
TechnologyToday satellites and computers inform us of what type of weather we may expect tomorrow or the next few days.
inDonEsia – austRalian GEoGRaPhY cuRRiculum
Source: http://www.bbc.co.uk/bitesize/standard/geography/weather_climate/recording_data/revision/2/
Geoactivities• Refer to the diagram and explain how different
sources of information are gathered on weather
Source: http://childdrivenlearning.files.wordpress.com/2012/05/weather_icons-copy.gif
Geoactivities• Using the icons draw the weather in your local area
over a week
Weather maps – Extra knowledge for teachers
Weather icons
Clouds at 2,500 metre above the ground> Source: Wikimedia Commons
Source of map: Keys to Geography 2nd ed + CD Australian Geography Teachers` Association, page 34
Winds blow in a clockwise direction around a low pressure system and anticlockwise direction around a high pressure system in the southern hemisphere. It is the opposite direction in the northern hemisphere
Isobars – lines joining places with the same air pressure
Air pressure measured by a barometer in hectopascals 1008hPa
Wind direction and speed. You name a wind from where it comes from. The wind at Townsville comes from the NE. It is blowing between 5–13km/h
Rainfall or precipitation which has fallen in the last 30 hours Low pressure system –
lowest air pressure in the centre is 1015hPa
Cold fronts coming from Antarctica – looks like ice along a line. They bring cooler weather and rain. They move in the direction of the points i.e. from poles towards southern Australia
Wind – it is windier and seas are rougher when the isobars are closer together
High pressure system – high air pressure in the centre is 1026hPa

12 © Journal of the Asia Education Teachers’ Association – June 2014
inDonEsia – austRalian GEoGRaPhY cuRRiculum
Geoactivities• Using the newspaper or the internet collect a
weather map over the last week• What information do weather maps provide?• Why are weather maps important to people,
farmers and tourist resorts?
Lowest and highest temperature for one day across Australia*
Source: http://resources1.news.com.au/images/2012/08/28/1226459/941877-channel-7-weather-map.jpg
* These figures are in degrees centigrade (oC) e.g. Brisbane 23oC
Geoactivities• Where is the highest temperature on the map?
What part of Australia?• Where is the lowest temperature on the map? What
part of Australia?• Where is it raining?• What is the difference between the highest and
lowest temperature in:ù Sydneyù Darwinù Hobartù Canberra
• Using a mobile phone, the internet or the newspaper describe the weather in your local area or nearby city on one day.
• Explain why weather forecasting is important.• Why do you think weather forecasting is a difficult
job?
Indonesian weather map – 12 February 2014
Source: http://www.weather-forecast.com/maps/Indonesia
Geoactivities• What is the date of this map?• List four different maps on weather
* Purple areas are cloudsSource: http://www.accuweather.com/en/id/national/satellite
Indonesian satellite image of weather on the 12 February 2014*
© ASIA Volume 42 Number 2 13
inDonEsia – austRalian GEoGRaPhY cuRRiculum
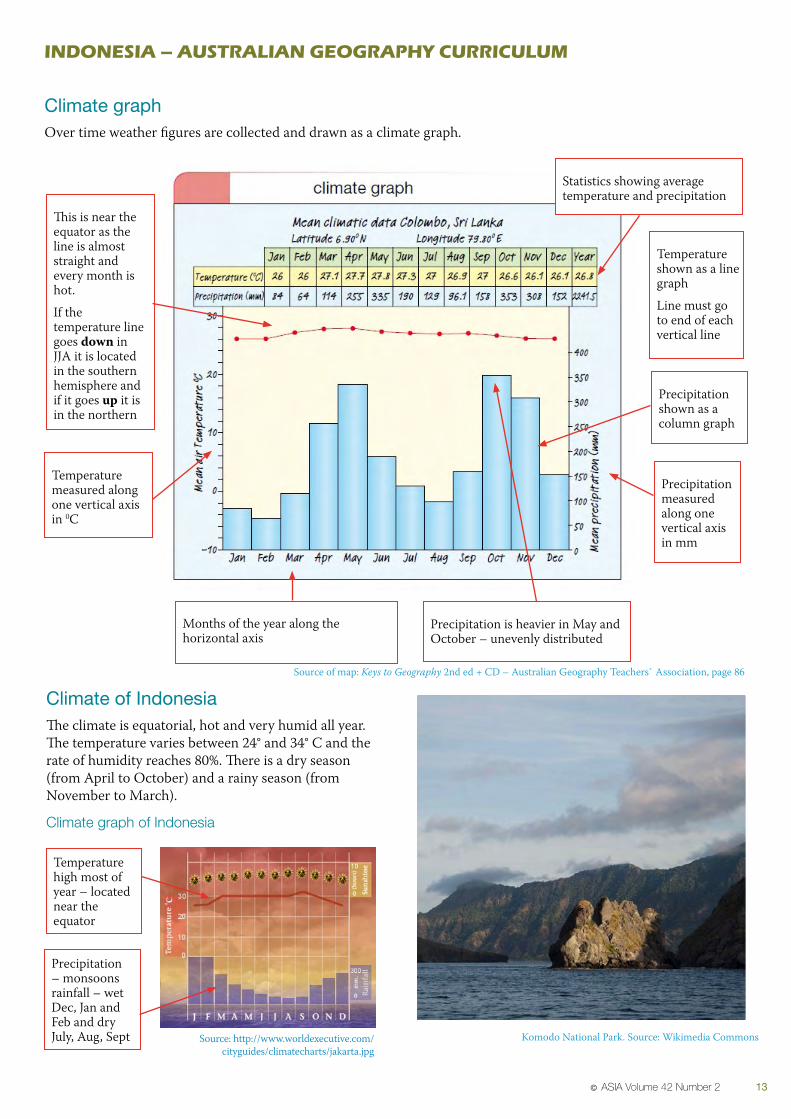
Climate graphOver time weather figures are collected and drawn as a climate graph.
Source of map: Keys to Geography 2nd ed + CD – Australian Geography Teachers` Association, page 86
This is near the equator as the line is almost straight and every month is hot.
If the temperature line goes down in JJA it is located in the southern hemisphere and if it goes up it is in the northern
Statistics showing average temperature and precipitation
Temperature shown as a line graph
Line must go to end of each vertical line
Precipitation shown as a column graph
Precipitation measured along one vertical axis in mm
Temperature measured along one vertical axis in 0C
Precipitation is heavier in May and October – unevenly distributed
Months of the year along the horizontal axis
Climate of IndonesiaThe climate is equatorial, hot and very humid all year. The temperature varies between 24° and 34° C and the rate of humidity reaches 80%. There is a dry season (from April to October) and a rainy season (from November to March).
Climate graph of Indonesia
Precipitation – monsoons rainfall – wet Dec, Jan and Feb and dry July, Aug, Sept
Temperature high most of year – located near the equator
Source: http://www.worldexecutive.com/cityguides/climatecharts/jakarta.jpg
Komodo National Park. Source: Wikimedia Commons

14 © Journal of the Asia Education Teachers’ Association – June 2014
inDonEsia – austRalian GEoGRaPhY cuRRiculum
Climate regions and graphs for AustraliaConnect the red line January and December temperature readings at both sides of the Y-axis for all the graphs..
Source: Macmillan Global Atlas, 3rd edition, p. 13 GeoWorld- Macmillan. Editor Susan Bliss
If the temperature line is lower during the middle months of the year (e.g June, July, August) the place is located in the southern hemisphere. If it is fairly high and even all year it is located near the equator
Geoactivities• When does Darwin receive most of its rain?• When does Perth receive most of its rain?• Why do you think there is little rain in Alice Springs?
ICTWorld climate – http://www.worldclimate.com/ WorldClimate.com contains over 85,000 records of world climate data (historical weather averages) from a wide range of sources.
Uluru, Central Dessert of Australia Cumulus stratus clouds and a raibow. Source: Wikimedia Commons
Cloud formations from Mt Kosiuszko, NSW Source: Wikimedia Commons
© ASIA Volume 42 Number 2 15
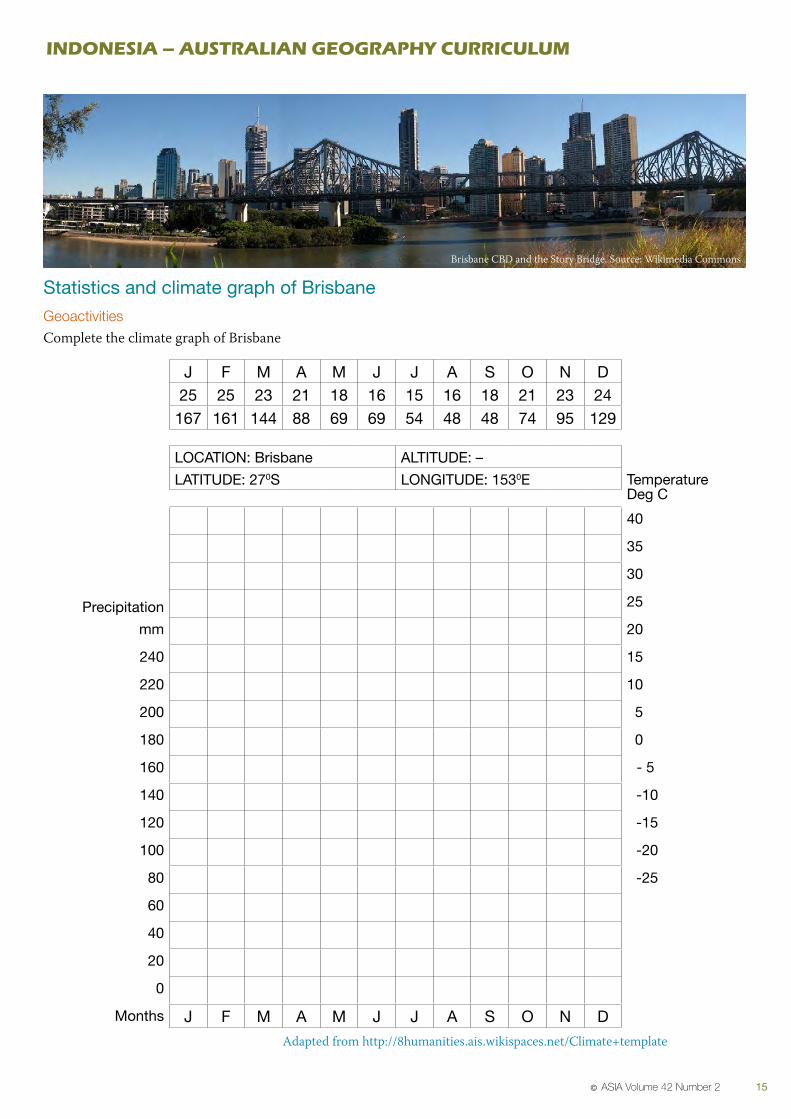
Statistics and climate graph of Brisbane
Geoactivities Complete the climate graph of Brisbane
inDonEsia – austRalian GEoGRaPhY cuRRiculum
J F M A M J J A S O N D25 25 23 21 18 16 15 16 18 21 23 24
167 161 144 88 69 69 54 48 48 74 95 129
LOCATION: Brisbane ALTITUDE: –
LATITUDE: 270S LONGITUDE: 1530E
40
35
30
Precipitation 25
mm 20
240 15
220 10
200 5
180 0
160 - 5
140 -10
120 -15
100 -20
80 -25
60
40
20
0
Months J F M A M J J A S O N D
Temperature Deg C
Adapted from http://8humanities.ais.wikispaces.net/Climate+template
Brisbane CBD and the Story Bridge. Source: Wikimedia Commons
16 © Journal of the Asia Education Teachers’ Association – June 2014
inDonEsia – austRalian GEoGRaPhY cuRRiculum
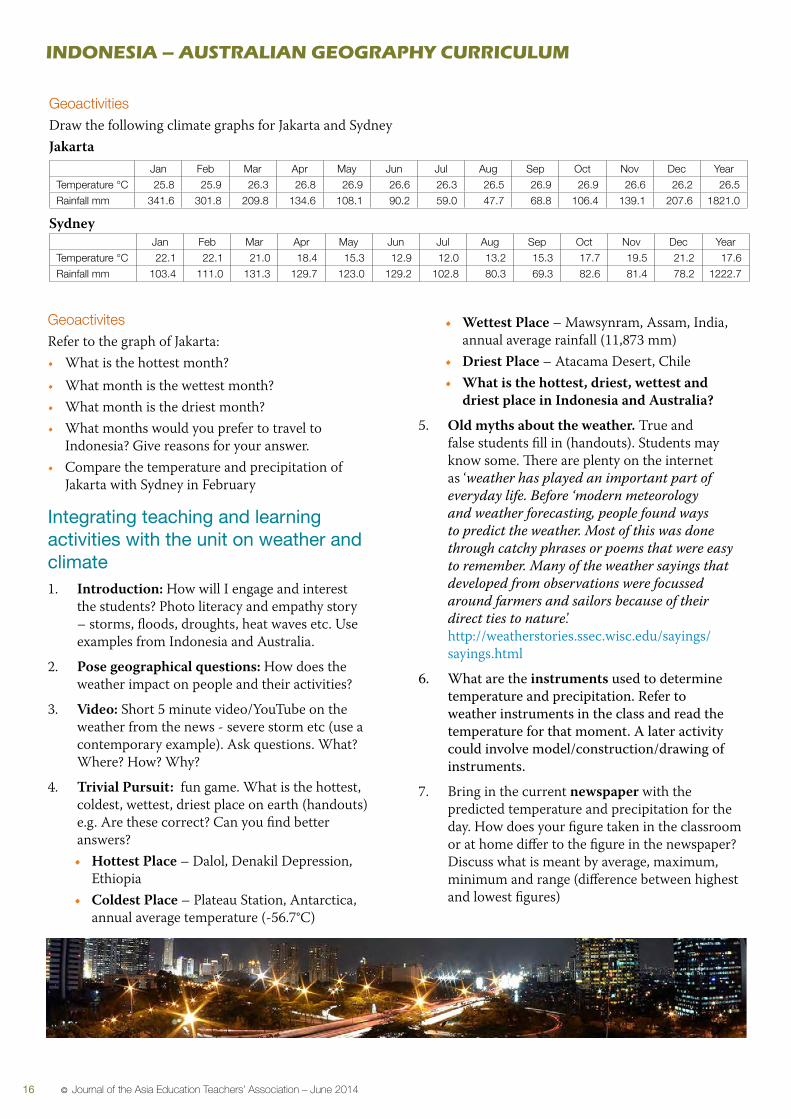
GeoactivitiesDraw the following climate graphs for Jakarta and SydneyJakarta
Jan Feb Mar Apr May Jun Jul Aug Sep Oct Nov Dec Year
Temperature °C 25.8 25.9 26.3 26.8 26.9 26.6 26.3 26.5 26.9 26.9 26.6 26.2 26.5
Rainfall mm 341.6 301.8 209.8 134.6 108.1 90.2 59.0 47.7 68.8 106.4 139.1 207.6 1821.0
Sydney Jan Feb Mar Apr May Jun Jul Aug Sep Oct Nov Dec Year
Temperature °C 22.1 22.1 21.0 18.4 15.3 12.9 12.0 13.2 15.3 17.7 19.5 21.2 17.6
Rainfall mm 103.4 111.0 131.3 129.7 123.0 129.2 102.8 80.3 69.3 82.6 81.4 78.2 1222.7
GeoactivitesRefer to the graph of Jakarta:• What is the hottest month?• What month is the wettest month? • What month is the driest month? • What months would you prefer to travel to
Indonesia? Give reasons for your answer.• Compare the temperature and precipitation of
Jakarta with Sydney in February
Integrating teaching and learning activities with the unit on weather and climate1. Introduction: How will I engage and interest
the students? Photo literacy and empathy story – storms, floods, droughts, heat waves etc. Use examples from Indonesia and Australia.
2. Pose geographical questions: How does the weather impact on people and their activities?
3. Video: Short 5 minute video/YouTube on the weather from the news - severe storm etc (use a contemporary example). Ask questions. What? Where? How? Why?
4. Trivial Pursuit: fun game. What is the hottest, coldest, wettest, driest place on earth (handouts) e.g. Are these correct? Can you find better answers?• Hottest Place – Dalol, Denakil Depression,
Ethiopia• Coldest Place – Plateau Station, Antarctica,
annual average temperature (-56.7°C)
• Wettest Place – Mawsynram, Assam, India, annual average rainfall (11,873 mm)
• Driest Place – Atacama Desert, Chile• What is the hottest, driest, wettest and
driest place in Indonesia and Australia?
5. Old myths about the weather. True and false students fill in (handouts). Students may know some. There are plenty on the internet as ‘weather has played an important part of everyday life. Before ‘modern meteorology and weather forecasting, people found ways to predict the weather. Most of this was done through catchy phrases or poems that were easy to remember. Many of the weather sayings that developed from observations were focussed around farmers and sailors because of their direct ties to nature.’ http://weatherstories.ssec.wisc.edu/sayings/sayings.html
6. Whataretheinstrumentsusedtodeterminetemperatureandprecipitation.Refertoweatherinstrumentsintheclassandreadthetemperatureforthatmoment.Alateractivitycouldinvolvemodel/construction/drawingofinstruments.
7. Bring in the current newspaper with the predicted temperature and precipitation for the day. How does your figure taken in the classroom or at home differ to the figure in the newspaper? Discuss what is meant by average, maximum, minimum and range (difference between highest and lowest figures)
© ASIA Volume 42 Number 2 17
inDonEsia – austRalian GEoGRaPhY cuRRiculum
8. Ask key geographical questions: Why it is necessary to know the temperature and precipitation of a place? – relate to holidays (like snow for skiing), high temperature (swimming), wind (sailing), picnics, sporting activities and jobs (farming)
9. How did the newspapers and TV get this information? e.g. weather stations, Bureau of Meteorology, satellite
10. Knowledge: Explain the difference between weather (daily) and climate (long term)
11. Students complete a climate graph following instructions. Pencils, rubber, ruler, red pen and black/blue pena. Explain axis, temperature line graphs (dot in
middle of month) and precipitation (column graph)
b. Move around room. Positive reinforcement. Helps determine those who require help.
c. When finished ink in details
12. Group work: Give each group a climate graph of a place in Indonesia and Australia. (co-operative learning) Address the following questions:
a. What would you wear to this place in different months?
b. What activities or problems of visiting this country at various times of the year?
c. Link graph to the tourism industry – When would you visit this place and why? e.g. Why is it cheaper to be a tourist at a ski resort in summer or a surfer at a coastal area in winter? Provide reasons
d. Conclusion: Students present conclusions from group discussion to the class either orally, written, photographs, web page etc
13. Homework: Literacy:Describeaclimategraph–putitintowords!!!!
Other student centred activities: Role play a flood in Indonesia or a drought in Australia
Teachers – Geolinks
World climate – http://www.climate-charts.com/
Interactive climate map – http://www.uwsp.edu/geo/faculty/ritter/interactive_climate_map/climate_map.html
Climate graphs for Australia – http://www.bom.gov.au/cgi-bin/climate/cgi_bin_scripts/map_script_new.cgi?14903
Satellite images – weather maps Australia – http://www.bom.gov.au/weather/satellite/
Weather maps Australia – http://www.bom.gov.au/
How to Make a Climograph – http://www.youtube.com/watch?feature=endscreen&NR=1&v=YploPyRff-Y
Drawing climate graphs – http://www.youtube.com/watch?v=t8vAe4HcbAA
National Geographic climate graph template – http://images.nationalgeographic.com/wpf/media-live/file/getting-geographic-climate-graph-template-cb1288472856.pdf
Interactive climate map – http://www4.uwsp.edu/geO/faculty/ritter/interactive_climate_map/climate_map.html
Interactive world climate map and graphs – http://www.geoknow.net/pages/climategraphs.html
Weather instruments
Weather kit – http://www.bom.gov.au/info/weatherkit/section2/barom2.shtml
How to make a weather station – http://www.bom.gov.au/info/weatherkit/section4/station.shtml
Build your own weather instruments – Multiple Intelligences – http://www.miamisci.org/hurricane/rainmeasure.html
Weather crossword – http://www.bom.gov.au/info/weatherkit/section3/cross.shtml
Red sunset. Source: Wikimedia Commons