Embed Size (px)
Citation preview
ed-CK / sa- MA, PY
Tiptoeing through a recovery
Commodity price and lagged impact of policy
loosening to sustain recovery traction in 2017
We see downside risk to staples’ earnings as raw
material price increases
Retailers’ PE discount to staples at historical low;
time for bargain hunting?
Maintain INDF as top pick; upgrade MAPI to BUY
On the path of gradual recovery. Demand recovery has remained nascent to date but with commodity prices having turned the corner, the purchasing power of consumers, particularly those residing outside Java, should improve. In addition, we think the impact from the policy loosening measures in 2016 is likely to be seen this year. Two key themes that we highlight in this report are: 1) rising soft commodity prices and the impact on consumer staples companies, and 2) retailers’ valuation which appears to have priced in the current economic cycle and risk of structural shift from one retail channel to another. Rising soft commodity prices pose downside risk to
consumer staples’ earnings. Consumer staples’ margin will likely shrink as raw material prices have started to rise. We expect the sector’s earnings growth to decelerate this year, hence, we advise investors to avoid companies that trade at a lofty valuation such as UNVR. We prefer cheaper names with dominant market share in key products, which should translate to a better flexibility in passing on higher raw material costs to consumers. For this reason, we maintain INDF as our top pick. Retailers trade near historical low multiples; focus on
company-specific factors. Retailers’ current valuation appears to have priced in the weak economy, trading at a significant PE discount to staples companies. However, as discretionary spending has yet to show signs of bottoming, we advise investors to put more focus on company-specific drivers. We upgrade MAPI to BUY as we believe the company will continue to reap rewards from its restructuring efforts that started three years ago. This upper-middle retailer also benefits from a weaker euro as 24% of its COGS are linked to the euro. We maintain our FULLY VALUED call on MPPA as we believe the market’s earnings expectation for the company is too high. It now trades at a high multiple of 39x PE FY17F vs. regional supermarkets which trade at 22x PE FY17F on average, making it prone to a de-rating if the company fails to deliver.
JCI : 5,361.10
Analyst Tiesha PUTRI +6221 30034931 [email protected] Andy SIM CFA +65 6682 3718
STOCKS
Source: DBS Vickers, DBS Bank, Bloomberg Finance L.P. Closing price as of 8 Feb 2017 Unilever Indonesia : PT Unilever Indonesia Tbk manufactures soaps, detergents, margarine, oil, and dairy based foods, tea based beverages, ice cream, and cosmetics. Indofood CBP Sukses Makmur : ICBP is a leading branded consumer products company in Indonesia with products comprising noodles, dairy, snack foods, food seasonings, nutrition & special foods, biscuits, and beverages. Indofood Sukses Makmur : Indofood Sukses Makmur is a Total Food Solutions company with operations spanning from the production of raw materials and their processing, to consumer products. Mayora Indah : PT Mayora Indah Tbk manufactures candies and cookies, as well as food, coffee powder, instant coffee, and cocoa beans. Matahari Department Store : PT Matahari Department Store Tbk engages in the retail business for several types of products such as clothes, accessories, bags, shoes, cosmetics, and household appliances. Matahari Putra Prima : Matahari Putra Prima Tbk is a mass grocery retail store operator in Indonesia. Its store formats include hypermarts under the name "Hypermart", medium-sized stores under the name "Foodmart", as well as a health and beauty store concept under the name Mitra Adiperkasa : Mitra Adiperkasa operates department stores and specialty stores selling a broad range of goods including clothing, toys, food, and other merchandises.
DBS Group Research . Equity 9 Feb 2017
Indonesia Industry Focus
Indonesia Consumer
Refer to important disclosures at the end of this report
12-mth
Price Mkt Cap Target Price Performance (%)
Rp US$m Rp 3 mth 12 mth Rating
Unilever Indonesia 41,725 23,874 36,200 (6.0) 2.8 FV
Indofood CBP Sukses Makmur
8,500 7,434 9,000 (10.1) 2.4 HOLD
Indofood Sukses Makmur
7,950 5,235 9,100 (3.1) 20.9 BUY
Mayora Indah 1,825 3,060 1,700 21.7 69.0 HOLD
Matahari Department Store 15,325 3,353 16,200 (8.2) (12.9) HOLD
Matahari Putra Prima 1,365 551 1,060 (20.2) (25.2) FV
Mitra Adiperkasa 5,425 675 6,600 (1.8) 50.7 BUY
Page 1
Industry Focus
Indonesia Consumer
Page 2
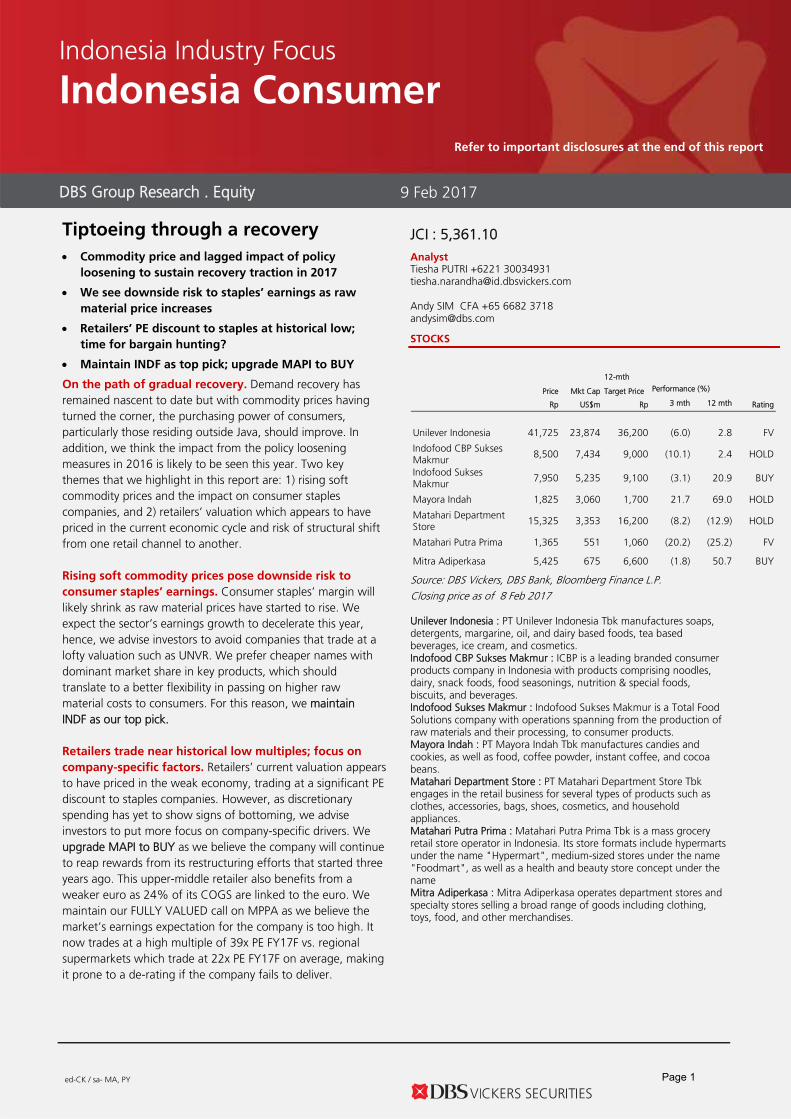
On a slow path of recovery As we have expected, consumption recovery has come very gradually to date. We have seen an encouraging improvement in staples’ sales volume in 2Q16-3Q16 (we merged the two quarters to eliminate the impact of a shift of Lebaran season), nevertheless consumers appear to spend only for primary needs. Minimarket’s average daily sales per store saw a strong pick-up in 1Q16, but the pace of growth somewhat slowed in 2Q16-3Q16, suggesting a nascent recovery. Discretionary spending has remained muted with retail sales growth still hovering at single-digit levels in Oct-Nov 2016. Listed retailers’ latest reported SSSG is mostly lower than that recorded in 1Q16. These data points are all reflected in GDP numbers. Household consumption growth was stable at c.5%. Nonetheless, discretionary spending has yet to show sign of bottoming, as shown in the subsequent chart. Discretionary household consumption
Source: Central Bureau of Statistics, DBS Vickers, DBS Bank Consumer companies’ sales growth trend
*UNVR, ICBP and MYOR’s domestic sales Source: Companies, DBS Vickers, DBS Bank
Minimarket’s average daily sales per store
*Based on Indomaret and Alfamart’s sales and store number Source: Companies, DBS Vickers, DBS Bank Retailers’ YTD SSSG trend
*Fiscal year ended in June Source: Companies, DBS Vickers, DBS Bank Ramayana (RALS) and Matahari Putra Prima’s (MPPA) SSSG was slower in 4Q16; Ace Hardware’s (ACES) SSSG has improved
Source: Companies, DBS Vickers, DBS Bank
5.5%
2.1%
6.0%
11.6% 12.1%8.9%
7.1%6.2%
4.6%
6.3%
0%
2%
4%
6%
8%
10%
12%
14%
1Q15 2Q15 + 3Q15 4Q15 1Q16 2Q16 + 3Q16
Staples* Retailers
11.1 13.0 12.9 12.1
13.4
-4%
-2%
0%
2%
4%
6%
8%
10%
0
2
4
6
8
10
12
14
16
1Q15 2Q15 + 3Q15 4Q15 1Q16 2Q16 + 3Q16
Avg. daily sales per store (Rp mn)* Growth y-o-y
-20%
-15%
-10%
-5%
0%
5%
10%
15%
20%
25%
30%
MPPA LPPF MAPI RALS ACES Parkson*
-2.9%
7.1%
0.7%
-4.5%
6.3%
1.4%
-6.0%
-4.0%
-2.0%
0.0%
2.0%
4.0%
6.0%
8.0%
MPPA RALS ACES
9M16 SSSG 12M16 SSSG
Page 2

Industry Focus
Indonesia Consumer
Page 3
Consumer tracker: data points reaffirm our view that
recovery momentum will sustain in 2017
Key commodity prices have reversed their downward trend. The low commodity prices in the past years have eroded consumer’s purchasing power, particularly those residing outside Java. We note that 33% and 7% of workforce are employed in the agriculture and construction sectors respectively. Rising soft commodity prices, particularly rubber, CPO, coffee and cocoa, along with an increase in infrastructure spending would help to raise household income, spur consumption and sustain the demand recovery momentum in 2017. Our recent check with plantation companies suggests that the key players are planning to hire more workers in 2017. Regional elections should also serve as a short-term boost to consumption. Three months campaign period will precede the voting day, which is scheduled to take place in mid-Feb 2017. Employment by sector
Source: Central Bureau of Statistics Indonesia’s key export commodities
Source: Bloomberg Finance L.P., DBS Vickers, DBS Bank Consumers turning more upbeat with confidence index above historical mean. Consumers have turned more upbeat with the consumer confidence index (CCI) consistently staying above its
5-year average through 4Q16. In Dec 2016, the CCI slid slightly to 115.4 from 115.9 in Nov 2016. Interestingly, the decline was mostly seen among low-income consumers with monthly expenditure of Rp1m-3m, while the confidence index of consumers with an income range of Rp3m-5m continued to improve. Bank Indonesia’s consumer confidence index
Source: Bank Indonesia But this has yet to be reflected in retail sales. The stronger consumer confidence has yet to translate to strong growth in the retail sales index (RSI). RSI growth moderated from the low-teens level (since Nov 2015) to 8%-10% in Oct-Dec 2016, in line with nominal GDP growth. Retail sales index
Source: Bank Indonesia Vehicle sales – positive read-through from motorcycle sales data. Motorcycle sales in 11M16 were still 8% lower y-o-y, while car sales held up relatively well with 4% growth y-o-y. However, we are encouraged to see a pick-up in monthly motorcycle sales in November which showed a positive growth of 7% y-o-y for the first time since Mar 2016, indicating that consumers have started to spend on bigger-ticket items.
Agriculture33%
Mining1%
Industrial13%
Construction7%
Trade23%
Others23%
-
20
40
60
80
100
120
140
Jan-11 Jan-12 Jan-13 Jan-14 Jan-15 Jan-16 Jan-17
2011 = 100
CPO Coffee Cocoa Rubber
-5.0
0.0
5.0
10.0
15.0
20.0
90
95
100
105
110
115
120
125
CCI 5-year avg. CCI AdministeredCPI y-o-y
0%
5%
10%
15%
20%
25%
30%
0
50
100
150
200
250
RSI index (2010=100) Growth y-o-y (RHS)
Page 3
Industry Focus
Indonesia Consumer
Page 4
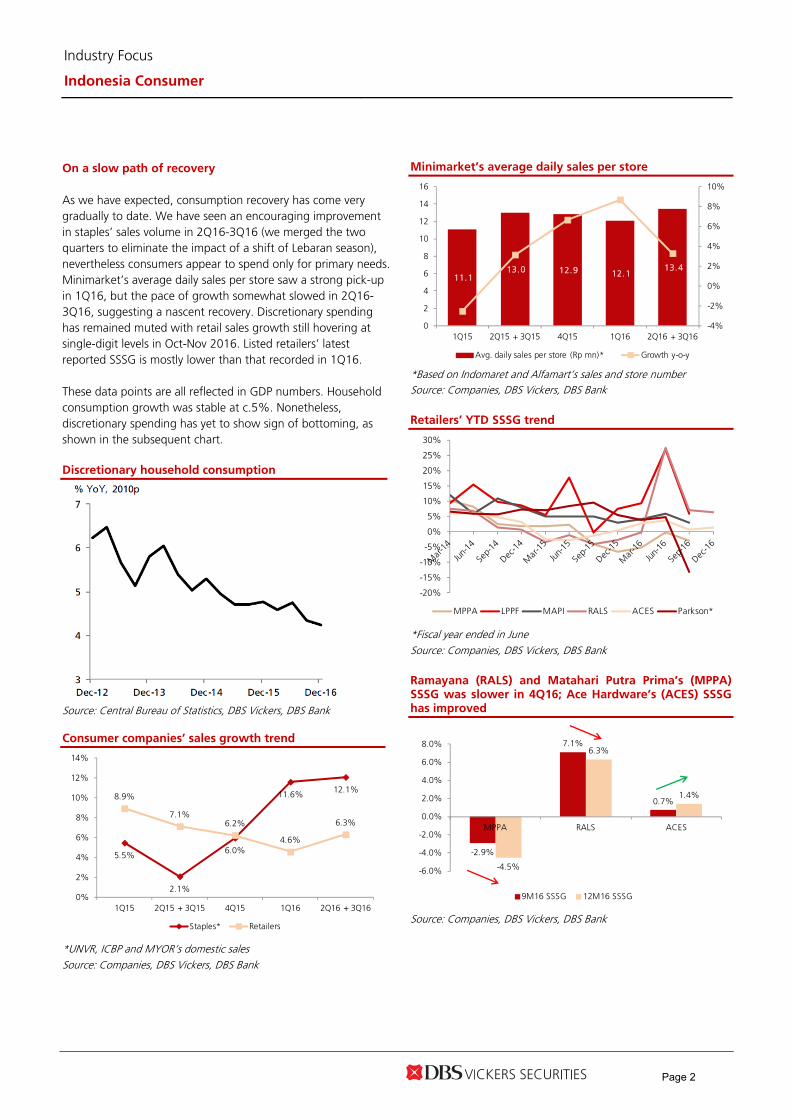
Motorcycle and car monthly sales growth
Source: Gaikindo Inflation creeps up but still within BI’s comfortable range. Our economist expects headline inflation to rise and average 4.5% in 2017. Headline inflation has consistently picked up since Sep 2016.We expect higher oil prices to push housing, transport and food inflation components higher in 2017. These combined three components make up 80% of the CPI basket. Nevertheless, we expect inflation to remain manageable and within the BI’s (Bank Indonesia) comfortable range. Downside risk to our view would emerge if energy cost rise higher than our expectation, given the limited energy subsidy budget. Headline, food and administered CPI trend
Source: Central Bureau of Statistics
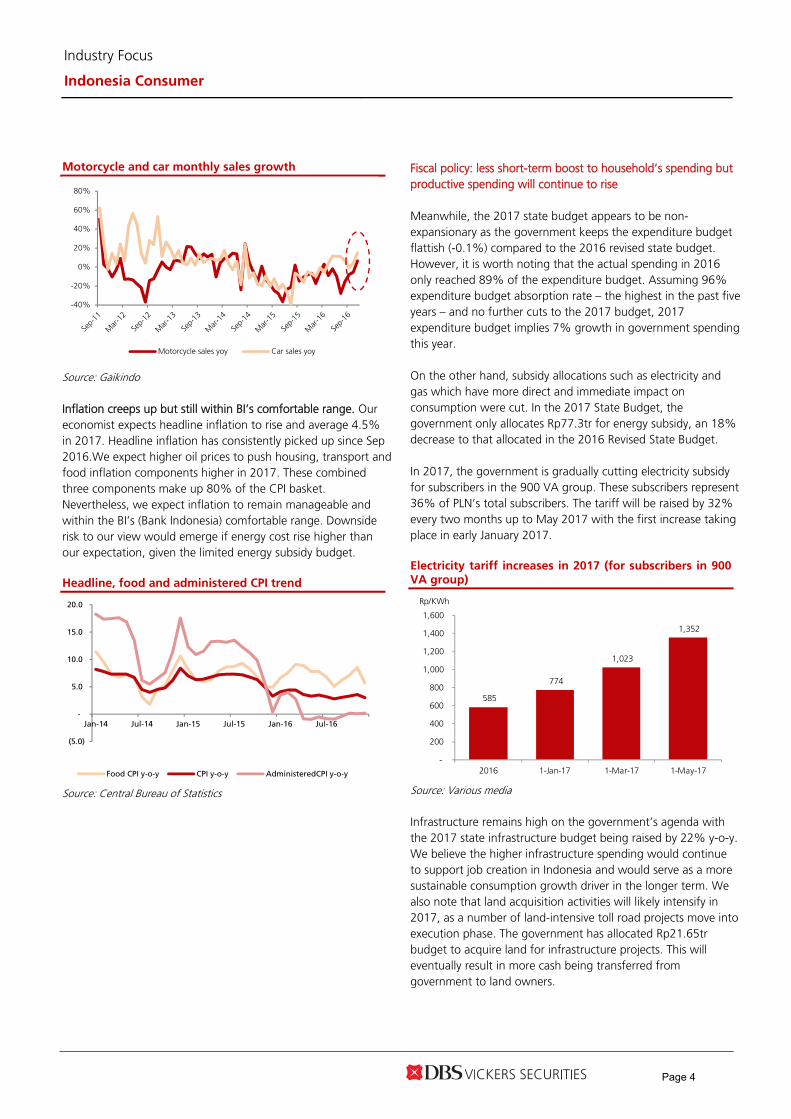
Fiscal policy: less short-term boost to household’s spending but productive spending will continue to rise Meanwhile, the 2017 state budget appears to be non-expansionary as the government keeps the expenditure budget flattish (-0.1%) compared to the 2016 revised state budget. However, it is worth noting that the actual spending in 2016 only reached 89% of the expenditure budget. Assuming 96% expenditure budget absorption rate – the highest in the past five years – and no further cuts to the 2017 budget, 2017 expenditure budget implies 7% growth in government spending this year. On the other hand, subsidy allocations such as electricity and gas which have more direct and immediate impact on consumption were cut. In the 2017 State Budget, the government only allocates Rp77.3tr for energy subsidy, an 18% decrease to that allocated in the 2016 Revised State Budget. In 2017, the government is gradually cutting electricity subsidy for subscribers in the 900 VA group. These subscribers represent 36% of PLN’s total subscribers. The tariff will be raised by 32% every two months up to May 2017 with the first increase taking place in early January 2017. Electricity tariff increases in 2017 (for subscribers in 900 VA group)
Source: Various media Infrastructure remains high on the government’s agenda with the 2017 state infrastructure budget being raised by 22% y-o-y. We believe the higher infrastructure spending would continue to support job creation in Indonesia and would serve as a more sustainable consumption growth driver in the longer term. We also note that land acquisition activities will likely intensify in 2017, as a number of land-intensive toll road projects move into execution phase. The government has allocated Rp21.65tr budget to acquire land for infrastructure projects. This will eventually result in more cash being transferred from government to land owners.
-40%
-20%
0%
20%
40%
60%
80%
Motorcycle sales yoy Car sales yoy
(5.0)
-
5.0
10.0
15.0
20.0
Jan-14 Jul-14 Jan-15 Jul-15 Jan-16 Jul-16
Food CPI y-o-y CPI y-o-y AdministeredCPI y-o-y
585
774
1,023
1,352
-
200
400
600
800
1,000
1,200
1,400
1,600
2016 1-Jan-17 1-Mar-17 1-May-17
Rp/KWh
Page 4
Industry Focus
Indonesia Consumer
Page 5
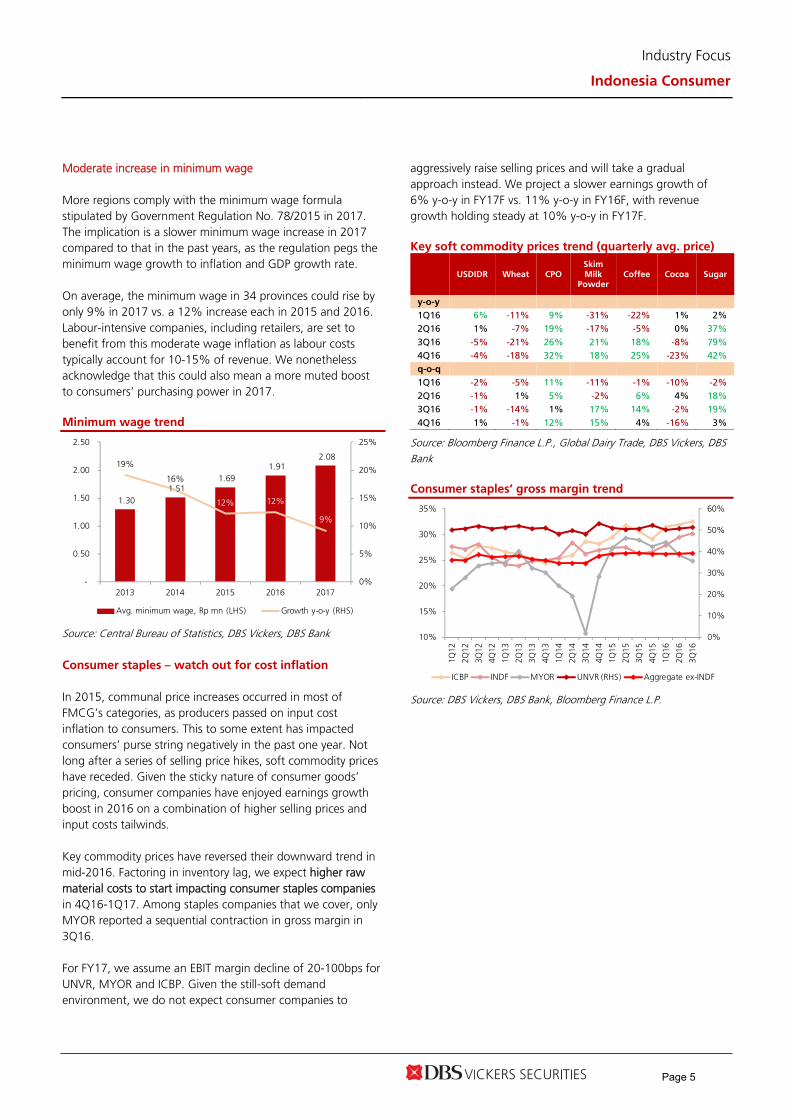
Moderate increase in minimum wage More regions comply with the minimum wage formula stipulated by Government Regulation No. 78/2015 in 2017. The implication is a slower minimum wage increase in 2017 compared to that in the past years, as the regulation pegs the minimum wage growth to inflation and GDP growth rate. On average, the minimum wage in 34 provinces could rise by only 9% in 2017 vs. a 12% increase each in 2015 and 2016. Labour-intensive companies, including retailers, are set to benefit from this moderate wage inflation as labour costs typically account for 10-15% of revenue. We nonetheless acknowledge that this could also mean a more muted boost to consumers’ purchasing power in 2017. Minimum wage trend
Source: Central Bureau of Statistics, DBS Vickers, DBS Bank Consumer staples – watch out for cost inflation
In 2015, communal price increases occurred in most of FMCG’s categories, as producers passed on input cost inflation to consumers. This to some extent has impacted consumers’ purse string negatively in the past one year. Not long after a series of selling price hikes, soft commodity prices have receded. Given the sticky nature of consumer goods’ pricing, consumer companies have enjoyed earnings growth boost in 2016 on a combination of higher selling prices and input costs tailwinds. Key commodity prices have reversed their downward trend in mid-2016. Factoring in inventory lag, we expect higher raw material costs to start impacting consumer staples companies in 4Q16-1Q17. Among staples companies that we cover, only MYOR reported a sequential contraction in gross margin in 3Q16. For FY17, we assume an EBIT margin decline of 20-100bps for UNVR, MYOR and ICBP. Given the still-soft demand environment, we do not expect consumer companies to
aggressively raise selling prices and will take a gradual approach instead. We project a slower earnings growth of 6% y-o-y in FY17F vs. 11% y-o-y in FY16F, with revenue growth holding steady at 10% y-o-y in FY17F. Key soft commodity prices trend (quarterly avg. price)
USDIDR Wheat CPO Skim Milk
Powder Coffee Cocoa Sugar
y-o-y
1Q16 6% -11% 9% -31% -22% 1% 2%
2Q16 1% -7% 19% -17% -5% 0% 37%
3Q16 -5% -21% 26% 21% 18% -8% 79%
4Q16 -4% -18% 32% 18% 25% -23% 42%
q-o-q
1Q16 -2% -5% 11% -11% -1% -10% -2%
2Q16 -1% 1% 5% -2% 6% 4% 18%
3Q16 -1% -14% 1% 17% 14% -2% 19%
4Q16 1% -1% 12% 15% 4% -16% 3%
Source: Bloomberg Finance L.P., Global Dairy Trade, DBS Vickers, DBS Bank
Consumer staples’ gross margin trend
Source: DBS Vickers, DBS Bank, Bloomberg Finance L.P.
1.30 1.51
1.69 1.91
2.08 19%
16%
12% 12%
9%
0%
5%
10%
15%
20%
25%
-
0.50
1.00
1.50
2.00
2.50
2013 2014 2015 2016 2017
Avg. minimum wage, Rp mn (LHS) Growth y-o-y (RHS)
0%
10%
20%
30%
40%
50%
60%
10%
15%
20%
25%
30%
35%
1Q12
2Q12
3Q12
4Q12
1Q13
2Q13
3Q13
4Q13
1Q14
2Q14
3Q14
4Q14
1Q15
2Q15
3Q15
4Q15
1Q16
2Q16
3Q16
ICBP INDF MYOR UNVR (RHS) Aggregate ex-INDF
Page 5

Industry Focus
Indonesia Consumer
Page 6
Consumer staples sector’s forward PE band
Source: DBS Vickers, DBS Bank, Bloomberg Finance L.P. Consumer staples companies’ PE valuation range in the past five years
Source: DBS Vickers, DBS Bank, Bloomberg Finance L.P.
Retailers – is it time for bargain-hunting?
We believe the retail sector warrants a re-look as some names trade below their historical mean valuation. Broad-based sector re-rating is possible if we see signs of firmer demand recovery. Retailers’ PE discount over staples has widened in the past two years, reflecting where we are in the economic cycle. On top of the cyclicality factor, the risk of structural shifts from one retail channel to another – from brick and mortar to e-commerce retailing and from supermarkets or hypermarkets to minimarkets – has also contributed to the sector de-rating. Among our coverage, LPPF now trades at 2.5SD below its historical mean PE. We believe this is partly due to concerns over potential higher capex in the future as the company works its way to be a leading omni-channel retailer in Indonesia. Meanwhile, MPPA saw its sales slowing down on the back of a slow demand environment, which prompted its customers to cut down spending on discretionary items such as electronics and clothes. Tightening competition among retail channels has also impacted MPPA’s sales negatively. Competition risk has yet to abate as the two largest minimarket chains, Indomaret and Alfamart (AMRT), are still
expanding aggressively. Both companies on average opened eight new minimarkets per day in the past three years. In 2017, Indomaret and Alfamart have announced its plan to open 1,600 and 1,400 new stores respectively. The combined store opening target of 3,000 is a tad higher than last year’s target of 2,990 stores. Excluding MPPA, we think the downside risks to retailers’ earnings and share price are lower compared to those of staples. It is worth highlighting that over the past one year, retailers have coped well with the economic slowdown. Inventory trend has remained healthy with no sign of a build-up despite the slowing sales growth (refer to the subsequent chart). Should the pace of demand recovery remain slow in 2017, the healthy inventory level would keep the risk of margin compression low, in our view. Retailers’ revenue and inventory growth trend*
*LPPF and MAPI. We excluded MPPA as the company changed its inventory measurement method in 3Q16. Source: Companies, DBS Vickers, DBS Bank Retailers’ gross margin trend (trailing 12-month)
Source: Companies, DBS Vickers, DBS Bank
20
25
30
35
40
45
50
+2sd
+1sd
‐1sd
‐2sd
Avg.
5
15
25
35
45
55
65
75
85
95
ICBP INDF UNVR MYOR Staples
-
1,000
2,000
3,000
4,000
5,000
6,000
-20%
-10%
0%
10%
20%
30%
40%
50%
60%
4Q11 2Q12 4Q12 2Q13 4Q13 2Q14 4Q14 2Q15 4Q15 2Q16
Inventory, Rp bn (RHS) T12M revenue growth y-o-y (LHS)
Inventory growth y-o-y (LHS)
15%
15%
16%
16%
17%
17%
18%
18%
35%
40%
45%
50%
55%
60%
65%
70%
4Q11
1Q12
2Q12
3Q12
4Q12
1Q13
2Q13
3Q13
4Q13
1Q14
2Q14
3Q14
4Q14
1Q15
2Q15
3Q15
4Q15
1Q16
2Q16
3Q16
LPPF (LHS) MAPI (LHS) Aggregate (LHS) MPPA (RHS)
Page 6

Industry Focus
Indonesia Consumer
Page 7
Retailers’ PE valuation range in the past five years
Source: DBS Vickers, DBS Bank, Bloomberg Finance L.P.
Retailers’ PE relative to consumer staples companies
Source: DBS Vickers, DBS Bank, Bloomberg Finance L.P.
What consensus is expecting?
For staples (ICBP, UNVR, MYOR), consensus is expecting 13% and 12% y-o-y net profit growth in FY16 and FY17, respectively, vs. 12% y-o-y growth in FY15A. Expectation appears to be high for staples. With no growth slowdown expected in 2017, the numbers suggest that consensus has assumed either one of these scenarios or the combination of the two to play out in FY17: a) costs are going to be stable or some cost efficiency measures would be rolled out to offset the impact of commodity prices or imported inflation; or, b) consumer staples companies would be able to successfully pass through cost inflation through price increases. The inability to fully pass on cost inflation through price hikes presents downside risk to our and consensus’ earnings forecasts. Meanwhile, retailers are expected to see a strong pick-up in earnings growth in 2016 and 2017. Consensus currently expects 21% y-o-y net profit growth in FY16 and 25% y-o-y in FY17 – an upturn after a 2% decline in net profit in FY15A.
Staples – DBS’ net profit forecast relative to consensus
Source: Bloomberg Finance L.P., DBS Vickers, DBS Bank Retailers – DBS’ net profit forecast relative to consensus
Source: Bloomberg Finance L.P., DBS Vickers, DBS Bank
Staples – consensus’ earnings revision in the past three months
Source: Bloomberg Finance L.P., DBS Vickers, DBS Bank
5
55
105
155
205
255
305
MAPI LPPF MPPA Retailers
5
15
25
35
45
55
65
+2sd
+1sd
‐1sd
‐2sd
Avg.
0.98
1.01
0.97
1.01
0.98
1.03
0.96
0.92 0.92
0.95
INDF ICBP UNVR MYOR Staples
Net profit FY16F Net profit FY17F
0.98 1.00
0.86
0.98 0.98 0.96 0.94
0.74
0.94 0.96
LPPF MAPI MPPA Retailers Retailers ex-MPPA
Net profit FY16F Net profit FY17F
-0.2% 0.0%
-0.5%
-0.3% -0.1%
-0.7% -0.8%
-2.0%
2.5%
-0.3%
-2.5%
-2.0%
-1.5%
-1.0%
-0.5%
0.0%
0.5%
1.0%
1.5%
2.0%
2.5%
3.0%
UNVR ICBP INDF MYOR Staples*
FY16F net profit FY17F net profit
Page 7
Industry Focus
Indonesia Consumer
Page 8
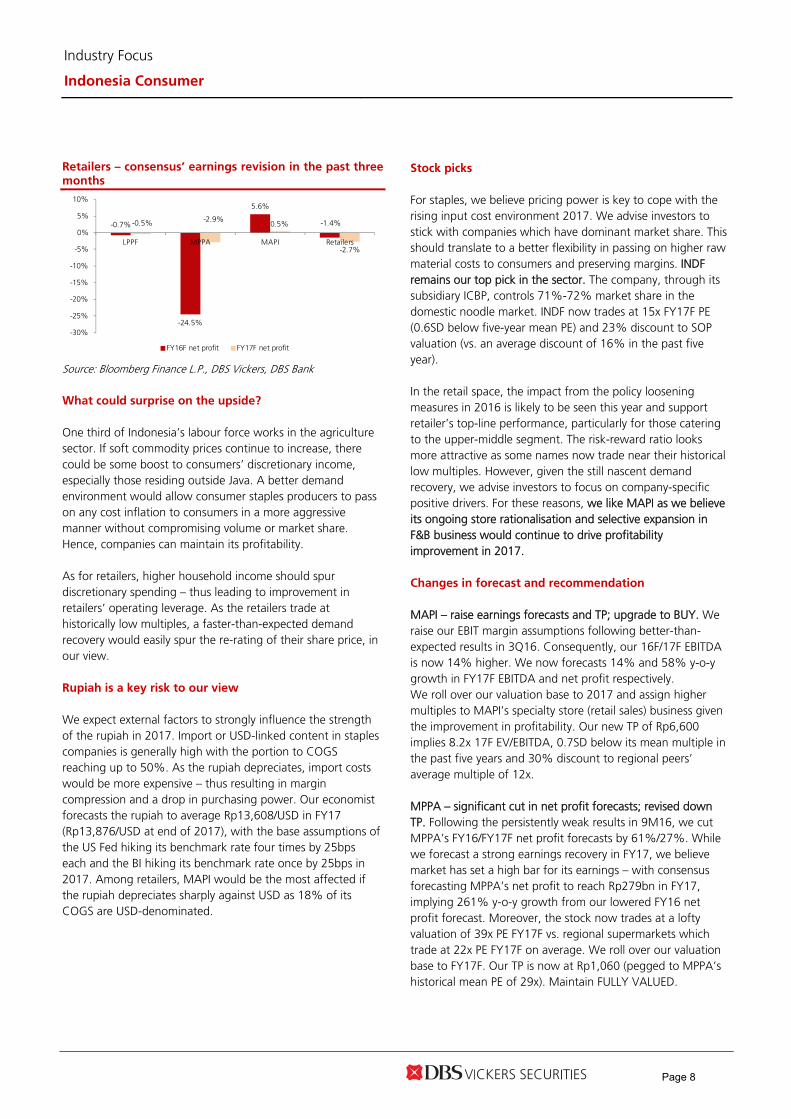
Retailers – consensus’ earnings revision in the past three months
Source: Bloomberg Finance L.P., DBS Vickers, DBS Bank
What could surprise on the upside?
One third of Indonesia’s labour force works in the agriculture sector. If soft commodity prices continue to increase, there could be some boost to consumers’ discretionary income, especially those residing outside Java. A better demand environment would allow consumer staples producers to pass on any cost inflation to consumers in a more aggressive manner without compromising volume or market share. Hence, companies can maintain its profitability. As for retailers, higher household income should spur discretionary spending – thus leading to improvement in retailers’ operating leverage. As the retailers trade at historically low multiples, a faster-than-expected demand recovery would easily spur the re-rating of their share price, in our view. Rupiah is a key risk to our view
We expect external factors to strongly influence the strength of the rupiah in 2017. Import or USD-linked content in staples companies is generally high with the portion to COGS reaching up to 50%. As the rupiah depreciates, import costs would be more expensive – thus resulting in margin compression and a drop in purchasing power. Our economist forecasts the rupiah to average Rp13,608/USD in FY17 (Rp13,876/USD at end of 2017), with the base assumptions of the US Fed hiking its benchmark rate four times by 25bps each and the BI hiking its benchmark rate once by 25bps in 2017. Among retailers, MAPI would be the most affected if the rupiah depreciates sharply against USD as 18% of its COGS are USD-denominated.
Stock picks
For staples, we believe pricing power is key to cope with the rising input cost environment 2017. We advise investors to stick with companies which have dominant market share. This should translate to a better flexibility in passing on higher raw material costs to consumers and preserving margins. INDF remains our top pick in the sector. The company, through its subsidiary ICBP, controls 71%-72% market share in the domestic noodle market. INDF now trades at 15x FY17F PE (0.6SD below five-year mean PE) and 23% discount to SOP valuation (vs. an average discount of 16% in the past five year). In the retail space, the impact from the policy loosening measures in 2016 is likely to be seen this year and support retailer’s top-line performance, particularly for those catering to the upper-middle segment. The risk-reward ratio looks more attractive as some names now trade near their historical low multiples. However, given the still nascent demand recovery, we advise investors to focus on company-specific positive drivers. For these reasons, we like MAPI as we believe its ongoing store rationalisation and selective expansion in F&B business would continue to drive profitability improvement in 2017. Changes in forecast and recommendation
MAPI – raise earnings forecasts and TP; upgrade to BUY. We raise our EBIT margin assumptions following better-than-expected results in 3Q16. Consequently, our 16F/17F EBITDA is now 14% higher. We now forecasts 14% and 58% y-o-y growth in FY17F EBITDA and net profit respectively. We roll over our valuation base to 2017 and assign higher multiples to MAPI’s specialty store (retail sales) business given the improvement in profitability. Our new TP of Rp6,600 implies 8.2x 17F EV/EBITDA, 0.7SD below its mean multiple in the past five years and 30% discount to regional peers’ average multiple of 12x. MPPA – significant cut in net profit forecasts; revised down TP. Following the persistently weak results in 9M16, we cut MPPA’s FY16/FY17F net profit forecasts by 61%/27%. While we forecast a strong earnings recovery in FY17, we believe market has set a high bar for its earnings – with consensus forecasting MPPA’s net profit to reach Rp279bn in FY17, implying 261% y-o-y growth from our lowered FY16 net profit forecast. Moreover, the stock now trades at a lofty valuation of 39x PE FY17F vs. regional supermarkets which trade at 22x PE FY17F on average. We roll over our valuation base to FY17F. Our TP is now at Rp1,060 (pegged to MPPA’s historical mean PE of 29x). Maintain FULLY VALUED.
-0.7%
-24.5%
5.6%
-1.4%-0.5% -2.9%0.5%
-2.7%
-30%
-25%
-20%
-15%
-10%
-5%
0%
5%
10%
LPPF MPPA MAPI Retailers
FY16F net profit FY17F net profit
Page 8

Industry Focus
Indonesia Consumer
Page 9
UNVR – revised up earnings on better-than-expected operational efficiency. We revise up UNVR’s FY16/FY17 net profit forecasts by 7% for better cost control. Our FY17F net profit is now 8% below consensus as we assume lower margin in FY17F on the back of higher raw material costs, particularly palm oil. Our FULLY VALUED call is unchanged as we believe UNVR’s lofty valuation of 49x PE FY17F is not justified by its earnings growth prospect. Summary of earnings forecast changes
Source: DBS Vickers, DBS Bank
Summary of recommendation changes
Source: DBS Vickers, DBS Bank
Old New Change Old New ChangeUNVR 5,836 6,247 7% 6,138 6,564 7%MYOR 1,264 1,305 3% 1,431 1,454 2%ICBP 3,660 3,660 0% 3,953 3,868 -2%INDF 3,927 3,927 0% 4,529 4,545 0%LPPF 2,130 2,095 -2% 2,429 2,357 -3%MAPI 180 191 6% 286 302 6%MPPA 197 77 -61% 267 196 -27%A ggregate 17,194 17,502 2% 19,033 19,287 1%
F Y16F net prof it F Y17F net prof it
Old New ChangeUNVR 30,700 36,200 18% Maintain Fully ValuedMYOR 1,568 1,700 8% Maintain HoldICBP 9,800 9,000 -8% Maintain HoldINDF 9,900 9,100 -8% Maintain BuyLPPF 20,300 16,200 -20% Maintain HoldMAPI 4,150 6,600 59% Upgrade to Buy from HoldMPPA 1,160 1,060 -9% Maintain Fully Valued
Target PriceRecommendat ion
Page 9

Industry Focus
Indonesia Consumer
Page 10
Indonesian consumer sector: valuation summary
Source: DBS Vickers, DBS Bank, Bloomberg Finance L.P
Company ICBP INDF MYOR UNVR MAPI LPPF MPPA
Market cap (US$m) 7,438 5,238 3,062 23,888 676 3,355 551Share price (Rp)* 8,500 7,950 1,825 41,725 5,425 15,325 1,365Recommendation HOLD BUY HOLD FULLY VALUED BUY HOLD FULLY VALUEDTarget price 9,000 9,100 1,700 36,200 6,600 16,200 1,060Upside (downside) 6% 14% -7% -13% 22% 6% -22%PE (x)FY15A 33.0 23.5 33.4 54.4 241.2 25.1 40.1FY16F 27.1 17.8 31.3 51.0 47.0 21.3 95.1FY17F 25.6 15.4 28.1 48.5 29.8 19.0 37.4FY18F 23.0 14.3 24.3 44.3 20.8 17.0 29.3PB (x)FY15A 6.4 2.6 8.0 65.9 3.0 40.4 2.9FY16F 5.7 2.4 6.8 65.8 2.9 22.9 2.9FY17F 5.2 2.2 5.8 65.6 2.6 15.7 2.7FY18F 4.6 2.1 5.0 65.4 2.4 11.7 2.6EV/EBITDA (x)FY15A 20.3 9.5 18.5 37.8 11.2 17.1 13.1FY16F 17.2 9.1 16.9 35.4 8.1 14.9 14.6FY17F 15.9 8.4 15.3 33.5 7.0 13.1 10.7FY18F 14.3 7.5 13.5 30.5 6.0 11.4 9.0Revenue growthFY15A 5.7% 0.7% 4.6% 5.7% 8.5% 13.6% 2.5%FY16F 9.8% 5.1% 12.3% 9.2% 10.3% 10.5% -0.4%FY17F 8.8% 7.5% 13.9% 10.6% 12.3% 10.9% 9.4%FY18F 9.2% 8.9% 12.9% 10.6% 12.7% 11.5% 9.0%Net profit growthFY15A 13.5% -24.7% 202.3% -1.3% -52.8% 25.5% -67.0%FY16F 22.0% 32.3% 6.9% 6.8% 412.8% 17.6% -57.8%FY17F 5.7% 15.7% 11.4% 5.1% 57.7% 12.5% 154.2%FY18F 11.4% 7.7% 15.6% 9.6% 43.7% 11.6% 27.5%Gros s marginFY15A 30.3% 26.9% 28.3% 51.1% 45.1% 35.2% 16.2%FY16F 29.5% 26.8% 26.0% 50.5% 46.0% 35.5% 15.7%FY17F 28.6% 26.8% 25.2% 49.6% 46.5% 35.9% 15.9%FY18F 28.8% 26.8% 25.2% 49.4% 47.0% 36.1% 15.9%EBIT marginFY15A 12.6% 11.5% 12.6% 21.8% 4.1% 14.4% 1.8%FY16F 13.5% 11.8% 12.0% 21.3% 5.7% 14.8% 1.3%FY17F 13.4% 12.0% 11.5% 20.3% 5.9% 15.2% 2.1%FY18F 13.6% 12.5% 11.5% 20.2% 6.2% 15.4% 2.4%Net gearingFY15A Net cash 24% 29% 18% 51% Net cash 9%FY16F Net cash 18% 24% 27% 49% Net cash 16%FY17F Net cash 17% 18% 35% 45% Net cash 18%FY18F Net cash 16% 11% 40% 40% Net cash 13%ROAEFY15A 19.4% 10.9% 24.0% 121.2% 1.3% 161.0% 7.3%FY16F 21.2% 13.4% 21.8% 129.1% 6.1% 107.2% 3.0%FY17F 20.1% 14.4% 20.7% 135.3% 8.8% 82.9% 7.3%FY18F 20.2% 14.4% 20.5% 147.7% 11.4% 68.8% 8.8%
Page 10
Industry Focus
Indonesia Consumer
Page 11
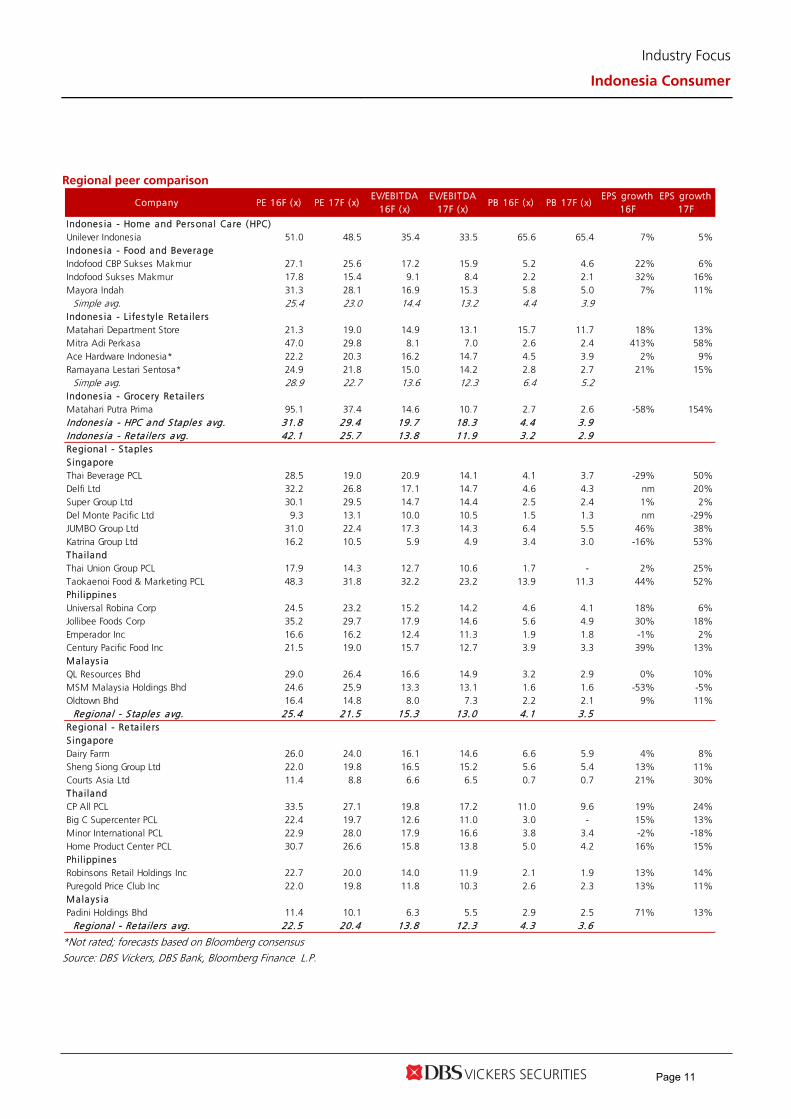
Regional peer comparison
*Not rated; forecasts based on Bloomberg consensus Source: DBS Vickers, DBS Bank, Bloomberg Finance L.P.
Company PE 16F (x) PE 17F (x)EV/EBITDA
16F (x)EV/EBITDA
17F (x)PB 16F (x) PB 17F (x)
EPS growth 16F
EPS growth 17F
Indones ia - Home and Pers ona l Care (HPC)Unilever Indonesia 51.0 48.5 35.4 33.5 65.6 65.4 7% 5%Indones ia - Food and BeverageIndofood CBP Sukses Makmur 27.1 25.6 17.2 15.9 5.2 4.6 22% 6%Indofood Sukses Makmur 17.8 15.4 9.1 8.4 2.2 2.1 32% 16%Mayora Indah 31.3 28.1 16.9 15.3 5.8 5.0 7% 11%
Simple avg. 25.4 23.0 14.4 13.2 4.4 3.9 Indones ia - L ifes tyle Reta i le rsMatahari Department Store 21.3 19.0 14.9 13.1 15.7 11.7 18% 13%Mitra Adi Perkasa 47.0 29.8 8.1 7.0 2.6 2.4 413% 58%Ace Hardware Indonesia* 22.2 20.3 16.2 14.7 4.5 3.9 2% 9%Ramayana Lestari Sentosa* 24.9 21.8 15.0 14.2 2.8 2.7 21% 15%
Simple avg. 28.9 22.7 13.6 12.3 6.4 5.2 Indones ia - Grocery Reta i le rsMatahari Putra Prima 95.1 37.4 14.6 10.7 2.7 2.6 -58% 154%Indones ia - HPC and S taples avg. 31.8 29.4 19.7 18.3 4.4 3.9 Indones ia - Reta i le rs avg. 42.1 25.7 13.8 11.9 3.2 2.9 Regiona l - S taplesS ingaporeThai Beverage PCL 28.5 19.0 20.9 14.1 4.1 3.7 -29% 50%Delfi Ltd 32.2 26.8 17.1 14.7 4.6 4.3 nm 20%Super Group Ltd 30.1 29.5 14.7 14.4 2.5 2.4 1% 2%Del Monte Pacific Ltd 9.3 13.1 10.0 10.5 1.5 1.3 nm -29%JUMBO Group Ltd 31.0 22.4 17.3 14.3 6.4 5.5 46% 38%Katrina Group Ltd 16.2 10.5 5.9 4.9 3.4 3.0 -16% 53%Tha ilandThai Union Group PCL 17.9 14.3 12.7 10.6 1.7 - 2% 25%Taokaenoi Food & Marketing PCL 48.3 31.8 32.2 23.2 13.9 11.3 44% 52%Phil ippinesUniversal Robina Corp 24.5 23.2 15.2 14.2 4.6 4.1 18% 6%Jollibee Foods Corp 35.2 29.7 17.9 14.6 5.6 4.9 30% 18%Emperador Inc 16.6 16.2 12.4 11.3 1.9 1.8 -1% 2%Century Pacific Food Inc 21.5 19.0 15.7 12.7 3.9 3.3 39% 13%Malays iaQL Resources Bhd 29.0 26.4 16.6 14.9 3.2 2.9 0% 10%MSM Malaysia Holdings Bhd 24.6 25.9 13.3 13.1 1.6 1.6 -53% -5%Oldtown Bhd 16.4 14.8 8.0 7.3 2.2 2.1 9% 11%
Regiona l - S taples avg. 25.4 21.5 15.3 13.0 4.1 3.5 Regiona l - Reta i le rsS ingaporeDairy Farm 26.0 24.0 16.1 14.6 6.6 5.9 4% 8%Sheng Siong Group Ltd 22.0 19.8 16.5 15.2 5.6 5.4 13% 11%Courts Asia Ltd 11.4 8.8 6.6 6.5 0.7 0.7 21% 30%Tha ilandCP All PCL 33.5 27.1 19.8 17.2 11.0 9.6 19% 24%Big C Supercenter PCL 22.4 19.7 12.6 11.0 3.0 - 15% 13%Minor International PCL 22.9 28.0 17.9 16.6 3.8 3.4 -2% -18%Home Product Center PCL 30.7 26.6 15.8 13.8 5.0 4.2 16% 15%Phil ippinesRobinsons Retail Holdings Inc 22.7 20.0 14.0 11.9 2.1 1.9 13% 14%Puregold Price Club Inc 22.0 19.8 11.8 10.3 2.6 2.3 13% 11%Malays iaPadini Holdings Bhd 11.4 10.1 6.3 5.5 2.9 2.5 71% 13%
Regiona l - Reta ile rs avg. 22.5 20.4 13.8 12.3 4.3 3.6
Page 11
Industry Focus
Indonesia Consumer
Page 12
COMPANY GUIDES COMPANY GUIDES COMPANY GUIDES
COMPANY GUIDES
COMPANY GUIDES
Page 12

ASIAN INSIGHTS VICKERS SECURITIES ed: CK / sa:MA, PY
HOLD Last Traded Price ( 8 Feb 2017): Rp8,500 (JCI : 5,361.10) Price Target 12-mth: Rp9,000 (6% upside) (Prev Rp9,800) Potential Catalyst: Further drop in raw material prices, particularly wheat, and rupiah appreciation Where we differ: Broadly in line with consensus Analyst Tiesha PUTRI +6221 30034931 [email protected] Andy SIM CFA +65 6682 3718 [email protected]
What’s New • Margin to moderate as key raw material prices
namely CPO, sugar and milk powder have rallied
• ICBP raised noodle prices by 4-5% in early January 2017
• Maintain HOLD; TP cut to Rp9,000
Price Relative
Forecasts and Valuation FY Dec (Rp m) 2015A 2016F 2017F 2018F Revenue 31,741 34,848 37,900 41,380 EBITDA 4,691 5,473 5,864 6,451 Pre-tax Profit 4,010 4,972 5,255 5,853 Net Profit 3,001 3,660 3,868 4,308 Net Pft (Pre Ex.) 3,001 3,660 3,868 4,308 Net Pft Gth (Pre-ex) (%) 13.5 22.0 5.7 11.4 EPS (Rp) 257 314 332 369 EPS Pre Ex. (Rp) 257 314 332 369 EPS Gth Pre Ex (%) 13 22 6 11 Diluted EPS (Rp) 257 314 332 369 Net DPS (Rp) 129 157 166 185 BV Per Share (Rp) 1,325 1,482 1,648 1,833 PE (X) 33.0 27.1 25.6 23.0 PE Pre Ex. (X) 33.0 27.1 25.6 23.0 P/Cash Flow (X) 28.4 21.7 22.3 20.3 EV/EBITDA (X) 20.3 17.2 15.9 14.3 Net Div Yield (%) 1.5 1.8 2.0 2.2 P/Book Value (X) 6.4 5.7 5.2 4.6 Net Debt/Equity (X) CASH CASH CASH CASH ROAE (%) 19.4 21.2 20.1 20.2 Earnings Rev (%): 0 (2) (1) Consensus EPS (Rp): 594 N/A N/A Other Broker Recs: B: 16 S: 1 H: 12
Source of all data on this page: Company, DBS Vickers, Bloomberg Finance L.P
A less exciting year Input cost tailwind dissipates. ICBP’s share price has underperformed the JCI by 15% since early Sep 2016, possibly owing to concerns over rising raw material prices. As mentioned in our previous report, we believe ICBP’s margin had peaked in 3Q16 and would moderate going forward as the prices of its key raw materials, namely CPO, sugar, milk powder and recently chilli, have risen considerably. Pre-emptive price increase for noodles in Jan 2017. The company raised its noodle ASP by Rp100/pack in early January 2017, translating to 4-5% hike. We believe this price hike is a pre-emptive move taken to preserve its profitability in 2017. ICBP remains the price leader in the domestic noodle market with a market share of 71-72% in the past five years. The noodle segment contributed to 65% and 75% of ICBP’s consolidated revenue and EBIT respectively. An improving demand environment and the strong pricing power of ICBP’s noodle products are two things that it can leverage on to prevent a sharp margin contraction. 2017 outlook: expecting deceleration in earnings growth. Looking ahead to 2017, we expect earnings to only grow by 6% y-o-y as input cost rises. This is a deceleration from 22% y-o-y growth that we projected for FY16. For this reason, we lower our PE multiple to 27x PE FY17F or +1SD of ICBP’s five-year mean PE (from +29x or +2SD above mean PE previously). Our revised TP of Rp9,000 only provides limited upside from the last closing price. Upside risks to our call would be faster-than-expected turnaround of its loss-making beverage business and market share gain, particularly for its less mature segments such as dairy. Valuation: Our TP of Rp9,000 is based on 27x FY17F PE or +1SD of ICBP’s five-year historical mean PE. Key Risks to Our View: Rapid rupiah depreciation and commodity price hikes could hurt ICBP’s margins as they directly impact input costs. At A Glance Issued Capital (m shrs) 11,662 Mkt. Cap (Rpbn/US$m) 99,126 / 7,434 Major Shareholders (%) PT Indofood Sukses Makmur (%) 80.5
Free Float (%) 19.5 3m Avg. Daily Val (US$m) 2.7 ICB Industry : Consumer Goods / Food Producers
DBS Group Research . Equity
9 Feb 2017
Indonesia Company Guide
Indofood CBP Sukses Makmur Version 6 | Bloomberg: ICBP IJ | Reuters: ICBP.JK Refer to important disclosures at the end of this report
Page 13
ASIAN INSIGHTS VICKERS SECURITIES Page 2
Company Guide
Indofood CBP Sukses Makmur
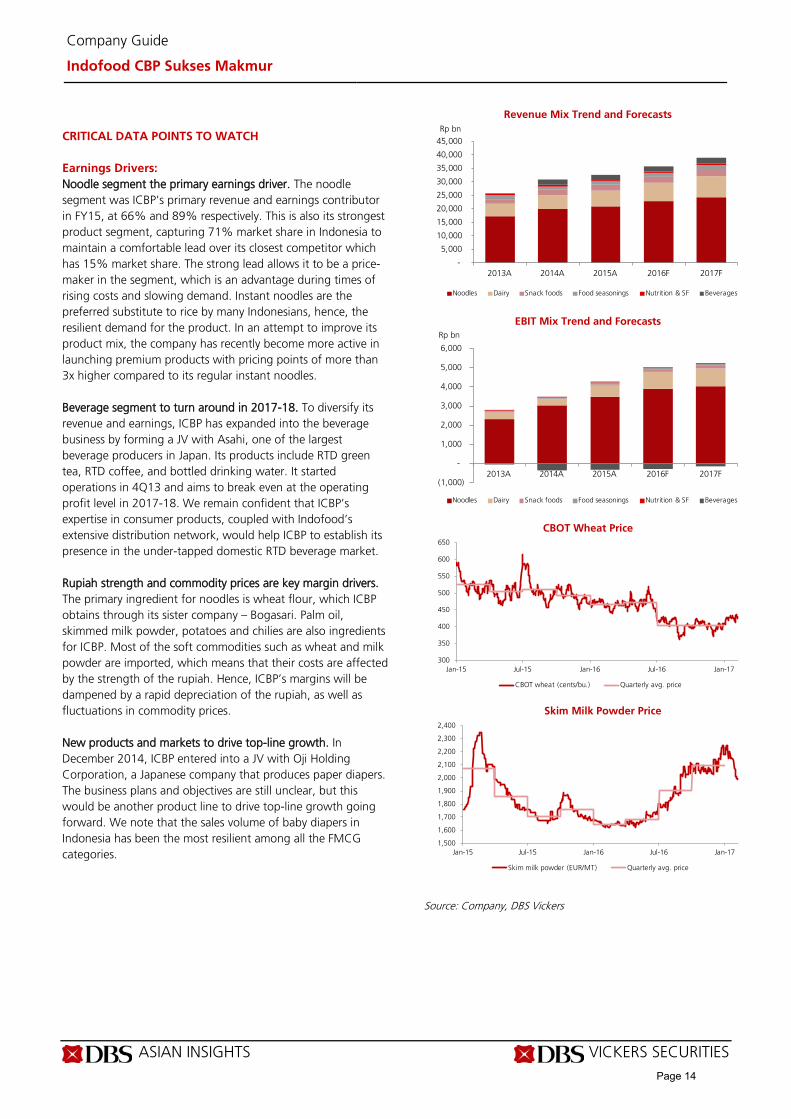
CRITICAL DATA POINTS TO WATCH Earnings Drivers: Noodle segment the primary earnings driver. The noodle segment was ICBP’s primary revenue and earnings contributor in FY15, at 66% and 89% respectively. This is also its strongest product segment, capturing 71% market share in Indonesia to maintain a comfortable lead over its closest competitor which has 15% market share. The strong lead allows it to be a price-maker in the segment, which is an advantage during times of rising costs and slowing demand. Instant noodles are the preferred substitute to rice by many Indonesians, hence, the resilient demand for the product. In an attempt to improve its product mix, the company has recently become more active in launching premium products with pricing points of more than 3x higher compared to its regular instant noodles. Beverage segment to turn around in 2017-18. To diversify its revenue and earnings, ICBP has expanded into the beverage business by forming a JV with Asahi, one of the largest beverage producers in Japan. Its products include RTD green tea, RTD coffee, and bottled drinking water. It started operations in 4Q13 and aims to break even at the operating profit level in 2017-18. We remain confident that ICBP’s expertise in consumer products, coupled with Indofood’s extensive distribution network, would help ICBP to establish its presence in the under-tapped domestic RTD beverage market. Rupiah strength and commodity prices are key margin drivers. The primary ingredient for noodles is wheat flour, which ICBP obtains through its sister company – Bogasari. Palm oil, skimmed milk powder, potatoes and chilies are also ingredients for ICBP. Most of the soft commodities such as wheat and milk powder are imported, which means that their costs are affected by the strength of the rupiah. Hence, ICBP’s margins will be dampened by a rapid depreciation of the rupiah, as well as fluctuations in commodity prices. New products and markets to drive top-line growth. In December 2014, ICBP entered into a JV with Oji Holding Corporation, a Japanese company that produces paper diapers. The business plans and objectives are still unclear, but this would be another product line to drive top-line growth going forward. We note that the sales volume of baby diapers in Indonesia has been the most resilient among all the FMCG categories.
Revenue Mix Trend and Forecasts
EBIT Mix Trend and Forecasts
CBOT Wheat Price
Skim Milk Powder Price
Source: Company, DBS Vickers
-
5,000
10,000
15,000
20,000
25,000
30,000
35,000
40,000
45,000
2013A 2014A 2015A 2016F 2017F
Rp bn
Noodles Dairy Snack foods Food seasonings Nutrition & SF Beverages
(1,000)
-
1,000
2,000
3,000
4,000
5,000
6,000
2013A 2014A 2015A 2016F 2017F
Rp bn
Noodles Dairy Snack foods Food seasonings Nutrition & SF Beverages
300
350
400
450
500
550
600
650
Jan-15 Jul-15 Jan-16 Jul-16 Jan-17
CBOT wheat (cents/bu.) Quarterly avg. price
1,500
1,600
1,700
1,800
1,900
2,000
2,100
2,200
2,300
2,400
Jan-15 Jul-15 Jan-16 Jul-16 Jan-17
Skim milk powder (EUR/MT) Quarterly avg. price
Page 14
ASIAN INSIGHTS VICKERS SECURITIES Page 3
Company Guide
Indofood CBP Sukses Makmur
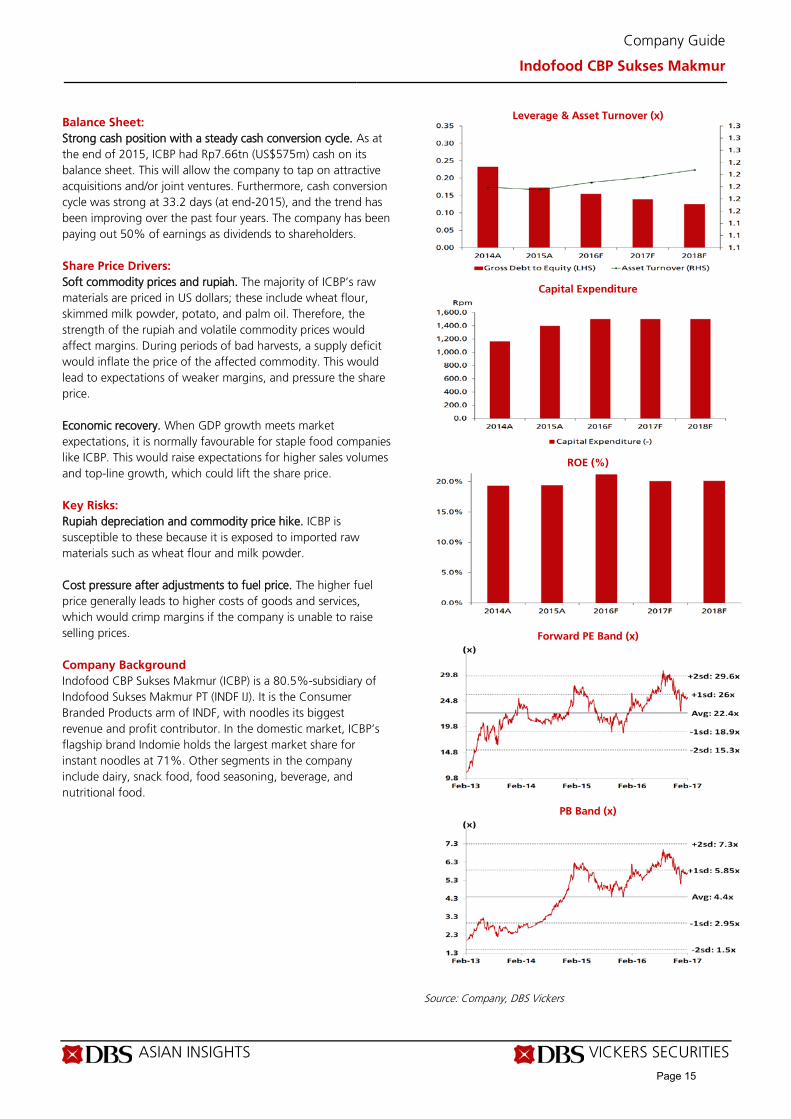
Balance Sheet: Strong cash position with a steady cash conversion cycle. As at the end of 2015, ICBP had Rp7.66tn (US$575m) cash on its balance sheet. This will allow the company to tap on attractive acquisitions and/or joint ventures. Furthermore, cash conversion cycle was strong at 33.2 days (at end-2015), and the trend has been improving over the past four years. The company has been paying out 50% of earnings as dividends to shareholders. Share Price Drivers: Soft commodity prices and rupiah. The majority of ICBP’s raw materials are priced in US dollars; these include wheat flour, skimmed milk powder, potato, and palm oil. Therefore, the strength of the rupiah and volatile commodity prices would affect margins. During periods of bad harvests, a supply deficit would inflate the price of the affected commodity. This would lead to expectations of weaker margins, and pressure the share price. Economic recovery. When GDP growth meets market expectations, it is normally favourable for staple food companies like ICBP. This would raise expectations for higher sales volumes and top-line growth, which could lift the share price. Key Risks: Rupiah depreciation and commodity price hike. ICBP is susceptible to these because it is exposed to imported raw materials such as wheat flour and milk powder. Cost pressure after adjustments to fuel price. The higher fuel price generally leads to higher costs of goods and services, which would crimp margins if the company is unable to raise selling prices. Company Background Indofood CBP Sukses Makmur (ICBP) is a 80.5%-subsidiary of Indofood Sukses Makmur PT (INDF IJ). It is the Consumer Branded Products arm of INDF, with noodles its biggest revenue and profit contributor. In the domestic market, ICBP’s flagship brand Indomie holds the largest market share for instant noodles at 71%. Other segments in the company include dairy, snack food, food seasoning, beverage, and nutritional food.
Leverage & Asset Turnover (x)
Capital Expenditure
ROE (%)
Forward PE Band (x)
PB Band (x)
Source: Company, DBS Vickers
Page 15
ASIAN INSIGHTS VICKERS SECURITIES Page 4
Company Guide
Indofood CBP Sukses Makmur
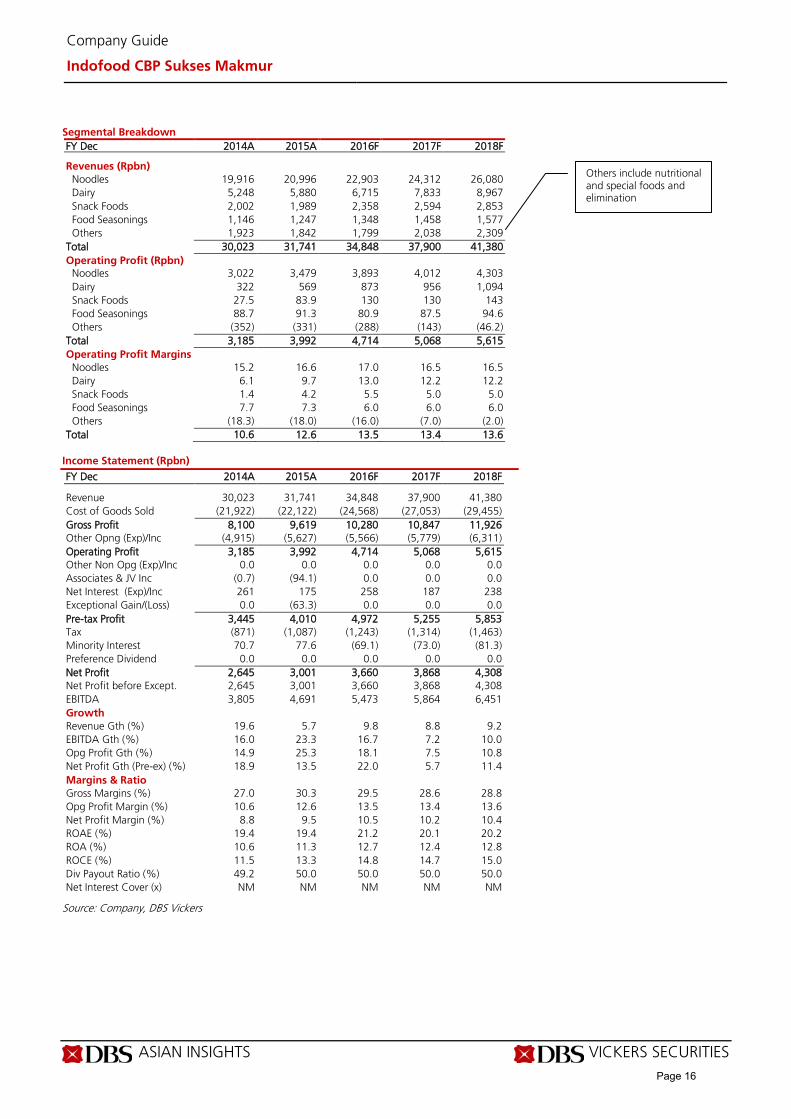
Segmental Breakdown FY Dec 2014A 2015A 2016F 2017F 2018F Revenues (Rpbn) Noodles 19,916 20,996 22,903 24,312 26,080 Dairy 5,248 5,880 6,715 7,833 8,967 Snack Foods 2,002 1,989 2,358 2,594 2,853 Food Seasonings 1,146 1,247 1,348 1,458 1,577 Others 1,923 1,842 1,799 2,038 2,309 Total 30,023 31,741 34,848 37,900 41,380 Operating Profit (Rpbn) Noodles 3,022 3,479 3,893 4,012 4,303 Dairy 322 569 873 956 1,094 Snack Foods 27.5 83.9 130 130 143 Food Seasonings 88.7 91.3 80.9 87.5 94.6 Others (352) (331) (288) (143) (46.2) Total 3,185 3,992 4,714 5,068 5,615 Operating Profit Margins
Noodles 15.2 16.6 17.0 16.5 16.5 Dairy 6.1 9.7 13.0 12.2 12.2 Snack Foods 1.4 4.2 5.5 5.0 5.0 Food Seasonings 7.7 7.3 6.0 6.0 6.0 Others (18.3) (18.0) (16.0) (7.0) (2.0) Total 10.6 12.6 13.5 13.4 13.6
Income Statement (Rpbn)
FY Dec 2014A 2015A 2016F 2017F 2018F Revenue 30,023 31,741 34,848 37,900 41,380 Cost of Goods Sold (21,922) (22,122) (24,568) (27,053) (29,455) Gross Profit 8,100 9,619 10,280 10,847 11,926 Other Opng (Exp)/Inc (4,915) (5,627) (5,566) (5,779) (6,311) Operating Profit 3,185 3,992 4,714 5,068 5,615 Other Non Opg (Exp)/Inc 0.0 0.0 0.0 0.0 0.0 Associates & JV Inc (0.7) (94.1) 0.0 0.0 0.0 Net Interest (Exp)/Inc 261 175 258 187 238 Exceptional Gain/(Loss) 0.0 (63.3) 0.0 0.0 0.0 Pre-tax Profit 3,445 4,010 4,972 5,255 5,853 Tax (871) (1,087) (1,243) (1,314) (1,463) Minority Interest 70.7 77.6 (69.1) (73.0) (81.3) Preference Dividend 0.0 0.0 0.0 0.0 0.0 Net Profit 2,645 3,001 3,660 3,868 4,308 Net Profit before Except. 2,645 3,001 3,660 3,868 4,308 EBITDA 3,805 4,691 5,473 5,864 6,451 Growth Revenue Gth (%) 19.6 5.7 9.8 8.8 9.2 EBITDA Gth (%) 16.0 23.3 16.7 7.2 10.0 Opg Profit Gth (%) 14.9 25.3 18.1 7.5 10.8 Net Profit Gth (Pre-ex) (%) 18.9 13.5 22.0 5.7 11.4 Margins & Ratio Gross Margins (%) 27.0 30.3 29.5 28.6 28.8 Opg Profit Margin (%) 10.6 12.6 13.5 13.4 13.6 Net Profit Margin (%) 8.8 9.5 10.5 10.2 10.4 ROAE (%) 19.4 19.4 21.2 20.1 20.2 ROA (%) 10.6 11.3 12.7 12.4 12.8 ROCE (%) 11.5 13.3 14.8 14.7 15.0 Div Payout Ratio (%) 49.2 50.0 50.0 50.0 50.0 Net Interest Cover (x) NM NM NM NM NM
Source: Company, DBS Vickers
Others include nutritional and special foods and elimination
Page 16
ASIAN INSIGHTS VICKERS SECURITIES Page 5
Company Guide
Indofood CBP Sukses Makmur
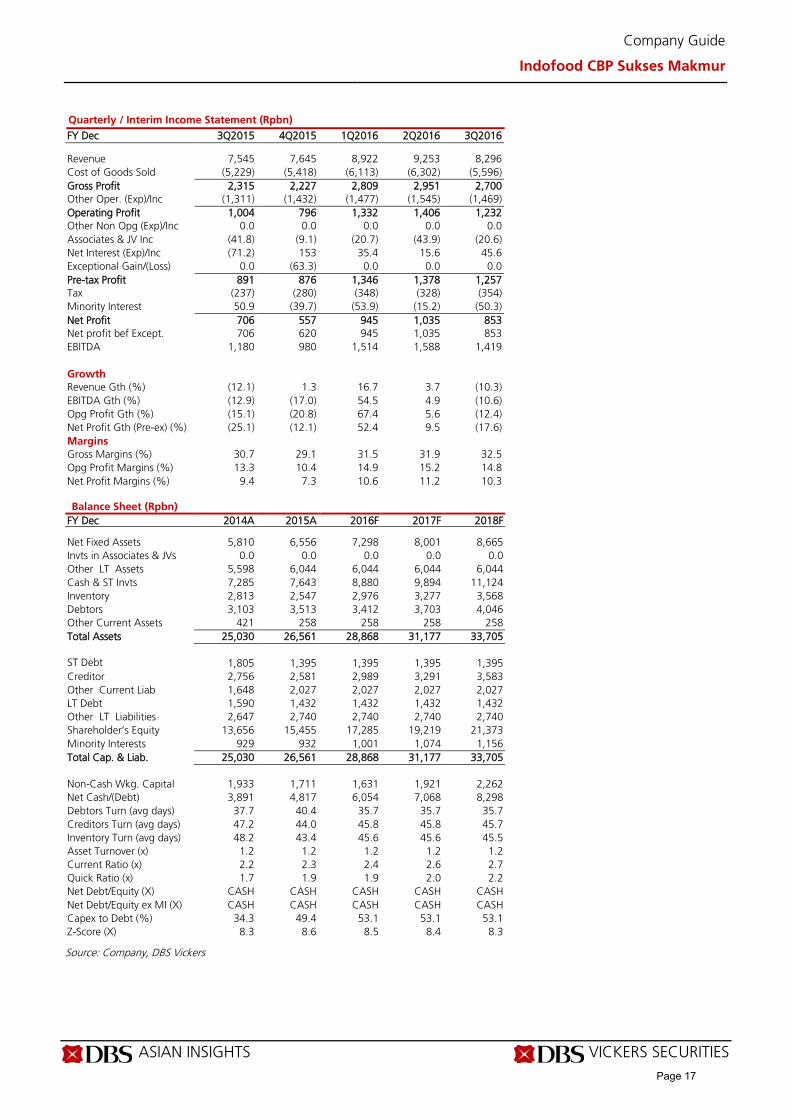
Quarterly / Interim Income Statement (Rpbn)
FY Dec 3Q2015 4Q2015 1Q2016 2Q2016 3Q2016 Revenue 7,545 7,645 8,922 9,253 8,296 Cost of Goods Sold (5,229) (5,418) (6,113) (6,302) (5,596) Gross Profit 2,315 2,227 2,809 2,951 2,700 Other Oper. (Exp)/Inc (1,311) (1,432) (1,477) (1,545) (1,469) Operating Profit 1,004 796 1,332 1,406 1,232 Other Non Opg (Exp)/Inc 0.0 0.0 0.0 0.0 0.0 Associates & JV Inc (41.8) (9.1) (20.7) (43.9) (20.6) Net Interest (Exp)/Inc (71.2) 153 35.4 15.6 45.6 Exceptional Gain/(Loss) 0.0 (63.3) 0.0 0.0 0.0 Pre-tax Profit 891 876 1,346 1,378 1,257 Tax (237) (280) (348) (328) (354) Minority Interest 50.9 (39.7) (53.9) (15.2) (50.3) Net Profit 706 557 945 1,035 853 Net profit bef Except. 706 620 945 1,035 853 EBITDA 1,180 980 1,514 1,588 1,419 Growth Revenue Gth (%) (12.1) 1.3 16.7 3.7 (10.3) EBITDA Gth (%) (12.9) (17.0) 54.5 4.9 (10.6) Opg Profit Gth (%) (15.1) (20.8) 67.4 5.6 (12.4) Net Profit Gth (Pre-ex) (%) (25.1) (12.1) 52.4 9.5 (17.6) Margins Gross Margins (%) 30.7 29.1 31.5 31.9 32.5 Opg Profit Margins (%) 13.3 10.4 14.9 15.2 14.8 Net Profit Margins (%) 9.4 7.3 10.6 11.2 10.3
Balance Sheet (Rpbn)
FY Dec 2014A 2015A 2016F 2017F 2018F Net Fixed Assets 5,810 6,556 7,298 8,001 8,665 Invts in Associates & JVs 0.0 0.0 0.0 0.0 0.0 Other LT Assets 5,598 6,044 6,044 6,044 6,044 Cash & ST Invts 7,285 7,643 8,880 9,894 11,124 Inventory 2,813 2,547 2,976 3,277 3,568 Debtors 3,103 3,513 3,412 3,703 4,046 Other Current Assets 421 258 258 258 258 Total Assets 25,030 26,561 28,868 31,177 33,705 ST Debt
1,805 1,395 1,395 1,395 1,395 Creditor 2,756 2,581 2,989 3,291 3,583 Other Current Liab 1,648 2,027 2,027 2,027 2,027 LT Debt 1,590 1,432 1,432 1,432 1,432 Other LT Liabilities 2,647 2,740 2,740 2,740 2,740 Shareholder’s Equity 13,656 15,455 17,285 19,219 21,373 Minority Interests 929 932 1,001 1,074 1,156 Total Cap. & Liab. 25,030 26,561 28,868 31,177 33,705 Non-Cash Wkg. Capital 1,933 1,711 1,631 1,921 2,262 Net Cash/(Debt) 3,891 4,817 6,054 7,068 8,298 Debtors Turn (avg days) 37.7 40.4 35.7 35.7 35.7 Creditors Turn (avg days) 47.2 44.0 45.8 45.8 45.7 Inventory Turn (avg days) 48.2 43.4 45.6 45.6 45.5 Asset Turnover (x) 1.2 1.2 1.2 1.2 1.2 Current Ratio (x) 2.2 2.3 2.4 2.6 2.7 Quick Ratio (x) 1.7 1.9 1.9 2.0 2.2 Net Debt/Equity (X) CASH CASH CASH CASH CASH Net Debt/Equity ex MI (X) CASH CASH CASH CASH CASH Capex to Debt (%) 34.3 49.4 53.1 53.1 53.1 Z-Score (X) 8.3 8.6 8.5 8.4 8.3
Source: Company, DBS Vickers
Page 17
ASIAN INSIGHTS VICKERS SECURITIES Page 6
Company Guide
Indofood CBP Sukses Makmur
Cash Flow Statement (Rpbn)
FY Dec 2014A 2015A 2016F 2017F 2018F Pre-Tax Profit 3,445 4,010 4,972 5,255 5,853 Dep. & Amort. 619 699 758 796 836 Tax Paid (871) (1,087) (1,243) (1,314) (1,463) Assoc. & JV Inc/(loss) 0.70 94.1 0.0 0.0 0.0 Chg in Wkg.Cap. 298 117 80.3 (290) (342) Other Operating CF 369 (348) 0.0 0.0 0.0 Net Operating CF 3,861 3,486 4,568 4,447 4,884 Capital Exp.(net) (1,164) (1,396) (1,500) (1,500) (1,500) Other Invts.(net) 0.0 0.0 0.0 0.0 0.0 Invts in Assoc. & JV (218) (619) 0.0 0.0 0.0 Div from Assoc & JV 0.0 0.0 0.0 0.0 0.0 Other Investing CF (368) (32.6) 0.0 0.0 0.0 Net Investing CF (1,750) (2,047) (1,500) (1,500) (1,500) Div Paid (1,108) (1,295) (1,830) (1,934) (2,154) Chg in Gross Debt 686 (29.9) 0.0 0.0 0.0 Capital Issues 0.0 0.0 0.0 0.0 0.0 Other Financing CF 135 59.5 0.0 0.0 0.0 Net Financing CF (287) (1,265) (1,830) (1,934) (2,154) Currency Adjustments 22.6 144 0.0 0.0 0.0 Chg in Cash 1,847 318 1,238 1,013 1,230 Opg CFPS (Rp) 306 289 385 406 448 Free CFPS (Rp) 231 179 263 253 290
Source: Company, DBS Vickers
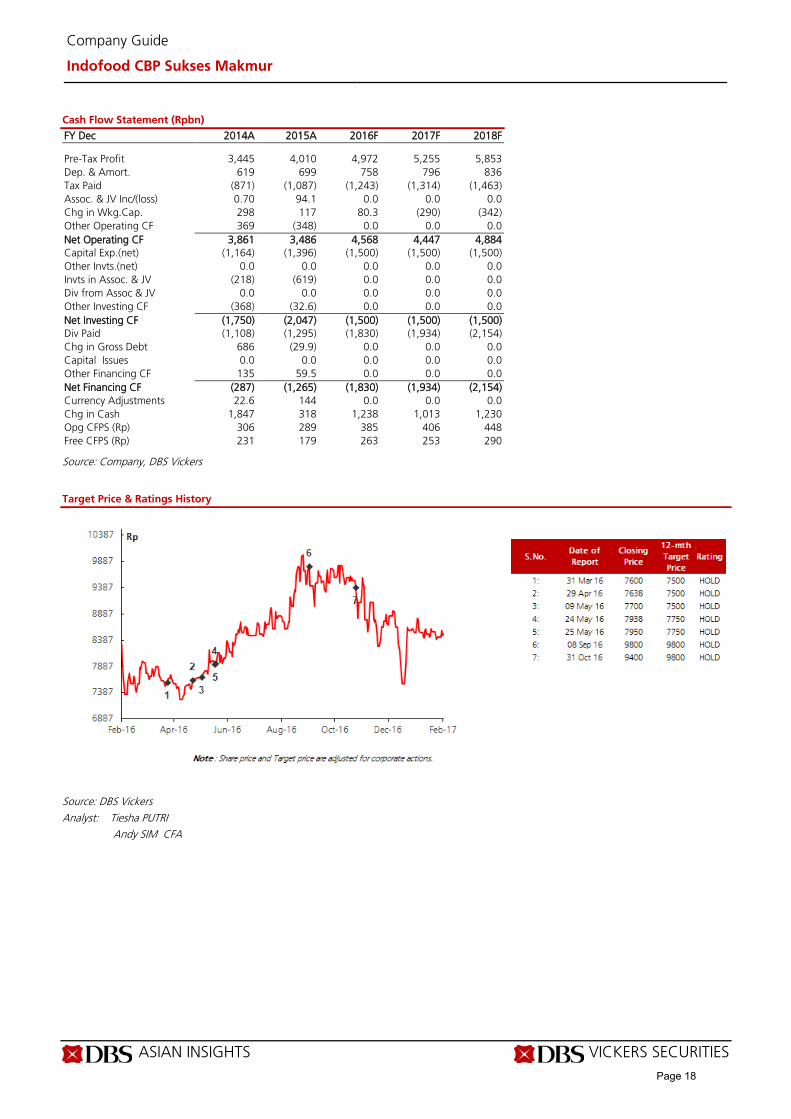
Target Price & Ratings History
Source: DBS Vickers
Analyst: Tiesha PUTRI Andy SIM CFA
Page 18
ASIAN INSIGHTS VICKERS SECURITIES ed: CK / sa:MA, PY
BUY Last Traded Price ( 8 Feb 2017): Rp7,950 (JCI : 5,361.10) Price Target 12-mth: Rp9,100 (14% upside) (Prev Rp9,900) Potential Catalyst: Stronger pick-up in domestic consumption and recovery in CPO price Where we differ: Broadly in line with consensus Analyst Tiesha PUTRI +6221 30034931 [email protected] Andy SIM CFA +65 6682 3718 [email protected]
What’s New • Attractive valuation; trades at 22% to its SOP
valuation • Agribusiness to support earnings growth in FY17 • Potential valuation upgrade post Minzhong
divestment
Price Relative
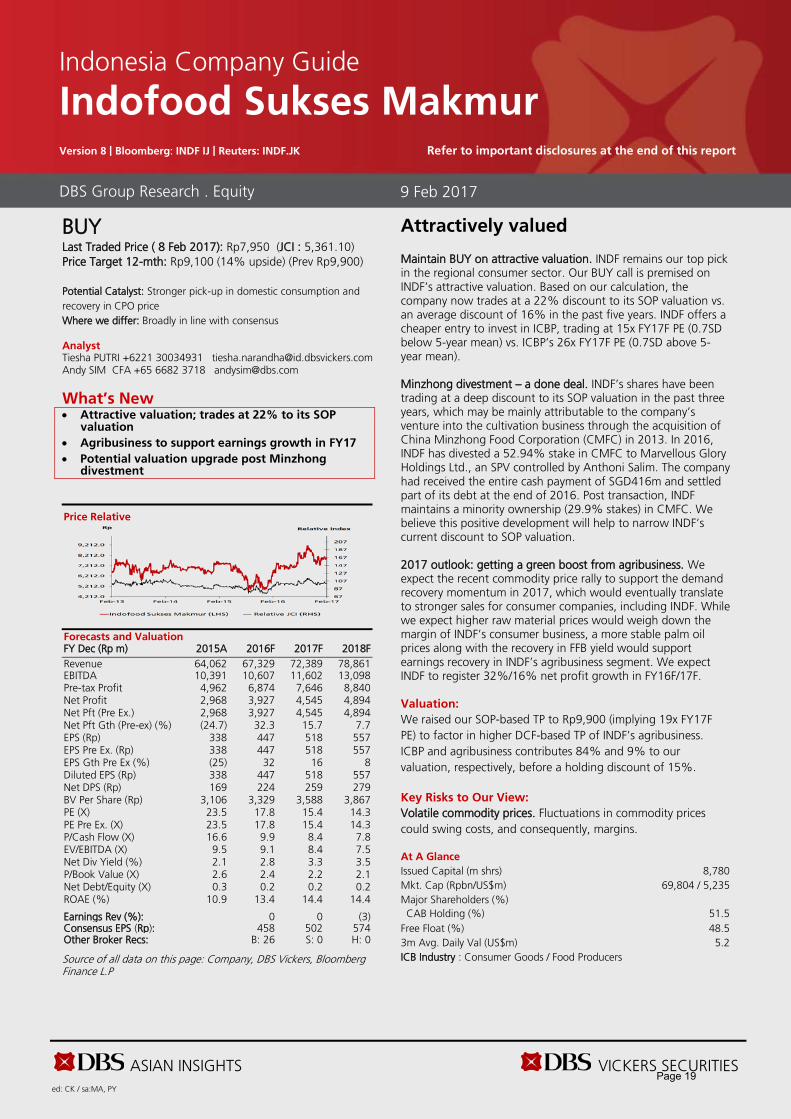
Forecasts and Valuation FY Dec (Rp m) 2015A 2016F 2017F 2018F Revenue 64,062 67,329 72,389 78,861 EBITDA 10,391 10,607 11,602 13,098 Pre-tax Profit 4,962 6,874 7,646 8,840 Net Profit 2,968 3,927 4,545 4,894 Net Pft (Pre Ex.) 2,968 3,927 4,545 4,894 Net Pft Gth (Pre-ex) (%) (24.7) 32.3 15.7 7.7 EPS (Rp) 338 447 518 557 EPS Pre Ex. (Rp) 338 447 518 557 EPS Gth Pre Ex (%) (25) 32 16 8 Diluted EPS (Rp) 338 447 518 557 Net DPS (Rp) 169 224 259 279 BV Per Share (Rp) 3,106 3,329 3,588 3,867 PE (X) 23.5 17.8 15.4 14.3 PE Pre Ex. (X) 23.5 17.8 15.4 14.3 P/Cash Flow (X) 16.6 9.9 8.4 7.8 EV/EBITDA (X) 9.5 9.1 8.4 7.5 Net Div Yield (%) 2.1 2.8 3.3 3.5 P/Book Value (X) 2.6 2.4 2.2 2.1 Net Debt/Equity (X) 0.3 0.2 0.2 0.2 ROAE (%) 10.9 13.4 14.4 14.4 Earnings Rev (%): 0 0 (3) Consensus EPS (Rp): 458 502 574 Other Broker Recs: B: 26 S: 0 H: 0
Source of all data on this page: Company, DBS Vickers, Bloomberg Finance L.P
Attractively valued Maintain BUY on attractive valuation. INDF remains our top pick in the regional consumer sector. Our BUY call is premised on INDF’s attractive valuation. Based on our calculation, the company now trades at a 22% discount to its SOP valuation vs. an average discount of 16% in the past five years. INDF offers a cheaper entry to invest in ICBP, trading at 15x FY17F PE (0.7SD below 5-year mean) vs. ICBP’s 26x FY17F PE (0.7SD above 5-year mean). Minzhong divestment – a done deal. INDF’s shares have been trading at a deep discount to its SOP valuation in the past three years, which may be mainly attributable to the company’s venture into the cultivation business through the acquisition of China Minzhong Food Corporation (CMFC) in 2013. In 2016, INDF has divested a 52.94% stake in CMFC to Marvellous Glory Holdings Ltd., an SPV controlled by Anthoni Salim. The company had received the entire cash payment of SGD416m and settled part of its debt at the end of 2016. Post transaction, INDF maintains a minority ownership (29.9% stakes) in CMFC. We believe this positive development will help to narrow INDF’s current discount to SOP valuation. 2017 outlook: getting a green boost from agribusiness. We expect the recent commodity price rally to support the demand recovery momentum in 2017, which would eventually translate to stronger sales for consumer companies, including INDF. While we expect higher raw material prices would weigh down the margin of INDF’s consumer business, a more stable palm oil prices along with the recovery in FFB yield would support earnings recovery in INDF’s agribusiness segment. We expect INDF to register 32%/16% net profit growth in FY16F/17F. Valuation: We raised our SOP-based TP to Rp9,900 (implying 19x FY17F PE) to factor in higher DCF-based TP of INDF’s agribusiness. ICBP and agribusiness contributes 84% and 9% to our valuation, respectively, before a holding discount of 15%. Key Risks to Our View: Volatile commodity prices. Fluctuations in commodity prices could swing costs, and consequently, margins. At A Glance Issued Capital (m shrs) 8,780 Mkt. Cap (Rpbn/US$m) 69,804 / 5,235 Major Shareholders (%) CAB Holding (%) 51.5
Free Float (%) 48.5 3m Avg. Daily Val (US$m) 5.2 ICB Industry : Consumer Goods / Food Producers
DBS Group Research . Equity
9 Feb 2017
Indonesia Company Guide
Indofood Sukses Makmur Version 8 | Bloomberg: INDF IJ | Reuters: INDF.JK Refer to important disclosures at the end of this report
Page 19

ASIAN INSIGHTS VICKERS SECURITIES Page 2
Company Guide
Indofood Sukses Makmur
Sum-of-parts (SOP) valuation
Source: DBS Vickers, DBS Bank
INDF’s SOP valuation discount trend in the past five years
Source: DBS Vickers, DBS Bank, Bloomberg Finance L.P
INDF’s SOP valuation vs. CPO price
Source: DBS Vickers, DBS Bank, Bloomberg Finance L.P
Ent it yINDF 's ef fect iv e shareholding
EVadj, to INDF 's
ownership(Rp bn)
A dj. EV per share
(Rp)Remark s
ICBP 80.5% 78,787 8,973 DBS target price; pegged to 26x FY17F EPS or +1SD above historical mean (lowered from 29x
FY17F EPS or +2SD above historical mean initially )
Bogasari 100.0% 12,814 1,459 6x FY17F EV/EBITDA
Indofood Agri Resources 62.8% 9,801 1,116 DBS target price; DCF-based
Distribution 100.0% 2,280 260 6x FY17F EV/EBITDA
China Minzhong 29.9% 499 57 Offer price for majority stake
Net debt/ cash (9,684) (1,103)
Holding company di ( )
(14,175) (1,614)
Target price 80,324 9,100 Implied PE 17F 17.6
-22%
-16%
-50%-40%-30%-20%-10%
0%10%20%30%40%50%
Sep-
11
Dec
-11
Mar
-12
Jun-
12
Sep-
12
Dec
-12
Mar
-13
Jun-
13
Sep-
13
Dec
-13
Mar
-14
Jun-
14
Sep-
14
Dec
-14
Mar
-15
Jun-
15
Sep-
15
Dec
-15
Mar
-16
Jun-
16
Sep-
16
Dec
-16
Premium (discount) to RNAV Avg. Premium (discount) to RNAV
INDF divested 52.94% stakes
in CMFC
INDF acquired 29.33% stakes
in CMFC
INDF owned 82.88% stakes
in CMFC
1,500
2,000
2,500
3,000
3,500
4,000
-50%-40%-30%-20%-10%
0%10%20%30%40%50%
Sep-
11
Dec
-11
Mar
-12
Jun-
12
Sep-
12
Dec
-12
Mar
-13
Jun-
13
Sep-
13
Dec
-13
Mar
-14
Jun-
14
Sep-
14
Dec
-14
Mar
-15
Jun-
15
Sep-
15
Dec
-15
Mar
-16
Jun-
16
Sep-
16
Dec
-16
Premium (discount) to RNAV CPO price (RHS)
Page 20

ASIAN INSIGHTS VICKERS SECURITIES Page 3
Company Guide
Indofood Sukses Makmur
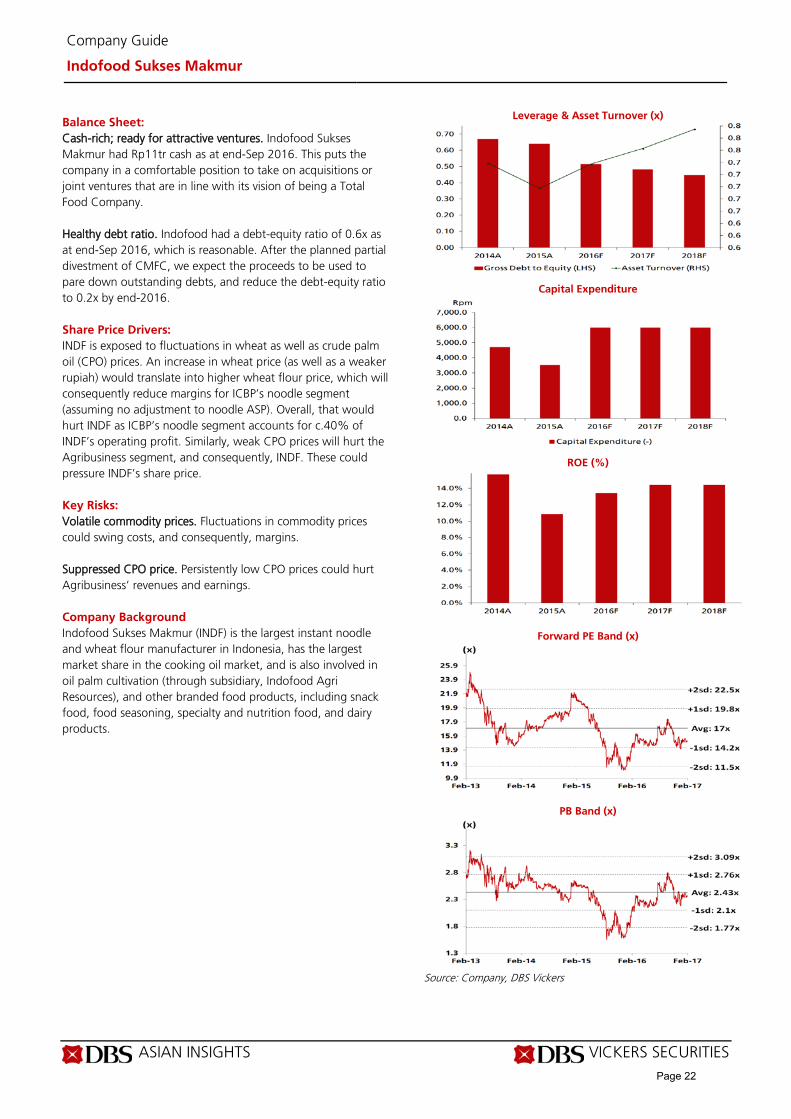
CRITICAL DATA POINTS TO WATCH Earnings Drivers: Consumer Branded Products (CBP) segment is the primary earnings driver. In 2015, Indofood’s CBP segment contributed more than 50% of INDF’s EBIT. Agribusiness and Bogasari contributed 20% and 18% respectively. Growth in the CBP segment is predominantly driven by the noodle business which generated c.90% of ICBP’s earnings in FY15. Also, noodles are considered a cheap substitute to rice for many Indonesians, which is why noodle sales are relatively resilient even in a slow economy. Wheat price and rupiah strength. Bogasari produces wheat flour, of which 30% is used by ICBP, 65% is sold to SMEs, and the rest to retail consumers. Bogasari imports its entire wheat requirements, which means it is susceptible to fluctuations in global wheat prices and the strength of the rupiah. It adjusts average selling price according to its costs, which eventually affects ICBP’s margins. The sharp depreciation of the rupiah in 2013-14 had reduced EBIT margins at the CBP segment by about 300bps to 10.2% in 2014 from 13.1% in 2012. CPO price and output. The Agribusiness segment, under 62.8%-owned subsidiary Indofood Agri Resources (IFAR SP), is involved in both upstream and downstream operations. Our plantation analyst expects a flattish CPO price in FY17F, but sales volume recovery should help to boost Agribusiness’ performance next year with EBIT projected to grow 19% y-o-y in FY17F after staying flat y-o-y in FY16F. The Agribusiness segment contributed 20% and 15% of Indofood’s FY15 and 9M16 EBIT respectively. Recovery in the domestic economy. We are expecting a gradual recovery in consumption going into 2017. This, coupled with favourable soft commodity prices and stabilising rupiah, should support INDF’s earnings growth, particularly for its CBP and Bogasari segments. As for the latter, around 65% of Bogasari’s wheat flour is sold to SMEs. Improving domestic consumer demand would eventually lead to more business expansion by SMEs and higher demand for wheat flour. Competition in FMCG industry. Indonesia’s rising consumerism has attracted a number of new local and foreign players to the Fast Moving Consumer Goods (FMCG) industry. Rising competition would dent INDF’s pricing power and top-line growth for its consumer goods products. In the event of rising input costs, weak competitive position would result in INDF not being able to pass through the rising costs, hence a drag on earnings.
Revenue Trend and Forecasts
Net Profit Trend and Forecasts
Margin Trend and Forecasts
CBOT Wheat Price
CPO Price
Source: Company, DBS Vickers
-
2%
4%
6%
8%
10%
12%
14%
16%
0
10,000
20,000
30,000
40,000
50,000
60,000
70,000
80,000
2013A 2014A 2015A 2016F 2017F
Revenue (Rp bn) Growth y-o-y (RHS)
(30%)
(20%)
(10%)
-
10%
20%
30%
40%
50%
60%
70%
0
500
1,000
1,500
2,000
2,500
3,000
3,500
4,000
4,500
5,000
2013A 2014A 2015A 2016F 2017F
Net profit (Rp bn) Growth y-o-y (RHS)
-
2.0%
4.0%
6.0%
8.0%
10.0%
12.0%
14.0%
2013A 2014A 2015A 2016F 2017F
EBIT margin Net margin
300
350
400
450
500
550
600
650
Jan-15 Jul-15 Jan-16 Jul-16 Jan-17
Wheat (cents/bu.) Quarterly avg. price
1,500
1,700
1,900
2,100
2,300
2,500
2,700
2,900
3,100
3,300
3,500
Jan-15 Jul-15 Jan-16 Jul-16 Jan-17
CPO price (MYR/MT) Quarterly avg. price
Page 21
ASIAN INSIGHTS VICKERS SECURITIES Page 4
Company Guide
Indofood Sukses Makmur
Balance Sheet: Cash-rich; ready for attractive ventures. Indofood Sukses Makmur had Rp11tr cash as at end-Sep 2016. This puts the company in a comfortable position to take on acquisitions or joint ventures that are in line with its vision of being a Total Food Company. Healthy debt ratio. Indofood had a debt-equity ratio of 0.6x as at end-Sep 2016, which is reasonable. After the planned partial divestment of CMFC, we expect the proceeds to be used to pare down outstanding debts, and reduce the debt-equity ratio to 0.2x by end-2016. Share Price Drivers: INDF is exposed to fluctuations in wheat as well as crude palm oil (CPO) prices. An increase in wheat price (as well as a weaker rupiah) would translate into higher wheat flour price, which will consequently reduce margins for ICBP’s noodle segment (assuming no adjustment to noodle ASP). Overall, that would hurt INDF as ICBP’s noodle segment accounts for c.40% of INDF’s operating profit. Similarly, weak CPO prices will hurt the Agribusiness segment, and consequently, INDF. These could pressure INDF’s share price. Key Risks: Volatile commodity prices. Fluctuations in commodity prices could swing costs, and consequently, margins. Suppressed CPO price. Persistently low CPO prices could hurt Agribusiness’ revenues and earnings. Company Background Indofood Sukses Makmur (INDF) is the largest instant noodle and wheat flour manufacturer in Indonesia, has the largest market share in the cooking oil market, and is also involved in oil palm cultivation (through subsidiary, Indofood Agri Resources), and other branded food products, including snack food, food seasoning, specialty and nutrition food, and dairy products.
Leverage & Asset Turnover (x)
Capital Expenditure
ROE (%)
Forward PE Band (x)
PB Band (x)
Source: Company, DBS Vickers
Page 22
ASIAN INSIGHTS VICKERS SECURITIES Page 5
Company Guide
Indofood Sukses Makmur
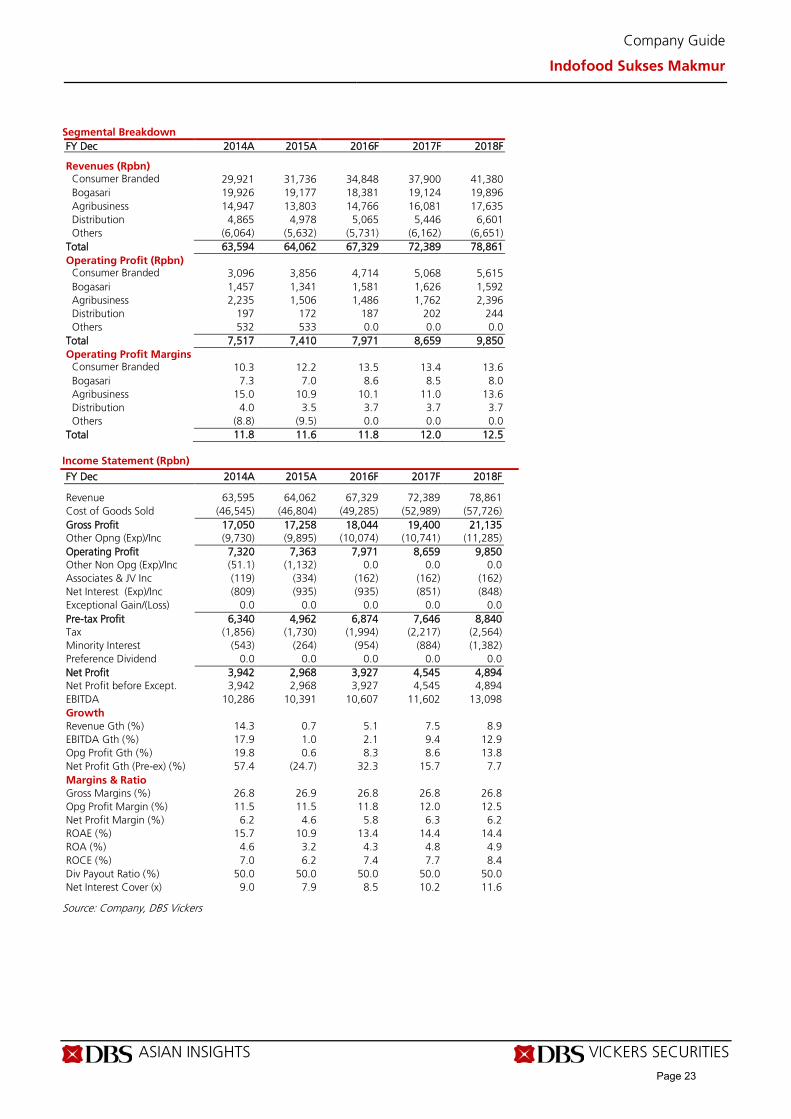
Segmental Breakdown FY Dec 2014A 2015A 2016F 2017F 2018F Revenues (Rpbn) Consumer Branded
29,921 31,736 34,848 37,900 41,380
Bogasari 19,926 19,177 18,381 19,124 19,896 Agribusiness 14,947 13,803 14,766 16,081 17,635 Distribution 4,865 4,978 5,065 5,446 6,601 Others (6,064) (5,632) (5,731) (6,162) (6,651) Total 63,594 64,062 67,329 72,389 78,861 Operating Profit (Rpbn) Consumer Branded
3,096 3,856 4,714 5,068 5,615
Bogasari 1,457 1,341 1,581 1,626 1,592 Agribusiness 2,235 1,506 1,486 1,762 2,396 Distribution 197 172 187 202 244 Others 532 533 0.0 0.0 0.0 Total 7,517 7,410 7,971 8,659 9,850 Operating Profit Margins
Consumer Branded
10.3 12.2 13.5 13.4 13.6 Bogasari 7.3 7.0 8.6 8.5 8.0 Agribusiness 15.0 10.9 10.1 11.0 13.6 Distribution 4.0 3.5 3.7 3.7 3.7 Others (8.8) (9.5) 0.0 0.0 0.0 Total 11.8 11.6 11.8 12.0 12.5
Income Statement (Rpbn)
FY Dec 2014A 2015A 2016F 2017F 2018F Revenue 63,595 64,062 67,329 72,389 78,861 Cost of Goods Sold (46,545) (46,804) (49,285) (52,989) (57,726) Gross Profit 17,050 17,258 18,044 19,400 21,135 Other Opng (Exp)/Inc (9,730) (9,895) (10,074) (10,741) (11,285) Operating Profit 7,320 7,363 7,971 8,659 9,850 Other Non Opg (Exp)/Inc (51.1) (1,132) 0.0 0.0 0.0 Associates & JV Inc (119) (334) (162) (162) (162) Net Interest (Exp)/Inc (809) (935) (935) (851) (848) Exceptional Gain/(Loss) 0.0 0.0 0.0 0.0 0.0 Pre-tax Profit 6,340 4,962 6,874 7,646 8,840 Tax (1,856) (1,730) (1,994) (2,217) (2,564) Minority Interest (543) (264) (954) (884) (1,382) Preference Dividend 0.0 0.0 0.0 0.0 0.0 Net Profit 3,942 2,968 3,927 4,545 4,894 Net Profit before Except. 3,942 2,968 3,927 4,545 4,894 EBITDA 10,286 10,391 10,607 11,602 13,098 Growth Revenue Gth (%) 14.3 0.7 5.1 7.5 8.9 EBITDA Gth (%) 17.9 1.0 2.1 9.4 12.9 Opg Profit Gth (%) 19.8 0.6 8.3 8.6 13.8 Net Profit Gth (Pre-ex) (%) 57.4 (24.7) 32.3 15.7 7.7 Margins & Ratio Gross Margins (%) 26.8 26.9 26.8 26.8 26.8 Opg Profit Margin (%) 11.5 11.5 11.8 12.0 12.5 Net Profit Margin (%) 6.2 4.6 5.8 6.3 6.2 ROAE (%) 15.7 10.9 13.4 14.4 14.4 ROA (%) 4.6 3.2 4.3 4.8 4.9 ROCE (%) 7.0 6.2 7.4 7.7 8.4 Div Payout Ratio (%) 50.0 50.0 50.0 50.0 50.0 Net Interest Cover (x) 9.0 7.9 8.5 10.2 11.6
Source: Company, DBS Vickers
Page 23

ASIAN INSIGHTS VICKERS SECURITIES Page 6
Company Guide
Indofood Sukses Makmur
Quarterly / Interim Income Statement (Rpbn)
FY Dec 3Q2015 4Q2015 1Q2016 2Q2016 3Q2016 Revenue 14,929 16,498 16,516 17,568 15,782 Cost of Goods Sold (11,015) (12,107) (11,902) (12,383) (11,020) Gross Profit 3,915 4,391 4,614 5,186 4,762 Other Oper. (Exp)/Inc (2,341) (2,453) (2,735) (3,051) (2,844) Operating Profit 1,574 1,938 1,879 2,135 1,918 Other Non Opg (Exp)/Inc (1,125) 710 0.0 0.0 0.0 Associates & JV Inc (109) (50.6) (78.4) (116) 7.40 Net Interest (Exp)/Inc (286) (258) (69.8) (161) (56.8) Exceptional Gain/(Loss) 29.9 55.7 101 82.6 86.2 Pre-tax Profit 83.6 2,395 1,832 1,941 1,955 Tax (97.0) (793) (468) (547) (613) Minority Interest (34.0) (318) (278) (249) (333) Net Profit (47.3) 1,284 1,086 1,146 1,009 Net profit bef Except. (77.2) 1,229 985 1,063 923 EBITDA 2,227 2,539 2,487 3,391 3,917 Growth Revenue Gth (%) (15.2) 10.5 0.1 6.4 (10.2) EBITDA Gth (%) (16.6) 14.0 (2.0) 36.3 15.5 Opg Profit Gth (%) (25.1) 23.1 (3.1) 13.6 (10.2) Net Profit Gth (Pre-ex) (%) nm nm (19.9) 7.9 (13.2) Margins Gross Margins (%) 26.2 26.6 27.9 29.5 30.2 Opg Profit Margins (%) 10.5 11.7 11.4 12.2 12.2 Net Profit Margins (%) (0.3) 7.8 6.6 6.5 6.4
Balance Sheet (Rpbn)
FY Dec 2014A 2015A 2016F 2017F 2018F Net Fixed Assets 30,575 34,184 33,644 36,701 39,452 Invts in Associates & JVs 0.0 0.0 0.0 0.0 0.0 Other LT Assets 14,488 14,831 14,669 14,507 14,345 Cash & ST Invts 14,823 14,167 13,272 13,351 13,843 Inventory 8,446 7,627 8,463 9,099 9,912 Debtors 4,358 5,117 5,350 5,318 5,794 Other Current Assets 13,386 15,906 15,906 15,906 15,906 Total Assets 86,077 91,832 91,303 94,882 99,253 ST Debt
10,096 10,712 10,712 10,712 10,712 Creditor 5,093 5,174 5,632 6,055 6,597 Other Current Liab 7,470 9,222 9,222 9,222 9,222 LT Debt 16,838 16,894 12,990 12,990 12,990 Other LT Liabilities 6,306 6,708 6,708 6,708 6,708 Shareholder’s Equity 25,104 27,269 29,233 31,506 33,953 Minority Interests 15,170 15,852 16,806 17,689 19,072 Total Cap. & Liab. 86,077 91,832 91,303 94,882 99,253 Non-Cash Wkg. Capital 13,628 14,254 14,865 15,046 15,794 Net Cash/(Debt) (12,110) (13,439) (10,430) (10,351) (9,859) Debtors Turn (avg days) 25.0 29.2 29.0 26.8 26.8 Creditors Turn (avg days) 42.7 43.1 44.1 44.2 44.2 Inventory Turn (avg days) 70.7 63.6 66.2 66.4 66.4 Asset Turnover (x) 0.7 0.7 0.7 0.8 0.8 Current Ratio (x) 1.8 1.7 1.7 1.7 1.7 Quick Ratio (x) 0.8 0.8 0.7 0.7 0.7 Net Debt/Equity (X) 0.3 0.3 0.2 0.2 0.2 Net Debt/Equity ex MI (X) 0.5 0.5 0.4 0.3 0.3 Capex to Debt (%) 17.5 12.8 25.3 25.3 25.3 Z-Score (X) 2.5 2.4 2.6 2.6 2.7
Source: Company, DBS Vickers
Page 24
ASIAN INSIGHTS VICKERS SECURITIES Page 7
Company Guide
Indofood Sukses Makmur
Cash Flow Statement (Rpbn)
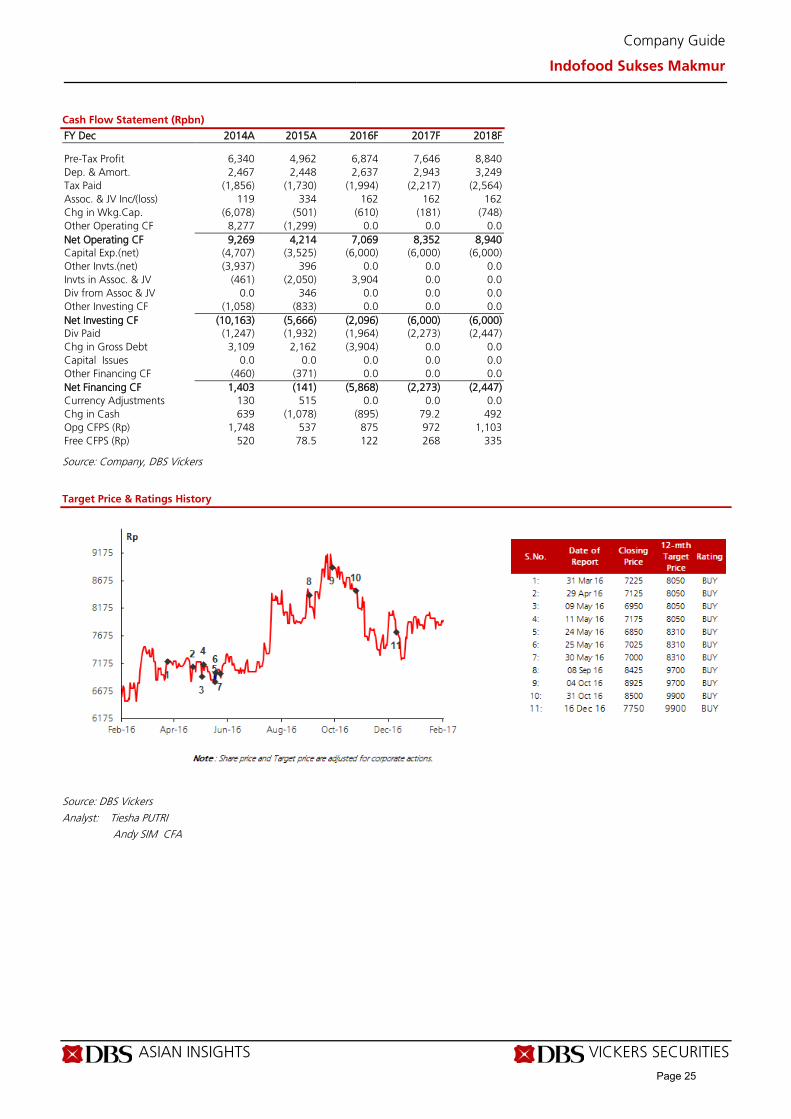
FY Dec 2014A 2015A 2016F 2017F 2018F Pre-Tax Profit 6,340 4,962 6,874 7,646 8,840 Dep. & Amort. 2,467 2,448 2,637 2,943 3,249 Tax Paid (1,856) (1,730) (1,994) (2,217) (2,564) Assoc. & JV Inc/(loss) 119 334 162 162 162 Chg in Wkg.Cap. (6,078) (501) (610) (181) (748) Other Operating CF 8,277 (1,299) 0.0 0.0 0.0 Net Operating CF 9,269 4,214 7,069 8,352 8,940 Capital Exp.(net) (4,707) (3,525) (6,000) (6,000) (6,000) Other Invts.(net) (3,937) 396 0.0 0.0 0.0 Invts in Assoc. & JV (461) (2,050) 3,904 0.0 0.0 Div from Assoc & JV 0.0 346 0.0 0.0 0.0 Other Investing CF (1,058) (833) 0.0 0.0 0.0 Net Investing CF (10,163) (5,666) (2,096) (6,000) (6,000) Div Paid (1,247) (1,932) (1,964) (2,273) (2,447) Chg in Gross Debt 3,109 2,162 (3,904) 0.0 0.0 Capital Issues 0.0 0.0 0.0 0.0 0.0 Other Financing CF (460) (371) 0.0 0.0 0.0 Net Financing CF 1,403 (141) (5,868) (2,273) (2,447) Currency Adjustments 130 515 0.0 0.0 0.0 Chg in Cash 639 (1,078) (895) 79.2 492 Opg CFPS (Rp) 1,748 537 875 972 1,103 Free CFPS (Rp) 520 78.5 122 268 335
Source: Company, DBS Vickers
Target Price & Ratings History
Source: DBS Vickers
Analyst: Tiesha PUTRI Andy SIM CFA
Page 25
ASIAN INSIGHTS VICKERS SECURITIES ed: CK / sa:MA, PY
HOLD Last Traded Price ( 8 Feb 2017): Rp15,325 (JCI : 5,361.10) Price Target 12-mth: Rp16,200 (6% upside) (Prev Rp20,300) Potential Catalyst: Strong pick-up in same-store sales growth Where we differ: Generally in line with consensus Analyst Tiesha PUTRI +6221 30034931 [email protected] Andy SIM CFA +65 6682 3718 [email protected]
What’s New • Lowering SSSG and earnings forecasts; maintain
HOLD with a lower TP of Rp16,200 • Share price has de-rated sharply; our DDM
valuation analysis suggests that it is fairly valued • Lack of catalysts, with discretionary spending yet
to show signs of bottoming
Price Relative
Forecasts and Valuation FY Dec (Rp m) 2015A 2016F 2017F 2018F Revenue 9,007 9,949 11,033 12,304 EBITDA 2,564 2,906 3,286 3,682 Pre-tax Profit 2,245 2,641 2,971 3,317 Net Profit 1,781 2,095 2,357 2,631 Net Pft (Pre Ex.) 1,781 2,095 2,357 2,631 Net Pft Gth (Pre-ex) (%) 25.5 17.6 12.5 11.6 EPS (Rp) 610 718 808 902 EPS Pre Ex. (Rp) 610 718 808 902 EPS Gth Pre Ex (%) 25 18 13 12 Diluted EPS (Rp) 610 718 808 902 Net DPS (Rp) 427 503 565 631 BV Per Share (Rp) 379 670 975 1,311 PE (X) 25.1 21.3 19.0 17.0 PE Pre Ex. (X) 25.1 21.3 19.0 17.0 P/Cash Flow (X) 20.6 18.7 16.2 14.4 EV/EBITDA (X) 17.1 14.9 13.1 11.4 Net Div Yield (%) 2.8 3.3 3.7 4.1 P/Book Value (X) 40.4 22.9 15.7 11.7 Net Debt/Equity (X) CASH CASH CASH CASH ROAE (%) 161.0 107.2 82.9 68.8 Earnings Rev (%): (2) (3) (6) Consensus EPS (Rp): 735 844 941 Other Broker Recs: B: 27 S: 2 H: 3
Source of all data on this page: Company, DBS Vickers, Bloomberg Finance L.P
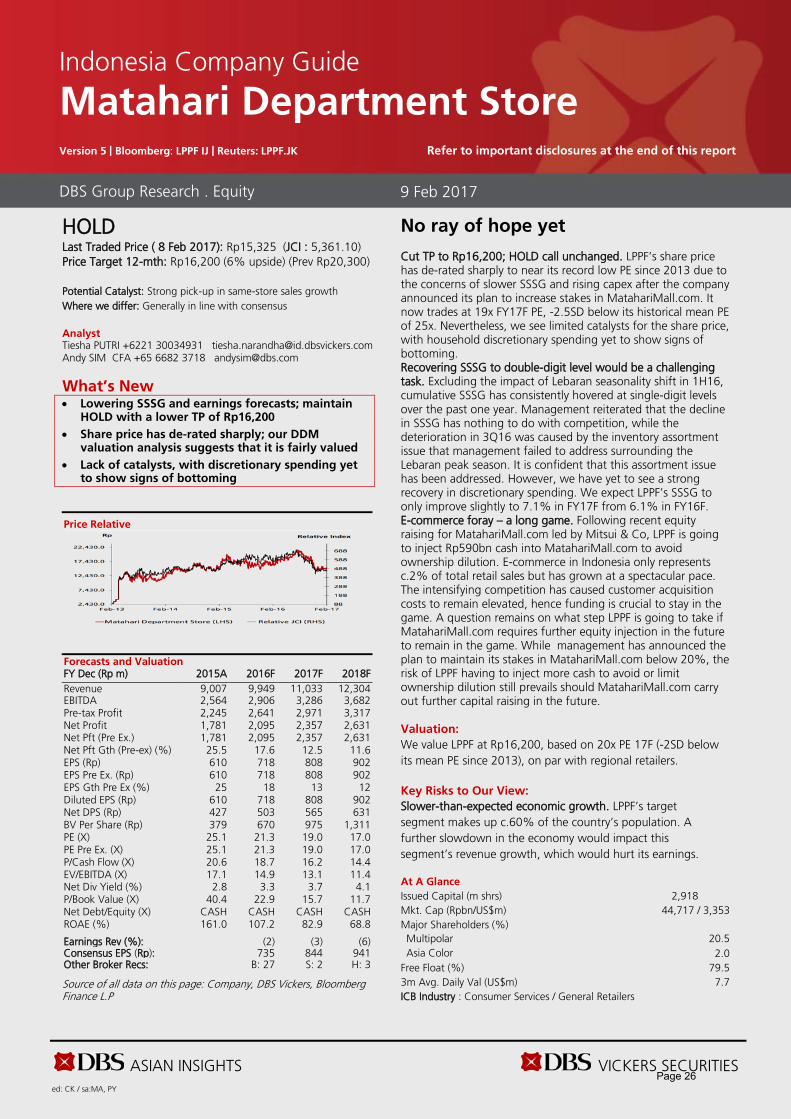
No ray of hope yet Cut TP to Rp16,200; HOLD call unchanged. LPPF’s share price has de-rated sharply to near its record low PE since 2013 due to the concerns of slower SSSG and rising capex after the company announced its plan to increase stakes in MatahariMall.com. It now trades at 19x FY17F PE, -2.5SD below its historical mean PE of 25x. Nevertheless, we see limited catalysts for the share price, with household discretionary spending yet to show signs of bottoming. Recovering SSSG to double-digit level would be a challenging task. Excluding the impact of Lebaran seasonality shift in 1H16, cumulative SSSG has consistently hovered at single-digit levels over the past one year. Management reiterated that the decline in SSSG has nothing to do with competition, while the deterioration in 3Q16 was caused by the inventory assortment issue that management failed to address surrounding the Lebaran peak season. It is confident that this assortment issue has been addressed. However, we have yet to see a strong recovery in discretionary spending. We expect LPPF’s SSSG to only improve slightly to 7.1% in FY17F from 6.1% in FY16F. E-commerce foray – a long game. Following recent equity raising for MatahariMall.com led by Mitsui & Co, LPPF is going to inject Rp590bn cash into MatahariMall.com to avoid ownership dilution. E-commerce in Indonesia only represents c.2% of total retail sales but has grown at a spectacular pace. The intensifying competition has caused customer acquisition costs to remain elevated, hence funding is crucial to stay in the game. A question remains on what step LPPF is going to take if MatahariMall.com requires further equity injection in the future to remain in the game. While management has announced the plan to maintain its stakes in MatahariMall.com below 20%, the risk of LPPF having to inject more cash to avoid or limit ownership dilution still prevails should MatahariMall.com carry out further capital raising in the future. Valuation: We value LPPF at Rp16,200, based on 20x PE 17F (-2SD below its mean PE since 2013), on par with regional retailers. Key Risks to Our View: Slower-than-expected economic growth. LPPF’s target segment makes up c.60% of the country’s population. A further slowdown in the economy would impact this segment’s revenue growth, which would hurt its earnings. At A Glance Issued Capital (m shrs) 2,918 Mkt. Cap (Rpbn/US$m) 44,717 / 3,353 Major Shareholders (%) Multipolar 20.5 Asia Color 2.0
Free Float (%) 79.5 3m Avg. Daily Val (US$m) 7.7 ICB Industry : Consumer Services / General Retailers
DBS Group Research . Equity
9 Feb 2017
Indonesia Company Guide
Matahari Department Store Version 5 | Bloomberg: LPPF IJ | Reuters: LPPF.JK Refer to important disclosures at the end of this report
Page 26
ASIAN INSIGHTS VICKERS SECURITIES Page 2
Company Guide
Matahari Department Store
WHAT’S NEW
Fairly valued; lack of substantial positive catalysts ahead SSSG had consistently hovered at single-digit levels, reflecting the economic cycle. Following weaker-than-expected SSSG in 3Q16, management has lowered its SSSG guidance for FY16 to 5%-6.5% vs. its initial guidance of 7%-7.5%. Management claimed that the reason behind the weak 3Q16 sales was the misstep in inventory assortment surrounding the Lebaran peak season, particularly for women’s apparels, rather than competition from online or specialty retailers. On top of that, discretionary spending had remained muted in 3Q16, which we believe also contributed to the decline in SSSG.
The subsequent chart shows that LPPF’s SSSG has broadly moved in line with nominal household consumption growth. We expect the demand recovery momentum to continue in 2017 but only at a gradual pace. While demand for necessities had generally improved in 3Q16, discretionary household spending growth has yet to show signs of bottoming as it further eased to 4.3% y-o-y in 4Q16, still lagging behind non-discretionary household spending. We do not see a strong reason to expect a surge in nominal household consumption growth in the near future, which in the past year hovered between 7% and 8%. For this reason, restoring SSSG to double-digit levels would be a challenging task for LPPF, in our view. We now project LPPF’s same-store sales to grow by 6.1% in 2016F and 7.1% in 2017F (from 7.6%/8.4% for FY16F/FY17F initially). We therefore lower our net profit forecasts by 2%/3% for FY16F/FY17F. We expect LPPF net profit to grow by 18% in FY16F and 13% in FY17F.
A change in strategy? LPPF has committed Rp590bn cash to be injected in stages into Lippo Group’s e-commerce arm MatahariMall.com from the end of 2016 to 3Q17. The additional investment is made to avoid LPPF’s ownership dilution in MatahariMall.com, which recently raised equity of USD100m – led by Japan’s Mitsui & Co. Prior to this, LPPF owned a minority stake of 9.47% in MatahariMall.com.
There appears to be a change in management’s strategy with regard to LPPF’s investment in MatahariMall.com as it previously guided for no further investment in MatahariMall.com. Looking ahead, the company aims to maintain its stake in MatahariMall.com below 20%.
In a statement release to the public, management stated that it had not planned to participate in any further funding initiatives by MatahariMall.com, but the question remains on how far LPPF would let its stake in MatahariMall.com being diluted should MatahariMall.com require further equity raising after 3Q17. Not letting its stakes being diluted would mean that LPPF has to top up its investment in
MatahariMall.com, possibly at a higher price. We note that in 7M16, MatahariMall.com booked a significant loss of Rp490bn.
PE multiple has de-rated sharply to 2.5SD below historical mean. LPPF now trades at 19x PE 17F, -2.5SD below its historical mean since April 2013. The sharp de-rating in the past month has brought down LPPF’s PE multiple to a level that is on par with regional peers despite having the highest ROE. We believe most of the negatives, including the increase of investment in MatahariMall.com, are already reflected in the share price.
The company generates more than enough operating cash flow to cover its capex annually and even if we are to assume an increase in inventory days by 10 days in 2017 and 2018 due to a persistently weak demand environment or management’s push toward direct purchase sales, our calculation shows that LPPF can still generate Rp2.4tr/Rp2.6tr operating cash flow in 2017F/2018F. If the company maintains a dividend payout ratio of 70% in the same period and double its capex budget to Rp1tr per year, it can still fund the expansion using internal cash.
Our DDM valuation analysis suggests limited downside to current share price. We ran a three-stage DDM valuation analysis to estimate the level of reduction in potential future dividends that the current share price has priced in. Currently, LPPF maintains a dividend payout ratio of 70% despite its ability to raise it to 100%. Our DDM model assumes LPPF will grow its dividend at 13% CAGR over the next 10 years on the back of: 1) 11% net profit and dividend CAGR in the first five years, 2) 7% net profit CAGR in the subsequent five years and a linear increase in dividend payout ratio (DPR) from 70% in year-5 to 100% in year-10, and 3) stable growth rate of 6% from year-11 onwards. We assume SSSG of 6%-7% in our model
Based on our calculation, LPPF’s current share price range of Rp14,800-Rp15,700 implies a scenario of 32%-37% of annual operating cash flow or roughly Rp1.2tr-Rp1.5tr being retained to fund capex or working capital needs over the next 10 years. As a comparison, LPPF only allocates Rp450bn capex budget for FY16 (excluding investment in MatahariMall.com). This affirms our view that the current valuation has largely priced in a slowing SSSG and more importantly the risk of significant rise in capex or investment as the company works to achieve its goal to become an omnichannel retailer. Our key assumptions and sensitivity analysis on the DDM valuation are presented on the subsequent page.
Page 27

ASIAN INSIGHTS VICKERS SECURITIES Page 3
Company Guide
Matahari Department Store
We see limited positive catalysts, especially since the demand environment (particularly for discretionary spending) has yet to show signs of an encouraging pick-up. What can surprise on the upside would be if LPPF manages to improve its profitability, be it from further opex efficiency or improvement in sales mix (toward more direct purchase), and if there is further increase in its dividend payout ratio from the current level of 70%.
The company has continued to roll out initiatives to increase profitability, among which is to improve its sales mix. The company recently opens its first specialty store in Jakarta, called Nevada Store, to test the market. Nevada Store sells LPPF’s private label apparels and shoes i.e. Nevada, Connexion, Details, and Cole, which command higher margins compared to consigned merchandise. In 9M16, the higher-margin direct purchase (DP) accounted for 36.7% of LPPF’s gross sales (vs. 35.3% in 9M15). There is also room to improve its sales mix if LPPF can increase sales of women’s apparels, which command higher margins and currently only contribute 8%-9% of total sales.
Indonesia’s Internet retailing landscape in brief. Indonesia’s retail landscape is still dominated by brick-and-mortar shops while Internet retailing only makes up a small fragment with a share of less than 2% of total retail sales. It nonetheless has grown at a spectacular pace with a CAGR of 45% in 2011-2016, driven by the strong penetration of smart phones. Apparel and footware Internet retailing is the fastest growing category with a CAGR of 152% in 2011-2016. It represented 24% of total Internet retailing revenue.
Indonesia’s Internet retailing is still in the early stages, which means gaining market share remains the main objective of the key players for the time being rather than turning the business into a profitable venture. This keeps customer acquisition costs elevated given the tight competition among existing and new players to attract traffic. Two key challenges faced by online retailers in Indonesia are high unbanked population (over 70% of population does not have a bank account) and poor infrastructure.
Competition against online fashion retailers should not be overlooked. We visited some major online retailers’ websites to get the on-the-ground perspective on how intense the competition is among the players. We focus our observation on key players in fashion retailing, an area where we see that LPPF has an edge over the competitors given its long experience in the field. We limit our observation to blouse/shirt and t-shirt categories for both women and men. We also visited LPPF’s first Nevada Store in Jakarta to compare the price offerings against online fashion retailers.
The highlights from our observation are:
i. Key players are crowding into middle-class apparel market. The Alibaba-backed Lazada, Zalora and BerryBenka on average have 90% of SKU with final price (after discount) ranging between Rp100,000- 300,000 (USD8-22). As a comparison, the average basket size of LPPF’s offline stores is c.USD20. Increasing competition against online retailers should not be overlooked, especially since LPPF caters to the middle-class segment, which could turn increasingly price sensitive when the economy slows.
ii. For LPPF’s private label items, discount on online store nearly doubled that given on onffline stores. Discounts given on MatahariMall.com are generally higher than those in Nevada Store (offline). We observed that a 20% promotional discount is given on apparels sold in Nevada Store. The similar items are sold at a 36% discount on MatahariMall.com. It is worth noting that any promotional discount given for purchases made through MatahariMall.com is borne by LPPF. The impact of heavy online promotion is not significant for now as online sales contribution is still small, at less than 1% of LPPF’s total sales.
LPPF’s SSSG vs. private consumption expenditure growth
Source: Company, DBS Vickers, Bloomberg Finance L.P
Cash flow and FCFF trend and forecasts
Source: DBS Vickers
5.0
10.0
15.0
20.0
25.0
30.0
SSSG, % (LHS) Private consumption GDP (current price), %
1H16 SSSG was expectionally high due to a shift in Lebaran peak season.
(1,500)(1,000)
(500)0
500 1,000 1,500 2,000 2,500 3,000 3,500
2014A 2015A 2016F 2017F 2018F
Rp bn
Operating cash flow Cash flow from investing act. FCFF
Page 28
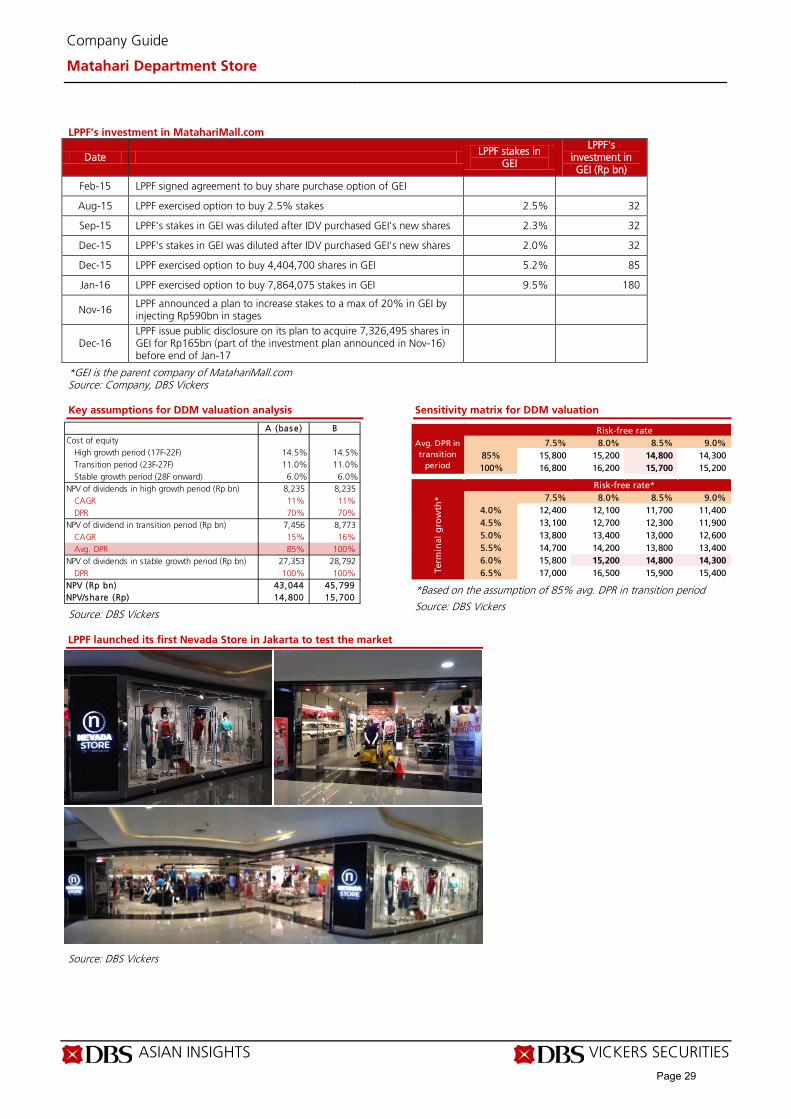
ASIAN INSIGHTS VICKERS SECURITIES Page 4
Company Guide
Matahari Department Store
LPPF’s investment in MatahariMall.com
Date LPPF stakes in GEI
LPPF's investment in GEI (Rp bn)
Feb-15 LPPF signed agreement to buy share purchase option of GEI Aug-15 LPPF exercised option to buy 2.5% stakes 2.5% 32
Sep-15 LPPF's stakes in GEI was diluted after IDV purchased GEI's new shares 2.3% 32
Dec-15 LPPF's stakes in GEI was diluted after IDV purchased GEI's new shares 2.0% 32
Dec-15 LPPF exercised option to buy 4,404,700 shares in GEI 5.2% 85
Jan-16 LPPF exercised option to buy 7,864,075 stakes in GEI 9.5% 180
Nov-16 LPPF announced a plan to increase stakes to a max of 20% in GEI by injecting Rp590bn in stages
Dec-16 LPPF issue public disclosure on its plan to acquire 7,326,495 shares in GEI for Rp165bn (part of the investment plan announced in Nov-16) before end of Jan-17
*GEI is the parent company of MatahariMall.com Source: Company, DBS Vickers Key assumptions for DDM valuation analysis
Source: DBS Vickers
Sensitivity matrix for DDM valuation
*Based on the assumption of 85% avg. DPR in transition period
Source: DBS Vickers
LPPF launched its first Nevada Store in Jakarta to test the market
Source: DBS Vickers
A (bas e ) BCost of equity
High growth period (17F-22F) 14.5% 14.5%Transition period (23F-27F) 11.0% 11.0%Stable growth period (28F onward) 6.0% 6.0%
NPV of dividends in high growth period (Rp bn) 8,235 8,235 CAGR 11% 11% DPR 70% 70%
NPV of dividend in transition period (Rp bn) 7,456 8,773 CAGR 15% 16% Avg. DPR 85% 100%
NPV of dividends in stable growth period (Rp bn) 27,353 28,792 DPR 100% 100%
NPV (Rp bn) 43,044 45,799 NPV/s hare (Rp) 14,800 15,700
7.5% 8.0% 8.5% 9.0% 85% 15,800 15,200 14,800 14,300 100% 16,800 16,200 15,700 15,200
Risk-free rateAvg. DPR in transition
period
7.5% 8.0% 8.5% 9.0% 4.0% 12,400 12,100 11,700 11,400 4.5% 13,100 12,700 12,300 11,900 5.0% 13,800 13,400 13,000 12,600 5.5% 14,700 14,200 13,800 13,400 6.0% 15,800 15,200 14,800 14,300 6.5% 17,000 16,500 15,900 15,400 Te
rmin
al g
row
th*
Risk-free rate*
Page 29

ASIAN INSIGHTS VICKERS SECURITIES Page 5
Company Guide
Matahari Department Store
CRITICAL DATA POINTS TO WATCH Earnings Drivers: Stable SSSG and new store openings. We assume 6.1%/7.1% SSSG, and the opening of 8/7 new stores in FY16F/17F. LPPF saw weaker SSSG in FY15 (i.e. 6.8%) because of generally weaker consumer spending and slower economy, especially in ex-Java islands such as Kalimantan where incomes have been affected by low commodity prices and several closures of commodity-related businesses. Kalimantan’s economy is dependent on the commodity industry, such as coal-mining and oil palm cultivation. LPPF opened 10-11 new stores annually in the past two years. For 2017, we assume that LPPF will open 7seven new stores, in line with management’s guidance. Recovery of consumer sentiment. LPPF’s target market is mid-low/middle income consumers, which make up about 60% of the country’s population. A pick-up in the consumer sentiment, represented by the Consumer Confidence Index, would help lift sales growth. Larger share of retail sales to lift margins. LPPF operates two main business segments: consignment sales and retail sales. Gross margins from retail sales (or direct purchase) are higher than from consignment sales, at c.44% vs. c.31%. Going forward, we expect retail sales to outpace consignment sales, which would expand margins as the revenue mix shifts. Expect net profit to grow at 12% CAGR (FY16F-18F). Our earnings projection is premised on: (1) margin expansion arising from a shift in revenue mix (we expect the higher-margin retail sales to contribute 39% to LPPF’s gross revenue in FY18 vs. 36% in FY15), (2) new stores openings, and (3) an uptick in same-store sales growth as the economy recovers, supported by a debt-free balance sheet and strong cash flow generation. Low exposure to USD/IDR volatility. More than 80% of LPPF’s products are sourced locally, so margins are virtually unaffected by the volatile rupiah. Currently, the rupiah is hovering around Rp13,300 to the US dollar. Our in-house forecast for the rupiah is Rp13,876 by the end of 2017, implying 4% depreciation, assuming four 25bps fed rate hikes in 2017. We like LPPF for its minimal exposure to the USD and relatively stable earnings throughout our forecast period.
Quarterly SSSG Trend
Direct Purchase vs. Consignment Sales
New Stores
Same-Store Sales Growth (%)
Source: Company, DBS Vickers
-30%
-20%
-10%
0%
10%
20%
30%
40%
50%
1Q12
2Q12
3Q12
4Q12
1Q13
2Q13
3Q13
4Q13
1Q14
2Q14
3Q14
4Q14
1Q15
2Q15
3Q15
4Q15
1Q16
2Q16
3Q16
SSSG Same-store sales volume growth
68% 66% 64% 63% 62% 61%
32% 34% 36% 37% 38% 39%
33%
34%
35%
36%
37%
0%
20%
40%
60%
80%
100%
2013 2014 2015A 2016F 2017F 2018F
Consignment sales Retail sales (direct purchase)
Service fees Gross margin (RHS)
Page 30
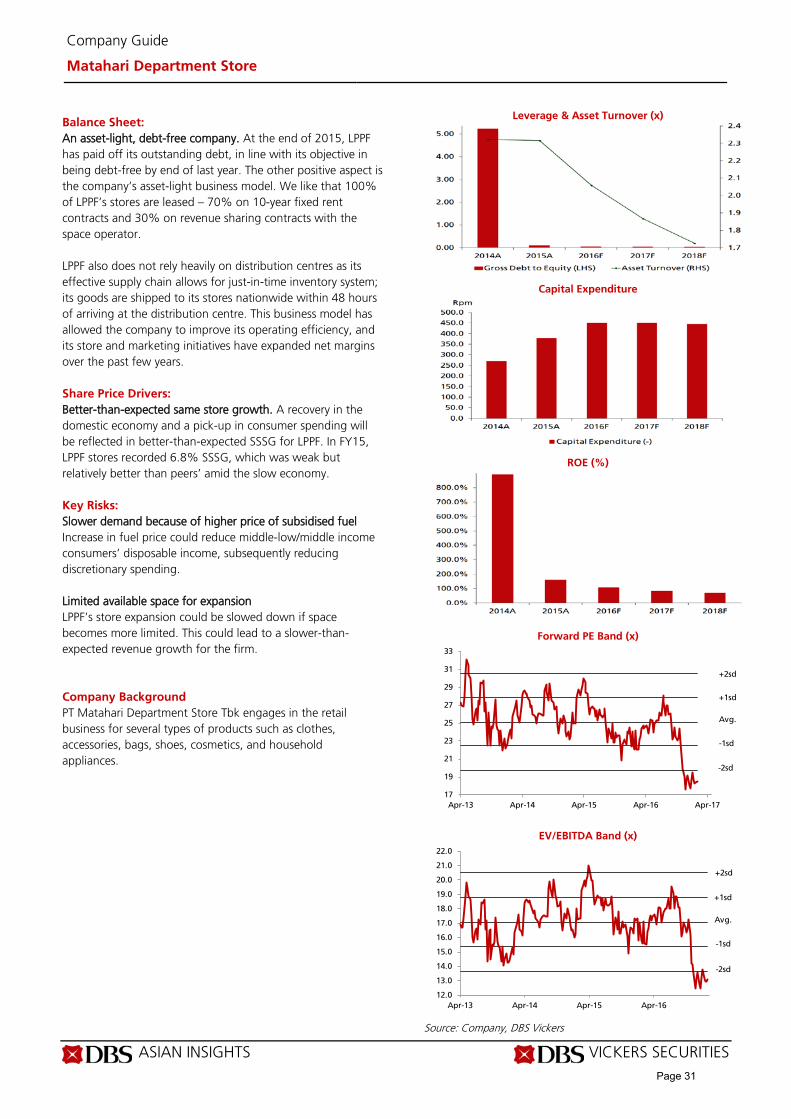
ASIAN INSIGHTS VICKERS SECURITIES Page 6
Company Guide
Matahari Department Store
Balance Sheet: An asset-light, debt-free company. At the end of 2015, LPPF has paid off its outstanding debt, in line with its objective in being debt-free by end of last year. The other positive aspect is the company’s asset-light business model. We like that 100% of LPPF’s stores are leased – 70% on 10-year fixed rent contracts and 30% on revenue sharing contracts with the space operator. LPPF also does not rely heavily on distribution centres as its effective supply chain allows for just-in-time inventory system; its goods are shipped to its stores nationwide within 48 hours of arriving at the distribution centre. This business model has allowed the company to improve its operating efficiency, and its store and marketing initiatives have expanded net margins over the past few years. Share Price Drivers: Better-than-expected same store growth. A recovery in the domestic economy and a pick-up in consumer spending will be reflected in better-than-expected SSSG for LPPF. In FY15, LPPF stores recorded 6.8% SSSG, which was weak but relatively better than peers’ amid the slow economy. Key Risks: Slower demand because of higher price of subsidised fuel Increase in fuel price could reduce middle-low/middle income consumers’ disposable income, subsequently reducing discretionary spending. Limited available space for expansion LPPF’s store expansion could be slowed down if space becomes more limited. This could lead to a slower-than-expected revenue growth for the firm. Company Background PT Matahari Department Store Tbk engages in the retail business for several types of products such as clothes, accessories, bags, shoes, cosmetics, and household appliances.
Leverage & Asset Turnover (x)
Capital Expenditure
ROE (%)
Forward PE Band (x)
EV/EBITDA Band (x)
Source: Company, DBS Vickers
17
19
21
23
25
27
29
31
33
Apr-13 Apr-14 Apr-15 Apr-16 Apr-17
+2sd
+1sd
-1sd
-2sd
Avg.
12.0
13.0
14.0
15.0
16.0
17.0
18.0
19.0
20.0
21.0
22.0
Apr-13 Apr-14 Apr-15 Apr-16
+2sd
+1sd
-1sd
-2sd
Avg.
Page 31
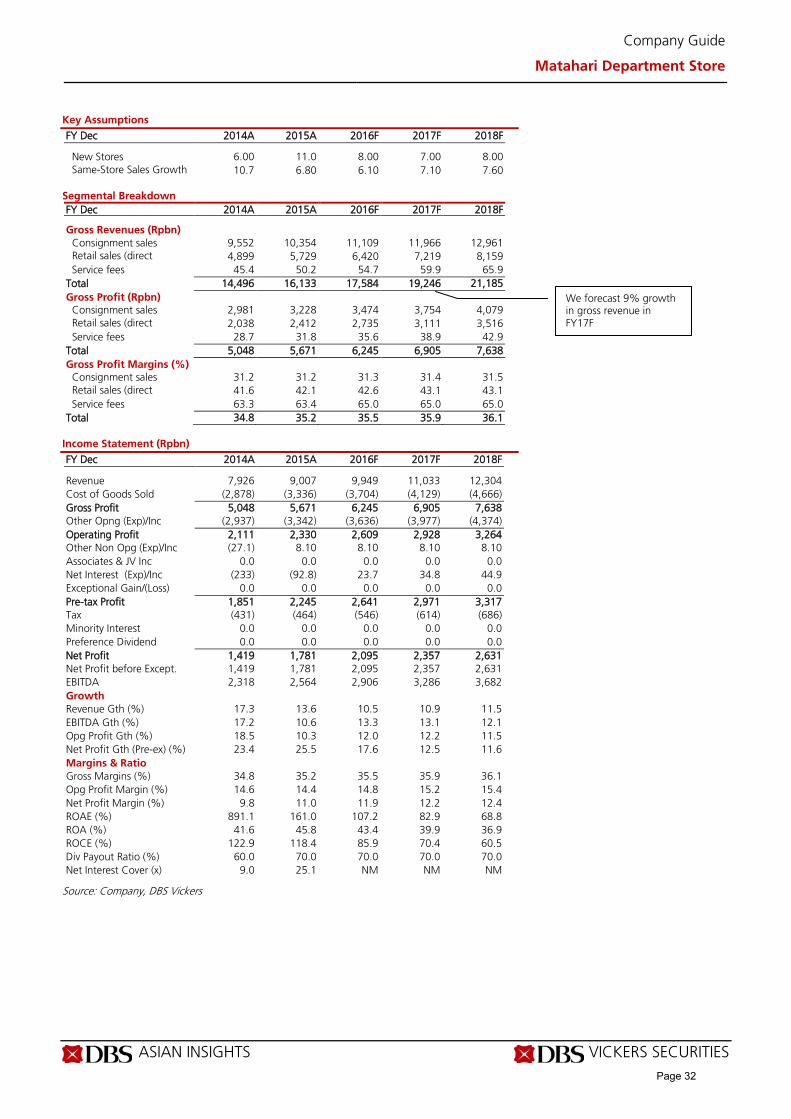
ASIAN INSIGHTS VICKERS SECURITIES Page 7
Company Guide
Matahari Department Store
Key Assumptions
FY Dec 2014A 2015A 2016F 2017F 2018F New Stores 6.00 11.0 8.00 7.00 8.00 Same-Store Sales Growth
10.7 6.80 6.10 7.10 7.60
Segmental Breakdown FY Dec 2014A 2015A 2016F 2017F 2018F Gross Revenues (Rpbn) Consignment sales 9,552 10,354 11,109 11,966 12,961 Retail sales (direct
4,899 5,729 6,420 7,219 8,159
Service fees 45.4 50.2 54.7 59.9 65.9 Total 14,496 16,133 17,584 19,246 21,185 Gross Profit (Rpbn) Consignment sales 2,981 3,228 3,474 3,754 4,079 Retail sales (direct
2,038 2,412 2,735 3,111 3,516
Service fees 28.7 31.8 35.6 38.9 42.9 Total 5,048 5,671 6,245 6,905 7,638 Gross Profit Margins (%) Consignment sales 31.2 31.2 31.3 31.4 31.5 Retail sales (direct
41.6 42.1 42.6 43.1 43.1
Service fees 63.3 63.4 65.0 65.0 65.0 Total 34.8 35.2 35.5 35.9 36.1
Income Statement (Rpbn)
FY Dec 2014A 2015A 2016F 2017F 2018F Revenue 7,926 9,007 9,949 11,033 12,304 Cost of Goods Sold (2,878) (3,336) (3,704) (4,129) (4,666) Gross Profit 5,048 5,671 6,245 6,905 7,638 Other Opng (Exp)/Inc (2,937) (3,342) (3,636) (3,977) (4,374) Operating Profit 2,111 2,330 2,609 2,928 3,264 Other Non Opg (Exp)/Inc (27.1) 8.10 8.10 8.10 8.10 Associates & JV Inc 0.0 0.0 0.0 0.0 0.0 Net Interest (Exp)/Inc (233) (92.8) 23.7 34.8 44.9 Exceptional Gain/(Loss) 0.0 0.0 0.0 0.0 0.0 Pre-tax Profit 1,851 2,245 2,641 2,971 3,317 Tax (431) (464) (546) (614) (686) Minority Interest 0.0 0.0 0.0 0.0 0.0 Preference Dividend 0.0 0.0 0.0 0.0 0.0 Net Profit 1,419 1,781 2,095 2,357 2,631 Net Profit before Except. 1,419 1,781 2,095 2,357 2,631 EBITDA 2,318 2,564 2,906 3,286 3,682 Growth Revenue Gth (%) 17.3 13.6 10.5 10.9 11.5 EBITDA Gth (%) 17.2 10.6 13.3 13.1 12.1 Opg Profit Gth (%) 18.5 10.3 12.0 12.2 11.5 Net Profit Gth (Pre-ex) (%) 23.4 25.5 17.6 12.5 11.6 Margins & Ratio Gross Margins (%) 34.8 35.2 35.5 35.9 36.1 Opg Profit Margin (%) 14.6 14.4 14.8 15.2 15.4 Net Profit Margin (%) 9.8 11.0 11.9 12.2 12.4 ROAE (%) 891.1 161.0 107.2 82.9 68.8 ROA (%) 41.6 45.8 43.4 39.9 36.9 ROCE (%) 122.9 118.4 85.9 70.4 60.5 Div Payout Ratio (%) 60.0 70.0 70.0 70.0 70.0 Net Interest Cover (x) 9.0 25.1 NM NM NM
Source: Company, DBS Vickers
We forecast 9% growth in gross revenue in FY17F
Page 32

ASIAN INSIGHTS VICKERS SECURITIES Page 8
Company Guide
Matahari Department Store
Quarterly / Interim Income Statement (Rpbn)
FY Dec 3Q2015 4Q2015 1Q2016 2Q2016 3Q2016 Revenue 2,892 2,194 1,862 3,318 2,343 Cost of Goods Sold (1,080) (816) (700) (1,196) (874) Gross Profit 1,812 1,378 1,162 2,122 1,468 Other Oper. (Exp)/Inc (887) (832) (856) (967) (909) Operating Profit 925 547 307 1,155 560 Other Non Opg (Exp)/Inc 2.50 5.60 1.70 (3.7) 0.40 Associates & JV Inc 0.0 0.0 0.0 0.0 0.0 Net Interest (Exp)/Inc (13.3) (48.5) 0.60 (2.4) 4.40 Exceptional Gain/(Loss) 0.0 0.0 0.0 0.0 0.0 Pre-tax Profit 914 504 309 1,149 565 Tax (178) (107) (65.2) (235) (112) Minority Interest 0.0 0.0 0.0 0.0 0.0 Net Profit 736 397 244 913 453 Net profit bef Except. 736 397 244 913 453 EBITDA 988 615 367 1,219 627 Growth Revenue Gth (%) 25.6 (24.1) (15.1) 78.2 (29.4) EBITDA Gth (%) 49.7 (37.8) (40.3) 232.1 (48.5) Opg Profit Gth (%) 53.6 (40.9) (43.9) 276.6 (51.5) Net Profit Gth (Pre-ex) (%) 59.1 (46.1) (38.6) 274.7 (50.4) Margins Gross Margins (%) 34.4 35.3 35.3 36.6 35.0 Opg Profit Margins (%) 17.6 14.0 9.3 19.9 13.3 Net Profit Margins (%) 14.0 10.2 7.4 15.8 10.8
Balance Sheet (Rpbn)
FY Dec 2014A 2015A 2016F 2017F 2018F Net Fixed Assets 726 877 1,030 1,122 1,150 Invts in Associates & JVs 0.0 0.0 0.0 0.0 0.0 Other LT Assets 570 740 982 1,425 1,425 Cash & ST Invts 786 947 1,393 1,794 2,807 Inventory 955 1,008 1,100 1,238 1,411 Debtors 45.1 39.3 46.6 51.7 57.6 Other Current Assets 331 279 279 279 279 Total Assets 3,413 3,889 4,831 5,909 7,129 ST Debt
423 110 110 110 110 Creditor 1,411 1,552 1,645 1,833 2,072 Other Current Liab 685 777 777 777 777 LT Debt 410 0.0 0.0 0.0 0.0 Other LT Liabilities 325 344 344 344 344 Shareholder’s Equity 159 1,106 1,954 2,844 3,826 Minority Interests 0.0 0.0 0.0 0.0 0.0 Total Cap. & Liab. 3,413 3,889 4,831 5,909 7,129 Non-Cash Wkg. Capital (764) (1,002) (996) (1,042) (1,101) Net Cash/(Debt) (46.8) 836 1,283 1,684 2,696 Debtors Turn (avg days) 2.1 1.6 1.7 1.7 1.7 Creditors Turn (avg days) 192.8 182.6 176.2 177.5 178.0 Inventory Turn (avg days) 130.5 118.6 117.9 119.8 121.3 Asset Turnover (x) 2.3 2.3 2.1 1.9 1.7 Current Ratio (x) 0.8 0.9 1.1 1.2 1.5 Quick Ratio (x) 0.3 0.4 0.6 0.7 1.0 Net Debt/Equity (X) 0.3 CASH CASH CASH CASH Net Debt/Equity ex MI (X) 0.3 CASH CASH CASH CASH Capex to Debt (%) 32.5 343.0 407.8 407.8 404.0 Z-Score (X) 12.0 13.7 13.2 12.7 12.2
Source: Company, DBS Vickers
Margins based on gross revenue
Page 33
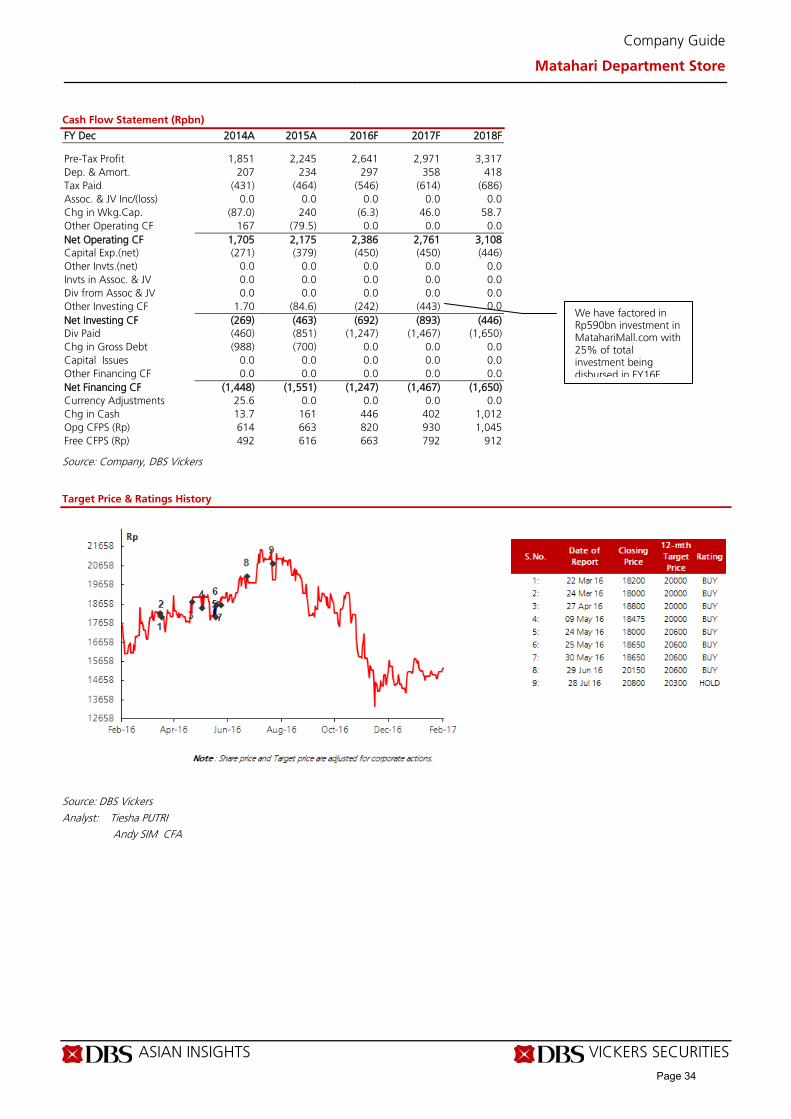
ASIAN INSIGHTS VICKERS SECURITIES Page 9
Company Guide
Matahari Department Store
Cash Flow Statement (Rpbn)
FY Dec 2014A 2015A 2016F 2017F 2018F Pre-Tax Profit 1,851 2,245 2,641 2,971 3,317 Dep. & Amort. 207 234 297 358 418 Tax Paid (431) (464) (546) (614) (686) Assoc. & JV Inc/(loss) 0.0 0.0 0.0 0.0 0.0 Chg in Wkg.Cap. (87.0) 240 (6.3) 46.0 58.7 Other Operating CF 167 (79.5) 0.0 0.0 0.0 Net Operating CF 1,705 2,175 2,386 2,761 3,108 Capital Exp.(net) (271) (379) (450) (450) (446) Other Invts.(net) 0.0 0.0 0.0 0.0 0.0 Invts in Assoc. & JV 0.0 0.0 0.0 0.0 0.0 Div from Assoc & JV 0.0 0.0 0.0 0.0 0.0 Other Investing CF 1.70 (84.6) (242) (443) 0.0 Net Investing CF (269) (463) (692) (893) (446) Div Paid (460) (851) (1,247) (1,467) (1,650) Chg in Gross Debt (988) (700) 0.0 0.0 0.0 Capital Issues 0.0 0.0 0.0 0.0 0.0 Other Financing CF 0.0 0.0 0.0 0.0 0.0 Net Financing CF (1,448) (1,551) (1,247) (1,467) (1,650) Currency Adjustments 25.6 0.0 0.0 0.0 0.0 Chg in Cash 13.7 161 446 402 1,012 Opg CFPS (Rp) 614 663 820 930 1,045 Free CFPS (Rp) 492 616 663 792 912
Source: Company, DBS Vickers
Target Price & Ratings History
Source: DBS Vickers
Analyst: Tiesha PUTRI Andy SIM CFA
We have factored in Rp590bn investment in MatahariMall.com with 25% of total investment being disbursed in FY16F.
Page 34
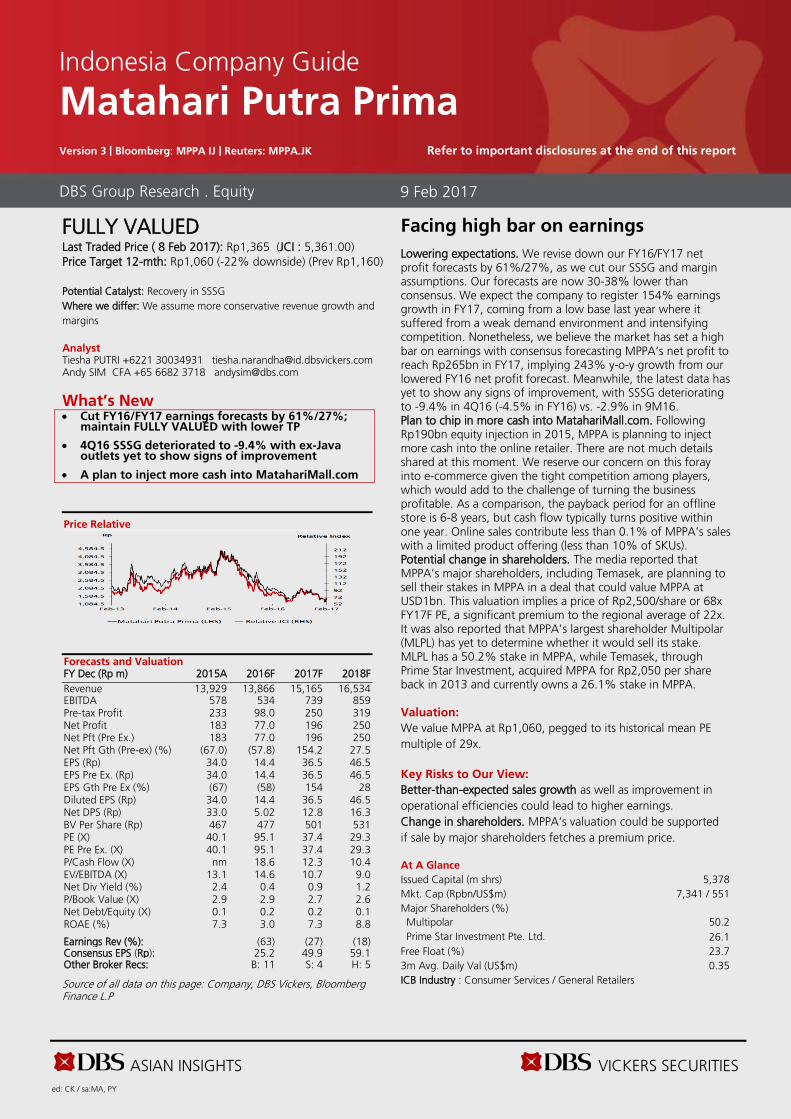
ASIAN INSIGHTS VICKERS SECURITIES ed: CK / sa:MA, PY
FULLY VALUEDLast Traded Price ( 8 Feb 2017): Rp1,365 (JCI : 5,361.00) Price Target 12-mth: Rp1,060 (-22% downside) (Prev Rp1,160)
Potential Catalyst: Recovery in SSSG Where we differ: We assume more conservative revenue growth and margins
Analyst Tiesha PUTRI +6221 30034931 [email protected] Andy SIM CFA +65 6682 3718 [email protected]
What’s New • Cut FY16/FY17 earnings forecasts by 61%/27%;
maintain FULLY VALUED with lower TP
• 4Q16 SSSG deteriorated to -9.4% with ex-Javaoutlets yet to show signs of improvement
• A plan to inject more cash into MatahariMall.com
Price Relative
Forecasts and Valuation FY Dec (Rp m) 2015A 2016F 2017F 2018F Revenue 13,929 13,866 15,165 16,534 EBITDA 578 534 739 859 Pre-tax Profit 233 98.0 250 319 Net Profit 183 77.0 196 250 Net Pft (Pre Ex.) 183 77.0 196 250 Net Pft Gth (Pre-ex) (%) (67.0) (57.8) 154.2 27.5 EPS (Rp) 34.0 14.4 36.5 46.5 EPS Pre Ex. (Rp) 34.0 14.4 36.5 46.5 EPS Gth Pre Ex (%) (67) (58) 154 28 Diluted EPS (Rp) 34.0 14.4 36.5 46.5 Net DPS (Rp) 33.0 5.02 12.8 16.3 BV Per Share (Rp) 467 477 501 531 PE (X) 40.1 95.1 37.4 29.3 PE Pre Ex. (X) 40.1 95.1 37.4 29.3 P/Cash Flow (X) nm 18.6 12.3 10.4 EV/EBITDA (X) 13.1 14.6 10.7 9.0 Net Div Yield (%) 2.4 0.4 0.9 1.2 P/Book Value (X) 2.9 2.9 2.7 2.6 Net Debt/Equity (X) 0.1 0.2 0.2 0.1 ROAE (%) 7.3 3.0 7.3 8.8 Earnings Rev (%): (63) (27) (18) Consensus EPS (Rp): 25.2 49.9 59.1 Other Broker Recs: B: 11 S: 4 H: 5
Source of all data on this page: Company, DBS Vickers, Bloomberg Finance L.P
Facing high bar on earnings Lowering expectations. We revise down our FY16/FY17 net profit forecasts by 61%/27%, as we cut our SSSG and margin assumptions. Our forecasts are now 30-38% lower than consensus. We expect the company to register 154% earnings growth in FY17, coming from a low base last year where it suffered from a weak demand environment and intensifying competition. Nonetheless, we believe the market has set a high bar on earnings with consensus forecasting MPPA’s net profit to reach Rp265bn in FY17, implying 243% y-o-y growth from our lowered FY16 net profit forecast. Meanwhile, the latest data has yet to show any signs of improvement, with SSSG deteriorating to -9.4% in 4Q16 (-4.5% in FY16) vs. -2.9% in 9M16. Plan to chip in more cash into MatahariMall.com. Following Rp190bn equity injection in 2015, MPPA is planning to inject more cash into the online retailer. There are not much details shared at this moment. We reserve our concern on this foray into e-commerce given the tight competition among players, which would add to the challenge of turning the business profitable. As a comparison, the payback period for an offline store is 6-8 years, but cash flow typically turns positive within one year. Online sales contribute less than 0.1% of MPPA’s sales with a limited product offering (less than 10% of SKUs). Potential change in shareholders. The media reported that MPPA’s major shareholders, including Temasek, are planning to sell their stakes in MPPA in a deal that could value MPPA at USD1bn. This valuation implies a price of Rp2,500/share or 68x FY17F PE, a significant premium to the regional average of 22x. It was also reported that MPPA’s largest shareholder Multipolar (MLPL) has yet to determine whether it would sell its stake. MLPL has a 50.2% stake in MPPA, while Temasek, through Prime Star Investment, acquired MPPA for Rp2,050 per share back in 2013 and currently owns a 26.1% stake in MPPA.
Valuation: We value MPPA at Rp1,060, pegged to its historical mean PE multiple of 29x.
Key Risks to Our View: Better-than-expected sales growth as well as improvement in operational efficiencies could lead to higher earnings. Change in shareholders. MPPA’s valuation could be supported if sale by major shareholders fetches a premium price.
At A Glance Issued Capital (m shrs) 5,378 Mkt. Cap (Rpbn/US$m) 7,341 / 551 Major Shareholders (%) Multipolar 50.2 Prime Star Investment Pte. Ltd. 26.1
Free Float (%) 23.7 3m Avg. Daily Val (US$m) 0.35 ICB Industry : Consumer Services / General Retailers
DBS Group Research . Equity
9 Feb 2017
Indonesia Company Guide
Matahari Putra Prima Version 3 | Bloomberg: MPPA IJ | Reuters: MPPA.JK Refer to important disclosures at the end of this report
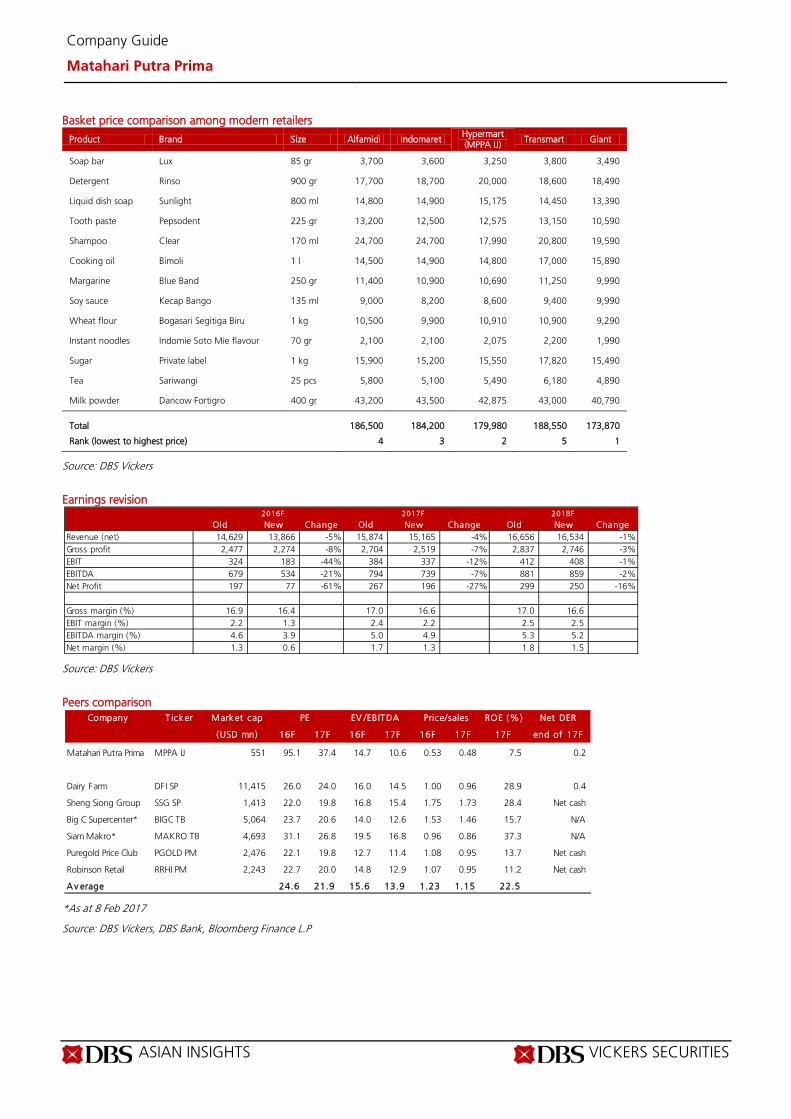
ASIAN INSIGHTS VICKERS SECURITIES Page 2
Company Guide
Matahari Putra Prima
Basket price comparison among modern retailers
Product Brand Size Alfamidi Indomaret Hypermart (MPPA IJ) Transmart Giant
Soap bar Lux 85 gr 3,700 3,600 3,250 3,800 3,490
Detergent Rinso 900 gr 17,700 18,700 20,000 18,600 18,490
Liquid dish soap Sunlight 800 ml 14,800 14,900 15,175 14,450 13,390
Tooth paste Pepsodent 225 gr 13,200 12,500 12,575 13,150 10,590
Shampoo Clear 170 ml 24,700 24,700 17,990 20,800 19,590
Cooking oil Bimoli 1 l 14,500 14,900 14,800 17,000 15,890
Margarine Blue Band 250 gr 11,400 10,900 10,690 11,250 9,990
Soy sauce Kecap Bango 135 ml 9,000 8,200 8,600 9,400 9,990
Wheat flour Bogasari Segitiga Biru 1 kg 10,500 9,900 10,910 10,900 9,290
Instant noodles Indomie Soto Mie flavour 70 gr 2,100 2,100 2,075 2,200 1,990
Sugar Private label 1 kg 15,900 15,200 15,550 17,820 15,490
Tea Sariwangi 25 pcs 5,800 5,100 5,490 6,180 4,890
Milk powder Dancow Fortigro 400 gr 43,200 43,500 42,875 43,000 40,790
Total
186,500 184,200 179,980 188,550 173,870
Rank (lowest to highest price) 4 3 2 5 1
Source: DBS Vickers
Earnings revision
Source: DBS Vickers
Peers comparison
*As at 8 Feb 2017
Source: DBS Vickers, DBS Bank, Bloomberg Finance L.P
2016F 2017F 2018F
Old New Change Old New Change Old New ChangeRevenue (net) 14,629 13,866 -5% 15,874 15,165 -4% 16,656 16,534 -1%Gross profit 2,477 2,274 -8% 2,704 2,519 -7% 2,837 2,746 -3%EBIT 324 183 -44% 384 337 -12% 412 408 -1%EBITDA 679 534 -21% 794 739 -7% 881 859 -2%Net Profit 197 77 -61% 267 196 -27% 299 250 -16%
Gross margin (%) 16.9 16.4 17.0 16.6 17.0 16.6 EBIT margin (%) 2.2 1.3 2.4 2.2 2.5 2.5 EBITDA margin (%) 4.6 3.9 5.0 4.9 5.3 5.2 Net margin (%) 1.3 0.6 1.7 1.3 1.8 1.5
Company T icker Market cap ROE (%) Net DER
(USD mn) 16F 17F 16F 17F 16F 17F 17F end of 17F
Matahari Putra Prima MPPA IJ 551 95.1 37.4 14.7 10.6 0.53 0.48 7.5 0.2
Dairy Farm DFI SP 11,415 26.0 24.0 16.0 14.5 1.00 0.96 28.9 0.4
Sheng Siong Group SSG SP 1,413 22.0 19.8 16.8 15.4 1.75 1.73 28.4 Net cash
Big C Supercenter* BIGC TB 5,064 23.7 20.6 14.0 12.6 1.53 1.46 15.7 N/A
Siam Makro* MAKRO TB 4,693 31.1 26.8 19.5 16.8 0.96 0.86 37.3 N/A
Puregold Price Club PGOLD PM 2,476 22.1 19.8 12.7 11.4 1.08 0.95 13.7 Net cash
Robinson Retail RRHI PM 2,243 22.7 20.0 14.8 12.9 1.07 0.95 11.2 Net cash
A v erage 24.6 21.9 15.6 13.9 1.23 1.15 22.5
PE EV /EBITDA Price/sales
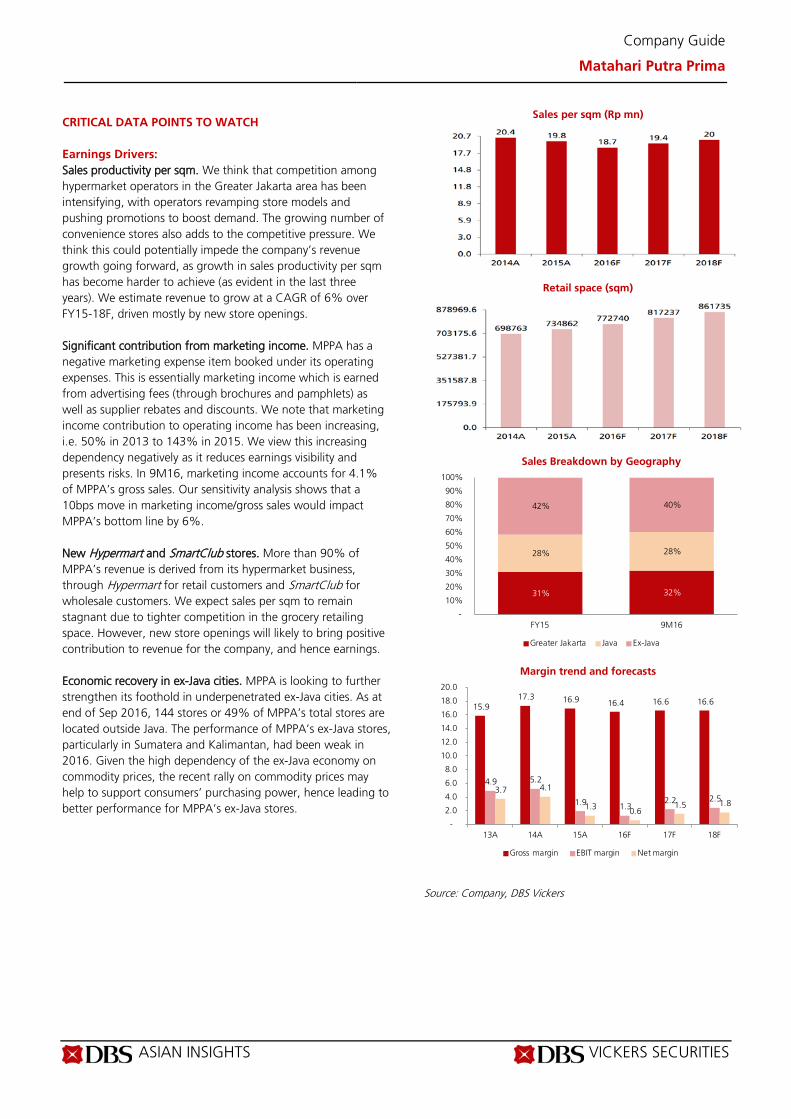
ASIAN INSIGHTS VICKERS SECURITIES Page 3
Company Guide
Matahari Putra Prima
CRITICAL DATA POINTS TO WATCH Earnings Drivers: Sales productivity per sqm. We think that competition among hypermarket operators in the Greater Jakarta area has been intensifying, with operators revamping store models and pushing promotions to boost demand. The growing number of convenience stores also adds to the competitive pressure. We think this could potentially impede the company’s revenue growth going forward, as growth in sales productivity per sqm has become harder to achieve (as evident in the last three years). We estimate revenue to grow at a CAGR of 6% over FY15-18F, driven mostly by new store openings. Significant contribution from marketing income. MPPA has a negative marketing expense item booked under its operating expenses. This is essentially marketing income which is earned from advertising fees (through brochures and pamphlets) as well as supplier rebates and discounts. We note that marketing income contribution to operating income has been increasing, i.e. 50% in 2013 to 143% in 2015. We view this increasing dependency negatively as it reduces earnings visibility and presents risks. In 9M16, marketing income accounts for 4.1% of MPPA’s gross sales. Our sensitivity analysis shows that a 10bps move in marketing income/gross sales would impact MPPA’s bottom line by 6%. New Hypermart and SmartClub stores. More than 90% of MPPA’s revenue is derived from its hypermarket business, through Hypermart for retail customers and SmartClub for wholesale customers. We expect sales per sqm to remain stagnant due to tighter competition in the grocery retailing space. However, new store openings will likely to bring positive contribution to revenue for the company, and hence earnings. Economic recovery in ex-Java cities. MPPA is looking to further strengthen its foothold in underpenetrated ex-Java cities. As at end of Sep 2016, 144 stores or 49% of MPPA’s total stores are located outside Java. The performance of MPPA’s ex-Java stores, particularly in Sumatera and Kalimantan, had been weak in 2016. Given the high dependency of the ex-Java economy on commodity prices, the recent rally on commodity prices may help to support consumers’ purchasing power, hence leading to better performance for MPPA’s ex-Java stores.
Sales per sqm (Rp mn)
Retail space (sqm)
Sales Breakdown by Geography
Margin trend and forecasts
Source: Company, DBS Vickers
31% 32%
28% 28%
42% 40%
-
10%
20%
30%
40%
50%
60%
70%
80%
90%
100%
FY15 9M16
Greater Jakarta Java Ex-Java
15.9 17.3 16.9 16.4 16.6 16.6
4.9 5.2
1.9 1.3 2.2 2.5
3.7 4.1
1.3 0.6 1.5 1.8
-
2.0
4.0
6.0
8.0
10.0
12.0
14.0
16.0
18.0
20.0
13A 14A 15A 16F 17F 18F
Gross margin EBIT margin Net margin
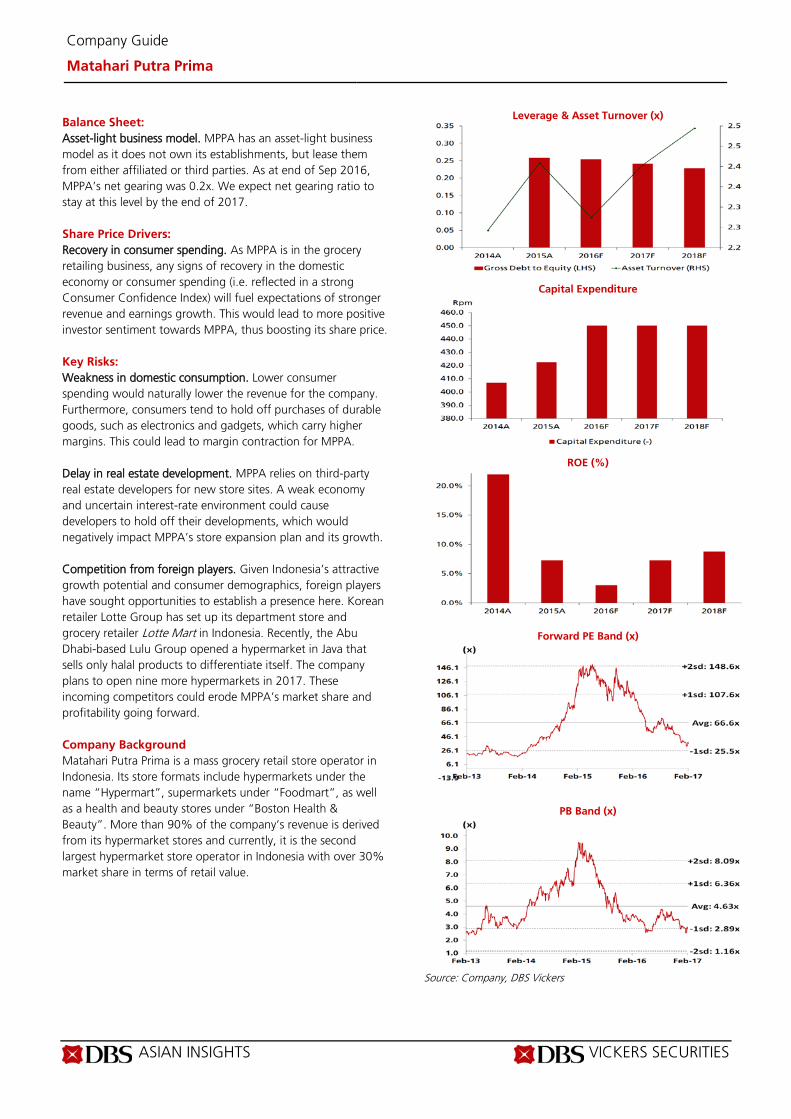
ASIAN INSIGHTS VICKERS SECURITIES Page 4
Company Guide
Matahari Putra Prima
Balance Sheet: Asset-light business model. MPPA has an asset-light business model as it does not own its establishments, but lease them from either affiliated or third parties. As at end of Sep 2016, MPPA’s net gearing was 0.2x. We expect net gearing ratio to stay at this level by the end of 2017. Share Price Drivers: Recovery in consumer spending. As MPPA is in the grocery retailing business, any signs of recovery in the domestic economy or consumer spending (i.e. reflected in a strong Consumer Confidence Index) will fuel expectations of stronger revenue and earnings growth. This would lead to more positive investor sentiment towards MPPA, thus boosting its share price. Key Risks: Weakness in domestic consumption. Lower consumer spending would naturally lower the revenue for the company. Furthermore, consumers tend to hold off purchases of durable goods, such as electronics and gadgets, which carry higher margins. This could lead to margin contraction for MPPA. Delay in real estate development. MPPA relies on third-party real estate developers for new store sites. A weak economy and uncertain interest-rate environment could cause developers to hold off their developments, which would negatively impact MPPA’s store expansion plan and its growth. Competition from foreign players. Given Indonesia’s attractive growth potential and consumer demographics, foreign players have sought opportunities to establish a presence here. Korean retailer Lotte Group has set up its department store and grocery retailer Lotte Mart in Indonesia. Recently, the Abu Dhabi-based Lulu Group opened a hypermarket in Java that sells only halal products to differentiate itself. The company plans to open nine more hypermarkets in 2017. These incoming competitors could erode MPPA’s market share and profitability going forward. Company Background Matahari Putra Prima is a mass grocery retail store operator in Indonesia. Its store formats include hypermarkets under the name “Hypermart”, supermarkets under “Foodmart”, as well as a health and beauty stores under “Boston Health & Beauty”. More than 90% of the company’s revenue is derived from its hypermarket stores and currently, it is the second largest hypermarket store operator in Indonesia with over 30% market share in terms of retail value.
Leverage & Asset Turnover (x)
Capital Expenditure
ROE (%)
Forward PE Band (x)
PB Band (x)
Source: Company, DBS Vickers
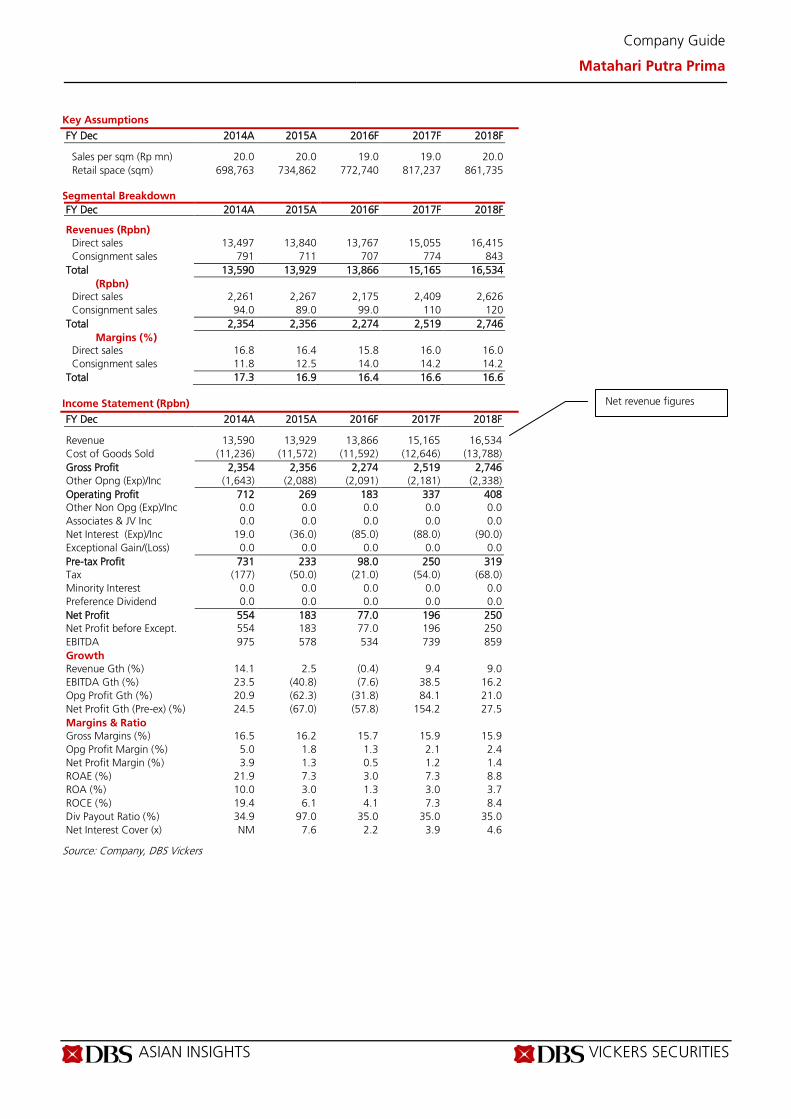
ASIAN INSIGHTS VICKERS SECURITIES Page 5
Company Guide
Matahari Putra Prima
Key Assumptions
FY Dec 2014A 2015A 2016F 2017F 2018F Sales per sqm (Rp mn) 20.0 20.0 19.0 19.0 20.0 Retail space (sqm) 698,763 734,862 772,740 817,237 861,735
Segmental Breakdown FY Dec 2014A 2015A 2016F 2017F 2018F Revenues (Rpbn) Direct sales 13,497 13,840 13,767 15,055 16,415 Consignment sales 791 711 707 774 843 Total 13,590 13,929 13,866 15,165 16,534 (Rpbn) Direct sales 2,261 2,267 2,175 2,409 2,626 Consignment sales 94.0 89.0 99.0 110 120 Total 2,354 2,356 2,274 2,519 2,746 Margins (%) Direct sales 16.8 16.4 15.8 16.0 16.0 Consignment sales 11.8 12.5 14.0 14.2 14.2 Total 17.3 16.9 16.4 16.6 16.6
Income Statement (Rpbn)
FY Dec 2014A 2015A 2016F 2017F 2018F Revenue 13,590 13,929 13,866 15,165 16,534 Cost of Goods Sold (11,236) (11,572) (11,592) (12,646) (13,788) Gross Profit 2,354 2,356 2,274 2,519 2,746 Other Opng (Exp)/Inc (1,643) (2,088) (2,091) (2,181) (2,338) Operating Profit 712 269 183 337 408 Other Non Opg (Exp)/Inc 0.0 0.0 0.0 0.0 0.0 Associates & JV Inc 0.0 0.0 0.0 0.0 0.0 Net Interest (Exp)/Inc 19.0 (36.0) (85.0) (88.0) (90.0) Exceptional Gain/(Loss) 0.0 0.0 0.0 0.0 0.0 Pre-tax Profit 731 233 98.0 250 319 Tax (177) (50.0) (21.0) (54.0) (68.0) Minority Interest 0.0 0.0 0.0 0.0 0.0 Preference Dividend 0.0 0.0 0.0 0.0 0.0 Net Profit 554 183 77.0 196 250 Net Profit before Except. 554 183 77.0 196 250 EBITDA 975 578 534 739 859 Growth Revenue Gth (%) 14.1 2.5 (0.4) 9.4 9.0 EBITDA Gth (%) 23.5 (40.8) (7.6) 38.5 16.2 Opg Profit Gth (%) 20.9 (62.3) (31.8) 84.1 21.0 Net Profit Gth (Pre-ex) (%) 24.5 (67.0) (57.8) 154.2 27.5 Margins & Ratio Gross Margins (%) 16.5 16.2 15.7 15.9 15.9 Opg Profit Margin (%) 5.0 1.8 1.3 2.1 2.4 Net Profit Margin (%) 3.9 1.3 0.5 1.2 1.4 ROAE (%) 21.9 7.3 3.0 7.3 8.8 ROA (%) 10.0 3.0 1.3 3.0 3.7 ROCE (%) 19.4 6.1 4.1 7.3 8.4 Div Payout Ratio (%) 34.9 97.0 35.0 35.0 35.0 Net Interest Cover (x) NM 7.6 2.2 3.9 4.6
Source: Company, DBS Vickers
Net revenue figures

ASIAN INSIGHTS VICKERS SECURITIES Page 6
Company Guide
Matahari Putra Prima
Quarterly / Interim Income Statement (Rpbn)
FY Dec 3Q2015 4Q2015 1Q2016 2Q2016 3Q2016 Revenue 3,593 3,481 3,265 3,736 3,393 Cost of Goods Sold (2,996) (2,925) (2,806) (3,063) (2,834) Gross Profit 597 556 459 673 558 Other Oper. (Exp)/Inc (492) (613) (569) (560) (470) Operating Profit 105 (57.0) (110) 112 89.0 Other Non Opg (Exp)/Inc 0.0 0.0 0.0 0.0 0.0 Associates & JV Inc 0.0 0.0 0.0 0.0 0.0 Net Interest (Exp)/Inc (16.0) (22.0) (16.0) (18.0) (21.0) Exceptional Gain/(Loss) 0.0 0.0 0.0 0.0 0.0 Pre-tax Profit 89.0 (79.0) (126) 94.0 68.0 Tax (19.0) 17.0 3.00 8.00 (15.0) Minority Interest 0.0 0.0 0.0 0.0 0.0 Net Profit 70.0 (63.0) (123) 102 53.0 Net profit bef Except. 70.0 (63.0) (123) 102 53.0 EBITDA 183 28.0 (26.0) 194 177 Growth Revenue Gth (%) 2.5 (3.1) (6.2) 14.4 (9.2) EBITDA Gth (%) (6.8) (84.8) nm nm (8.8) Opg Profit Gth (%) (14.4) nm (93.1) nm (21.0) Net Profit Gth (Pre-ex) (%) (25.3) nm (96.4) nm (47.9) Margins Gross Margins (%) 16.6 16.0 14.1 18.0 16.5 Opg Profit Margins (%) 2.9 (1.6) (3.4) 3.0 2.6 Net Profit Margins (%) 2.0 (1.8) (3.8) 2.7 1.6
Balance Sheet (Rpbn)
FY Dec 2014A 2015A 2016F 2017F 2018F Net Fixed Assets 1,273 1,462 1,561 1,609 1,609 Invts in Associates & JVs 0.0 0.0 0.0 0.0 0.0 Other LT Assets 657 861 1,019 1,199 1,199 Cash & ST Invts 748 409 169 66.0 233 Inventory 2,355 2,498 2,604 2,772 2,947 Debtors 31.0 26.0 30.0 33.0 36.0 Other Current Assets 470 777 777 777 777 Total Assets 5,534 6,033 6,162 6,457 6,801 ST Debt
0.0 250 250 250 250 Creditor 1,893 1,763 1,842 2,010 2,191 Other Current Liab 859 801 801 801 801 LT Debt 0.0 400 400 400 400 Other LT Liabilities 253 304 304 304 304 Shareholder’s Equity 2,528 2,514 2,564 2,692 2,854 Minority Interests 0.0 0.0 0.0 0.0 0.0 Total Cap. & Liab. 5,534 6,033 6,162 6,457 6,801 Non-Cash Wkg. Capital 104 736 768 771 768 Net Cash/(Debt) 748 (241) (481) (584) (417) Debtors Turn (avg days) 0.9 0.8 0.8 0.8 0.8 Creditors Turn (avg days) 63.1 57.7 58.0 58.0 58.0 Inventory Turn (avg days) 75.2 76.5 82.0 80.0 78.0 Asset Turnover (x) 2.2 2.4 2.3 2.4 2.5 Current Ratio (x) 1.3 1.3 1.2 1.2 1.2 Quick Ratio (x) 0.3 0.2 0.1 0.0 0.1 Net Debt/Equity (X) CASH 0.1 0.2 0.2 0.1 Net Debt/Equity ex MI (X) CASH 0.1 0.2 0.2 0.1 Capex to Debt (%) N/A 65.0 69.2 69.2 69.2 Z-Score (X) 5.2 4.5 4.7 4.9 4.8
Source: Company, DBS Vickers
The company booked losses in 4Q15 and 1Q16
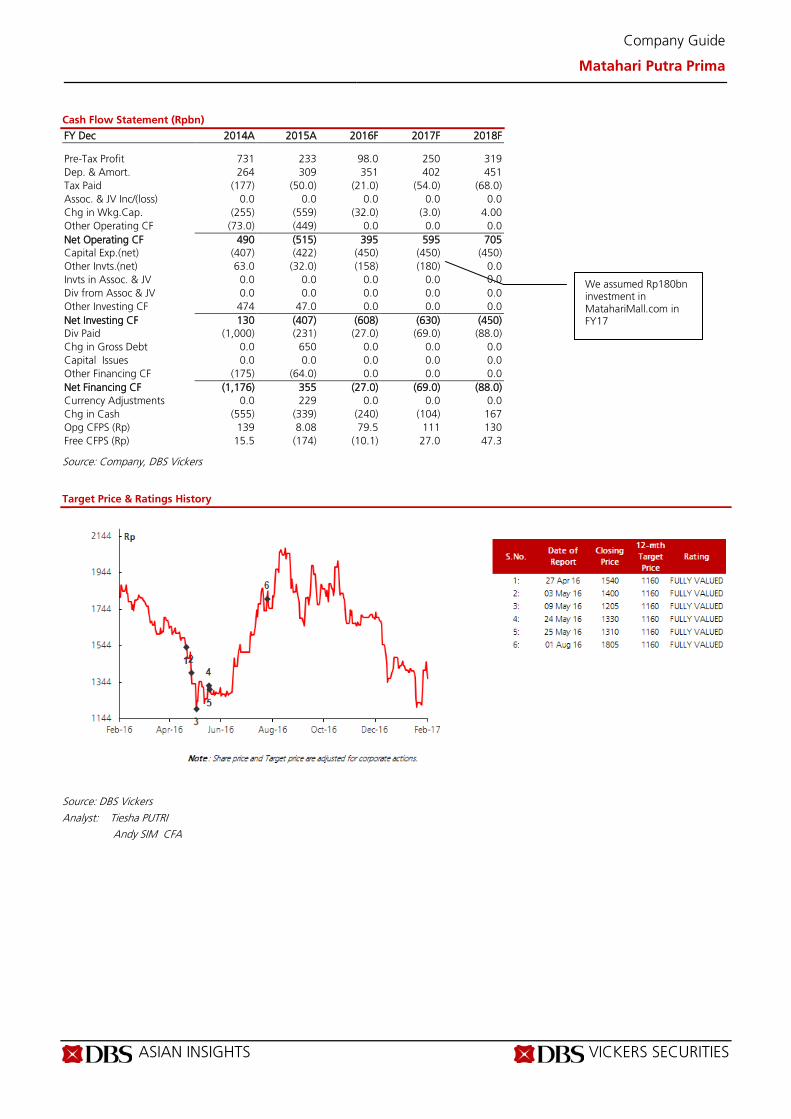
ASIAN INSIGHTS VICKERS SECURITIES Page 7
Company Guide
Matahari Putra Prima
Cash Flow Statement (Rpbn)
FY Dec 2014A 2015A 2016F 2017F 2018F Pre-Tax Profit 731 233 98.0 250 319 Dep. & Amort. 264 309 351 402 451 Tax Paid (177) (50.0) (21.0) (54.0) (68.0) Assoc. & JV Inc/(loss) 0.0 0.0 0.0 0.0 0.0 Chg in Wkg.Cap. (255) (559) (32.0) (3.0) 4.00 Other Operating CF (73.0) (449) 0.0 0.0 0.0 Net Operating CF 490 (515) 395 595 705 Capital Exp.(net) (407) (422) (450) (450) (450) Other Invts.(net) 63.0 (32.0) (158) (180) 0.0 Invts in Assoc. & JV 0.0 0.0 0.0 0.0 0.0 Div from Assoc & JV 0.0 0.0 0.0 0.0 0.0 Other Investing CF 474 47.0 0.0 0.0 0.0 Net Investing CF 130 (407) (608) (630) (450) Div Paid (1,000) (231) (27.0) (69.0) (88.0) Chg in Gross Debt 0.0 650 0.0 0.0 0.0 Capital Issues 0.0 0.0 0.0 0.0 0.0 Other Financing CF (175) (64.0) 0.0 0.0 0.0 Net Financing CF (1,176) 355 (27.0) (69.0) (88.0) Currency Adjustments 0.0 229 0.0 0.0 0.0 Chg in Cash (555) (339) (240) (104) 167 Opg CFPS (Rp) 139 8.08 79.5 111 130 Free CFPS (Rp) 15.5 (174) (10.1) 27.0 47.3
Source: Company, DBS Vickers
Target Price & Ratings History
Source: DBS Vickers
Analyst: Tiesha PUTRI Andy SIM CFA
We assumed Rp180bn investment in MatahariMall.com in FY17

ASIAN INSIGHTS VICKERS SECURITIES ed: CK / sa:MA, PY
HOLD Last Traded Price ( 8 Feb 2017): Rp1,825 (JCI : 5,361.10) Price Target 12-mth: Rp1,700 (-7% downside) (Prev Rp1,568) Potential Catalyst: Lower raw material prices Where we differ: Broadly in line with consensus Analyst Tiesha PUTRI +6221 30034931 [email protected] Andy SIM CFA +65 6682 3718 [email protected]
What’s New • Expect margins to moderate as MYOR’s key input
costs have mostly reversed their downward trend since 2Q16
• Maintain HOLD with a higher TP of Rp1,800 as we roll over valuation base to FY17
Price Relative
Forecasts and Valuation FY Dec (Rp m) 2015A 2016F 2017F 2018F Revenue 14,819 16,637 18,950 21,387 EBITDA 2,332 2,539 2,773 3,110 Pre-tax Profit 1,641 1,697 1,891 2,184 Net Profit 1,220 1,305 1,454 1,680 Net Pft (Pre Ex.) 1,220 1,305 1,454 1,680 Net Pft Gth (Pre-ex) (%) 202.3 6.9 11.4 15.6 EPS (Rp) 54.6 58.4 65.0 75.1 EPS Pre Ex. (Rp) 54.6 58.4 65.0 75.1 EPS Gth Pre Ex (%) 202 7 11 16 Diluted EPS (Rp) 54.6 58.4 65.0 75.1 Net DPS (Rp) 19.1 17.5 19.5 22.5 BV Per Share (Rp) 227 268 313 366 PE (X) 33.4 31.3 28.1 24.3 PE Pre Ex. (X) 33.4 31.3 28.1 24.3 P/Cash Flow (X) 17.5 31.8 28.6 24.2 EV/EBITDA (X) 18.5 16.9 15.3 13.5 Net Div Yield (%) 1.0 1.0 1.1 1.2 P/Book Value (X) 8.0 6.8 5.8 5.0 Net Debt/Equity (X) 0.4 0.3 0.2 0.1 ROAE (%) 24.0 21.8 20.7 20.5 Earnings Rev (%): 3 2 7 Consensus EPS (Rp): 57.5 69.9 81.9 Other Broker Recs: B: 9 S: 0 H: 3
Source of all data on this page: Company, DBS Vickers, Bloomberg Finance L.P
Anticipating costlier raw materials Maintain HOLD. Our price target for MYOR rises to Rp1,700, as we roll over our valuation base to FY17F earnings. MYOR’s key input costs namely sugar, coffee and CPO have seen a strong rally since 2Q16. Taking into account some inventory lags (3-6 months), we expect MYOR’s margin to moderate going forward. Our TP is pegged to 26x FY17F PE, on par with MYOR’s mean multiple in the past five years. At this level, we believe the stock is fairly valued. Rising input cost may pressurise margin. Rising cost pressure would be the key challenge faced by MYOR in 2017. Soft commodity prices have mostly seen a reversal of the downward trend. Among MYOR’s five key raw materials, only cocoa and wheat prices remain favourable for the company, while sugar, coffee and CPO prices have risen considerably. Note that the company does not enter into forward contracts to hedge raw material purchases while maintaining its product price affordability remains the company’s key strategy as it caters for the mass-market segment. This explains the volatility of MYOR’s margins in the past. Export sales provide some earnings buffer against rupiah depreciation. We like MYOR for its highest export sales among our coverage, providing a high degree of natural hedge against rupiah depreciation. In 9M16, MYOR’s export sales accounted for 44% of total sales and 70% of MYOR’s raw material costs. Valuation: We value MYOR at Rp1,700/share, based on 26x PE 17F (5-year mean multiple). Key Risks to Our View: Rapid increase in raw material prices would crimp the company’s margins if it is unable to pass on the cost increases to consumers. At A Glance Issued Capital (m shrs) 22,359 Mkt. Cap (Rpbn/US$m) 40,805 / 3,060 Major Shareholders (%) Unita Branindo (%) 32.9 BBH Boston S/A GMO (%) 5.6
Free Float (%) 61.5 3m Avg. Daily Val (US$m) 0.12 ICB Industry : Consumer Goods / Food Producers
DBS Group Research . Equity
9 Feb 2017
Indonesia Company Guide
Mayora Indah Version 4 | Bloomberg: MYOR IJ | Reuters: MYOR.JK Refer to important disclosures at the end of this report
Page 41
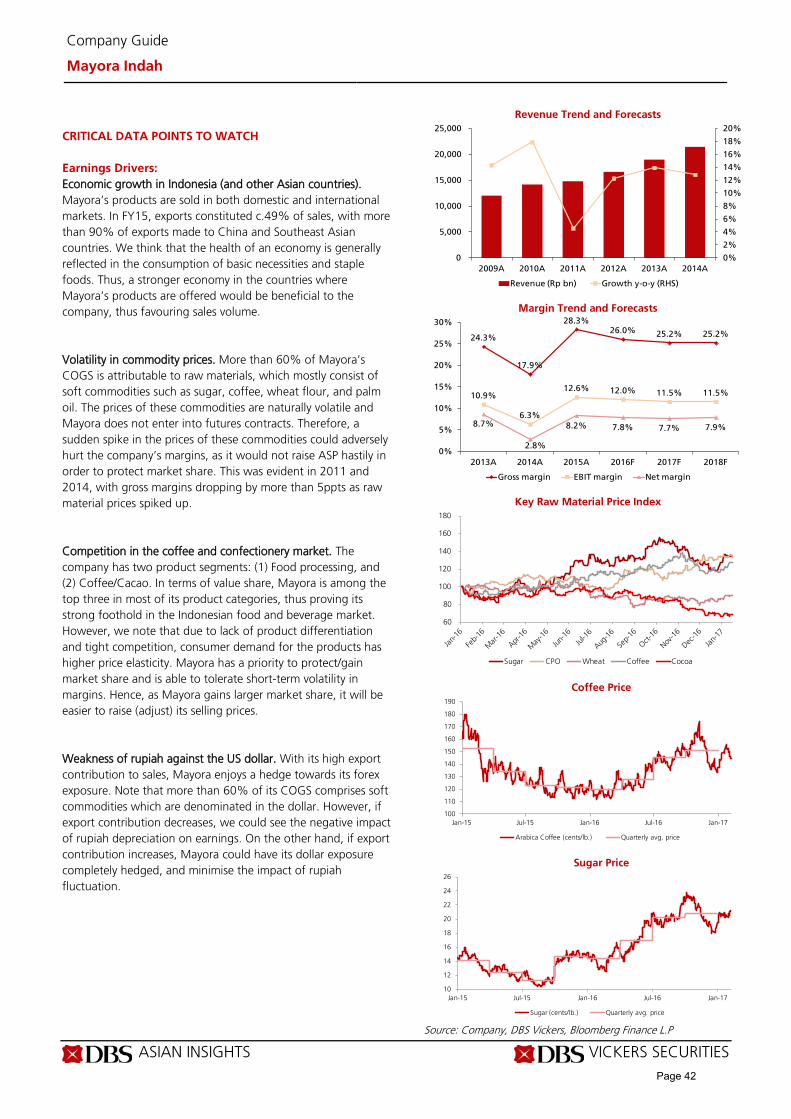
ASIAN INSIGHTS VICKERS SECURITIES Page 2
Company Guide
Mayora Indah
CRITICAL DATA POINTS TO WATCH Earnings Drivers: Economic growth in Indonesia (and other Asian countries). Mayora’s products are sold in both domestic and international markets. In FY15, exports constituted c.49% of sales, with more than 90% of exports made to China and Southeast Asian countries. We think that the health of an economy is generally reflected in the consumption of basic necessities and staple foods. Thus, a stronger economy in the countries where Mayora’s products are offered would be beneficial to the company, thus favouring sales volume. Volatility in commodity prices. More than 60% of Mayora’s COGS is attributable to raw materials, which mostly consist of soft commodities such as sugar, coffee, wheat flour, and palm oil. The prices of these commodities are naturally volatile and Mayora does not enter into futures contracts. Therefore, a sudden spike in the prices of these commodities could adversely hurt the company’s margins, as it would not raise ASP hastily in order to protect market share. This was evident in 2011 and 2014, with gross margins dropping by more than 5ppts as raw material prices spiked up. Competition in the coffee and confectionery market. The company has two product segments: (1) Food processing, and (2) Coffee/Cacao. In terms of value share, Mayora is among the top three in most of its product categories, thus proving its strong foothold in the Indonesian food and beverage market. However, we note that due to lack of product differentiation and tight competition, consumer demand for the products has higher price elasticity. Mayora has a priority to protect/gain market share and is able to tolerate short-term volatility in margins. Hence, as Mayora gains larger market share, it will be easier to raise (adjust) its selling prices. Weakness of rupiah against the US dollar. With its high export contribution to sales, Mayora enjoys a hedge towards its forex exposure. Note that more than 60% of its COGS comprises soft commodities which are denominated in the dollar. However, if export contribution decreases, we could see the negative impact of rupiah depreciation on earnings. On the other hand, if export contribution increases, Mayora could have its dollar exposure completely hedged, and minimise the impact of rupiah fluctuation.
Revenue Trend and Forecasts
Margin Trend and Forecasts
Key Raw Material Price Index
Coffee Price
Sugar Price
Source: Company, DBS Vickers, Bloomberg Finance L.P
0%
2%
4%
6%
8%
10%
12%
14%
16%
18%
20%
0
5,000
10,000
15,000
20,000
25,000
2009A 2010A 2011A 2012A 2013A 2014A
Revenue (Rp bn) Growth y-o-y (RHS)
24.3%
17.9%
28.3%26.0% 25.2% 25.2%
10.9%
6.3%
12.6% 12.0% 11.5% 11.5%
8.7%
2.8%
8.2% 7.8% 7.7% 7.9%
0%
5%
10%
15%
20%
25%
30%
2013A 2014A 2015A 2016F 2017F 2018F
Gross margin EBIT margin Net margin
60
80
100
120
140
160
180
Sugar CPO Wheat Coffee Cocoa
100
110
120
130
140
150
160
170
180
190
Jan-15 Jul-15 Jan-16 Jul-16 Jan-17
Arabica Coffee (cents/lb.) Quarterly avg. price
10
12
14
16
18
20
22
24
26
Jan-15 Jul-15 Jan-16 Jul-16 Jan-17
Sugar (cents/lb.) Quarterly avg. price
Page 42
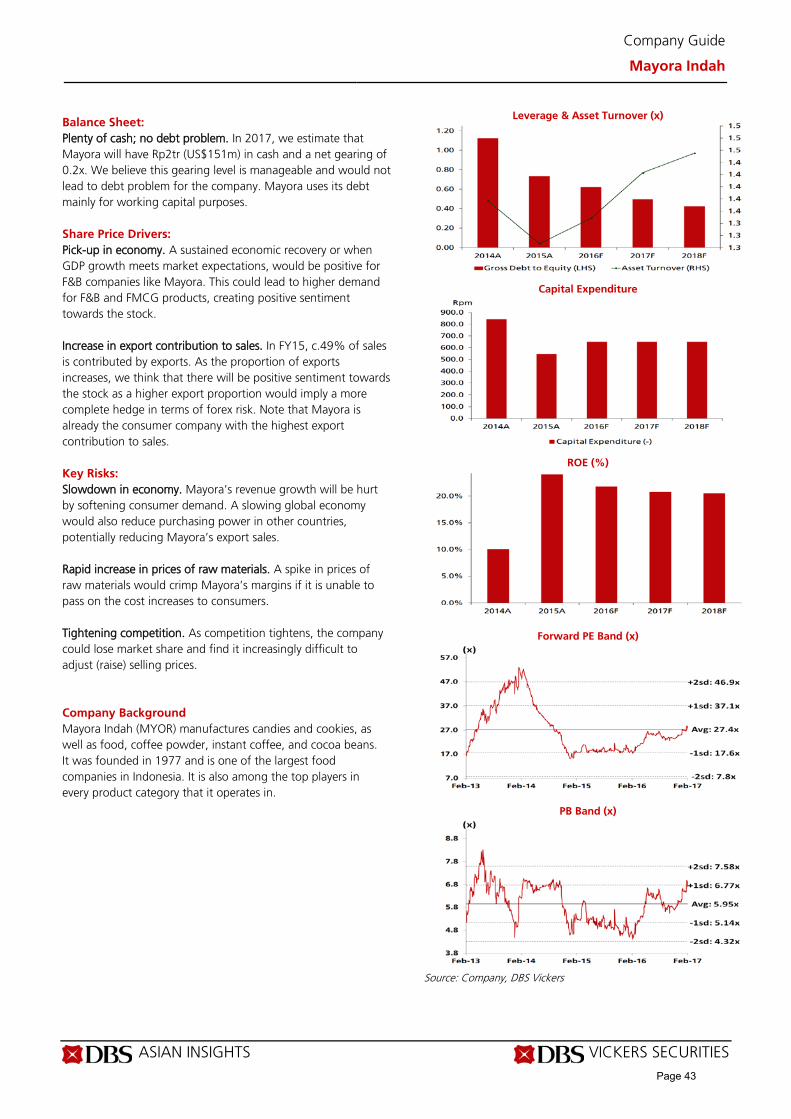
ASIAN INSIGHTS VICKERS SECURITIES Page 3
Company Guide
Mayora Indah
Balance Sheet: Plenty of cash; no debt problem. In 2017, we estimate that Mayora will have Rp2tr (US$151m) in cash and a net gearing of 0.2x. We believe this gearing level is manageable and would not lead to debt problem for the company. Mayora uses its debt mainly for working capital purposes. Share Price Drivers: Pick-up in economy. A sustained economic recovery or when GDP growth meets market expectations, would be positive for F&B companies like Mayora. This could lead to higher demand for F&B and FMCG products, creating positive sentiment towards the stock. Increase in export contribution to sales. In FY15, c.49% of sales is contributed by exports. As the proportion of exports increases, we think that there will be positive sentiment towards the stock as a higher export proportion would imply a more complete hedge in terms of forex risk. Note that Mayora is already the consumer company with the highest export contribution to sales. Key Risks: Slowdown in economy. Mayora’s revenue growth will be hurt by softening consumer demand. A slowing global economy would also reduce purchasing power in other countries, potentially reducing Mayora’s export sales. Rapid increase in prices of raw materials. A spike in prices of raw materials would crimp Mayora’s margins if it is unable to pass on the cost increases to consumers. Tightening competition. As competition tightens, the company could lose market share and find it increasingly difficult to adjust (raise) selling prices. Company Background Mayora Indah (MYOR) manufactures candies and cookies, as well as food, coffee powder, instant coffee, and cocoa beans. It was founded in 1977 and is one of the largest food companies in Indonesia. It is also among the top players in every product category that it operates in.
Leverage & Asset Turnover (x)
Capital Expenditure
ROE (%)
Forward PE Band (x)
PB Band (x)
Source: Company, DBS Vickers
Page 43
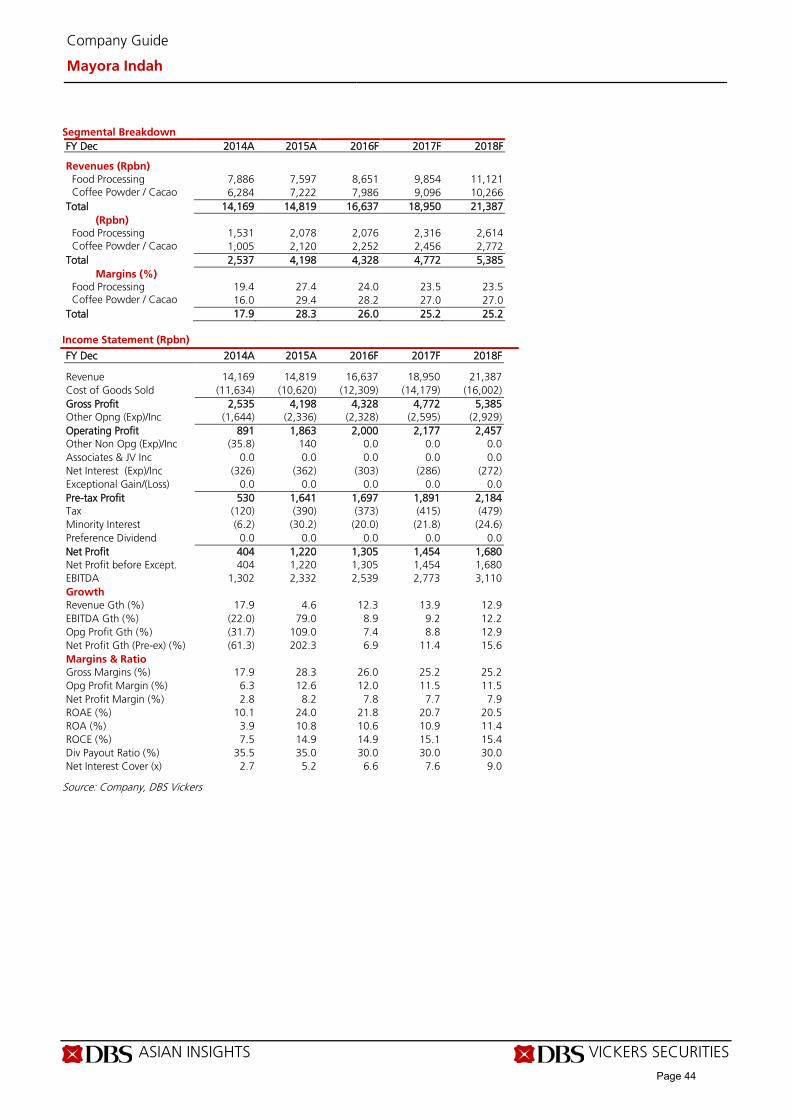
ASIAN INSIGHTS VICKERS SECURITIES Page 4
Company Guide
Mayora Indah
Segmental Breakdown FY Dec 2014A 2015A 2016F 2017F 2018F Revenues (Rpbn) Food Processing 7,886 7,597 8,651 9,854 11,121 Coffee Powder / Cacao
6,284 7,222 7,986 9,096 10,266
Total 14,169 14,819 16,637 18,950 21,387 (Rpbn) Food Processing 1,531 2,078 2,076 2,316 2,614 Coffee Powder / Cacao
1,005 2,120 2,252 2,456 2,772
Total 2,537 4,198 4,328 4,772 5,385 Margins (%) Food Processing 19.4 27.4 24.0 23.5 23.5 Coffee Powder / Cacao
16.0 29.4 28.2 27.0 27.0
Total 17.9 28.3 26.0 25.2 25.2 Income Statement (Rpbn)
FY Dec 2014A 2015A 2016F 2017F 2018F Revenue 14,169 14,819 16,637 18,950 21,387 Cost of Goods Sold (11,634) (10,620) (12,309) (14,179) (16,002) Gross Profit 2,535 4,198 4,328 4,772 5,385 Other Opng (Exp)/Inc (1,644) (2,336) (2,328) (2,595) (2,929) Operating Profit 891 1,863 2,000 2,177 2,457 Other Non Opg (Exp)/Inc (35.8) 140 0.0 0.0 0.0 Associates & JV Inc 0.0 0.0 0.0 0.0 0.0 Net Interest (Exp)/Inc (326) (362) (303) (286) (272) Exceptional Gain/(Loss) 0.0 0.0 0.0 0.0 0.0 Pre-tax Profit 530 1,641 1,697 1,891 2,184 Tax (120) (390) (373) (415) (479) Minority Interest (6.2) (30.2) (20.0) (21.8) (24.6) Preference Dividend 0.0 0.0 0.0 0.0 0.0 Net Profit 404 1,220 1,305 1,454 1,680 Net Profit before Except. 404 1,220 1,305 1,454 1,680 EBITDA 1,302 2,332 2,539 2,773 3,110 Growth Revenue Gth (%) 17.9 4.6 12.3 13.9 12.9 EBITDA Gth (%) (22.0) 79.0 8.9 9.2 12.2 Opg Profit Gth (%) (31.7) 109.0 7.4 8.8 12.9 Net Profit Gth (Pre-ex) (%) (61.3) 202.3 6.9 11.4 15.6 Margins & Ratio Gross Margins (%) 17.9 28.3 26.0 25.2 25.2 Opg Profit Margin (%) 6.3 12.6 12.0 11.5 11.5 Net Profit Margin (%) 2.8 8.2 7.8 7.7 7.9 ROAE (%) 10.1 24.0 21.8 20.7 20.5 ROA (%) 3.9 10.8 10.6 10.9 11.4 ROCE (%) 7.5 14.9 14.9 15.1 15.4 Div Payout Ratio (%) 35.5 35.0 30.0 30.0 30.0 Net Interest Cover (x) 2.7 5.2 6.6 7.6 9.0
Source: Company, DBS Vickers
Page 44
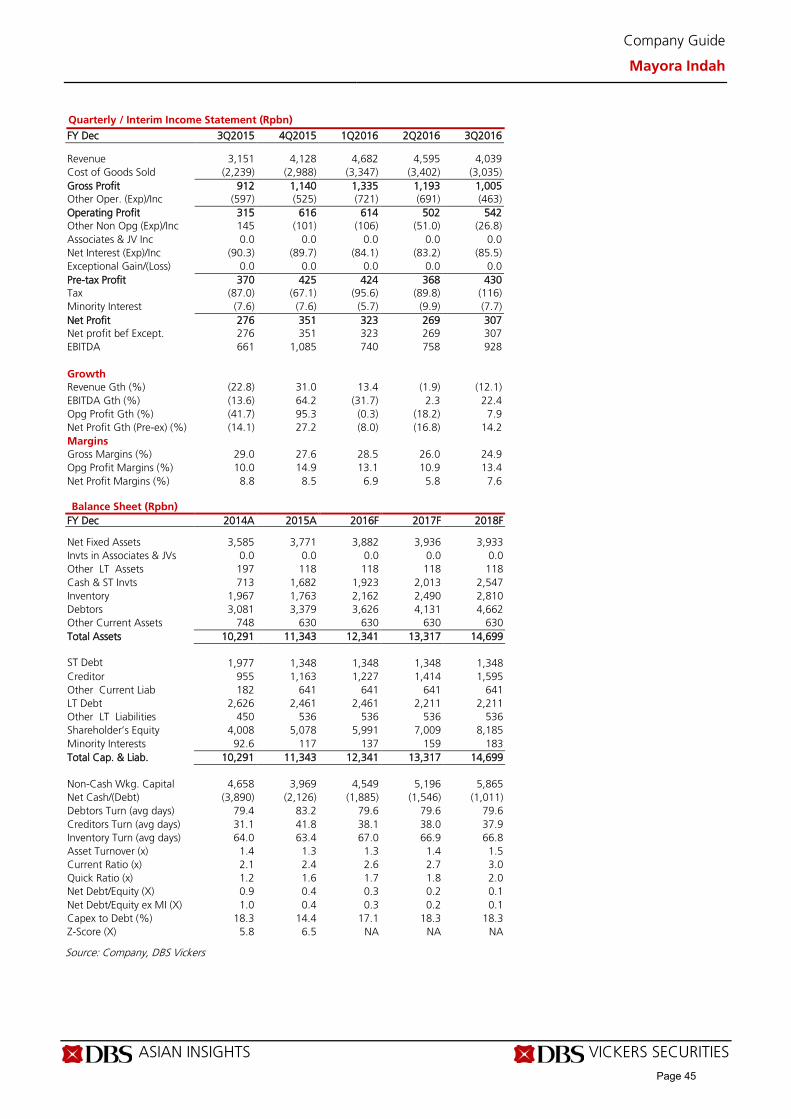
ASIAN INSIGHTS VICKERS SECURITIES Page 5
Company Guide
Mayora Indah
Quarterly / Interim Income Statement (Rpbn)
FY Dec 3Q2015 4Q2015 1Q2016 2Q2016 3Q2016 Revenue 3,151 4,128 4,682 4,595 4,039 Cost of Goods Sold (2,239) (2,988) (3,347) (3,402) (3,035) Gross Profit 912 1,140 1,335 1,193 1,005 Other Oper. (Exp)/Inc (597) (525) (721) (691) (463) Operating Profit 315 616 614 502 542 Other Non Opg (Exp)/Inc 145 (101) (106) (51.0) (26.8) Associates & JV Inc 0.0 0.0 0.0 0.0 0.0 Net Interest (Exp)/Inc (90.3) (89.7) (84.1) (83.2) (85.5) Exceptional Gain/(Loss) 0.0 0.0 0.0 0.0 0.0 Pre-tax Profit 370 425 424 368 430 Tax (87.0) (67.1) (95.6) (89.8) (116) Minority Interest (7.6) (7.6) (5.7) (9.9) (7.7) Net Profit 276 351 323 269 307 Net profit bef Except. 276 351 323 269 307 EBITDA 661 1,085 740 758 928 Growth Revenue Gth (%) (22.8) 31.0 13.4 (1.9) (12.1) EBITDA Gth (%) (13.6) 64.2 (31.7) 2.3 22.4 Opg Profit Gth (%) (41.7) 95.3 (0.3) (18.2) 7.9 Net Profit Gth (Pre-ex) (%) (14.1) 27.2 (8.0) (16.8) 14.2 Margins Gross Margins (%) 29.0 27.6 28.5 26.0 24.9 Opg Profit Margins (%) 10.0 14.9 13.1 10.9 13.4 Net Profit Margins (%) 8.8 8.5 6.9 5.8 7.6
Balance Sheet (Rpbn)
FY Dec 2014A 2015A 2016F 2017F 2018F Net Fixed Assets 3,585 3,771 3,882 3,936 3,933 Invts in Associates & JVs 0.0 0.0 0.0 0.0 0.0 Other LT Assets 197 118 118 118 118 Cash & ST Invts 713 1,682 1,923 2,013 2,547 Inventory 1,967 1,763 2,162 2,490 2,810 Debtors 3,081 3,379 3,626 4,131 4,662 Other Current Assets 748 630 630 630 630 Total Assets 10,291 11,343 12,341 13,317 14,699 ST Debt
1,977 1,348 1,348 1,348 1,348 Creditor 955 1,163 1,227 1,414 1,595 Other Current Liab 182 641 641 641 641 LT Debt 2,626 2,461 2,461 2,211 2,211 Other LT Liabilities 450 536 536 536 536 Shareholder’s Equity 4,008 5,078 5,991 7,009 8,185 Minority Interests 92.6 117 137 159 183 Total Cap. & Liab. 10,291 11,343 12,341 13,317 14,699 Non-Cash Wkg. Capital 4,658 3,969 4,549 5,196 5,865 Net Cash/(Debt) (3,890) (2,126) (1,885) (1,546) (1,011) Debtors Turn (avg days) 79.4 83.2 79.6 79.6 79.6 Creditors Turn (avg days) 31.1 41.8 38.1 38.0 37.9 Inventory Turn (avg days) 64.0 63.4 67.0 66.9 66.8 Asset Turnover (x) 1.4 1.3 1.3 1.4 1.5 Current Ratio (x) 2.1 2.4 2.6 2.7 3.0 Quick Ratio (x) 1.2 1.6 1.7 1.8 2.0 Net Debt/Equity (X) 0.9 0.4 0.3 0.2 0.1 Net Debt/Equity ex MI (X) 1.0 0.4 0.3 0.2 0.1 Capex to Debt (%) 18.3 14.4 17.1 18.3 18.3 Z-Score (X) 5.8 6.5 NA NA NA
Source: Company, DBS Vickers
Page 45
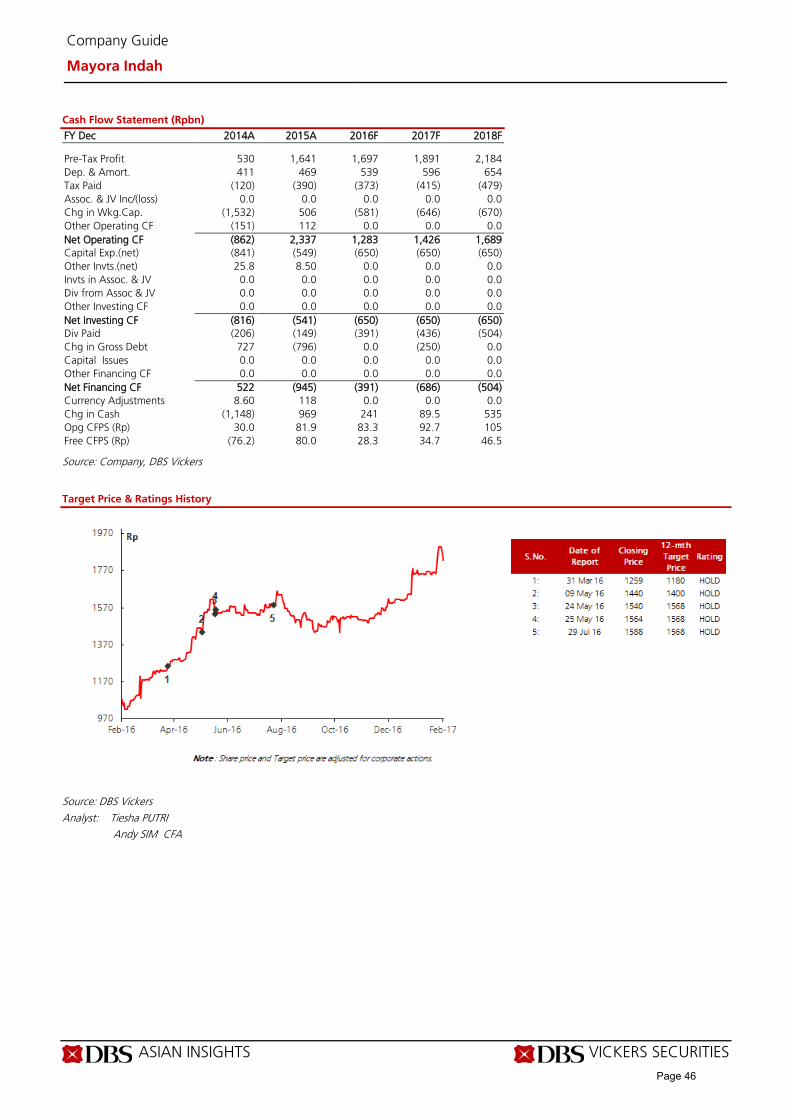
ASIAN INSIGHTS VICKERS SECURITIES Page 6
Company Guide
Mayora Indah
Cash Flow Statement (Rpbn)
FY Dec 2014A 2015A 2016F 2017F 2018F Pre-Tax Profit 530 1,641 1,697 1,891 2,184 Dep. & Amort. 411 469 539 596 654 Tax Paid (120) (390) (373) (415) (479) Assoc. & JV Inc/(loss) 0.0 0.0 0.0 0.0 0.0 Chg in Wkg.Cap. (1,532) 506 (581) (646) (670) Other Operating CF (151) 112 0.0 0.0 0.0 Net Operating CF (862) 2,337 1,283 1,426 1,689 Capital Exp.(net) (841) (549) (650) (650) (650) Other Invts.(net) 25.8 8.50 0.0 0.0 0.0 Invts in Assoc. & JV 0.0 0.0 0.0 0.0 0.0 Div from Assoc & JV 0.0 0.0 0.0 0.0 0.0 Other Investing CF 0.0 0.0 0.0 0.0 0.0 Net Investing CF (816) (541) (650) (650) (650) Div Paid (206) (149) (391) (436) (504) Chg in Gross Debt 727 (796) 0.0 (250) 0.0 Capital Issues 0.0 0.0 0.0 0.0 0.0 Other Financing CF 0.0 0.0 0.0 0.0 0.0 Net Financing CF 522 (945) (391) (686) (504) Currency Adjustments 8.60 118 0.0 0.0 0.0 Chg in Cash (1,148) 969 241 89.5 535 Opg CFPS (Rp) 30.0 81.9 83.3 92.7 105 Free CFPS (Rp) (76.2) 80.0 28.3 34.7 46.5
Source: Company, DBS Vickers
Target Price & Ratings History
Source: DBS Vickers
Analyst: Tiesha PUTRI Andy SIM CFA
Page 46
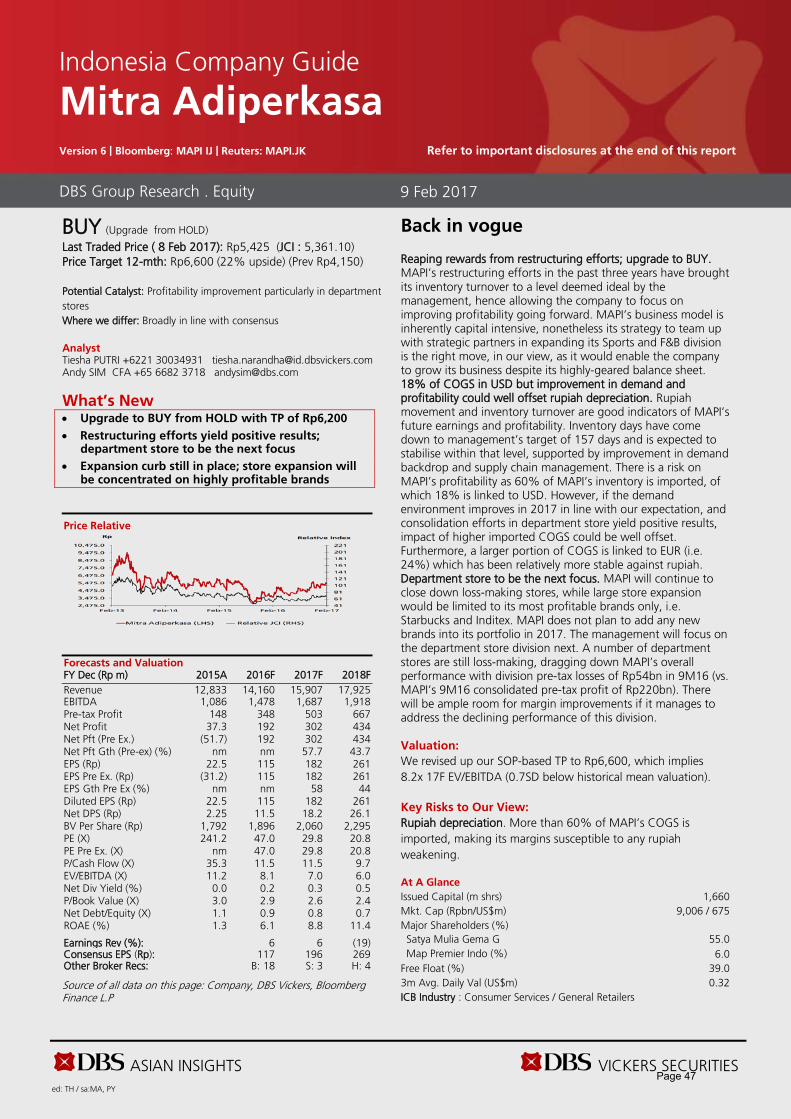
ASIAN INSIGHTS VICKERS SECURITIES ed: TH / sa:MA, PY
BUY (Upgrade from HOLD)
Last Traded Price ( 8 Feb 2017): Rp5,425 (JCI : 5,361.10) Price Target 12-mth: Rp6,600 (22% upside) (Prev Rp4,150) Potential Catalyst: Profitability improvement particularly in department stores Where we differ: Broadly in line with consensus Analyst Tiesha PUTRI +6221 30034931 [email protected] Andy SIM CFA +65 6682 3718 [email protected]
What’s New • Upgrade to BUY from HOLD with TP of Rp6,200
• Restructuring efforts yield positive results; department store to be the next focus
• Expansion curb still in place; store expansion will be concentrated on highly profitable brands
Price Relative
Forecasts and Valuation FY Dec (Rp m) 2015A 2016F 2017F 2018F Revenue 12,833 14,160 15,907 17,925 EBITDA 1,086 1,478 1,687 1,918 Pre-tax Profit 148 348 503 667 Net Profit 37.3 192 302 434 Net Pft (Pre Ex.) (51.7) 192 302 434 Net Pft Gth (Pre-ex) (%) nm nm 57.7 43.7 EPS (Rp) 22.5 115 182 261 EPS Pre Ex. (Rp) (31.2) 115 182 261 EPS Gth Pre Ex (%) nm nm 58 44 Diluted EPS (Rp) 22.5 115 182 261 Net DPS (Rp) 2.25 11.5 18.2 26.1 BV Per Share (Rp) 1,792 1,896 2,060 2,295 PE (X) 241.2 47.0 29.8 20.8 PE Pre Ex. (X) nm 47.0 29.8 20.8 P/Cash Flow (X) 35.3 11.5 11.5 9.7 EV/EBITDA (X) 11.2 8.1 7.0 6.0 Net Div Yield (%) 0.0 0.2 0.3 0.5 P/Book Value (X) 3.0 2.9 2.6 2.4 Net Debt/Equity (X) 1.1 0.9 0.8 0.7 ROAE (%) 1.3 6.1 8.8 11.4 Earnings Rev (%): 6 6 (19) Consensus EPS (Rp): 117 196 269 Other Broker Recs: B: 18 S: 3 H: 4
Source of all data on this page: Company, DBS Vickers, Bloomberg Finance L.P
Back in vogue Reaping rewards from restructuring efforts; upgrade to BUY. MAPI’s restructuring efforts in the past three years have brought its inventory turnover to a level deemed ideal by the management, hence allowing the company to focus on improving profitability going forward. MAPI’s business model is inherently capital intensive, nonetheless its strategy to team up with strategic partners in expanding its Sports and F&B division is the right move, in our view, as it would enable the company to grow its business despite its highly-geared balance sheet. 18% of COGS in USD but improvement in demand and profitability could well offset rupiah depreciation. Rupiah movement and inventory turnover are good indicators of MAPI’s future earnings and profitability. Inventory days have come down to management’s target of 157 days and is expected to stabilise within that level, supported by improvement in demand backdrop and supply chain management. There is a risk on MAPI’s profitability as 60% of MAPI’s inventory is imported, of which 18% is linked to USD. However, if the demand environment improves in 2017 in line with our expectation, and consolidation efforts in department store yield positive results, impact of higher imported COGS could be well offset. Furthermore, a larger portion of COGS is linked to EUR (i.e. 24%) which has been relatively more stable against rupiah. Department store to be the next focus. MAPI will continue to close down loss-making stores, while large store expansion would be limited to its most profitable brands only, i.e. Starbucks and Inditex. MAPI does not plan to add any new brands into its portfolio in 2017. The management will focus on the department store division next. A number of department stores are still loss-making, dragging down MAPI’s overall performance with division pre-tax losses of Rp54bn in 9M16 (vs. MAPI’s 9M16 consolidated pre-tax profit of Rp220bn). There will be ample room for margin improvements if it manages to address the declining performance of this division. Valuation: We revised up our SOP-based TP to Rp6,600, which implies 8.2x 17F EV/EBITDA (0.7SD below historical mean valuation). Key Risks to Our View: Rupiah depreciation. More than 60% of MAPI’s COGS is imported, making its margins susceptible to any rupiah weakening. At A Glance Issued Capital (m shrs) 1,660 Mkt. Cap (Rpbn/US$m) 9,006 / 675 Major Shareholders (%) Satya Mulia Gema G 55.0 Map Premier Indo (%) 6.0
Free Float (%) 39.0 3m Avg. Daily Val (US$m) 0.32 ICB Industry : Consumer Services / General Retailers
DBS Group Research . Equity
9 Feb 2017
Indonesia Company Guide
Mitra Adiperkasa Version 6 | Bloomberg: MAPI IJ | Reuters: MAPI.JK Refer to important disclosures at the end of this report
Page 47

ASIAN INSIGHTS VICKERS SECURITIES Page 2
Company Guide
Mitra Adiperkasa
WHAT’S NEW Back in vogue
Better supply chain management should sustain inventory turnover at current level. In the past few years, MAPI’s main focus had been on addressing its inventory build-up issue, which was done at the expense of profitability. The company ran aggressive discounting across all brands, particularly its Active/Sports division (whose inventory days climbed up to 11 months in 2015, partly due to aggressive store rollouts in second-tier cities) with discounts ranging from 50-70%. The company removed the blanket discount in mid-2015 and its gross margin has been picking up ever since. According to management, inventory days of MAPI’s Active division have come down to c.90 days currently.
Along with the inventory clearance programme, the company had also fixed its ordering cycle and inventory management. A more orderly scheme on inventory clearance discount has now been put in place, which is based on inventory’s age. Unlike in the past years, MAPI now can monitor its inventory purchase, ageing and discounting policy through an enhanced software. The adoption of this new system enables MAPI to closely monitor its inventories, hence reducing the risk of inventory build-up and impairment in the future.
Addressing profitability issue in Department Store. MAPI owns 32 department stores under six brands, i.e. SOGO, Debenhams, Seibu, Galeries Lafayette, Lotus and Alun Alun Indonesia, and 27 supermarkets under the brand “The Foodhall”. The department store has the lowest profitability among MAPI’s four store formats but carries low inventory as it operates under consignment model (80% of inventories are consigned). It is also the most space intensive as one department store occupies up to 6,000 sqm of retail space on average, which is equal to 26 specialty or F&B outlets. In many cases, a department store can take up to 50% of a mall’s retail space. The department store business enables MAPI to enjoy special lease rates from property developers due to its status as an anchor tenant in a number of malls.
While SOGO and Seibu are performing well, other department store brands are still loss-making. In an attempt to improve the segment’s profitability, the company closed down one loss-making Debenhams store at Lippo Kemang Village Jakarta in the middle of 2016 and is reviewing the conversion of two Debenhams stores in Senayan City (Jakarta) and Supermall Karawaci (Tangerang, West Java) into its more successful department store formats, Seibu and SOGO. The company also operates five loss-making department stores catering to the middle-income segment under the brand “Lotus”. Two Lotus stores in East Java are scheduled to be closed in 2017, while the remaining three stores in Greater Jakarta will be converted into MAP Clearance Store.
Department stores have shown a weak organic growth with SSSG consistently underperforming MAPI’s consolidated SSSG in the past six years. Store productivity and profitability have also been weaker compared to MAPI’s other segments. In 9M16, department stores contributed only 20% of MAPI’s consolidated revenue despite occupying 47% of MAPI’s retail space. The segment booked a razor-thin EBIT margin of 0.6% with pretax losses of Rp54bn. As a comparison, MAPI booked a consolidated pre-tax profit of Rp220bn in 9M16. There is still room for profitability improvement if MAPI manages to address the store productivity issue faced by its department stores.
We assume Department Store’s EBIT margin would improve to 1% in FY17F. We keep our number conservative as we believe it would take time for MAPI to close down all of its non-performing stores given the rental commitment and ramp up sales and profits from the replacement stores. As a reference, Department Store’s EBIT margin ranged between 4% and 7% in 2010-2013 vs. a mere 0.6% in 9M16 and our assumption of 1% in FY17F and 1.5% in FY18F. Every 10-bp upside to our margin assumption would lift our FY17 EBITDA/net profit forecast by 0.2%/0.5%.
Expansion curb still in place; store expansion will be concentrated on highly-profitable brands. MAPI will keep its expansion pace slow without any new brand addition in 2017. The company aims to add 200 stores this year (which is still slower compared to its store expansion pace in 2012-2013), but mostly for its highly-profitable brands such as Inditex and Starbucks. Starbucks is MAPI’s key segment in the F&B division with c.240 stores and c.80% contribution to F&B EBIT. The brand has consistently booked a low-teen SSSG in the past years. Partnering with General Atlantic, MAPI looks to add 60 Starbucks outlets p.a. equally spread among malls, rest areas, airports/terminals (mainly outside Java) and office buildings. In the past, MAPI typically only adds 20-30 Starbucks outlets p.a.
Competition from online retailers still scarce in upper and upper-middle segment. The company has tapped into the fast-growing e-commerce business through MAPeMALL where most of its key brands are sold exclusively in its website. The brand exclusivity and MAPI’s main target markets, which are upper and upper-middle income segment, insulate MAPI from competition against the existing online retailers, in our view. We note that online fashion retailers cater mostly to the middle-class segments, offering apparels with pricing range of Rp100,000-300,000 (US$7–US$22) while MAPI’s products are typically priced above Rp300,000.
Revised up 16F/17F net profit forecasts by 6%; upgrade to BUY. We raise our EBIT margin assumptions following better-than-expected results in 3Q16. Consequently, our 16F/17F
Page 48
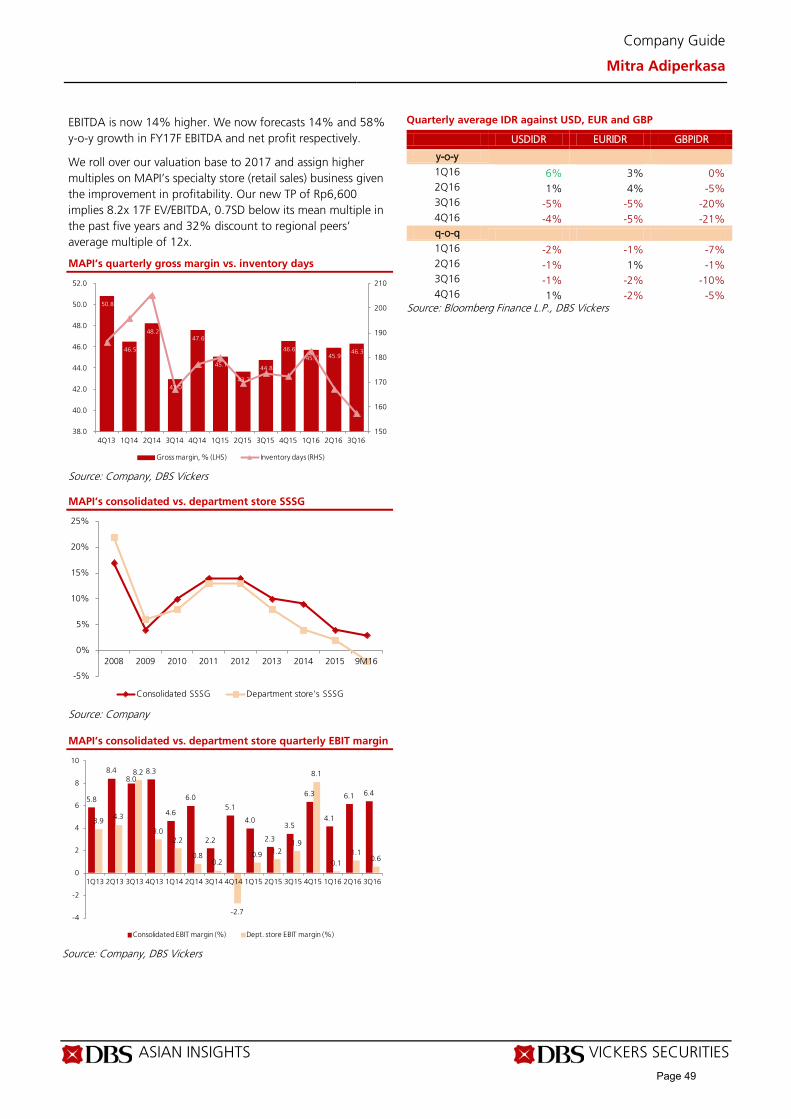
ASIAN INSIGHTS VICKERS SECURITIES Page 3
Company Guide
Mitra Adiperkasa
EBITDA is now 14% higher. We now forecasts 14% and 58% y-o-y growth in FY17F EBITDA and net profit respectively.
We roll over our valuation base to 2017 and assign higher multiples on MAPI’s specialty store (retail sales) business given the improvement in profitability. Our new TP of Rp6,600 implies 8.2x 17F EV/EBITDA, 0.7SD below its mean multiple in the past five years and 32% discount to regional peers’ average multiple of 12x.
MAPI’s quarterly gross margin vs. inventory days
Source: Company, DBS Vickers MAPI’s consolidated vs. department store SSSG
Source: Company
MAPI’s consolidated vs. department store quarterly EBIT margin
Source: Company, DBS Vickers
Quarterly average IDR against USD, EUR and GBP
USDIDR EURIDR GBPIDR
y-o-y 1Q16 6% 3% 0% 2Q16 1% 4% -5% 3Q16 -5% -5% -20% 4Q16 -4% -5% -21% q-o-q 1Q16 -2% -1% -7% 2Q16 -1% 1% -1% 3Q16 -1% -2% -10% 4Q16 1% -2% -5%
Source: Bloomberg Finance L.P., DBS Vickers
50.8
46.5
48.2
43.0
47.6
45.1
43.7
44.8
46.6 45.7 45.9
46.3
150
160
170
180
190
200
210
38.0
40.0
42.0
44.0
46.0
48.0
50.0
52.0
4Q13 1Q14 2Q14 3Q14 4Q14 1Q15 2Q15 3Q15 4Q15 1Q16 2Q16 3Q16
Gross margin, % (LHS) Inventory days (RHS)
-5%
0%
5%
10%
15%
20%
25%
2008 2009 2010 2011 2012 2013 2014 2015 9M16
Consolidated SSSG Department store's SSSG
5.8
8.48.0
8.3
4.6
6.0
2.2
5.1
4.0
2.3
3.5
6.3
4.1
6.1 6.4
3.9 4.3
8.2
3.02.2
0.80.2
-2.7
0.9 1.21.9
8.1
0.11.1
0.6
-4
-2
0
2
4
6
8
10
1Q13 2Q13 3Q13 4Q13 1Q14 2Q14 3Q14 4Q14 1Q15 2Q15 3Q15 4Q15 1Q16 2Q16 3Q16
Consolidated EBIT margin (%) Dept. store EBIT margin (%)
Page 49
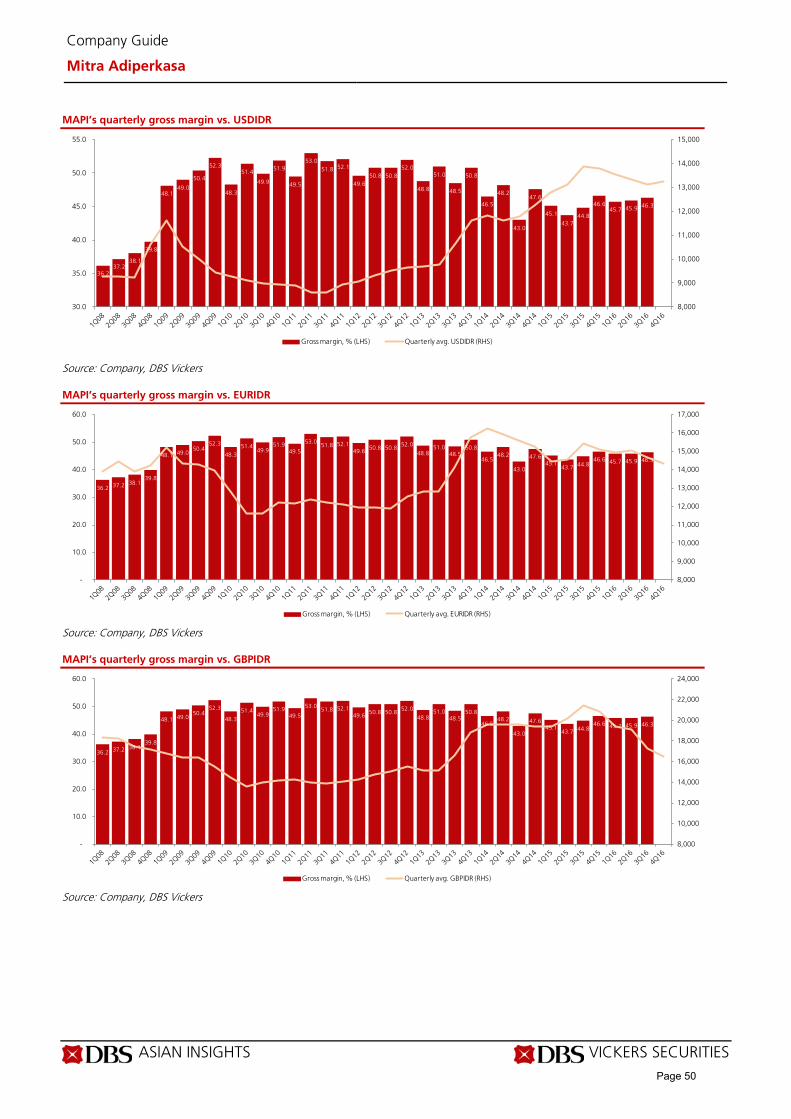
ASIAN INSIGHTS VICKERS SECURITIES Page 4
Company Guide
Mitra Adiperkasa
MAPI’s quarterly gross margin vs. USDIDR
Source: Company, DBS Vickers MAPI’s quarterly gross margin vs. EURIDR
Source: Company, DBS Vickers MAPI’s quarterly gross margin vs. GBPIDR
Source: Company, DBS Vickers
36.2 37.2
38.1
39.8
48.1 49.0
50.4
52.3
48.3
51.4
49.9
51.9
49.5
53.0 51.8 52.1
49.6 50.8 50.8
52.0
48.8
51.0
48.5
50.8
46.5
48.2
43.0
47.6
45.1
43.7 44.8
46.6 45.7 45.9 46.3
8,000
9,000
10,000
11,000
12,000
13,000
14,000
15,000
30.0
35.0
40.0
45.0
50.0
55.0
Gross margin, % (LHS) Quarterly avg. USDIDR (RHS)
36.2 37.2 38.1 39.8
48.1 49.0 50.4
52.3
48.3 51.4
49.9 51.9
49.5
53.0 51.8 52.1 49.6 50.8 50.8 52.0
48.8 51.0
48.5 50.8
46.5 48.2
43.0
47.6 45.1
43.7 44.8 46.6 45.7 45.9 46.3
8,000
9,000
10,000
11,000
12,000
13,000
14,000
15,000
16,000
17,000
-
10.0
20.0
30.0
40.0
50.0
60.0
Gross margin, % (LHS) Quarterly avg. EURIDR (RHS)
36.2 37.2 38.1 39.8
48.1 49.0 50.4
52.3
48.3 51.4
49.9 51.9
49.5
53.0 51.8 52.1 49.6 50.8 50.8 52.0
48.8 51.0
48.5 50.8
46.5 48.2
43.0
47.6 45.1
43.7 44.8 46.6 45.7 45.9 46.3
8,000
10,000
12,000
14,000
16,000
18,000
20,000
22,000
24,000
-
10.0
20.0
30.0
40.0
50.0
60.0
Gross margin, % (LHS) Quarterly avg. GBPIDR (RHS)
Page 50
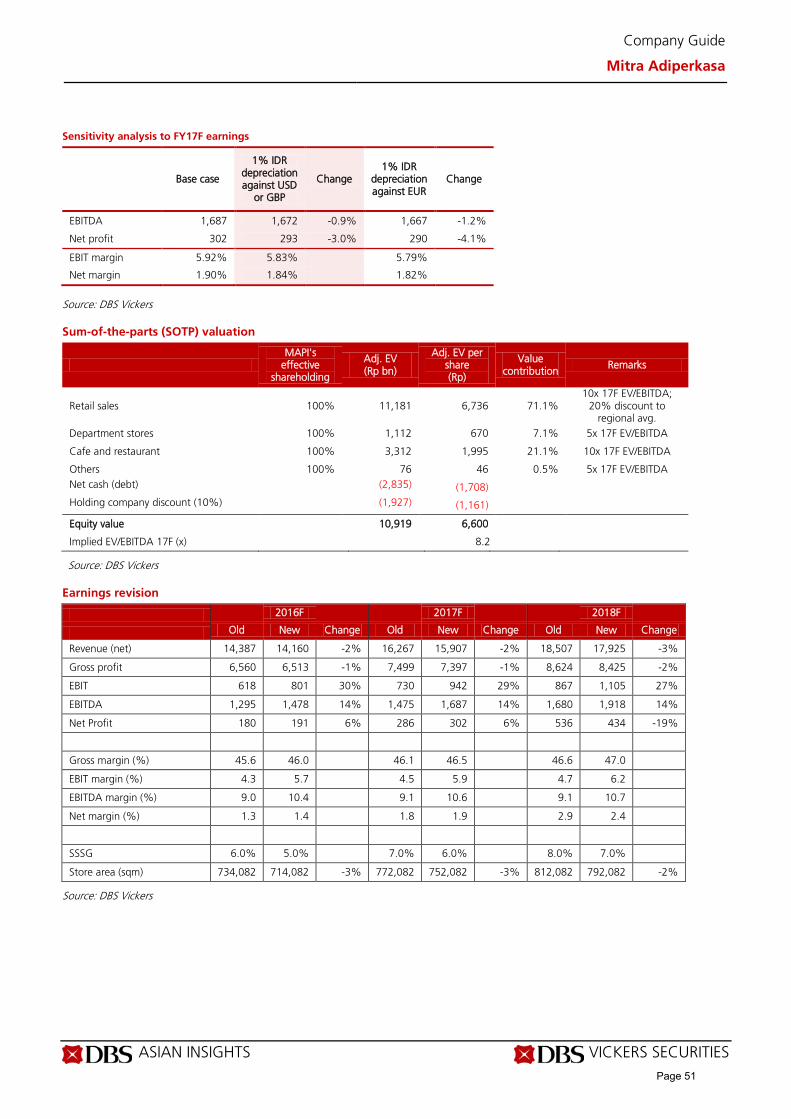
ASIAN INSIGHTS VICKERS SECURITIES Page 5
Company Guide
Mitra Adiperkasa
Sensitivity analysis to FY17F earnings
Base case
1% IDR depreciation against USD
or GBP
Change 1% IDR
depreciation against EUR
Change
EBITDA 1,687 1,672 -0.9% 1,667 -1.2%
Net profit 302 293 -3.0% 290 -4.1%
EBIT margin 5.92% 5.83%
5.79%
Net margin 1.90% 1.84%
1.82%
Source: DBS Vickers Sum-of-the-parts (SOTP) valuation
MAPI's
effective shareholding
Adj. EV (Rp bn)
Adj. EV per share (Rp)
Value contribution
Remarks
Retail sales 100% 11,181 6,736 71.1% 10x 17F EV/EBITDA;
20% discount to regional avg.
Department stores 100% 1,112 670 7.1% 5x 17F EV/EBITDA
Cafe and restaurant 100% 3,312 1,995 21.1% 10x 17F EV/EBITDA
Others 100% 76 46 0.5% 5x 17F EV/EBITDA Net cash (debt) (2,835) (1,708) Holding company discount (10%) (1,927) (1,161)
Equity value 10,919 6,600 Implied EV/EBITDA 17F (x)
8.2
Source: DBS Vickers
Earnings revision
2016F
2017F
2018F
Old New Change Old New Change Old New Change
Revenue (net) 14,387 14,160 -2% 16,267 15,907 -2% 18,507 17,925 -3%
Gross profit 6,560 6,513 -1% 7,499 7,397 -1% 8,624 8,425 -2%
EBIT 618 801 30% 730 942 29% 867 1,105 27%
EBITDA 1,295 1,478 14% 1,475 1,687 14% 1,680 1,918 14%
Net Profit 180 191 6% 286 302 6% 536 434 -19%
Gross margin (%) 45.6 46.0 46.1 46.5 46.6 47.0
EBIT margin (%) 4.3 5.7 4.5 5.9 4.7 6.2
EBITDA margin (%) 9.0 10.4 9.1 10.6 9.1 10.7
Net margin (%) 1.3 1.4 1.8 1.9 2.9 2.4
SSSG 6.0% 5.0% 7.0% 6.0% 8.0% 7.0%
Store area (sqm) 734,082 714,082 -3% 772,082 752,082 -3% 812,082 792,082 -2%
Source: DBS Vickers
Page 51
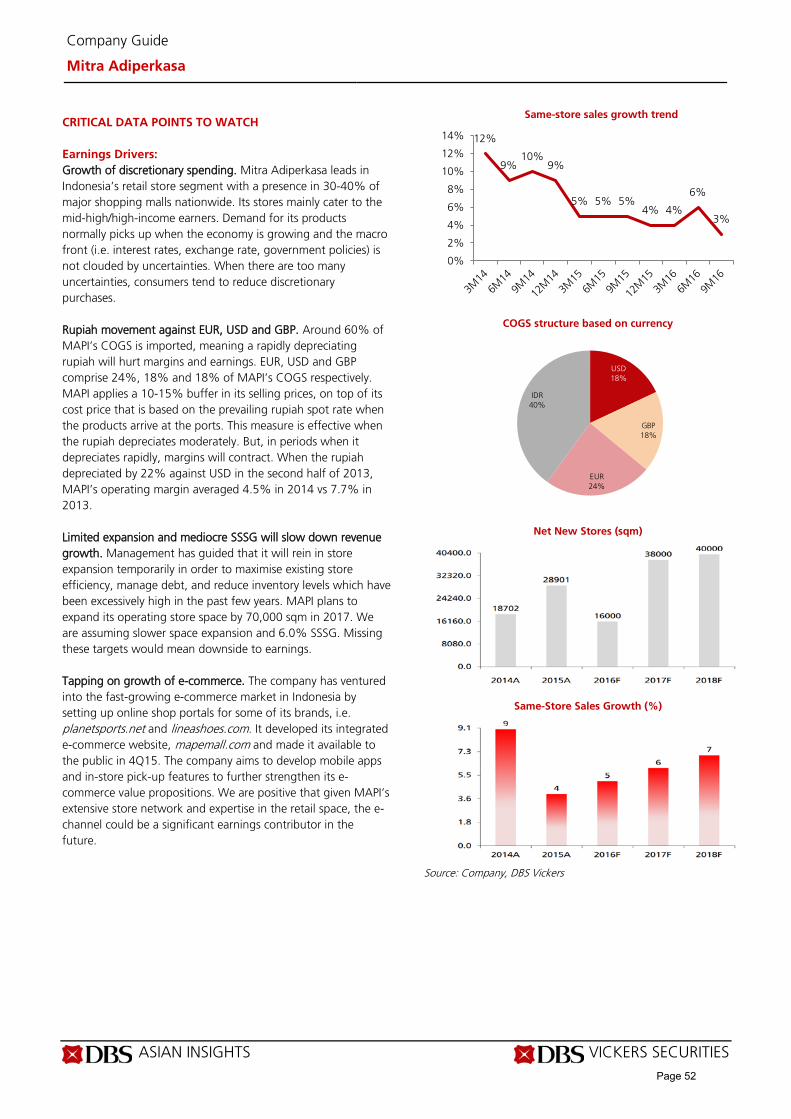
ASIAN INSIGHTS VICKERS SECURITIES Page 6
Company Guide
Mitra Adiperkasa
CRITICAL DATA POINTS TO WATCH Earnings Drivers: Growth of discretionary spending. Mitra Adiperkasa leads in Indonesia’s retail store segment with a presence in 30-40% of major shopping malls nationwide. Its stores mainly cater to the mid-high/high-income earners. Demand for its products normally picks up when the economy is growing and the macro front (i.e. interest rates, exchange rate, government policies) is not clouded by uncertainties. When there are too many uncertainties, consumers tend to reduce discretionary purchases. Rupiah movement against EUR, USD and GBP. Around 60% of MAPI’s COGS is imported, meaning a rapidly depreciating rupiah will hurt margins and earnings. EUR, USD and GBP comprise 24%, 18% and 18% of MAPI’s COGS respectively. MAPI applies a 10-15% buffer in its selling prices, on top of its cost price that is based on the prevailing rupiah spot rate when the products arrive at the ports. This measure is effective when the rupiah depreciates moderately. But, in periods when it depreciates rapidly, margins will contract. When the rupiah depreciated by 22% against USD in the second half of 2013, MAPI’s operating margin averaged 4.5% in 2014 vs 7.7% in 2013. Limited expansion and mediocre SSSG will slow down revenue growth. Management has guided that it will rein in store expansion temporarily in order to maximise existing store efficiency, manage debt, and reduce inventory levels which have been excessively high in the past few years. MAPI plans to expand its operating store space by 70,000 sqm in 2017. We are assuming slower space expansion and 6.0% SSSG. Missing these targets would mean downside to earnings. Tapping on growth of e-commerce. The company has ventured into the fast-growing e-commerce market in Indonesia by setting up online shop portals for some of its brands, i.e. planetsports.net and lineashoes.com. It developed its integrated e-commerce website, mapemall.com and made it available to the public in 4Q15. The company aims to develop mobile apps and in-store pick-up features to further strengthen its e-commerce value propositions. We are positive that given MAPI’s extensive store network and expertise in the retail space, the e-channel could be a significant earnings contributor in the future.
Same-store sales growth trend
COGS structure based on currency
Net New Stores (sqm)
Same-Store Sales Growth (%)
Source: Company, DBS Vickers
12%
9%10%
9%
5% 5% 5%4% 4%
6%
3%
0%
2%
4%
6%
8%
10%
12%
14%
USD18%
GBP18%
EUR24%
IDR40%
Page 52
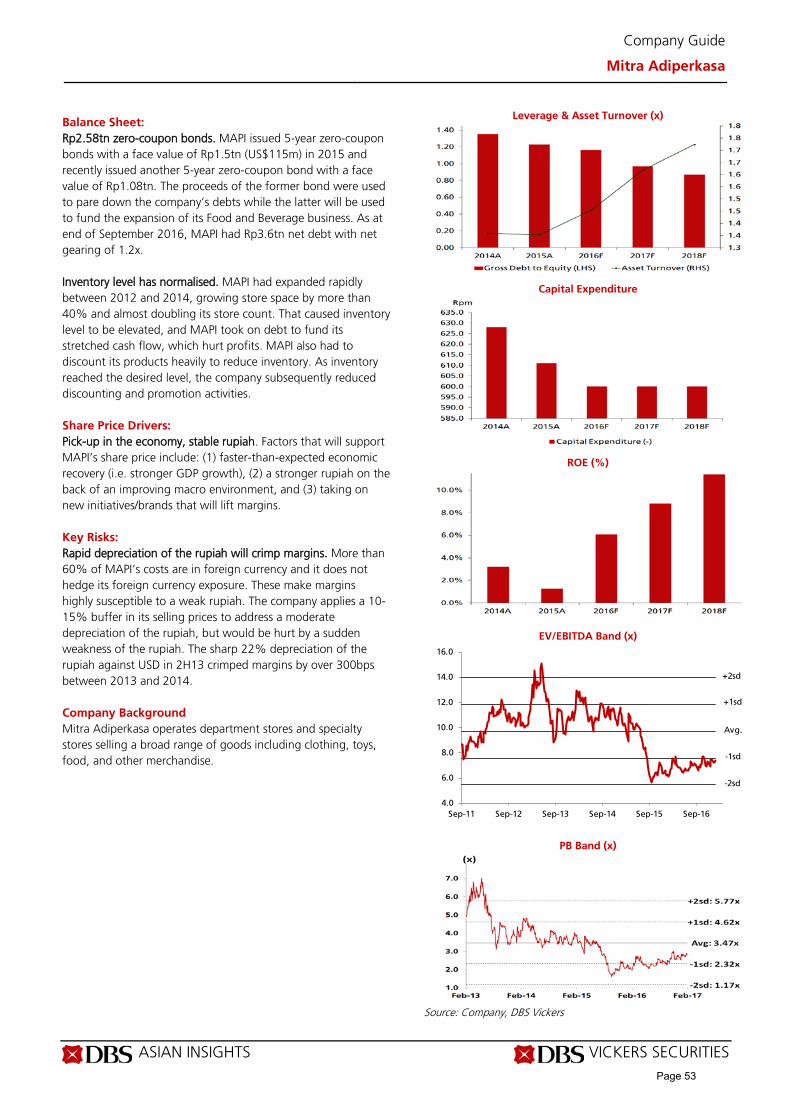
ASIAN INSIGHTS VICKERS SECURITIES Page 7
Company Guide
Mitra Adiperkasa
Balance Sheet: Rp2.58tn zero-coupon bonds. MAPI issued 5-year zero-coupon bonds with a face value of Rp1.5tn (US$115m) in 2015 and recently issued another 5-year zero-coupon bond with a face value of Rp1.08tn. The proceeds of the former bond were used to pare down the company’s debts while the latter will be used to fund the expansion of its Food and Beverage business. As at end of September 2016, MAPI had Rp3.6tn net debt with net gearing of 1.2x. Inventory level has normalised. MAPI had expanded rapidly between 2012 and 2014, growing store space by more than 40% and almost doubling its store count. That caused inventory level to be elevated, and MAPI took on debt to fund its stretched cash flow, which hurt profits. MAPI also had to discount its products heavily to reduce inventory. As inventory reached the desired level, the company subsequently reduced discounting and promotion activities. Share Price Drivers: Pick-up in the economy, stable rupiah. Factors that will support MAPI’s share price include: (1) faster-than-expected economic recovery (i.e. stronger GDP growth), (2) a stronger rupiah on the back of an improving macro environment, and (3) taking on new initiatives/brands that will lift margins. Key Risks: Rapid depreciation of the rupiah will crimp margins. More than 60% of MAPI’s costs are in foreign currency and it does not hedge its foreign currency exposure. These make margins highly susceptible to a weak rupiah. The company applies a 10-15% buffer in its selling prices to address a moderate depreciation of the rupiah, but would be hurt by a sudden weakness of the rupiah. The sharp 22% depreciation of the rupiah against USD in 2H13 crimped margins by over 300bps between 2013 and 2014. Company Background Mitra Adiperkasa operates department stores and specialty stores selling a broad range of goods including clothing, toys, food, and other merchandise.
Leverage & Asset Turnover (x)
Capital Expenditure
ROE (%)
EV/EBITDA Band (x)
PB Band (x)
Source: Company, DBS Vickers
4.0
6.0
8.0
10.0
12.0
14.0
16.0
Sep-11 Sep-12 Sep-13 Sep-14 Sep-15 Sep-16
+2sd
+1sd
-1sd
-2sd
Avg.
Page 53
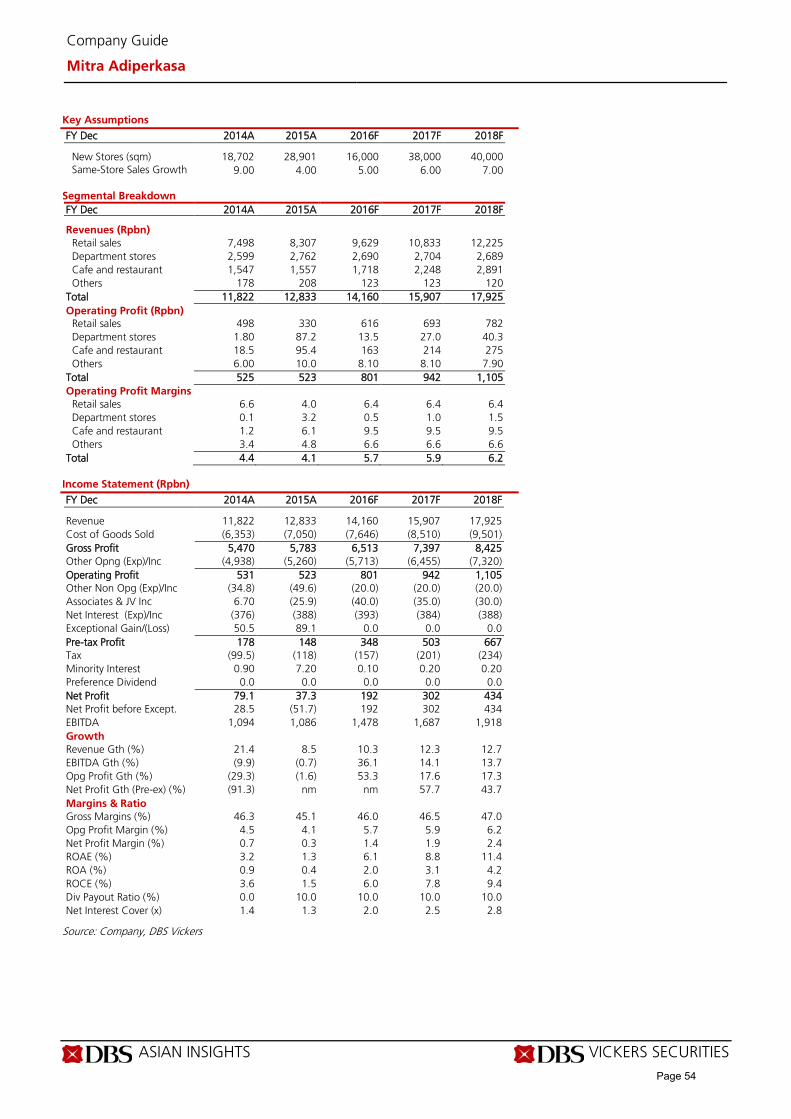
ASIAN INSIGHTS VICKERS SECURITIES Page 8
Company Guide
Mitra Adiperkasa
Key Assumptions
FY Dec 2014A 2015A 2016F 2017F 2018F New Stores (sqm) 18,702 28,901 16,000 38,000 40,000 Same-Store Sales Growth
9.00 4.00 5.00 6.00 7.00
Segmental Breakdown FY Dec 2014A 2015A 2016F 2017F 2018F Revenues (Rpbn) Retail sales 7,498 8,307 9,629 10,833 12,225 Department stores 2,599 2,762 2,690 2,704 2,689 Cafe and restaurant 1,547 1,557 1,718 2,248 2,891 Others 178 208 123 123 120 Total 11,822 12,833 14,160 15,907 17,925 Operating Profit (Rpbn) Retail sales 498 330 616 693 782 Department stores 1.80 87.2 13.5 27.0 40.3 Cafe and restaurant 18.5 95.4 163 214 275 Others 6.00 10.0 8.10 8.10 7.90 Total 525 523 801 942 1,105 Operating Profit Margins
Retail sales 6.6 4.0 6.4 6.4 6.4 Department stores 0.1 3.2 0.5 1.0 1.5 Cafe and restaurant 1.2 6.1 9.5 9.5 9.5 Others 3.4 4.8 6.6 6.6 6.6 Total 4.4 4.1 5.7 5.9 6.2
Income Statement (Rpbn)
FY Dec 2014A 2015A 2016F 2017F 2018F Revenue 11,822 12,833 14,160 15,907 17,925 Cost of Goods Sold (6,353) (7,050) (7,646) (8,510) (9,501) Gross Profit 5,470 5,783 6,513 7,397 8,425 Other Opng (Exp)/Inc (4,938) (5,260) (5,713) (6,455) (7,320) Operating Profit 531 523 801 942 1,105 Other Non Opg (Exp)/Inc (34.8) (49.6) (20.0) (20.0) (20.0) Associates & JV Inc 6.70 (25.9) (40.0) (35.0) (30.0) Net Interest (Exp)/Inc (376) (388) (393) (384) (388) Exceptional Gain/(Loss) 50.5 89.1 0.0 0.0 0.0 Pre-tax Profit 178 148 348 503 667 Tax (99.5) (118) (157) (201) (234) Minority Interest 0.90 7.20 0.10 0.20 0.20 Preference Dividend 0.0 0.0 0.0 0.0 0.0 Net Profit 79.1 37.3 192 302 434 Net Profit before Except. 28.5 (51.7) 192 302 434 EBITDA 1,094 1,086 1,478 1,687 1,918 Growth Revenue Gth (%) 21.4 8.5 10.3 12.3 12.7 EBITDA Gth (%) (9.9) (0.7) 36.1 14.1 13.7 Opg Profit Gth (%) (29.3) (1.6) 53.3 17.6 17.3 Net Profit Gth (Pre-ex) (%) (91.3) nm nm 57.7 43.7 Margins & Ratio Gross Margins (%) 46.3 45.1 46.0 46.5 47.0 Opg Profit Margin (%) 4.5 4.1 5.7 5.9 6.2 Net Profit Margin (%) 0.7 0.3 1.4 1.9 2.4 ROAE (%) 3.2 1.3 6.1 8.8 11.4 ROA (%) 0.9 0.4 2.0 3.1 4.2 ROCE (%) 3.6 1.5 6.0 7.8 9.4 Div Payout Ratio (%) 0.0 10.0 10.0 10.0 10.0 Net Interest Cover (x) 1.4 1.3 2.0 2.5 2.8
Source: Company, DBS Vickers
Page 54

ASIAN INSIGHTS VICKERS SECURITIES Page 9
Company Guide
Mitra Adiperkasa
Quarterly / Interim Income Statement (Rpbn)
FY Dec 3Q2015 4Q2015 1Q2016 2Q2016 3Q2016 Revenue 3,299 3,432 3,167 3,494 3,629 Cost of Goods Sold (1,822) (1,834) (1,719) (1,889) (1,947) Gross Profit 1,477 1,598 1,448 1,604 1,682 Other Oper. (Exp)/Inc (1,362) (1,380) (1,317) (1,390) (1,450) Operating Profit 115 217 131 215 232 Other Non Opg (Exp)/Inc (20.3) 3.60 0.30 (27.9) 4.40 Associates & JV Inc (4.7) (13.5) (10.7) (18.1) (3.7) Net Interest (Exp)/Inc (91.8) (103) (91.0) (109) (101) Exceptional Gain/(Loss) 0.0 2.20 0.0 0.0 0.0 Pre-tax Profit (1.6) 106 29.6 59.0 132 Tax (4.4) (96.3) (14.2) (28.0) (57.7) Minority Interest 7.30 (0.1) 0.0 0.0 0.0 Net Profit 1.40 10.0 15.4 30.9 74.0 Net profit bef Except. 1.40 7.80 15.4 30.9 74.0 EBITDA 266 367 282 380 431 Growth Revenue Gth (%) 5.1 4.0 (7.7) 10.3 3.9 EBITDA Gth (%) 19.5 38.2 (23.2) 34.7 13.5 Opg Profit Gth (%) 59.7 88.7 (39.7) 63.7 8.2 Net Profit Gth (Pre-ex) (%) nm 471.6 96.6 101.4 139.2 Margins Gross Margins (%) 44.8 46.6 45.7 45.9 46.3 Opg Profit Margins (%) 3.5 6.3 4.1 6.1 6.4 Net Profit Margins (%) 0.0 0.3 0.5 0.9 2.0
Balance Sheet (Rpbn)
FY Dec 2014A 2015A 2016F 2017F 2018F Net Fixed Assets 2,636 2,674 2,596 2,451 2,239 Invts in Associates & JVs 93.9 187 147 112 81.5 Other LT Assets 809 927 927 927 927 Cash & ST Invts 513 504 670 475 759 Inventory 3,203 3,357 3,536 3,912 4,342 Debtors 496 568 597 684 786 Other Current Assets 950 1,268 1,268 1,268 1,268 Total Assets 8,701 9,483 9,741 9,829 10,401 ST Debt
1,567 937 937 937 937 Creditor 1,726 1,767 1,852 2,015 2,197 Other Current Liab 549 587 587 587 587 LT Debt 1,858 2,719 2,719 2,373 2,373 Other LT Liabilities 468 498 498 498 498 Shareholder’s Equity 2,463 2,975 3,147 3,419 3,809 Minority Interests 69.7 0.0 (0.1) (0.3) (0.5) Total Cap. & Liab. 8,701 9,483 9,741 9,829 10,401 Non-Cash Wkg. Capital 2,375 2,839 2,962 3,263 3,611 Net Cash/(Debt) (2,913) (3,152) (2,986) (2,835) (2,551) Debtors Turn (avg days) 14.1 15.1 15.0 14.7 15.0 Creditors Turn (avg days) 102.1 90.4 86.4 82.9 80.9 Inventory Turn (avg days) 176.5 169.8 164.5 159.7 158.6 Asset Turnover (x) 1.4 1.4 1.5 1.6 1.7 Current Ratio (x) 1.3 1.7 1.8 1.8 1.9 Quick Ratio (x) 0.3 0.3 0.4 0.3 0.4 Net Debt/Equity (X) 1.2 1.1 0.9 0.8 0.7 Net Debt/Equity ex MI (X) 1.2 1.1 0.9 0.8 0.7 Capex to Debt (%) 18.3 16.7 16.4 18.1 18.1 Z-Score (X) 2.8 2.8 3.0 3.3 3.5
Source: Company, DBS Vickers
Page 55

ASIAN INSIGHTS VICKERS SECURITIES Page 10
Company Guide
Mitra Adiperkasa
Cash Flow Statement (Rpbn)
FY Dec 2014A 2015A 2016F 2017F 2018F Pre-Tax Profit 178 148 348 503 667 Dep. & Amort. 563 564 677 745 813 Tax Paid (99.5) (118) (157) (201) (234) Assoc. & JV Inc/(loss) (6.7) 25.9 40.0 35.0 30.0 Chg in Wkg.Cap. (576) (438) (124) (300) (348) Other Operating CF 135 73.3 0.0 0.0 0.0 Net Operating CF 194 255 785 781 928 Capital Exp.(net) (628) (611) (600) (600) (600) Other Invts.(net) (5.1) 11.3 0.0 0.0 0.0 Invts in Assoc. & JV 56.8 0.0 0.0 0.0 0.0 Div from Assoc & JV 12.0 14.0 0.0 0.0 0.0 Other Investing CF (41.4) (65.0) 0.0 0.0 0.0 Net Investing CF (606) (651) (600) (600) (600) Div Paid (33.2) 0.0 (19.1) (30.2) (43.4) Chg in Gross Debt 645 684 0.0 (346) 0.0 Capital Issues 0.0 0.0 0.0 0.0 0.0 Other Financing CF (52.4) (145) 0.0 0.0 0.0 Net Financing CF 559 539 (19.1) (376) (43.4) Currency Adjustments (3.0) (152) 0.0 0.0 0.0 Chg in Cash 144 (8.8) 166 (195) 285 Opg CFPS (Rp) 463 418 547 652 769 Free CFPS (Rp) (262) (214) 111 109 198
Source: Company, DBS Vickers
Target Price & Ratings History
Source: DBS Vickers
Analyst: Tiesha PUTRI Andy SIM CFA
Page 56

ASIAN INSIGHTS VICKERS SECURITIES ed: CK / sa:MA, PY
FULLY VALUED Last Traded Price ( 8 Feb 2017): Rp41,725 (JCI : 5,361.10) Price Target 12-mth: Rp36,200 (-13% downside) (Prev Rp30,700) Potential Catalyst: Stronger rupiah and lower raw material prices Where we differ: One of the lowest earnings forecasts on the street Analyst Tiesha PUTRI +6221 30034931 [email protected] Andy SIM CFA +65 6682 3718 [email protected]
What’s New • Revise up net profit forecasts by 7-9% for better
operating efficiency
• Facing higher cost inflation in 2017 • Welcoming Wings Group as a new competitor in
ice cream market
Price Relative
Forecasts and Valuation FY Dec (Rp m) 2015A 2016F 2017F 2018F Revenue 36,484 39,845 44,051 48,722 EBITDA 8,444 9,034 9,587 10,538 Pre-tax Profit 7,830 8,359 8,783 9,622 Net Profit 5,852 6,247 6,565 7,192 Net Pft (Pre Ex.) 5,852 6,247 6,565 7,192 Net Pft Gth (Pre-ex) (%) (1.3) 6.8 5.1 9.6 EPS (Rp) 767 819 860 943 EPS Pre Ex. (Rp) 767 819 860 943 EPS Gth Pre Ex (%) (1) 7 5 10 Diluted EPS (Rp) 767 819 860 943 Net DPS (Rp) 765 817 859 941 BV Per Share (Rp) 633 634 636 638 PE (X) 54.4 51.0 48.5 44.3 PE Pre Ex. (X) 54.4 51.0 48.5 44.3 P/Cash Flow (X) 50.5 46.1 44.5 40.8 EV/EBITDA (X) 37.8 35.4 33.5 30.5 Net Div Yield (%) 1.8 2.0 2.1 2.3 P/Book Value (X) 65.9 65.8 65.6 65.4 Net Debt/Equity (X) 0.2 0.4 0.5 0.7 ROAE (%) 121.2 129.1 135.3 147.7 Earnings Rev (%): 7 7 9 Consensus EPS (Rp): 847 942 1,066 Other Broker Recs: B: 8 S: 6 H: 15
Source of all data on this page: Company, DBS Vickers, Bloomberg Finance L.P
No bang for your buck Maintain FULLY VALUED. We raise our FY16-FY18 net profit forecasts by 7-9% to account for better operational efficiency. UNVR currently trades at a lofty valuation of 48x PE 17F. The company is facing higher cost inflation in 2017 on the back of rising commodity prices, particularly palm oil. Demand recovery has remained nascent and with tightening competition in selected segments, we only forecast 5% earnings growth for FY17. This pace of earnings growth does not justify UNVR’s lofty valuation, in our view. Our TP rises to Rp36,200, as we bump up our earnings forecast and roll over valuation base to 2017, though we maintain our FULLY VALUED call on the stock.
Higher cost inflation is key challenge in 2017. Palm oil and its derivatives are UNVR’s key raw materials. It is also worth noting that over half of UNVR’s raw material costs are linked to USD. The recent rally in commodity prices, along with potential pressure on the rupiah, may crimp UNVR’s margins going forward. We assume gross and EBIT margin contraction of 96bps in our FY17 model.
Welcoming new competitor in ice cream market. The recent entry of Japanese consumer goods company Glico into the Indonesian ice cream market is something to keep an eye on, as it could affect UNVR’s pricing power in the ice cream segment. Glico, which has teamed up with Wings Group, launched 16 variances of ice cream in November 2016 via Alfamart and Familymart, and will gradually expand its distribution channel to both modern and general trade across Indonesia. We also note that Indofood group (through ICBP) also plans to expand its ice cream business this year. Currently, UNVR dominates the Indonesian ice cream market with a market share of c.67%. We estimate the ice cream business to contribute c.16% of UNVR’s consolidated revenue.
Valuation: We value UNVR at Rp36,200 per share, based on 42x PE FY17F (five-year average PE multiple). Key Risks to Our View: Recovery in domestic economy. A faster-than-expected pick-up in Indonesia’s economy would likely translate to higher revenue growth for UNVR. A stronger demand environment would allow UNVR to pass through higher raw material costs without damaging sales volume. At A Glance Issued Capital (m shrs) 7,630 Mkt. Cap (Rpbn/US$m) 318,362 / 23,874 Major Shareholders (%) Unilever Indonesia Holding BV 85.0
Free Float (%) 15.0 3m Avg. Daily Val (US$m) 6.4 ICB Industry : Consumer Goods / Personal Goods
DBS Group Research . Equity
9 Feb 2017
Indonesia Company Guide
Unilever Indonesia Version 4 | Bloomberg: UNVR IJ | Reuters: UNVR.JK Refer to important disclosures at the end of this report
Page 57
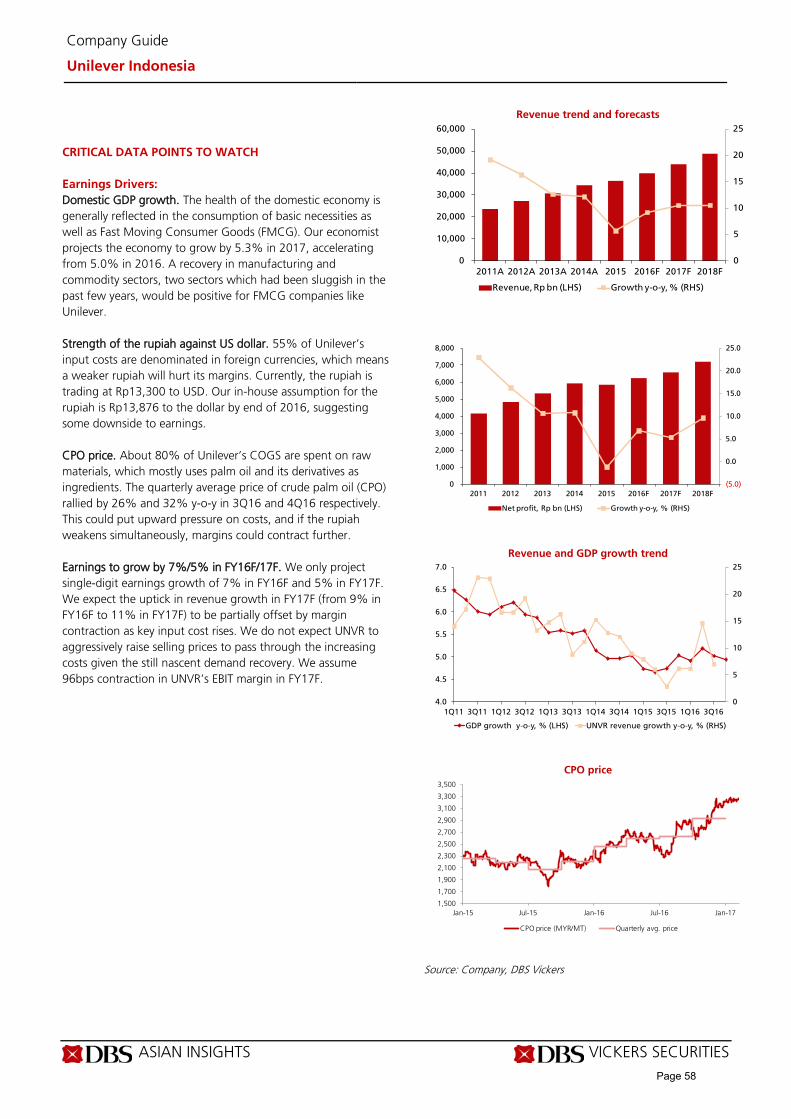
ASIAN INSIGHTS VICKERS SECURITIES Page 2
Company Guide
Unilever Indonesia
CRITICAL DATA POINTS TO WATCH Earnings Drivers: Domestic GDP growth. The health of the domestic economy is generally reflected in the consumption of basic necessities as well as Fast Moving Consumer Goods (FMCG). Our economist projects the economy to grow by 5.3% in 2017, accelerating from 5.0% in 2016. A recovery in manufacturing and commodity sectors, two sectors which had been sluggish in the past few years, would be positive for FMCG companies like Unilever. Strength of the rupiah against US dollar. 55% of Unilever’s input costs are denominated in foreign currencies, which means a weaker rupiah will hurt its margins. Currently, the rupiah is trading at Rp13,300 to USD. Our in-house assumption for the rupiah is Rp13,876 to the dollar by end of 2016, suggesting some downside to earnings. CPO price. About 80% of Unilever’s COGS are spent on raw materials, which mostly uses palm oil and its derivatives as ingredients. The quarterly average price of crude palm oil (CPO) rallied by 26% and 32% y-o-y in 3Q16 and 4Q16 respectively. This could put upward pressure on costs, and if the rupiah weakens simultaneously, margins could contract further. Earnings to grow by 7%/5% in FY16F/17F. We only project single-digit earnings growth of 7% in FY16F and 5% in FY17F. We expect the uptick in revenue growth in FY17F (from 9% in FY16F to 11% in FY17F) to be partially offset by margin contraction as key input cost rises. We do not expect UNVR to aggressively raise selling prices to pass through the increasing costs given the still nascent demand recovery. We assume 96bps contraction in UNVR’s EBIT margin in FY17F.
Revenue trend and forecasts
Revenue and GDP growth trend
CPO price
Source: Company, DBS Vickers
0
5
10
15
20
25
0
10,000
20,000
30,000
40,000
50,000
60,000
2011A 2012A 2013A 2014A 2015 2016F 2017F 2018F
Revenue, Rp bn (LHS) Growth y-o-y, % (RHS)
(5.0)
0.0
5.0
10.0
15.0
20.0
25.0
0
1,000
2,000
3,000
4,000
5,000
6,000
7,000
8,000
2011 2012 2013 2014 2015 2016F 2017F 2018F
Net profit, Rp bn (LHS) Growth y-o-y, % (RHS)
0
5
10
15
20
25
4.0
4.5
5.0
5.5
6.0
6.5
7.0
1Q11 3Q11 1Q12 3Q12 1Q13 3Q13 1Q14 3Q14 1Q15 3Q15 1Q16 3Q16
GDP growth y-o-y, % (LHS) UNVR revenue growth y-o-y, % (RHS)
1,500
1,700
1,900
2,100
2,300
2,500
2,700
2,900
3,100
3,300
3,500
Jan-15 Jul-15 Jan-16 Jul-16 Jan-17
CPO price (MYR/MT) Quarterly avg. price
Page 58
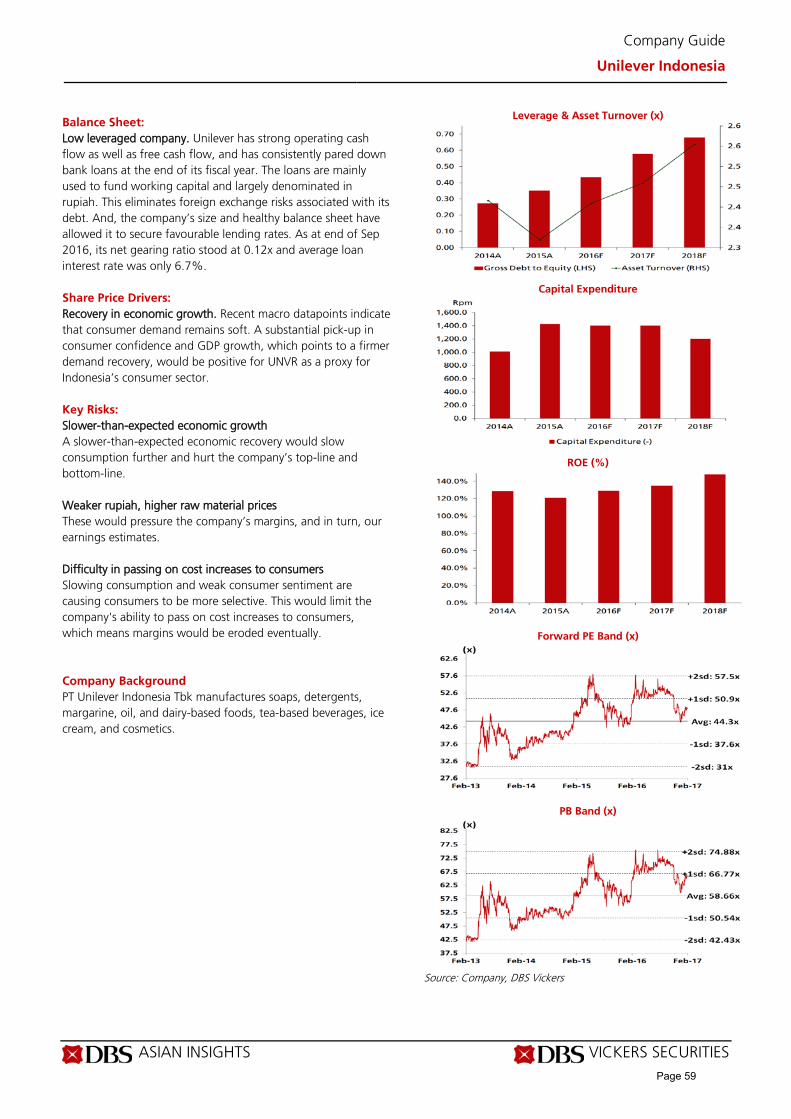
ASIAN INSIGHTS VICKERS SECURITIES Page 3
Company Guide
Unilever Indonesia
Balance Sheet: Low leveraged company. Unilever has strong operating cash flow as well as free cash flow, and has consistently pared down bank loans at the end of its fiscal year. The loans are mainly used to fund working capital and largely denominated in rupiah. This eliminates foreign exchange risks associated with its debt. And, the company’s size and healthy balance sheet have allowed it to secure favourable lending rates. As at end of Sep 2016, its net gearing ratio stood at 0.12x and average loan interest rate was only 6.7%. Share Price Drivers: Recovery in economic growth. Recent macro datapoints indicate that consumer demand remains soft. A substantial pick-up in consumer confidence and GDP growth, which points to a firmer demand recovery, would be positive for UNVR as a proxy for Indonesia’s consumer sector. Key Risks: Slower-than-expected economic growth A slower-than-expected economic recovery would slow consumption further and hurt the company’s top-line and bottom-line. Weaker rupiah, higher raw material prices These would pressure the company’s margins, and in turn, our earnings estimates. Difficulty in passing on cost increases to consumers Slowing consumption and weak consumer sentiment are causing consumers to be more selective. This would limit the company's ability to pass on cost increases to consumers, which means margins would be eroded eventually. Company Background PT Unilever Indonesia Tbk manufactures soaps, detergents, margarine, oil, and dairy-based foods, tea-based beverages, ice cream, and cosmetics.
Leverage & Asset Turnover (x)
Capital Expenditure
ROE (%)
Forward PE Band (x)
PB Band (x)
Source: Company, DBS Vickers
Page 59
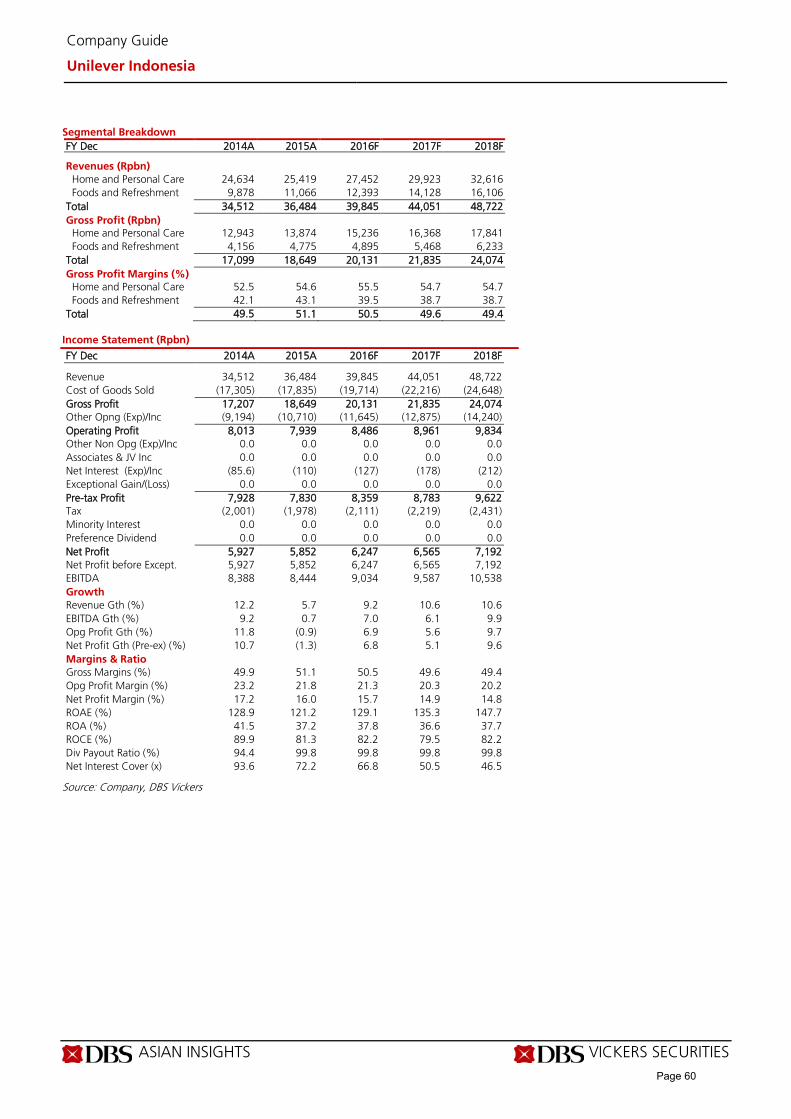
ASIAN INSIGHTS VICKERS SECURITIES Page 4
Company Guide
Unilever Indonesia
Segmental Breakdown FY Dec 2014A 2015A 2016F 2017F 2018F Revenues (Rpbn) Home and Personal Care 24,634 25,419 27,452 29,923 32,616 Foods and Refreshment 9,878 11,066 12,393 14,128 16,106 Total 34,512 36,484 39,845 44,051 48,722 Gross Profit (Rpbn) Home and Personal Care 12,943 13,874 15,236 16,368 17,841 Foods and Refreshment 4,156 4,775 4,895 5,468 6,233 Total 17,099 18,649 20,131 21,835 24,074 Gross Profit Margins (%) Home and Personal Care 52.5 54.6 55.5 54.7 54.7 Foods and Refreshment 42.1 43.1 39.5 38.7 38.7 Total 49.5 51.1 50.5 49.6 49.4
Income Statement (Rpbn)
FY Dec 2014A 2015A 2016F 2017F 2018F Revenue 34,512 36,484 39,845 44,051 48,722 Cost of Goods Sold (17,305) (17,835) (19,714) (22,216) (24,648) Gross Profit 17,207 18,649 20,131 21,835 24,074 Other Opng (Exp)/Inc (9,194) (10,710) (11,645) (12,875) (14,240) Operating Profit 8,013 7,939 8,486 8,961 9,834 Other Non Opg (Exp)/Inc 0.0 0.0 0.0 0.0 0.0 Associates & JV Inc 0.0 0.0 0.0 0.0 0.0 Net Interest (Exp)/Inc (85.6) (110) (127) (178) (212) Exceptional Gain/(Loss) 0.0 0.0 0.0 0.0 0.0 Pre-tax Profit 7,928 7,830 8,359 8,783 9,622 Tax (2,001) (1,978) (2,111) (2,219) (2,431) Minority Interest 0.0 0.0 0.0 0.0 0.0 Preference Dividend 0.0 0.0 0.0 0.0 0.0 Net Profit 5,927 5,852 6,247 6,565 7,192 Net Profit before Except. 5,927 5,852 6,247 6,565 7,192 EBITDA 8,388 8,444 9,034 9,587 10,538 Growth Revenue Gth (%) 12.2 5.7 9.2 10.6 10.6 EBITDA Gth (%) 9.2 0.7 7.0 6.1 9.9 Opg Profit Gth (%) 11.8 (0.9) 6.9 5.6 9.7 Net Profit Gth (Pre-ex) (%) 10.7 (1.3) 6.8 5.1 9.6 Margins & Ratio Gross Margins (%) 49.9 51.1 50.5 49.6 49.4 Opg Profit Margin (%) 23.2 21.8 21.3 20.3 20.2 Net Profit Margin (%) 17.2 16.0 15.7 14.9 14.8 ROAE (%) 128.9 121.2 129.1 135.3 147.7 ROA (%) 41.5 37.2 37.8 36.6 37.7 ROCE (%) 89.9 81.3 82.2 79.5 82.2 Div Payout Ratio (%) 94.4 99.8 99.8 99.8 99.8 Net Interest Cover (x) 93.6 72.2 66.8 50.5 46.5
Source: Company, DBS Vickers
Page 60
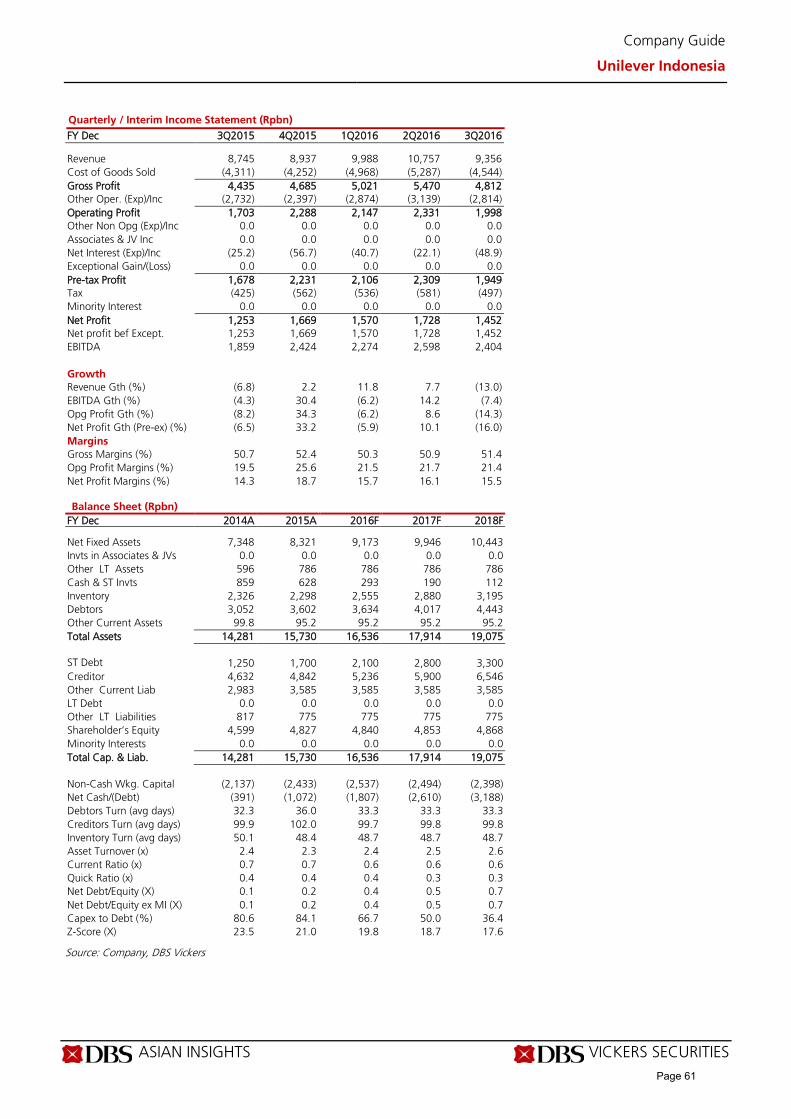
ASIAN INSIGHTS VICKERS SECURITIES Page 5
Company Guide
Unilever Indonesia
Quarterly / Interim Income Statement (Rpbn)
FY Dec 3Q2015 4Q2015 1Q2016 2Q2016 3Q2016 Revenue 8,745 8,937 9,988 10,757 9,356 Cost of Goods Sold (4,311) (4,252) (4,968) (5,287) (4,544) Gross Profit 4,435 4,685 5,021 5,470 4,812 Other Oper. (Exp)/Inc (2,732) (2,397) (2,874) (3,139) (2,814) Operating Profit 1,703 2,288 2,147 2,331 1,998 Other Non Opg (Exp)/Inc 0.0 0.0 0.0 0.0 0.0 Associates & JV Inc 0.0 0.0 0.0 0.0 0.0 Net Interest (Exp)/Inc (25.2) (56.7) (40.7) (22.1) (48.9) Exceptional Gain/(Loss) 0.0 0.0 0.0 0.0 0.0 Pre-tax Profit 1,678 2,231 2,106 2,309 1,949 Tax (425) (562) (536) (581) (497) Minority Interest 0.0 0.0 0.0 0.0 0.0 Net Profit 1,253 1,669 1,570 1,728 1,452 Net profit bef Except. 1,253 1,669 1,570 1,728 1,452 EBITDA 1,859 2,424 2,274 2,598 2,404 Growth Revenue Gth (%) (6.8) 2.2 11.8 7.7 (13.0) EBITDA Gth (%) (4.3) 30.4 (6.2) 14.2 (7.4) Opg Profit Gth (%) (8.2) 34.3 (6.2) 8.6 (14.3) Net Profit Gth (Pre-ex) (%) (6.5) 33.2 (5.9) 10.1 (16.0) Margins Gross Margins (%) 50.7 52.4 50.3 50.9 51.4 Opg Profit Margins (%) 19.5 25.6 21.5 21.7 21.4 Net Profit Margins (%) 14.3 18.7 15.7 16.1 15.5
Balance Sheet (Rpbn)
FY Dec 2014A 2015A 2016F 2017F 2018F Net Fixed Assets 7,348 8,321 9,173 9,946 10,443 Invts in Associates & JVs 0.0 0.0 0.0 0.0 0.0 Other LT Assets 596 786 786 786 786 Cash & ST Invts 859 628 293 190 112 Inventory 2,326 2,298 2,555 2,880 3,195 Debtors 3,052 3,602 3,634 4,017 4,443 Other Current Assets 99.8 95.2 95.2 95.2 95.2 Total Assets 14,281 15,730 16,536 17,914 19,075 ST Debt
1,250 1,700 2,100 2,800 3,300 Creditor 4,632 4,842 5,236 5,900 6,546 Other Current Liab 2,983 3,585 3,585 3,585 3,585 LT Debt 0.0 0.0 0.0 0.0 0.0 Other LT Liabilities 817 775 775 775 775 Shareholder’s Equity 4,599 4,827 4,840 4,853 4,868 Minority Interests 0.0 0.0 0.0 0.0 0.0 Total Cap. & Liab. 14,281 15,730 16,536 17,914 19,075 Non-Cash Wkg. Capital (2,137) (2,433) (2,537) (2,494) (2,398) Net Cash/(Debt) (391) (1,072) (1,807) (2,610) (3,188) Debtors Turn (avg days) 32.3 36.0 33.3 33.3 33.3 Creditors Turn (avg days) 99.9 102.0 99.7 99.8 99.8 Inventory Turn (avg days) 50.1 48.4 48.7 48.7 48.7 Asset Turnover (x) 2.4 2.3 2.4 2.5 2.6 Current Ratio (x) 0.7 0.7 0.6 0.6 0.6 Quick Ratio (x) 0.4 0.4 0.4 0.3 0.3 Net Debt/Equity (X) 0.1 0.2 0.4 0.5 0.7 Net Debt/Equity ex MI (X) 0.1 0.2 0.4 0.5 0.7 Capex to Debt (%) 80.6 84.1 66.7 50.0 36.4 Z-Score (X) 23.5 21.0 19.8 18.7 17.6
Source: Company, DBS Vickers
Page 61

ASIAN INSIGHTS VICKERS SECURITIES Page 6
Company Guide
Unilever Indonesia
Cash Flow Statement (Rpbn)
FY Dec 2014A 2015A 2016F 2017F 2018F Pre-Tax Profit 7,928 7,830 8,359 8,783 9,622 Dep. & Amort. 375 505 548 627 704 Tax Paid (2,001) (1,978) (2,111) (2,219) (2,431) Assoc. & JV Inc/(loss) 0.0 0.0 0.0 0.0 0.0 Chg in Wkg.Cap. 277 123 104 (43.4) (95.2) Other Operating CF (116) (181) 0.0 0.0 0.0 Net Operating CF 6,463 6,299 6,900 7,148 7,800 Capital Exp.(net) (1,007) (1,429) (1,400) (1,400) (1,200) Other Invts.(net) 0.0 0.0 0.0 0.0 0.0 Invts in Assoc. & JV 0.0 0.0 0.0 0.0 0.0 Div from Assoc & JV 0.0 0.0 0.0 0.0 0.0 Other Investing CF 0.0 0.0 0.0 0.0 0.0 Net Investing CF (1,007) (1,429) (1,400) (1,400) (1,200) Div Paid (5,127) (5,592) (6,235) (6,551) (7,177) Chg in Gross Debt 273 450 400 700 500 Capital Issues 0.0 0.0 0.0 0.0 0.0 Other Financing CF 0.0 0.0 0.0 0.0 0.0 Net Financing CF (4,854) (5,142) (5,835) (5,851) (6,677) Currency Adjustments (4.3) 41.6 0.0 0.0 0.0 Chg in Cash 598 (231) (335) (103) (77.1) Opg CFPS (Rp) 811 809 891 942 1,035 Free CFPS (Rp) 715 638 721 753 865
Source: Company, DBS Vickers
Target Price & Ratings History
Source: DBS Vickers
Analyst: Tiesha PUTRI Andy SIM CFA
Page 62

Industry Focus
Indonesia Consumer
Page 13
DBS Vickers recommendations are based an Absolute Total Return* Rating system, defined as follows:
STRONG BUY (>20% total return over the next 3 months, with identifiable share price catalysts within this time frame)
BUY (>15% total return over the next 12 months for small caps, >10% for large caps)
HOLD (-10% to +15% total return over the next 12 months for small caps, -10% to +10% for large caps)
FULLY VALUED (negative total return i.e. > -10% over the next 12 months)
SELL (negative total return of > -20% over the next 3 months, with identifiable catalysts within this time frame)
Share price appreciation + dividends
Completed Date: 9 Feb 2017 13:56:07 Dissemination Date: 9 Feb 2017 17:47:08
GENERAL DISCLOSURE/DISCLAIMER
This report is prepared by PT DBS Vickers Sekuritas Indonesia. This report is solely intended for the clients of DBS Bank Ltd, DBS Vickers Securities
(Singapore) Pte Ltd, its respective connected and associated corporations and affiliates only and no part of this document may be (i) copied,
photocopied or duplicated in any form or by any means or (ii) redistributed without the prior written consent of PT DBS Vickers Sekuritas
Indonesia.
The research set out in this report is based on information obtained from sources believed to be reliable, but we (which collectively refers to DBS
Bank Ltd, its respective connected and associated corporations, affiliates and their respective directors, officers, employees and agents (collectively,
the “DBS Group”)) do not make any representation or warranty as to its accuracy, completeness or correctness. Opinions expressed are subject to
change without notice. This document is prepared for general circulation. Any recommendation contained in this document does not have regard
to the specific investment objectives, financial situation and the particular needs of any specific addressee. This document is for the information of
addressees only and is not to be taken in substitution for the exercise of judgement by addressees, who should obtain separate independent legal
or financial advice. The DBS Group accepts no liability whatsoever for any direct, indirect and/or consequential loss (including any claims for loss of
profit) arising from any use of and/or reliance upon this document and/or further communication given in relation to this document. This
document is not to be construed as an offer or a solicitation of an offer to buy or sell any securities. The DBS Group, along with its affiliates and/or
persons associated with any of them may from time to time have interests in the securities mentioned in this document. The DBS Group may have
positions in, and may effect transactions in securities mentioned herein and may also perform or seek to perform broking, investment banking and
other banking services for these companies.
Any valuations, opinions, estimates, forecasts, ratings or risk assessments herein constitutes a judgment as of the date of this report, and there can be no assurance that future results or events will be consistent with any such valuations, opinions, estimates, forecasts, ratings or risk assessments. The information in this document is subject to change without notice, its accuracy is not guaranteed, it may be incomplete or condensed and it may not contain all material information concerning the company (or companies) referred to in this report and the DBS Group is under no obligation to update the information in this report.
This publication has not been reviewed or authorized by any regulatory authority in Singapore, Hong Kong or elsewhere. There is no planned schedule or frequency for updating research publication relating to any issuer.
The valuations, opinions, estimates, forecasts, ratings or risk assessments described in this report were based upon a number of estimates and
assumptions and are inherently subject to significant uncertainties and contingencies. It can be expected that one or more of the estimates on
which the valuations, opinions, estimates, forecasts, ratings or risk assessments were based will not materialize or will vary significantly from actual
results. Therefore, the inclusion of the valuations, opinions, estimates, forecasts, ratings or risk assessments described herein IS NOT TO BE RELIED
UPON as a representation and/or warranty by the DBS Group (and/or any persons associated with the aforesaid entities), that:
(a) such valuations, opinions, estimates, forecasts, ratings or risk assessments or their underlying assumptions will be achieved, and
(b) there is any assurance that future results or events will be consistent with any such valuations, opinions, estimates, forecasts, ratings or risk
assessments stated therein.
Please contact the primary analyst for valuation methodologies and assumptions associated with the covered companies or price targets.
Any assumptions made in this report that refers to commodities, are for the purposes of making forecasts for the company (or companies)
mentioned herein. They are not to be construed as recommendations to trade in the physical commodity or in the futures contract relating to the
commodity referred to in this report.
Page 63

Industry Focus
Indonesia Consumer
Page 14
DBS Vickers Securities (USA) Inc ("DBSVUSA")"), a U.S.-registered broker-dealer, does not have its own investment banking or research department,
has not participated in any public offering of securities as a manager or co-manager or in any other investment banking transaction in the past
twelve months and does not engage in market-making.
ANALYST CERTIFICATION The research analyst(s) primarily responsible for the content of this research report, in part or in whole, certifies that the views about the companies and their securities expressed in this report accurately reflect his/her personal views. The analyst(s) also certifies that no part of his/her compensation was, is, or will be, directly, or indirectly, related to specific recommendations or views expressed in the report. The DBS Group has procedures in place to eliminate, avoid and manage any potential conflicts of interests that may arise in connection with the production of research reports. As of 9 Feb 2017, the analyst(s) and his/her spouse and/or relatives who are financially dependent on the analyst(s), do not hold interests in the securities recommended in this report (“interest” includes direct or indirect ownership of securities). The research analyst(s) responsible for this report operates as part of a separate and independent team to the investment banking function of the DBS Group and procedures are in place to ensure that confidential information held by either the research or investment banking function is handled appropriately.
COMPANY-SPECIFIC / REGULATORY DISCLOSURES
1. PT DBS Vickers Sekuritas Indonesia (''DBSVI'') has a proprietary position in Unilever Indonesia, Indofood CBP Sukses Makmur, Indofood Sukses
Makmur, Mayora Indah, Ace Hardware Indonesia, Ramayana Lestari Sentosa and Multipolar recommended in this report as of 8 Feb 2017.
Compensation for investment banking services:
2. DBS Bank Ltd., DBSVS, their subsidiaries and/or other affiliates of DBSVUSA have received compensation, within the past 12 months for
investment banking services from Courts Asia as of 30 Dec 2016.
3. DBS Bank Ltd., DBSVS, their subsidiaries and/or other affiliates of DBSVUSA have managed or co-managed a public offering of securities for
Courts Asia in the past 12 months, as of 30 Dec 2016.
4. DBSVUSA does not have its own investment banking or research department, nor has it participated in any public offering of securities as a
manager or co-manager or in any other investment banking transaction in the past twelve months. Any US persons wishing to obtain further
information, including any clarification on disclosures in this disclaimer, or to effect a transaction in any security discussed in this document
should contact DBSVUSA exclusively.
Disclosure of previous investment recommendation produced
5. DBS Bank Ltd, DBS Vickers Securities (Singapore) Pte Ltd (''DBSVS''), their subsidiaries and/or other affiliates may have published other
investment recommendations in respect of the same securities / instruments recommended in this research report during the preceding 12
months. Please contact the primary analyst listed in the first page of this report to view previous investment recommendations published by
DBS Bank Ltd, DBS Vickers Securities (Singapore) Pte Ltd (''DBSVS''), their subsidiaries and/or other affiliates in the preceding 12 months.
RESTRICTIONS ON DISTRIBUTION
General This report is not directed to, or intended for distribution to or use by, any person or entity who is a citizen or resident of or located in any locality, state, country or other jurisdiction where such distribution, publication, availability or use would be contrary to law or regulation.
Australia This report is being distributed in Australia by DBS Bank Ltd. (“DBS”) or DBS Vickers Securities (Singapore) Pte Ltd (“DBSVS”), both of which are exempted from the requirement to hold an Australian Financial Services Licence under the Corporation Act 2001 (“CA”) in respect of financial services provided to the recipients. Both DBS and DBSVS are regulated by the Monetary Authority of Singapore under the laws of Singapore, which differ from Australian laws. Distribution of this report is intended only for “wholesale investors” within the meaning of the CA.
Hong Kong This report is being distributed in Hong Kong by or on behalf of, and is attributable to DBS Vickers (Hong Kong) Limited which is licensed and regulated by the Hong Kong Securities and Futures Commission and/or by DBS Bank (Hong Kong) Limited which is regulated by the Hong Kong Monetary Authority and the Securities and Futures Commission. Where this publication relates to a research report, unless otherwise stated in the research report(s), DBS Bank (Hong Kong) Limited is not the issuer of the research report(s). This publication including any research report(s) is/are distributed on the express understanding that, whilst the information contained within is believed to be reliable, the information has not been independently verified by DBS Bank (Hong Kong) Limited. This report is intended for distribution in Hong Kong only to professional investors (as defined in the Securities and Futures Ordinance (Chapter 571 of the Laws of Hong Kong) and any rules promulgated thereunder.)
For any query regarding the materials herein, please contact Paul Yong (CE. No. ASE988) at [email protected].
Indonesia This report is being distributed in Indonesia by PT DBS Vickers Sekuritas Indonesia.
Page 64
Industry Focus
Indonesia Consumer
Page 15
Malaysia This report is distributed in Malaysia by AllianceDBS Research Sdn Bhd ("ADBSR"). Recipients of this report, received from ADBSR are to contact the undersigned at 603-2604 3333 in respect of any matters arising from or in connection with this report. In addition to the General Disclosure/Disclaimer found at the preceding page, recipients of this report are advised that ADBSR (the preparer of this report), its holding company Alliance Investment Bank Berhad, their respective connected and associated corporations, affiliates, their directors, officers, employees, agents and parties related or associated with any of them may have positions in, and may effect transactions in the securities mentioned herein and may also perform or seek to perform broking, investment banking/corporate advisory and other services for the subject companies. They may also have received compensation and/or seek to obtain compensation for broking, investment banking/corporate advisory and other services from the subject companies.
Wong Ming Tek, Executive Director, ADBSR
Singapore This report is distributed in Singapore by DBS Bank Ltd (Company Regn. No. 196800306E) or DBSVS (Company Regn No. 198600294G), both of which are Exempt Financial Advisers as defined in the Financial Advisers Act and regulated by the Monetary Authority of Singapore. DBS Bank Ltd and/or DBSVS, may distribute reports produced by its respective foreign entities, affiliates or other foreign research houses pursuant to an arrangement under Regulation 32C of the Financial Advisers Regulations. Where the report is distributed in Singapore to a person who is not an Accredited Investor, Expert Investor or an Institutional Investor, DBS Bank Ltd accepts legal responsibility for the contents of the report to such persons only to the extent required by law. Singapore recipients should contact DBS Bank Ltd at 6327 2288 for matters arising from, or in connection with the report.
Thailand This report is being distributed in Thailand by DBS Vickers Securities (Thailand) Co Ltd. Research reports distributed are only intended for institutional clients only and no other person may act upon it.
United Kingdom This report is produced by PT DBS Vickers Sekuritas Indonesia which is regulated by the Otoritas Jasa Keuangan (OJK). This report is disseminated in the United Kingdom by DBS Vickers Securities (UK) Ltd, ("DBSVUK"). DBSVUK is authorised and regulated by the Financial Conduct Authority in the United Kingdom. In respect of the United Kingdom, this report is solely intended for the clients of DBSVUK, its respective connected and associated corporations and affiliates only and no part of this document may be (i) copied, photocopied or duplicated in any form or by any means or (ii) redistributed without the prior written consent of DBSVUK. This communication is directed at persons having professional experience in matters relating to investments. Any investment activity following from this communication will only be engaged in with such persons. Persons who do not have professional experience in matters relating to investments should not rely on this communication.
Dubai
This research report is being distributed in The Dubai International Financial Centre (“DIFC”) by DBS Bank Ltd., (DIFC Branch) having its office at PO Box 506538, 3rd Floor, Building 3, East Wing, Gate Precinct, Dubai International Financial Centre (DIFC), Dubai, United Arab Emirates. DBS Bank Ltd., (DIFC Branch) is regulated by The Dubai Financial Services Authority. This research report is intended only for professional clients (as defined in the DFSA rulebook) and no other person may act upon it.
United States This report was prepared by PT DBS Vickers Sekuritas Indonesia. DBSVUSA did not participate in its preparation. The research analyst(s) named on this report are not registered as research analysts with FINRA and are not associated persons of DBSVUSA. The research analyst(s) are not subject to FINRA Rule 2241 restrictions on analyst compensation, communications with a subject company, public appearances and trading securities held by a research analyst. This report is being distributed in the United States by DBSVUSA, which accepts responsibility for its contents. This report may only be distributed to Major U.S. Institutional Investors (as defined in SEC Rule 15a-6) and to such other institutional investors and qualified persons as DBSVUSA may authorize. Any U.S. person receiving this report who wishes to effect transactions in any securities referred to herein should contact DBSVUSA directly and not its affiliate.
Other jurisdictions In any other jurisdictions, except if otherwise restricted by laws or regulations, this report is intended only for qualified, professional, institutional or sophisticated investors as defined in the laws and regulations of such jurisdictions.
PT DBS Vickers Sekuritas Indonesia
DBS Bank Tower, Ciputra World 1, 32/F Jl. Prof. Dr. Satrio Kav. 3-5, Jakarta 12940, Indonesia
Tel. 6221-3003 4900, Fax: 6221-3003 4943
Otoritas Jasa Keuangan (OJK)
Page 65