Embed Size (px)
Citation preview
ed-CK / sa- MA, PY
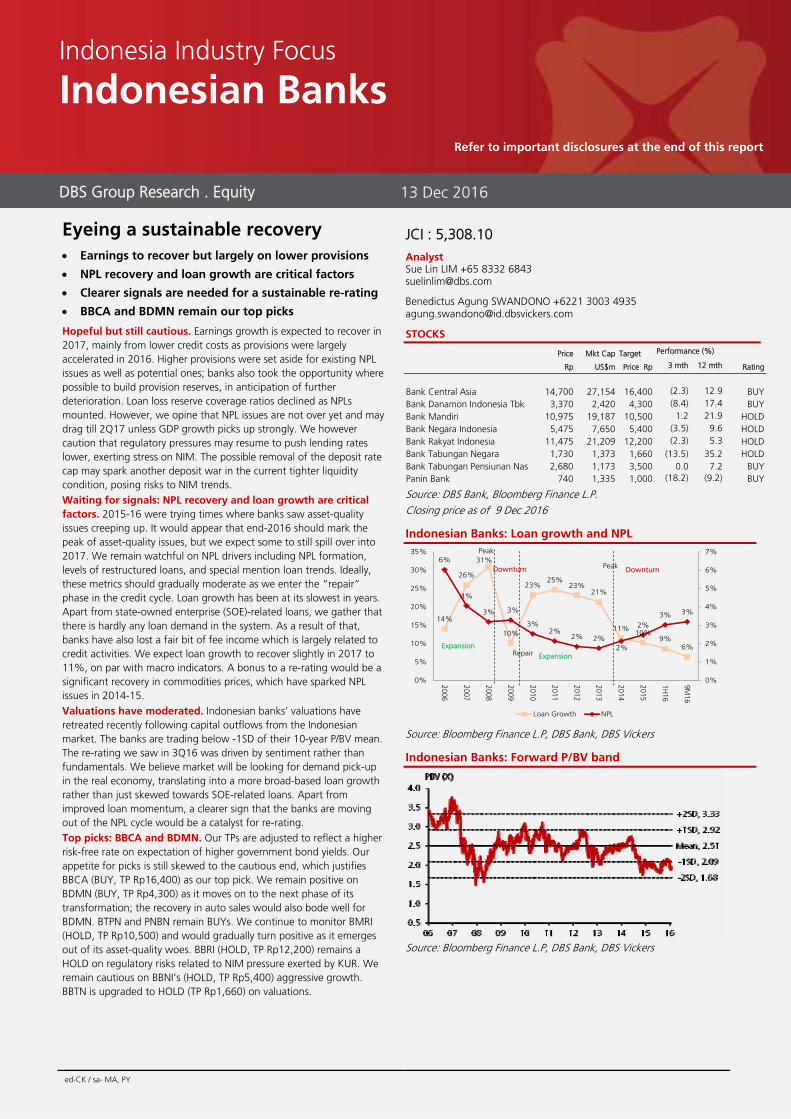
Eyeing a sustainable recovery
Earnings to recover but largely on lower provisions
NPL recovery and loan growth are critical factors
Clearer signals are needed for a sustainable re-rating
BBCA and BDMN remain our top picks
Hopeful but still cautious. Earnings growth is expected to recover in 2017, mainly from lower credit costs as provisions were largely accelerated in 2016. Higher provisions were set aside for existing NPL issues as well as potential ones; banks also took the opportunity where possible to build provision reserves, in anticipation of further deterioration. Loan loss reserve coverage ratios declined as NPLs mounted. However, we opine that NPL issues are not over yet and may drag till 2Q17 unless GDP growth picks up strongly. We however caution that regulatory pressures may resume to push lending rates lower, exerting stress on NIM. The possible removal of the deposit rate cap may spark another deposit war in the current tighter liquidity condition, posing risks to NIM trends. Waiting for signals: NPL recovery and loan growth are critical
factors. 2015-16 were trying times where banks saw asset-quality issues creeping up. It would appear that end-2016 should mark the peak of asset-quality issues, but we expect some to still spill over into 2017. We remain watchful on NPL drivers including NPL formation, levels of restructured loans, and special mention loan trends. Ideally, these metrics should gradually moderate as we enter the “repair” phase in the credit cycle. Loan growth has been at its slowest in years. Apart from state-owned enterprise (SOE)-related loans, we gather that there is hardly any loan demand in the system. As a result of that, banks have also lost a fair bit of fee income which is largely related to credit activities. We expect loan growth to recover slightly in 2017 to 11%, on par with macro indicators. A bonus to a re-rating would be a significant recovery in commodities prices, which have sparked NPL issues in 2014-15. Valuations have moderated. Indonesian banks’ valuations have retreated recently following capital outflows from the Indonesian market. The banks are trading below -1SD of their 10-year P/BV mean. The re-rating we saw in 3Q16 was driven by sentiment rather than fundamentals. We believe market will be looking for demand pick-up in the real economy, translating into a more broad-based loan growth rather than just skewed towards SOE-related loans. Apart from improved loan momentum, a clearer sign that the banks are moving out of the NPL cycle would be a catalyst for re-rating. Top picks: BBCA and BDMN. Our TPs are adjusted to reflect a higher risk-free rate on expectation of higher government bond yields. Our appetite for picks is still skewed to the cautious end, which justifies BBCA (BUY, TP Rp16,400) as our top pick. We remain positive on BDMN (BUY, TP Rp4,300) as it moves on to the next phase of its transformation; the recovery in auto sales would also bode well for BDMN. BTPN and PNBN remain BUYs. We continue to monitor BMRI (HOLD, TP Rp10,500) and would gradually turn positive as it emerges out of its asset-quality woes. BBRI (HOLD, TP Rp12,200) remains a HOLD on regulatory risks related to NIM pressure exerted by KUR. We remain cautious on BBNI’s (HOLD, TP Rp5,400) aggressive growth. BBTN is upgraded to HOLD (TP Rp1,660) on valuations.
JCI : 5,308.10
Analyst Sue Lin LIM +65 8332 6843 [email protected]
Benedictus Agung SWANDONO +6221 3003 4935
STOCKS
Source: DBS Bank, Bloomberg Finance L.P. Closing price as of 9 Dec 2016
Indonesian Banks: Loan growth and NPL
Source: Bloomberg Finance L.P, DBS Bank, DBS Vickers
Indonesian Banks: Forward P/BV band
Source: Bloomberg Finance L.P, DBS Bank, DBS Vickers
14%
26%
31%
10%
23%25%
23%21%
11%10%
9%6%
6%
4%
3% 3%
3%2%
2% 2%2%
2%3% 3%
0%
1%
2%
3%
4%
5%
6%
7%
0%
5%
10%
15%
20%
25%
30%
35%
2006
2007
2008
2009
2010
2011
2012
2013
2014
2015
1H16
9M16
Loan Growth NPL
RepairExpansion
Expansion
Downturn DownturnPeak
Peak
DBS Group Research . Equity 13 Dec 2016
Indonesia Industry Focus
Indonesian Banks
Refer to important disclosures at the end of this report
Price Mkt Cap Target Performance (%)
Rp US$m Price Rp 3 mth 12 mth Rating
Bank Central Asia 14,700 27,154 16,400 (2.3) 12.9 BUY Bank Danamon Indonesia Tbk 3,370 2,420 4,300 (8.4) 17.4 BUY Bank Mandiri 10,975 19,187 10,500 1.2 21.9 HOLD Bank Negara Indonesia 5,475 7,650 5,400 (3.5) 9.6 HOLD Bank Rakyat Indonesia 11,475 21,209 12,200 (2.3) 5.3 HOLD Bank Tabungan Negara 1,730 1,373 1,660 (13.5) 35.2 HOLD Bank Tabungan Pensiunan Nas 2,680 1,173 3,500 0.0 7.2 BUY Panin Bank 740 1,335 1,000 (18.2) (9.2) BUY

Industry Focus
Page 2
Table of Contents Key trends to watch for 2017 3
Turning a little more positive 4
Clearer signals are needed for a sustainable re-rating 8
Valuation and recommendation 11
Appendix – Key charts 13
Company Guides 16
Bank Central Asia 17
Bank Danamon 24
Bank Mandiri 32
Bank Negara Indonesia 39
Bank Rakyat Indonesia 46
Bank Tabungan Negara 53
Bank Tabungan Pensiunan Nasional 60
Panin Bank 67
Industry Focus
Page 3
Key trends to watch in 2017
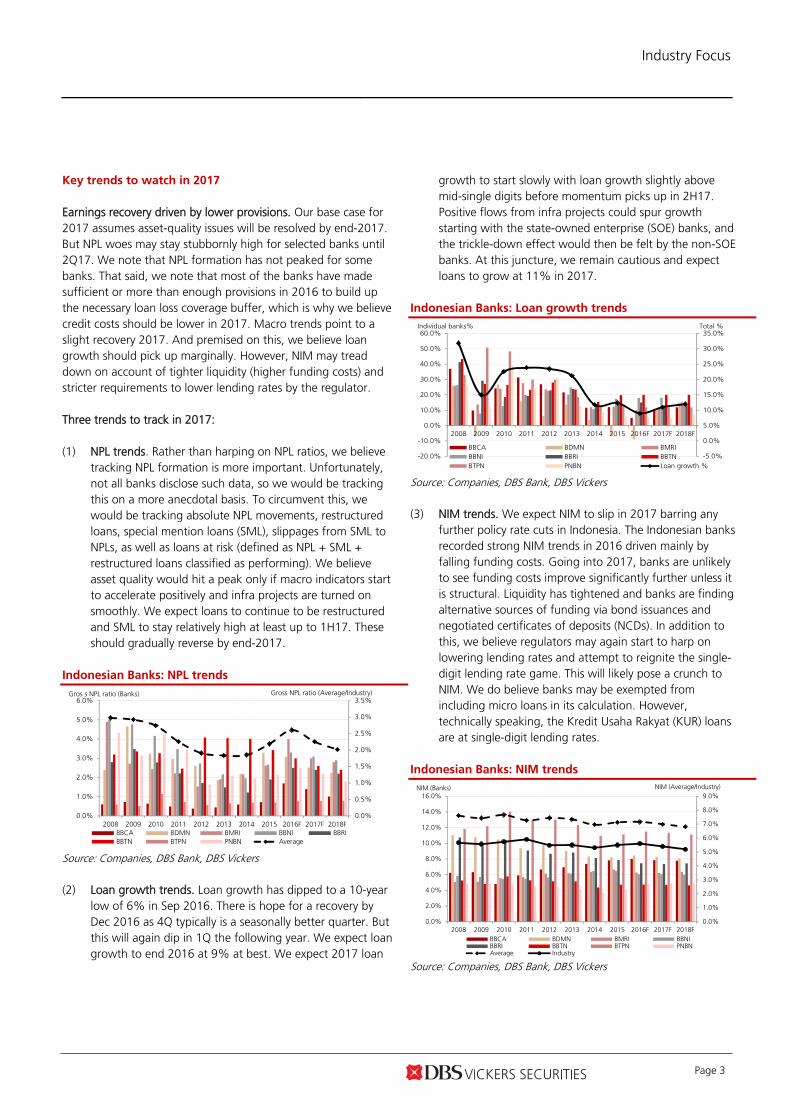
Earnings recovery driven by lower provisions. Our base case for 2017 assumes asset-quality issues will be resolved by end-2017. But NPL woes may stay stubbornly high for selected banks until 2Q17. We note that NPL formation has not peaked for some banks. That said, we note that most of the banks have made sufficient or more than enough provisions in 2016 to build up the necessary loan loss coverage buffer, which is why we believe credit costs should be lower in 2017. Macro trends point to a slight recovery 2017. And premised on this, we believe loan growth should pick up marginally. However, NIM may tread down on account of tighter liquidity (higher funding costs) and stricter requirements to lower lending rates by the regulator. Three trends to track in 2017: (1) NPL trends. Rather than harping on NPL ratios, we believe
tracking NPL formation is more important. Unfortunately, not all banks disclose such data, so we would be tracking this on a more anecdotal basis. To circumvent this, we would be tracking absolute NPL movements, restructured loans, special mention loans (SML), slippages from SML to NPLs, as well as loans at risk (defined as NPL + SML + restructured loans classified as performing). We believe asset quality would hit a peak only if macro indicators start to accelerate positively and infra projects are turned on smoothly. We expect loans to continue to be restructured and SML to stay relatively high at least up to 1H17. These should gradually reverse by end-2017.
Indonesian Banks: NPL trends
Source: Companies, DBS Bank, DBS Vickers (2) Loan growth trends. Loan growth has dipped to a 10-year
low of 6% in Sep 2016. There is hope for a recovery by Dec 2016 as 4Q typically is a seasonally better quarter. But this will again dip in 1Q the following year. We expect loan growth to end 2016 at 9% at best. We expect 2017 loan
growth to start slowly with loan growth slightly above mid-single digits before momentum picks up in 2H17. Positive flows from infra projects could spur growth starting with the state-owned enterprise (SOE) banks, and the trickle-down effect would then be felt by the non-SOE banks. At this juncture, we remain cautious and expect loans to grow at 11% in 2017.
Indonesian Banks: Loan growth trends
Source: Companies, DBS Bank, DBS Vickers
(3) NIM trends. We expect NIM to slip in 2017 barring any
further policy rate cuts in Indonesia. The Indonesian banks recorded strong NIM trends in 2016 driven mainly by falling funding costs. Going into 2017, banks are unlikely to see funding costs improve significantly further unless it is structural. Liquidity has tightened and banks are finding alternative sources of funding via bond issuances and negotiated certificates of deposits (NCDs). In addition to this, we believe regulators may again start to harp on lowering lending rates and attempt to reignite the single- digit lending rate game. This will likely pose a crunch to NIM. We do believe banks may be exempted from including micro loans in its calculation. However, technically speaking, the Kredit Usaha Rakyat (KUR) loans are at single-digit lending rates.
Indonesian Banks: NIM trends
Source: Companies, DBS Bank, DBS Vickers
0.0%
0.5%
1.0%
1.5%
2.0%
2.5%
3.0%
3.5%
0.0%
1.0%
2.0%
3.0%
4.0%
5.0%
6.0%
2008 2009 2010 2011 2012 2013 2014 2015 2016F 2017F 2018FBBCA BDMN BMRI BBNI BBRIBBTN BTPN PNBN Average
Gros s NPL ratio (Banks) Gross NPL ratio (Average/Industry)
-5.0%
0.0%
5.0%
10.0%
15.0%
20.0%
25.0%
30.0%
35.0%
-20.0%
-10.0%
0.0%
10.0%
20.0%
30.0%
40.0%
50.0%
60.0%
2008 2009 2010 2011 2012 2013 2014 2015 2016F 2017F 2018F
BBCA BDMN BMRIBBNI BBRI BBTNBTPN PNBN Loan growth %
Individual banks% Total %
0.0%
1.0%
2.0%
3.0%
4.0%
5.0%
6.0%
7.0%
8.0%
9.0%
0.0%
2.0%
4.0%
6.0%
8.0%
10.0%
12.0%
14.0%
16.0%
2008 2009 2010 2011 2012 2013 2014 2015 2016F 2017F 2018FBBCA BDMN BMRI BBNIBBRI BBTN BTPN PNBNAverage Industry
NIM (Banks) NIM (Average/Industry)
Industry Focus
Page 4
Turning a little more positive
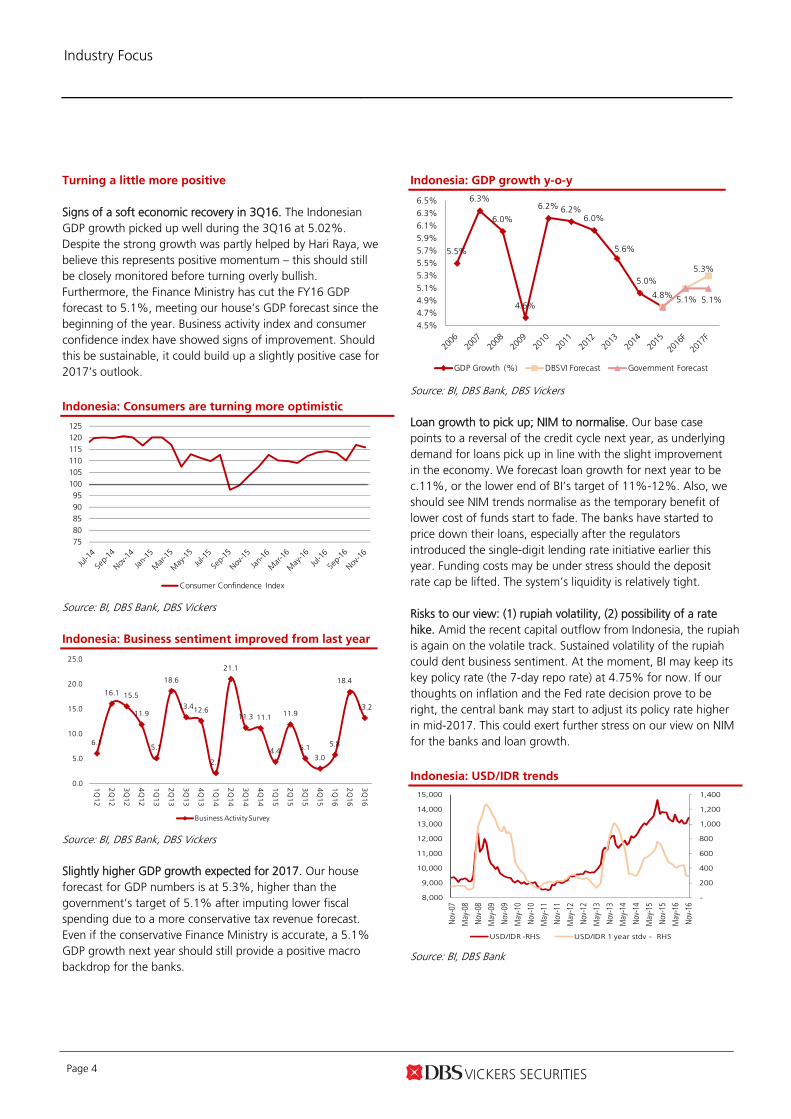
Signs of a soft economic recovery in 3Q16. The Indonesian GDP growth picked up well during the 3Q16 at 5.02%. Despite the strong growth was partly helped by Hari Raya, we believe this represents positive momentum – this should still be closely monitored before turning overly bullish. Furthermore, the Finance Ministry has cut the FY16 GDP forecast to 5.1%, meeting our house’s GDP forecast since the beginning of the year. Business activity index and consumer confidence index have showed signs of improvement. Should this be sustainable, it could build up a slightly positive case for 2017’s outlook.
Indonesia: Consumers are turning more optimistic
Source: BI, DBS Bank, DBS Vickers Indonesia: Business sentiment improved from last year
Source: BI, DBS Bank, DBS Vickers Slightly higher GDP growth expected for 2017. Our house forecast for GDP numbers is at 5.3%, higher than the government’s target of 5.1% after imputing lower fiscal spending due to a more conservative tax revenue forecast. Even if the conservative Finance Ministry is accurate, a 5.1% GDP growth next year should still provide a positive macro backdrop for the banks.
Indonesia: GDP growth y-o-y
Source: BI, DBS Bank, DBS Vickers Loan growth to pick up; NIM to normalise. Our base case points to a reversal of the credit cycle next year, as underlying demand for loans pick up in line with the slight improvement in the economy. We forecast loan growth for next year to be c.11%, or the lower end of BI’s target of 11%-12%. Also, we should see NIM trends normalise as the temporary benefit of lower cost of funds start to fade. The banks have started to price down their loans, especially after the regulators introduced the single-digit lending rate initiative earlier this year. Funding costs may be under stress should the deposit rate cap be lifted. The system’s liquidity is relatively tight. Risks to our view: (1) rupiah volatility, (2) possibility of a rate hike. Amid the recent capital outflow from Indonesia, the rupiah is again on the volatile track. Sustained volatility of the rupiah could dent business sentiment. At the moment, BI may keep its key policy rate (the 7-day repo rate) at 4.75% for now. If our thoughts on inflation and the Fed rate decision prove to be right, the central bank may start to adjust its policy rate higher in mid-2017. This could exert further stress on our view on NIM for the banks and loan growth.
Indonesia: USD/IDR trends
Source: BI, DBS Bank
7580859095
100105110115120125
Consumer Confindence Index
6.1
16.1 15.5
11.9
5.1
18.6
13.412.6
2.1
21.1
11.3 11.1
4.4
11.9
5.13.0
5.8
18.4
13.2
0.0
5.0
10.0
15.0
20.0
25.0
1Q
12
2Q
12
3Q
12
4Q
12
1Q
13
2Q
13
3Q
13
4Q
13
1Q
14
2Q
14
3Q
14
4Q
14
1Q
15
2Q
15
3Q
15
4Q
15
1Q
16
2Q
16
3Q
16
Business Activity Survey
5.5%
6.3%
6.0%
4.6%
6.2% 6.2%6.0%
5.6%
5.0%
4.8%
5.3%
5.1% 5.1%
4.5%
4.7%
4.9%
5.1%
5.3%
5.5%
5.7%
5.9%
6.1%
6.3%
6.5%
GDP Growth (%) DBSVI Forecast Government Forecast
-
200
400
600
800
1,000
1,200
1,400
8,000
9,000
10,000
11,000
12,000
13,000
14,000
15,000
Nov-
07
May
-08
Nov-
08
May
-09
Nov-
09
May
-10
Nov-
10
May
-11
Nov-
11
May
-12
Nov-
12
May
-13
Nov-
13
May
-14
Nov-
14
May
-15
Nov-
15
May
-16
Nov-
16
USD/IDR -RHS USD/IDR 1 year stdv - RHS
Industry Focus
Page 5
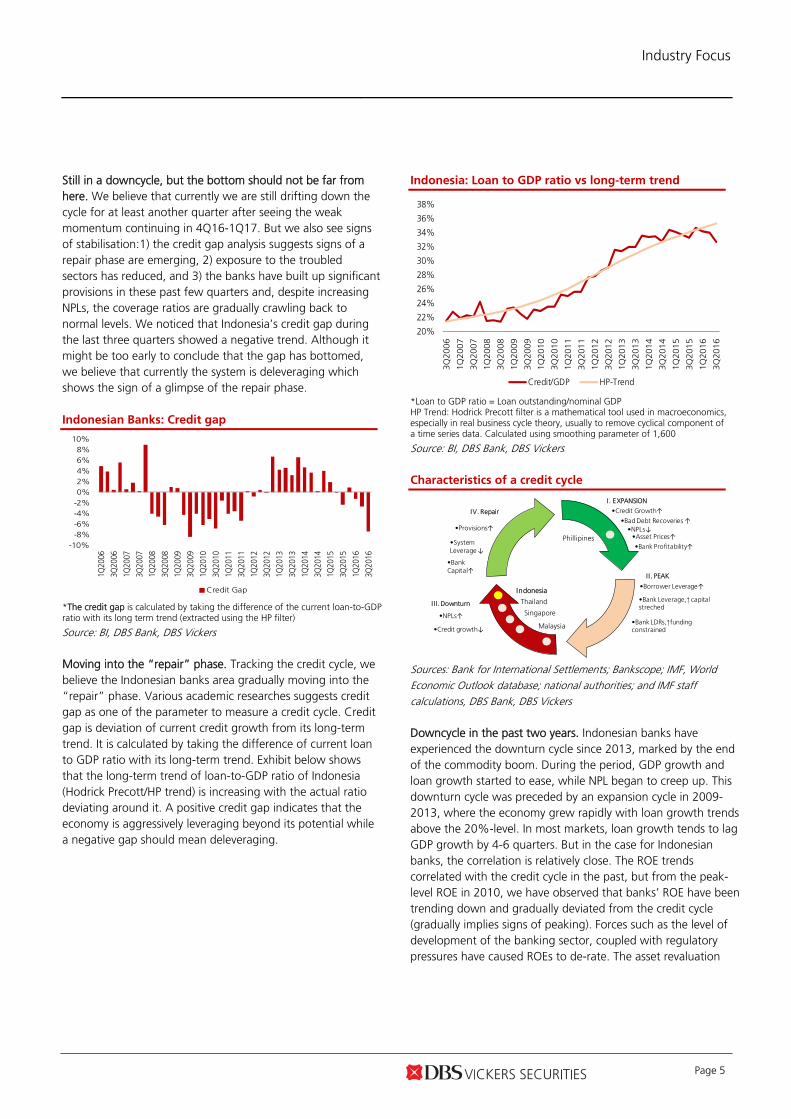
Still in a downcycle, but the bottom should not be far from here. We believe that currently we are still drifting down the cycle for at least another quarter after seeing the weak momentum continuing in 4Q16-1Q17. But we also see signs of stabilisation:1) the credit gap analysis suggests signs of a repair phase are emerging, 2) exposure to the troubled sectors has reduced, and 3) the banks have built up significant provisions in these past few quarters and, despite increasing NPLs, the coverage ratios are gradually crawling back to normal levels. We noticed that Indonesia’s credit gap during the last three quarters showed a negative trend. Although it might be too early to conclude that the gap has bottomed, we believe that currently the system is deleveraging which shows the sign of a glimpse of the repair phase. Indonesian Banks: Credit gap
*The credit gap is calculated by taking the difference of the current loan-to-GDP ratio with its long term trend (extracted using the HP filter)
Source: BI, DBS Bank, DBS Vickers Moving into the “repair” phase. Tracking the credit cycle, we believe the Indonesian banks area gradually moving into the “repair” phase. Various academic researches suggests credit gap as one of the parameter to measure a credit cycle. Credit gap is deviation of current credit growth from its long-term trend. It is calculated by taking the difference of current loan to GDP ratio with its long-term trend. Exhibit below shows that the long-term trend of loan-to-GDP ratio of Indonesia (Hodrick Precott/HP trend) is increasing with the actual ratio deviating around it. A positive credit gap indicates that the economy is aggressively leveraging beyond its potential while a negative gap should mean deleveraging.
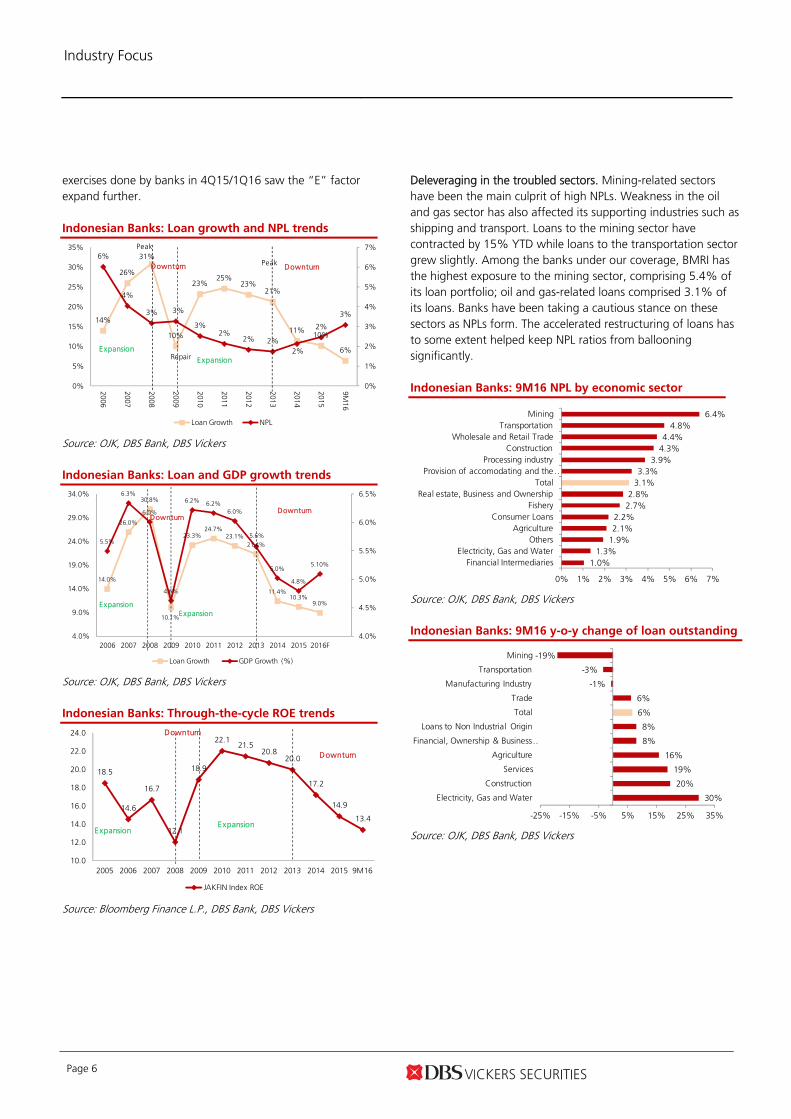
Indonesia: Loan to GDP ratio vs long-term trend
*Loan to GDP ratio = Loan outstanding/nominal GDP HP Trend: Hodrick Precott filter is a mathematical tool used in macroeconomics, especially in real business cycle theory, usually to remove cyclical component of a time series data. Calculated using smoothing parameter of 1,600
Source: BI, DBS Bank, DBS Vickers Characteristics of a credit cycle
Sources: Bank for International Settlements; Bankscope; IMF, World Economic Outlook database; national authorities; and IMF staff calculations, DBS Bank, DBS Vickers Downcycle in the past two years. Indonesian banks have experienced the downturn cycle since 2013, marked by the end of the commodity boom. During the period, GDP growth and loan growth started to ease, while NPL began to creep up. This downturn cycle was preceded by an expansion cycle in 2009-2013, where the economy grew rapidly with loan growth trends above the 20%-level. In most markets, loan growth tends to lag GDP growth by 4-6 quarters. But in the case for Indonesian banks, the correlation is relatively close. The ROE trends correlated with the credit cycle in the past, but from the peak-level ROE in 2010, we have observed that banks’ ROE have been trending down and gradually deviated from the credit cycle (gradually implies signs of peaking). Forces such as the level of development of the banking sector, coupled with regulatory pressures have caused ROEs to de-rate. The asset revaluation
-10%-8%-6%-4%-2%0%2%4%6%8%
10%
1Q20
06
3Q20
06
1Q20
07
3Q20
07
1Q20
08
3Q20
08
1Q20
09
3Q20
09
1Q20
10
3Q20
10
1Q20
11
3Q20
11
1Q20
12
3Q20
12
1Q20
13
3Q20
13
1Q20
14
3Q20
14
1Q20
15
3Q20
15
1Q20
16
3Q20
16
Credit Gap
20%
22%
24%
26%
28%
30%
32%
34%
36%
38%
3Q20
06
1Q20
07
3Q20
07
1Q20
08
3Q20
08
1Q20
09
3Q20
09
1Q20
10
3Q20
10
1Q20
11
3Q20
11
1Q20
12
3Q20
12
1Q20
13
3Q20
13
1Q20
14
3Q20
14
1Q20
15
3Q20
15
1Q20
16
3Q20
16
Credit/GDP HP-Trend
Thailand
Indonesia
Singapore
Phillipines
I . EXPANSION
•↑↓
•Bank Profitability↑
•Provisions↑•Asset Prices↑
•NPLs↓•Bad Debt Recoveries ↑
•Credit Growth↑
•System Leverage ↓
•Bank Capital↑
•Credit growth↓
•NPLs↑•Bank LDRs,↑funding constrained
•Bank Leverage,↑ capital streched
•Borrower Leverage↑
I I . PEAK
I II. Downturn
IV. Repair
Malaysia
Industry Focus
Page 6
exercises done by banks in 4Q15/1Q16 saw the “E” factor expand further. Indonesian Banks: Loan growth and NPL trends
Source: OJK, DBS Bank, DBS Vickers Indonesian Banks: Loan and GDP growth trends
Source: OJK, DBS Bank, DBS Vickers Indonesian Banks: Through-the-cycle ROE trends
Source: Bloomberg Finance L.P., DBS Bank, DBS Vickers
Deleveraging in the troubled sectors. Mining-related sectors have been the main culprit of high NPLs. Weakness in the oil and gas sector has also affected its supporting industries such as shipping and transport. Loans to the mining sector have contracted by 15% YTD while loans to the transportation sector grew slightly. Among the banks under our coverage, BMRI has the highest exposure to the mining sector, comprising 5.4% of its loan portfolio; oil and gas-related loans comprised 3.1% of its loans. Banks have been taking a cautious stance on these sectors as NPLs form. The accelerated restructuring of loans has to some extent helped keep NPL ratios from ballooning significantly. Indonesian Banks: 9M16 NPL by economic sector
Source: OJK, DBS Bank, DBS Vickers Indonesian Banks: 9M16 y-o-y change of loan outstanding
Source: OJK, DBS Bank, DBS Vickers
14%
26%
31%
10%
23%25%
23%21%
11%10%
6%
6%
4%
3% 3%
3%2%
2% 2%2%
2%
3%
0%
1%
2%
3%
4%
5%
6%
7%
0%
5%
10%
15%
20%
25%
30%
35%
2006
2007
2008
2009
2010
2011
2012
2013
2014
2015
9M16
Loan Growth NPL
RepairExpansion
Expansion
Downturn DownturnPeak
Peak
14.0%
26.0%
30.8%
10.1%
23.3%24.7%
23.1%21.4%
11.4%10.3%
9.0%
5.5%
6.3%
6.0%
4.6%
6.2% 6.2%6.0%
5.6%
5.0%
4.8%
5.10%
4.0%
4.5%
5.0%
5.5%
6.0%
6.5%
4.0%
9.0%
14.0%
19.0%
24.0%
29.0%
34.0%
2006 2007 2008 2009 2010 2011 2012 2013 2014 2015 2016F
Loan Growth GDP Growth (%)
ExpansionExpansion
DownturnDownturn
18.5
14.6
16.7
12.1
18.9
22.121.5
20.820.0
17.2
14.9
13.4
10.0
12.0
14.0
16.0
18.0
20.0
22.0
24.0
2005 2006 2007 2008 2009 2010 2011 2012 2013 2014 2015 9M16
JAKFIN Index ROE
Expansion
Downturn
Expansion
Downturn
1.0%1.3%
1.9%2.1%2.2%
2.7%2.8%
3.1%3.3%
3.9%4.3%4.4%
4.8%6.4%
0% 1% 2% 3% 4% 5% 6% 7%
Financial IntermediariesElectricity, Gas and Water
OthersAgriculture
Consumer LoansFishery
Real estate, Business and OwnershipTotal
Provision of accomodating and the …Processing industry
ConstructionWholesale and Retail Trade
TransportationMining
30%
20%
19%
16%
8%
8%
6%
6%
-1%
-3%
-19%
-25% -15% -5% 5% 15% 25% 35%
Electricity, Gas and Water
Construction
Services
Agriculture
Financial, Ownership & Business …
Loans to Non Industrial Origin
Total
Trade
Manufacturing Industry
Transportation
Mining
Industry Focus
Page 7
Indonesian Banks: Exposure to mining as at end-3Q16
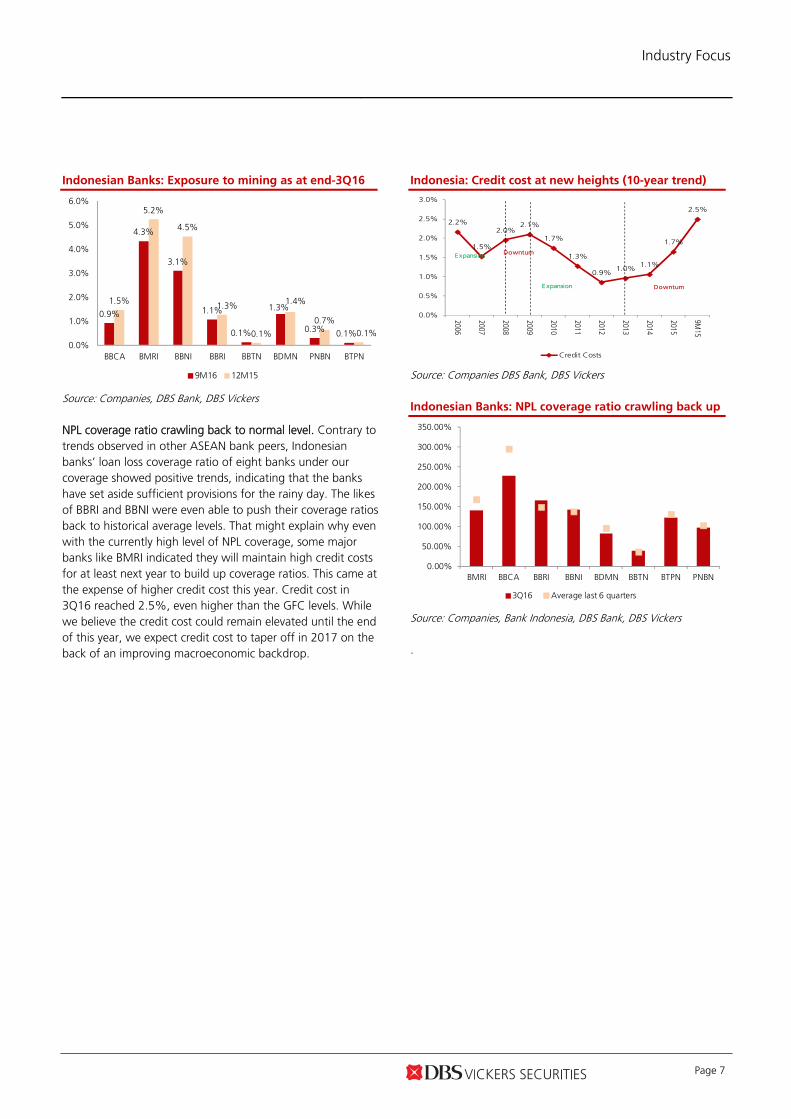
Source: Companies, DBS Bank, DBS Vickers NPL coverage ratio crawling back to normal level. Contrary to trends observed in other ASEAN bank peers, Indonesian banks’ loan loss coverage ratio of eight banks under our coverage showed positive trends, indicating that the banks have set aside sufficient provisions for the rainy day. The likes of BBRI and BBNI were even able to push their coverage ratios back to historical average levels. That might explain why even with the currently high level of NPL coverage, some major banks like BMRI indicated they will maintain high credit costs for at least next year to build up coverage ratios. This came at the expense of higher credit cost this year. Credit cost in 3Q16 reached 2.5%, even higher than the GFC levels. While we believe the credit cost could remain elevated until the end of this year, we expect credit cost to taper off in 2017 on the back of an improving macroeconomic backdrop.
Indonesia: Credit cost at new heights (10-year trend)
Source: Companies DBS Bank, DBS Vickers Indonesian Banks: NPL coverage ratio crawling back up
Source: Companies, Bank Indonesia, DBS Bank, DBS Vickers .
0.9%
4.3%
3.1%
1.1%
0.1%
1.3%
0.3% 0.1%
1.5%
5.2%
4.5%
1.3%
0.1%
1.4%
0.7%0.1%
0.0%
1.0%
2.0%
3.0%
4.0%
5.0%
6.0%
BBCA BMRI BBNI BBRI BBTN BDMN PNBN BTPN
9M16 12M15
2.2%
1.5%
2.0%2.1%
1.7%
1.3%
0.9%1.0%
1.1%
1.7%
2.5%
0.0%
0.5%
1.0%
1.5%
2.0%
2.5%
3.0%
2006
2007
2008
2009
2010
2011
2012
2013
2014
2015
9M15
Credit Costs
Expansion
E xpansion
Downturn
Downturn
0.00%
50.00%
100.00%
150.00%
200.00%
250.00%
300.00%
350.00%
BMRI BBCA BBRI BBNI BDMN BBTN BTPN PNBN
3Q16 Average last 6 quarters
Industry Focus
Page 8
Clearer signals are needed for a sustainable re-rating
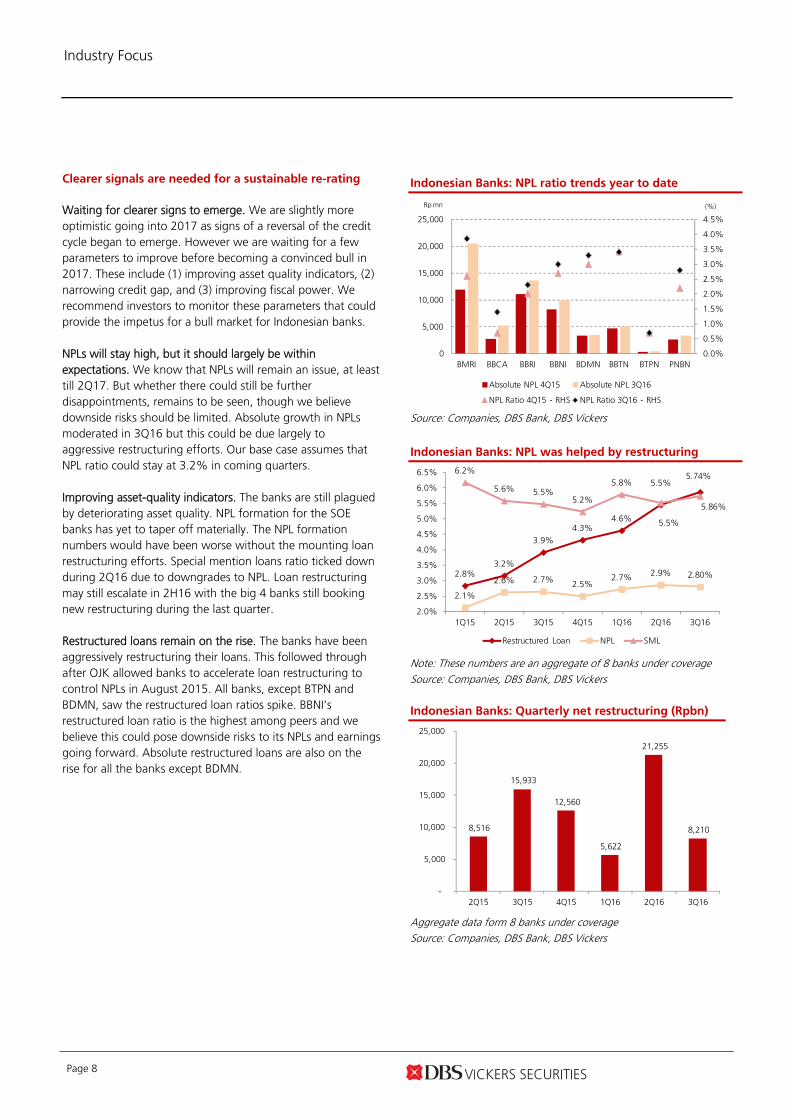
Waiting for clearer signs to emerge. We are slightly more optimistic going into 2017 as signs of a reversal of the credit cycle began to emerge. However we are waiting for a few parameters to improve before becoming a convinced bull in 2017. These include (1) improving asset quality indicators, (2) narrowing credit gap, and (3) improving fiscal power. We recommend investors to monitor these parameters that could provide the impetus for a bull market for Indonesian banks. NPLs will stay high, but it should largely be within expectations. We know that NPLs will remain an issue, at least till 2Q17. But whether there could still be further disappointments, remains to be seen, though we believe downside risks should be limited. Absolute growth in NPLs moderated in 3Q16 but this could be due largely to aggressive restructuring efforts. Our base case assumes that NPL ratio could stay at 3.2% in coming quarters. Improving asset-quality indicators. The banks are still plagued by deteriorating asset quality. NPL formation for the SOE banks has yet to taper off materially. The NPL formation numbers would have been worse without the mounting loan restructuring efforts. Special mention loans ratio ticked down during 2Q16 due to downgrades to NPL. Loan restructuring may still escalate in 2H16 with the big 4 banks still booking new restructuring during the last quarter. Restructured loans remain on the rise. The banks have been aggressively restructuring their loans. This followed through after OJK allowed banks to accelerate loan restructuring to control NPLs in August 2015. All banks, except BTPN and BDMN, saw the restructured loan ratios spike. BBNI’s restructured loan ratio is the highest among peers and we believe this could pose downside risks to its NPLs and earnings going forward. Absolute restructured loans are also on the rise for all the banks except BDMN.
Indonesian Banks: NPL ratio trends year to date
Source: Companies, DBS Bank, DBS Vickers
Indonesian Banks: NPL was helped by restructuring
Note: These numbers are an aggregate of 8 banks under coverage Source: Companies, DBS Bank, DBS Vickers Indonesian Banks: Quarterly net restructuring (Rpbn)
Aggregate data form 8 banks under coverage Source: Companies, DBS Bank, DBS Vickers
0.0%
0.5%
1.0%
1.5%
2.0%
2.5%
3.0%
3.5%
4.0%
4.5%
0
5,000
10,000
15,000
20,000
25,000
BMRI BBCA BBRI BBNI BDMN BBTN BTPN PNBN
Absolute NPL 4Q15 Absolute NPL 3Q16
NPL Ratio 4Q15 - RHS NPL Ratio 3Q16 - RHS
Rp mn (%)
2.8%3.2%
3.9%4.3%
4.6% 5.5%
5.86%
2.1%
2.6% 2.7% 2.5%2.7% 2.9% 2.80%
6.2%
5.6% 5.5%5.2%
5.8% 5.5%5.74%
2.0%
2.5%
3.0%
3.5%
4.0%
4.5%
5.0%
5.5%
6.0%
6.5%
1Q15 2Q15 3Q15 4Q15 1Q16 2Q16 3Q16
Restructured Loan NPL SML
8,516
15,933
12,560
5,622
21,255
8,210
-
5,000
10,000
15,000
20,000
25,000
2Q15 3Q15 4Q15 1Q16 2Q16 3Q16
Industry Focus
Page 9
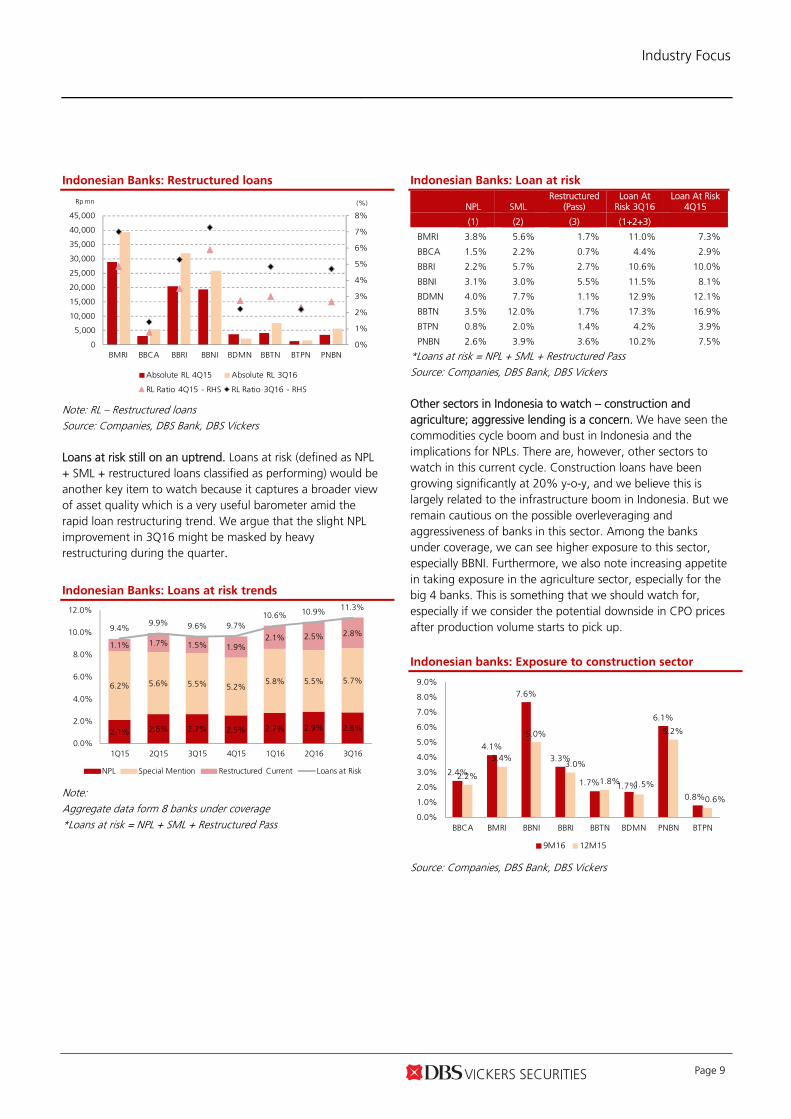
Indonesian Banks: Restructured loans
Note: RL – Restructured loans Source: Companies, DBS Bank, DBS Vickers Loans at risk still on an uptrend. Loans at risk (defined as NPL + SML + restructured loans classified as performing) would be another key item to watch because it captures a broader view of asset quality which is a very useful barometer amid the rapid loan restructuring trend. We argue that the slight NPL improvement in 3Q16 might be masked by heavy restructuring during the quarter.
Indonesian Banks: Loans at risk trends
Note: Aggregate data form 8 banks under coverage *Loans at risk = NPL + SML + Restructured Pass
Indonesian Banks: Loan at risk
NPL SML Restructured
(Pass) Loan At
Risk 3Q16 Loan At Risk
4Q15
(1) (2) (3) (1+2+3)
BMRI 3.8% 5.6% 1.7% 11.0% 7.3%
BBCA 1.5% 2.2% 0.7% 4.4% 2.9%
BBRI 2.2% 5.7% 2.7% 10.6% 10.0%
BBNI 3.1% 3.0% 5.5% 11.5% 8.1%
BDMN 4.0% 7.7% 1.1% 12.9% 12.1%
BBTN 3.5% 12.0% 1.7% 17.3% 16.9%
BTPN 0.8% 2.0% 1.4% 4.2% 3.9%
PNBN 2.6% 3.9% 3.6% 10.2% 7.5%
*Loans at risk = NPL + SML + Restructured Pass Source: Companies, DBS Bank, DBS Vickers Other sectors in Indonesia to watch – construction and agriculture; aggressive lending is a concern. We have seen the commodities cycle boom and bust in Indonesia and the implications for NPLs. There are, however, other sectors to watch in this current cycle. Construction loans have been growing significantly at 20% y-o-y, and we believe this is largely related to the infrastructure boom in Indonesia. But we remain cautious on the possible overleveraging and aggressiveness of banks in this sector. Among the banks under coverage, we can see higher exposure to this sector, especially BBNI. Furthermore, we also note increasing appetite in taking exposure in the agriculture sector, especially for the big 4 banks. This is something that we should watch for, especially if we consider the potential downside in CPO prices after production volume starts to pick up.
Indonesian banks: Exposure to construction sector
Source: Companies, DBS Bank, DBS Vickers
0%
1%
2%
3%
4%
5%
6%
7%
8%
0
5,000
10,000
15,000
20,000
25,000
30,000
35,000
40,000
45,000
BMRI BBCA BBRI BBNI BDMN BBTN BTPN PNBN
Absolute RL 4Q15 Absolute RL 3Q16
RL Ratio 4Q15 - RHS RL Ratio 3Q16 - RHS
Rp mn (%)
2.1% 2.6% 2.7% 2.5% 2.7% 2.9% 2.8%
6.2% 5.6% 5.5% 5.2%5.8% 5.5% 5.7%
1.1% 1.7% 1.5% 1.9%2.1% 2.5% 2.8%
9.4%9.9% 9.6% 9.7%
10.6% 10.9% 11.3%
0.0%
2.0%
4.0%
6.0%
8.0%
10.0%
12.0%
1Q15 2Q15 3Q15 4Q15 1Q16 2Q16 3Q16
NPL Special Mention Restructured Current Loans at Risk 2.4%
4.1%
7.6%
3.3%
1.7% 1.7%
6.1%
0.8%
2.2%
3.4%
5.0%
3.0%
1.8% 1.5%
5.2%
0.6%
0.0%
1.0%
2.0%
3.0%
4.0%
5.0%
6.0%
7.0%
8.0%
9.0%
BBCA BMRI BBNI BBRI BBTN BDMN PNBN BTPN
9M16 12M15
Industry Focus
Page 10
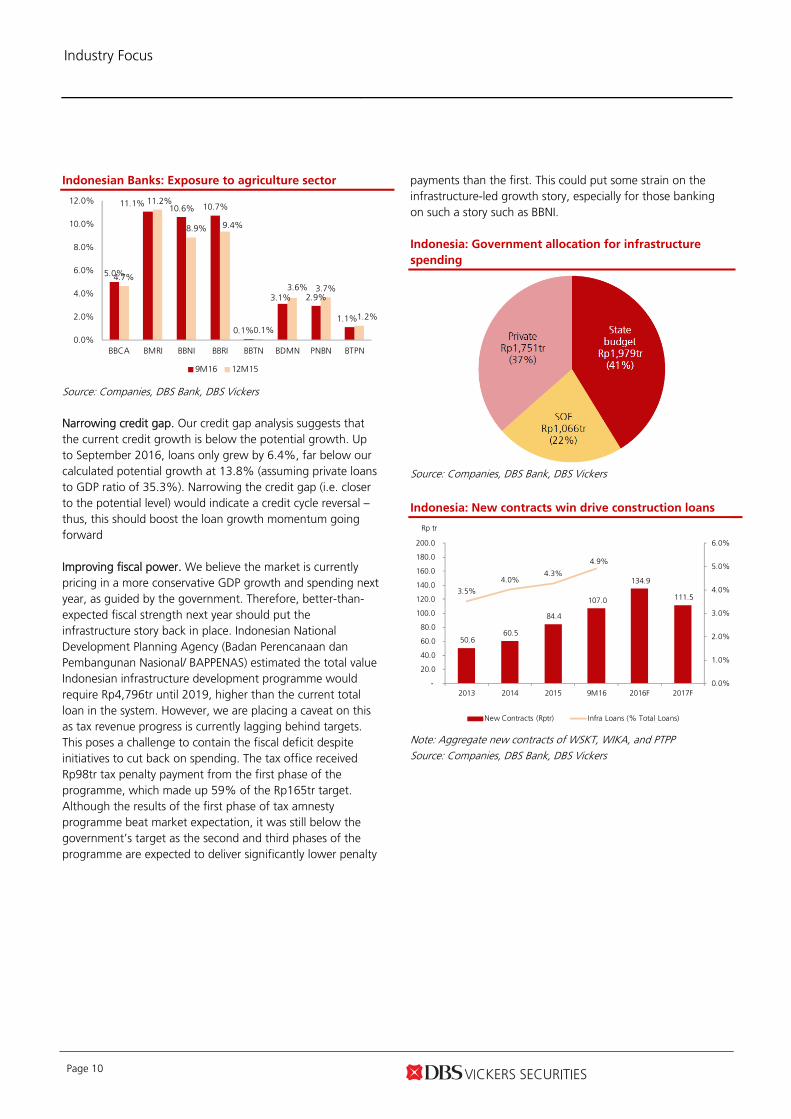
Indonesian Banks: Exposure to agriculture sector
Source: Companies, DBS Bank, DBS Vickers Narrowing credit gap. Our credit gap analysis suggests that the current credit growth is below the potential growth. Up to September 2016, loans only grew by 6.4%, far below our calculated potential growth at 13.8% (assuming private loans to GDP ratio of 35.3%). Narrowing the credit gap (i.e. closer to the potential level) would indicate a credit cycle reversal – thus, this should boost the loan growth momentum going forward Improving fiscal power. We believe the market is currently pricing in a more conservative GDP growth and spending next year, as guided by the government. Therefore, better-than- expected fiscal strength next year should put the infrastructure story back in place. Indonesian National Development Planning Agency (Badan Perencanaan dan Pembangunan Nasional/ BAPPENAS) estimated the total value Indonesian infrastructure development programme would require Rp4,796tr until 2019, higher than the current total loan in the system. However, we are placing a caveat on this as tax revenue progress is currently lagging behind targets. This poses a challenge to contain the fiscal deficit despite initiatives to cut back on spending. The tax office received Rp98tr tax penalty payment from the first phase of the programme, which made up 59% of the Rp165tr target. Although the results of the first phase of tax amnesty programme beat market expectation, it was still below the government’s target as the second and third phases of the programme are expected to deliver significantly lower penalty
payments than the first. This could put some strain on the infrastructure-led growth story, especially for those banking on such a story such as BBNI. Indonesia: Government allocation for infrastructure
spending
Source: Companies, DBS Bank, DBS Vickers
Indonesia: New contracts win drive construction loans
Note: Aggregate new contracts of WSKT, WIKA, and PTPP Source: Companies, DBS Bank, DBS Vickers
5.0%
11.1%10.6% 10.7%
0.1%
3.1% 2.9%
1.1%
4.7%
11.2%
8.9% 9.4%
0.1%
3.6% 3.7%
1.2%
0.0%
2.0%
4.0%
6.0%
8.0%
10.0%
12.0%
BBCA BMRI BBNI BBRI BBTN BDMN PNBN BTPN
9M16 12M15
50.6 60.5
84.4
107.0
134.9
111.5 3.5%
4.0%4.3%
4.9%
0.0%
1.0%
2.0%
3.0%
4.0%
5.0%
6.0%
-
20.0
40.0
60.0
80.0
100.0
120.0
140.0
160.0
180.0
200.0
2013 2014 2015 9M16 2016F 2017F
Rp tr
New Contracts (Rptr) Infra Loans (% Total Loans)

Industry Focus
Page 11
Valuation and recommendation
Through-the-cycle valuation trends. We note that during the downturn cycle, valuations are typically below average PBV, and vice versa. There are some anomalies (i.e. during 1Q15 where the investors were overly bullish after Jokowi was elected) but subsequent crashes had pushed valuations back below the average levels. This is a similar scenario with the current situation, where optimism over the tax amnesty programme is not supported by a credit cycle reversal. Indonesian banks were doing well in 3Q16 following the positive sentiment on the tax amnesty programme and the reshuffling of the cabinet (especially the appointment of the Finance Minister). However, recent capital outflows have affected valuations. Indonesian banks are now trading at -1.5 SD of their 10-year mean P/BV band. Indonesian Banks: Rolling forward PBV band
Source: Bloomberg Finance L.P., DBS Bank, DBS Vickers Market has probably overestimated the impact of the tax amnesty as a positive wildcard for the banks as the government expects the programme to be able to repatriate Rp1,000tr (significantly higher than Bank Indonesia’s (BI) target of Rp180tr). We understand that additional liquidity through funds repatriations should be positive for the banks while funds declarations, although would be positive for government fiscal spending, would have less or no impact on the banks. While we view the success of the tax amnesty being positive for the market and for the banks indirectly, we have held back on imputing this as the banks have yet to find a resounding way to monetise their newfound pool of liquidity. Too much liquidity without proper deployment could lead to negative carry for the banks.
Indonesia: JAKFIN performance
Source: Bloomberg Finance L.P., DBS Bank, DBS Vickers A little more optimistic but still with a pinch of cautiousness. Only BBNI sounds very positive. Approximately, another half of the banks sounded a little more optimistic on growth going into 2017, but remained cautious on asset quality issues at least for 1H17. All banks expect loan growth to pick up marginally in 2017. The state-owned enterprise (SOE) banks were more bullish on growth, except BMRI which expects asset quality issues to drag on till 2Q17. BBRI and BBTN expect loan growth to still be strong in 2017 (c.20%), driven by their respective niche products, i.e. micro (KUR mainly) and subsidised mortgages, respectively. The non-SOE banks (the likes of BBCA and PNBN) are still sounding cautious. BTPN is taking an alternative route to grow. BDMN will be embarking on the second phase of its transformation plan. Target prices adjusted to reflect higher risk free rate. The recent flight of capital outflows coupled with expected volatility has caused government bond yields to spike. We expect such rates to persist. Our risk free rate assumption has been raised to 8.5% (from 7.2% previously). Target prices for banks under our coverage have been adjusted accordingly. BBCA and BDMN remain our top picks. Our appetite for picks is still skewed to the cautious end, which justifies BBCA (BUY, TP Rp16,400) as our top pick. We remain positive on BDMN (BUY, TP Rp4,300) as it moves on to its next phase of its transformation. In addition, we believe the recovery in auto sales would also bode well for BDMN. Other stock ratings. BTPN and PNBN remain BUYs. We continue to monitor BMRI (HOLD, TP Rp10,500) and would gradually turn positive as it emerges out of its asset-quality woes. BBRI (HOLD, TP Rp12,200) remains a HOLD on regulatory risks related to NIM pressure exerted by KUR. We remain cautious on BBNI’s (HOLD, TP Rp5,400) aggressive growth. BBTN is upgraded to HOLD (TP Rp1,660) on valuations
Mean, 2.51
+1SD, 2.92
+2SD, 3.33
-1SD, 2.09
-2SD, 1.68
0.5
1.0
1.5
2.0
2.5
3.0
3.5
4.0
06 07 08 09 10 11 12 13 14 15 16
PBV (X)
600
650
700
750
800
850
JAKFIN Index
Tax amnesty bill passed in June EM market
correction after US election
Industry Focus
Page 12
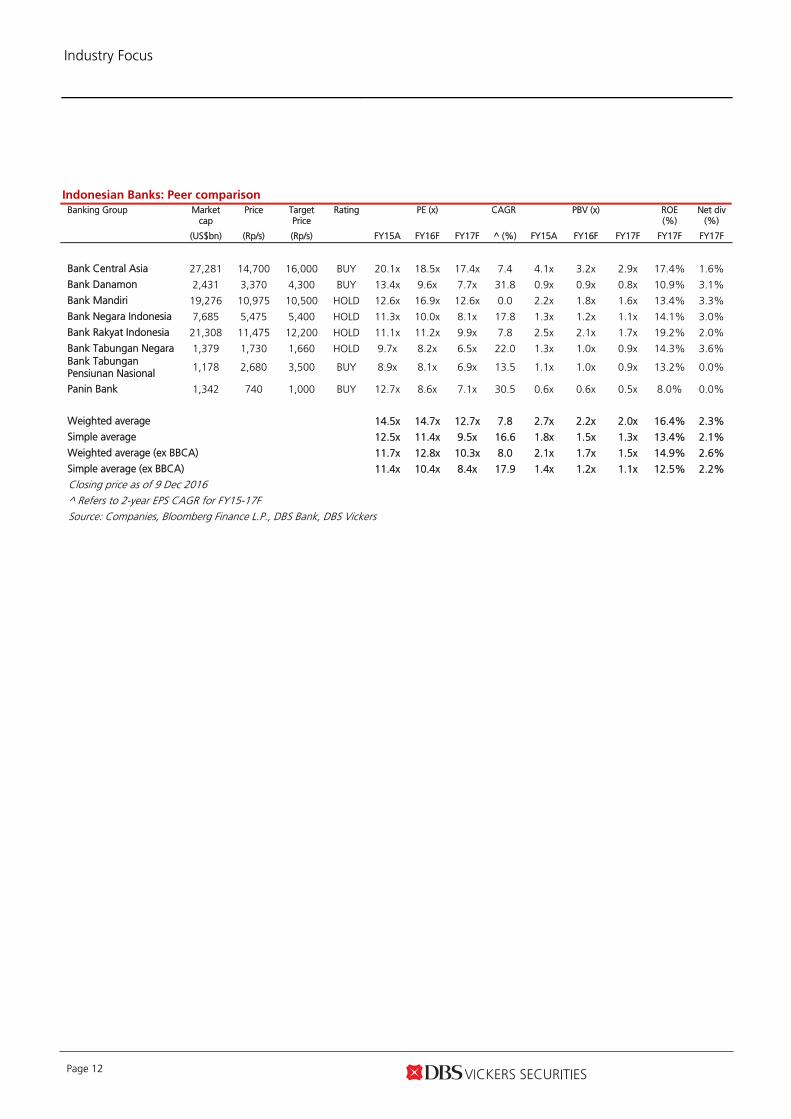
Indonesian Banks: Peer comparison Banking Group Market
cap Price Target
Price Rating PE (x)
CAGR PBV (x)
ROE (%)
Net div (%)
(US$bn) (Rp/s) (Rp/s) FY15A FY16F FY17F ^ (%) FY15A FY16F FY17F FY17F FY17F
Bank Central Asia 27,281 14,700 16,000 BUY 20.1x 18.5x 17.4x 7.4 4.1x 3.2x 2.9x 17.4% 1.6%
Bank Danamon 2,431 3,370 4,300 BUY 13.4x 9.6x 7.7x 31.8 0.9x 0.9x 0.8x 10.9% 3.1%
Bank Mandiri 19,276 10,975 10,500 HOLD 12.6x 16.9x 12.6x 0.0 2.2x 1.8x 1.6x 13.4% 3.3%
Bank Negara Indonesia 7,685 5,475 5,400 HOLD 11.3x 10.0x 8.1x 17.8 1.3x 1.2x 1.1x 14.1% 3.0%
Bank Rakyat Indonesia 21,308 11,475 12,200 HOLD 11.1x 11.2x 9.9x 7.8 2.5x 2.1x 1.7x 19.2% 2.0%
Bank Tabungan Negara 1,379 1,730 1,660 HOLD 9.7x 8.2x 6.5x 22.0 1.3x 1.0x 0.9x 14.3% 3.6% Bank Tabungan Pensiunan Nasional 1,178 2,680 3,500 BUY 8.9x 8.1x 6.9x 13.5 1.1x 1.0x 0.9x 13.2% 0.0%
Panin Bank 1,342 740 1,000 BUY 12.7x 8.6x 7.1x 30.5 0.6x 0.6x 0.5x 8.0% 0.0%
Weighted average 14.5x 14.7x 12.7x 7.8 2.7x 2.2x 2.0x 16.4% 2.3%
Simple average 12.5x 11.4x 9.5x 16.6 1.8x 1.5x 1.3x 13.4% 2.1%
Weighted average (ex BBCA) 11.7x 12.8x 10.3x 8.0 2.1x 1.7x 1.5x 14.9% 2.6%
Simple average (ex BBCA) 11.4x 10.4x 8.4x 17.9 1.4x 1.2x 1.1x 12.5% 2.2%
Closing price as of 9 Dec 2016 ^ Refers to 2-year EPS CAGR for FY15-17F Source: Companies, Bloomberg Finance L.P., DBS Bank, DBS Vickers
Industry Focus
Page 13
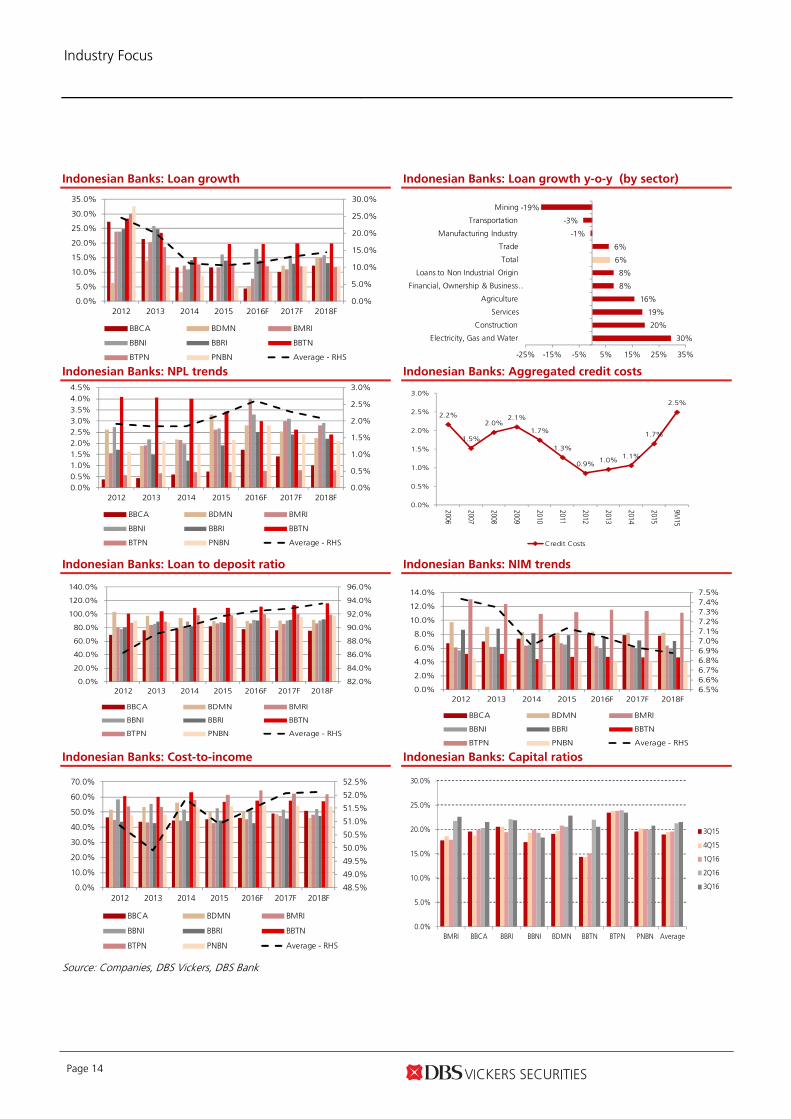
Appendix – Key charts
Industry Focus
Page 14
Indonesian Banks: Loan growth
Indonesian Banks: Loan growth y-o-y (by sector)
Indonesian Banks: NPL trends
Indonesian Banks: Aggregated credit costs
Indonesian Banks: Loan to deposit ratio
Indonesian Banks: NIM trends
Indonesian Banks: Cost-to-income
Indonesian Banks: Capital ratios
Source: Companies, DBS Vickers, DBS Bank
0.0%
5.0%
10.0%
15.0%
20.0%
25.0%
30.0%
0.0%
5.0%
10.0%
15.0%
20.0%
25.0%
30.0%
35.0%
2012 2013 2014 2015 2016F 2017F 2018F
BBCA BDMN BMRI
BBNI BBRI BBTN
BTPN PNBN Average - RHS
30%
20%
19%
16%
8%
8%
6%
6%
-1%
-3%
-19%
-25% -15% -5% 5% 15% 25% 35%
Electricity, Gas and Water
Construction
Services
Agriculture
Financial, Ownership & Business …
Loans to Non Industrial Origin
Total
Trade
Manufacturing Industry
Transportation
Mining
0.0%
0.5%
1.0%
1.5%
2.0%
2.5%
3.0%
0.0%0.5%1.0%1.5%2.0%2.5%3.0%3.5%4.0%4.5%
2012 2013 2014 2015 2016F 2017F 2018F
BBCA BDMN BMRI
BBNI BBRI BBTN
BTPN PNBN Average - RHS
6.5%6.6%6.7%6.8%6.9%7.0%7.1%7.2%7.3%7.4%7.5%
0.0%
2.0%
4.0%
6.0%
8.0%
10.0%
12.0%
14.0%
2012 2013 2014 2015 2016F 2017F 2018F
BBCA BDMN BMRI
BBNI BBRI BBTN
BTPN PNBN Average - RHS
48.5%
49.0%
49.5%
50.0%
50.5%
51.0%
51.5%
52.0%
52.5%
0.0%
10.0%
20.0%
30.0%
40.0%
50.0%
60.0%
70.0%
2012 2013 2014 2015 2016F 2017F 2018F
BBCA BDMN BMRI
BBNI BBRI BBTN
BTPN PNBN Average - RHS
82.0%
84.0%
86.0%
88.0%
90.0%
92.0%
94.0%
96.0%
0.0%
20.0%
40.0%
60.0%
80.0%
100.0%
120.0%
140.0%
2012 2013 2014 2015 2016F 2017F 2018F
BBCA BDMN BMRI
BBNI BBRI BBTN
BTPN PNBN Average - RHS
2.2%
1.5%
2.0%2.1%
1.7%
1.3%
0.9%1.0%
1.1%
1.7%
2.5%
0.0%
0.5%
1.0%
1.5%
2.0%
2.5%
3.0%
2006
2007
2008
2009
2010
2011
2012
2013
2014
2015
9M15
Credit Costs
0.0%
5.0%
10.0%
15.0%
20.0%
25.0%
30.0%
BMRI BBCA BBRI BBNI BDMN BBTN BTPN PNBN Average
3Q15
4Q15
1Q16
2Q16
3Q16

Industry Focus
Page 15
Indonesia: GDP growth
Indonesia: Policy rate trends
Indonesia: Currency
Indonesia: Inflation
Indonesia: Business sentiment
Indonesia: Consumer sentiment
Indonesia: Banking sector stock performance
Indonesia: Stock price performance until November
Source: Companies, DBS Vickers, DBS Bank, Bloomberg Finance L.P
5.5%
6.3%6.0%
4.6%
6.2% 6.2% 6.0%
5.6%
5.0%4.8%
5.1%5.3%
3.0%
3.5%
4.0%
4.5%
5.0%
5.5%
6.0%
6.5%
7.0%
GDP Growth
600
650
700
750
800
850
JAKFIN Index
Tax amnesty bill passed in June EM market
correction after US election
12%
7%
3%
21%
31%
12%
-5%
18%
13% 13%
-10%
-5%
0%
5%
10%
15%
20%
25%
30%
35%
BBCA BBNI BBRI BMRI BBTN BDMN PNBN BTPN JAKFIN JCI
0
1
2
3
4
5
6
7
8
9
Oct
-11
Jan-
12
Apr
-12
Jul-1
2
Oct
-12
Jan-
13
Apr
-13
Jul-1
3
Oct
-13
Jan-
14
Apr
-14
Jul-1
4
Oct
-14
Jan-
15
Apr
-15
Jul-1
5
Oct
-15
Jan-
16
Apr
-16
Jul-1
6
Oct
-16
Inflation (%)
4.00
4.50
5.00
5.50
6.00
6.50
7.00
7.50
8.00
BI Rate 7DRRR 12MSBI
-
200
400
600
800
1,000
1,200
1,400
8,000
9,000
10,000
11,000
12,000
13,000
14,000
15,000
Nov
-07
May
-08
Nov
-08
May
-09
Nov
-09
May
-10
Nov
-10
May
-11
Nov
-11
May
-12
Nov
-12
May
-13
Nov
-13
May
-14
Nov
-14
May
-15
Nov
-15
May
-16
Nov
-16
USD/IDR -RHS USD/IDR 1 year stdv - RHS
7580859095
100105110115120125
Consumer Confindence Index
6.1
16.1 15.5
11.9
5.1
18.6
13.412.6
2.1
21.1
11.3 11.1
4.4
11.9
5.13.0
5.8
18.4
13.2
0.0
5.0
10.0
15.0
20.0
25.0
1Q12
2Q12
3Q12
4Q12
1Q13
2Q13
3Q13
4Q13
1Q14
2Q14
3Q14
4Q14
1Q15
2Q15
3Q15
4Q15
1Q16
2Q16
3Q16
Business Activity Survey

Industry Focus
Page 16
Company Guides
ASIAN INSIGHTS VICKERS SECURITIES ed: TH / sa: MA, PY
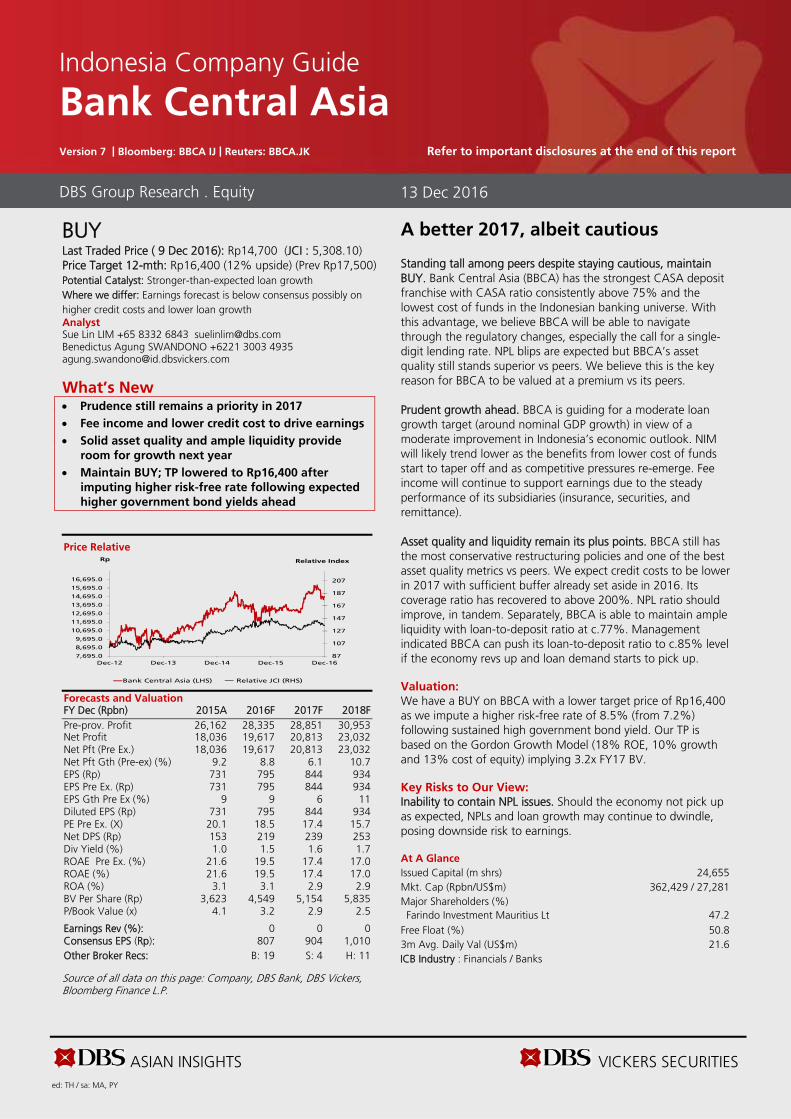
BUY Last Traded Price ( 9 Dec 2016): Rp14,700 (JCI : 5,308.10) Price Target 12-mth: Rp16,400 (12% upside) (Prev Rp17,500) Potential Catalyst: Stronger-than-expected loan growth Where we differ: Earnings forecast is below consensus possibly on higher credit costs and lower loan growth Analyst Sue Lin LIM +65 8332 6843 [email protected] Benedictus Agung SWANDONO +6221 3003 4935 [email protected]
What’s New Prudence still remains a priority in 2017 Fee income and lower credit cost to drive earnings Solid asset quality and ample liquidity provide
room for growth next year Maintain BUY; TP lowered to Rp16,400 after
imputing higher risk-free rate following expected
higher government bond yields ahead
Price Relative
Forecasts and Valuation FY Dec (Rpbn) 2015A 2016F 2017F 2018F Pre-prov. Profit 26,162 28,335 28,851 30,953 Net Profit 18,036 19,617 20,813 23,032 Net Pft (Pre Ex.) 18,036 19,617 20,813 23,032 Net Pft Gth (Pre-ex) (%) 9.2 8.8 6.1 10.7 EPS (Rp) 731 795 844 934 EPS Pre Ex. (Rp) 731 795 844 934 EPS Gth Pre Ex (%) 9 9 6 11 Diluted EPS (Rp) 731 795 844 934 PE Pre Ex. (X) 20.1 18.5 17.4 15.7 Net DPS (Rp) 153 219 239 253 Div Yield (%) 1.0 1.5 1.6 1.7 ROAE Pre Ex. (%) 21.6 19.5 17.4 17.0 ROAE (%) 21.6 19.5 17.4 17.0 ROA (%) 3.1 3.1 2.9 2.9 BV Per Share (Rp) 3,623 4,549 5,154 5,835 P/Book Value (x) 4.1 3.2 2.9 2.5 Earnings Rev (%): 0 0 0 Consensus EPS (Rp): 807 904 1,010 Other Broker Recs: B: 19 S: 4 H: 11
Source of all data on this page: Company, DBS Bank, DBS Vickers, Bloomberg Finance L.P.
A better 2017, albeit cautious
Standing tall among peers despite staying cautious, maintain BUY. Bank Central Asia (BBCA) has the strongest CASA deposit franchise with CASA ratio consistently above 75% and the lowest cost of funds in the Indonesian banking universe. With this advantage, we believe BBCA will be able to navigate through the regulatory changes, especially the call for a single-digit lending rate. NPL blips are expected but BBCA’s asset quality still stands superior vs peers. We believe this is the key reason for BBCA to be valued at a premium vs its peers. Prudent growth ahead. BBCA is guiding for a moderate loan growth target (around nominal GDP growth) in view of a moderate improvement in Indonesia’s economic outlook. NIM will likely trend lower as the benefits from lower cost of funds start to taper off and as competitive pressures re-emerge. Fee income will continue to support earnings due to the steady performance of its subsidiaries (insurance, securities, and remittance). Asset quality and liquidity remain its plus points. BBCA still has the most conservative restructuring policies and one of the best asset quality metrics vs peers. We expect credit costs to be lower in 2017 with sufficient buffer already set aside in 2016. Its coverage ratio has recovered to above 200%. NPL ratio should improve, in tandem. Separately, BBCA is able to maintain ample liquidity with loan-to-deposit ratio at c.77%. Management indicated BBCA can push its loan-to-deposit ratio to c.85% level if the economy revs up and loan demand starts to pick up. Valuation:
We have a BUY on BBCA with a lower target price of Rp16,400 as we impute a higher risk-free rate of 8.5% (from 7.2%) following sustained high government bond yield. Our TP is based on the Gordon Growth Model (18% ROE, 10% growth and 13% cost of equity) implying 3.2x FY17 BV. Key Risks to Our View:
Inability to contain NPL issues. Should the economy not pick up as expected, NPLs and loan growth may continue to dwindle, posing downside risk to earnings. At A Glance Issued Capital (m shrs) 24,655 Mkt. Cap (Rpbn/US$m) 362,429 / 27,281 Major Shareholders (%) Farindo Investment Mauritius Lt 47.2
Free Float (%) 50.8 3m Avg. Daily Val (US$m) 21.6 ICB Industry : Financials / Banks
DBS Group Research . Equity 13 Dec 2016
Indonesia Company Guide
Bank Central Asia Version 7 | Bloomberg: BBCA IJ | Reuters: BBCA.JK Refer to important disclosures at the end of this report
87
107
127
147
167
187
207
7,695.0
8,695.0
9,695.0
10,695.0
11,695.0
12,695.0
13,695.0
14,695.0
15,695.0
16,695.0
Dec-12 Dec-13 Dec-14 Dec-15 Dec-16
Relative IndexRp
Bank Central Asia (LHS) Relative JCI (RHS)
ASIAN INSIGHTS VICKERS SECURITIES Page 18
Company Guide
Bank Central Asia
WHAT’S NEW
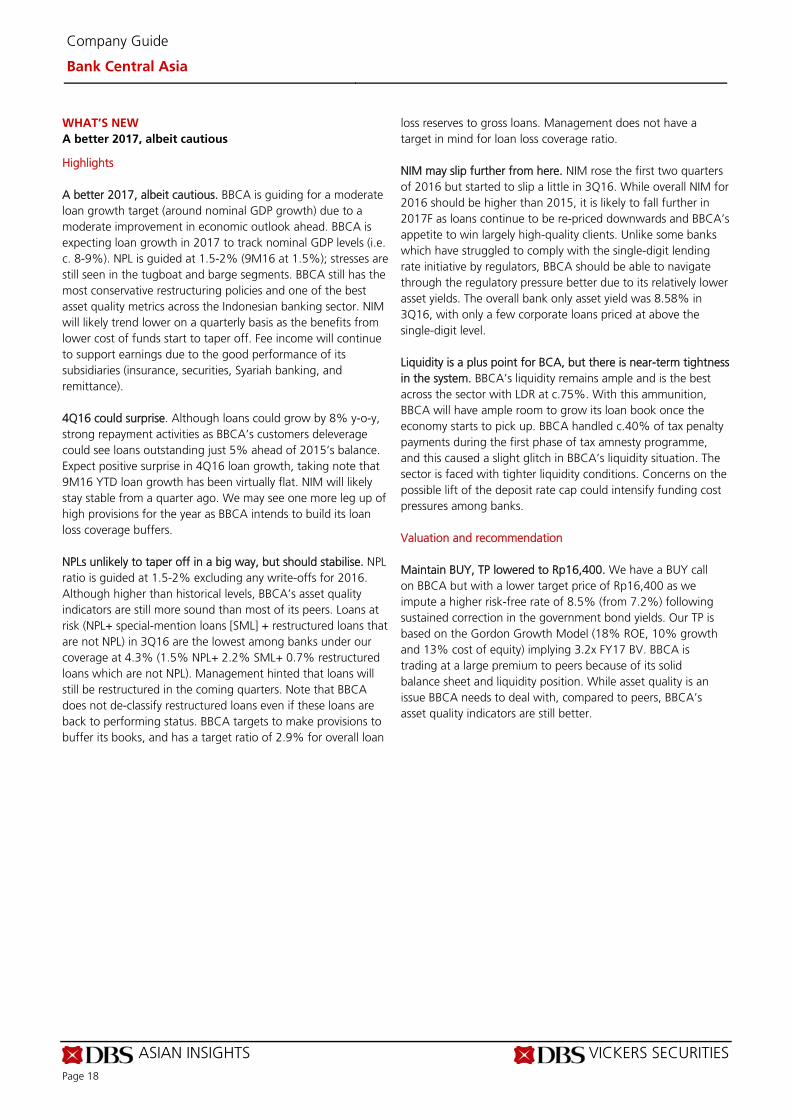
A better 2017, albeit cautious
Highlights A better 2017, albeit cautious. BBCA is guiding for a moderate loan growth target (around nominal GDP growth) due to a moderate improvement in economic outlook ahead. BBCA is expecting loan growth in 2017 to track nominal GDP levels (i.e. c. 8-9%). NPL is guided at 1.5-2% (9M16 at 1.5%); stresses are still seen in the tugboat and barge segments. BBCA still has the most conservative restructuring policies and one of the best asset quality metrics across the Indonesian banking sector. NIM will likely trend lower on a quarterly basis as the benefits from lower cost of funds start to taper off. Fee income will continue to support earnings due to the good performance of its subsidiaries (insurance, securities, Syariah banking, and remittance). 4Q16 could surprise. Although loans could grow by 8% y-o-y, strong repayment activities as BBCA’s customers deleverage could see loans outstanding just 5% ahead of 2015’s balance. Expect positive surprise in 4Q16 loan growth, taking note that 9M16 YTD loan growth has been virtually flat. NIM will likely stay stable from a quarter ago. We may see one more leg up of high provisions for the year as BBCA intends to build its loan loss coverage buffers. NPLs unlikely to taper off in a big way, but should stabilise. NPL ratio is guided at 1.5-2% excluding any write-offs for 2016. Although higher than historical levels, BBCA’s asset quality indicators are still more sound than most of its peers. Loans at risk (NPL+ special-mention loans [SML] + restructured loans that are not NPL) in 3Q16 are the lowest among banks under our coverage at 4.3% (1.5% NPL+ 2.2% SML+ 0.7% restructured loans which are not NPL). Management hinted that loans will still be restructured in the coming quarters. Note that BBCA does not de-classify restructured loans even if these loans are back to performing status. BBCA targets to make provisions to buffer its books, and has a target ratio of 2.9% for overall loan
loss reserves to gross loans. Management does not have a target in mind for loan loss coverage ratio. NIM may slip further from here. NIM rose the first two quarters of 2016 but started to slip a little in 3Q16. While overall NIM for 2016 should be higher than 2015, it is likely to fall further in 2017F as loans continue to be re-priced downwards and BBCA’s appetite to win largely high-quality clients. Unlike some banks which have struggled to comply with the single-digit lending rate initiative by regulators, BBCA should be able to navigate through the regulatory pressure better due to its relatively lower asset yields. The overall bank only asset yield was 8.58% in 3Q16, with only a few corporate loans priced at above the single-digit level. Liquidity is a plus point for BCA, but there is near-term tightness in the system. BBCA’s liquidity remains ample and is the best across the sector with LDR at c.75%. With this ammunition, BBCA will have ample room to grow its loan book once the economy starts to pick up. BBCA handled c.40% of tax penalty payments during the first phase of tax amnesty programme, and this caused a slight glitch in BBCA’s liquidity situation. The sector is faced with tighter liquidity conditions. Concerns on the possible lift of the deposit rate cap could intensify funding cost pressures among banks. Valuation and recommendation Maintain BUY, TP lowered to Rp16,400. We have a BUY call on BBCA but with a lower target price of Rp16,400 as we impute a higher risk-free rate of 8.5% (from 7.2%) following sustained correction in the government bond yields. Our TP is based on the Gordon Growth Model (18% ROE, 10% growth and 13% cost of equity) implying 3.2x FY17 BV. BBCA is trading at a large premium to peers because of its solid balance sheet and liquidity position. While asset quality is an issue BBCA needs to deal with, compared to peers, BBCA’s asset quality indicators are still better.
ASIAN INSIGHTS VICKERS SECURITIES Page 19
Company Guide
Bank Central Asia
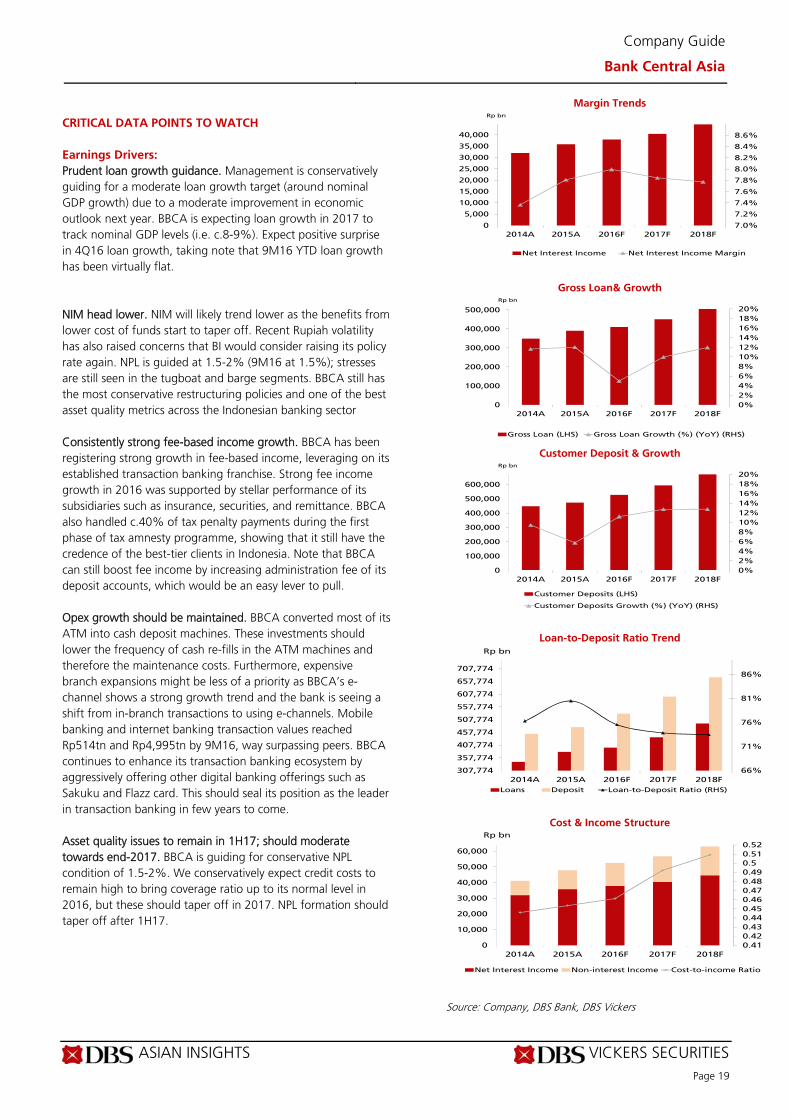
CRITICAL DATA POINTS TO WATCH
Earnings Drivers:
Prudent loan growth guidance. Management is conservatively guiding for a moderate loan growth target (around nominal GDP growth) due to a moderate improvement in economic outlook next year. BBCA is expecting loan growth in 2017 to track nominal GDP levels (i.e. c.8-9%). Expect positive surprise in 4Q16 loan growth, taking note that 9M16 YTD loan growth has been virtually flat. NIM head lower. NIM will likely trend lower as the benefits from lower cost of funds start to taper off. Recent Rupiah volatility has also raised concerns that BI would consider raising its policy rate again. NPL is guided at 1.5-2% (9M16 at 1.5%); stresses are still seen in the tugboat and barge segments. BBCA still has the most conservative restructuring policies and one of the best asset quality metrics across the Indonesian banking sector Consistently strong fee-based income growth. BBCA has been registering strong growth in fee-based income, leveraging on its established transaction banking franchise. Strong fee income growth in 2016 was supported by stellar performance of its subsidiaries such as insurance, securities, and remittance. BBCA also handled c.40% of tax penalty payments during the first phase of tax amnesty programme, showing that it still have the credence of the best-tier clients in Indonesia. Note that BBCA can still boost fee income by increasing administration fee of its deposit accounts, which would be an easy lever to pull. Opex growth should be maintained. BBCA converted most of its ATM into cash deposit machines. These investments should lower the frequency of cash re-fills in the ATM machines and therefore the maintenance costs. Furthermore, expensive branch expansions might be less of a priority as BBCA’s e-channel shows a strong growth trend and the bank is seeing a shift from in-branch transactions to using e-channels. Mobile banking and internet banking transaction values reached Rp514tn and Rp4,995tn by 9M16, way surpassing peers. BBCA continues to enhance its transaction banking ecosystem by aggressively offering other digital banking offerings such as Sakuku and Flazz card. This should seal its position as the leader in transaction banking in few years to come. Asset quality issues to remain in 1H17; should moderate towards end-2017. BBCA is guiding for conservative NPL condition of 1.5-2%. We conservatively expect credit costs to remain high to bring coverage ratio up to its normal level in 2016, but these should taper off in 2017. NPL formation should taper off after 1H17.
Margin Trends
Gross Loan& Growth
Customer Deposit & Growth
Loan-to-Deposit Ratio Trend
Cost & Income Structure
Source: Company, DBS Bank, DBS Vickers
7.0%
7.2%
7.4%
7.6%
7.8%
8.0%
8.2%
8.4%
8.6%
0
5,000
10,000
15,000
20,000
25,000
30,000
35,000
40,000
2014A 2015A 2016F 2017F 2018F
Rp bn
Net Interest Income Net Interest Income Margin
0%
2%
4%
6%
8%
10%
12%
14%
16%
18%
20%
0
100,000
200,000
300,000
400,000
500,000
2014A 2015A 2016F 2017F 2018F
Rp bn
Gross Loan (LHS) Gross Loan Growth (%) (YoY) (RHS)
0%
2%
4%
6%
8%
10%
12%
14%
16%
18%
20%
0
100,000
200,000
300,000
400,000
500,000
600,000
2014A 2015A 2016F 2017F 2018F
Rp bn
Customer Deposits (LHS)
Customer Deposits Growth (%) (YoY) (RHS)
66%
71%
76%
81%
86%
307,774
357,774
407,774
457,774
507,774
557,774
607,774
657,774
707,774
2014A 2015A 2016F 2017F 2018F
Rp bn
Loans Deposit Loan-to-Deposit Ratio (RHS)
0.41
0.42
0.43
0.44
0.45
0.46
0.47
0.48
0.49
0.5
0.51
0.52
0
10,000
20,000
30,000
40,000
50,000
60,000
2014A 2015A 2016F 2017F 2018F
Rp bn
Net Interest Income Non-interest Income Cost-to-income Ratio
ASIAN INSIGHTS VICKERS SECURITIES Page 20
Company Guide
Bank Central Asia
Balance Sheet:
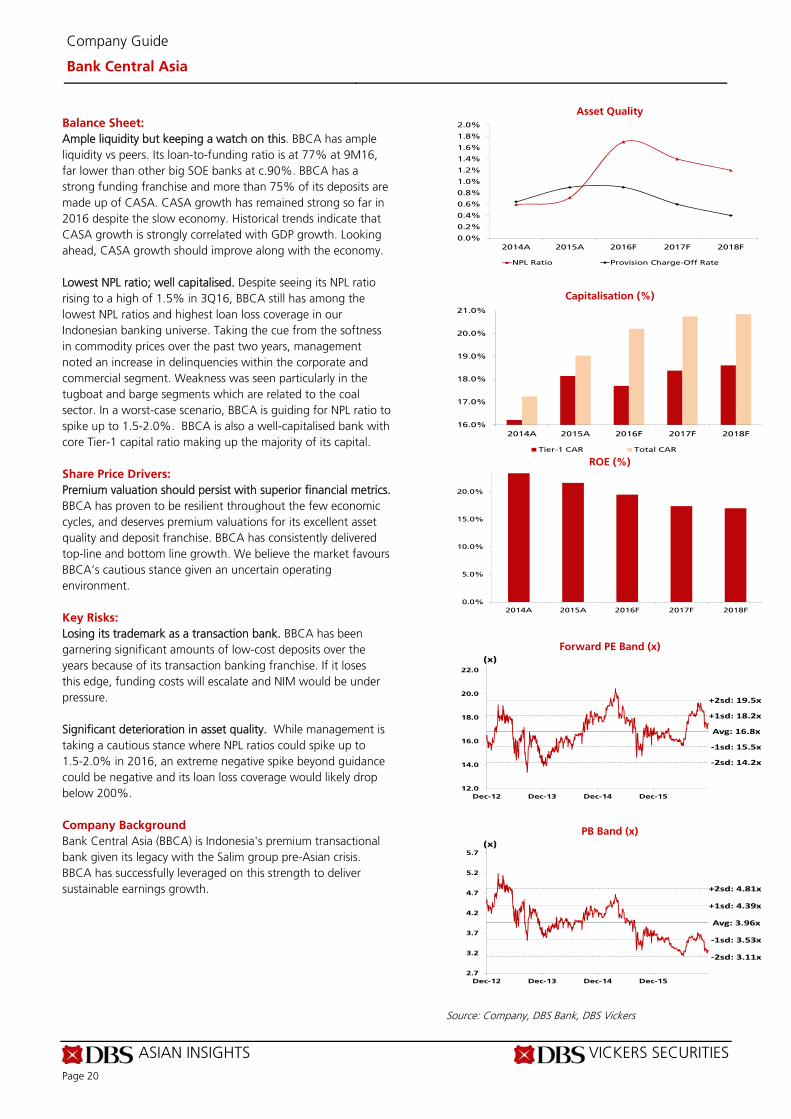
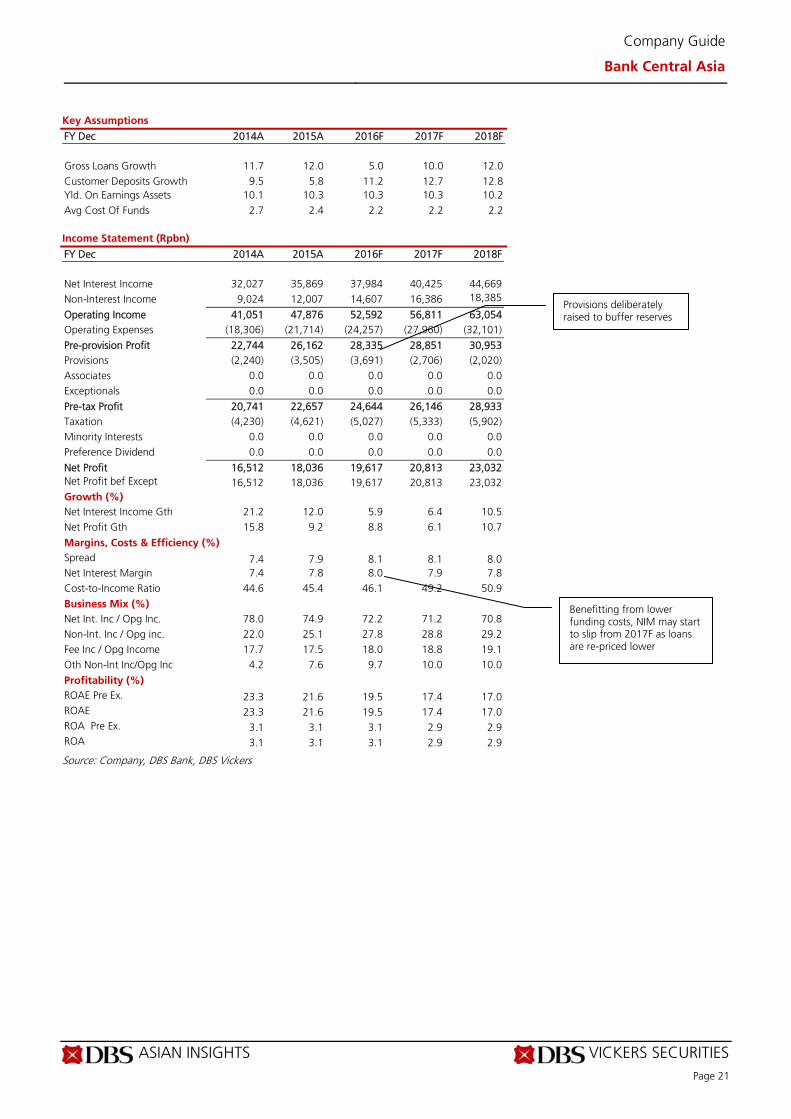
Ample liquidity but keeping a watch on this. BBCA has ample liquidity vs peers. Its loan-to-funding ratio is at 77% at 9M16, far lower than other big SOE banks at c.90%. BBCA has a strong funding franchise and more than 75% of its deposits are made up of CASA. CASA growth has remained strong so far in 2016 despite the slow economy. Historical trends indicate that CASA growth is strongly correlated with GDP growth. Looking ahead, CASA growth should improve along with the economy. Lowest NPL ratio; well capitalised. Despite seeing its NPL ratio rising to a high of 1.5% in 3Q16, BBCA still has among the lowest NPL ratios and highest loan loss coverage in our Indonesian banking universe. Taking the cue from the softness in commodity prices over the past two years, management noted an increase in delinquencies within the corporate and commercial segment. Weakness was seen particularly in the tugboat and barge segments which are related to the coal sector. In a worst-case scenario, BBCA is guiding for NPL ratio to spike up to 1.5-2.0%. BBCA is also a well-capitalised bank with core Tier-1 capital ratio making up the majority of its capital. Share Price Drivers:
Premium valuation should persist with superior financial metrics. BBCA has proven to be resilient throughout the few economic cycles, and deserves premium valuations for its excellent asset quality and deposit franchise. BBCA has consistently delivered top-line and bottom line growth. We believe the market favours BBCA’s cautious stance given an uncertain operating environment. Key Risks:
Losing its trademark as a transaction bank. BBCA has been garnering significant amounts of low-cost deposits over the years because of its transaction banking franchise. If it loses this edge, funding costs will escalate and NIM would be under pressure. Significant deterioration in asset quality. While management is taking a cautious stance where NPL ratios could spike up to 1.5-2.0% in 2016, an extreme negative spike beyond guidance could be negative and its loan loss coverage would likely drop below 200%. Company Background
Bank Central Asia (BBCA) is Indonesia's premium transactional bank given its legacy with the Salim group pre-Asian crisis. BBCA has successfully leveraged on this strength to deliver sustainable earnings growth.
Asset Quality
Capitalisation (%)
ROE (%)
Forward PE Band (x)
PB Band (x)
Source: Company, DBS Bank, DBS Vickers
0.0%
0.2%
0.4%
0.6%
0.8%
1.0%
1.2%
1.4%
1.6%
1.8%
2.0%
2014A 2015A 2016F 2017F 2018F
NPL Ratio Provision Charge-Off Rate
16.0%
17.0%
18.0%
19.0%
20.0%
21.0%
2014A 2015A 2016F 2017F 2018F
Tier-1 CAR Total CAR
0.0%
5.0%
10.0%
15.0%
20.0%
2014A 2015A 2016F 2017F 2018F
Avg: 16.8x
+1sd: 18.2x
+2sd: 19.5x
‐1sd: 15.5x
‐2sd: 14.2x
12.0
14.0
16.0
18.0
20.0
22.0
Dec-12 Dec-13 Dec-14 Dec-15
(x)
Avg: 3.96x
+1sd: 4.39x
+2sd: 4.81x
‐1sd: 3.53x
‐2sd: 3.11x
2.7
3.2
3.7
4.2
4.7
5.2
5.7
Dec-12 Dec-13 Dec-14 Dec-15
(x)
ASIAN INSIGHTS VICKERS SECURITIES Page 21
Company Guide
Bank Central Asia
Key Assumptions
FY Dec 2014A 2015A 2016F 2017F 2018F
Gross Loans Growth 11.7 12.0 5.0 10.0 12.0 Customer Deposits Growth 9.5 5.8 11.2 12.7 12.8 Yld. On Earnings Assets 10.1 10.3 10.3 10.3 10.2 Avg Cost Of Funds 2.7 2.4 2.2 2.2 2.2 Income Statement (Rpbn)
FY Dec 2014A 2015A 2016F 2017F 2018F Net Interest Income 32,027 35,869 37,984 40,425 44,669 Non-Interest Income 9,024 12,007 14,607 16,386 18,385
Operating Income 41,051 47,876 52,592 56,811 63,054 Operating Expenses (18,306) (21,714) (24,257) (27,960) (32,101)
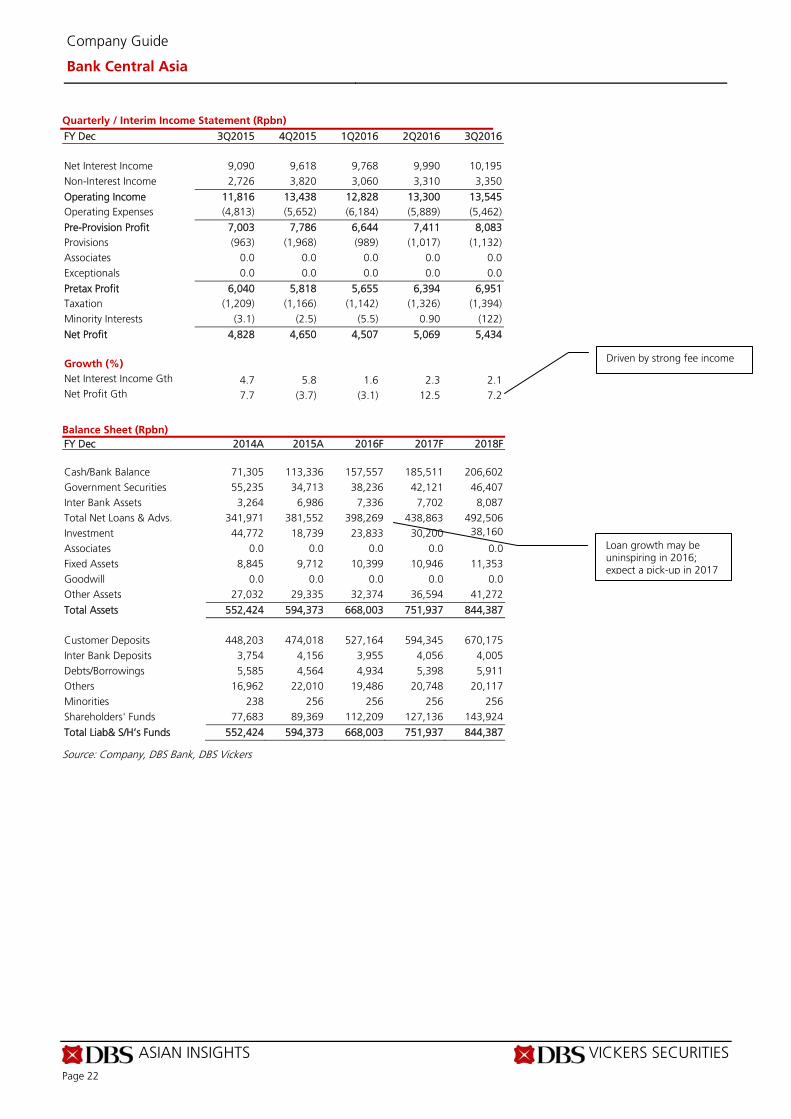
Pre-provision Profit 22,744 26,162 28,335 28,851 30,953 Provisions (2,240) (3,505) (3,691) (2,706) (2,020) Associates 0.0 0.0 0.0 0.0 0.0 Exceptionals 0.0 0.0 0.0 0.0 0.0
Pre-tax Profit 20,741 22,657 24,644 26,146 28,933 Taxation (4,230) (4,621) (5,027) (5,333) (5,902) Minority Interests 0.0 0.0 0.0 0.0 0.0 Preference Dividend 0.0 0.0 0.0 0.0 0.0
Net Profit 16,512 18,036 19,617 20,813 23,032 Net Profit bef Except 16,512 18,036 19,617 20,813 23,032 Growth (%) Net Interest Income Gth 21.2 12.0 5.9 6.4 10.5 Net Profit Gth 15.8 9.2 8.8 6.1 10.7
Margins, Costs & Efficiency (%) Spread 7.4 7.9 8.1 8.1 8.0 Net Interest Margin 7.4 7.8 8.0 7.9 7.8 Cost-to-Income Ratio 44.6 45.4 46.1 49.2 50.9
Business Mix (%) Net Int. Inc / Opg Inc. 78.0 74.9 72.2 71.2 70.8 Non-Int. Inc / Opg inc. 22.0 25.1 27.8 28.8 29.2 Fee Inc / Opg Income 17.7 17.5 18.0 18.8 19.1 Oth Non-Int Inc/Opg Inc 4.2 7.6 9.7 10.0 10.0
Profitability (%) ROAE Pre Ex. 23.3 21.6 19.5 17.4 17.0 ROAE 23.3 21.6 19.5 17.4 17.0 ROA Pre Ex. 3.1 3.1 3.1 2.9 2.9 ROA 3.1 3.1 3.1 2.9 2.9
Source: Company, DBS Bank, DBS Vickers
Provisions deliberately raised to buffer reserves
Benefitting from lower funding costs, NIM may start to slip from 2017F as loans are re-priced lower
ASIAN INSIGHTS VICKERS SECURITIES Page 22
Company Guide
Bank Central Asia
Quarterly / Interim Income Statement (Rpbn)
FY Dec 3Q2015 4Q2015 1Q2016 2Q2016 3Q2016 Net Interest Income 9,090 9,618 9,768 9,990 10,195 Non-Interest Income 2,726 3,820 3,060 3,310 3,350
Operating Income 11,816 13,438 12,828 13,300 13,545 Operating Expenses (4,813) (5,652) (6,184) (5,889) (5,462)
Pre-Provision Profit 7,003 7,786 6,644 7,411 8,083 Provisions (963) (1,968) (989) (1,017) (1,132) Associates 0.0 0.0 0.0 0.0 0.0 Exceptionals 0.0 0.0 0.0 0.0 0.0
Pretax Profit 6,040 5,818 5,655 6,394 6,951 Taxation (1,209) (1,166) (1,142) (1,326) (1,394) Minority Interests (3.1) (2.5) (5.5) 0.90 (122)
Net Profit 4,828 4,650 4,507 5,069 5,434
Growth (%) Net Interest Income Gth 4.7 5.8 1.6 2.3 2.1 Net Profit Gth 7.7 (3.7) (3.1) 12.5 7.2
Balance Sheet (Rpbn)
FY Dec 2014A 2015A 2016F 2017F 2018F Cash/Bank Balance 71,305 113,336 157,557 185,511 206,602 Government Securities 55,235 34,713 38,236 42,121 46,407 Inter Bank Assets 3,264 6,986 7,336 7,702 8,087 Total Net Loans & Advs. 341,971 381,552 398,269 438,863 492,506 Investment 44,772 18,739 23,833 30,200 38,160
Associates 0.0 0.0 0.0 0.0 0.0 Fixed Assets 8,845 9,712 10,399 10,946 11,353 Goodwill 0.0 0.0 0.0 0.0 0.0 Other Assets 27,032 29,335 32,374 36,594 41,272
Total Assets 552,424 594,373 668,003 751,937 844,387 Customer Deposits 448,203 474,018 527,164 594,345 670,175 Inter Bank Deposits 3,754 4,156 3,955 4,056 4,005 Debts/Borrowings 5,585 4,564 4,934 5,398 5,911 Others 16,962 22,010 19,486 20,748 20,117 Minorities 238 256 256 256 256 Shareholders' Funds 77,683 89,369 112,209 127,136 143,924
Total Liab& S/H’s Funds 552,424 594,373 668,003 751,937 844,387
Source: Company, DBS Bank, DBS Vickers
Driven by strong fee income
Loan growth may be uninspiring in 2016; expect a pick-up in 2017
ASIAN INSIGHTS VICKERS SECURITIES Page 23
Company Guide
Bank Central Asia
Financial Stability Measures (%)
FY Dec 2014A 2015A 2016F 2017F 2018F Balance Sheet Structure Loan-to-Deposit Ratio 76.3 80.5 75.5 73.8 73.5 Net Loans / Total Assets 61.9 64.2 59.6 58.4 58.3
Investment / Total Assets 8.1 3.2 3.6 4.0 4.5 Cust . Dep./Int. Bear. Liab. 98.8 99.0 99.1 99.1 99.1 Interbank Dep / Int. Bear. 0.8 0.9 0.7 0.7 0.6
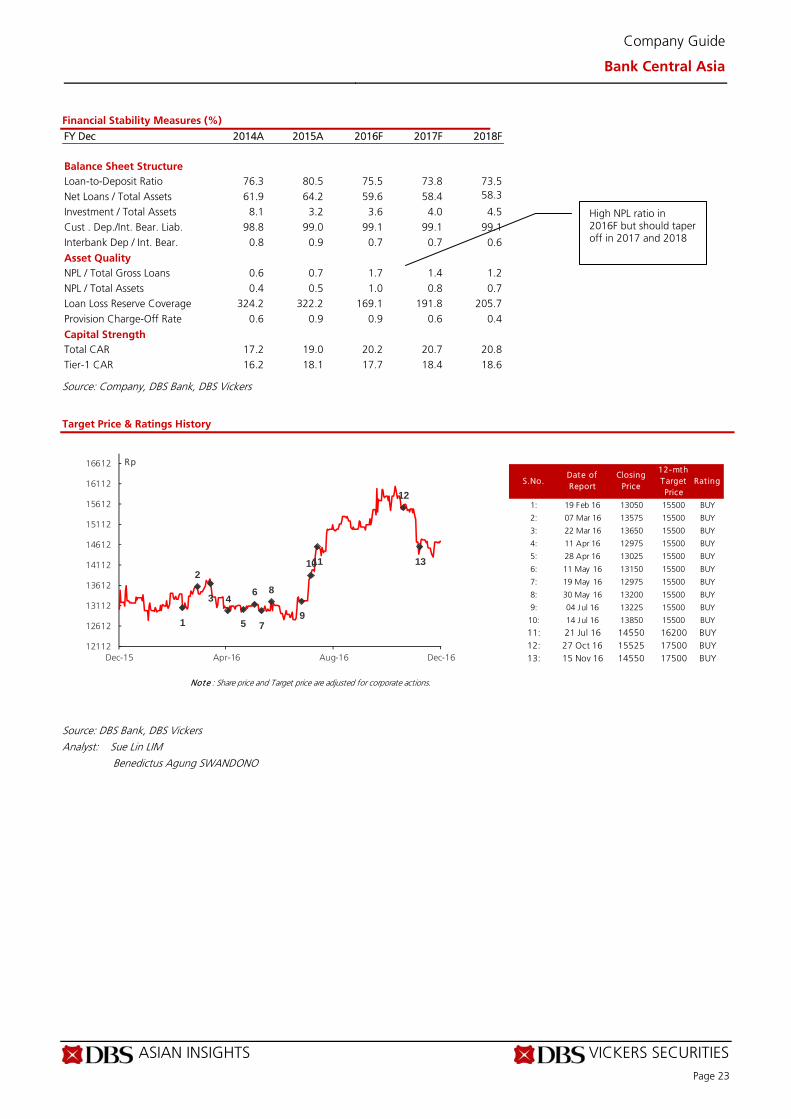
Asset Quality NPL / Total Gross Loans 0.6 0.7 1.7 1.4 1.2 NPL / Total Assets 0.4 0.5 1.0 0.8 0.7 Loan Loss Reserve Coverage 324.2 322.2 169.1 191.8 205.7 Provision Charge-Off Rate 0.6 0.9 0.9 0.6 0.4
Capital Strength Total CAR 17.2 19.0 20.2 20.7 20.8 Tier-1 CAR 16.2 18.1 17.7 18.4 18.6
Source: Company, DBS Bank, DBS Vickers
Target Price & Ratings History
Source: DBS Bank, DBS Vickers Analyst: Sue Lin LIM
Benedictus Agung SWANDONO
S.No.Date of Report
Closing Price
12-mth Target Price
Rat ing
1: 19 Feb 16 13050 15500 BUY
2: 07 Mar 16 13575 15500 BUY
3: 22 Mar 16 13650 15500 BUY
4: 11 Apr 16 12975 15500 BUY
5: 28 Apr 16 13025 15500 BUY
6: 11 May 16 13150 15500 BUY
7: 19 May 16 12975 15500 BUY
8: 30 May 16 13200 15500 BUY
9: 04 Jul 16 13225 15500 BUY
10: 14 Jul 16 13850 15500 BUY
11: 21 Jul 16 14550 16200 BUY12: 27 Oct 16 15525 17500 BUY13: 15 Nov 16 14550 17500 BUY
Note : Share price and Target price are adjusted for corporate actions.
1
2
3 4
5
6
7
8
9
1011
12
13
12112
12612
13112
13612
14112
14612
15112
15612
16112
16612
Dec-15 Apr-16 Aug-16 Dec-16
Rp
High NPL ratio in 2016F but should taper off in 2017 and 2018

ASIAN INSIGHTS VICKERS SECURITIES ed: TH / sa: MA, PY
BUY
Last Traded Price ( 9 Dec 2016): Rp3,370 (JCI : 5,308.10) Price Target 12-mth: Rp4,300 (28% upside) (Prev Rp4,700) Potential Catalyst: Deliveries of transformation programme Where we differ: We are among the few bullish brokers on Danamon’s turnaround story, more visibility expected in FY17F Analyst Sue Lin LIM +65 8332 6843 [email protected] Benedictus Agung SWANDONO +6221 3003 4935 [email protected]
What’s New Remains our conviction pick for a turnaround story More deliveries in 2017 as retail and SME
businesses accelerate while micro business revamps
Double-digit ROEs over time as new business engines ramp up
Maintain BUY; TP lowered to Rp4,300 after imputing higher risk-free rate following expected higher government bond yields ahead
Price Relative
Forecasts and Valuation FY Dec (Rpbn) 2015A 2016F 2017F 2018F Pre-prov. Profit 9,026 9,127 9,935 11,654 Net Profit 2,393 3,364 4,158 5,213 Net Pft (Pre Ex.) 2,393 3,364 4,158 5,213 Net Pft Gth (Pre-ex) (%) (8.1) 40.5 23.6 25.4 EPS (Rp) 251 352 436 546 EPS Pre Ex. (Rp) 251 352 436 546 EPS Gth Pre Ex (%) (8) 41 24 25 Diluted EPS (Rp) 251 352 436 546 PE Pre Ex. (X) 13.4 9.6 7.7 6.2 Net DPS (Rp) 81.9 75.2 106 131 Div Yield (%) 2.4 2.2 3.1 3.9 ROAE Pre Ex. (%) 7.2 9.5 10.9 12.5 ROAE (%) 7.2 9.5 10.9 12.5 ROA (%) 1.3 1.8 2.0 2.3 BV Per Share (Rp) 3,556 3,849 4,179 4,595 P/Book Value (x) 0.9 0.9 0.8 0.7 Earnings Rev (%): 0 (1) 0 Consensus EPS (Rp): 331 376 433 Other Broker Recs: B: 5 S: 6 H: 10
Source of all data on this page: Company, DBS Bank, DBS Vickers, Bloomberg Finance L.P.
Transformation on track
Remains our conviction pick for a turnaround story; reiterate BUY. Bank Danamon (BDMN) remains a BUY and our conviction pick for a turnaround story. The successes of its transformation process are starting to bear fruit. Visible deliveries include lower funding costs and lower expenses. The bank is also now on a leaner scale. Expect more deliveries in FY17 with retail and SME businesses accelerating their pace, Adira turning around and the rationalisation of its micro business. Amid recent funds outflow from Indonesia, BDMN was not spared. BDMN is currently trading below book, significantly discounting deliveries of its transformation programme, in our view. Double-digit ROEs over time. Management’s target is to achieve double-digit ROEs over time. And that can only be possible once the current engines are revived and new revenue engines start to fire up. With the lower-cost base and a cleaner balance sheet, we expect ROEs to improve closer to the 10% mark by end-FY16F as loan growth starts to pick up and funding costs head lower. We have tweaked our FY17-18F forecasts for slower loan growth but higher fee income as its business mix shifts. We remain bullish on FY16-17F earnings; our forecasts remain above consensus. Capital management plans are on the cards. Key milestones to watch in 2017. In the coming year, we will be on the lookout for loan growth resumption and a revamp of its micro business. Loan growth is expected to be driven by auto, SME and Commercial banking while micro loans might still continue to slip as rationalisation of its micro business will be a feature in 1H17. Management is in the midst of reviewing its entire micro business model. There will be further clarity once a detailed strategy is outlined. Watch this space. Valuation: We have a BUY on BDMN with a lower target price of Rp4,300 as we impute higher risk-free rate of 8.5% (from 7.2%) following expected higher government bond yields. Our TP is based on the Gordon Growth Model (14% ROE, 10% growth and 13.9% cost of equity) implying 1.0x FY17 BV. Key Risks to Our View:
Ineffective transformation deliveries. Slower-than-expected changes to business processes could derail the turnaround story in 2016. Failure to improve the deposit franchise could pressure NIM, while loan-to-deposit ratio will remain high and could lead to liquidity risk. At A Glance Issued Capital (m shrs) 9,585 Mkt. Cap (Rpbn/US$m) 32,300 / 2,431 Major Shareholders (%) Asia Financial (Indonesia) Pte. Ltd (%) 68.9 Morgan Stanley Sec 5.0
Free Float (%) 26.1 3m Avg. Daily Val (US$m) 0.48 ICB Industry : Financials / Banks
DBS Group Research . Equity 13 Dec 2016
Indonesia Company Guide
Bank Danamon Version 7 | Bloomberg: BDMN IJ | Reuters: BDMN.JK Refer to important disclosures at the end of this report
41
61
81
101
121
141
161
181
201
221
2,425.5
2,925.5
3,425.5
3,925.5
4,425.5
4,925.5
5,425.5
5,925.5
6,425.5
6,925.5
Dec-12 Dec-13 Dec-14 Dec-15 Dec-16
Relative IndexRp
Bank Danamon (LHS) Relative JCI (RHS)
ASIAN INSIGHTS VICKERS SECURITIES Page 25
Company Guide
Bank Danamon
WHAT’S NEW
Transformation on track, more deliveries in 2017
Highlights Moving away from concentrated business; more diversified revenue streams over time. The bank has been reliant on two main engines in the past – Adira (2W and 4W financing) and Danamon Simpan Pinjam (DSP; its micro business). Collectively, these used to contribute 67% of the bank’s books. But after challenges seen in the auto sector since 2014, and changes in the micro lending landscape with the introduction of Kredit Usaha Rakyat (KUR) loans, these two key engines have suffered declines. Positively, Adira is starting to turn around, after a round of restructuring completed; its funding costs have declined quite substantially. Over time, its business model will likely be less dependent on dealers; and alternative distribution channels have been established. Adira is poised to show growth next year as the 4W market recovers, with credit costs well under control. Adira remains an important part of BDMN’s business and is expected to remain so. Separately, its micro business has encountered disruption from KUR; virtually impossible to compete with KUR loan rates. As such, loans from the DSP have been running down. The micro business is still undergoing rationalisation. A clearer picture on its micro business will be made known early next year. New engines revving up: Retail, SME and commercial banking. To compensate for the slowdown in its two engines and to make revenue streams more diversified, the bank is heading towards three other new engines – retail, SME and commercial loans. Retail and SME loans are an important source for low-cost funding (CASA) and cross-sell opportunities to gain fee income traction over time. Both retail and SME loans have showed positive loan growth YTD. The commercial banking segment will be ready for growth by mid-next year. Within the retail space, mortgages have been introduced. While it is a low-NIM business, opportunities for cross-selling are ample. Mortgages are seen as a fee income feeder to the bank (for bancassurance (life insurance products for bancassurance tie-up with Manulife), general insurance (with Adira Insurance), and more importantly CASA (customers are encouraged to leave a balance amounting to 3-6 months of instalment payments in their CASA accounts). The retail business has been remodelled in 1H16 and the results were apparent in 2H16. As for SMEs, 9M16 YTD loan growth has been at 6% with the key success factor being its improved turnaround time from 2-3 weeks to five working days) Successes delivered in 2016. Two key metrics can measure the bank’s success from its transformation programme (approval by the Board in November 2015; implementation from early 2016) this year:
(i) Lower cost of funds (both at bank level and Adira) – the bank has successfully flushed out expensive time deposits and CASA. CASA-to-total deposits have dropped to below 40% but these involve non-promotional CASA rates. Even time deposits are no longer premium priced. At its peak, expensive time deposits formed close to 20% of total deposits. Funding cost at Adira has also declined. The ability to lower costs at the bank level also allows the bank to lend at a lower rate to Adira via joint-financing.
(ii) Lower operating costs – headcount has been on a decline
even before the current CEO joined. The bank’s expenses are on a downtrend y-o-y and the there is still room for more costs to be trimmed next year. Branches (and outlets) are also being rationalised where non-profitable ones will be closed down and/or relocated. The branch rationalisation programme forms part of its Sales and Distribution arm of its transformation programme.
Challenges faced. Changes will almost always be faced with challenges. The key challenge is human capital; to find the right fit for the right role. Several new faces have been introduced to the senior management team in the past two years. The bank’s previous Chief Risk Officer now heads and is responsible to manage/restructure/turn around its micro business – watch this space in the next 12-18 months. A new Chief Risk Officer has been appointed with experience in wholesale-commercial as well as retail granular business and micro business. A new IT head has been brought over as well, while a new Chief Credit Officer will soon join the bank. Lower NIM trends ahead as loan mix changes, but lower expenses and provisions should make up for earnings over time. NIM will likely slide as the loan mix changes towards SME loans which are mainly secured (carrying lower lending yields). But this portfolio will also come with significantly lower credit cost and expenses. Comparatively, the credit cost for micro loans is in excess of 8% but credit cost for SME would be below 1% (this portfolio is deemed to have lower risk). Expenses will be lower as the bank scales down its labour-intensive micro business (typically requiring more employees to be surveyors and for collections). Provisions should also decline. All in, the lower NIM will be compensated by lower funding costs, lower expenses, higher fee income and lower provisions. With the recovery of its loans in 2017, earnings are well poised for growth. Separately, the pressure by regulators have somewhat cooled off. That said, the growth of new loan products by BDMN (e.g. mortgage and SME loans) are at single-digit levels. Asset quality under control. More than 80% of Special-Mention Loans are below 30 days and these are deemed habitual. Special mention loans have been flat. Slippages from special-mention loans to NPL have been low. BDMN has among the lowest
ASIAN INSIGHTS VICKERS SECURITIES Page 26
Company Guide
Bank Danamon
percentage of restructured loans-to-total loans (c.3%). This is also because auto loans (both 2W and 4W from Adira) and micro loans have automatic write-off policies of 180 days and 360 days respectively. Most of BDMN’s asset quality issues have been settled. The credit cost figure and NPL ratio looks high because loans (the denominator for both the formulae for credit cost and NPL ratio) have been contracting. Further cost reduction likely as efficiency improves. There will likely be a round of “restructuring costs” booked in 4Q16 (similar to that recorded in 4Q15). There is still room for further cost reduction when efficiency improves mainly from branch/outlet rationalisation in 2017. Cost-to-income ratio should stay below 50%. Next key milestones. In the coming year, we will be on the lookout for loan growth resumption and a revamp of its micro business. (i) Loan growth to resume in 2017 (ex-micro). Loans have
been mainly contracting in 2016 because of the rundown of auto loans (industry weakness) as well as micro loans (more sharply and deliberate). The decline in consumer loans in 2016 was a result of reducing its exposure to unsecured lending. Green shoots for growth was seen in retail and SME in 2H16. In 2017, while micro loans will still slide, a recovery is expected for auto loans at Adira. SME and retail loans should continue their traction and commercial loans will start to show growth by middle of the year. A segment called “asset-based financing” which is largely related to the plantation segment will be reduced.
(ii) Micro business rationalisation. Keep watch on the micro business rationalisation in 2017. The landscape for micro lending business has changed since the revamp of the KUR scheme in August 2015, as mentioned above. The single- digit lending rate for loans that KUR extended are disrupting the existing micro banking landscape for players other than Bank Rakyat Indonesia (BBRI). BDMN has seen its micro loans run down by 30% y-o-y up to 9M16. Such trends are likely to continue in 2017. Management is in the midst of reviewing its entire micro business model. There will be further clarity once a detailed strategy is outlined. Watch this space.
Capital management plans on the cards. The bank holds very high capital levels and this is one of the reasons why ROE has been suppressed. BDMN is one of the few banks that has not revalued its assets. It will consider this at an appropriate time when a capital management plan is laid out. Valuation and recommendation Maintain BUY, TP lowered to Rp4,300. We have a BUY call on BDMN with a lower target price of Rp4,300 as we impute a higher risk-free rate of 8.5% (from 7.2%) following sustained high government bond yield. Our TP is based on the Gordon Growth Model (14% ROE, 10% growth and 13.9% cost of equity) implying 1.0x FY17 BV.
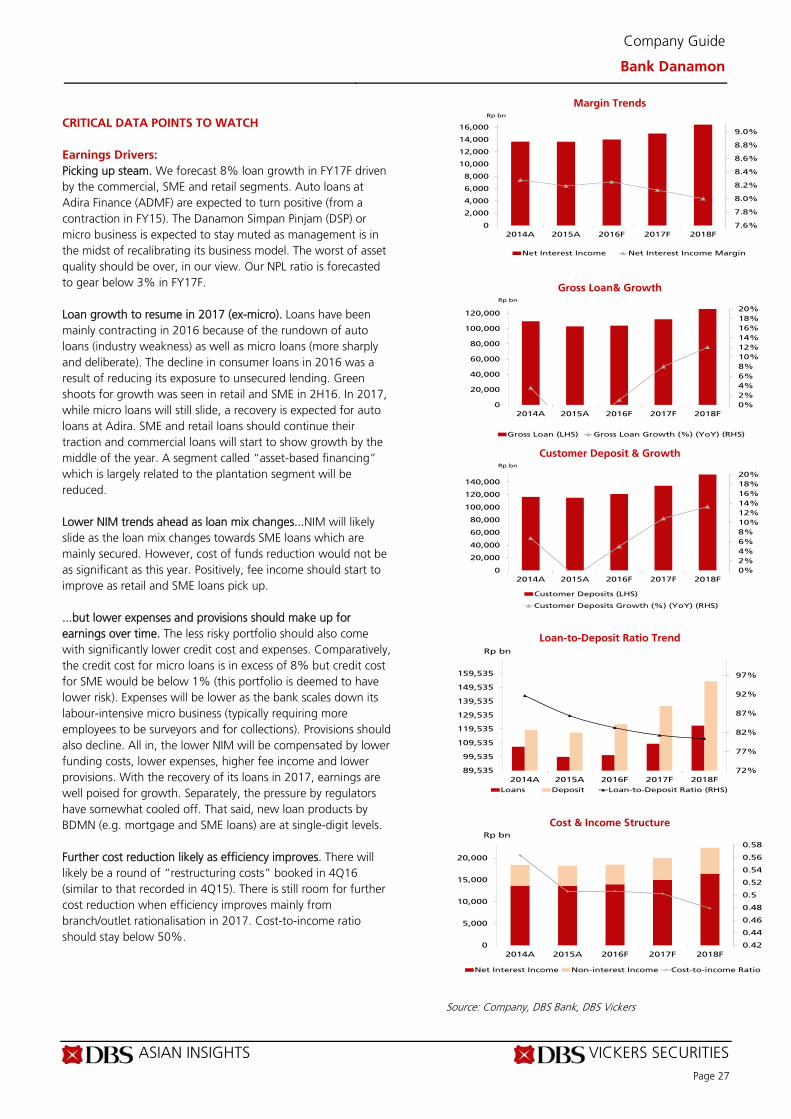
ASIAN INSIGHTS VICKERS SECURITIES Page 27
Company Guide
Bank Danamon
CRITICAL DATA POINTS TO WATCH
Earnings Drivers:
Picking up steam. We forecast 8% loan growth in FY17F driven by the commercial, SME and retail segments. Auto loans at Adira Finance (ADMF) are expected to turn positive (from a contraction in FY15). The Danamon Simpan Pinjam (DSP) or micro business is expected to stay muted as management is in the midst of recalibrating its business model. The worst of asset quality should be over, in our view. Our NPL ratio is forecasted to gear below 3% in FY17F. Loan growth to resume in 2017 (ex-micro). Loans have been mainly contracting in 2016 because of the rundown of auto loans (industry weakness) as well as micro loans (more sharply and deliberate). The decline in consumer loans in 2016 was a result of reducing its exposure to unsecured lending. Green shoots for growth was seen in retail and SME in 2H16. In 2017, while micro loans will still slide, a recovery is expected for auto loans at Adira. SME and retail loans should continue their traction and commercial loans will start to show growth by the middle of the year. A segment called “asset-based financing” which is largely related to the plantation segment will be reduced. Lower NIM trends ahead as loan mix changes...NIM will likely slide as the loan mix changes towards SME loans which are mainly secured. However, cost of funds reduction would not be as significant as this year. Positively, fee income should start to improve as retail and SME loans pick up. ...but lower expenses and provisions should make up for earnings over time. The less risky portfolio should also come with significantly lower credit cost and expenses. Comparatively, the credit cost for micro loans is in excess of 8% but credit cost for SME would be below 1% (this portfolio is deemed to have lower risk). Expenses will be lower as the bank scales down its labour-intensive micro business (typically requiring more employees to be surveyors and for collections). Provisions should also decline. All in, the lower NIM will be compensated by lower funding costs, lower expenses, higher fee income and lower provisions. With the recovery of its loans in 2017, earnings are well poised for growth. Separately, the pressure by regulators have somewhat cooled off. That said, new loan products by BDMN (e.g. mortgage and SME loans) are at single-digit levels. Further cost reduction likely as efficiency improves. There will likely be a round of “restructuring costs” booked in 4Q16 (similar to that recorded in 4Q15). There is still room for further cost reduction when efficiency improves mainly from branch/outlet rationalisation in 2017. Cost-to-income ratio should stay below 50%.
Margin Trends
Gross Loan& Growth
Customer Deposit & Growth
Loan-to-Deposit Ratio Trend
Cost & Income Structure
Source: Company, DBS Bank, DBS Vickers
7.6%
7.8%
8.0%
8.2%
8.4%
8.6%
8.8%
9.0%
0
2,000
4,000
6,000
8,000
10,000
12,000
14,000
16,000
2014A 2015A 2016F 2017F 2018F
Rp bn
Net Interest Income Net Interest Income Margin
0%
2%
4%
6%
8%
10%
12%
14%
16%
18%
20%
0
20,000
40,000
60,000
80,000
100,000
120,000
2014A 2015A 2016F 2017F 2018F
Rp bn
Gross Loan (LHS) Gross Loan Growth (%) (YoY) (RHS)
0%
2%
4%
6%
8%
10%
12%
14%
16%
18%
20%
0
20,000
40,000
60,000
80,000
100,000
120,000
140,000
2014A 2015A 2016F 2017F 2018F
Rp bn
Customer Deposits (LHS)
Customer Deposits Growth (%) (YoY) (RHS)
72%
77%
82%
87%
92%
97%
89,535
99,535
109,535
119,535
129,535
139,535
149,535
159,535
2014A 2015A 2016F 2017F 2018F
Rp bn
Loans Deposit Loan-to-Deposit Ratio (RHS)
0.42
0.44
0.46
0.48
0.5
0.52
0.54
0.56
0.58
0
5,000
10,000
15,000
20,000
2014A 2015A 2016F 2017F 2018F
Rp bn
Net Interest Income Non-interest Income Cost-to-income Ratio
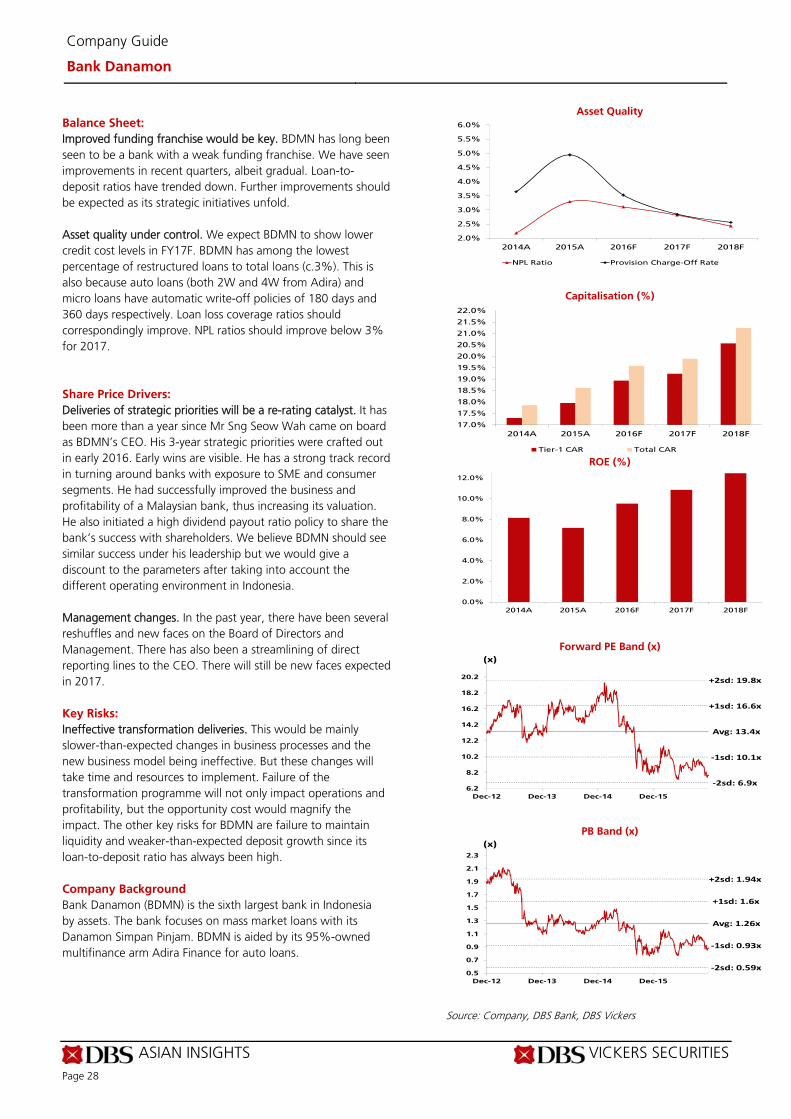
ASIAN INSIGHTS VICKERS SECURITIES Page 28
Company Guide
Bank Danamon
Balance Sheet:
Improved funding franchise would be key. BDMN has long been seen to be a bank with a weak funding franchise. We have seen improvements in recent quarters, albeit gradual. Loan-to-deposit ratios have trended down. Further improvements should be expected as its strategic initiatives unfold. Asset quality under control. We expect BDMN to show lower credit cost levels in FY17F. BDMN has among the lowest percentage of restructured loans to total loans (c.3%). This is also because auto loans (both 2W and 4W from Adira) and micro loans have automatic write-off policies of 180 days and 360 days respectively. Loan loss coverage ratios should correspondingly improve. NPL ratios should improve below 3% for 2017. Share Price Drivers:
Deliveries of strategic priorities will be a re-rating catalyst. It has been more than a year since Mr Sng Seow Wah came on board as BDMN’s CEO. His 3-year strategic priorities were crafted out in early 2016. Early wins are visible. He has a strong track record in turning around banks with exposure to SME and consumer segments. He had successfully improved the business and profitability of a Malaysian bank, thus increasing its valuation. He also initiated a high dividend payout ratio policy to share the bank’s success with shareholders. We believe BDMN should see similar success under his leadership but we would give a discount to the parameters after taking into account the different operating environment in Indonesia. Management changes. In the past year, there have been several reshuffles and new faces on the Board of Directors and Management. There has also been a streamlining of direct reporting lines to the CEO. There will still be new faces expected in 2017. Key Risks:
Ineffective transformation deliveries. This would be mainly slower-than-expected changes in business processes and the new business model being ineffective. But these changes will take time and resources to implement. Failure of the transformation programme will not only impact operations and profitability, but the opportunity cost would magnify the impact. The other key risks for BDMN are failure to maintain liquidity and weaker-than-expected deposit growth since its loan-to-deposit ratio has always been high. Company Background
Bank Danamon (BDMN) is the sixth largest bank in Indonesia by assets. The bank focuses on mass market loans with its Danamon Simpan Pinjam. BDMN is aided by its 95%-owned multifinance arm Adira Finance for auto loans.
Asset Quality
Capitalisation (%)
ROE (%)
Forward PE Band (x)
PB Band (x)
Source: Company, DBS Bank, DBS Vickers
2.0%
2.5%
3.0%
3.5%
4.0%
4.5%
5.0%
5.5%
6.0%
2014A 2015A 2016F 2017F 2018F
NPL Ratio Provision Charge-Off Rate
17.0%
17.5%
18.0%
18.5%
19.0%
19.5%
20.0%
20.5%
21.0%
21.5%
22.0%
2014A 2015A 2016F 2017F 2018F
Tier-1 CAR Total CAR
0.0%
2.0%
4.0%
6.0%
8.0%
10.0%
12.0%
2014A 2015A 2016F 2017F 2018F
Avg: 13.4x
+1sd: 16.6x
+2sd: 19.8x
‐1sd: 10.1x
‐2sd: 6.9x6.2
8.2
10.2
12.2
14.2
16.2
18.2
20.2
Dec-12 Dec-13 Dec-14 Dec-15
(x)
Avg: 1.26x
+1sd: 1.6x
+2sd: 1.94x
‐1sd: 0.93x
‐2sd: 0.59x0.5
0.7
0.9
1.1
1.3
1.5
1.7
1.9
2.1
2.3
Dec-12 Dec-13 Dec-14 Dec-15
(x)
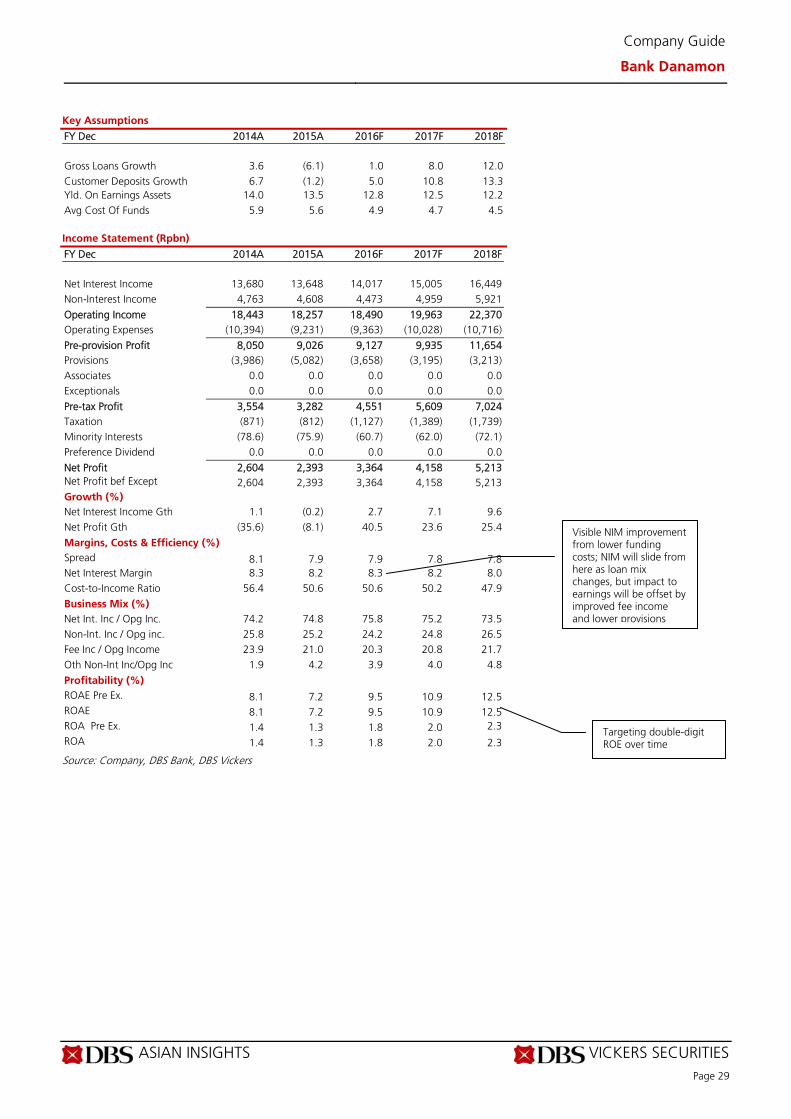
ASIAN INSIGHTS VICKERS SECURITIES Page 29
Company Guide
Bank Danamon
Key Assumptions
FY Dec 2014A 2015A 2016F 2017F 2018F
Gross Loans Growth 3.6 (6.1) 1.0 8.0 12.0 Customer Deposits Growth 6.7 (1.2) 5.0 10.8 13.3 Yld. On Earnings Assets 14.0 13.5 12.8 12.5 12.2 Avg Cost Of Funds 5.9 5.6 4.9 4.7 4.5 Income Statement (Rpbn)
FY Dec 2014A 2015A 2016F 2017F 2018F Net Interest Income 13,680 13,648 14,017 15,005 16,449 Non-Interest Income 4,763 4,608 4,473 4,959 5,921
Operating Income 18,443 18,257 18,490 19,963 22,370 Operating Expenses (10,394) (9,231) (9,363) (10,028) (10,716)
Pre-provision Profit 8,050 9,026 9,127 9,935 11,654 Provisions (3,986) (5,082) (3,658) (3,195) (3,213) Associates 0.0 0.0 0.0 0.0 0.0 Exceptionals 0.0 0.0 0.0 0.0 0.0
Pre-tax Profit 3,554 3,282 4,551 5,609 7,024 Taxation (871) (812) (1,127) (1,389) (1,739) Minority Interests (78.6) (75.9) (60.7) (62.0) (72.1) Preference Dividend 0.0 0.0 0.0 0.0 0.0
Net Profit 2,604 2,393 3,364 4,158 5,213 Net Profit bef Except 2,604 2,393 3,364 4,158 5,213 Growth (%) Net Interest Income Gth 1.1 (0.2) 2.7 7.1 9.6 Net Profit Gth (35.6) (8.1) 40.5 23.6 25.4
Margins, Costs & Efficiency (%) Spread 8.1 7.9 7.9 7.8 7.8 Net Interest Margin 8.3 8.2 8.3 8.2 8.0 Cost-to-Income Ratio 56.4 50.6 50.6 50.2 47.9
Business Mix (%) Net Int. Inc / Opg Inc. 74.2 74.8 75.8 75.2 73.5 Non-Int. Inc / Opg inc. 25.8 25.2 24.2 24.8 26.5 Fee Inc / Opg Income 23.9 21.0 20.3 20.8 21.7 Oth Non-Int Inc/Opg Inc 1.9 4.2 3.9 4.0 4.8
Profitability (%) ROAE Pre Ex. 8.1 7.2 9.5 10.9 12.5 ROAE 8.1 7.2 9.5 10.9 12.5 ROA Pre Ex. 1.4 1.3 1.8 2.0 2.3 ROA 1.4 1.3 1.8 2.0 2.3
Source: Company, DBS Bank, DBS Vickers
Visible NIM improvement from lower funding costs; NIM will slide from here as loan mix changes, but impact to earnings will be offset by improved fee income and lower provisions
Targeting double-digit ROE over time
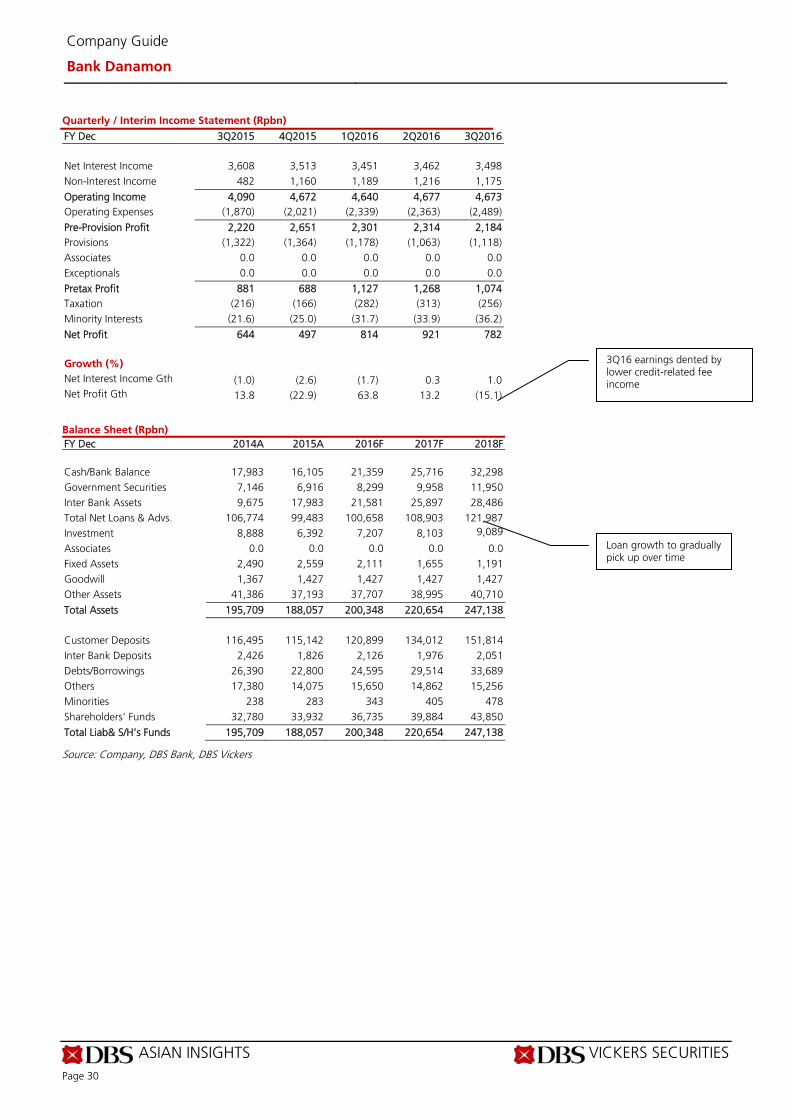
ASIAN INSIGHTS VICKERS SECURITIES Page 30
Company Guide
Bank Danamon
Quarterly / Interim Income Statement (Rpbn)
FY Dec 3Q2015 4Q2015 1Q2016 2Q2016 3Q2016 Net Interest Income 3,608 3,513 3,451 3,462 3,498 Non-Interest Income 482 1,160 1,189 1,216 1,175
Operating Income 4,090 4,672 4,640 4,677 4,673 Operating Expenses (1,870) (2,021) (2,339) (2,363) (2,489)
Pre-Provision Profit 2,220 2,651 2,301 2,314 2,184 Provisions (1,322) (1,364) (1,178) (1,063) (1,118) Associates 0.0 0.0 0.0 0.0 0.0 Exceptionals 0.0 0.0 0.0 0.0 0.0
Pretax Profit 881 688 1,127 1,268 1,074 Taxation (216) (166) (282) (313) (256) Minority Interests (21.6) (25.0) (31.7) (33.9) (36.2)
Net Profit 644 497 814 921 782
Growth (%) Net Interest Income Gth (1.0) (2.6) (1.7) 0.3 1.0 Net Profit Gth 13.8 (22.9) 63.8 13.2 (15.1)
Balance Sheet (Rpbn)
FY Dec 2014A 2015A 2016F 2017F 2018F Cash/Bank Balance 17,983 16,105 21,359 25,716 32,298 Government Securities 7,146 6,916 8,299 9,958 11,950 Inter Bank Assets 9,675 17,983 21,581 25,897 28,486 Total Net Loans & Advs. 106,774 99,483 100,658 108,903 121,987 Investment 8,888 6,392 7,207 8,103 9,089
Associates 0.0 0.0 0.0 0.0 0.0 Fixed Assets 2,490 2,559 2,111 1,655 1,191 Goodwill 1,367 1,427 1,427 1,427 1,427 Other Assets 41,386 37,193 37,707 38,995 40,710
Total Assets 195,709 188,057 200,348 220,654 247,138 Customer Deposits 116,495 115,142 120,899 134,012 151,814 Inter Bank Deposits 2,426 1,826 2,126 1,976 2,051 Debts/Borrowings 26,390 22,800 24,595 29,514 33,689 Others 17,380 14,075 15,650 14,862 15,256 Minorities 238 283 343 405 478 Shareholders' Funds 32,780 33,932 36,735 39,884 43,850
Total Liab& S/H’s Funds 195,709 188,057 200,348 220,654 247,138
Source: Company, DBS Bank, DBS Vickers
3Q16 earnings dented by lower credit-related fee income
Loan growth to gradually pick up over time
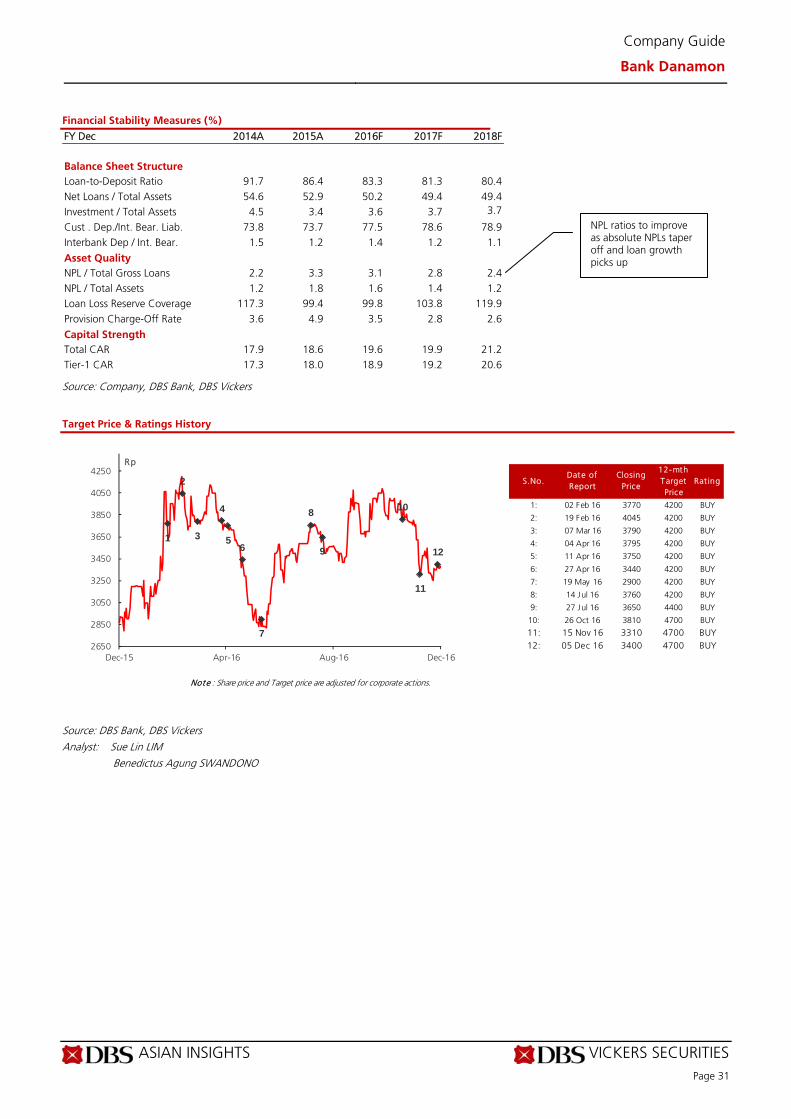
ASIAN INSIGHTS VICKERS SECURITIES Page 31
Company Guide
Bank Danamon
Financial Stability Measures (%)
FY Dec 2014A 2015A 2016F 2017F 2018F Balance Sheet Structure Loan-to-Deposit Ratio 91.7 86.4 83.3 81.3 80.4 Net Loans / Total Assets 54.6 52.9 50.2 49.4 49.4 Investment / Total Assets 4.5 3.4 3.6 3.7 3.7
Cust . Dep./Int. Bear. Liab. 73.8 73.7 77.5 78.6 78.9 Interbank Dep / Int. Bear. 1.5 1.2 1.4 1.2 1.1
Asset Quality NPL / Total Gross Loans 2.2 3.3 3.1 2.8 2.4 NPL / Total Assets 1.2 1.8 1.6 1.4 1.2 Loan Loss Reserve Coverage 117.3 99.4 99.8 103.8 119.9 Provision Charge-Off Rate 3.6 4.9 3.5 2.8 2.6
Capital Strength Total CAR 17.9 18.6 19.6 19.9 21.2 Tier-1 CAR 17.3 18.0 18.9 19.2 20.6
Source: Company, DBS Bank, DBS Vickers
Target Price & Ratings History
Source: DBS Bank, DBS Vickers Analyst: Sue Lin LIM
Benedictus Agung SWANDONO
S.No.Date of Report
Closing Price
12-mth Target Price
Rat ing
1: 02 Feb 16 3770 4200 BUY
2: 19 Feb 16 4045 4200 BUY
3: 07 Mar 16 3790 4200 BUY
4: 04 Apr 16 3795 4200 BUY
5: 11 Apr 16 3750 4200 BUY
6: 27 Apr 16 3440 4200 BUY
7: 19 May 16 2900 4200 BUY
8: 14 Jul 16 3760 4200 BUY
9: 27 Jul 16 3650 4400 BUY
10: 26 Oct 16 3810 4700 BUY
11: 15 Nov 16 3310 4700 BUY12: 05 Dec 16 3400 4700 BUY
Note : Share price and Target price are adjusted for corporate actions.
1
2
3
4
56
7
8
9
10
11
12
2650
2850
3050
3250
3450
3650
3850
4050
4250
Dec-15 Apr-16 Aug-16 Dec-16
Rp
NPL ratios to improve as absolute NPLs taper off and loan growth picks up
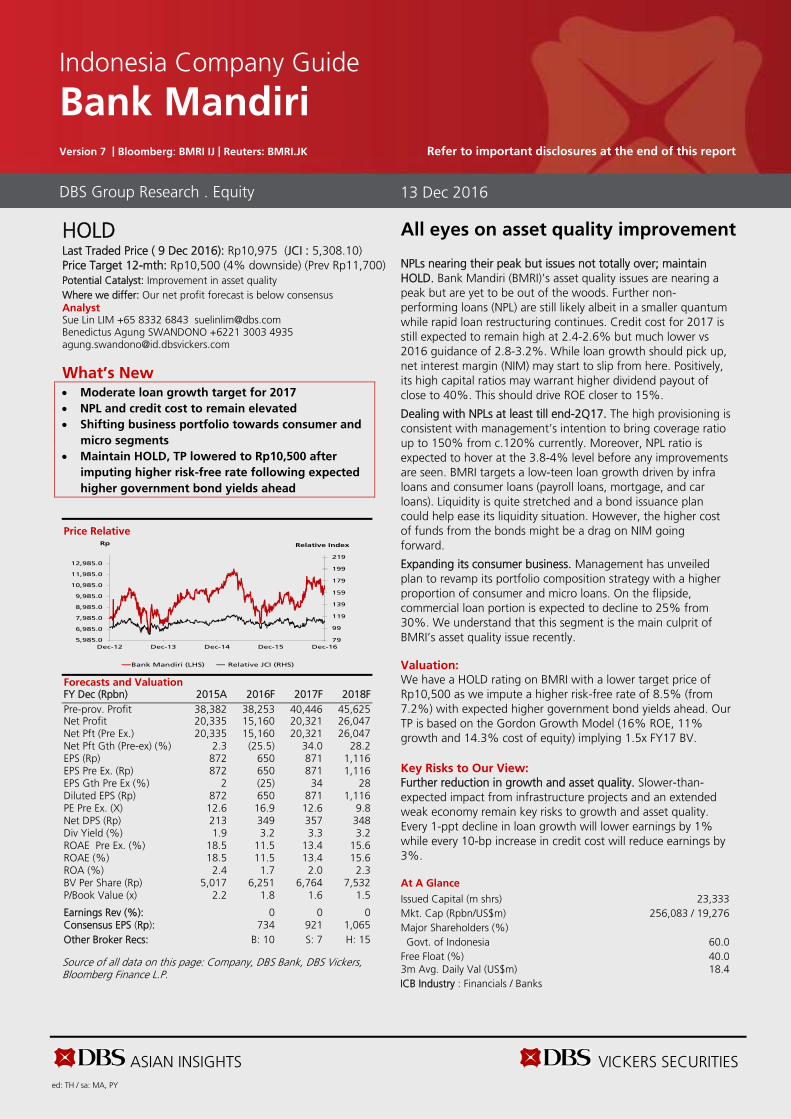
ASIAN INSIGHTS VICKERS SECURITIES ed: TH / sa: MA, PY
HOLD Last Traded Price ( 9 Dec 2016): Rp10,975 (JCI : 5,308.10) Price Target 12-mth: Rp10,500 (4% downside) (Prev Rp11,700) Potential Catalyst: Improvement in asset quality Where we differ: Our net profit forecast is below consensus Analyst Sue Lin LIM +65 8332 6843 [email protected] Benedictus Agung SWANDONO +6221 3003 4935 [email protected]
What’s New Moderate loan growth target for 2017
NPL and credit cost to remain elevated Shifting business portfolio towards consumer and
micro segments Maintain HOLD, TP lowered to Rp10,500 after
imputing higher risk-free rate following expected
higher government bond yields ahead
Price Relative
Forecasts and Valuation FY Dec (Rpbn) 2015A 2016F 2017F 2018F Pre-prov. Profit 38,382 38,253 40,446 45,625 Net Profit 20,335 15,160 20,321 26,047 Net Pft (Pre Ex.) 20,335 15,160 20,321 26,047 Net Pft Gth (Pre-ex) (%) 2.3 (25.5) 34.0 28.2 EPS (Rp) 872 650 871 1,116 EPS Pre Ex. (Rp) 872 650 871 1,116 EPS Gth Pre Ex (%) 2 (25) 34 28 Diluted EPS (Rp) 872 650 871 1,116 PE Pre Ex. (X) 12.6 16.9 12.6 9.8 Net DPS (Rp) 213 349 357 348 Div Yield (%) 1.9 3.2 3.3 3.2 ROAE Pre Ex. (%) 18.5 11.5 13.4 15.6 ROAE (%) 18.5 11.5 13.4 15.6 ROA (%) 2.4 1.7 2.0 2.3 BV Per Share (Rp) 5,017 6,251 6,764 7,532 P/Book Value (x) 2.2 1.8 1.6 1.5 Earnings Rev (%): 0 0 0 Consensus EPS (Rp): 734 921 1,065 Other Broker Recs: B: 10 S: 7 H: 15
Source of all data on this page: Company, DBS Bank, DBS Vickers, Bloomberg Finance L.P.
All eyes on asset quality improvement
NPLs nearing their peak but issues not totally over; maintain HOLD. Bank Mandiri (BMRI)’s asset quality issues are nearing a peak but are yet to be out of the woods. Further non-performing loans (NPL) are still likely albeit in a smaller quantum while rapid loan restructuring continues. Credit cost for 2017 is still expected to remain high at 2.4-2.6% but much lower vs 2016 guidance of 2.8-3.2%. While loan growth should pick up, net interest margin (NIM) may start to slip from here. Positively, its high capital ratios may warrant higher dividend payout of close to 40%. This should drive ROE closer to 15%.
Dealing with NPLs at least till end-2Q17. The high provisioning is consistent with management’s intention to bring coverage ratio up to 150% from c.120% currently. Moreover, NPL ratio is expected to hover at the 3.8-4% level before any improvements are seen. BMRI targets a low-teen loan growth driven by infra loans and consumer loans (payroll loans, mortgage, and car loans). Liquidity is quite stretched and a bond issuance plan could help ease its liquidity situation. However, the higher cost of funds from the bonds might be a drag on NIM going forward.
Expanding its consumer business. Management has unveiled plan to revamp its portfolio composition strategy with a higher proportion of consumer and micro loans. On the flipside, commercial loan portion is expected to decline to 25% from 30%. We understand that this segment is the main culprit of BMRI’s asset quality issue recently. Valuation: We have a HOLD rating on BMRI with a lower target price of Rp10,500 as we impute a higher risk-free rate of 8.5% (from 7.2%) with expected higher government bond yields ahead. Our TP is based on the Gordon Growth Model (16% ROE, 11% growth and 14.3% cost of equity) implying 1.5x FY17 BV. Key Risks to Our View: Further reduction in growth and asset quality. Slower-than- expected impact from infrastructure projects and an extended weak economy remain key risks to growth and asset quality. Every 1-ppt decline in loan growth will lower earnings by 1% while every 10-bp increase in credit cost will reduce earnings by 3%. At A Glance Issued Capital (m shrs) 23,333 Mkt. Cap (Rpbn/US$m) 256,083 / 19,276 Major Shareholders (%) Govt. of Indonesia 60.0
Free Float (%) 40.0 3m Avg. Daily Val (US$m) 18.4 ICB Industry : Financials / Banks
DBS Group Research . Equity 13 Dec 2016
Indonesia Company Guide
Bank Mandiri Version 7 | Bloomberg: BMRI IJ | Reuters: BMRI.JK Refer to important disclosures at the end of this report
79
99
119
139
159
179
199
219
5,985.0
6,985.0
7,985.0
8,985.0
9,985.0
10,985.0
11,985.0
12,985.0
Dec-12 Dec-13 Dec-14 Dec-15 Dec-16
Relative IndexRp
Bank Mandiri (LHS) Relative JCI (RHS)
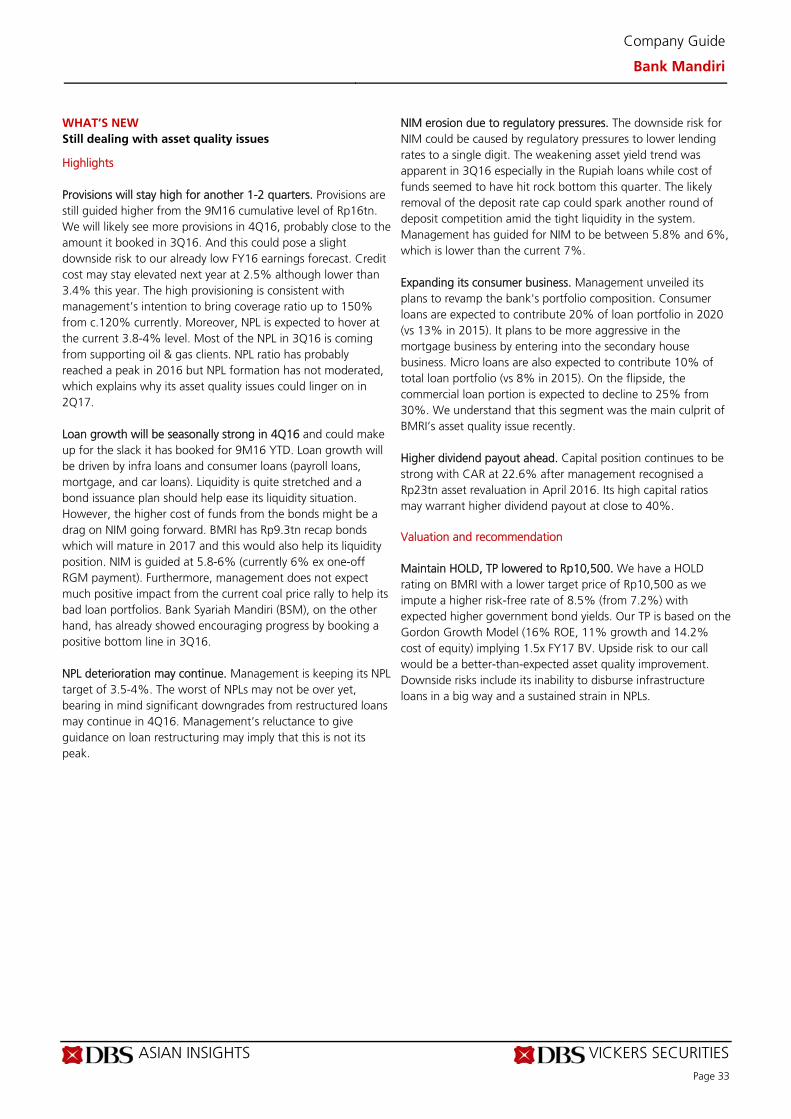
ASIAN INSIGHTS VICKERS SECURITIES Page 33
Company Guide
Bank Mandiri
WHAT’S NEW
Still dealing with asset quality issues
Highlights Provisions will stay high for another 1-2 quarters. Provisions are still guided higher from the 9M16 cumulative level of Rp16tn. We will likely see more provisions in 4Q16, probably close to the amount it booked in 3Q16. And this could pose a slight downside risk to our already low FY16 earnings forecast. Credit cost may stay elevated next year at 2.5% although lower than 3.4% this year. The high provisioning is consistent with management’s intention to bring coverage ratio up to 150% from c.120% currently. Moreover, NPL is expected to hover at the current 3.8-4% level. Most of the NPL in 3Q16 is coming from supporting oil & gas clients. NPL ratio has probably reached a peak in 2016 but NPL formation has not moderated, which explains why its asset quality issues could linger on in 2Q17. Loan growth will be seasonally strong in 4Q16 and could make up for the slack it has booked for 9M16 YTD. Loan growth will be driven by infra loans and consumer loans (payroll loans, mortgage, and car loans). Liquidity is quite stretched and a bond issuance plan should help ease its liquidity situation. However, the higher cost of funds from the bonds might be a drag on NIM going forward. BMRI has Rp9.3tn recap bonds which will mature in 2017 and this would also help its liquidity position. NIM is guided at 5.8-6% (currently 6% ex one-off RGM payment). Furthermore, management does not expect much positive impact from the current coal price rally to help its bad loan portfolios. Bank Syariah Mandiri (BSM), on the other hand, has already showed encouraging progress by booking a positive bottom line in 3Q16. NPL deterioration may continue. Management is keeping its NPL target of 3.5-4%. The worst of NPLs may not be over yet, bearing in mind significant downgrades from restructured loans may continue in 4Q16. Management’s reluctance to give guidance on loan restructuring may imply that this is not its peak.
NIM erosion due to regulatory pressures. The downside risk for NIM could be caused by regulatory pressures to lower lending rates to a single digit. The weakening asset yield trend was apparent in 3Q16 especially in the Rupiah loans while cost of funds seemed to have hit rock bottom this quarter. The likely removal of the deposit rate cap could spark another round of deposit competition amid the tight liquidity in the system. Management has guided for NIM to be between 5.8% and 6%, which is lower than the current 7%. Expanding its consumer business. Management unveiled its plans to revamp the bank's portfolio composition. Consumer loans are expected to contribute 20% of loan portfolio in 2020 (vs 13% in 2015). It plans to be more aggressive in the mortgage business by entering into the secondary house business. Micro loans are also expected to contribute 10% of total loan portfolio (vs 8% in 2015). On the flipside, the commercial loan portion is expected to decline to 25% from 30%. We understand that this segment was the main culprit of BMRI’s asset quality issue recently. Higher dividend payout ahead. Capital position continues to be strong with CAR at 22.6% after management recognised a Rp23tn asset revaluation in April 2016. Its high capital ratios may warrant higher dividend payout at close to 40%. Valuation and recommendation Maintain HOLD, TP lowered to Rp10,500. We have a HOLD rating on BMRI with a lower target price of Rp10,500 as we impute a higher risk-free rate of 8.5% (from 7.2%) with expected higher government bond yields. Our TP is based on the Gordon Growth Model (16% ROE, 11% growth and 14.2% cost of equity) implying 1.5x FY17 BV. Upside risk to our call would be a better-than-expected asset quality improvement. Downside risks include its inability to disburse infrastructure loans in a big way and a sustained strain in NPLs.
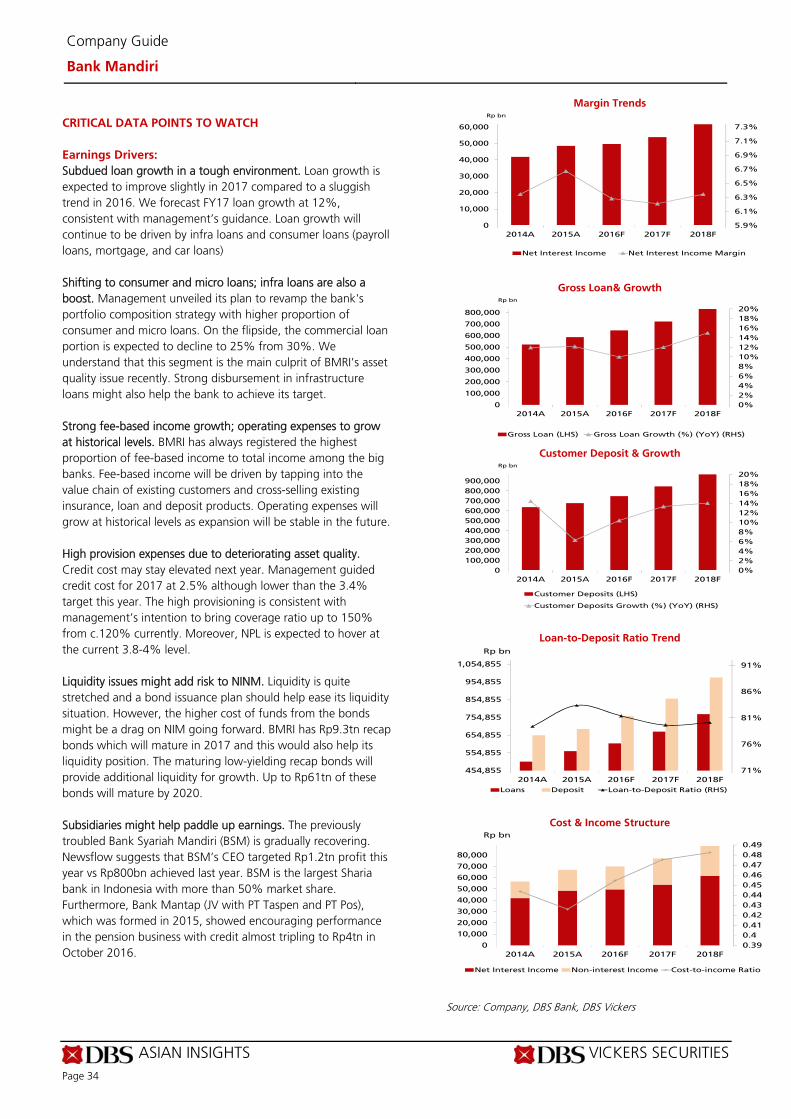
ASIAN INSIGHTS VICKERS SECURITIES Page 34
Company Guide
Bank Mandiri
CRITICAL DATA POINTS TO WATCH
Earnings Drivers:
Subdued loan growth in a tough environment. Loan growth is expected to improve slightly in 2017 compared to a sluggish trend in 2016. We forecast FY17 loan growth at 12%, consistent with management’s guidance. Loan growth will continue to be driven by infra loans and consumer loans (payroll loans, mortgage, and car loans) Shifting to consumer and micro loans; infra loans are also a boost. Management unveiled its plan to revamp the bank's portfolio composition strategy with higher proportion of consumer and micro loans. On the flipside, the commercial loan portion is expected to decline to 25% from 30%. We understand that this segment is the main culprit of BMRI’s asset quality issue recently. Strong disbursement in infrastructure loans might also help the bank to achieve its target. Strong fee-based income growth; operating expenses to grow at historical levels. BMRI has always registered the highest proportion of fee-based income to total income among the big banks. Fee-based income will be driven by tapping into the value chain of existing customers and cross-selling existing insurance, loan and deposit products. Operating expenses will grow at historical levels as expansion will be stable in the future. High provision expenses due to deteriorating asset quality. Credit cost may stay elevated next year. Management guided credit cost for 2017 at 2.5% although lower than the 3.4% target this year. The high provisioning is consistent with management’s intention to bring coverage ratio up to 150% from c.120% currently. Moreover, NPL is expected to hover at the current 3.8-4% level. Liquidity issues might add risk to NINM. Liquidity is quite stretched and a bond issuance plan should help ease its liquidity situation. However, the higher cost of funds from the bonds might be a drag on NIM going forward. BMRI has Rp9.3tn recap bonds which will mature in 2017 and this would also help its liquidity position. The maturing low-yielding recap bonds will provide additional liquidity for growth. Up to Rp61tn of these bonds will mature by 2020. Subsidiaries might help paddle up earnings. The previously troubled Bank Syariah Mandiri (BSM) is gradually recovering. Newsflow suggests that BSM’s CEO targeted Rp1.2tn profit this year vs Rp800bn achieved last year. BSM is the largest Sharia bank in Indonesia with more than 50% market share. Furthermore, Bank Mantap (JV with PT Taspen and PT Pos), which was formed in 2015, showed encouraging performance in the pension business with credit almost tripling to Rp4tn in October 2016.
Margin Trends
Gross Loan& Growth
Customer Deposit & Growth
Loan-to-Deposit Ratio Trend
Cost & Income Structure
Source: Company, DBS Bank, DBS Vickers
5.9%
6.1%
6.3%
6.5%
6.7%
6.9%
7.1%
7.3%
0
10,000
20,000
30,000
40,000
50,000
60,000
2014A 2015A 2016F 2017F 2018F
Rp bn
Net Interest Income Net Interest Income Margin
0%
2%
4%
6%
8%
10%
12%
14%
16%
18%
20%
0
100,000
200,000
300,000
400,000
500,000
600,000
700,000
800,000
2014A 2015A 2016F 2017F 2018F
Rp bn
Gross Loan (LHS) Gross Loan Growth (%) (YoY) (RHS)
0%
2%
4%
6%
8%
10%
12%
14%
16%
18%
20%
0
100,000
200,000
300,000
400,000
500,000
600,000
700,000
800,000
900,000
2014A 2015A 2016F 2017F 2018F
Rp bn
Customer Deposits (LHS)
Customer Deposits Growth (%) (YoY) (RHS)
71%
76%
81%
86%
91%
454,855
554,855
654,855
754,855
854,855
954,855
1,054,855
2014A 2015A 2016F 2017F 2018F
Rp bn
Loans Deposit Loan-to-Deposit Ratio (RHS)
0.39
0.4
0.41
0.42
0.43
0.44
0.45
0.46
0.47
0.48
0.49
0
10,000
20,000
30,000
40,000
50,000
60,000
70,000
80,000
2014A 2015A 2016F 2017F 2018F
Rp bn
Net Interest Income Non-interest Income Cost-to-income Ratio
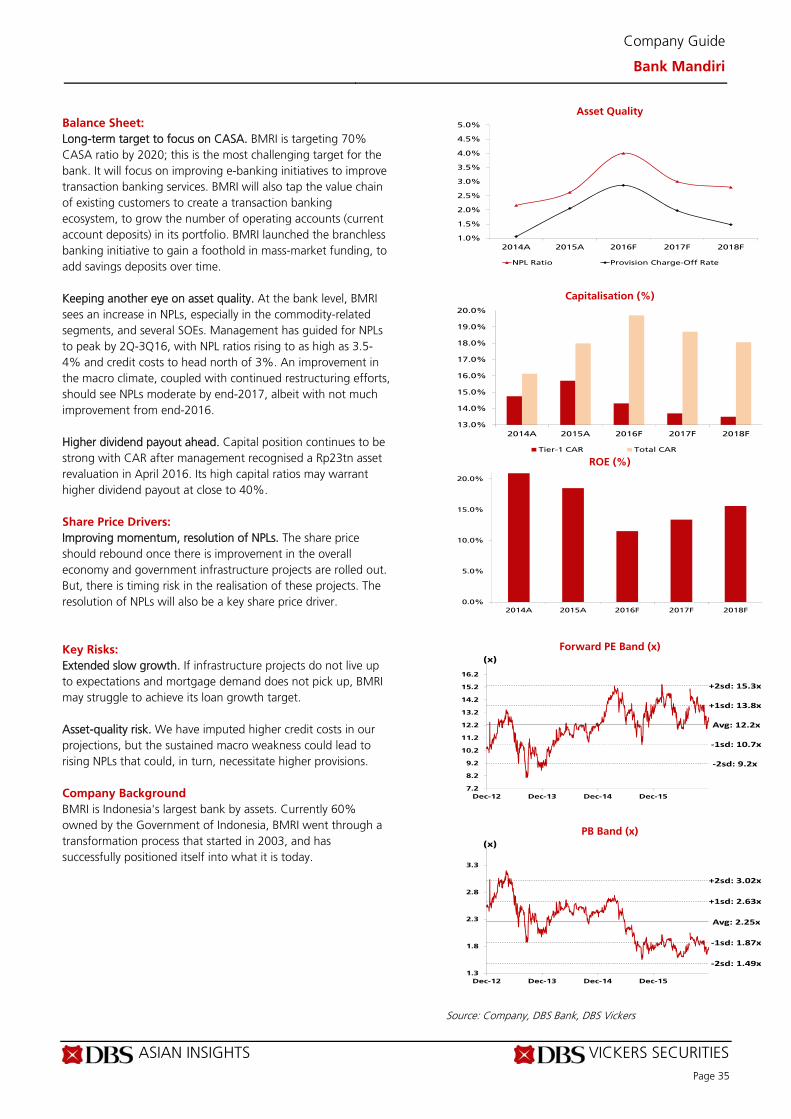
ASIAN INSIGHTS VICKERS SECURITIES Page 35
Company Guide
Bank Mandiri
Balance Sheet:
Long-term target to focus on CASA. BMRI is targeting 70% CASA ratio by 2020; this is the most challenging target for the bank. It will focus on improving e-banking initiatives to improve transaction banking services. BMRI will also tap the value chain of existing customers to create a transaction banking ecosystem, to grow the number of operating accounts (current account deposits) in its portfolio. BMRI launched the branchless banking initiative to gain a foothold in mass-market funding, to add savings deposits over time. Keeping another eye on asset quality. At the bank level, BMRI sees an increase in NPLs, especially in the commodity-related segments, and several SOEs. Management has guided for NPLs to peak by 2Q-3Q16, with NPL ratios rising to as high as 3.5-4% and credit costs to head north of 3%. An improvement in the macro climate, coupled with continued restructuring efforts, should see NPLs moderate by end-2017, albeit with not much improvement from end-2016. Higher dividend payout ahead. Capital position continues to be strong with CAR after management recognised a Rp23tn asset revaluation in April 2016. Its high capital ratios may warrant higher dividend payout at close to 40%. Share Price Drivers:
Improving momentum, resolution of NPLs. The share price should rebound once there is improvement in the overall economy and government infrastructure projects are rolled out. But, there is timing risk in the realisation of these projects. The resolution of NPLs will also be a key share price driver. Key Risks:
Extended slow growth. If infrastructure projects do not live up to expectations and mortgage demand does not pick up, BMRI may struggle to achieve its loan growth target. Asset-quality risk. We have imputed higher credit costs in our projections, but the sustained macro weakness could lead to rising NPLs that could, in turn, necessitate higher provisions. Company Background
BMRI is Indonesia's largest bank by assets. Currently 60% owned by the Government of Indonesia, BMRI went through a transformation process that started in 2003, and has successfully positioned itself into what it is today.
Asset Quality
Capitalisation (%)
ROE (%)
Forward PE Band (x)
PB Band (x)
Source: Company, DBS Bank, DBS Vickers
1.0%
1.5%
2.0%
2.5%
3.0%
3.5%
4.0%
4.5%
5.0%
2014A 2015A 2016F 2017F 2018F
NPL Ratio Provision Charge-Off Rate
13.0%
14.0%
15.0%
16.0%
17.0%
18.0%
19.0%
20.0%
2014A 2015A 2016F 2017F 2018F
Tier-1 CAR Total CAR
0.0%
5.0%
10.0%
15.0%
20.0%
2014A 2015A 2016F 2017F 2018F
Avg: 12.2x
+1sd: 13.8x
+2sd: 15.3x
‐1sd: 10.7x
‐2sd: 9.2x
7.2
8.2
9.2
10.2
11.2
12.2
13.2
14.2
15.2
16.2
Dec-12 Dec-13 Dec-14 Dec-15
(x)
Avg: 2.25x
+1sd: 2.63x
+2sd: 3.02x
‐1sd: 1.87x
‐2sd: 1.49x1.3
1.8
2.3
2.8
3.3
Dec-12 Dec-13 Dec-14 Dec-15
(x)
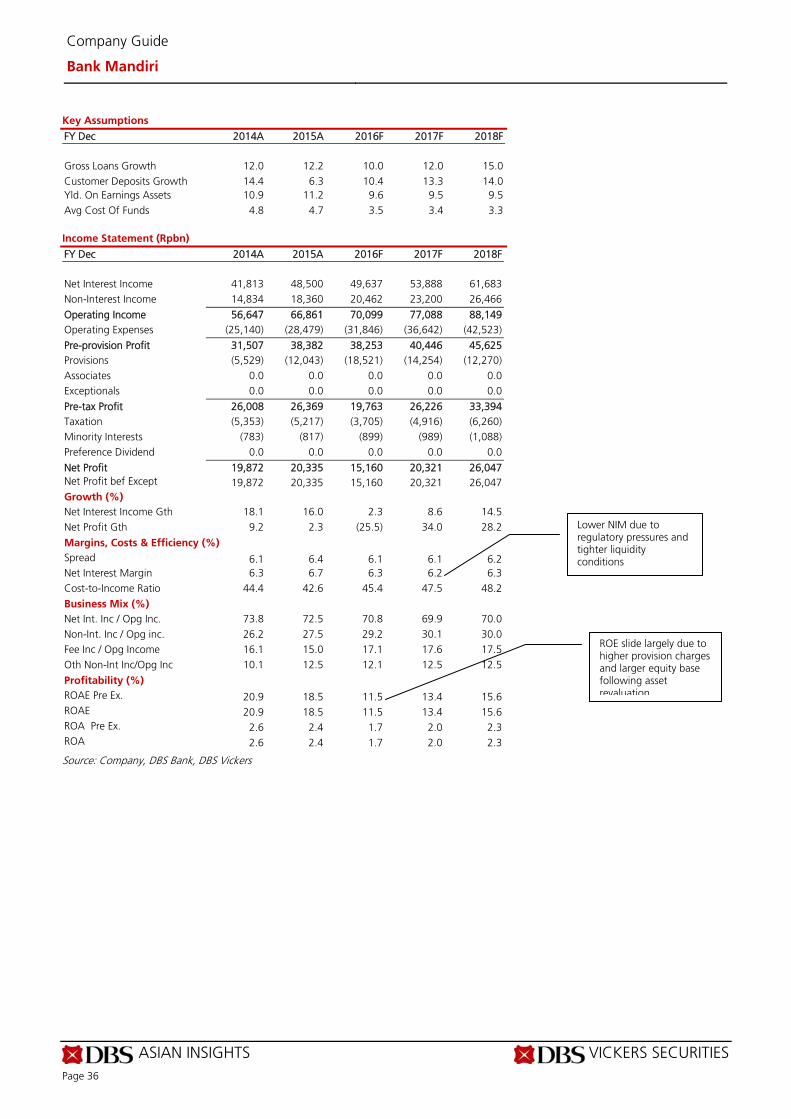
ASIAN INSIGHTS VICKERS SECURITIES Page 36
Company Guide
Bank Mandiri
Key Assumptions
FY Dec 2014A 2015A 2016F 2017F 2018F
Gross Loans Growth 12.0 12.2 10.0 12.0 15.0 Customer Deposits Growth 14.4 6.3 10.4 13.3 14.0 Yld. On Earnings Assets 10.9 11.2 9.6 9.5 9.5 Avg Cost Of Funds 4.8 4.7 3.5 3.4 3.3 Income Statement (Rpbn)
FY Dec 2014A 2015A 2016F 2017F 2018F Net Interest Income 41,813 48,500 49,637 53,888 61,683 Non-Interest Income 14,834 18,360 20,462 23,200 26,466
Operating Income 56,647 66,861 70,099 77,088 88,149 Operating Expenses (25,140) (28,479) (31,846) (36,642) (42,523)
Pre-provision Profit 31,507 38,382 38,253 40,446 45,625 Provisions (5,529) (12,043) (18,521) (14,254) (12,270) Associates 0.0 0.0 0.0 0.0 0.0 Exceptionals 0.0 0.0 0.0 0.0 0.0
Pre-tax Profit 26,008 26,369 19,763 26,226 33,394 Taxation (5,353) (5,217) (3,705) (4,916) (6,260) Minority Interests (783) (817) (899) (989) (1,088) Preference Dividend 0.0 0.0 0.0 0.0 0.0
Net Profit 19,872 20,335 15,160 20,321 26,047 Net Profit bef Except 19,872 20,335 15,160 20,321 26,047 Growth (%) Net Interest Income Gth 18.1 16.0 2.3 8.6 14.5 Net Profit Gth 9.2 2.3 (25.5) 34.0 28.2
Margins, Costs & Efficiency (%) Spread 6.1 6.4 6.1 6.1 6.2 Net Interest Margin 6.3 6.7 6.3 6.2 6.3 Cost-to-Income Ratio 44.4 42.6 45.4 47.5 48.2
Business Mix (%) Net Int. Inc / Opg Inc. 73.8 72.5 70.8 69.9 70.0 Non-Int. Inc / Opg inc. 26.2 27.5 29.2 30.1 30.0 Fee Inc / Opg Income 16.1 15.0 17.1 17.6 17.5 Oth Non-Int Inc/Opg Inc 10.1 12.5 12.1 12.5 12.5
Profitability (%) ROAE Pre Ex. 20.9 18.5 11.5 13.4 15.6 ROAE 20.9 18.5 11.5 13.4 15.6 ROA Pre Ex. 2.6 2.4 1.7 2.0 2.3 ROA 2.6 2.4 1.7 2.0 2.3
Source: Company, DBS Bank, DBS Vickers
Lower NIM due to regulatory pressures and tighter liquidity conditions
ROE slide largely due to higher provision charges and larger equity base following asset revaluation
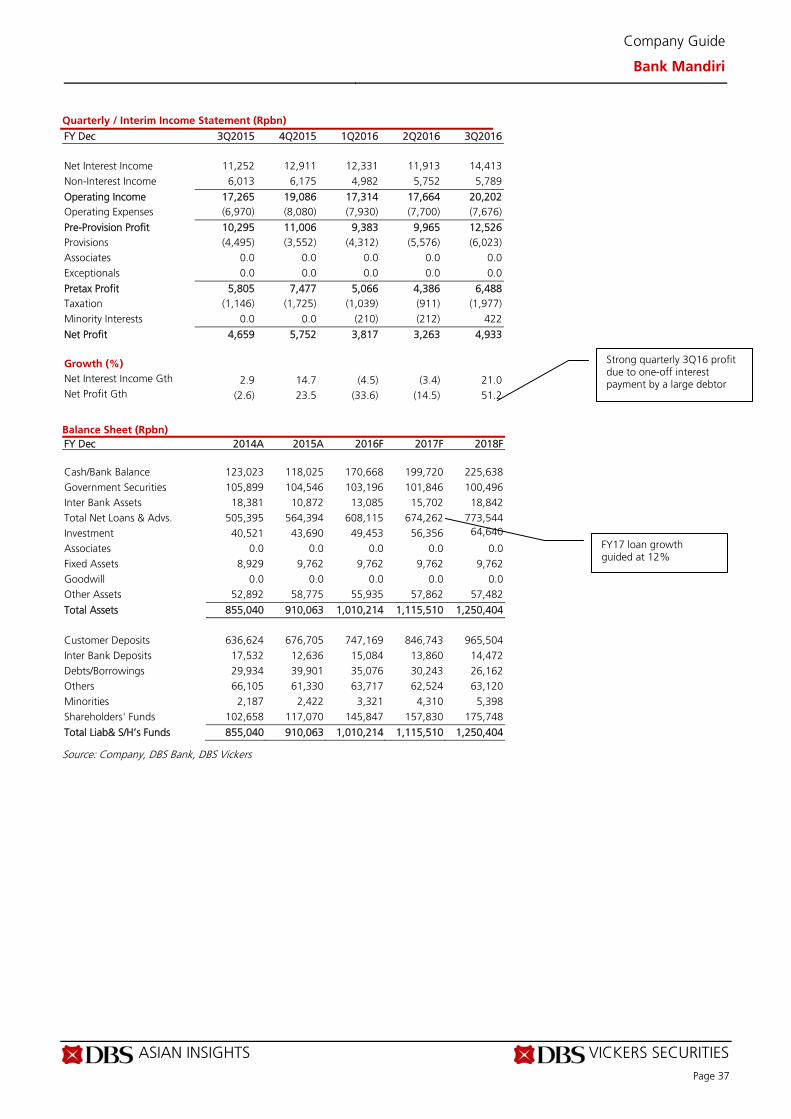
ASIAN INSIGHTS VICKERS SECURITIES Page 37
Company Guide
Bank Mandiri
Quarterly / Interim Income Statement (Rpbn)
FY Dec 3Q2015 4Q2015 1Q2016 2Q2016 3Q2016 Net Interest Income 11,252 12,911 12,331 11,913 14,413 Non-Interest Income 6,013 6,175 4,982 5,752 5,789
Operating Income 17,265 19,086 17,314 17,664 20,202 Operating Expenses (6,970) (8,080) (7,930) (7,700) (7,676)
Pre-Provision Profit 10,295 11,006 9,383 9,965 12,526 Provisions (4,495) (3,552) (4,312) (5,576) (6,023) Associates 0.0 0.0 0.0 0.0 0.0 Exceptionals 0.0 0.0 0.0 0.0 0.0
Pretax Profit 5,805 7,477 5,066 4,386 6,488 Taxation (1,146) (1,725) (1,039) (911) (1,977) Minority Interests 0.0 0.0 (210) (212) 422
Net Profit 4,659 5,752 3,817 3,263 4,933
Growth (%) Net Interest Income Gth 2.9 14.7 (4.5) (3.4) 21.0 Net Profit Gth (2.6) 23.5 (33.6) (14.5) 51.2
Balance Sheet (Rpbn)
FY Dec 2014A 2015A 2016F 2017F 2018F Cash/Bank Balance 123,023 118,025 170,668 199,720 225,638 Government Securities 105,899 104,546 103,196 101,846 100,496 Inter Bank Assets 18,381 10,872 13,085 15,702 18,842 Total Net Loans & Advs. 505,395 564,394 608,115 674,262 773,544 Investment 40,521 43,690 49,453 56,356 64,640
Associates 0.0 0.0 0.0 0.0 0.0 Fixed Assets 8,929 9,762 9,762 9,762 9,762 Goodwill 0.0 0.0 0.0 0.0 0.0 Other Assets 52,892 58,775 55,935 57,862 57,482
Total Assets 855,040 910,063 1,010,214 1,115,510 1,250,404 Customer Deposits 636,624 676,705 747,169 846,743 965,504 Inter Bank Deposits 17,532 12,636 15,084 13,860 14,472 Debts/Borrowings 29,934 39,901 35,076 30,243 26,162 Others 66,105 61,330 63,717 62,524 63,120 Minorities 2,187 2,422 3,321 4,310 5,398 Shareholders' Funds 102,658 117,070 145,847 157,830 175,748
Total Liab& S/H’s Funds 855,040 910,063 1,010,214 1,115,510 1,250,404
Source: Company, DBS Bank, DBS Vickers
Strong quarterly 3Q16 profit due to one-off interest payment by a large debtor
FY17 loan growth guided at 12%
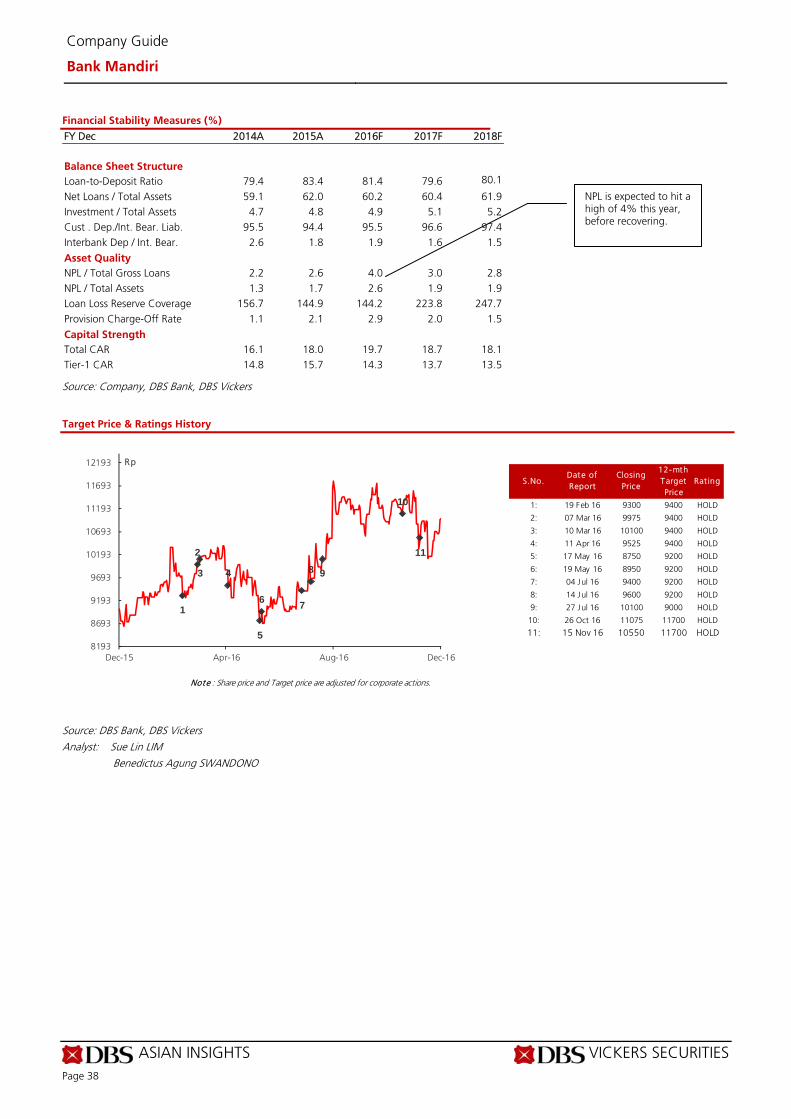
ASIAN INSIGHTS VICKERS SECURITIES Page 38
Company Guide
Bank Mandiri
Financial Stability Measures (%)
FY Dec 2014A 2015A 2016F 2017F 2018F Balance Sheet Structure Loan-to-Deposit Ratio 79.4 83.4 81.4 79.6 80.1
Net Loans / Total Assets 59.1 62.0 60.2 60.4 61.9 Investment / Total Assets 4.7 4.8 4.9 5.1 5.2 Cust . Dep./Int. Bear. Liab. 95.5 94.4 95.5 96.6 97.4 Interbank Dep / Int. Bear. 2.6 1.8 1.9 1.6 1.5
Asset Quality NPL / Total Gross Loans 2.2 2.6 4.0 3.0 2.8 NPL / Total Assets 1.3 1.7 2.6 1.9 1.9 Loan Loss Reserve Coverage 156.7 144.9 144.2 223.8 247.7 Provision Charge-Off Rate 1.1 2.1 2.9 2.0 1.5
Capital Strength Total CAR 16.1 18.0 19.7 18.7 18.1 Tier-1 CAR 14.8 15.7 14.3 13.7 13.5
Source: Company, DBS Bank, DBS Vickers
Target Price & Ratings History
Source: DBS Bank, DBS Vickers Analyst: Sue Lin LIM
Benedictus Agung SWANDONO
S.No.Date of Report
Closing Price
12-mth Target Price
Rat ing
1: 19 Feb 16 9300 9400 HOLD
2: 07 Mar 16 9975 9400 HOLD
3: 10 Mar 16 10100 9400 HOLD
4: 11 Apr 16 9525 9400 HOLD
5: 17 May 16 8750 9200 HOLD
6: 19 May 16 8950 9200 HOLD
7: 04 Jul 16 9400 9200 HOLD
8: 14 Jul 16 9600 9200 HOLD
9: 27 Jul 16 10100 9000 HOLD
10: 26 Oct 16 11075 11700 HOLD
11: 15 Nov 16 10550 11700 HOLD
Note : Share price and Target price are adjusted for corporate actions.
1
2
3 4
5
67
8 9
10
11
8193
8693
9193
9693
10193
10693
11193
11693
12193
Dec-15 Apr-16 Aug-16 Dec-16
Rp
NPL is expected to hit a high of 4% this year, before recovering.
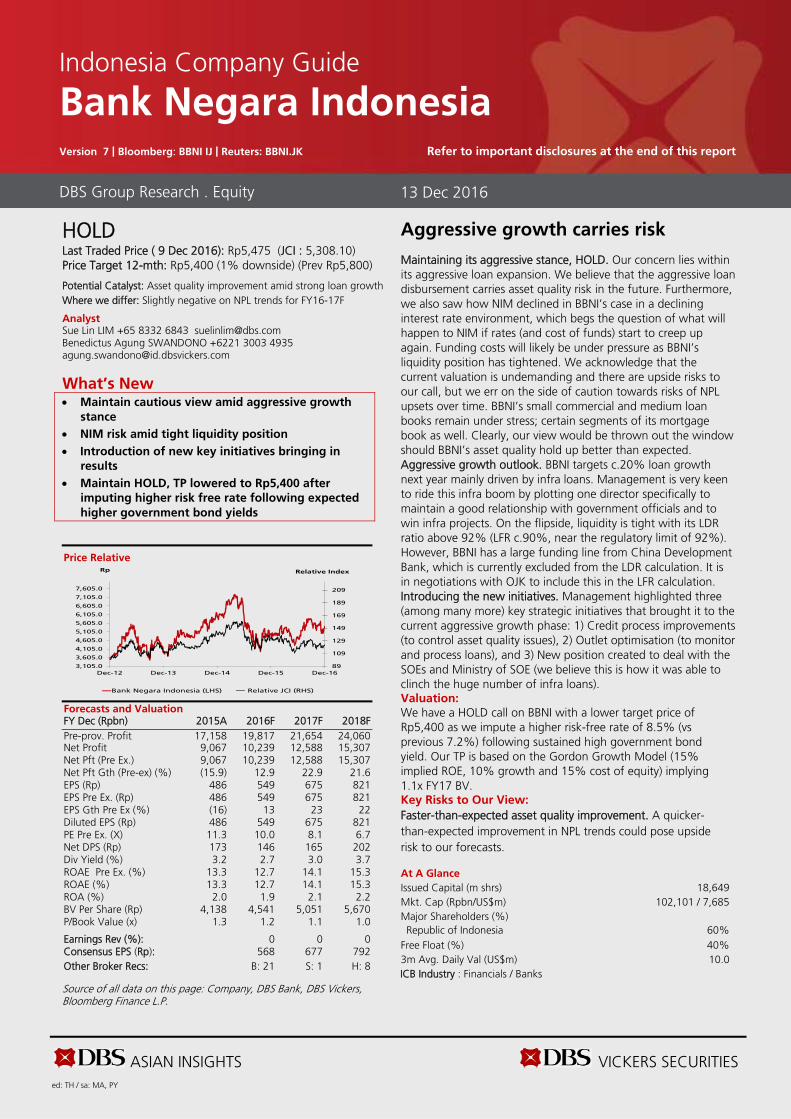
ASIAN INSIGHTS VICKERS SECURITIES ed: TH / sa: MA, PY
HOLD Last Traded Price ( 9 Dec 2016): Rp5,475 (JCI : 5,308.10) Price Target 12-mth: Rp5,400 (1% downside) (Prev Rp5,800)
Potential Catalyst: Asset quality improvement amid strong loan growth Where we differ: Slightly negative on NPL trends for FY16-17F
Analyst Sue Lin LIM +65 8332 6843 [email protected] Benedictus Agung SWANDONO +6221 3003 4935 [email protected]
What’s New Maintain cautious view amid aggressive growth
stance NIM risk amid tight liquidity position Introduction of new key initiatives bringing in
results Maintain HOLD, TP lowered to Rp5,400 after
imputing higher risk free rate following expected
higher government bond yields
Price Relative
Forecasts and Valuation FY Dec (Rpbn) 2015A 2016F 2017F 2018F Pre-prov. Profit 17,158 19,817 21,654 24,060 Net Profit 9,067 10,239 12,588 15,307 Net Pft (Pre Ex.) 9,067 10,239 12,588 15,307 Net Pft Gth (Pre-ex) (%) (15.9) 12.9 22.9 21.6 EPS (Rp) 486 549 675 821 EPS Pre Ex. (Rp) 486 549 675 821 EPS Gth Pre Ex (%) (16) 13 23 22 Diluted EPS (Rp) 486 549 675 821 PE Pre Ex. (X) 11.3 10.0 8.1 6.7 Net DPS (Rp) 173 146 165 202 Div Yield (%) 3.2 2.7 3.0 3.7 ROAE Pre Ex. (%) 13.3 12.7 14.1 15.3 ROAE (%) 13.3 12.7 14.1 15.3 ROA (%) 2.0 1.9 2.1 2.2 BV Per Share (Rp) 4,138 4,541 5,051 5,670 P/Book Value (x) 1.3 1.2 1.1 1.0 Earnings Rev (%): 0 0 0 Consensus EPS (Rp): 568 677 792 Other Broker Recs: B: 21 S: 1 H: 8
Source of all data on this page: Company, DBS Bank, DBS Vickers, Bloomberg Finance L.P.
Aggressive growth carries risk
Maintaining its aggressive stance, HOLD. Our concern lies within its aggressive loan expansion. We believe that the aggressive loan disbursement carries asset quality risk in the future. Furthermore, we also saw how NIM declined in BBNI’s case in a declining interest rate environment, which begs the question of what will happen to NIM if rates (and cost of funds) start to creep up again. Funding costs will likely be under pressure as BBNI’s liquidity position has tightened. We acknowledge that the current valuation is undemanding and there are upside risks to our call, but we err on the side of caution towards risks of NPL upsets over time. BBNI’s small commercial and medium loan books remain under stress; certain segments of its mortgage book as well. Clearly, our view would be thrown out the window should BBNI’s asset quality hold up better than expected. Aggressive growth outlook. BBNI targets c.20% loan growth next year mainly driven by infra loans. Management is very keen to ride this infra boom by plotting one director specifically to maintain a good relationship with government officials and to win infra projects. On the flipside, liquidity is tight with its LDR ratio above 92% (LFR c.90%, near the regulatory limit of 92%). However, BBNI has a large funding line from China Development Bank, which is currently excluded from the LDR calculation. It is in negotiations with OJK to include this in the LFR calculation. Introducing the new initiatives. Management highlighted three (among many more) key strategic initiatives that brought it to the current aggressive growth phase: 1) Credit process improvements (to control asset quality issues), 2) Outlet optimisation (to monitor and process loans), and 3) New position created to deal with the SOEs and Ministry of SOE (we believe this is how it was able to clinch the huge number of infra loans). Valuation: We have a HOLD call on BBNI with a lower target price of Rp5,400 as we impute a higher risk-free rate of 8.5% (vs previous 7.2%) following sustained high government bond yield. Our TP is based on the Gordon Growth Model (15% implied ROE, 10% growth and 15% cost of equity) implying 1.1x FY17 BV. Key Risks to Our View:
Faster-than-expected asset quality improvement. A quicker-than-expected improvement in NPL trends could pose upside risk to our forecasts. At A Glance Issued Capital (m shrs) 18,649 Mkt. Cap (Rpbn/US$m) 102,101 / 7,685 Major Shareholders (%) Republic of Indonesia 60%
Free Float (%) 40% 3m Avg. Daily Val (US$m) 10.0 ICB Industry : Financials / Banks
DBS Group Research . Equity 13 Dec 2016
Indonesia Company Guide
Bank Negara Indonesia Version 7 | Bloomberg: BBNI IJ | Reuters: BBNI.JK Refer to important disclosures at the end of this report
89
109
129
149
169
189
209
3,105.0
3,605.0
4,105.0
4,605.0
5,105.0
5,605.0
6,105.0
6,605.0
7,105.0
7,605.0
Dec-12 Dec-13 Dec-14 Dec-15 Dec-16
Relative IndexRp
Bank Negara Indonesia (LHS) Relative JCI (RHS)
ASIAN INSIGHTS VICKERS SECURITIES Page 40
Company Guide
Bank Negara Indonesia
WHAT’S NEW
Eager beaver
Highlights:
Key strategic initiatives that led to its aggressive growth stance. Management highlighted three (among many more) key strategic initiatives that brought it to the current aggressive growth phase: 1) Credit process improvements (to control asset quality issues), 2) Outlet optimisation (to monitor and process loans), and 3) New position created to deal with the SOEs and Ministry of SOE (we believe this is how it was able to clinch the huge number of infra loans).
Continue to ride the infra boom. Management painted an optimistic outlook going forward, and will continue to aggressively grow its loans. BBNI maintains its aggressive growth target next year that will be driven by infrastructure-related and agriculture sectors.
NIM downtrend may continue. We think the pressure on NIM may persist as we believe the cost of funds has hit rock bottom while asset yield might continue on a downtrend due to loan restructuring (which typically allows debtors to pay lower interest rates), more infrastructure-related loans (usually priced at a single-digit rate), and regulatory pressures to implement the single-digit lending rate. NIM ticked up to 6.2% in 3Q16 from 6.1% in 2Q16 mainly due to one-off interest payment receivables. We expect NIM to hit closer to 6% by end-2016, and further below 6% in FY17F.
Liquidity is tight. Liquidity is tight with its LDR ratio above 92% (LFR c.90%, near the regulatory limit of 92%). However, BBNI has a large chunk of loans from China Development Bank which are currently excluded from the LDR calculation. It is in negotiations with OJK to include these loans in the LFR calculation.
NPL peak not far from the current 3.1%. We noted that the weakening momentum of asset quality deterioration has tapered off. Loans at risk ratio ticked down 20bps q-o-q but it still grew 3% q-o-q in absolute terms. We understand the worst of NPLs may still be ahead of us but we believe the peak should not be far from here. Management indicated a lumpy account could turn into an NPL in 4Q16, which will add another 10-bp increase in NPL ratio to 3.2%. The bank is optimistic that NPL and credit cost should trend lower next year from the current levels of 3.1% and 2.7% respectively. BBNI is expected to maintain its coverage ratio at the current 145% level.
Pockets of NPL issues noted. Loans will continue to be aggressively restructured in coming months. Special-mention loans are still quite high and these are in the small commercial and medium loan segments (the same issue it faced in 2008/09). Notably, there is also NPL formation in its mortgage book. These borrowers are not fixed salaried employees (self-employed) and their businesses are tied to the commodity cycles. We understand that these borrowers tend to speculate on properties. Mortgage NPL ratio is as high as 3.8% (3Q16). Restructuring cases for this segment are high. If the loans cannot be restructured, the bank will proceed to auction the property.
Valuation and recommendation
Maintain HOLD, TP lowered to Rp5,400. We have a HOLD recommendation on BBNI with a lower target price of Rp5,400 as we impute a higher risk-free rate of 8.5% (from 7.2%) with expected high government bond yields. Our TP is based on the Gordon Growth Model (15% implied ROE, 10% growth and 14.5% cost of equity) implying 1.1x FY17 BV.
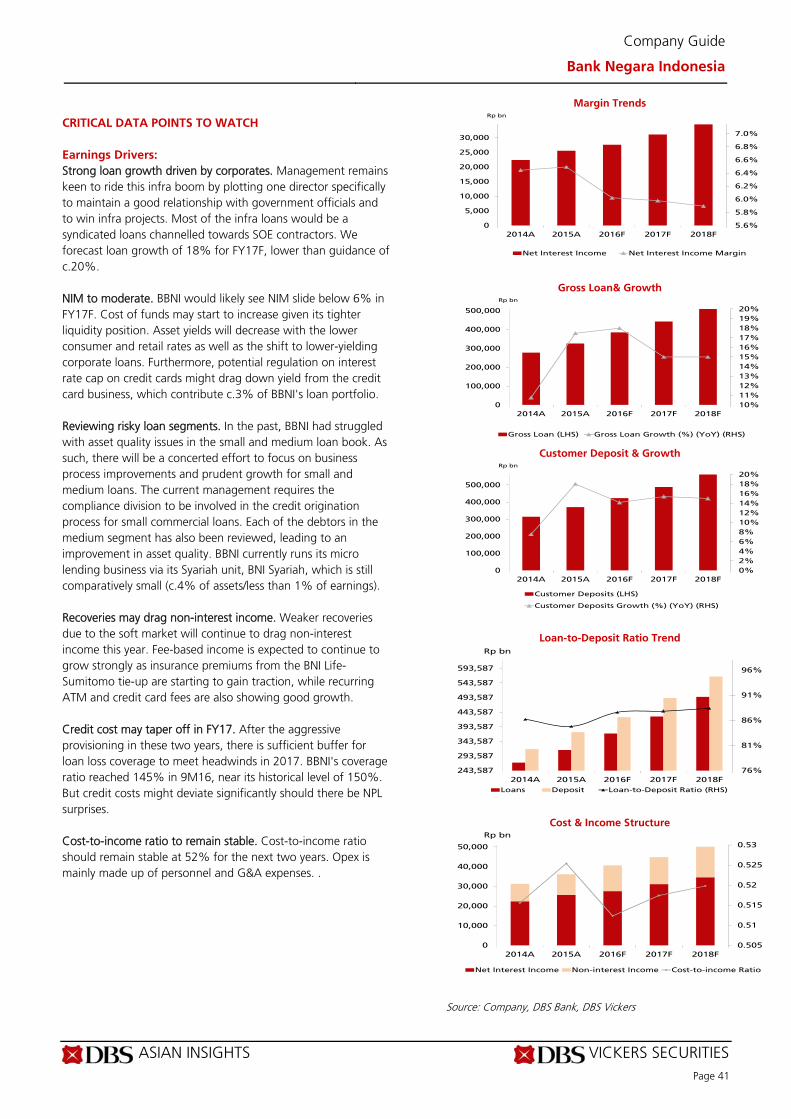
ASIAN INSIGHTS VICKERS SECURITIES Page 41
Company Guide
Bank Negara Indonesia
CRITICAL DATA POINTS TO WATCH
Earnings Drivers:
Strong loan growth driven by corporates. Management remains keen to ride this infra boom by plotting one director specifically to maintain a good relationship with government officials and to win infra projects. Most of the infra loans would be a syndicated loans channelled towards SOE contractors. We forecast loan growth of 18% for FY17F, lower than guidance of c.20%. NIM to moderate. BBNI would likely see NIM slide below 6% in FY17F. Cost of funds may start to increase given its tighter liquidity position. Asset yields will decrease with the lower consumer and retail rates as well as the shift to lower-yielding corporate loans. Furthermore, potential regulation on interest rate cap on credit cards might drag down yield from the credit card business, which contribute c.3% of BBNI's loan portfolio. Reviewing risky loan segments. In the past, BBNI had struggled with asset quality issues in the small and medium loan book. As such, there will be a concerted effort to focus on business process improvements and prudent growth for small and medium loans. The current management requires the compliance division to be involved in the credit origination process for small commercial loans. Each of the debtors in the medium segment has also been reviewed, leading to an improvement in asset quality. BBNI currently runs its micro lending business via its Syariah unit, BNI Syariah, which is still comparatively small (c.4% of assets/less than 1% of earnings). Recoveries may drag non-interest income. Weaker recoveries due to the soft market will continue to drag non-interest income this year. Fee-based income is expected to continue to grow strongly as insurance premiums from the BNI Life-Sumitomo tie-up are starting to gain traction, while recurring ATM and credit card fees are also showing good growth. Credit cost may taper off in FY17. After the aggressive provisioning in these two years, there is sufficient buffer for loan loss coverage to meet headwinds in 2017. BBNI's coverage ratio reached 145% in 9M16, near its historical level of 150%. But credit costs might deviate significantly should there be NPL surprises. Cost-to-income ratio to remain stable. Cost-to-income ratio should remain stable at 52% for the next two years. Opex is mainly made up of personnel and G&A expenses. .
Margin Trends
Gross Loan& Growth
Customer Deposit & Growth
Loan-to-Deposit Ratio Trend
Cost & Income Structure
Source: Company, DBS Bank, DBS Vickers
5.6%
5.8%
6.0%
6.2%
6.4%
6.6%
6.8%
7.0%
0
5,000
10,000
15,000
20,000
25,000
30,000
2014A 2015A 2016F 2017F 2018F
Rp bn
Net Interest Income Net Interest Income Margin
10%
11%
12%
13%
14%
15%
16%
17%
18%
19%
20%
0
100,000
200,000
300,000
400,000
500,000
2014A 2015A 2016F 2017F 2018F
Rp bn
Gross Loan (LHS) Gross Loan Growth (%) (YoY) (RHS)
0%
2%
4%
6%
8%
10%
12%
14%
16%
18%
20%
0
100,000
200,000
300,000
400,000
500,000
2014A 2015A 2016F 2017F 2018F
Rp bn
Customer Deposits (LHS)
Customer Deposits Growth (%) (YoY) (RHS)
76%
81%
86%
91%
96%
243,587
293,587
343,587
393,587
443,587
493,587
543,587
593,587
2014A 2015A 2016F 2017F 2018F
Rp bn
Loans Deposit Loan-to-Deposit Ratio (RHS)
0.505
0.51
0.515
0.52
0.525
0.53
0
10,000
20,000
30,000
40,000
50,000
2014A 2015A 2016F 2017F 2018F
Rp bn
Net Interest Income Non-interest Income Cost-to-income Ratio
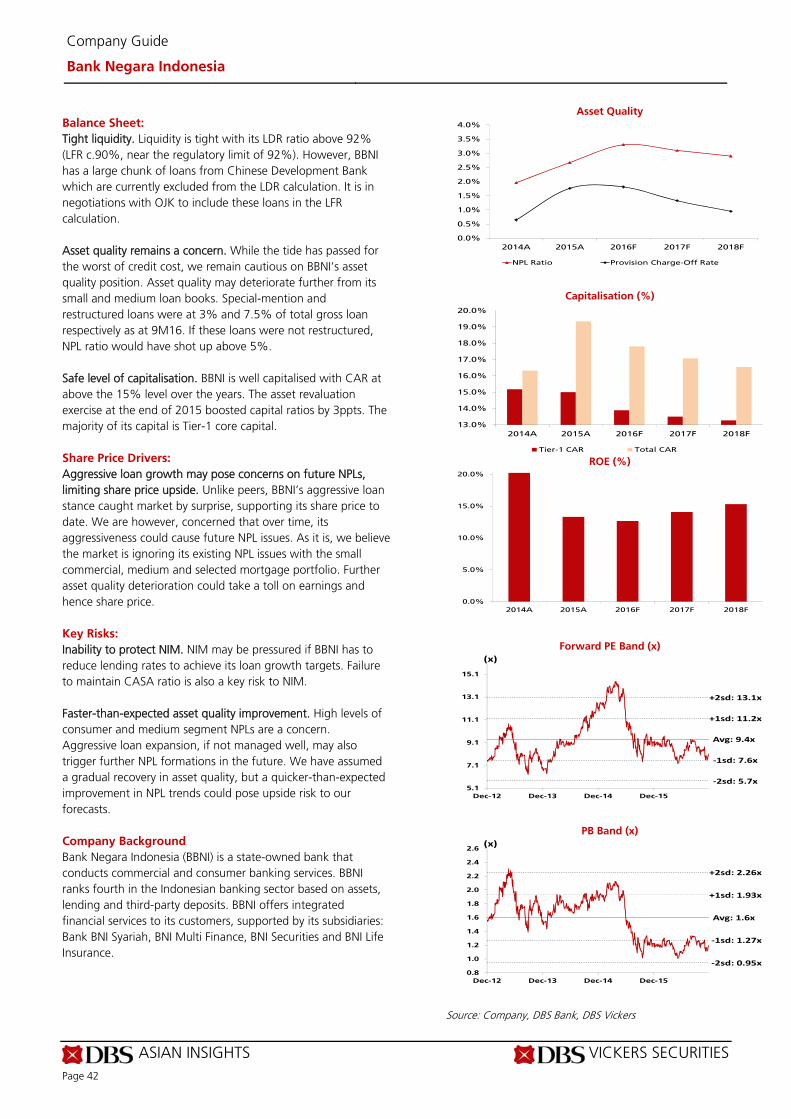
ASIAN INSIGHTS VICKERS SECURITIES Page 42
Company Guide
Bank Negara Indonesia
Balance Sheet:
Tight liquidity. Liquidity is tight with its LDR ratio above 92% (LFR c.90%, near the regulatory limit of 92%). However, BBNI has a large chunk of loans from Chinese Development Bank which are currently excluded from the LDR calculation. It is in negotiations with OJK to include these loans in the LFR calculation. Asset quality remains a concern. While the tide has passed for the worst of credit cost, we remain cautious on BBNI’s asset quality position. Asset quality may deteriorate further from its small and medium loan books. Special-mention and restructured loans were at 3% and 7.5% of total gross loan respectively as at 9M16. If these loans were not restructured, NPL ratio would have shot up above 5%. Safe level of capitalisation. BBNI is well capitalised with CAR at above the 15% level over the years. The asset revaluation exercise at the end of 2015 boosted capital ratios by 3ppts. The majority of its capital is Tier-1 core capital. Share Price Drivers:
Aggressive loan growth may pose concerns on future NPLs, limiting share price upside. Unlike peers, BBNI’s aggressive loan stance caught market by surprise, supporting its share price to date. We are however, concerned that over time, its aggressiveness could cause future NPL issues. As it is, we believe the market is ignoring its existing NPL issues with the small commercial, medium and selected mortgage portfolio. Further asset quality deterioration could take a toll on earnings and hence share price. Key Risks:
Inability to protect NIM. NIM may be pressured if BBNI has to reduce lending rates to achieve its loan growth targets. Failure to maintain CASA ratio is also a key risk to NIM. Faster-than-expected asset quality improvement. High levels of consumer and medium segment NPLs are a concern. Aggressive loan expansion, if not managed well, may also trigger further NPL formations in the future. We have assumed a gradual recovery in asset quality, but a quicker-than-expected improvement in NPL trends could pose upside risk to our forecasts. Company Background
Bank Negara Indonesia (BBNI) is a state-owned bank that conducts commercial and consumer banking services. BBNI ranks fourth in the Indonesian banking sector based on assets, lending and third-party deposits. BBNI offers integrated financial services to its customers, supported by its subsidiaries: Bank BNI Syariah, BNI Multi Finance, BNI Securities and BNI Life Insurance.
Asset Quality
Capitalisation (%)
ROE (%)
Forward PE Band (x)
PB Band (x)
Source: Company, DBS Bank, DBS Vickers
0.0%
0.5%
1.0%
1.5%
2.0%
2.5%
3.0%
3.5%
4.0%
2014A 2015A 2016F 2017F 2018F
NPL Ratio Provision Charge-Off Rate
13.0%
14.0%
15.0%
16.0%
17.0%
18.0%
19.0%
20.0%
2014A 2015A 2016F 2017F 2018F
Tier-1 CAR Total CAR
0.0%
5.0%
10.0%
15.0%
20.0%
2014A 2015A 2016F 2017F 2018F
Avg: 9.4x
+1sd: 11.2x
+2sd: 13.1x
‐1sd: 7.6x
‐2sd: 5.7x5.1
7.1
9.1
11.1
13.1
15.1
Dec-12 Dec-13 Dec-14 Dec-15
(x)
Avg: 1.6x
+1sd: 1.93x
+2sd: 2.26x
‐1sd: 1.27x
‐2sd: 0.95x0.8
1.0
1.2
1.4
1.6
1.8
2.0
2.2
2.4
2.6
Dec-12 Dec-13 Dec-14 Dec-15
(x)
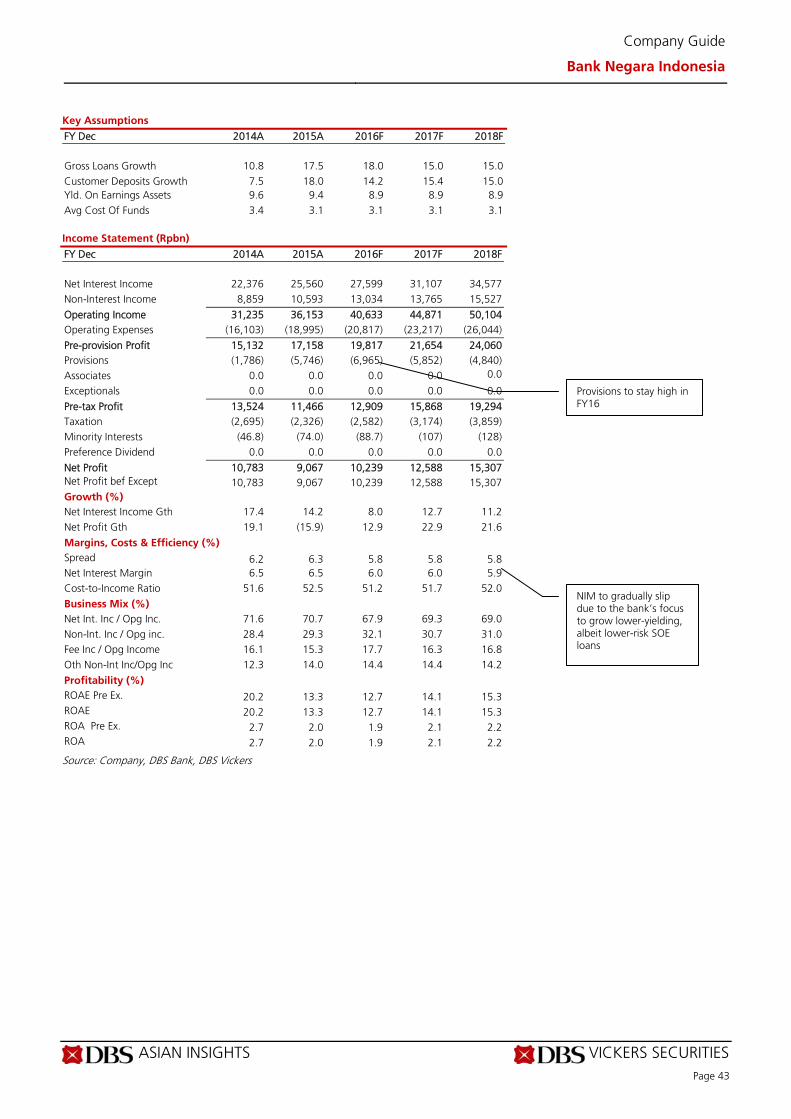
ASIAN INSIGHTS VICKERS SECURITIES Page 43
Company Guide
Bank Negara Indonesia
Key Assumptions
FY Dec 2014A 2015A 2016F 2017F 2018F
Gross Loans Growth 10.8 17.5 18.0 15.0 15.0 Customer Deposits Growth 7.5 18.0 14.2 15.4 15.0 Yld. On Earnings Assets 9.6 9.4 8.9 8.9 8.9 Avg Cost Of Funds 3.4 3.1 3.1 3.1 3.1 Income Statement (Rpbn)
FY Dec 2014A 2015A 2016F 2017F 2018F Net Interest Income 22,376 25,560 27,599 31,107 34,577 Non-Interest Income 8,859 10,593 13,034 13,765 15,527
Operating Income 31,235 36,153 40,633 44,871 50,104 Operating Expenses (16,103) (18,995) (20,817) (23,217) (26,044)
Pre-provision Profit 15,132 17,158 19,817 21,654 24,060 Provisions (1,786) (5,746) (6,965) (5,852) (4,840) Associates 0.0 0.0 0.0 0.0 0.0
Exceptionals 0.0 0.0 0.0 0.0 0.0
Pre-tax Profit 13,524 11,466 12,909 15,868 19,294 Taxation (2,695) (2,326) (2,582) (3,174) (3,859) Minority Interests (46.8) (74.0) (88.7) (107) (128) Preference Dividend 0.0 0.0 0.0 0.0 0.0
Net Profit 10,783 9,067 10,239 12,588 15,307 Net Profit bef Except 10,783 9,067 10,239 12,588 15,307 Growth (%) Net Interest Income Gth 17.4 14.2 8.0 12.7 11.2 Net Profit Gth 19.1 (15.9) 12.9 22.9 21.6
Margins, Costs & Efficiency (%) Spread 6.2 6.3 5.8 5.8 5.8 Net Interest Margin 6.5 6.5 6.0 6.0 5.9 Cost-to-Income Ratio 51.6 52.5 51.2 51.7 52.0
Business Mix (%) Net Int. Inc / Opg Inc. 71.6 70.7 67.9 69.3 69.0 Non-Int. Inc / Opg inc. 28.4 29.3 32.1 30.7 31.0 Fee Inc / Opg Income 16.1 15.3 17.7 16.3 16.8 Oth Non-Int Inc/Opg Inc 12.3 14.0 14.4 14.4 14.2
Profitability (%) ROAE Pre Ex. 20.2 13.3 12.7 14.1 15.3 ROAE 20.2 13.3 12.7 14.1 15.3 ROA Pre Ex. 2.7 2.0 1.9 2.1 2.2 ROA 2.7 2.0 1.9 2.1 2.2
Source: Company, DBS Bank, DBS Vickers
Provisions to stay high in FY16
NIM to gradually slip due to the bank’s focus to grow lower-yielding, albeit lower-risk SOE loans
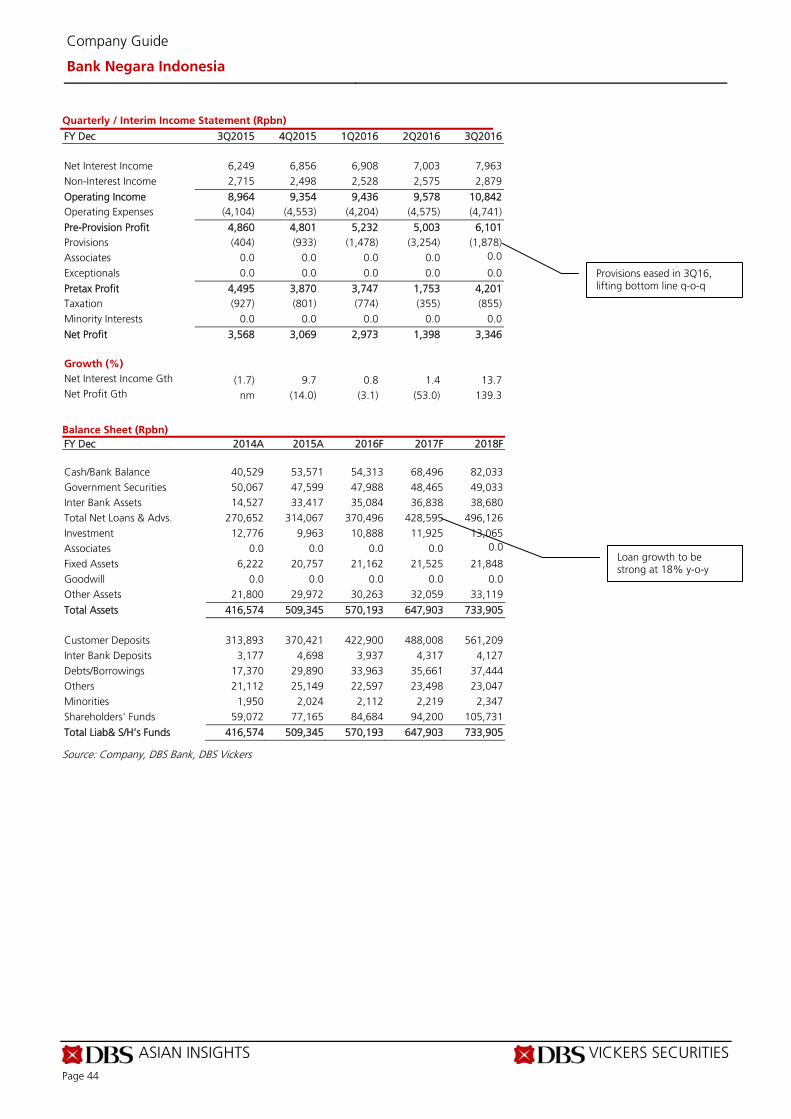
ASIAN INSIGHTS VICKERS SECURITIES Page 44
Company Guide
Bank Negara Indonesia
Quarterly / Interim Income Statement (Rpbn)
FY Dec 3Q2015 4Q2015 1Q2016 2Q2016 3Q2016 Net Interest Income 6,249 6,856 6,908 7,003 7,963 Non-Interest Income 2,715 2,498 2,528 2,575 2,879
Operating Income 8,964 9,354 9,436 9,578 10,842 Operating Expenses (4,104) (4,553) (4,204) (4,575) (4,741)
Pre-Provision Profit 4,860 4,801 5,232 5,003 6,101 Provisions (404) (933) (1,478) (3,254) (1,878) Associates 0.0 0.0 0.0 0.0 0.0
Exceptionals 0.0 0.0 0.0 0.0 0.0
Pretax Profit 4,495 3,870 3,747 1,753 4,201 Taxation (927) (801) (774) (355) (855) Minority Interests 0.0 0.0 0.0 0.0 0.0
Net Profit 3,568 3,069 2,973 1,398 3,346 Growth (%) Net Interest Income Gth (1.7) 9.7 0.8 1.4 13.7 Net Profit Gth nm (14.0) (3.1) (53.0) 139.3
Balance Sheet (Rpbn)
FY Dec 2014A 2015A 2016F 2017F 2018F Cash/Bank Balance 40,529 53,571 54,313 68,496 82,033 Government Securities 50,067 47,599 47,988 48,465 49,033 Inter Bank Assets 14,527 33,417 35,084 36,838 38,680 Total Net Loans & Advs. 270,652 314,067 370,496 428,595 496,126 Investment 12,776 9,963 10,888 11,925 13,065 Associates 0.0 0.0 0.0 0.0 0.0
Fixed Assets 6,222 20,757 21,162 21,525 21,848 Goodwill 0.0 0.0 0.0 0.0 0.0 Other Assets 21,800 29,972 30,263 32,059 33,119
Total Assets 416,574 509,345 570,193 647,903 733,905 Customer Deposits 313,893 370,421 422,900 488,008 561,209 Inter Bank Deposits 3,177 4,698 3,937 4,317 4,127 Debts/Borrowings 17,370 29,890 33,963 35,661 37,444 Others 21,112 25,149 22,597 23,498 23,047 Minorities 1,950 2,024 2,112 2,219 2,347 Shareholders' Funds 59,072 77,165 84,684 94,200 105,731
Total Liab& S/H’s Funds 416,574 509,345 570,193 647,903 733,905
Source: Company, DBS Bank, DBS Vickers
Provisions eased in 3Q16, lifting bottom line q-o-q
Loan growth to be strong at 18% y-o-y
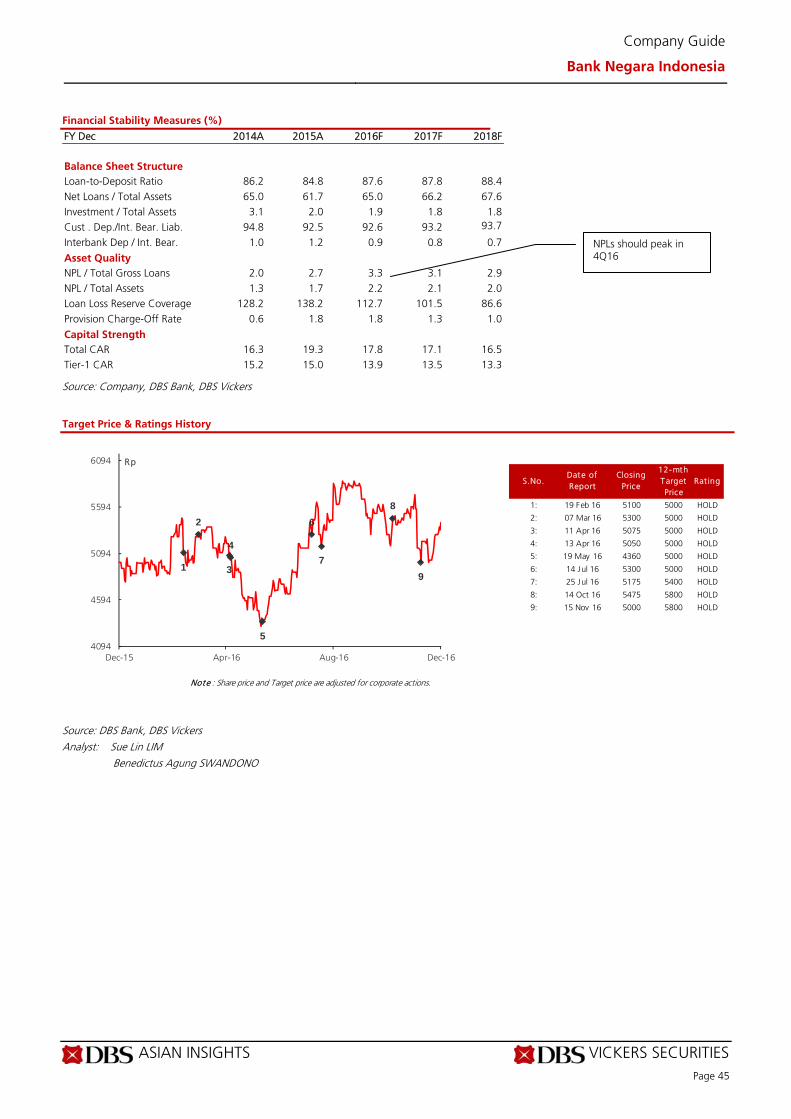
ASIAN INSIGHTS VICKERS SECURITIES Page 45
Company Guide
Bank Negara Indonesia
Financial Stability Measures (%)
FY Dec 2014A 2015A 2016F 2017F 2018F Balance Sheet Structure Loan-to-Deposit Ratio 86.2 84.8 87.6 87.8 88.4 Net Loans / Total Assets 65.0 61.7 65.0 66.2 67.6 Investment / Total Assets 3.1 2.0 1.9 1.8 1.8 Cust . Dep./Int. Bear. Liab. 94.8 92.5 92.6 93.2 93.7
Interbank Dep / Int. Bear. 1.0 1.2 0.9 0.8 0.7
Asset Quality NPL / Total Gross Loans 2.0 2.7 3.3 3.1 2.9 NPL / Total Assets 1.3 1.7 2.2 2.1 2.0 Loan Loss Reserve Coverage 128.2 138.2 112.7 101.5 86.6 Provision Charge-Off Rate 0.6 1.8 1.8 1.3 1.0
Capital Strength Total CAR 16.3 19.3 17.8 17.1 16.5 Tier-1 CAR 15.2 15.0 13.9 13.5 13.3
Source: Company, DBS Bank, DBS Vickers
Target Price & Ratings History
Source: DBS Bank, DBS Vickers Analyst: Sue Lin LIM
Benedictus Agung SWANDONO
S.No.Date of Report
Closing Price
12-mth Target Price
Rat ing
1: 19 Feb 16 5100 5000 HOLD
2: 07 Mar 16 5300 5000 HOLD
3: 11 Apr 16 5075 5000 HOLD
4: 13 Apr 16 5050 5000 HOLD
5: 19 May 16 4360 5000 HOLD
6: 14 Jul 16 5300 5000 HOLD
7: 25 Jul 16 5175 5400 HOLD
8: 14 Oct 16 5475 5800 HOLD
9: 15 Nov 16 5000 5800 HOLD
Note : Share price and Target price are adjusted for corporate actions.
1
2
3
4
5
6
7
8
9
4094
4594
5094
5594
6094
Dec-15 Apr-16 Aug-16 Dec-16
Rp
NPLs should peak in 4Q16
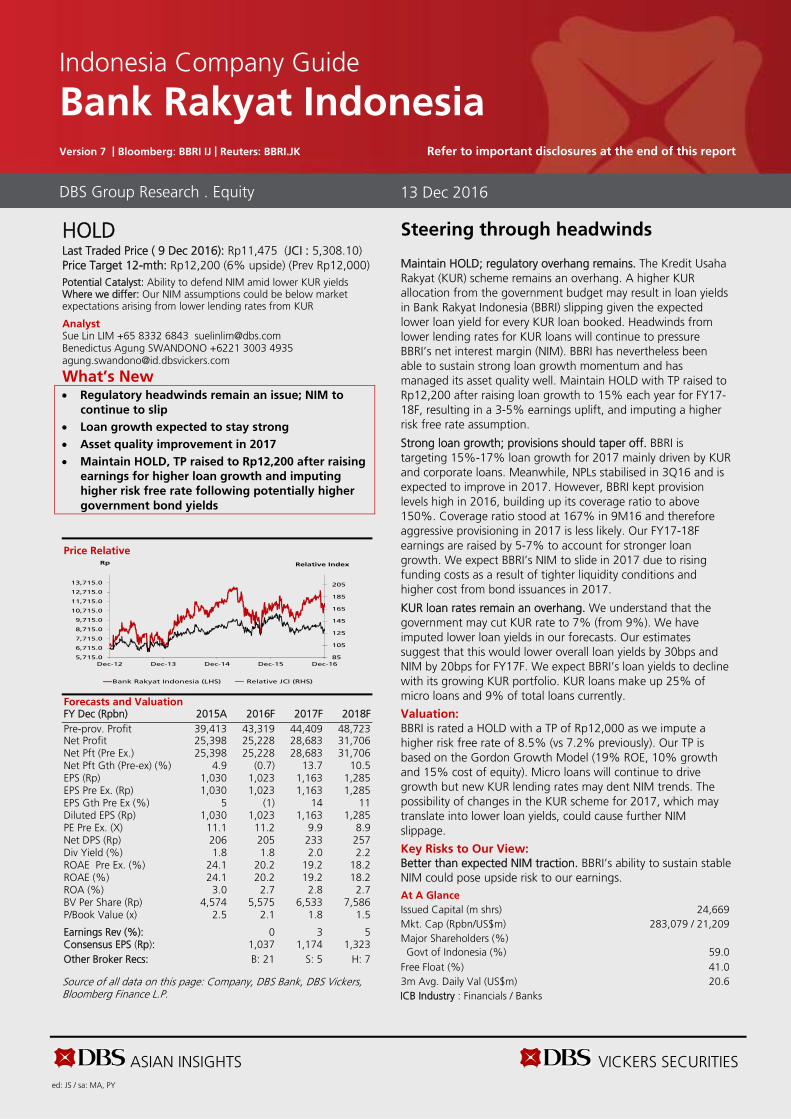
ASIAN INSIGHTS VICKERS SECURITIES ed: JS / sa: MA, PY
HOLD Last Traded Price ( 9 Dec 2016): Rp11,475 (JCI : 5,308.10) Price Target 12-mth: Rp12,200 (6% upside) (Prev Rp12,000) Potential Catalyst: Ability to defend NIM amid lower KUR yields Where we differ: Our NIM assumptions could be below market expectations arising from lower lending rates from KUR
Analyst Sue Lin LIM +65 8332 6843 [email protected] Benedictus Agung SWANDONO +6221 3003 4935 [email protected]
What’s New Regulatory headwinds remain an issue; NIM to
continue to slip Loan growth expected to stay strong Asset quality improvement in 2017 Maintain HOLD, TP raised to Rp12,200 after raising
earnings for higher loan growth and imputing
higher risk free rate following potentially higher
government bond yields
Price Relative
Forecasts and Valuation FY Dec (Rpbn) 2015A 2016F 2017F 2018F Pre-prov. Profit 39,413 43,319 44,409 48,723 Net Profit 25,398 25,228 28,683 31,706 Net Pft (Pre Ex.) 25,398 25,228 28,683 31,706 Net Pft Gth (Pre-ex) (%) 4.9 (0.7) 13.7 10.5 EPS (Rp) 1,030 1,023 1,163 1,285 EPS Pre Ex. (Rp) 1,030 1,023 1,163 1,285 EPS Gth Pre Ex (%) 5 (1) 14 11 Diluted EPS (Rp) 1,030 1,023 1,163 1,285 PE Pre Ex. (X) 11.1 11.2 9.9 8.9 Net DPS (Rp) 206 205 233 257 Div Yield (%) 1.8 1.8 2.0 2.2 ROAE Pre Ex. (%) 24.1 20.2 19.2 18.2 ROAE (%) 24.1 20.2 19.2 18.2 ROA (%) 3.0 2.7 2.8 2.7 BV Per Share (Rp) 4,574 5,575 6,533 7,586 P/Book Value (x) 2.5 2.1 1.8 1.5 Earnings Rev (%): 0 3 5 Consensus EPS (Rp): 1,037 1,174 1,323 Other Broker Recs: B: 21 S: 5 H: 7
Source of all data on this page: Company, DBS Bank, DBS Vickers, Bloomberg Finance L.P.
Steering through headwinds
Maintain HOLD; regulatory overhang remains. The Kredit Usaha Rakyat (KUR) scheme remains an overhang. A higher KUR allocation from the government budget may result in loan yields in Bank Rakyat Indonesia (BBRI) slipping given the expected lower loan yield for every KUR loan booked. Headwinds from lower lending rates for KUR loans will continue to pressure BBRI’s net interest margin (NIM). BBRI has nevertheless been able to sustain strong loan growth momentum and has managed its asset quality well. Maintain HOLD with TP raised to Rp12,200 after raising loan growth to 15% each year for FY17-18F, resulting in a 3-5% earnings uplift, and imputing a higher risk free rate assumption.
Strong loan growth; provisions should taper off. BBRI is targeting 15%-17% loan growth for 2017 mainly driven by KUR and corporate loans. Meanwhile, NPLs stabilised in 3Q16 and is expected to improve in 2017. However, BBRI kept provision levels high in 2016, building up its coverage ratio to above 150%. Coverage ratio stood at 167% in 9M16 and therefore aggressive provisioning in 2017 is less likely. Our FY17-18F earnings are raised by 5-7% to account for stronger loan growth. We expect BBRI’s NIM to slide in 2017 due to rising funding costs as a result of tighter liquidity conditions and higher cost from bond issuances in 2017.
KUR loan rates remain an overhang. We understand that the government may cut KUR rate to 7% (from 9%). We have imputed lower loan yields in our forecasts. Our estimates suggest that this would lower overall loan yields by 30bps and NIM by 20bps for FY17F. We expect BBRI’s loan yields to decline with its growing KUR portfolio. KUR loans make up 25% of micro loans and 9% of total loans currently.
Valuation:
BBRI is rated a HOLD with a TP of Rp12,000 as we impute a higher risk free rate of 8.5% (vs 7.2% previously). Our TP is based on the Gordon Growth Model (19% ROE, 10% growth and 15% cost of equity). Micro loans will continue to drive growth but new KUR lending rates may dent NIM trends. The possibility of changes in the KUR scheme for 2017, which may translate into lower loan yields, could cause further NIM slippage.
Key Risks to Our View: Better than expected NIM traction. BBRI’s ability to sustain stable NIM could pose upside risk to our earnings. At A Glance Issued Capital (m shrs) 24,669 Mkt. Cap (Rpbn/US$m) 283,079 / 21,209 Major Shareholders (%) Govt of Indonesia (%) 59.0
Free Float (%) 41.0 3m Avg. Daily Val (US$m) 20.6 ICB Industry : Financials / Banks
DBS Group Research . Equity 13 Dec 2016
Indonesia Company Guide
Bank Rakyat Indonesia Version 7 | Bloomberg: BBRI IJ | Reuters: BBRI.JK Refer to important disclosures at the end of this report
85
105
125
145
165
185
205
5,715.0
6,715.0
7,715.0
8,715.0
9,715.0
10,715.0
11,715.0
12,715.0
13,715.0
Dec-12 Dec-13 Dec-14 Dec-15 Dec-16
Relative IndexRp
Bank Rakyat Indonesia (LHS) Relative JCI (RHS)
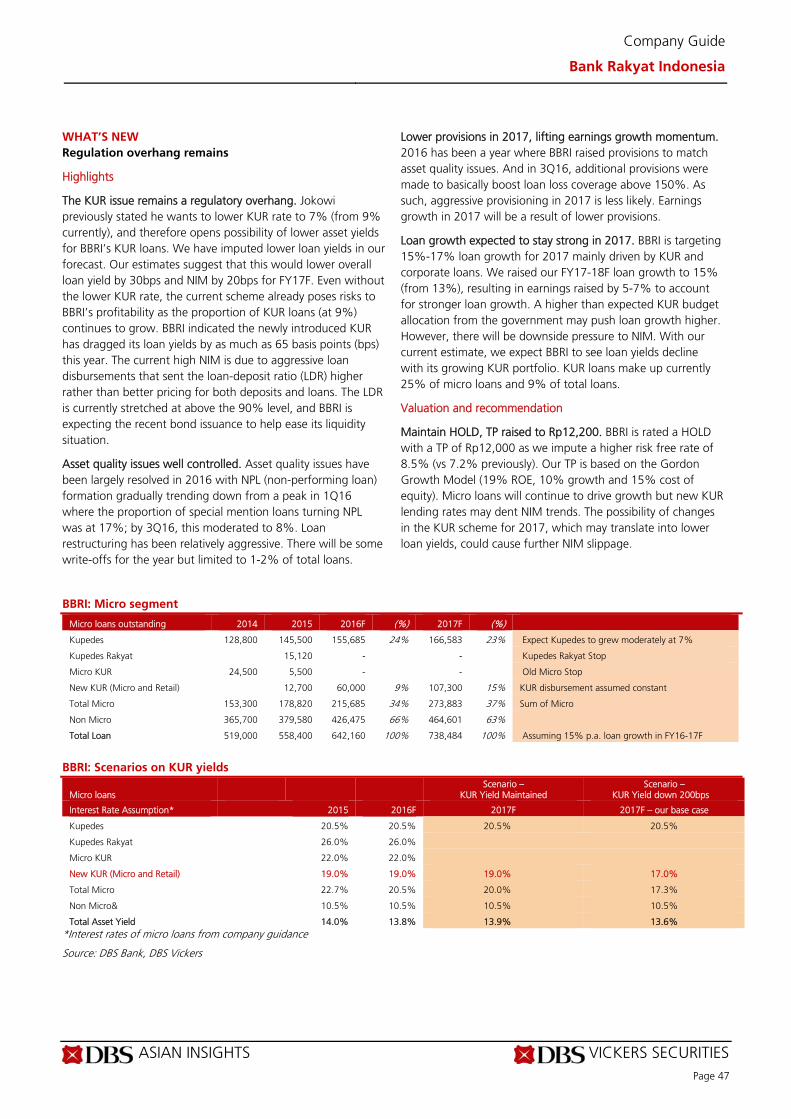
ASIAN INSIGHTS VICKERS SECURITIES Page 47
Company Guide
Bank Rakyat Indonesia
WHAT’S NEW
Regulation overhang remains
Highlights
The KUR issue remains a regulatory overhang. Jokowi previously stated he wants to lower KUR rate to 7% (from 9% currently), and therefore opens possibility of lower asset yields for BBRI’s KUR loans. We have imputed lower loan yields in our forecast. Our estimates suggest that this would lower overall loan yield by 30bps and NIM by 20bps for FY17F. Even without the lower KUR rate, the current scheme already poses risks to BBRI’s profitability as the proportion of KUR loans (at 9%) continues to grow. BBRI indicated the newly introduced KUR has dragged its loan yields by as much as 65 basis points (bps) this year. The current high NIM is due to aggressive loan disbursements that sent the loan-deposit ratio (LDR) higher rather than better pricing for both deposits and loans. The LDR is currently stretched at above the 90% level, and BBRI is expecting the recent bond issuance to help ease its liquidity situation.
Asset quality issues well controlled. Asset quality issues have been largely resolved in 2016 with NPL (non-performing loan) formation gradually trending down from a peak in 1Q16 where the proportion of special mention loans turning NPL was at 17%; by 3Q16, this moderated to 8%. Loan restructuring has been relatively aggressive. There will be some write-offs for the year but limited to 1-2% of total loans.
Lower provisions in 2017, lifting earnings growth momentum. 2016 has been a year where BBRI raised provisions to match asset quality issues. And in 3Q16, additional provisions were made to basically boost loan loss coverage above 150%. As such, aggressive provisioning in 2017 is less likely. Earnings growth in 2017 will be a result of lower provisions.
Loan growth expected to stay strong in 2017. BBRI is targeting 15%-17% loan growth for 2017 mainly driven by KUR and corporate loans. We raised our FY17-18F loan growth to 15% (from 13%), resulting in earnings raised by 5-7% to account for stronger loan growth. A higher than expected KUR budget allocation from the government may push loan growth higher. However, there will be downside pressure to NIM. With our current estimate, we expect BBRI to see loan yields decline with its growing KUR portfolio. KUR loans make up currently 25% of micro loans and 9% of total loans.
Valuation and recommendation
Maintain HOLD, TP raised to Rp12,200. BBRI is rated a HOLD with a TP of Rp12,000 as we impute a higher risk free rate of 8.5% (vs 7.2% previously). Our TP is based on the Gordon Growth Model (19% ROE, 10% growth and 15% cost of equity). Micro loans will continue to drive growth but new KUR lending rates may dent NIM trends. The possibility of changes in the KUR scheme for 2017, which may translate into lower loan yields, could cause further NIM slippage.
BBRI: Micro segment
Micro loans outstanding 2014 2015 2016F (%) 2017F (%)
Kupedes 128,800 145,500 155,685 24% 166,583 23% Expect Kupedes to grew moderately at 7%
Kupedes Rakyat 15,120 - - Kupedes Rakyat Stop
Micro KUR 24,500 5,500 - - Old Micro Stop
New KUR (Micro and Retail) 12,700 60,000 9% 107,300 15% KUR disbursement assumed constant
Total Micro 153,300 178,820 215,685 34% 273,883 37% Sum of Micro
Non Micro 365,700 379,580 426,475 66% 464,601 63%
Total Loan 519,000 558,400 642,160 100% 738,484 100% Assuming 15% p.a. loan growth in FY16-17F
BBRI: Scenarios on KUR yields
Micro loans Scenario –
KUR Yield Maintained Scenario –
KUR Yield down 200bps
Interest Rate Assumption* 2015 2016F 2017F 2017F – our base case
Kupedes 20.5% 20.5% 20.5% 20.5%
Kupedes Rakyat 26.0% 26.0%
Micro KUR 22.0% 22.0%
New KUR (Micro and Retail) 19.0% 19.0% 19.0% 17.0%
Total Micro 22.7% 20.5% 20.0% 17.3%
Non Micro& 10.5% 10.5% 10.5% 10.5%
Total Asset Yield 14.0% 13.8% 13.9% 13.6% *Interest rates of micro loans from company guidance
Source: DBS Bank, DBS Vickers
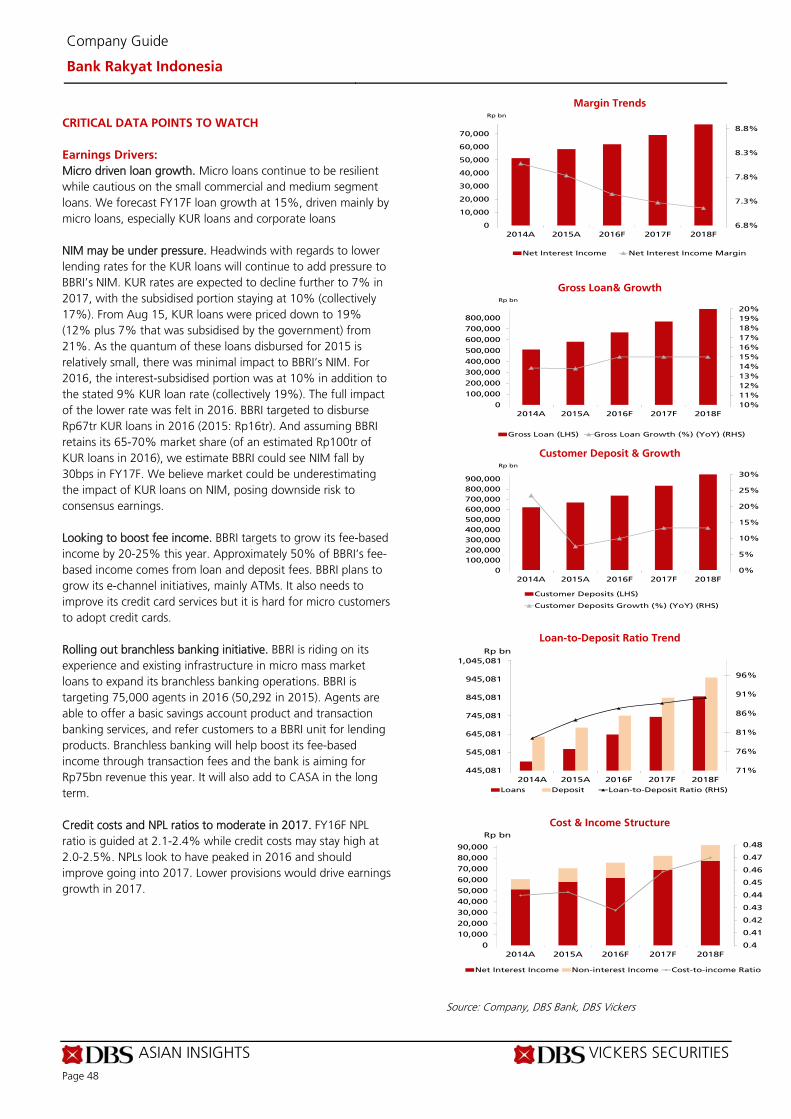
ASIAN INSIGHTS VICKERS SECURITIES Page 48
Company Guide
Bank Rakyat Indonesia
CRITICAL DATA POINTS TO WATCH
Earnings Drivers:
Micro driven loan growth. Micro loans continue to be resilient while cautious on the small commercial and medium segment loans. We forecast FY17F loan growth at 15%, driven mainly by micro loans, especially KUR loans and corporate loans NIM may be under pressure. Headwinds with regards to lower lending rates for the KUR loans will continue to add pressure to BBRI’s NIM. KUR rates are expected to decline further to 7% in 2017, with the subsidised portion staying at 10% (collectively 17%). From Aug 15, KUR loans were priced down to 19% (12% plus 7% that was subsidised by the government) from 21%. As the quantum of these loans disbursed for 2015 is relatively small, there was minimal impact to BBRI’s NIM. For 2016, the interest-subsidised portion was at 10% in addition to the stated 9% KUR loan rate (collectively 19%). The full impact of the lower rate was felt in 2016. BBRI targeted to disburse Rp67tr KUR loans in 2016 (2015: Rp16tr). And assuming BBRI retains its 65-70% market share (of an estimated Rp100tr of KUR loans in 2016), we estimate BBRI could see NIM fall by 30bps in FY17F. We believe market could be underestimating the impact of KUR loans on NIM, posing downside risk to consensus earnings. Looking to boost fee income. BBRI targets to grow its fee-based income by 20-25% this year. Approximately 50% of BBRI’s fee-based income comes from loan and deposit fees. BBRI plans to grow its e-channel initiatives, mainly ATMs. It also needs to improve its credit card services but it is hard for micro customers to adopt credit cards. Rolling out branchless banking initiative. BBRI is riding on its experience and existing infrastructure in micro mass market loans to expand its branchless banking operations. BBRI is targeting 75,000 agents in 2016 (50,292 in 2015). Agents are able to offer a basic savings account product and transaction banking services, and refer customers to a BBRI unit for lending products. Branchless banking will help boost its fee-based income through transaction fees and the bank is aiming for Rp75bn revenue this year. It will also add to CASA in the long term. Credit costs and NPL ratios to moderate in 2017. FY16F NPL ratio is guided at 2.1-2.4% while credit costs may stay high at 2.0-2.5%. NPLs look to have peaked in 2016 and should improve going into 2017. Lower provisions would drive earnings growth in 2017.
Margin Trends
Gross Loan& Growth
Customer Deposit & Growth
Loan-to-Deposit Ratio Trend
Cost & Income Structure
Source: Company, DBS Bank, DBS Vickers
6.8%
7.3%
7.8%
8.3%
8.8%
0
10,000
20,000
30,000
40,000
50,000
60,000
70,000
2014A 2015A 2016F 2017F 2018F
Rp bn
Net Interest Income Net Interest Income Margin
10%
11%
12%
13%
14%
15%
16%
17%
18%
19%
20%
0
100,000
200,000
300,000
400,000
500,000
600,000
700,000
800,000
2014A 2015A 2016F 2017F 2018F
Rp bn
Gross Loan (LHS) Gross Loan Growth (%) (YoY) (RHS)
0%
5%
10%
15%
20%
25%
30%
0
100,000
200,000
300,000
400,000
500,000
600,000
700,000
800,000
900,000
2014A 2015A 2016F 2017F 2018F
Rp bn
Customer Deposits (LHS)
Customer Deposits Growth (%) (YoY) (RHS)
71%
76%
81%
86%
91%
96%
445,081
545,081
645,081
745,081
845,081
945,081
1,045,081
2014A 2015A 2016F 2017F 2018F
Rp bn
Loans Deposit Loan-to-Deposit Ratio (RHS)
0.4
0.41
0.42
0.43
0.44
0.45
0.46
0.47
0.48
0
10,000
20,000
30,000
40,000
50,000
60,000
70,000
80,000
90,000
2014A 2015A 2016F 2017F 2018F
Rp bn
Net Interest Income Non-interest Income Cost-to-income Ratio
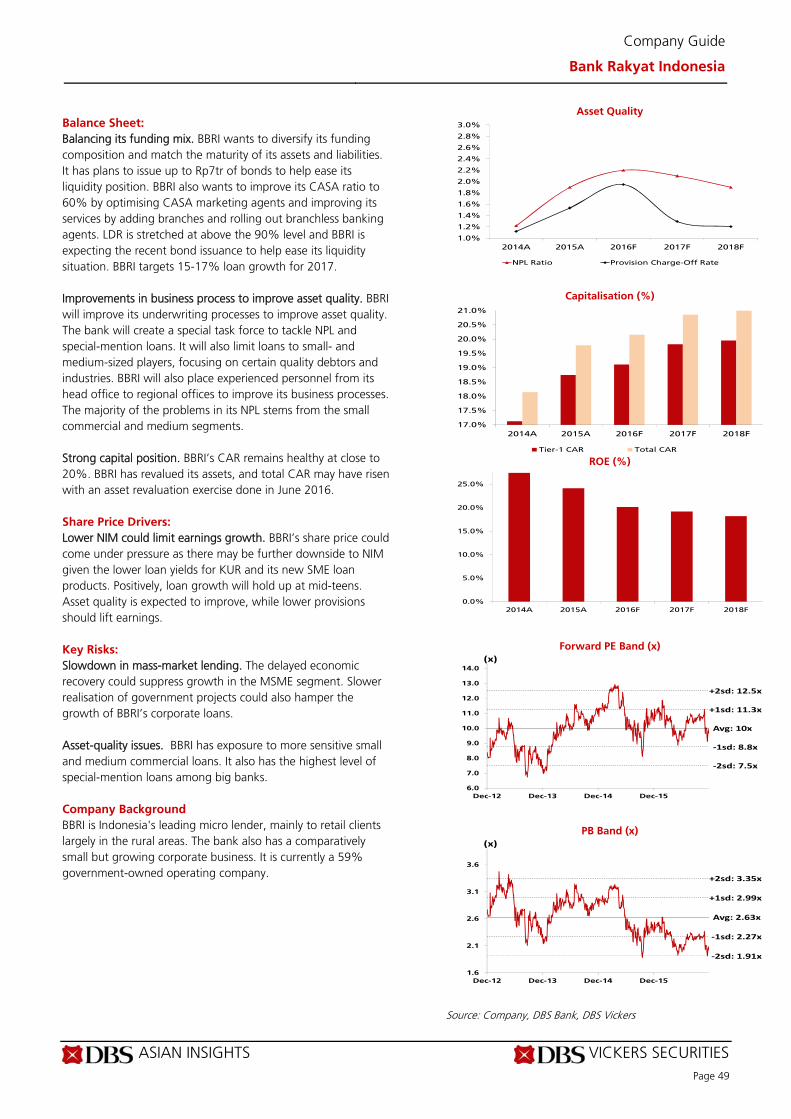
ASIAN INSIGHTS VICKERS SECURITIES Page 49
Company Guide
Bank Rakyat Indonesia
Balance Sheet:
Balancing its funding mix. BBRI wants to diversify its funding composition and match the maturity of its assets and liabilities. It has plans to issue up to Rp7tr of bonds to help ease its liquidity position. BBRI also wants to improve its CASA ratio to 60% by optimising CASA marketing agents and improving its services by adding branches and rolling out branchless banking agents. LDR is stretched at above the 90% level and BBRI is expecting the recent bond issuance to help ease its liquidity situation. BBRI targets 15-17% loan growth for 2017. Improvements in business process to improve asset quality. BBRI will improve its underwriting processes to improve asset quality. The bank will create a special task force to tackle NPL and special-mention loans. It will also limit loans to small- and medium-sized players, focusing on certain quality debtors and industries. BBRI will also place experienced personnel from its head office to regional offices to improve its business processes. The majority of the problems in its NPL stems from the small commercial and medium segments. Strong capital position. BBRI’s CAR remains healthy at close to 20%. BBRI has revalued its assets, and total CAR may have risen with an asset revaluation exercise done in June 2016. Share Price Drivers:
Lower NIM could limit earnings growth. BBRI’s share price could come under pressure as there may be further downside to NIM given the lower loan yields for KUR and its new SME loan products. Positively, loan growth will hold up at mid-teens. Asset quality is expected to improve, while lower provisions should lift earnings. Key Risks:
Slowdown in mass-market lending. The delayed economic recovery could suppress growth in the MSME segment. Slower realisation of government projects could also hamper the growth of BBRI’s corporate loans. Asset-quality issues. BBRI has exposure to more sensitive small and medium commercial loans. It also has the highest level of special-mention loans among big banks. Company Background
BBRI is Indonesia's leading micro lender, mainly to retail clients largely in the rural areas. The bank also has a comparatively small but growing corporate business. It is currently a 59% government-owned operating company.
Asset Quality
Capitalisation (%)
ROE (%)
Forward PE Band (x)
PB Band (x)
Source: Company, DBS Bank, DBS Vickers
1.0%
1.2%
1.4%
1.6%
1.8%
2.0%
2.2%
2.4%
2.6%
2.8%
3.0%
2014A 2015A 2016F 2017F 2018F
NPL Ratio Provision Charge-Off Rate
17.0%
17.5%
18.0%
18.5%
19.0%
19.5%
20.0%
20.5%
21.0%
2014A 2015A 2016F 2017F 2018F
Tier-1 CAR Total CAR
0.0%
5.0%
10.0%
15.0%
20.0%
25.0%
2014A 2015A 2016F 2017F 2018F
Avg: 10x
+1sd: 11.3x
+2sd: 12.5x
‐1sd: 8.8x
‐2sd: 7.5x
6.0
7.0
8.0
9.0
10.0
11.0
12.0
13.0
14.0
Dec-12 Dec-13 Dec-14 Dec-15
(x)
Avg: 2.63x
+1sd: 2.99x
+2sd: 3.35x
‐1sd: 2.27x
‐2sd: 1.91x
1.6
2.1
2.6
3.1
3.6
Dec-12 Dec-13 Dec-14 Dec-15
(x)
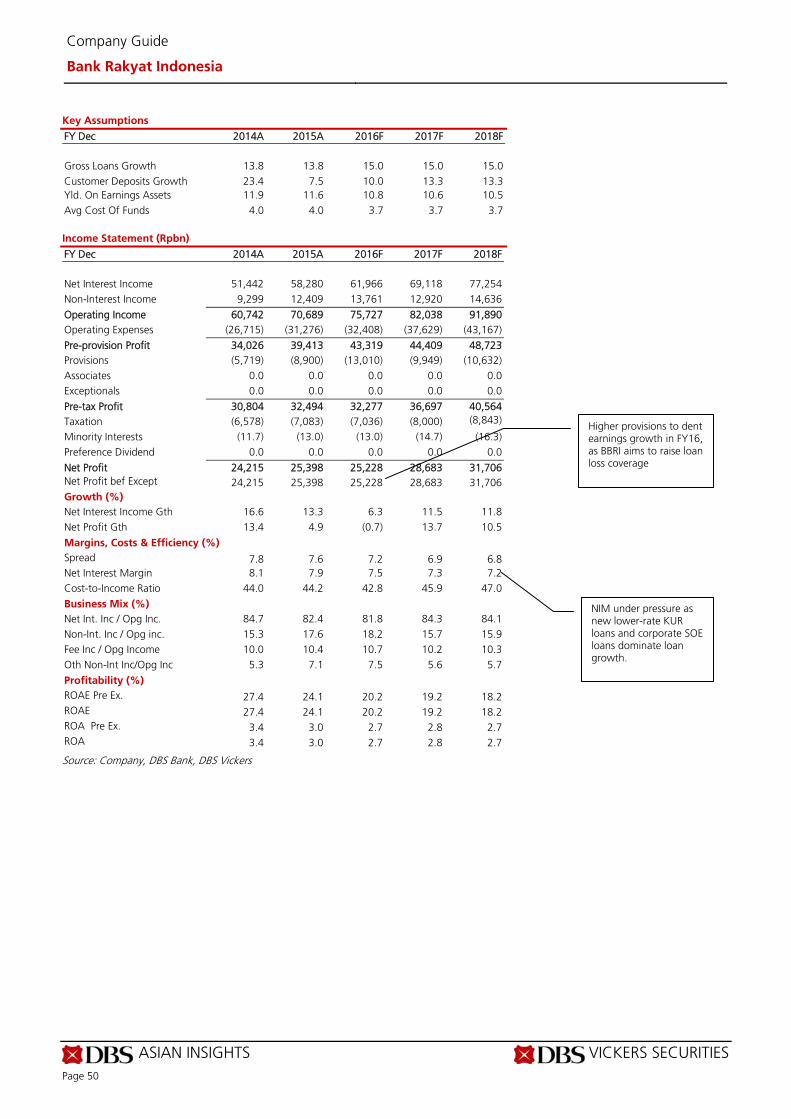
ASIAN INSIGHTS VICKERS SECURITIES Page 50
Company Guide
Bank Rakyat Indonesia
Key Assumptions
FY Dec 2014A 2015A 2016F 2017F 2018F
Gross Loans Growth 13.8 13.8 15.0 15.0 15.0 Customer Deposits Growth 23.4 7.5 10.0 13.3 13.3 Yld. On Earnings Assets 11.9 11.6 10.8 10.6 10.5 Avg Cost Of Funds 4.0 4.0 3.7 3.7 3.7 Income Statement (Rpbn)
FY Dec 2014A 2015A 2016F 2017F 2018F Net Interest Income 51,442 58,280 61,966 69,118 77,254 Non-Interest Income 9,299 12,409 13,761 12,920 14,636
Operating Income 60,742 70,689 75,727 82,038 91,890 Operating Expenses (26,715) (31,276) (32,408) (37,629) (43,167)
Pre-provision Profit 34,026 39,413 43,319 44,409 48,723 Provisions (5,719) (8,900) (13,010) (9,949) (10,632) Associates 0.0 0.0 0.0 0.0 0.0 Exceptionals 0.0 0.0 0.0 0.0 0.0
Pre-tax Profit 30,804 32,494 32,277 36,697 40,564 Taxation (6,578) (7,083) (7,036) (8,000) (8,843)
Minority Interests (11.7) (13.0) (13.0) (14.7) (16.3) Preference Dividend 0.0 0.0 0.0 0.0 0.0
Net Profit 24,215 25,398 25,228 28,683 31,706 Net Profit bef Except 24,215 25,398 25,228 28,683 31,706 Growth (%) Net Interest Income Gth 16.6 13.3 6.3 11.5 11.8 Net Profit Gth 13.4 4.9 (0.7) 13.7 10.5
Margins, Costs & Efficiency (%) Spread 7.8 7.6 7.2 6.9 6.8 Net Interest Margin 8.1 7.9 7.5 7.3 7.2 Cost-to-Income Ratio 44.0 44.2 42.8 45.9 47.0
Business Mix (%) Net Int. Inc / Opg Inc. 84.7 82.4 81.8 84.3 84.1 Non-Int. Inc / Opg inc. 15.3 17.6 18.2 15.7 15.9 Fee Inc / Opg Income 10.0 10.4 10.7 10.2 10.3 Oth Non-Int Inc/Opg Inc 5.3 7.1 7.5 5.6 5.7
Profitability (%) ROAE Pre Ex. 27.4 24.1 20.2 19.2 18.2 ROAE 27.4 24.1 20.2 19.2 18.2 ROA Pre Ex. 3.4 3.0 2.7 2.8 2.7 ROA 3.4 3.0 2.7 2.8 2.7
Source: Company, DBS Bank, DBS Vickers
Higher provisions to dent earnings growth in FY16, as BBRI aims to raise loan loss coverage
NIM under pressure as new lower-rate KUR loans and corporate SOE loans dominate loan growth.
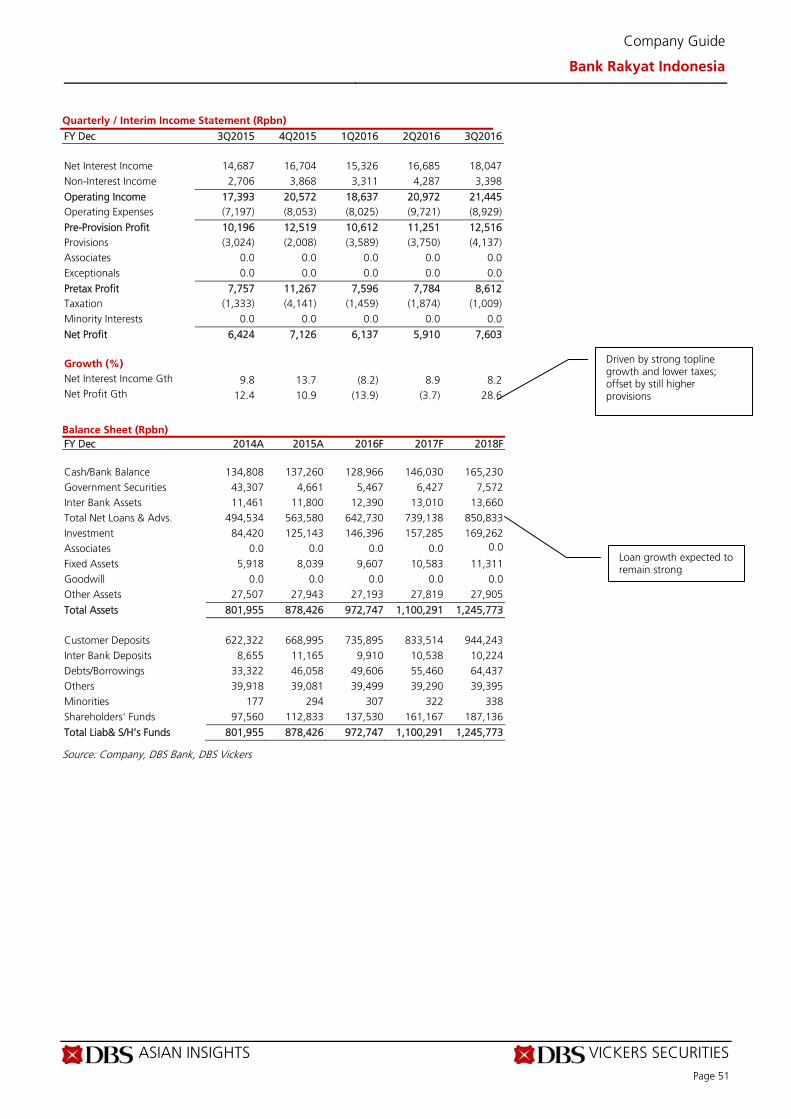
ASIAN INSIGHTS VICKERS SECURITIES Page 51
Company Guide
Bank Rakyat Indonesia
Quarterly / Interim Income Statement (Rpbn)
FY Dec 3Q2015 4Q2015 1Q2016 2Q2016 3Q2016 Net Interest Income 14,687 16,704 15,326 16,685 18,047 Non-Interest Income 2,706 3,868 3,311 4,287 3,398
Operating Income 17,393 20,572 18,637 20,972 21,445 Operating Expenses (7,197) (8,053) (8,025) (9,721) (8,929)
Pre-Provision Profit 10,196 12,519 10,612 11,251 12,516 Provisions (3,024) (2,008) (3,589) (3,750) (4,137) Associates 0.0 0.0 0.0 0.0 0.0 Exceptionals 0.0 0.0 0.0 0.0 0.0
Pretax Profit 7,757 11,267 7,596 7,784 8,612 Taxation (1,333) (4,141) (1,459) (1,874) (1,009) Minority Interests 0.0 0.0 0.0 0.0 0.0
Net Profit 6,424 7,126 6,137 5,910 7,603
Growth (%) Net Interest Income Gth 9.8 13.7 (8.2) 8.9 8.2 Net Profit Gth 12.4 10.9 (13.9) (3.7) 28.6
Balance Sheet (Rpbn)
FY Dec 2014A 2015A 2016F 2017F 2018F Cash/Bank Balance 134,808 137,260 128,966 146,030 165,230 Government Securities 43,307 4,661 5,467 6,427 7,572 Inter Bank Assets 11,461 11,800 12,390 13,010 13,660 Total Net Loans & Advs. 494,534 563,580 642,730 739,138 850,833 Investment 84,420 125,143 146,396 157,285 169,262 Associates 0.0 0.0 0.0 0.0 0.0
Fixed Assets 5,918 8,039 9,607 10,583 11,311 Goodwill 0.0 0.0 0.0 0.0 0.0 Other Assets 27,507 27,943 27,193 27,819 27,905
Total Assets 801,955 878,426 972,747 1,100,291 1,245,773 Customer Deposits 622,322 668,995 735,895 833,514 944,243 Inter Bank Deposits 8,655 11,165 9,910 10,538 10,224 Debts/Borrowings 33,322 46,058 49,606 55,460 64,437 Others 39,918 39,081 39,499 39,290 39,395 Minorities 177 294 307 322 338 Shareholders' Funds 97,560 112,833 137,530 161,167 187,136
Total Liab& S/H’s Funds 801,955 878,426 972,747 1,100,291 1,245,773
Source: Company, DBS Bank, DBS Vickers
Driven by strong topline growth and lower taxes; offset by still higher provisions
Loan growth expected to remain strong
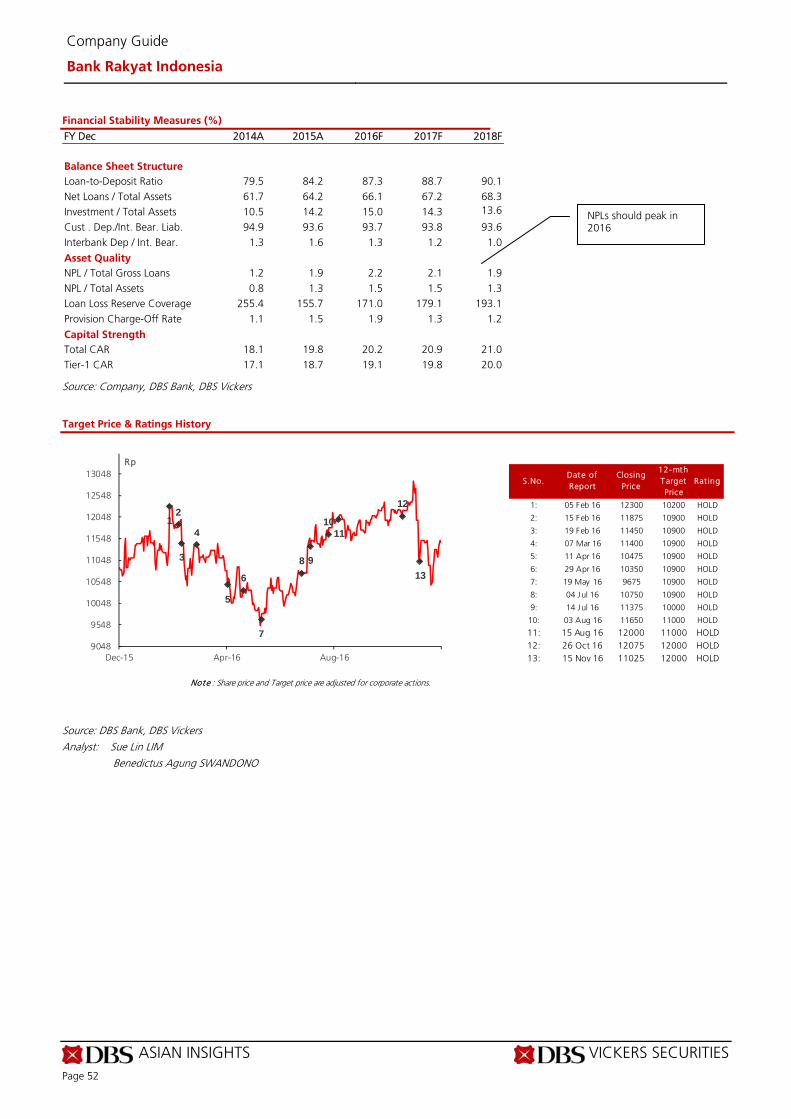
ASIAN INSIGHTS VICKERS SECURITIES Page 52
Company Guide
Bank Rakyat Indonesia
Financial Stability Measures (%)
FY Dec 2014A 2015A 2016F 2017F 2018F Balance Sheet Structure Loan-to-Deposit Ratio 79.5 84.2 87.3 88.7 90.1 Net Loans / Total Assets 61.7 64.2 66.1 67.2 68.3 Investment / Total Assets 10.5 14.2 15.0 14.3 13.6
Cust . Dep./Int. Bear. Liab. 94.9 93.6 93.7 93.8 93.6 Interbank Dep / Int. Bear. 1.3 1.6 1.3 1.2 1.0
Asset Quality NPL / Total Gross Loans 1.2 1.9 2.2 2.1 1.9 NPL / Total Assets 0.8 1.3 1.5 1.5 1.3 Loan Loss Reserve Coverage 255.4 155.7 171.0 179.1 193.1 Provision Charge-Off Rate 1.1 1.5 1.9 1.3 1.2
Capital Strength Total CAR 18.1 19.8 20.2 20.9 21.0 Tier-1 CAR 17.1 18.7 19.1 19.8 20.0
Source: Company, DBS Bank, DBS Vickers
Target Price & Ratings History
Source: DBS Bank, DBS Vickers Analyst: Sue Lin LIM
Benedictus Agung SWANDONO
S.No.Date of Report
Closing Price
12-mth Target Price
Rat ing
1: 05 Feb 16 12300 10200 HOLD
2: 15 Feb 16 11875 10900 HOLD
3: 19 Feb 16 11450 10900 HOLD
4: 07 Mar 16 11400 10900 HOLD
5: 11 Apr 16 10475 10900 HOLD
6: 29 Apr 16 10350 10900 HOLD
7: 19 May 16 9675 10900 HOLD
8: 04 Jul 16 10750 10900 HOLD
9: 14 Jul 16 11375 10000 HOLD
10: 03 Aug 16 11650 11000 HOLD
11: 15 Aug 16 12000 11000 HOLD12: 26 Oct 16 12075 12000 HOLD13: 15 Nov 16 11025 12000 HOLD
Note : Share price and Target price are adjusted for corporate actions.
12
3
4
5
6
7
8 9
1011
12
13
9048
9548
10048
10548
11048
11548
12048
12548
13048
Dec-15 Apr-16 Aug-16
Rp
NPLs should peak in 2016
ASIAN INSIGHTS VICKERS SECURITIES ed: JS / sa: MA, PY
HOLD (Upgrade from FULLY VALUED)
Last Traded Price ( 9 Dec 2016): Rp1,730 (JCI : 5,308.10) Price Target 12-mth: Rp1,660 (4% downside) (Prev Rp1,710)
Potential Catalyst: Favorable FLPP scheme for 2017 Where we differ: We have one of the lower TPs in the market
Analyst Sue Lin LIM +65 8332 6843 [email protected] Benedictus Agung SWANDONO +6221 3003 4935 [email protected]
What’s New Share price correction finally pricing in risks;
upgrade to HOLD TP lowered to Rp1,660 after imputing a higher risk
free rate following expectations of higher government bond yields
New FLPP scheme still under negotiation; higher funding costs will exert pressure on NIM
Strong loan growth momentum expected to persist driven by subsidised mortgages
Price Relative
Forecasts and Valuation FY Dec (Rpbn) 2015A 2016F 2017F 2018F Pre-prov. Profit 3,427 3,931 4,624 5,474 Net Profit 1,851 2,175 2,757 3,343 Net Pft (Pre Ex.) 1,851 2,175 2,757 3,343 Net Pft Gth (Pre-ex) (%) 61.6 17.5 26.7 21.3 EPS (Rp) 179 210 266 323 EPS Pre Ex. (Rp) 179 210 266 323 EPS Gth Pre Ex (%) 62 18 27 21 Diluted EPS (Rp) 179 210 266 323 PE Pre Ex. (X) 9.7 8.2 6.5 5.4 Net DPS (Rp) 33.2 53.6 63.0 79.9 Div Yield (%) 1.9 3.1 3.6 4.6 ROAE Pre Ex. (%) 14.2 13.6 14.3 15.5 ROAE (%) 14.2 13.6 14.3 15.5 ROA (%) 1.2 1.2 1.3 1.3 BV Per Share (Rp) 1,339 1,758 1,961 2,204 P/Book Value (x) 1.3 1.0 0.9 0.8 Earnings Rev (%): 0 0 0 Consensus EPS (Rp): 216 257 303 Other Broker Recs: B: 20 S: 1 H: 5
Source of all data on this page: Company, DBS Bank, DBS Vickers, Bloomberg Finance L.P.
Risks partially priced in
Risks partially priced in; upgrade to HOLD. Bank Tabungan Negara (BBTN)’s share price has finally corrected towards our previous fair value of Rp1,710. Our revised TP of Rp1,660 merely reflects a higher risk free rate assumed following expectations of higher government bond yields. We believe current valuations partially reflect the risk from regulatory uncertainties on the new FLPP scheme (Fasilitas Likuiditas Pembiayaan Perumahan / Subsidised Mortgage Liquidity Facility). The Ministry of Public Works and Housing (PUPR) is said to be eyeing at a lower portion of government funding to BBTN which may result in lower net interest margin (NIM) for the bank. Positively, with low cost housing still a priority in the government’s agenda driven by the 1m government housing programme, BBTN’s loan growth is expected to remain strong underpinned by subsidised mortgages. We remain cautious on non-subsidised mortgage’s asset quality. Aggressive targets in 2017. Management maintained a positive view on 2017 outlook with loan growth targeted at 18-20%, driven by 1m government housing programme. The government has also announced an increase in the programme’s budget to Rp15.6tr in 2017 from Rp12.4tr in 2016. On the funding side, BBTN targets 20-22% deposit growth with CASA ratio closer to 50%. Expense growth is expected to moderate. Topline growth in 2017 hinges on details of the FLPP scheme. The FLPP scheme will be the major contributor to BBTN’s funding in 2017, instead of the interest subsidy scheme which it had to rely on in 2016. However, uncertainty on details of the new FLPP scheme, which may see a lower portion funded by the government may limit upside to the stock. Note that the government funding portion carries very low funding cost, and this aids in capping BBTN’s overall funding cost. We have assumed 85% funding from the government with no increase in funding cost (2016: 90%; 0.3% funding cost). Valuation: We upgrade BBTN to HOLD with a lower target price of Rp1,660 as we impute higher risk free rate of 8.5% (vs 7.2% previously) following expectations of higher government bond yields. Our TP is based on the Gordon Growth Model (14.5% ROE, 10% growth and 15% cost of equity) implying 0.9x FY17 BV. Key Risks to Our View: Favourable FLPP scheme and sustained asset quality trends. Upside risk to our call would be favorable FLPP terms, timely mortgage subsidy disbursements, and sustained asset quality trends particularly from non-subsidised mortgages.
At A Glance Issued Capital (m shrs) 10,590 Mkt. Cap (Rpbn/US$m) 18,321 / 1,373 Major Shareholders (%) Government of Indonesia (%) 60.1
Free Float (%) 39.9 3m Avg. Daily Val (US$m) 2.1 ICB Industry : Financials / Financial Services
DBS Group Research . Equity 13 Dec 2016
Indonesia Company Guide
Bank Tabungan Negara Version 7 | Bloomberg: BBTN IJ | Reuters: BBTN.JK Refer to important disclosures at the end of this report
47
67
87
107
127
147
167
187
207
756.0
956.0
1,156.0
1,356.0
1,556.0
1,756.0
1,956.0
2,156.0
Dec-12 Dec-13 Dec-14 Dec-15 Dec-16
Relative IndexRp
Bank Tabungan Negara (LHS) Relative JCI (RHS)
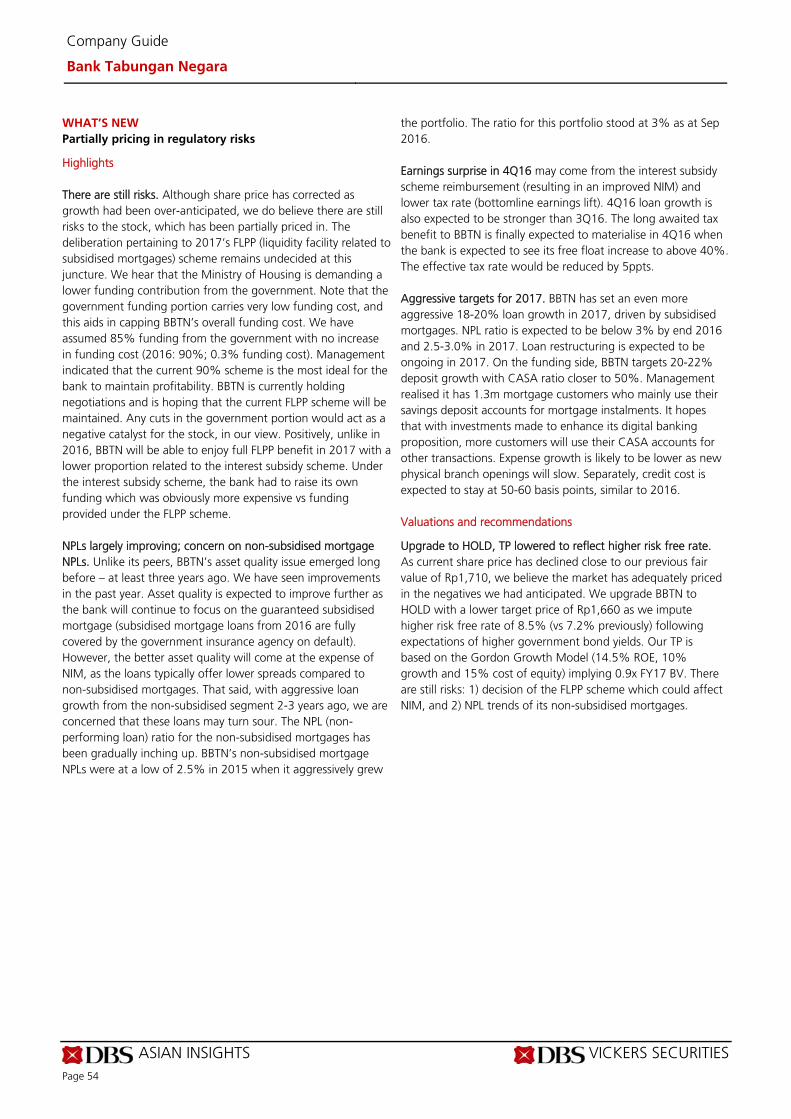
ASIAN INSIGHTS VICKERS SECURITIES Page 54
Company Guide
Bank Tabungan Negara
WHAT’S NEW
Partially pricing in regulatory risks
Highlights There are still risks. Although share price has corrected as growth had been over-anticipated, we do believe there are still risks to the stock, which has been partially priced in. The deliberation pertaining to 2017’s FLPP (liquidity facility related to subsidised mortgages) scheme remains undecided at this juncture. We hear that the Ministry of Housing is demanding a lower funding contribution from the government. Note that the government funding portion carries very low funding cost, and this aids in capping BBTN’s overall funding cost. We have assumed 85% funding from the government with no increase in funding cost (2016: 90%; 0.3% funding cost). Management indicated that the current 90% scheme is the most ideal for the bank to maintain profitability. BBTN is currently holding negotiations and is hoping that the current FLPP scheme will be maintained. Any cuts in the government portion would act as a negative catalyst for the stock, in our view. Positively, unlike in 2016, BBTN will be able to enjoy full FLPP benefit in 2017 with a lower proportion related to the interest subsidy scheme. Under the interest subsidy scheme, the bank had to raise its own funding which was obviously more expensive vs funding provided under the FLPP scheme. NPLs largely improving; concern on non-subsidised mortgage NPLs. Unlike its peers, BBTN’s asset quality issue emerged long before – at least three years ago. We have seen improvements in the past year. Asset quality is expected to improve further as the bank will continue to focus on the guaranteed subsidised mortgage (subsidised mortgage loans from 2016 are fully covered by the government insurance agency on default). However, the better asset quality will come at the expense of NIM, as the loans typically offer lower spreads compared to non-subsidised mortgages. That said, with aggressive loan growth from the non-subsidised segment 2-3 years ago, we are concerned that these loans may turn sour. The NPL (non-performing loan) ratio for the non-subsidised mortgages has been gradually inching up. BBTN’s non-subsidised mortgage NPLs were at a low of 2.5% in 2015 when it aggressively grew
the portfolio. The ratio for this portfolio stood at 3% as at Sep 2016. Earnings surprise in 4Q16 may come from the interest subsidy scheme reimbursement (resulting in an improved NIM) and lower tax rate (bottomline earnings lift). 4Q16 loan growth is also expected to be stronger than 3Q16. The long awaited tax benefit to BBTN is finally expected to materialise in 4Q16 when the bank is expected to see its free float increase to above 40%. The effective tax rate would be reduced by 5ppts. Aggressive targets for 2017. BBTN has set an even more aggressive 18-20% loan growth in 2017, driven by subsidised mortgages. NPL ratio is expected to be below 3% by end 2016 and 2.5-3.0% in 2017. Loan restructuring is expected to be ongoing in 2017. On the funding side, BBTN targets 20-22% deposit growth with CASA ratio closer to 50%. Management realised it has 1.3m mortgage customers who mainly use their savings deposit accounts for mortgage instalments. It hopes that with investments made to enhance its digital banking proposition, more customers will use their CASA accounts for other transactions. Expense growth is likely to be lower as new physical branch openings will slow. Separately, credit cost is expected to stay at 50-60 basis points, similar to 2016. Valuations and recommendations
Upgrade to HOLD, TP lowered to reflect higher risk free rate. As current share price has declined close to our previous fair value of Rp1,710, we believe the market has adequately priced in the negatives we had anticipated. We upgrade BBTN to HOLD with a lower target price of Rp1,660 as we impute higher risk free rate of 8.5% (vs 7.2% previously) following expectations of higher government bond yields. Our TP is based on the Gordon Growth Model (14.5% ROE, 10% growth and 15% cost of equity) implying 0.9x FY17 BV. There are still risks: 1) decision of the FLPP scheme which could affect NIM, and 2) NPL trends of its non-subsidised mortgages.
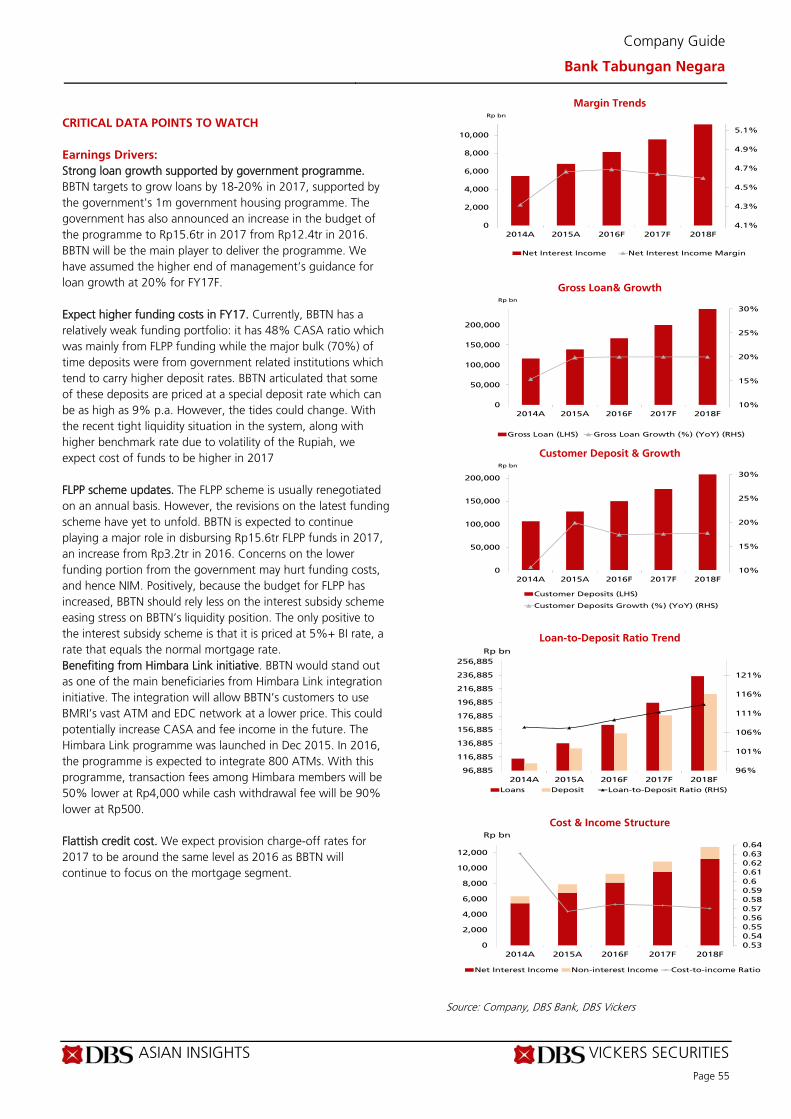
ASIAN INSIGHTS VICKERS SECURITIES Page 55
Company Guide
Bank Tabungan Negara
CRITICAL DATA POINTS TO WATCH
Earnings Drivers:
Strong loan growth supported by government programme. BBTN targets to grow loans by 18-20% in 2017, supported by the government's 1m government housing programme. The government has also announced an increase in the budget of the programme to Rp15.6tr in 2017 from Rp12.4tr in 2016. BBTN will be the main player to deliver the programme. We have assumed the higher end of management’s guidance for loan growth at 20% for FY17F. Expect higher funding costs in FY17. Currently, BBTN has a relatively weak funding portfolio: it has 48% CASA ratio which was mainly from FLPP funding while the major bulk (70%) of time deposits were from government related institutions which tend to carry higher deposit rates. BBTN articulated that some of these deposits are priced at a special deposit rate which can be as high as 9% p.a. However, the tides could change. With the recent tight liquidity situation in the system, along with higher benchmark rate due to volatility of the Rupiah, we expect cost of funds to be higher in 2017 FLPP scheme updates. The FLPP scheme is usually renegotiated on an annual basis. However, the revisions on the latest funding scheme have yet to unfold. BBTN is expected to continue playing a major role in disbursing Rp15.6tr FLPP funds in 2017, an increase from Rp3.2tr in 2016. Concerns on the lower funding portion from the government may hurt funding costs, and hence NIM. Positively, because the budget for FLPP has increased, BBTN should rely less on the interest subsidy scheme easing stress on BBTN’s liquidity position. The only positive to the interest subsidy scheme is that it is priced at 5%+ BI rate, a rate that equals the normal mortgage rate. Benefiting from Himbara Link initiative. BBTN would stand out as one of the main beneficiaries from Himbara Link integration initiative. The integration will allow BBTN’s customers to use BMRI’s vast ATM and EDC network at a lower price. This could potentially increase CASA and fee income in the future. The Himbara Link programme was launched in Dec 2015. In 2016, the programme is expected to integrate 800 ATMs. With this programme, transaction fees among Himbara members will be 50% lower at Rp4,000 while cash withdrawal fee will be 90% lower at Rp500. Flattish credit cost. We expect provision charge-off rates for 2017 to be around the same level as 2016 as BBTN will continue to focus on the mortgage segment.
Margin Trends
Gross Loan& Growth
Customer Deposit & Growth
Loan-to-Deposit Ratio Trend
Cost & Income Structure
Source: Company, DBS Bank, DBS Vickers
4.1%
4.3%
4.5%
4.7%
4.9%
5.1%
0
2,000
4,000
6,000
8,000
10,000
2014A 2015A 2016F 2017F 2018F
Rp bn
Net Interest Income Net Interest Income Margin
10%
15%
20%
25%
30%
0
50,000
100,000
150,000
200,000
2014A 2015A 2016F 2017F 2018F
Rp bn
Gross Loan (LHS) Gross Loan Growth (%) (YoY) (RHS)
10%
15%
20%
25%
30%
0
50,000
100,000
150,000
200,000
2014A 2015A 2016F 2017F 2018F
Rp bn
Customer Deposits (LHS)
Customer Deposits Growth (%) (YoY) (RHS)
96%
101%
106%
111%
116%
121%
96,885
116,885
136,885
156,885
176,885
196,885
216,885
236,885
256,885
2014A 2015A 2016F 2017F 2018F
Rp bn
Loans Deposit Loan-to-Deposit Ratio (RHS)
0.53
0.54
0.55
0.56
0.57
0.58
0.59
0.6
0.61
0.62
0.63
0.64
0
2,000
4,000
6,000
8,000
10,000
12,000
2014A 2015A 2016F 2017F 2018F
Rp bn
Net Interest Income Non-interest Income Cost-to-income Ratio
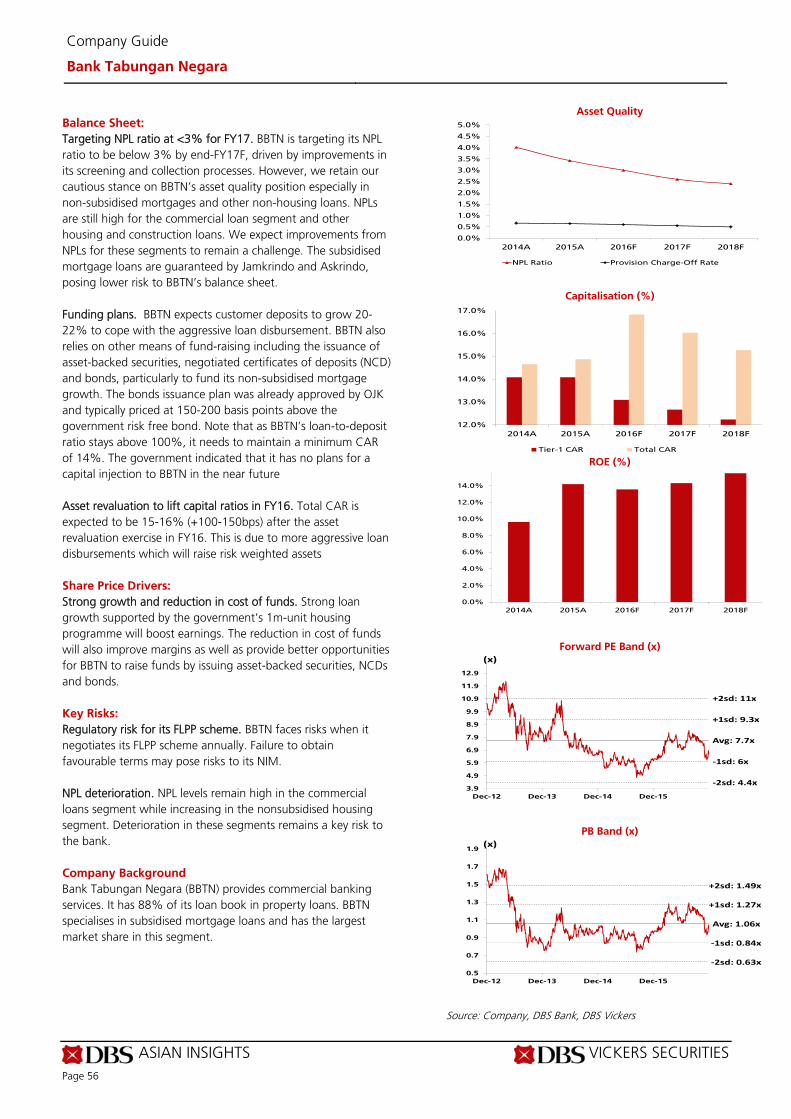
ASIAN INSIGHTS VICKERS SECURITIES Page 56
Company Guide
Bank Tabungan Negara
Balance Sheet:
Targeting NPL ratio at <3% for FY17. BBTN is targeting its NPL ratio to be below 3% by end-FY17F, driven by improvements in its screening and collection processes. However, we retain our cautious stance on BBTN’s asset quality position especially in non-subsidised mortgages and other non-housing loans. NPLs are still high for the commercial loan segment and other housing and construction loans. We expect improvements from NPLs for these segments to remain a challenge. The subsidised mortgage loans are guaranteed by Jamkrindo and Askrindo, posing lower risk to BBTN’s balance sheet. Funding plans. BBTN expects customer deposits to grow 20-22% to cope with the aggressive loan disbursement. BBTN also relies on other means of fund-raising including the issuance of asset-backed securities, negotiated certificates of deposits (NCD) and bonds, particularly to fund its non-subsidised mortgage growth. The bonds issuance plan was already approved by OJK and typically priced at 150-200 basis points above the government risk free bond. Note that as BBTN’s loan-to-deposit ratio stays above 100%, it needs to maintain a minimum CAR of 14%. The government indicated that it has no plans for a capital injection to BBTN in the near future Asset revaluation to lift capital ratios in FY16. Total CAR is expected to be 15-16% (+100-150bps) after the asset revaluation exercise in FY16. This is due to more aggressive loan disbursements which will raise risk weighted assets Share Price Drivers:
Strong growth and reduction in cost of funds. Strong loan growth supported by the government's 1m-unit housing programme will boost earnings. The reduction in cost of funds will also improve margins as well as provide better opportunities for BBTN to raise funds by issuing asset-backed securities, NCDs and bonds. Key Risks:
Regulatory risk for its FLPP scheme. BBTN faces risks when it negotiates its FLPP scheme annually. Failure to obtain favourable terms may pose risks to its NIM. NPL deterioration. NPL levels remain high in the commercial loans segment while increasing in the nonsubsidised housing segment. Deterioration in these segments remains a key risk to the bank. Company Background
Bank Tabungan Negara (BBTN) provides commercial banking services. It has 88% of its loan book in property loans. BBTN specialises in subsidised mortgage loans and has the largest market share in this segment.
Asset Quality
Capitalisation (%)
ROE (%)
Forward PE Band (x)
PB Band (x)
Source: Company, DBS Bank, DBS Vickers
0.0%
0.5%
1.0%
1.5%
2.0%
2.5%
3.0%
3.5%
4.0%
4.5%
5.0%
2014A 2015A 2016F 2017F 2018F
NPL Ratio Provision Charge-Off Rate
12.0%
13.0%
14.0%
15.0%
16.0%
17.0%
2014A 2015A 2016F 2017F 2018F
Tier-1 CAR Total CAR
0.0%
2.0%
4.0%
6.0%
8.0%
10.0%
12.0%
14.0%
2014A 2015A 2016F 2017F 2018F
Avg: 7.7x
+1sd: 9.3x
+2sd: 11x
‐1sd: 6x
‐2sd: 4.4x3.9
4.9
5.9
6.9
7.9
8.9
9.9
10.9
11.9
12.9
Dec-12 Dec-13 Dec-14 Dec-15
(x)
Avg: 1.06x
+1sd: 1.27x
+2sd: 1.49x
‐1sd: 0.84x
‐2sd: 0.63x
0.5
0.7
0.9
1.1
1.3
1.5
1.7
1.9
Dec-12 Dec-13 Dec-14 Dec-15
(x)
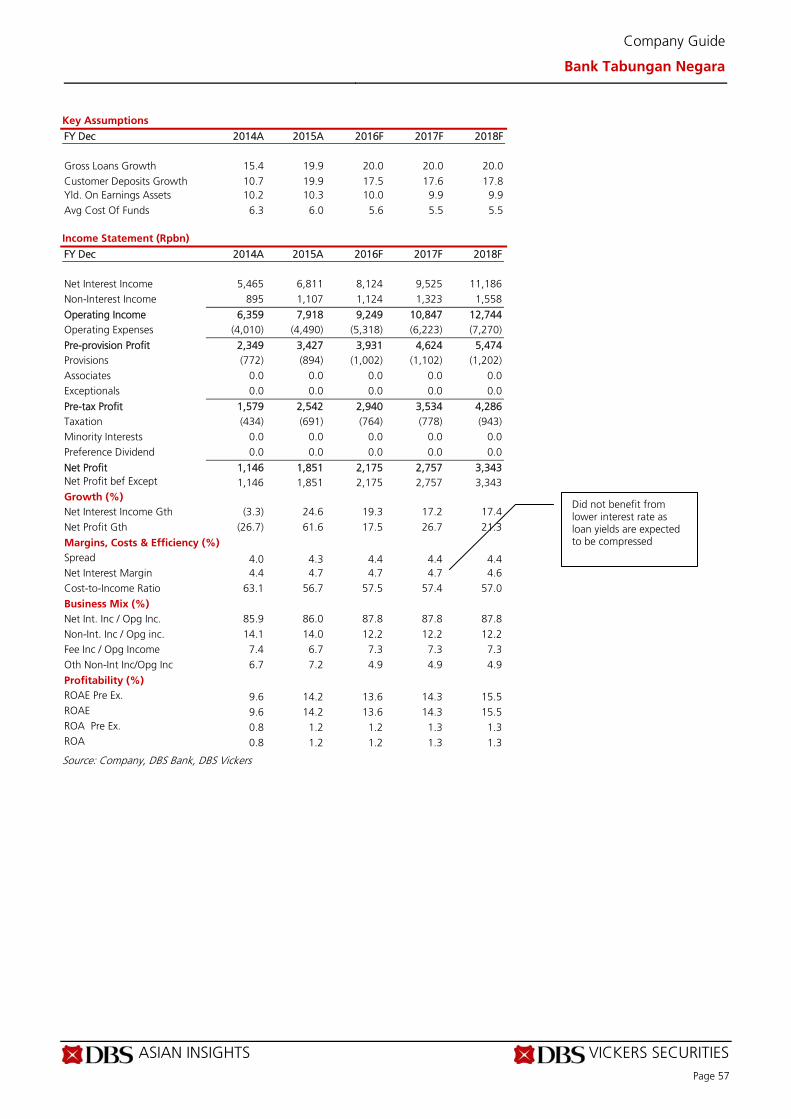
ASIAN INSIGHTS VICKERS SECURITIES Page 57
Company Guide
Bank Tabungan Negara
Key Assumptions
FY Dec 2014A 2015A 2016F 2017F 2018F
Gross Loans Growth 15.4 19.9 20.0 20.0 20.0 Customer Deposits Growth 10.7 19.9 17.5 17.6 17.8 Yld. On Earnings Assets 10.2 10.3 10.0 9.9 9.9 Avg Cost Of Funds 6.3 6.0 5.6 5.5 5.5 Income Statement (Rpbn)
FY Dec 2014A 2015A 2016F 2017F 2018F Net Interest Income 5,465 6,811 8,124 9,525 11,186 Non-Interest Income 895 1,107 1,124 1,323 1,558
Operating Income 6,359 7,918 9,249 10,847 12,744 Operating Expenses (4,010) (4,490) (5,318) (6,223) (7,270)
Pre-provision Profit 2,349 3,427 3,931 4,624 5,474 Provisions (772) (894) (1,002) (1,102) (1,202) Associates 0.0 0.0 0.0 0.0 0.0 Exceptionals 0.0 0.0 0.0 0.0 0.0
Pre-tax Profit 1,579 2,542 2,940 3,534 4,286 Taxation (434) (691) (764) (778) (943) Minority Interests 0.0 0.0 0.0 0.0 0.0 Preference Dividend 0.0 0.0 0.0 0.0 0.0
Net Profit 1,146 1,851 2,175 2,757 3,343 Net Profit bef Except 1,146 1,851 2,175 2,757 3,343 Growth (%) Net Interest Income Gth (3.3) 24.6 19.3 17.2 17.4 Net Profit Gth (26.7) 61.6 17.5 26.7 21.3
Margins, Costs & Efficiency (%) Spread 4.0 4.3 4.4 4.4 4.4 Net Interest Margin 4.4 4.7 4.7 4.7 4.6 Cost-to-Income Ratio 63.1 56.7 57.5 57.4 57.0
Business Mix (%) Net Int. Inc / Opg Inc. 85.9 86.0 87.8 87.8 87.8 Non-Int. Inc / Opg inc. 14.1 14.0 12.2 12.2 12.2 Fee Inc / Opg Income 7.4 6.7 7.3 7.3 7.3 Oth Non-Int Inc/Opg Inc 6.7 7.2 4.9 4.9 4.9
Profitability (%) ROAE Pre Ex. 9.6 14.2 13.6 14.3 15.5 ROAE 9.6 14.2 13.6 14.3 15.5 ROA Pre Ex. 0.8 1.2 1.2 1.3 1.3 ROA 0.8 1.2 1.2 1.3 1.3
Source: Company, DBS Bank, DBS Vickers
Did not benefit from lower interest rate as loan yields are expected to be compressed
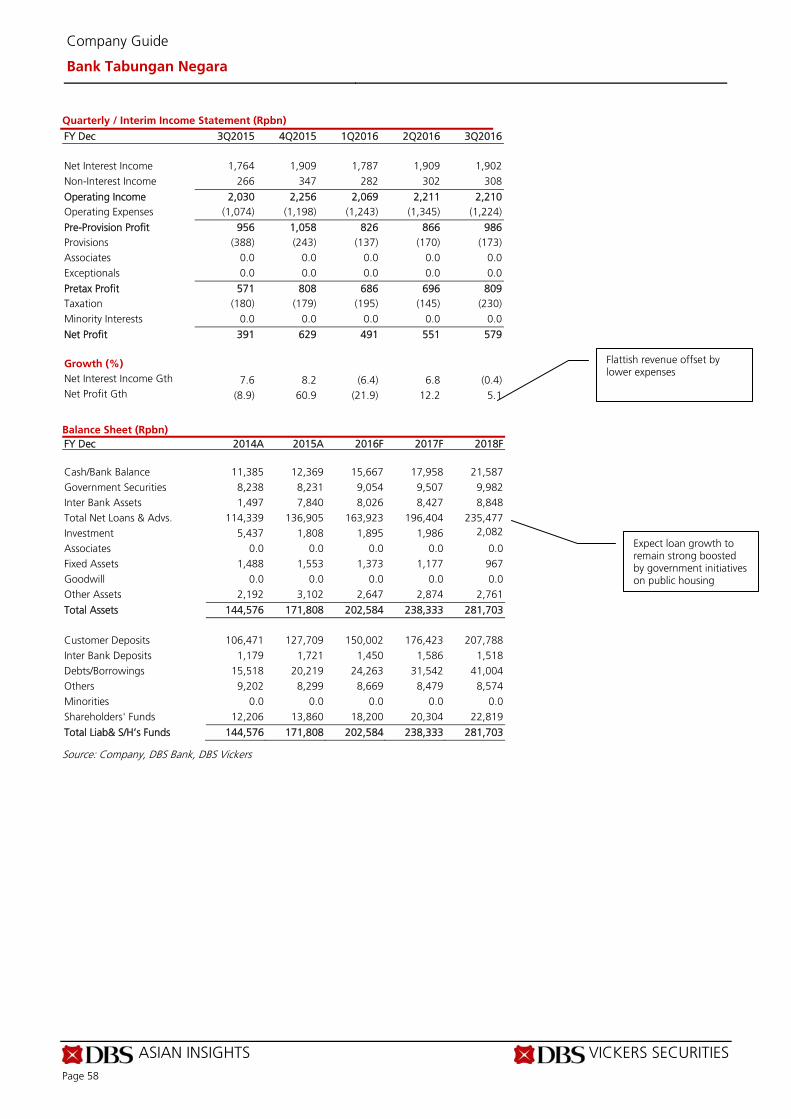
ASIAN INSIGHTS VICKERS SECURITIES Page 58
Company Guide
Bank Tabungan Negara
Quarterly / Interim Income Statement (Rpbn)
FY Dec 3Q2015 4Q2015 1Q2016 2Q2016 3Q2016 Net Interest Income 1,764 1,909 1,787 1,909 1,902 Non-Interest Income 266 347 282 302 308
Operating Income 2,030 2,256 2,069 2,211 2,210 Operating Expenses (1,074) (1,198) (1,243) (1,345) (1,224)
Pre-Provision Profit 956 1,058 826 866 986 Provisions (388) (243) (137) (170) (173) Associates 0.0 0.0 0.0 0.0 0.0 Exceptionals 0.0 0.0 0.0 0.0 0.0
Pretax Profit 571 808 686 696 809 Taxation (180) (179) (195) (145) (230) Minority Interests 0.0 0.0 0.0 0.0 0.0
Net Profit 391 629 491 551 579
Growth (%) Net Interest Income Gth 7.6 8.2 (6.4) 6.8 (0.4) Net Profit Gth (8.9) 60.9 (21.9) 12.2 5.1
Balance Sheet (Rpbn)
FY Dec 2014A 2015A 2016F 2017F 2018F Cash/Bank Balance 11,385 12,369 15,667 17,958 21,587 Government Securities 8,238 8,231 9,054 9,507 9,982 Inter Bank Assets 1,497 7,840 8,026 8,427 8,848 Total Net Loans & Advs. 114,339 136,905 163,923 196,404 235,477 Investment 5,437 1,808 1,895 1,986 2,082
Associates 0.0 0.0 0.0 0.0 0.0 Fixed Assets 1,488 1,553 1,373 1,177 967 Goodwill 0.0 0.0 0.0 0.0 0.0 Other Assets 2,192 3,102 2,647 2,874 2,761
Total Assets 144,576 171,808 202,584 238,333 281,703 Customer Deposits 106,471 127,709 150,002 176,423 207,788 Inter Bank Deposits 1,179 1,721 1,450 1,586 1,518 Debts/Borrowings 15,518 20,219 24,263 31,542 41,004 Others 9,202 8,299 8,669 8,479 8,574 Minorities 0.0 0.0 0.0 0.0 0.0 Shareholders' Funds 12,206 13,860 18,200 20,304 22,819
Total Liab& S/H’s Funds 144,576 171,808 202,584 238,333 281,703
Source: Company, DBS Bank, DBS Vickers
Flattish revenue offset by lower expenses
Expect loan growth to remain strong boosted by government initiatives on public housing
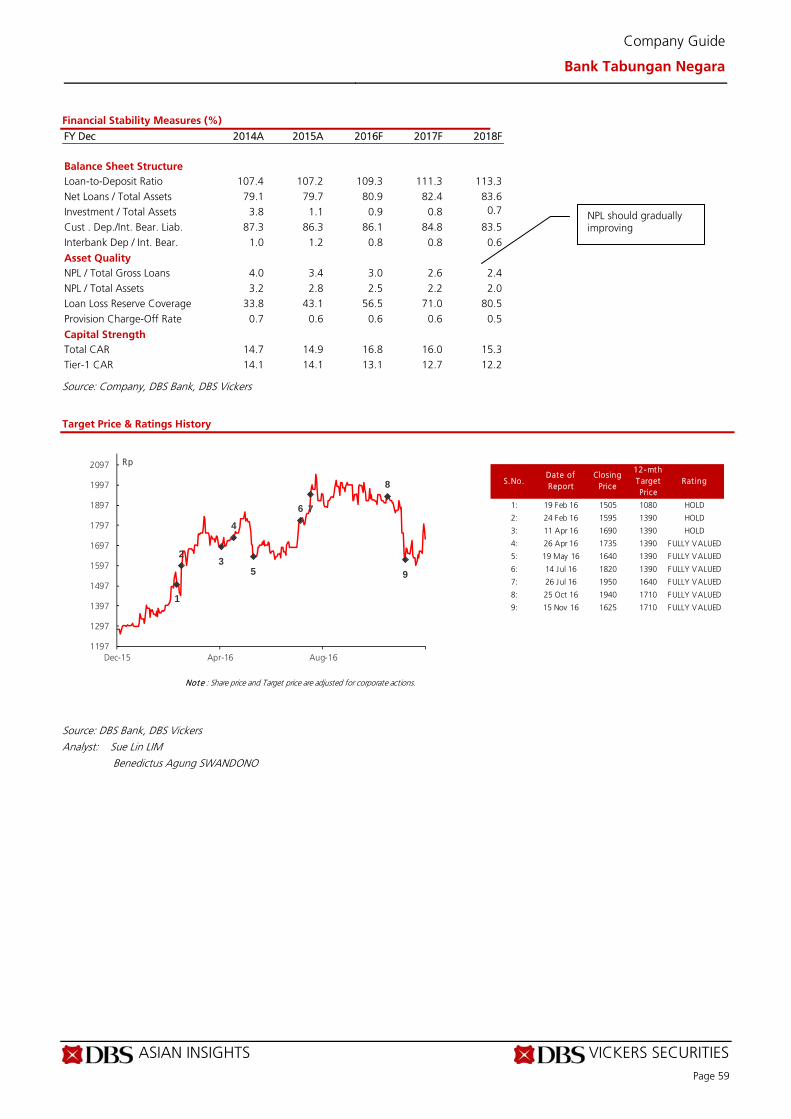
ASIAN INSIGHTS VICKERS SECURITIES Page 59
Company Guide
Bank Tabungan Negara
Financial Stability Measures (%)
FY Dec 2014A 2015A 2016F 2017F 2018F Balance Sheet Structure Loan-to-Deposit Ratio 107.4 107.2 109.3 111.3 113.3 Net Loans / Total Assets 79.1 79.7 80.9 82.4 83.6 Investment / Total Assets 3.8 1.1 0.9 0.8 0.7
Cust . Dep./Int. Bear. Liab. 87.3 86.3 86.1 84.8 83.5 Interbank Dep / Int. Bear. 1.0 1.2 0.8 0.8 0.6
Asset Quality NPL / Total Gross Loans 4.0 3.4 3.0 2.6 2.4 NPL / Total Assets 3.2 2.8 2.5 2.2 2.0 Loan Loss Reserve Coverage 33.8 43.1 56.5 71.0 80.5 Provision Charge-Off Rate 0.7 0.6 0.6 0.6 0.5
Capital Strength Total CAR 14.7 14.9 16.8 16.0 15.3 Tier-1 CAR 14.1 14.1 13.1 12.7 12.2
Source: Company, DBS Bank, DBS Vickers
Target Price & Ratings History
Source: DBS Bank, DBS Vickers Analyst: Sue Lin LIM
Benedictus Agung SWANDONO
S.No.Date of Report
Closing Price
12-mth Target Price
Rat ing
1: 19 Feb 16 1505 1080 HOLD
2: 24 Feb 16 1595 1390 HOLD
3: 11 Apr 16 1690 1390 HOLD
4: 26 Apr 16 1735 1390 FULLY VALUED
5: 19 May 16 1640 1390 FULLY VALUED
6: 14 Jul 16 1820 1390 FULLY VALUED
7: 26 Jul 16 1950 1640 FULLY VALUED
8: 25 Oct 16 1940 1710 FULLY VALUED
9: 15 Nov 16 1625 1710 FULLY VALUED
Note : Share price and Target price are adjusted for corporate actions.
1
23
4
5
6 7
8
9
1197
1297
1397
1497
1597
1697
1797
1897
1997
2097
Dec-15 Apr-16 Aug-16
Rp
NPL should gradually improving
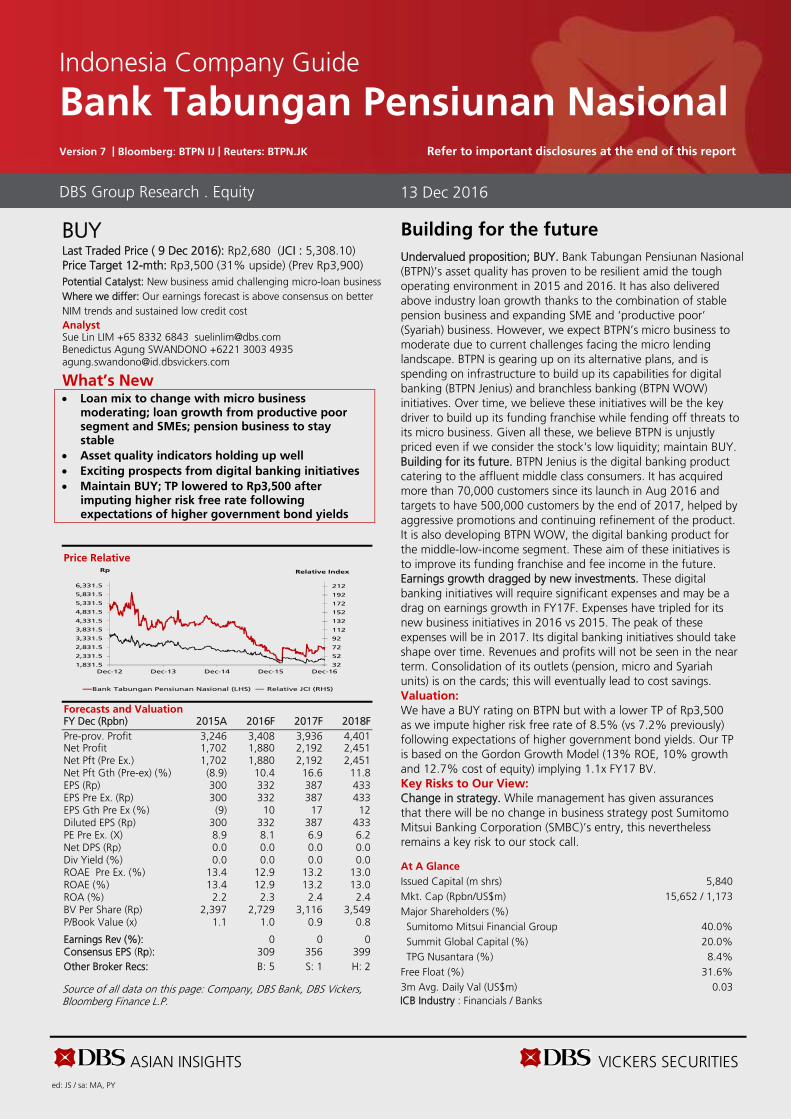
ASIAN INSIGHTS VICKERS SECURITIES ed: JS / sa: MA, PY
BUY Last Traded Price ( 9 Dec 2016): Rp2,680 (JCI : 5,308.10) Price Target 12-mth: Rp3,500 (31% upside) (Prev Rp3,900) Potential Catalyst: New business amid challenging micro-loan business Where we differ: Our earnings forecast is above consensus on better NIM trends and sustained low credit cost Analyst Sue Lin LIM +65 8332 6843 [email protected] Benedictus Agung SWANDONO +6221 3003 4935 [email protected]
What’s New Loan mix to change with micro business
moderating; loan growth from productive poor segment and SMEs; pension business to stay stable
Asset quality indicators holding up well Exciting prospects from digital banking initiatives Maintain BUY; TP lowered to Rp3,500 after
imputing higher risk free rate following expectations of higher government bond yields
Price Relative
Forecasts and Valuation FY Dec (Rpbn) 2015A 2016F 2017F 2018F Pre-prov. Profit 3,246 3,408 3,936 4,401 Net Profit 1,702 1,880 2,192 2,451 Net Pft (Pre Ex.) 1,702 1,880 2,192 2,451 Net Pft Gth (Pre-ex) (%) (8.9) 10.4 16.6 11.8 EPS (Rp) 300 332 387 433 EPS Pre Ex. (Rp) 300 332 387 433 EPS Gth Pre Ex (%) (9) 10 17 12 Diluted EPS (Rp) 300 332 387 433 PE Pre Ex. (X) 8.9 8.1 6.9 6.2 Net DPS (Rp) 0.0 0.0 0.0 0.0 Div Yield (%) 0.0 0.0 0.0 0.0 ROAE Pre Ex. (%) 13.4 12.9 13.2 13.0 ROAE (%) 13.4 12.9 13.2 13.0 ROA (%) 2.2 2.3 2.4 2.4 BV Per Share (Rp) 2,397 2,729 3,116 3,549 P/Book Value (x) 1.1 1.0 0.9 0.8 Earnings Rev (%): 0 0 0 Consensus EPS (Rp): 309 356 399 Other Broker Recs: B: 5 S: 1 H: 2
Source of all data on this page: Company, DBS Bank, DBS Vickers, Bloomberg Finance L.P.
Building for the future
Undervalued proposition; BUY. Bank Tabungan Pensiunan Nasional (BTPN)’s asset quality has proven to be resilient amid the tough operating environment in 2015 and 2016. It has also delivered above industry loan growth thanks to the combination of stable pension business and expanding SME and ‘productive poor’ (Syariah) business. However, we expect BTPN’s micro business to moderate due to current challenges facing the micro lending landscape. BTPN is gearing up on its alternative plans, and is spending on infrastructure to build up its capabilities for digital banking (BTPN Jenius) and branchless banking (BTPN WOW) initiatives. Over time, we believe these initiatives will be the key driver to build up its funding franchise while fending off threats to its micro business. Given all these, we believe BTPN is unjustly priced even if we consider the stock's low liquidity; maintain BUY. Building for its future. BTPN Jenius is the digital banking product catering to the affluent middle class consumers. It has acquired more than 70,000 customers since its launch in Aug 2016 and targets to have 500,000 customers by the end of 2017, helped by aggressive promotions and continuing refinement of the product. It is also developing BTPN WOW, the digital banking product for the middle-low-income segment. These aim of these initiatives is to improve its funding franchise and fee income in the future. Earnings growth dragged by new investments. These digital banking initiatives will require significant expenses and may be a drag on earnings growth in FY17F. Expenses have tripled for its new business initiatives in 2016 vs 2015. The peak of these expenses will be in 2017. Its digital banking initiatives should take shape over time. Revenues and profits will not be seen in the near term. Consolidation of its outlets (pension, micro and Syariah units) is on the cards; this will eventually lead to cost savings. Valuation:
We have a BUY rating on BTPN but with a lower TP of Rp3,500 as we impute higher risk free rate of 8.5% (vs 7.2% previously) following expectations of higher government bond yields. Our TP is based on the Gordon Growth Model (13% ROE, 10% growth and 12.7% cost of equity) implying 1.1x FY17 BV. Key Risks to Our View:
Change in strategy. While management has given assurances that there will be no change in business strategy post Sumitomo Mitsui Banking Corporation (SMBC)’s entry, this nevertheless remains a key risk to our stock call.
At A Glance Issued Capital (m shrs) 5,840 Mkt. Cap (Rpbn/US$m) 15,652 / 1,173 Major Shareholders (%) Sumitomo Mitsui Financial Group 40.0% Summit Global Capital (%) 20.0% TPG Nusantara (%) 8.4%
Free Float (%) 31.6% 3m Avg. Daily Val (US$m) 0.03 ICB Industry : Financials / Banks
DBS Group Research . Equity 13 Dec 2016
Indonesia Company Guide
Bank Tabungan Pensiunan Nasional Version 7 | Bloomberg: BTPN IJ | Reuters: BTPN.JK Refer to important disclosures at the end of this report
32
52
72
92
112
132
152
172
192
212
1,831.5
2,331.5
2,831.5
3,331.5
3,831.5
4,331.5
4,831.5
5,331.5
5,831.5
6,331.5
Dec-12 Dec-13 Dec-14 Dec-15 Dec-16
Relative IndexRp
Bank Tabungan Pensiunan Nasional (LHS) Relative JCI (RHS)
ASIAN INSIGHTS VICKERS SECURITIES Page 61
Company Guide
Bank Tabungan Pensiunan Nasional
WHAT’S NEW
Building for the future
Highlights Growth from productive poor and SME loans. BTPN is able to maintain above industry loan growth thanks to its SME and the successful productive poor (Syariah) products. Loan growth will stay at the 10% range with focus on SME and syariah loans. BTPN’s funding costs have declined by a good 180-185bps for the year, which explains why its net interest margin (NIM) has risen so far in 2016. NIM has stayed high at c.12% level while NPL (non-performing loan) is the lowest in among our coverage. That said, NIM is expected to trend lower in 2017 as benefits from low funding costs wear off. Managing well. Contrary to its peers, BTPN is not saddled with asset quality issues. Even then, management remains watchful of its loan portfolio. Collections were stepped up in the past two years to ensure its portfolio remains robust. Although BTPN is not likely to achieve the single-digit lending rate levels, its ability to demonstrate that lending rates for new loans are priced down to the quantum of its funding cost reduction has satisfied regulators. Alternative business plans to pave the way. Over time, we expect BTPN to gain more traction in its initiatives for BTPN Jenius and BTPN WOW. These would gradually alter BTPN’s funding franchise and product offering. Unlike its peers, which have dabbled in the branchless banking arena, BTPN stands to benefit the most given its high funding cost. An increase in CASA benefits BTPN’s funding cost profile. It is too early to quantify the profitability of these products but the adoption of these products has been quite decent. Betting on digital. The bank is continuing to bet on its digital banking initiative. BTPN Jenius, the digital banking product to
cater to the affluent middle class consumers, has acquired more than 70,000 customers since its launch in August. Next year it targets to have 500,000 customers, helped by aggressive promotion and continuing refinement of the product. Furthermore, the bank is also developing the BTPN WOW, the digital banking product for the middle- to low-income segment. With the latest IT technology, BTPN is aiming to reach out further to the unbankable population, such as by launching the Pico loans (loans with ticket size even smaller than micro). Higher expenses for new investments. All these digital banking initiatives will require significant expenses and therefore may drag earnings growth. Expenses have tripled for its new business initiatives compared to a year ago. The peak of expenses will be in 2017. Consolidation of its outlets (pension, micro and Syariah units) is on the cards and over time, this should lead to cost savings. Over time, the digital banking initiatives should take shape. Revenues and profits will not be seen in the near term. Management is expecting some positive inflows by 2H18. The full impact of these initiatives will be seen in 2019-2020.
Valuation and recommendations
Maintain BUY, TP lowered to Rp3,500. We have a BUY rating on BTPN with a lower target price of Rp3,500 as we impute higher risk free rate of 8.5% (vs 7.2% previously) following sustained correction in the government bond yield. Our TP is based on the Gordon Growth Model (13% ROE, 10% growth and 12.7% cost of equity) implying 1.1x FY17 BV. We reckon that the low liquidity of the stock does hamper investor interest and trading of the stock, which are key risks to our bullish view on the stock. Fundamentally, we believe BTPN is on solid ground as a long-term value proposition bank.
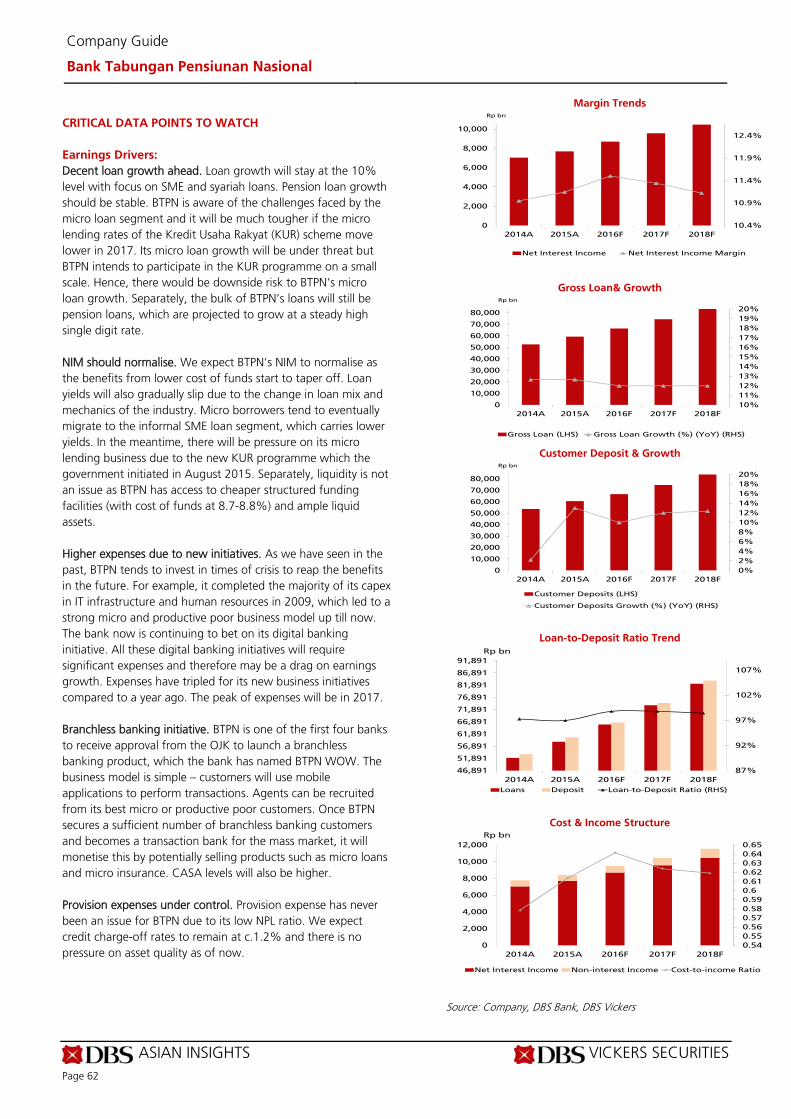
ASIAN INSIGHTS VICKERS SECURITIES Page 62
Company Guide
Bank Tabungan Pensiunan Nasional
CRITICAL DATA POINTS TO WATCH
Earnings Drivers:
Decent loan growth ahead. Loan growth will stay at the 10% level with focus on SME and syariah loans. Pension loan growth should be stable. BTPN is aware of the challenges faced by the micro loan segment and it will be much tougher if the micro lending rates of the Kredit Usaha Rakyat (KUR) scheme move lower in 2017. Its micro loan growth will be under threat but BTPN intends to participate in the KUR programme on a small scale. Hence, there would be downside risk to BTPN’s micro loan growth. Separately, the bulk of BTPN’s loans will still be pension loans, which are projected to grow at a steady high single digit rate. NIM should normalise. We expect BTPN’s NIM to normalise as the benefits from lower cost of funds start to taper off. Loan yields will also gradually slip due to the change in loan mix and mechanics of the industry. Micro borrowers tend to eventually migrate to the informal SME loan segment, which carries lower yields. In the meantime, there will be pressure on its micro lending business due to the new KUR programme which the government initiated in August 2015. Separately, liquidity is not an issue as BTPN has access to cheaper structured funding facilities (with cost of funds at 8.7-8.8%) and ample liquid assets. Higher expenses due to new initiatives. As we have seen in the past, BTPN tends to invest in times of crisis to reap the benefits in the future. For example, it completed the majority of its capex in IT infrastructure and human resources in 2009, which led to a strong micro and productive poor business model up till now. The bank now is continuing to bet on its digital banking initiative. All these digital banking initiatives will require significant expenses and therefore may be a drag on earnings growth. Expenses have tripled for its new business initiatives compared to a year ago. The peak of expenses will be in 2017. Branchless banking initiative. BTPN is one of the first four banks to receive approval from the OJK to launch a branchless banking product, which the bank has named BTPN WOW. The business model is simple – customers will use mobile applications to perform transactions. Agents can be recruited from its best micro or productive poor customers. Once BTPN secures a sufficient number of branchless banking customers and becomes a transaction bank for the mass market, it will monetise this by potentially selling products such as micro loans and micro insurance. CASA levels will also be higher. Provision expenses under control. Provision expense has never been an issue for BTPN due to its low NPL ratio. We expect credit charge-off rates to remain at c.1.2% and there is no pressure on asset quality as of now.
Margin Trends
Gross Loan& Growth
Customer Deposit & Growth
Loan-to-Deposit Ratio Trend
Cost & Income Structure
Source: Company, DBS Bank, DBS Vickers
10.4%
10.9%
11.4%
11.9%
12.4%
0
2,000
4,000
6,000
8,000
10,000
2014A 2015A 2016F 2017F 2018F
Rp bn
Net Interest Income Net Interest Income Margin
10%
11%
12%
13%
14%
15%
16%
17%
18%
19%
20%
0
10,000
20,000
30,000
40,000
50,000
60,000
70,000
80,000
2014A 2015A 2016F 2017F 2018F
Rp bn
Gross Loan (LHS) Gross Loan Growth (%) (YoY) (RHS)
0%
2%
4%
6%
8%
10%
12%
14%
16%
18%
20%
0
10,000
20,000
30,000
40,000
50,000
60,000
70,000
80,000
2014A 2015A 2016F 2017F 2018F
Rp bn
Customer Deposits (LHS)
Customer Deposits Growth (%) (YoY) (RHS)
87%
92%
97%
102%
107%
46,891
51,891
56,891
61,891
66,891
71,891
76,891
81,891
86,891
91,891
2014A 2015A 2016F 2017F 2018F
Rp bn
Loans Deposit Loan-to-Deposit Ratio (RHS)
0.54
0.55
0.56
0.57
0.58
0.59
0.6
0.61
0.62
0.63
0.64
0.65
0
2,000
4,000
6,000
8,000
10,000
12,000
2014A 2015A 2016F 2017F 2018F
Rp bn
Net Interest Income Non-interest Income Cost-to-income Ratio
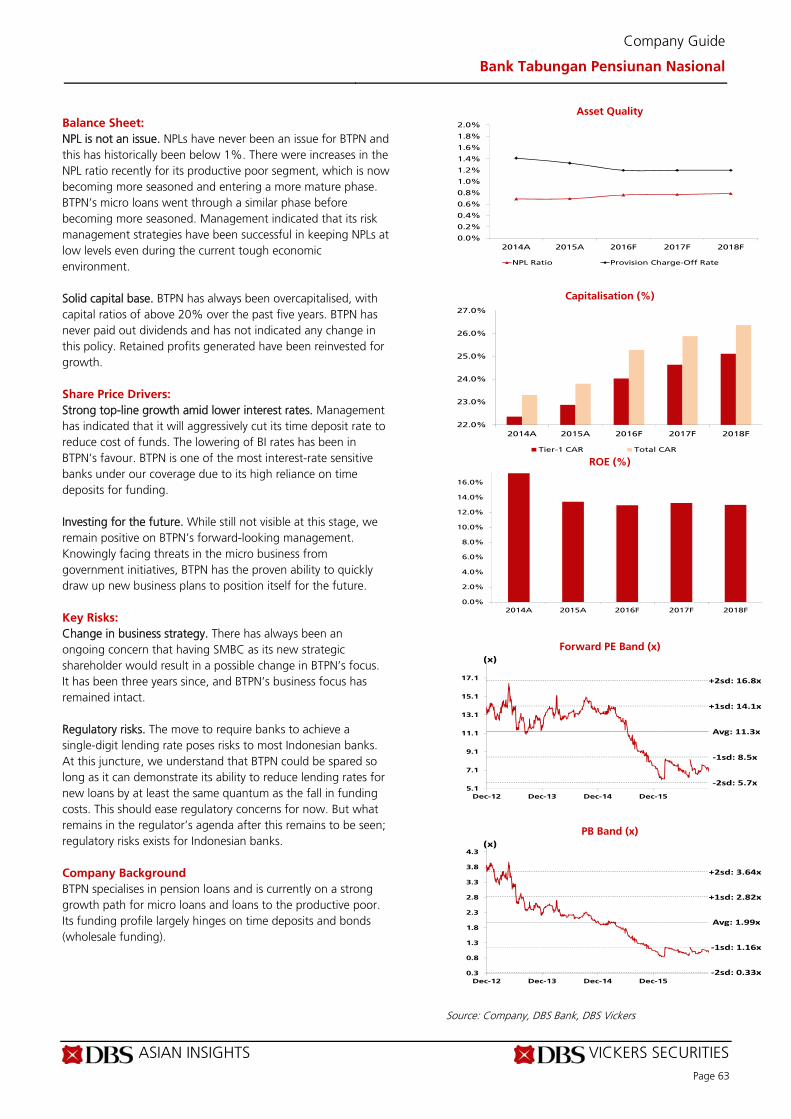
ASIAN INSIGHTS VICKERS SECURITIES Page 63
Company Guide
Bank Tabungan Pensiunan Nasional
Balance Sheet:
NPL is not an issue. NPLs have never been an issue for BTPN and this has historically been below 1%. There were increases in the NPL ratio recently for its productive poor segment, which is now becoming more seasoned and entering a more mature phase. BTPN’s micro loans went through a similar phase before becoming more seasoned. Management indicated that its risk management strategies have been successful in keeping NPLs at low levels even during the current tough economic environment. Solid capital base. BTPN has always been overcapitalised, with capital ratios of above 20% over the past five years. BTPN has never paid out dividends and has not indicated any change in this policy. Retained profits generated have been reinvested for growth. Share Price Drivers:
Strong top-line growth amid lower interest rates. Management has indicated that it will aggressively cut its time deposit rate to reduce cost of funds. The lowering of BI rates has been in BTPN’s favour. BTPN is one of the most interest-rate sensitive banks under our coverage due to its high reliance on time deposits for funding. Investing for the future. While still not visible at this stage, we remain positive on BTPN’s forward-looking management. Knowingly facing threats in the micro business from government initiatives, BTPN has the proven ability to quickly draw up new business plans to position itself for the future. Key Risks:
Change in business strategy. There has always been an ongoing concern that having SMBC as its new strategic shareholder would result in a possible change in BTPN’s focus. It has been three years since, and BTPN’s business focus has remained intact. Regulatory risks. The move to require banks to achieve a single-digit lending rate poses risks to most Indonesian banks. At this juncture, we understand that BTPN could be spared so long as it can demonstrate its ability to reduce lending rates for new loans by at least the same quantum as the fall in funding costs. This should ease regulatory concerns for now. But what remains in the regulator’s agenda after this remains to be seen; regulatory risks exists for Indonesian banks. Company Background
BTPN specialises in pension loans and is currently on a strong growth path for micro loans and loans to the productive poor. Its funding profile largely hinges on time deposits and bonds (wholesale funding).
Asset Quality
Capitalisation (%)
ROE (%)
Forward PE Band (x)
PB Band (x)
Source: Company, DBS Bank, DBS Vickers
0.0%
0.2%
0.4%
0.6%
0.8%
1.0%
1.2%
1.4%
1.6%
1.8%
2.0%
2014A 2015A 2016F 2017F 2018F
NPL Ratio Provision Charge-Off Rate
22.0%
23.0%
24.0%
25.0%
26.0%
27.0%
2014A 2015A 2016F 2017F 2018F
Tier-1 CAR Total CAR
0.0%
2.0%
4.0%
6.0%
8.0%
10.0%
12.0%
14.0%
16.0%
2014A 2015A 2016F 2017F 2018F
Avg: 11.3x
+1sd: 14.1x
+2sd: 16.8x
‐1sd: 8.5x
‐2sd: 5.7x5.1
7.1
9.1
11.1
13.1
15.1
17.1
Dec-12 Dec-13 Dec-14 Dec-15
(x)
Avg: 1.99x
+1sd: 2.82x
+2sd: 3.64x
‐1sd: 1.16x
‐2sd: 0.33x0.3
0.8
1.3
1.8
2.3
2.8
3.3
3.8
4.3
Dec-12 Dec-13 Dec-14 Dec-15
(x)

ASIAN INSIGHTS VICKERS SECURITIES Page 64
Company Guide
Bank Tabungan Pensiunan Nasional
Key Assumptions
FY Dec 2014A 2015A 2016F 2017F 2018F
Gross Loans Growth 12.6 12.6 12.0 12.0 12.0 Customer Deposits Growth 2.2 13.0 10.0 12.0 12.4 Yld. On Earnings Assets 19.1 18.8 18.7 18.6 18.4 Avg Cost Of Funds 8.7 8.3 7.9 7.9 7.9 Income Statement (Rpbn)
FY Dec 2014A 2015A 2016F 2017F 2018F Net Interest Income 7,041 7,696 8,704 9,570 10,466 Non-Interest Income 740 706 799 895 1,089
Operating Income 7,780 8,401 9,503 10,465 11,555 Operating Expenses (4,501) (5,156) (6,095) (6,529) (7,154)
Pre-provision Profit 3,279 3,246 3,408 3,936 4,401 Provisions (744) (786) (796) (892) (999) Associates 0.0 0.0 0.0 0.0 0.0 Exceptionals 0.0 0.0 0.0 0.0 0.0
Pre-tax Profit 2,523 2,433 2,581 3,010 3,366 Taxation (654) (680) (645) (753) (841) Minority Interests 0.0 (50.8) (56.1) (65.4) (73.1) Preference Dividend 0.0 0.0 0.0 0.0 0.0
Net Profit 1,869 1,702 1,880 2,192 2,451 Net Profit bef Except 1,869 1,702 1,880 2,192 2,451 Growth (%) Net Interest Income Gth (0.1) 9.3 13.1 10.0 9.4 Net Profit Gth (12.3) (8.9) 10.4 16.6 11.8
Margins, Costs & Efficiency (%) Spread 10.4 10.5 10.8 10.6 10.4 Net Interest Margin 10.9 11.1 11.5 11.3 11.1 Cost-to-Income Ratio 57.9 61.4 64.1 62.4 61.9
Business Mix (%) Net Int. Inc / Opg Inc. 90.5 91.6 91.6 91.4 90.6 Non-Int. Inc / Opg inc. 9.5 8.4 8.4 8.6 9.4 Fee Inc / Opg Income 9.5 8.4 8.4 8.6 9.4 Oth Non-Int Inc/Opg Inc 0.0 0.0 0.0 0.0 0.0
Profitability (%) ROAE Pre Ex. 17.2 13.4 12.9 13.2 13.0 ROAE 17.2 13.4 12.9 13.2 13.0 ROA Pre Ex. 2.6 2.2 2.3 2.4 2.4 ROA 2.6 2.2 2.3 2.4 2.4
Source: Company, DBS Bank, DBS Vickers
Top-line growth should remain healthy amid better NIM despite modest loan growth
NIM uplift in FY16 but should normalise as the benefit from lower funding costs starts to fade
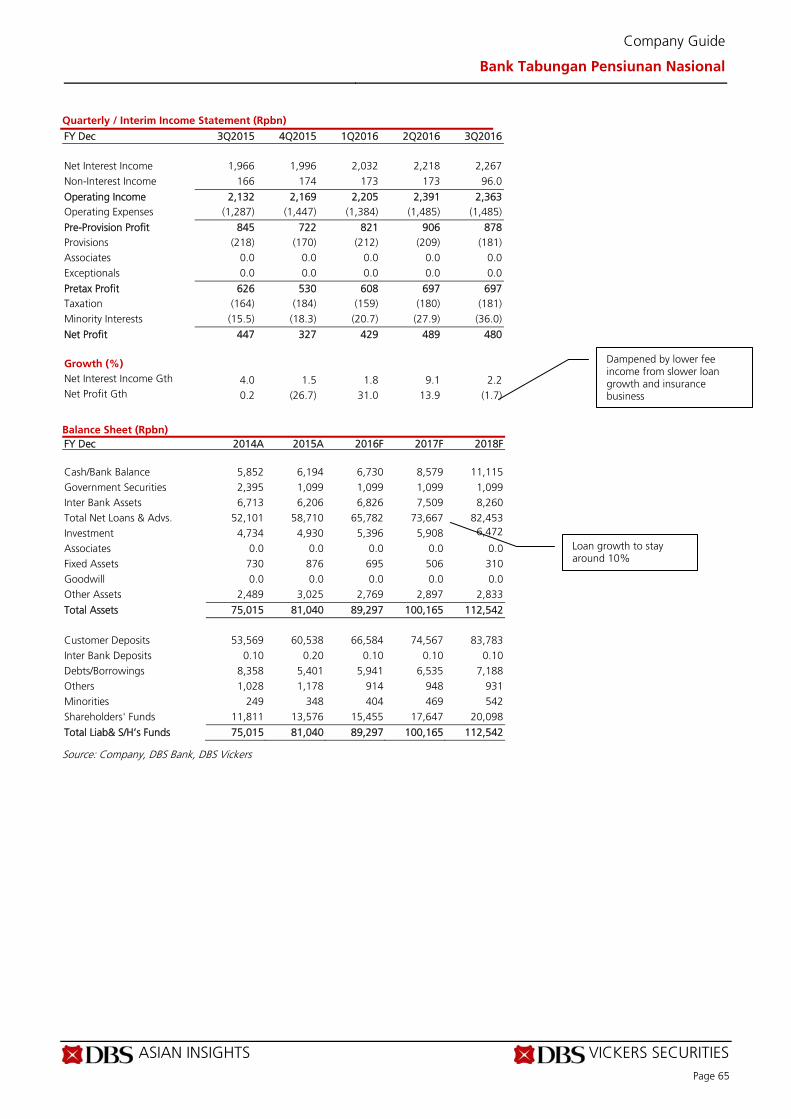
ASIAN INSIGHTS VICKERS SECURITIES Page 65
Company Guide
Bank Tabungan Pensiunan Nasional
Quarterly / Interim Income Statement (Rpbn)
FY Dec 3Q2015 4Q2015 1Q2016 2Q2016 3Q2016 Net Interest Income 1,966 1,996 2,032 2,218 2,267 Non-Interest Income 166 174 173 173 96.0
Operating Income 2,132 2,169 2,205 2,391 2,363 Operating Expenses (1,287) (1,447) (1,384) (1,485) (1,485)
Pre-Provision Profit 845 722 821 906 878 Provisions (218) (170) (212) (209) (181) Associates 0.0 0.0 0.0 0.0 0.0 Exceptionals 0.0 0.0 0.0 0.0 0.0
Pretax Profit 626 530 608 697 697 Taxation (164) (184) (159) (180) (181) Minority Interests (15.5) (18.3) (20.7) (27.9) (36.0)
Net Profit 447 327 429 489 480
Growth (%) Net Interest Income Gth 4.0 1.5 1.8 9.1 2.2 Net Profit Gth 0.2 (26.7) 31.0 13.9 (1.7)
Balance Sheet (Rpbn)
FY Dec 2014A 2015A 2016F 2017F 2018F Cash/Bank Balance 5,852 6,194 6,730 8,579 11,115 Government Securities 2,395 1,099 1,099 1,099 1,099 Inter Bank Assets 6,713 6,206 6,826 7,509 8,260 Total Net Loans & Advs. 52,101 58,710 65,782 73,667 82,453 Investment 4,734 4,930 5,396 5,908 6,472
Associates 0.0 0.0 0.0 0.0 0.0 Fixed Assets 730 876 695 506 310 Goodwill 0.0 0.0 0.0 0.0 0.0 Other Assets 2,489 3,025 2,769 2,897 2,833
Total Assets 75,015 81,040 89,297 100,165 112,542 Customer Deposits 53,569 60,538 66,584 74,567 83,783 Inter Bank Deposits 0.10 0.20 0.10 0.10 0.10 Debts/Borrowings 8,358 5,401 5,941 6,535 7,188 Others 1,028 1,178 914 948 931 Minorities 249 348 404 469 542 Shareholders' Funds 11,811 13,576 15,455 17,647 20,098
Total Liab& S/H’s Funds 75,015 81,040 89,297 100,165 112,542
Source: Company, DBS Bank, DBS Vickers
Dampened by lower fee income from slower loan growth and insurance business
Loan growth to stay around 10%
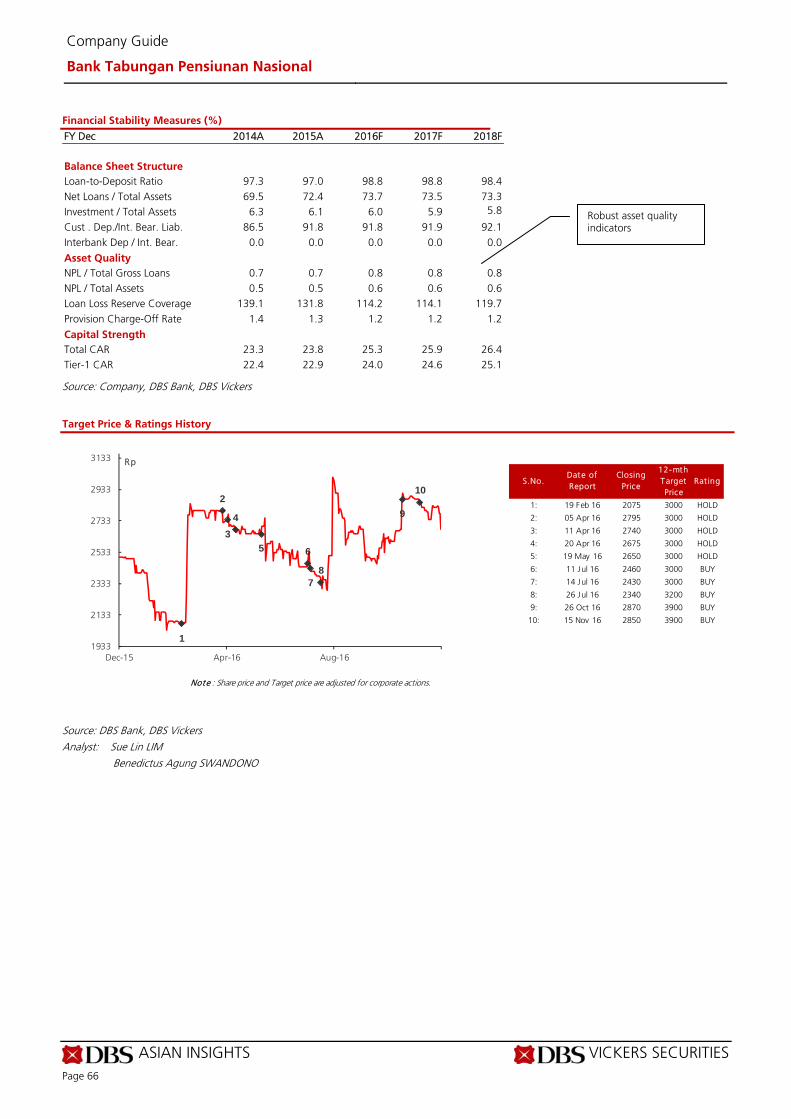
ASIAN INSIGHTS VICKERS SECURITIES Page 66
Company Guide
Bank Tabungan Pensiunan Nasional
Financial Stability Measures (%)
FY Dec 2014A 2015A 2016F 2017F 2018F Balance Sheet Structure Loan-to-Deposit Ratio 97.3 97.0 98.8 98.8 98.4 Net Loans / Total Assets 69.5 72.4 73.7 73.5 73.3 Investment / Total Assets 6.3 6.1 6.0 5.9 5.8
Cust . Dep./Int. Bear. Liab. 86.5 91.8 91.8 91.9 92.1 Interbank Dep / Int. Bear. 0.0 0.0 0.0 0.0 0.0
Asset Quality NPL / Total Gross Loans 0.7 0.7 0.8 0.8 0.8 NPL / Total Assets 0.5 0.5 0.6 0.6 0.6 Loan Loss Reserve Coverage 139.1 131.8 114.2 114.1 119.7 Provision Charge-Off Rate 1.4 1.3 1.2 1.2 1.2
Capital Strength Total CAR 23.3 23.8 25.3 25.9 26.4 Tier-1 CAR 22.4 22.9 24.0 24.6 25.1
Source: Company, DBS Bank, DBS Vickers
Target Price & Ratings History
Source: DBS Bank, DBS Vickers Analyst: Sue Lin LIM
Benedictus Agung SWANDONO
S.No.Date of Report
Closing Price
12-mth Target Price
Rat ing
1: 19 Feb 16 2075 3000 HOLD
2: 05 Apr 16 2795 3000 HOLD
3: 11 Apr 16 2740 3000 HOLD
4: 20 Apr 16 2675 3000 HOLD
5: 19 May 16 2650 3000 HOLD
6: 11 Jul 16 2460 3000 BUY
7: 14 Jul 16 2430 3000 BUY
8: 26 Jul 16 2340 3200 BUY
9: 26 Oct 16 2870 3900 BUY
10: 15 Nov 16 2850 3900 BUY
Note : Share price and Target price are adjusted for corporate actions.
1
2
3
4
5 6
78
9
10
1933
2133
2333
2533
2733
2933
3133
Dec-15 Apr-16 Aug-16
Rp
Robust asset quality indicators
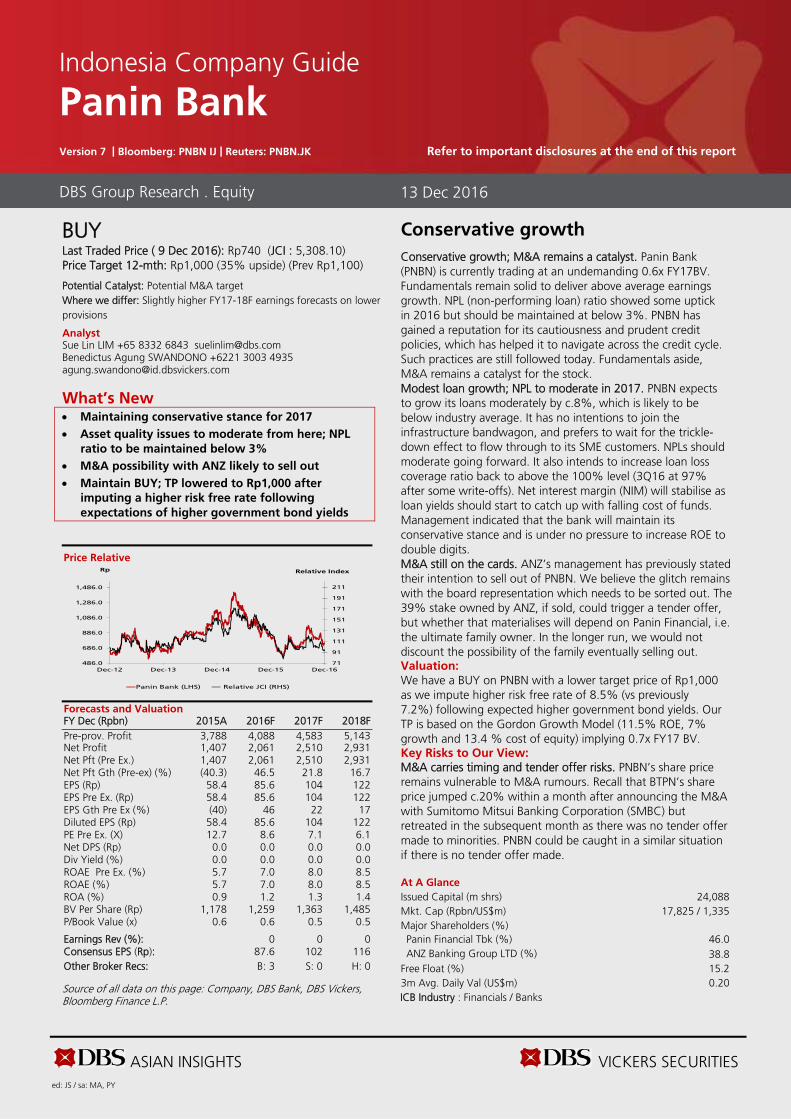
ASIAN INSIGHTS VICKERS SECURITIES ed: JS / sa: MA, PY
BUY Last Traded Price ( 9 Dec 2016): Rp740 (JCI : 5,308.10) Price Target 12-mth: Rp1,000 (35% upside) (Prev Rp1,100)
Potential Catalyst: Potential M&A target Where we differ: Slightly higher FY17-18F earnings forecasts on lower provisions
Analyst Sue Lin LIM +65 8332 6843 [email protected] Benedictus Agung SWANDONO +6221 3003 4935 [email protected]
What’s New Maintaining conservative stance for 2017 Asset quality issues to moderate from here; NPL
ratio to be maintained below 3% M&A possibility with ANZ likely to sell out Maintain BUY; TP lowered to Rp1,000 after
imputing a higher risk free rate following
expectations of higher government bond yields
Price Relative
Forecasts and Valuation FY Dec (Rpbn) 2015A 2016F 2017F 2018F Pre-prov. Profit 3,788 4,088 4,583 5,143 Net Profit 1,407 2,061 2,510 2,931 Net Pft (Pre Ex.) 1,407 2,061 2,510 2,931 Net Pft Gth (Pre-ex) (%) (40.3) 46.5 21.8 16.7 EPS (Rp) 58.4 85.6 104 122 EPS Pre Ex. (Rp) 58.4 85.6 104 122 EPS Gth Pre Ex (%) (40) 46 22 17 Diluted EPS (Rp) 58.4 85.6 104 122 PE Pre Ex. (X) 12.7 8.6 7.1 6.1 Net DPS (Rp) 0.0 0.0 0.0 0.0 Div Yield (%) 0.0 0.0 0.0 0.0 ROAE Pre Ex. (%) 5.7 7.0 8.0 8.5 ROAE (%) 5.7 7.0 8.0 8.5 ROA (%) 0.9 1.2 1.3 1.4 BV Per Share (Rp) 1,178 1,259 1,363 1,485 P/Book Value (x) 0.6 0.6 0.5 0.5 Earnings Rev (%): 0 0 0 Consensus EPS (Rp): 87.6 102 116 Other Broker Recs: B: 3 S: 0 H: 0
Source of all data on this page: Company, DBS Bank, DBS Vickers, Bloomberg Finance L.P.
Conservative growth
Conservative growth; M&A remains a catalyst. Panin Bank (PNBN) is currently trading at an undemanding 0.6x FY17BV. Fundamentals remain solid to deliver above average earnings growth. NPL (non-performing loan) ratio showed some uptick in 2016 but should be maintained at below 3%. PNBN has gained a reputation for its cautiousness and prudent credit policies, which has helped it to navigate across the credit cycle. Such practices are still followed today. Fundamentals aside, M&A remains a catalyst for the stock. Modest loan growth; NPL to moderate in 2017. PNBN expects to grow its loans moderately by c.8%, which is likely to be below industry average. It has no intentions to join the infrastructure bandwagon, and prefers to wait for the trickle-down effect to flow through to its SME customers. NPLs should moderate going forward. It also intends to increase loan loss coverage ratio back to above the 100% level (3Q16 at 97% after some write-offs). Net interest margin (NIM) will stabilise as loan yields should start to catch up with falling cost of funds. Management indicated that the bank will maintain its conservative stance and is under no pressure to increase ROE to double digits. M&A still on the cards. ANZ’s management has previously stated their intention to sell out of PNBN. We believe the glitch remains with the board representation which needs to be sorted out. The 39% stake owned by ANZ, if sold, could trigger a tender offer, but whether that materialises will depend on Panin Financial, i.e. the ultimate family owner. In the longer run, we would not discount the possibility of the family eventually selling out. Valuation:
We have a BUY on PNBN with a lower target price of Rp1,000 as we impute higher risk free rate of 8.5% (vs previously 7.2%) following expected higher government bond yields. Our TP is based on the Gordon Growth Model (11.5% ROE, 7% growth and 13.4 % cost of equity) implying 0.7x FY17 BV. Key Risks to Our View:
M&A carries timing and tender offer risks. PNBN’s share price remains vulnerable to M&A rumours. Recall that BTPN’s share price jumped c.20% within a month after announcing the M&A with Sumitomo Mitsui Banking Corporation (SMBC) but retreated in the subsequent month as there was no tender offer made to minorities. PNBN could be caught in a similar situation if there is no tender offer made. At A Glance Issued Capital (m shrs) 24,088 Mkt. Cap (Rpbn/US$m) 17,825 / 1,335 Major Shareholders (%) Panin Financial Tbk (%) 46.0 ANZ Banking Group LTD (%) 38.8
Free Float (%) 15.2 3m Avg. Daily Val (US$m) 0.20 ICB Industry : Financials / Banks
DBS Group Research . Equity 13 Dec 2016
Indonesia Company Guide
Panin Bank Version 7 | Bloomberg: PNBN IJ | Reuters: PNBN.JK Refer to important disclosures at the end of this report
71
91
111
131
151
171
191
211
486.0
686.0
886.0
1,086.0
1,286.0
1,486.0
Dec-12 Dec-13 Dec-14 Dec-15 Dec-16
Relative IndexRp
Panin Bank (LHS) Relative JCI (RHS)
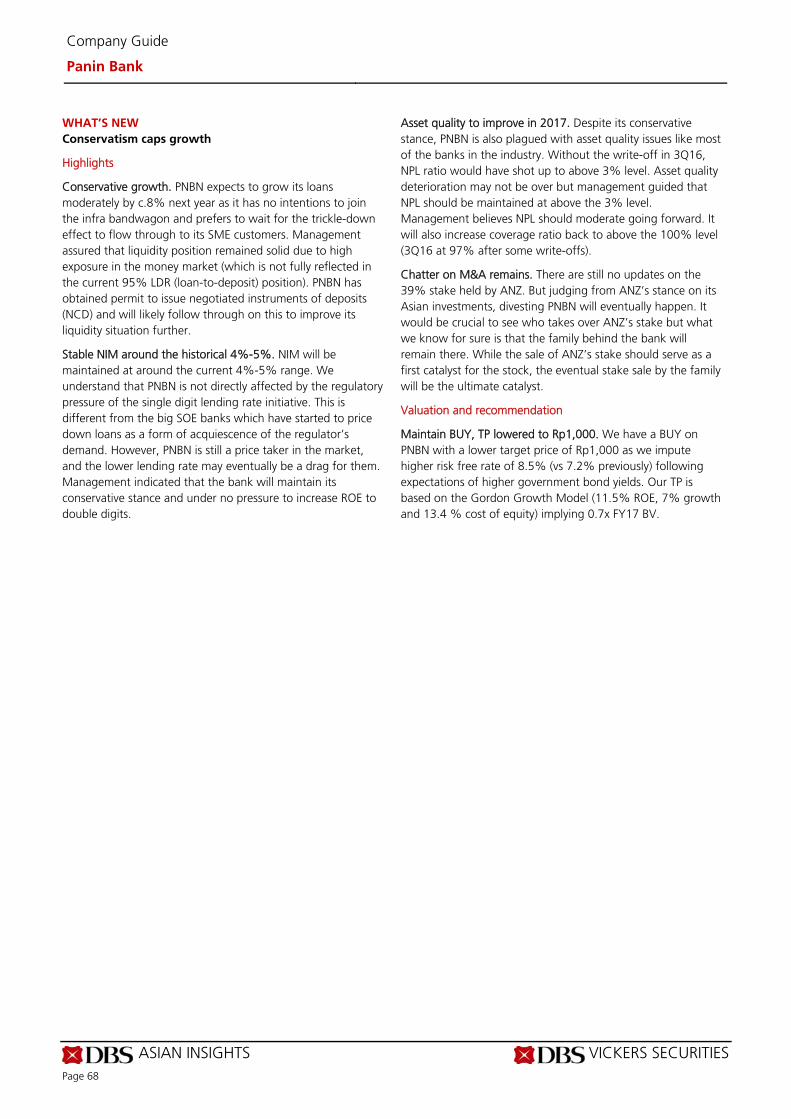
ASIAN INSIGHTS VICKERS SECURITIES Page 68
Company Guide
Panin Bank
WHAT’S NEW
Conservatism caps growth
Highlights
Conservative growth. PNBN expects to grow its loans moderately by c.8% next year as it has no intentions to join the infra bandwagon and prefers to wait for the trickle-down effect to flow through to its SME customers. Management assured that liquidity position remained solid due to high exposure in the money market (which is not fully reflected in the current 95% LDR (loan-to-deposit) position). PNBN has obtained permit to issue negotiated instruments of deposits (NCD) and will likely follow through on this to improve its liquidity situation further.
Stable NIM around the historical 4%-5%. NIM will be maintained at around the current 4%-5% range. We understand that PNBN is not directly affected by the regulatory pressure of the single digit lending rate initiative. This is different from the big SOE banks which have started to price down loans as a form of acquiescence of the regulator’s demand. However, PNBN is still a price taker in the market, and the lower lending rate may eventually be a drag for them. Management indicated that the bank will maintain its conservative stance and under no pressure to increase ROE to double digits.
Asset quality to improve in 2017. Despite its conservative stance, PNBN is also plagued with asset quality issues like most of the banks in the industry. Without the write-off in 3Q16, NPL ratio would have shot up to above 3% level. Asset quality deterioration may not be over but management guided that NPL should be maintained at above the 3% level. Management believes NPL should moderate going forward. It will also increase coverage ratio back to above the 100% level (3Q16 at 97% after some write-offs).
Chatter on M&A remains. There are still no updates on the 39% stake held by ANZ. But judging from ANZ’s stance on its Asian investments, divesting PNBN will eventually happen. It would be crucial to see who takes over ANZ’s stake but what we know for sure is that the family behind the bank will remain there. While the sale of ANZ’s stake should serve as a first catalyst for the stock, the eventual stake sale by the family will be the ultimate catalyst.
Valuation and recommendation
Maintain BUY, TP lowered to Rp1,000. We have a BUY on PNBN with a lower target price of Rp1,000 as we impute higher risk free rate of 8.5% (vs 7.2% previously) following expectations of higher government bond yields. Our TP is based on the Gordon Growth Model (11.5% ROE, 7% growth and 13.4 % cost of equity) implying 0.7x FY17 BV.
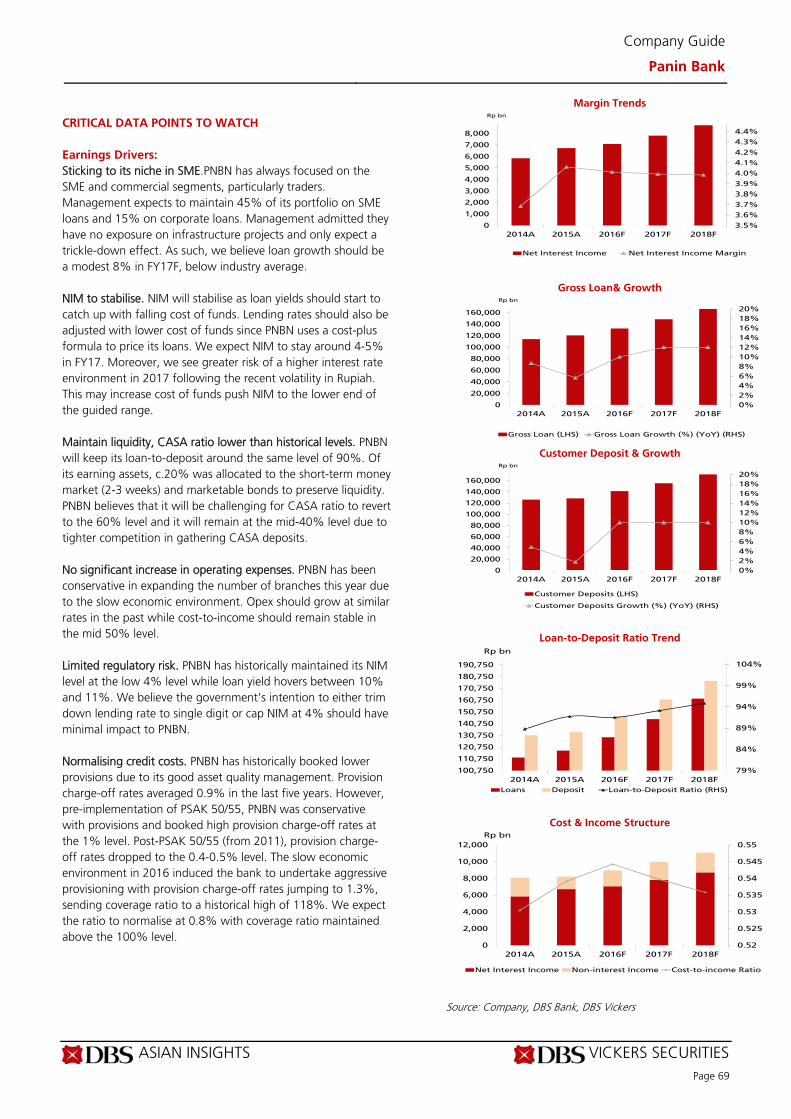
ASIAN INSIGHTS VICKERS SECURITIES Page 69
Company Guide
Panin Bank
CRITICAL DATA POINTS TO WATCH
Earnings Drivers:
Sticking to its niche in SME.PNBN has always focused on the SME and commercial segments, particularly traders. Management expects to maintain 45% of its portfolio on SME loans and 15% on corporate loans. Management admitted they have no exposure on infrastructure projects and only expect a trickle-down effect. As such, we believe loan growth should be a modest 8% in FY17F, below industry average. NIM to stabilise. NIM will stabilise as loan yields should start to catch up with falling cost of funds. Lending rates should also be adjusted with lower cost of funds since PNBN uses a cost-plus formula to price its loans. We expect NIM to stay around 4-5% in FY17. Moreover, we see greater risk of a higher interest rate environment in 2017 following the recent volatility in Rupiah. This may increase cost of funds push NIM to the lower end of the guided range. Maintain liquidity, CASA ratio lower than historical levels. PNBN will keep its loan-to-deposit around the same level of 90%. Of its earning assets, c.20% was allocated to the short-term money market (2-3 weeks) and marketable bonds to preserve liquidity. PNBN believes that it will be challenging for CASA ratio to revert to the 60% level and it will remain at the mid-40% level due to tighter competition in gathering CASA deposits. No significant increase in operating expenses. PNBN has been conservative in expanding the number of branches this year due to the slow economic environment. Opex should grow at similar rates in the past while cost-to-income should remain stable in the mid 50% level. Limited regulatory risk. PNBN has historically maintained its NIM level at the low 4% level while loan yield hovers between 10% and 11%. We believe the government's intention to either trim down lending rate to single digit or cap NIM at 4% should have minimal impact to PNBN. Normalising credit costs. PNBN has historically booked lower provisions due to its good asset quality management. Provision charge-off rates averaged 0.9% in the last five years. However, pre-implementation of PSAK 50/55, PNBN was conservative with provisions and booked high provision charge-off rates at the 1% level. Post-PSAK 50/55 (from 2011), provision charge-off rates dropped to the 0.4-0.5% level. The slow economic environment in 2016 induced the bank to undertake aggressive provisioning with provision charge-off rates jumping to 1.3%, sending coverage ratio to a historical high of 118%. We expect the ratio to normalise at 0.8% with coverage ratio maintained above the 100% level.
Margin Trends
Gross Loan& Growth
Customer Deposit & Growth
Loan-to-Deposit Ratio Trend
Cost & Income Structure
Source: Company, DBS Bank, DBS Vickers
3.5%
3.6%
3.7%
3.8%
3.9%
4.0%
4.1%
4.2%
4.3%
4.4%
0
1,000
2,000
3,000
4,000
5,000
6,000
7,000
8,000
2014A 2015A 2016F 2017F 2018F
Rp bn
Net Interest Income Net Interest Income Margin
0%
2%
4%
6%
8%
10%
12%
14%
16%
18%
20%
0
20,000
40,000
60,000
80,000
100,000
120,000
140,000
160,000
2014A 2015A 2016F 2017F 2018F
Rp bn
Gross Loan (LHS) Gross Loan Growth (%) (YoY) (RHS)
0%
2%
4%
6%
8%
10%
12%
14%
16%
18%
20%
0
20,000
40,000
60,000
80,000
100,000
120,000
140,000
160,000
2014A 2015A 2016F 2017F 2018F
Rp bn
Customer Deposits (LHS)
Customer Deposits Growth (%) (YoY) (RHS)
79%
84%
89%
94%
99%
104%
100,750
110,750
120,750
130,750
140,750
150,750
160,750
170,750
180,750
190,750
2014A 2015A 2016F 2017F 2018F
Rp bn
Loans Deposit Loan-to-Deposit Ratio (RHS)
0.52
0.525
0.53
0.535
0.54
0.545
0.55
0
2,000
4,000
6,000
8,000
10,000
12,000
2014A 2015A 2016F 2017F 2018F
Rp bn
Net Interest Income Non-interest Income Cost-to-income Ratio
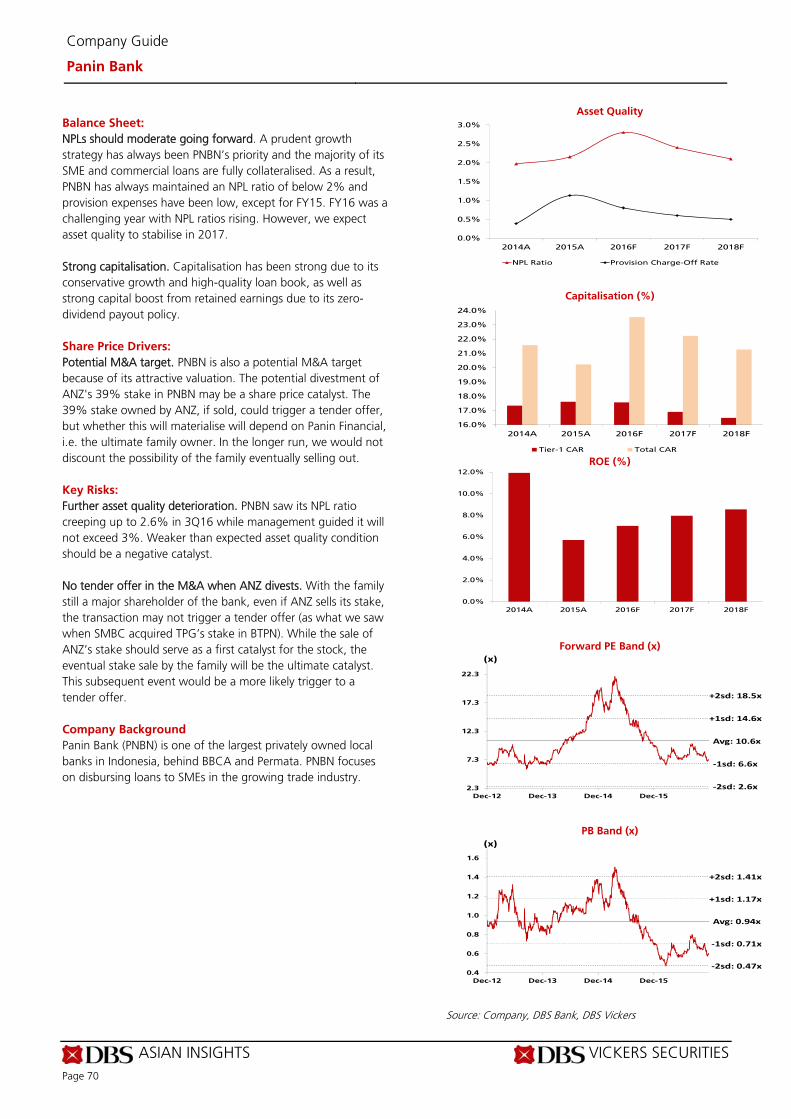
ASIAN INSIGHTS VICKERS SECURITIES Page 70
Company Guide
Panin Bank
Balance Sheet:
NPLs should moderate going forward. A prudent growth strategy has always been PNBN’s priority and the majority of its SME and commercial loans are fully collateralised. As a result, PNBN has always maintained an NPL ratio of below 2% and provision expenses have been low, except for FY15. FY16 was a challenging year with NPL ratios rising. However, we expect asset quality to stabilise in 2017. Strong capitalisation. Capitalisation has been strong due to its conservative growth and high-quality loan book, as well as strong capital boost from retained earnings due to its zero-dividend payout policy. Share Price Drivers:
Potential M&A target. PNBN is also a potential M&A target because of its attractive valuation. The potential divestment of ANZ's 39% stake in PNBN may be a share price catalyst. The 39% stake owned by ANZ, if sold, could trigger a tender offer, but whether this will materialise will depend on Panin Financial, i.e. the ultimate family owner. In the longer run, we would not discount the possibility of the family eventually selling out. Key Risks:
Further asset quality deterioration. PNBN saw its NPL ratio creeping up to 2.6% in 3Q16 while management guided it will not exceed 3%. Weaker than expected asset quality condition should be a negative catalyst. No tender offer in the M&A when ANZ divests. With the family still a major shareholder of the bank, even if ANZ sells its stake, the transaction may not trigger a tender offer (as what we saw when SMBC acquired TPG’s stake in BTPN). While the sale of ANZ’s stake should serve as a first catalyst for the stock, the eventual stake sale by the family will be the ultimate catalyst. This subsequent event would be a more likely trigger to a tender offer. Company Background
Panin Bank (PNBN) is one of the largest privately owned local banks in Indonesia, behind BBCA and Permata. PNBN focuses on disbursing loans to SMEs in the growing trade industry.
Asset Quality
Capitalisation (%)
ROE (%)
Forward PE Band (x)
PB Band (x)
Source: Company, DBS Bank, DBS Vickers
0.0%
0.5%
1.0%
1.5%
2.0%
2.5%
3.0%
2014A 2015A 2016F 2017F 2018F
NPL Ratio Provision Charge-Off Rate
16.0%
17.0%
18.0%
19.0%
20.0%
21.0%
22.0%
23.0%
24.0%
2014A 2015A 2016F 2017F 2018F
Tier-1 CAR Total CAR
0.0%
2.0%
4.0%
6.0%
8.0%
10.0%
12.0%
2014A 2015A 2016F 2017F 2018F
Avg: 10.6x
+1sd: 14.6x
+2sd: 18.5x
‐1sd: 6.6x
‐2sd: 2.6x2.3
7.3
12.3
17.3
22.3
Dec-12 Dec-13 Dec-14 Dec-15
(x)
Avg: 0.94x
+1sd: 1.17x
+2sd: 1.41x
‐1sd: 0.71x
‐2sd: 0.47x0.4
0.6
0.8
1.0
1.2
1.4
1.6
Dec-12 Dec-13 Dec-14 Dec-15
(x)
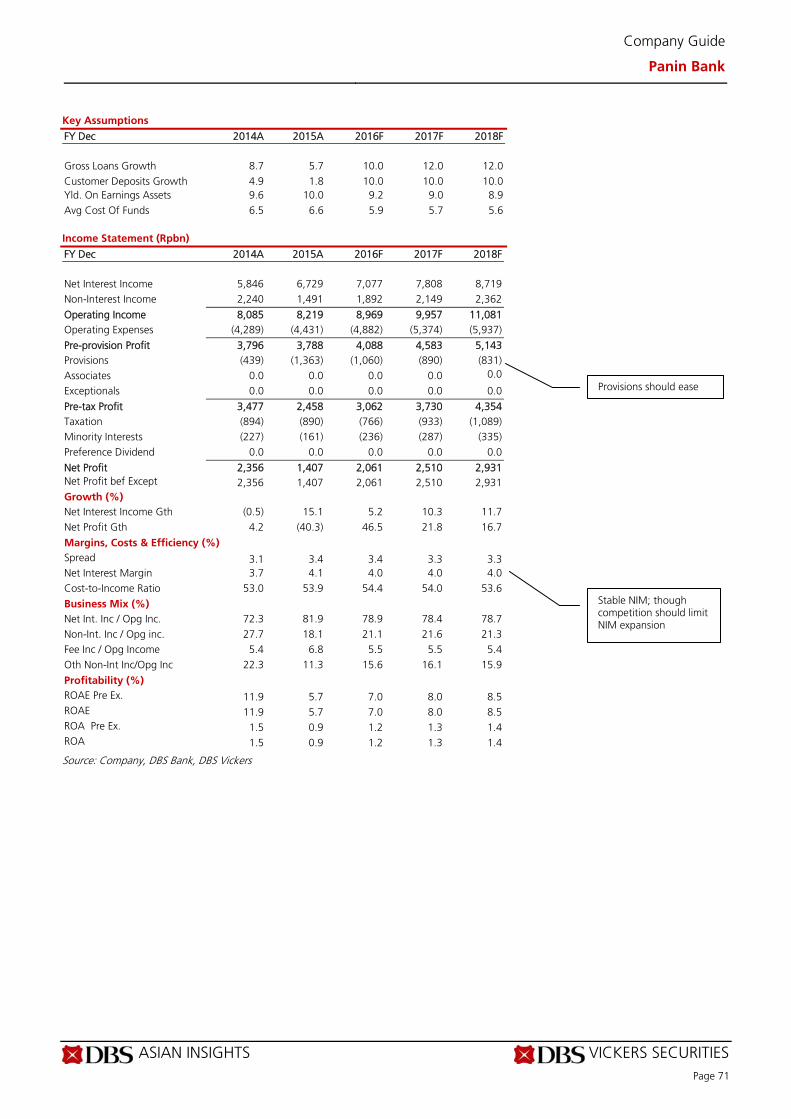
ASIAN INSIGHTS VICKERS SECURITIES Page 71
Company Guide
Panin Bank
Key Assumptions
FY Dec 2014A 2015A 2016F 2017F 2018F
Gross Loans Growth 8.7 5.7 10.0 12.0 12.0 Customer Deposits Growth 4.9 1.8 10.0 10.0 10.0 Yld. On Earnings Assets 9.6 10.0 9.2 9.0 8.9 Avg Cost Of Funds 6.5 6.6 5.9 5.7 5.6 Income Statement (Rpbn)
FY Dec 2014A 2015A 2016F 2017F 2018F Net Interest Income 5,846 6,729 7,077 7,808 8,719 Non-Interest Income 2,240 1,491 1,892 2,149 2,362
Operating Income 8,085 8,219 8,969 9,957 11,081 Operating Expenses (4,289) (4,431) (4,882) (5,374) (5,937)
Pre-provision Profit 3,796 3,788 4,088 4,583 5,143 Provisions (439) (1,363) (1,060) (890) (831) Associates 0.0 0.0 0.0 0.0 0.0
Exceptionals 0.0 0.0 0.0 0.0 0.0
Pre-tax Profit 3,477 2,458 3,062 3,730 4,354 Taxation (894) (890) (766) (933) (1,089) Minority Interests (227) (161) (236) (287) (335) Preference Dividend 0.0 0.0 0.0 0.0 0.0
Net Profit 2,356 1,407 2,061 2,510 2,931 Net Profit bef Except 2,356 1,407 2,061 2,510 2,931 Growth (%) Net Interest Income Gth (0.5) 15.1 5.2 10.3 11.7 Net Profit Gth 4.2 (40.3) 46.5 21.8 16.7
Margins, Costs & Efficiency (%) Spread 3.1 3.4 3.4 3.3 3.3 Net Interest Margin 3.7 4.1 4.0 4.0 4.0 Cost-to-Income Ratio 53.0 53.9 54.4 54.0 53.6
Business Mix (%) Net Int. Inc / Opg Inc. 72.3 81.9 78.9 78.4 78.7 Non-Int. Inc / Opg inc. 27.7 18.1 21.1 21.6 21.3 Fee Inc / Opg Income 5.4 6.8 5.5 5.5 5.4 Oth Non-Int Inc/Opg Inc 22.3 11.3 15.6 16.1 15.9
Profitability (%) ROAE Pre Ex. 11.9 5.7 7.0 8.0 8.5 ROAE 11.9 5.7 7.0 8.0 8.5 ROA Pre Ex. 1.5 0.9 1.2 1.3 1.4 ROA 1.5 0.9 1.2 1.3 1.4
Source: Company, DBS Bank, DBS Vickers
Provisions should ease
Stable NIM; though competition should limit NIM expansion
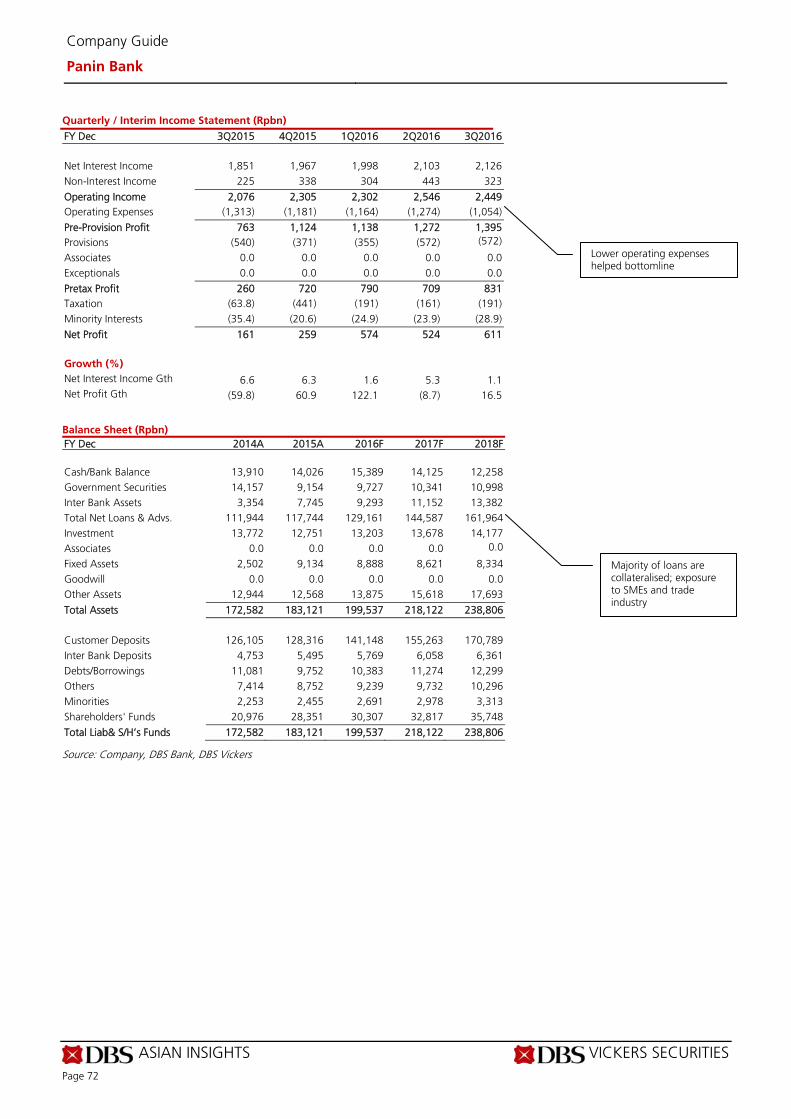
ASIAN INSIGHTS VICKERS SECURITIES Page 72
Company Guide
Panin Bank
Quarterly / Interim Income Statement (Rpbn)
FY Dec 3Q2015 4Q2015 1Q2016 2Q2016 3Q2016 Net Interest Income 1,851 1,967 1,998 2,103 2,126 Non-Interest Income 225 338 304 443 323
Operating Income 2,076 2,305 2,302 2,546 2,449 Operating Expenses (1,313) (1,181) (1,164) (1,274) (1,054)
Pre-Provision Profit 763 1,124 1,138 1,272 1,395 Provisions (540) (371) (355) (572) (572)
Associates 0.0 0.0 0.0 0.0 0.0 Exceptionals 0.0 0.0 0.0 0.0 0.0
Pretax Profit 260 720 790 709 831 Taxation (63.8) (441) (191) (161) (191) Minority Interests (35.4) (20.6) (24.9) (23.9) (28.9)
Net Profit 161 259 574 524 611 Growth (%) Net Interest Income Gth 6.6 6.3 1.6 5.3 1.1 Net Profit Gth (59.8) 60.9 122.1 (8.7) 16.5
Balance Sheet (Rpbn)
FY Dec 2014A 2015A 2016F 2017F 2018F Cash/Bank Balance 13,910 14,026 15,389 14,125 12,258 Government Securities 14,157 9,154 9,727 10,341 10,998 Inter Bank Assets 3,354 7,745 9,293 11,152 13,382 Total Net Loans & Advs. 111,944 117,744 129,161 144,587 161,964 Investment 13,772 12,751 13,203 13,678 14,177 Associates 0.0 0.0 0.0 0.0 0.0
Fixed Assets 2,502 9,134 8,888 8,621 8,334 Goodwill 0.0 0.0 0.0 0.0 0.0 Other Assets 12,944 12,568 13,875 15,618 17,693
Total Assets 172,582 183,121 199,537 218,122 238,806 Customer Deposits 126,105 128,316 141,148 155,263 170,789 Inter Bank Deposits 4,753 5,495 5,769 6,058 6,361 Debts/Borrowings 11,081 9,752 10,383 11,274 12,299 Others 7,414 8,752 9,239 9,732 10,296 Minorities 2,253 2,455 2,691 2,978 3,313 Shareholders' Funds 20,976 28,351 30,307 32,817 35,748
Total Liab& S/H’s Funds 172,582 183,121 199,537 218,122 238,806
Source: Company, DBS Bank, DBS Vickers
Lower operating expenses helped bottomline
Majority of loans are collateralised; exposure to SMEs and trade industry
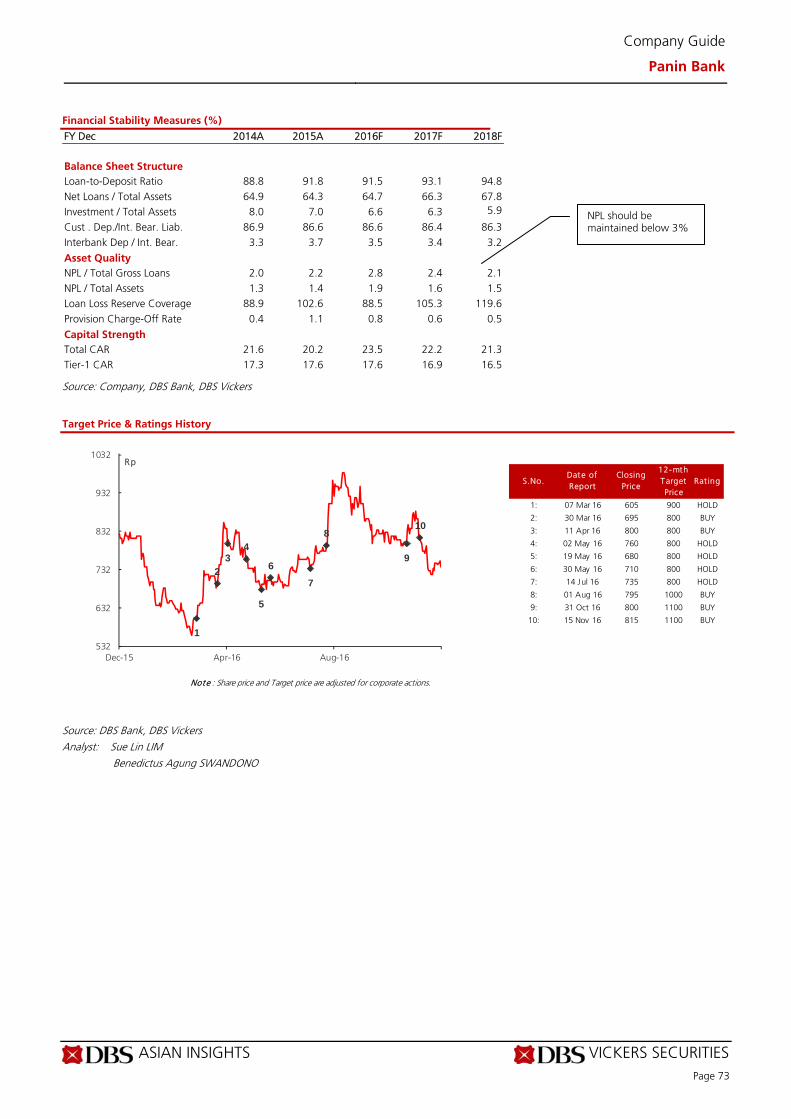
ASIAN INSIGHTS VICKERS SECURITIES Page 73
Company Guide
Panin Bank
Financial Stability Measures (%)
FY Dec 2014A 2015A 2016F 2017F 2018F Balance Sheet Structure Loan-to-Deposit Ratio 88.8 91.8 91.5 93.1 94.8 Net Loans / Total Assets 64.9 64.3 64.7 66.3 67.8 Investment / Total Assets 8.0 7.0 6.6 6.3 5.9
Cust . Dep./Int. Bear. Liab. 86.9 86.6 86.6 86.4 86.3 Interbank Dep / Int. Bear. 3.3 3.7 3.5 3.4 3.2
Asset Quality NPL / Total Gross Loans 2.0 2.2 2.8 2.4 2.1 NPL / Total Assets 1.3 1.4 1.9 1.6 1.5 Loan Loss Reserve Coverage 88.9 102.6 88.5 105.3 119.6 Provision Charge-Off Rate 0.4 1.1 0.8 0.6 0.5
Capital Strength Total CAR 21.6 20.2 23.5 22.2 21.3 Tier-1 CAR 17.3 17.6 17.6 16.9 16.5
Source: Company, DBS Bank, DBS Vickers
Target Price & Ratings History
Source: DBS Bank, DBS Vickers Analyst: Sue Lin LIM
Benedictus Agung SWANDONO
S.No.Date of Report
Closing Price
12-mth Target Price
Rat ing
1: 07 Mar 16 605 900 HOLD
2: 30 Mar 16 695 800 BUY
3: 11 Apr 16 800 800 BUY
4: 02 May 16 760 800 HOLD
5: 19 May 16 680 800 HOLD
6: 30 May 16 710 800 HOLD
7: 14 Jul 16 735 800 HOLD
8: 01 Aug 16 795 1000 BUY
9: 31 Oct 16 800 1100 BUY
10: 15 Nov 16 815 1100 BUY
Note : Share price and Target price are adjusted for corporate actions.
1
23
4
5
6
7
8
9
10
532
632
732
832
932
1032
Dec-15 Apr-16 Aug-16
Rp
NPL should be maintained below 3%

Industry Focus
Page 74
DBS Bank recommendations are based an Absolute Total Return* Rating system, defined as follows:
STRONG BUY (>20% total return over the next 3 months, with identifiable share price catalysts within this time frame)
BUY (>15% total return over the next 12 months for small caps, >10% for large caps)
HOLD (-10% to +15% total return over the next 12 months for small caps, -10% to +10% for large caps)
FULLY VALUED (negative total return i.e. > -10% over the next 12 months)
SELL (negative total return of > -20% over the next 3 months, with identifiable catalysts within this time frame)
Share price appreciation + dividends
Completed Date: 11 Dec 2016 23:56:47 Dissemination Date: 12 Dec 2016 15:46:50
GENERAL DISCLOSURE/DISCLAIMER
This report is prepared by DBS Bank Ltd. This report is solely intended for the clients of DBS Bank Ltd, DBS Vickers Securities (Singapore) Pte Ltd,
its respective connected and associated corporations and affiliates only and no part of this document may be (i) copied, photocopied or duplicated
in any form or by any means or (ii) redistributed without the prior written consent of DBS Bank Ltd.
The research set out in this report is based on information obtained from sources believed to be reliable, but we (which collectively refers to DBS
Bank Ltd, its respective connected and associated corporations, affiliates and their respective directors, officers, employees and agents (collectively,
the “DBS Group”)) do not make any representation or warranty as to its accuracy, completeness or correctness. Opinions expressed are subject to
change without notice. This document is prepared for general circulation. Any recommendation contained in this document does not have regard
to the specific investment objectives, financial situation and the particular needs of any specific addressee. This document is for the information of
addressees only and is not to be taken in substitution for the exercise of judgement by addressees, who should obtain separate independent legal
or financial advice. The DBS Group accepts no liability whatsoever for any direct, indirect and/or consequential loss (including any claims for loss of
profit) arising from any use of and/or reliance upon this document and/or further communication given in relation to this document. This
document is not to be construed as an offer or a solicitation of an offer to buy or sell any securities. The DBS Group, along with its affiliates and/or
persons associated with any of them may from time to time have interests in the securities mentioned in this document. The DBS Group may have
positions in, and may effect transactions in securities mentioned herein and may also perform or seek to perform broking, investment banking and
other banking services for these companies.
Any valuations, opinions, estimates, forecasts, ratings or risk assessments herein constitutes a judgment as of the date of this report, and there can be no assurance that future results or events will be consistent with any such valuations, opinions, estimates, forecasts, ratings or risk assessments. The information in this document is subject to change without notice, its accuracy is not guaranteed, it may be incomplete or condensed and it may not contain all material information concerning the company (or companies) referred to in this report and the DBS Group is under no obligation to update the information in this report.
This publication has not been reviewed or authorized by any regulatory authority in Singapore, Hong Kong or elsewhere. There is no planned schedule or frequency for updating research publication relating to any issuer.
The valuations, opinions, estimates, forecasts, ratings or risk assessments described in this report were based upon a number of estimates and
assumptions and are inherently subject to significant uncertainties and contingencies. It can be expected that one or more of the estimates on
which the valuations, opinions, estimates, forecasts, ratings or risk assessments were based will not materialize or will vary significantly from actual
results. Therefore, the inclusion of the valuations, opinions, estimates, forecasts, ratings or risk assessments described herein IS NOT TO BE RELIED
UPON as a representation and/or warranty by the DBS Group (and/or any persons associated with the aforesaid entities), that:
(a) such valuations, opinions, estimates, forecasts, ratings or risk assessments or their underlying assumptions will be achieved, and
(b) there is any assurance that future results or events will be consistent with any such valuations, opinions, estimates, forecasts, ratings or risk
assessments stated therein.
Please contact the primary analyst for valuation methodologies and assumptions associated with the covered companies or price targets.
Any assumptions made in this report that refers to commodities, are for the purposes of making forecasts for the company (or companies)
mentioned herein. They are not to be construed as recommendations to trade in the physical commodity or in the futures contract relating to the
commodity referred to in this report.
DBS Vickers Securities (USA) Inc ("DBSVUSA")"), a U.S.-registered broker-dealer, does not have its own investment banking or research
department, has not participated in any public offering of securities as a manager or co-manager or in any other investment banking transaction
in the past twelve months and does not engage in market-making.
Industry Focus
Page 75
ANALYST CERTIFICATION The research analyst(s) primarily responsible for the content of this research report, in part or in whole, certifies that the views about the companies and their securities expressed in this report accurately reflect his/her personal views. The analyst(s) also certifies that no part of his/her compensation was, is, or will be, directly, or indirectly, related to specific recommendations or views expressed in the report. The DBS Group has procedures in place to eliminate, avoid and manage any potential conflicts of interests that may arise in connection with the production of research reports. As of 13 Dec 2016, the analyst(s) and his/her spouse and/or relatives who are financially dependent on the analyst(s), do not hold interests in the securities recommended in this report (“interest” includes direct or indirect ownership of securities). The research analyst(s) responsible for this report operates as part of a separate and independent team to the investment banking function of the DBS Group and procedures are in place to ensure that confidential information held by either the research or investment banking function is handled appropriately.
COMPANY-SPECIFIC / REGULATORY DISCLOSURES
1. DBS Bank Ltd, DBS Vickers Securities (Singapore) Pte Ltd (''DBSVS''), their subsidiaries and/or other affiliates do not have a proprietary
position in the securities recommended in this report as of 30 Nov 2016.
2. DBS Bank Ltd does not market make in equity securities of the issuer(s) or company(ies) mentioned in this Research Report.
Compensation for investment banking services:
3. DBS Bank Ltd, DBSVS, their subsidiaries and/or other affiliates of DBSVUSA have received compensation, within the past 12 months for
investment banking services from Bank Central Asia as of 30 Nov 2016.
4. 3.DBS Bank Ltd, DBSVS, their subsidiaries and/or other affiliates of DBSVUSA have received compensation, within the past 3 months for
investment banking services from Bank Rakyat Indonesia as of 30 Nov 2016.
5. DBSVUSA does not have its own investment banking or research department, nor has it participated in any public offering of securities as a
manager or co-manager or in any other investment banking transaction in the past twelve months. Any US persons wishing to obtain further
information, including any clarification on disclosures in this disclaimer, or to effect a transaction in any security discussed in this document
should contact DBSVUSA exclusively.
RESTRICTIONS ON DISTRIBUTION
General This report is not directed to, or intended for distribution to or use by, any person or entity who is a citizen or resident of or located in any locality, state, country or other jurisdiction where such distribution, publication, availability or use would be contrary to law or regulation.
Australia This report is being distributed in Australia by DBS Bank Ltd. (“DBS”) or DBS Vickers Securities (Singapore) Pte Ltd (“DBSVS”), both of which are exempted from the requirement to hold an Australian Financial Services Licence under the Corporation Act 2001 (“CA”) in respect of financial services provided to the recipients. Both DBS and DBSVS are regulated by the Monetary Authority of Singapore under the laws of Singapore, which differ from Australian laws. Distribution of this report is intended only for “wholesale investors” within the meaning of the CA.
Hong Kong This report is being distributed in Hong Kong by or on behalf of, and is attributable to DBS Vickers (Hong Kong) Limited which is licensed and regulated by the Hong Kong Securities and Futures Commission and/or by DBS Bank (Hong Kong) Limited which is regulated by the Hong Kong Monetary Authority and the Securities and Futures Commission. Where this publication relates to a research report, unless otherwise stated in the research report(s), DBS Bank (Hong Kong) Limited is not the issuer of the research report(s). This publication including any research report(s) is/are distributed on the express understanding that, whilst the information contained within is believed to be reliable, the information has not been independently verified by DBS Bank (Hong Kong) Limited. This report is intended for distribution in Hong Kong only to professional investors (as defined in the Securities and Futures Ordinance (Chapter 571 of the Laws of Hong Kong) and any rules promulgated thereunder.) For any query regarding the materials herein, please contact Paul Yong (CE. No. ASE988) at [email protected].
Indonesia This report is being distributed in Indonesia by PT DBS Vickers Securities Indonesia.
Malaysia This report is distributed in Malaysia by AllianceDBS Research Sdn Bhd ("ADBSR"). Recipients of this report, received from ADBSR are to contact the undersigned at 603-2604 3333 in respect of any matters arising from or in connection with this report. In addition to the General Disclosure/Disclaimer found at the preceding page, recipients of this report are advised that ADBSR (the preparer of this report), its holding company Alliance Investment Bank Berhad, their respective connected and associated corporations, affiliates, their directors, officers, employees, agents and parties related or associated with any of them may have positions in, and may effect transactions in the securities mentioned herein and may also perform or seek to perform broking, investment banking/corporate advisory and other services for the subject companies. They may also have received compensation and/or seek to obtain compensation for broking, investment banking/corporate advisory and other services from the subject companies.
Industry Focus
Page 76
Wong Ming Tek, Executive Director, ADBSR
Singapore This report is distributed in Singapore by DBS Bank Ltd (Company Regn. No. 196800306E) or DBSVS (Company Regn No. 198600294G), both of which are Exempt Financial Advisers as defined in the Financial Advisers Act and regulated by the Monetary Authority of Singapore. DBS Bank Ltd and/or DBSVS, may distribute reports produced by its respective foreign entities, affiliates or other foreign research houses pursuant to an arrangement under Regulation 32C of the Financial Advisers Regulations. Where the report is distributed in Singapore to a person who is not an Accredited Investor, Expert Investor or an Institutional Investor, DBS Bank Ltd accepts legal responsibility for the contents of the report to such persons only to the extent required by law. Singapore recipients should contact DBS Bank Ltd at 6327 2288 for matters arising from, or in connection with the report.
Thailand This report is being distributed in Thailand by DBS Vickers Securities (Thailand) Co Ltd. Research reports distributed are only intended for institutional clients only and no other person may act upon it.
United Kingdom This report is produced by DBS Bank Ltd which is regulated by the Monetary Authority of Singapore. This report is disseminated in the United Kingdom by DBS Vickers Securities (UK) Ltd, ("DBSVUK"). DBSVUK is authorised and regulated by the Financial Conduct Authority in the United Kingdom. In respect of the United Kingdom, this report is solely intended for the clients of DBSVUK, its respective connected and associated corporations and affiliates only and no part of this document may be (i) copied, photocopied or duplicated in any form or by any means or (ii) redistributed without the prior written consent of DBSVUK. This communication is directed at persons having professional experience in matters relating to investments. Any investment activity following from this communication will only be engaged in with such persons. Persons who do not have professional experience in matters relating to investments should not rely on this communication.
Dubai
This research report is being distributed in The Dubai International Financial Centre (“DIFC”) by DBS Bank Ltd., (DIFC Branch) having its office at PO Box 506538, 3rd Floor, Building 3, East Wing, Gate Precinct, Dubai International Financial Centre (DIFC), Dubai, United Arab Emirates. DBS Bank Ltd., (DIFC Branch) is regulated by The Dubai Financial Services Authority. This research report is intended only for professional clients (as defined in the DFSA rulebook) and no other person may act upon it.
United States This report was prepared by DBS Bank Ltd. DBSVUSA did not participate in its preparation. The research analyst(s) named on this report are not registered as research analysts with FINRA and are not associated persons of DBSVUSA. The research analyst(s) are not subject to FINRA Rule 2241 restrictions on analyst compensation, communications with a subject company, public appearances and trading securities held by a research analyst. This report is being distributed in the United States by DBSVUSA, which accepts responsibility for its contents. This report may only be distributed to Major U.S. Institutional Investors (as defined in SEC Rule 15a-6) and to such other institutional investors and qualified persons as DBSVUSA may authorize. Any U.S. person receiving this report who wishes to effect transactions in any securities referred to herein should contact DBSVUSA directly and not its affiliate.
Other jurisdictions In any other jurisdictions, except if otherwise restricted by laws or regulations, this report is intended only for qualified, professional, institutional or sophisticated investors as defined in the laws and regulations of such jurisdictions.
DBS Bank Ltd
12 Marina Boulevard, Marina Bay Financial Centre Tower 3 Singapore 018982 Tel. 65-6878 8888
e-mail: [email protected] Company Regn. No. 196800306E