Embed Size (px)
Citation preview
EnvironmentalAssessment/AnalysisReports_______
Report E0035
INDONESIA -
Outer IslandsPower ProjectEA Category A
Environmental Assessment4of4April 1994
This report has been prepared by the Borrower or its Consultant
Pub
lic D
iscl
osur
e A
utho
rized
Pub
lic D
iscl
osur
e A
utho
rized
Pub
lic D
iscl
osur
e A
utho
rized
Pub
lic D
iscl
osur
e A
utho
rized
EnvironmentalAssessment/AnalysisReports__ ___
Report E0035
INDONESIA -
Outer IslandsPower ProjectEA Category A
Environmental Assessment4 of 4April 1994
This report has been prepared by the Borrower or its Consultant
MINISTRY OF MINES AND ENERGYPERUSAHAAN UMUM LISTRIK NEGARA
Main Report
E I A
ENVIRONMENTAL IMPACT ASSESSMENTBESAI HYDROELECTRIC POWER PROJECT
WEST LAMPUNGINDONESIA
9....... ..... 9
1 99 4
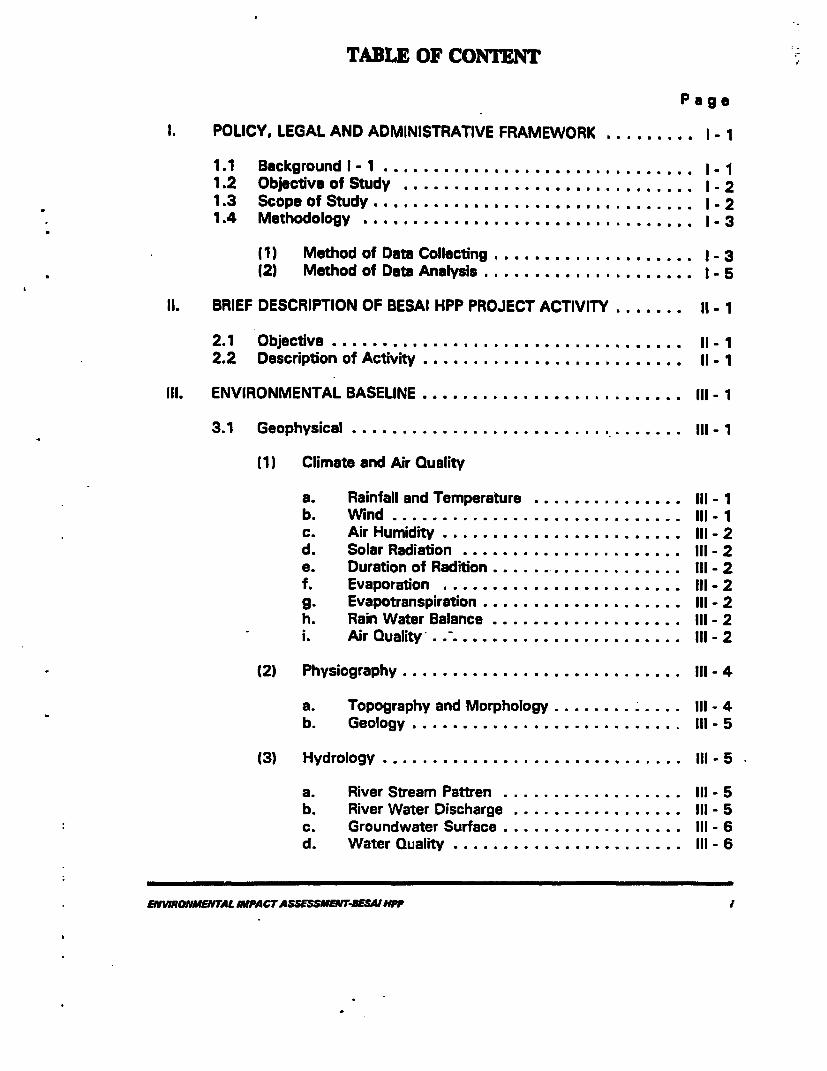
TABLE OF CONTENT
P A g a
POLICY, LEGAL AND ADMINISTRATIVE FRAMEWORK ...... ... I - 1
1.1 Background I - 1 .. - 11.2 Objective of Study .. 1- 21.3 Scope of Study .. I - 21.4 Methodology . .. 1- 3
(1) Method of Data Collecting . . 1- 3(2) Method of Data Analysis . . I- 5
11. BRIEF DESCRIPTION OF BESAI HPP PROJECT ACTIVITY ....... II - 1
2.1 Objectiva . .................................. Il-l
2.2 Description of Activity . ......................... II- I
Ill. ENVIRONMENTAL BASELINE .................... III- 1
3.1 Geophysical............................. Bhd - 1
(1) Climate and Air Quality
a. Rainfall and Temperature .Il - 1b. Wind .Il-1c. Air Humidity . 111- 2d. Solar Radiation . 111- 2e. Duration of Radition .III - 2f. Evaporation . 111- 2g. Evapotranspiration .III - 2h. Rain Water Balance .III - 2i. Air Quality .................... 1...... 11- 2
(2) Physiography .......................... 111- 4
a. Topography and Morphology ...... ll....... I- 4b. Geology .......................... 111- 5
(3) Hydrology . .......................... IIl- 5
a. River Stream Pattren ........ .......... III- 5b. River Water Discharge ........ ......... III- 5c. Groundwater Surface ........ .......... III- 6d. Water Quality ....................... I- 6
*EVIRONMENTAL IMPACTASSESSNENr-8ESA1 P
.j.l Page
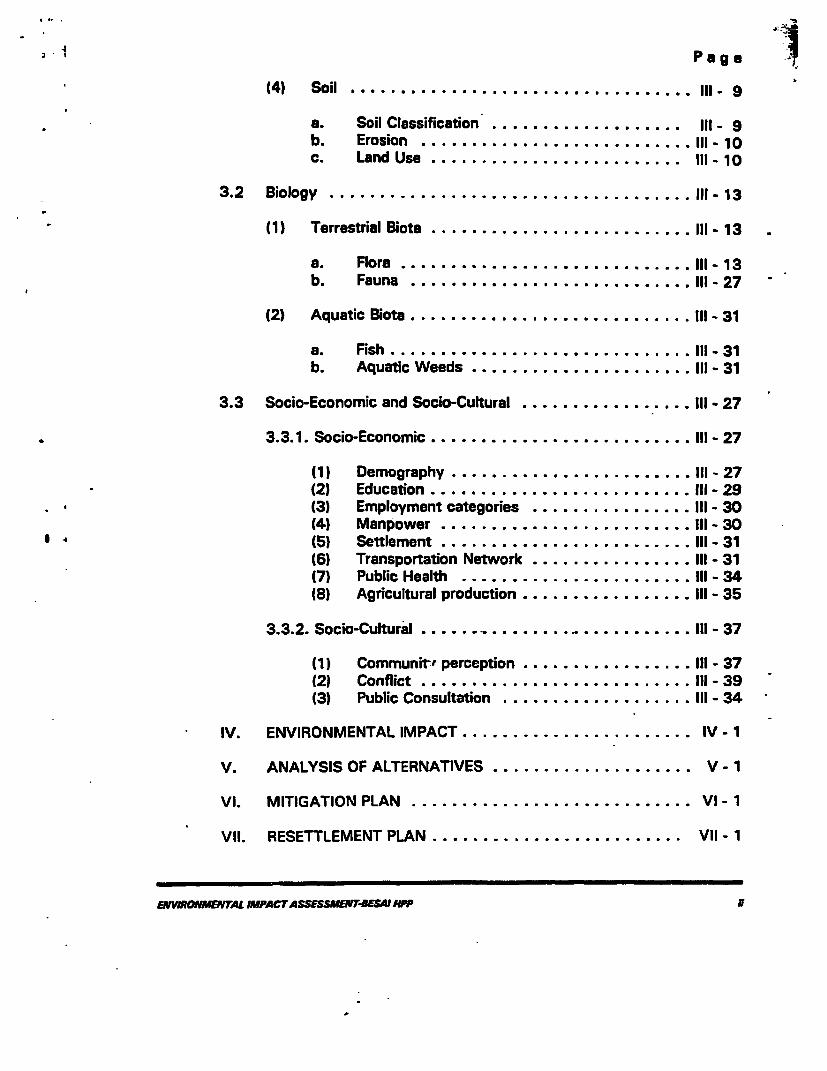
(4) Soil ..................... III- 9
a. Soil Classification ................. 111- 9b. Erosion ................. 111-10c. Land Use ....................... I 111- 10
3.2 Biology.. ll - 13
(1) Terrestrial Biota.... - 13
a. Flora . 111- 13b. Fauna .Il - 27
(2) Aquati Biota 1..I-31
a. Fish .111-31b. Aquatic Weeds . 111- 31
3.3 Socio-Economic and Socio-Cultural ....... .......... III- 27
3.3.1. Socio-Economic .......................... III- 27
(1) Demography ........................ Ill - 27(2) Educaton ....... 111.................. III- 29(3) Employment categories . ................ II- 30(4) Manpower ......................... 111- 30(5) Settlement ......................... 111- 31(6) Transportation Network ...... .......... III- 31(7) Public Health ........................ II- 34(8) Agricultural producton ....... .......... III- 35
3.3.2. Socio-Cultural ., 111-37
(1) Communit' perception ... 111- 37(2) Conflict ... 111- 39(3) Public Consultaton .Il.. II- 34
IV. ENVIRONMENTAL IMPACT ... IV- 1
V. ANALYSIS OF ALTERNATIVES ... V - 1
VI. MITIGATION PLAN ... VI- 1
VII. RESETTLEMENT PLAN ... VIl - 1
ENVMONMEtAL JMPACTASSESSMBVTBEW MP I
Page
VIII. MANAGEMENT AND TRAINING .................. Vil - 1
IX. MONITORING ........... ..................... IX-1
ANNEX 1 Impact Check List for transmission Lines ...... .. Al - 1
ANNEX 2 Preliminary Impact Assessment ofTransmission Lines ....................... A2-l1
Project features and maps ....... .................... A3 -1
. M
ENVIR ONMENTAL IMPACTASSESSMENT4WHP Ja
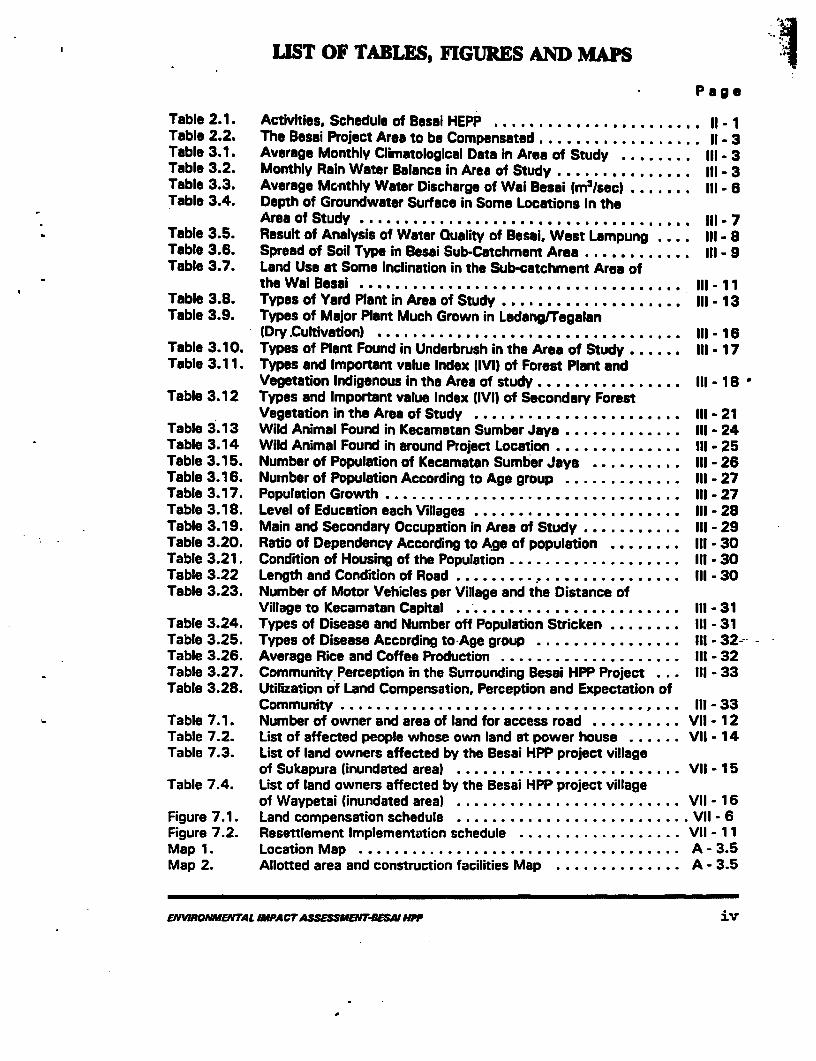
LIST OF TABLES, FIGURES AND MAPS
*Page
Table 2.1. Activities, Schedule of Besas HEPp ...... ................. 11-ITable 2.2. The Besai Project Area to be Compensated ... II - 3Table 3.1. Average Monthly Climatological Data in Area of Study.III - 3Table 3.2. Monthly Raln Water Balance in Area of Seudyt ............... 111- 3Table 3.3. Average Mcnthly Water Discharge of Wai Besai (m3/sec) ....... III - 6Table 3.4. Depth of Groundwater Surface in Some Locations In the
Area of Study .......... III- 7Table 3.5. Resuft of Analysis of Water O uality of Besa,. West Lampung .rpung Ill - 8Table 3.6. Spread of Soil Typo in Besai Sub-Catchment Area ........... . Il - 9Table 3.7. Land Use at Some Inclination in the Sub-catchment Area of
the Wai Besai ............ ........................ Ill-liTable 3.8. Types of Yard Plant in Area of Study . ................... 111-13Table 3.9. Types of Major Plant Much Grown in Ladang/Tegalan
(Dry.Cultivation) .......... ........................ 111- 16Table 3.10. Types of Plant Found in Underbrush in the Area of Study ... III - 17Table 3.11. Types and Important value Index IIVI) of Forest Plant and
Vegetation Indigenous in the Area of study ... 111-18Table 3.12 Types and Important value Index (IVI) of Secondary Forest
Vegetation in the Area of Study .. . 111-21Table 3.13 Wild Animal Found in Kecamatan Sumber Jaya ..... ........ III- 24Table 3.14 Wild Animal Found in around Project Location ..... ......... III- 25Table 3.15. Number of Population of Kecamatan Sumber Jaya .. Ill. I- 26Table 3.16. Number of Population According to Age group .... III - 27Table 3.17. Population Growth .. . 111- 27Table 3.18. Level of Education each Villages .. . 111-28Table 3.19. Main and Secondary Occupation in Area of Study .... III - 29Table 3.20. Ratio of Dependency According to Age of population .... III - 30Table 3.21. Condition of Housing of the Population .. l. . II- 30Table 3.22 Length and Condition of Road . . .. III - 30Table 3.23. Number of Motor Vehicles per Village and the Distance of
Village to Kecamatan Capital ... 111- 31Table 3.24. Types of Disease and Number off Population Stricken .. I... I- 31Table 3.25. Types of Disease According to-Age group ... Ill- 32-Table 3.26. Average Rice and Coffee Production . . .. III - 32Table 3.27. Community Perception in the Surrounding Besai HPP Project ... III - 33Table 3.28. Utilization of Land Compensation, Perception and Expectation of
Community ... 111- 33Table 7.1. Number of owner and area of land for access road .... ...... VIl - 12Table 7.2. List of affected people whose own land at power house ...... Vil - 14Table 7.3. List of land owners affected by the Besai HPP project village
of Sukapura (inundated area) ....... .................. VIl - 15Table 7.4. List of land owners affected by the Besai HPP project village
of Waypetai (inundated area) ....... .................. VIl - 16Figure 7.1. Land compensation schedule .......................... VI1 - 6Figure 7.2. Resettlement Implementation schedule ..... ............. VIl - 11Map 1. Location Map .............. ...................... A-3.5Map 2. Allotted area and construction facilities Map .... .......... A - 3.5
ENVIRONMENTAL IMPACrASSESSMENT-BESAIlNPP iv
INDONESIA
OUTER ISLANDS POWER PROJECT
Environmental Assessmwnt Summary
Besai Hydroelectric Power Plant
Introduction
1. Pursuant to the objectives of the Govermment of Indonesia (GOI) to improve thewelfare of the population and to support the growth of economic activity by meeting theelectricity requirements in an efficient and reliable manner, the State Electricity Corporation(PLN) has proposed to construct a hydroelectric power plant at Besai, in the Lampung provinceof South Sumatra, under the Outer Islands Power Project. The proposed loan will be made tothe GOI. The proceeds of the loan would be onlent to PLN, which is responsible for theimplementation of the project. The project is likely to be cofmanced by the EuropeanInvestment Bank, Austria and Australia, for the turbine generator and transmission components.GOI/PLN will meet the financing gap from their own internal resources.
2. The Electricity Act (Law No. 15 of 1985) defines the legal framework for theelectricity subsector of Indonesia. The subsector comprises: (i) PLN, the State ElectricityCorporation; (vi) captive plants; (iii) rural electric cooperatives; and (iv) a large number ofinformal microenterprises providing electricity to rural customers not served by PLN. Theprovisions of the Electricity Act are amplified in GOI Regulation No. 17/1990 for PLN and No.10/1990 for others. PLN was established as a public corporation with responsibility for thegeneration. tansmission, and distribution of electricity, and the planning, construction andoperation of electric supply facilities. PLN is managed by a Board of Directors headed by aPresident Director, who is appointed by the President and is accountable to the Ministry ofMines and Energy. Operational responsibility devolves upon 17 regions, and the responsibilityfor major construction upon 13 project managers: PLN has already appointed a project managerfor the proposed Besai hydroelectric power plant.
3. Since 1969, the Bank group has provided about $ 4.1 billion for the power subsectorin Indonesia, through 3 IDA credits, 18 loans, and one supplemental loan. Project PerformanceAudit Reports and Project Completion Reports on fourteen projects have been issued. Thereports have concluded that the objectives set out for these projects at appraisal have beenachieved.
Project Description
4. The Besai hydroelectric power plant is proposed to be a run-of-river typedevelopment, with a daily regulating storage capacity, to be built in the upper reaches of theBesai river in the Lampung province of Sumatra. The Enginering Services Center of PLN, in
2
association with their Consulting Engincers, have conducted an environmental assessment (EA)of the proposed hydroelectric plant based on the feasibility study and the preliminary designreports. The plant will have the following components:
- Intake dam- Power house, about 6 km downstram- Tunnel and penstock connecting the intake dam and power house- Access roads to the project site- Quarrying for stone and gravel to be used for construction- Construction camp- Permanent housing colony and offices- Transmnission lines
5. The dam commands a catchment area of 415 sq.km. Located in a steep gorge, theheight of the dam will be 9 meters only; however, because of the slope, the net available headat the power house 6 kan downstream will be about 240 m. Two turbine-generatcos will beinstalled initially in the power house to generate 45 MW each. The headrace tunnel from thedam will run undeground for a length of approximately 5 kIn, and connect through a surgetank, with the underground penstock for a further distance of about 0.6 kn leading into thepower house. There will be two access roads; one about 2.5 km from the village of Sukapurato the dam site; the other, about 2 km long, in the village of Dwikora. A double-circuit, 16 knlong, 150 kV transmission line will connect the power house with the nearest PLN tansmissiongrid to evacuate power generated at the Besai plant.
6. There are possibilities of soil erosion because of land clearing operations. Theremay also be some minor air and water pollution issues because of construction activities. Thiseadverse effects will be nitigated by appropriate measures as described below in this summaryreort.
Baseline Data
7. Geophysical - Climate, Physiology and Hydrology. It is a high rainfall area (rainsfor 11 months) with a fairly strong wind (39.31 km/day) blowing from the north most of thetime. There are no months of water deficit and the air quality in terms of dust content, gasesand noise is considered to be pure. The catchment area is mostly mountainous even thoughthere are some undulating plains in patches. The country rock is basically volcanic deposit. Thedrainage pattern is characterized by many trenches which finally appear as tnbutaries of the mainriver. A catchment area, such as this, has the advantage of having a very small flood discharge.The groundwater level is quite shallow, about 3-12 m from the land surface. The quality ofwater has been analyzed and found to be clean.
8. Soil. The soil has been analyzed based on the factors of chemical and physicalproperties and the factor of climate. The larger parts of the soil comprises of Inceptisol ,and issensitive to erosion. Land is used mostly for Sawah (wet rice cultivation) and also dry
3
cultivation. Local farners do not take recourse to conservational measures resulting in very highrate of erosion. Much of the forest area has disappeared; it has turned into farmland andunderbrush. Future farning operations must include better land management practices.
9. Flora. There are wet-cultivated areas in the farmlands, garden and forest lands.Mainly, there are six types of vegetation consisting of stable crops, like rice and maize, rootvegetables like potatoes, and other vegetables like tomatoes, chilies etc. Fruits such as durian,mahogany wood trees, flowers and bamboos also abound. Many popular varieties of wood arefound in the forest.
10. Fauna. The study has recorded 20 species of mammals, 9 reptiles and 10 birds.There are domestic animals like cows, buffaloes chicken and sheep. Most of the well-knownfish varieties are found in the rivers.
11. Socio-economic Study. A study of the population of the area has been conducted.The main occupation is firning (more than 80%). But it must be said that farming is notpracticed seriously and most of the people go for traditional rice cultivation and unatendedcoffee plantation. Over the years most of the people tend to migrate towards the Trans-SumatraHighway in search of employment in small business. People are generally healthy even thoughmalaria and influenza have been reported. In the survey most of the people tended to supportthe project.
Impacts
12. The environmental impacts of the proposed project can be subdivided into 3categories; (a) preconstruction, (b) constrton and (c) post constuction.
(a) Preconstuction:
Preconstruction impacts include investigation and surveys, and land acquisition.
(b) Construction:
Lud clearing and preparation, movement and operation of heavy constmctionequipment and materials, and the concentration of a fairly large constmcion laborforce, many of whom may come from outside the local region, are the man impactsof the construction stage.
(c) Post Construction:
The environmental impacts of the dam and the hydroelectric power plant will beinsignificant, except for liquid effluent and solid wastes from the housing colony andoffice facilities.
4
13. The project will have both physical and social impacts on the environment andhabitat of the area. However, the social impacts are not severe as there are no relocation issues.Most of the affected land for construction activities, comprising the two villages Sukapura andDwikora, belongs to the Forestry Department of GOI; however, several people cultivate the landand grow coffee crops on it. The area to be inundated covers private land, where the majorcrop is paddy. The village, Waypetai, is close to this area. No residential homes are affectedby the construction; only a few huts used for keeping crops will need to be relocated. Thephysical impacts can be listed as follows:
(a) Soil Erosion.
(b) Air and water pollution from construction and waste disposal.
(c) Social impact of construction.
(d) Quarrying.
(e) Water quality.
(f) Sedirnentation of the reservoir.
(g) Scouring of river bed below dam.
(h) Earthquakes and floods.
(i) Loss of forest lands and wildlife.
(j) Increase of water related diseases due to impounding.
(k) Impact on drinking water.
Analysis of Alternatives
14. The rn-of-river type development planed for Besai is to provide peaking powerto the PLN system in South Sumatra. One of the main objectives of GOI for the electricitysubsector is to meet the country's energy requirements in a least-cost way, and conserveexportable petroleum reserves, principally by encouraging the domestic market to substitute oilconsumption by alternative, more economical fuels, such as natural gas, coal, hydropower andgeothermal. Indonesia's hydroelectric resources are enormous; estimated at about 32,000 MW(out of a theoretical potential of about 75,000 MW), but their development todate has beenlimited by their geographic distribution relative to the load centers where there is deMand forelectricity. The Besai site is ideaUy suited for hydropower development; a dam about 9 metershigh constructed at the narrowest portion of a deep gorge, helping to provide a net head of 240m just 6 kan downstream from the dam. No naural gas or geothermal energy is available in the
5
vicinity; also a coal-fired power plant for peaking purposes is not economical. Other forms ofenergy for the proposed 90 MW power plant are detennined to be not feasible.
Mitigation Plans
15. The mitigation plans for the enviromnental impacts of the Besai hydroelectric powerplant can be listed as follows:
(a) Soil erosion - The river subcatclunent area of the Besai may be categorized intotwo groups; the volcanic group and the hilly group. More than 85% of the area is of thevolcanic group. The volcanic material is tuff, covered with andesite and basalt. Soil erosionwill be caused by the construction of access roads and temporary works, land clearing and cutand fill operations, disposal of tunnel excavation muck and other spoils. Soil erosion will beminimized by land reclamation, terracing, and replanting.
(b) Air and water pollution - Dust supp.ession and noise abatement measures,management of waste disposal (domestic and construction) in accordance with acceptablestandards will help mitigate these impacts.
(c) Social impacts - The construction site wiU be designed such that workers havea healthy work environment, adequate recreational facilities outside working hours and livingconditions with acceptable health and sanitary facilities. Potable water supply, waste disposal,health and amenities in contractors' temporary camps and facilities will be ensured.
(d) Quarrying - This environmental impact will be minimized by selecting severalsuitable sites, far apart from each other. Three possible sites for stone and gravel have beenidentified. Quarry I is 4.5 km and Quarry II is 14 kan from the intake dam, while Quarry mis located near the proposed power house site. Sand will be obtained from the surrounding areasof two villages; one about 6 km, and the other about 16 man from the intake dam.
(e) Water quality - Vegetation in the reservoir area will be cleared beforeinundation to avoid deterioration of the water quality. Because of the daily pondage that wilexpose parts of the submerged land everyday, the vegetation clearing operation will beundertaken on a regular basis.
(f) Sedimentation - Scouring gates are provided to rid the reservoir of accumulatedsediments by flushing on a regular basis. Regreening of the bare land areas are expected toreduce soil erosion and sedimentation.
(g) Scouring of river below dam - The flow rate in the river throughout the yearvaries between 11.04 and 32.01 m3Is. Even though the steep slope of the river acts as adisincentive for habiation, and there is no irrigation downstream of the dam, PLN has decidedthat, in accordance with Japanese regulatory practices, the plant will maintain a minimum releaseof at least 1 m3 /s of water from the dam so the river bed between the dam and the power station
6
never goes dry and that any aquatic life in the area is sustined. No wild aninals or migratoryfish, however, are known to have been found in the area covered by this section of the river.The discharge of water from the power plan would amount to about 45.6 m;/s, for 4 hours aday, when running at full capacity.
(h) Earthquake and floods - The project has been designed to accommodate theseismic acceleration of the volcanic region. The weir, as stated at the outset, is only 9 m high,and the surface of the reservoir, only 140 ha. The holding capacity of this run-of-the-river typedevelopment will be small due to its limited volume. Therefore, the induced seismic effect ofthe dam is insignificant. A horizontal stilling basin is designed to dissipate the energy of designflood equivalent to 100 years probable peak discharge.
(i) Loss of forest lands and wild life - Most of the forest in the project area hasalready been converted into coffee plantation. The area to be inundated represents mostly, wildrice cultivation. However. since the area of inundation is small, the loss of land is manageable.Some farmers will lose part of their farmland and will be compensated for the loss in accordancewith Bank guidelines for involuntary resettlement and the Presidential Decree, KEPRES55/1993. This issue is discussed in detail under the Resettlement Plan for Besai. There ispresence of wildlife in the vicinity of the project; the main habitat of the aninal species is foundto be in the adjacent forest area, very little of which is affected by the proposed project.
J ') Water related diseases due to impounding - The reservoir is planned to be of adaily pondage for power generation, which is the inherent nature of a run-of-river typedevelopment. The current in the river is expected to be too strong to support mosquitobreeding. Additionally, mosquito-larvae eating fish to be stocked in the reservoir would mitigatethis negative impact.
(k) Drinking water - The reservoir is relatively far from the dwelling areas. Peopleget their drinking water from the springs or existing wells located near their houses which arenot likely to be affected by the impounding of water by the dam.
Resettlement Plan
16. The Resettlement Plan of the Besai plant has the following objectives which are inkeeping with the Bank's operational directives.
- development of a timebound resettlement plan,based on replacement valuation andcompensation principles of land and other assets affected by the project
- establishment of a budget and an implementation plan
- identification of organizational responsibilities for implementation.
7
17. The plan has been prepared after consulting the affected people and NGOs who areactive in the area. The project affects lands (160 ha) in three villages primarily because ofinundation, acquisition for construction of the dam and the power house and for laying roadsfor the project. The project affected people (PAP) comprise 129 families both in the inundatedarea as also the construction area. In a social survey which was specially carried out in the area,almost the entire community including the affected families supported the project. The PAPsfelt that the project will bring with it improvements in the infrustructure of the area which intum will help in the growth of both industrial and agricultural activities. PLN is committed toproviding them with roads, drinking water supply, sanitation facilities, etc. Most of the PAPsalso expressed a desire to get jobs in the project. In the public consultation before thepreparation of the resettlement plan, which was held on 14 September 1993, some PAPs raisedthe question of "Replacement" principle in the matter of compensation and it was explained tothem that the GOI would provide for full compensation at replacement value and also otheropportunities to the PAPs so that their quality of life would positively improve after the project.A further round of consultation was held with the local NGOs on 22 December 1993 in whichthe NGOs seemed satisfied with the solutions offered by PLN to their concerns regarding theresettlement aspects.
18. 35% of the PAPs expressed interest in land-for-land compensation. PLN iscommitted to providing such PAPs with alternate land, after due consultation with them on theirchoice. PLN will procure the land and hand over to the PAPs who might choose this option.The compensation for land acquisition will be determined by a committee appointed by the GOIas per the relevant Presidential Decree. PLN will encourage the PAPs to take up other activitieslike small business, trading and will also help them in developing other skills. PLN will makecounselling and credit facilities available for such people, if desired. Education and training willbe provided by PLN in vocational schools to those who may opt for this option. A budgetprovision of Rp 660,000,000 (US$ 330,000) has been made for the implementation of the plan.The resettlement is scheduled to be completed well ahead of the start of actual construction ofthe project. The resettlement implementation schedule provides for monitoring by a committeeover the next five years.
Monitoring and Evaluation
19. The most important area of action is the strengthening of the internal structre ofPLN so that they may be in a position to monitor the implementation aspects, as well as the fnalresults of the resettlement plan. Pending this, it has been agreed that an independentorganization, such as the local university and some government agencies. would be engaged tomonitor the implementation of the resettlement plan, evaluate results, and report on the progresson a periodic basis. The university will be requested to include a local NGO in their monitoringteam.
8
Institutional Needs
20. Provision for Technical Assistance has been made under the proposed project toassist PLN to establish an enviromnental organization to develop PLN's capability to formulatecorporate environmental policies, evaluate environmental assessments of its development projectsand monitor enviromnental impacts and compliance with GOI guidelines for existing projects.
Public Participation
21. Public consultations have been held by PLN at the project site, with local NGOparticipation. During the public consultations, while 99% of those attending supported theconstruction of the project, a large majority of the Project Affected Persons (PAP) expressed astrong preference for cash compensation, and an opportunity to work in the construction of theproject. While the amount of cash compensation will be determined by the Land AcquisitionCommittee in accordance with Kepres 55 guidelines, which allows for compensation at thecurrent valuation of the land, the project proponents (PLN) have agreed to provide work toqualified PAPs in the construction of the project.
1. POLICY, LEGAL AND ADMNISTRATIVE FRAMEWORK
1.1 Background
Development is actually the utilization of natural and environmental resources,aiming at improving the living standard and welfare of the population. Therefore, in theimplementation of development changes are likely to occur, in the biogeophysical as wellas the socio-economic and socio-cultural environment.
The utilization of natural and environmental resources excessively and unwisely willin the end cause an environmental problem to arise. This means that the developmentundertaken will decrease the environmental quality.
In undertaking a development activity, it is necessary to minimize the negativeimpact and maximize the positive impact to the environment. Therefore, each activity ofdevelopment and its results will not be of a temporary character, but will last and givebenefit for a long term.
This is so. since in the development process the environmental aspects have beenconsidered. i.e. the balance of the environment in one ecosystem.
The successful development undertaken by the government as of REPELITA I in1969 has given tangible results in the various sectors. The industrial development andwelfare of the population which are ever enhancing have resulted in the demand for electricenergy to increase. In the effort to meet the demand for electric power. the Government,through Perusahaan Umum Listrik Negara (State Power Utility), is of intention to developthe Besai HPP (Hydro-electric Power Plant) in North Lampung. The development of this HPPwill be carried out in the content of the diversification and conservation of the use ofnatural oil energy resources.
In accordance with the policy of the Government, the first stage will develop twounits of the Besai HPP with a capacity of 2 x 45 MW (90 MWI. In order to identify whetherthe development of the Besai HPP (Project) will bring about a major impact to theenvironment, a study on the Environmental Impact Assessment (EIAI will be made.
The implementation of this EIA will be in accordance with existing rules andlegislation, as set forth in:
1. Act No. 4/1982 on: Basic Rules for Environmental Management;2r Government Regulation No. 2911986 on: Analysis on Environmental Impact;3. Decree of the Minister of State for Population and Environmental Affairs No.
Kep-49IMNKLHI6/1 987 on : Guidelines for Determining Major Impact;4. Decree of the Minister of State for Population and Environmental Affairs No.
Kep-50/MNKLH/611987 on: Guidelines for the Preparation of the Analysis onEnvironmental Impact;
5. Decree of the Minister of Mines& Energy No.0935 K/008/M.PE/1988 on:Technical Guidelines for the Preparation of the Environmental InformationPresentation for Hydra-electric Power plant (HPP) Project.
ENVIRONMEJTAL IMPACT ASSESSMENJT-ESAI NPPI- 1
1.2 Objective of Study
The objective of the EIA study of Besai HPP is as follows:
a. Identify the project or power plant activities, which particularly bring aboutenvironmental impact;
b. Inventory the environmental feature. which particularly is expected to beaffected by project or power plant activities;
c. Predict and evaluate the environmental impact;d. Develop basic management and monitoring plan.
The use of the EIA study is to assist in decision making, the planning andmanagement of the environment of the Besai HPP activity.
1.3 Scope of Study
(1) Area of Study
a. The project or the planned Besai HPP project to be developed has someplaces of activity (Annex 2) with the following locations:
- Intake dam in the Wai Besai. village of Sukapura.
-Power house in the village of Dwikora.
Tunnel connecting the intake dam and the power house, with adistance of about 6 km.
-Access road in the village of Sukapura with a length of about 2.5 kmto the intake dam and in the village -of Dwikora of about 2 km.
Quarry 1. found in the village of Simpang Sari (Simpang Gadis).at adistance of about 4.5 km to the intake dam.
Quarry 11. found in the vicinity of Bukit Kemuning DPP, at a distanceof about 14 km to the intake dam.
Quarry Ill. found in the vicinity of the power house.
Sand is obtained from the surroundings of the village of Wai Petai, ata distance of about 6 km to the intake dam and from the village ofsindang Pagar at a distance of about 1 6.5 km to the intake dam.
Base camp, in the village of Sukapura.
Housing and offices, in the village of Sukapura.
ENAIRONMENTAL IMPACT ASSESSMENr-BESAI HPPI -2
b. Ecological Borders
The ecological borders are the borders of the Catchment Area which formone ecosystem unit. This HPP Project is located in the Catchment Area of theupstream part of the Tulang Bawang which forms the Sub Catchment Area of theWai Besai, with an area of about 41,500 ha (415 kmal.Geographically the Sub Catchment Area of the Besai is situated between 40-60South Latitude and 1040-105° West Longitude.
c. Administrative Borders
The Bosai HPP Project is situated in two Kecamatans (Sub- Districts), i.e. theKecamatan of Sumber Jaya and the Kecamatan of Bukit Kemuning, Kabupaten(District) of West Lampung.
The intake dam is in the Village of Sukapurs, Kecamatan of Sumber Jaya ata distance of about 60 km from Kotabumi. The power house is in the Village ofDwikora. Kecamatan of Bukit Kemuning and these two villages lie adjacent to eachother.
(2) The Environmental Components Investigated/Observed
The environmental components investigated cover the Physical (soil.hydrology, air, and climate),biological (terrestrial and aquatic biota), andsocio-economic and socio-cultural aspects.
1.4 Methodology
(1) Method of Data Collectino
In accordance with the objective of the EIA study. the data used aresecondary data and primary data.
Secondary data are collected from the related Departments/Authorities andprimary data are obtained through observation in the field, measuring or sampletaking, and interviews.
a. Geophysical
Topographical data in the form of the obliqueness of slopes andheight/elevation of places are obtained from the topographical map and the landcapacity map. Geological data are obtained from the geological map and relevantreports. Data on the soil are obtained from maps, reports, supported with fieldobservation. The spread of soil types is found in the soil map and land unit.
Data on the climate and water discharge are collected from P3SA of theProvince of Lampung. the river stream pattern from the topographical map and thegroundwater surface from the Health Service of Sumber Jaya.To know the water quality, water samples are taken from the planned location ofthe dam site for further analysis in the laboratory.
ENWRONMENTAL MPACT ASSESSMEN7-TBSAIHPP'-3
b. Biology
b.1 Flora
Data on the flora are collected by the inventory method, i.e. byobservation in the field. For terrestrial flora, observation is undertaken ineach type of land use, consisting of: home garden, sawah (wet ricecultivation), tegalan/ladang (dry cultivation), garden/estate. underbrush, andforest. The data obtained for culture plants are secondary data (village andkecamatan).
The inventory of the underbrush and forest vegetation is done bymaking observation belts. The belt is made by the "belt transect" methodwith the description as follows:
- The belt is made along the length cutting the contour line with adimension of 20 x 100 m. The belt is further divided into five parts.so that 5 belts are obtained, each of 20m x 20 m. Of each samplebelt the diameter of each kind of plant at tree level is recorded andmeasured (DBH > 20 cm).
- To know the plants at pole level (10 < DBH < 20 cm) in the mainbelt a belt of 10 m x 10 m is made. The diameter of all plants of polelevel is recorded and measured.
- To know the plants at pile level (1cm < DBH < 10 Cm) in the "polebelt" a belt of 5 x 5 m is made. The diameter of all pile plants isrecorded and measured.
* To know the plants at seedling and undergrowth level, in the pile belta belt of lm x Im is made and the kind and number of individual'seedlings and undergrowth are recorded.As for aquatic flora, observation is made of the water weeds foundin sawah land and along the length of the river, in particular thosehaving a calm stream.
b.2 Fauna
Data on terrestrial fauna in the form of domestic animal (cattle anddomestic animals of the population) are obtained from secondary data anddata on wild animals (mammals, reptiles, and birds) are collected fromreliable sources,i.e. forest attendants, hunters, and members of thecommunity. In addition, animal is found during flora observation.
Data on aquatic fauna, particularly fish are obtained from thepopulation who often catches fish and from the members of the communityliving relatively near the river.
ENVIRONMEArrAL IMPACT ASSESSMENT.8ESAIHPPl .4
c. Socio-Economic and Socio-Cultural Aspects
Data and information on the social, economic. and cultural condition areobtained by the method of observation and interview. Interview is held with thepeople selected as respondents by using a set of questionnaire previously prepared.In addition, information is collected from village administrators and public figuresand secondary data from the village and Sub-District Office.
In order to obtain representative data, 10 villages have been established assamples consisting of 3 villages directly affected by the impact of the project(Sukapura. Wai Petai, and Dwikora) and 7 villages lying in the upstream part of theproject. These seven villages have been selected on the consideration that they arerepresentative of other villages. The existence and activity of these villages in theupstream part of the project are expected not to be affected by the impact of theproject, but on the contrary, will bring about a negative impact to the life of theproject for the long term.
(2) Method of Data Analysis
a. Geophysical
Topographical and geological data are interpreted from the topographicalmap, map of land capability, and geological map. Of the information obtained fromthe topographical and land capability map in the form of the inclination of the slope.a tabulation is made and the proportions measured. Whereas the regional geologyis interpreted descriptively.
The analysis of climatological data is made by way of tabulation. To knowthe type of rainfall and climate of the area of study, a calculation is made by theKoppen method and the Schmidt & Ferguson method.
Data on soil are analyzed by way of interpretation and calculation and thesoil classification system. In this case the system used is Soil Taxonomy (USDA.1 975) after which the equivalent is sought according to the FAO/UNESCO system(1974) and PPT (1984) . Data on the physical and chemical properties of the soilobtained from the field as well as reports are interpreted qualitatively. Gauging ofsedimentation is done by the SDR (Sediment Delivery Ratio) method according tothe Robinson 1 979) criteria. The gauging of the sedimentation presently occurringis done by calculating the predicted total erosion by the USLE method.
The analysis of data and the use of land is made by way of tabulation, sothat the spread of the use of land in various inclinations of the slope can beobtained.
Hydrological data are interpreted from the map (for river stream pattern) andthe tabulation made, where as to know the water quality an analysis of the watersample is made in the laboratory.
ENVIRONMENJTAL MIPACT ASSESSMENT-ESAINPP1-5
b. Biological
b.1 Flora
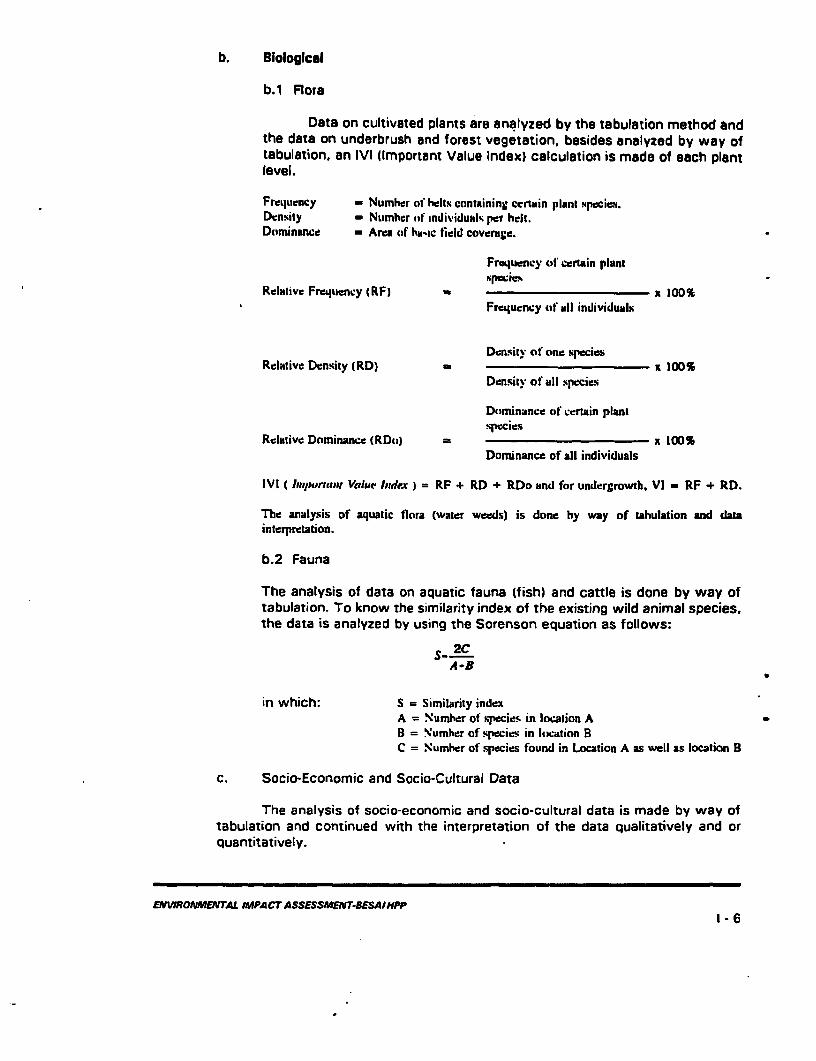
Data on cultivated plants are analyzed by the tabulation method andthe data on underbrush and forest vegetation, besides analyzed by way oftabulation, an IVI llmportant Value Index) calculation is made of each plantlevel.
Freqltucncy - Number of helts containing certain plant NpecieN.
Density - Number tif Individual'. per heit.Dominance - Area (ir hs-Ic field coverage.
Frequency ol crtain plant
Relative FreAluency (RF) x 100Frequency (ti all individuals
Densitv of one speciesRelative Density (RD) - x 1001
Densiiv of all species
Dominance cof certain plan,species
Relative Dominance (RDo) x 100%Dominance of all individuals
IVI ( mImvrhiant Value ldirex) = RF + RD + RDo and for undergrowth, VI _ RF + RD.
The analysis of aquatic flora (water weeds) is done by way of tahulation and datainterpretation.
b.2 Fauna
The analysis of data on aquatic fauna (fish) and cattle is done by way oftabulation- To know the similarity index of the existing wild animal species.the data is analyzed by using the Sorenson equation as follows:
S 2CA-B
in which: S = Similarity indexA =Number of species in location AB = Numher of species in location BC = Number of species found in Location A as well as location B
C. Socio-Economic and Socio-Cultural Data
The analysis of socio-economic and socio-cultural data is made by way oftabulation and continued with the interpretation of the data qualitatively and orquantitatively.
ENVWRONMENTAL IMPACr ASSESSMENA-BESAI IJPP1-6
11. BRIEF DESCRIPTION OF BESAI HPPPROJECT ACTIVATY
2.1 Objective
The objective of the Besai HPP Project is to increase the power capacity in the areaof Lampung in particular and Sumatera in general which according to the demand forecastthat area in 1996 will need a power production of 2,894 GWh and an installed capaci'y of722 MW. The Besai HPP will have a capacity of 90 MW with a total annual energy outputof 396 GWh.
2.2 Description of Activity
1. Type of planned activity Besai HPP Project2. Planned location of activity
a. Village : SukapuraKecamatan (Sub-District) Sumber JayaKabup_stArt ;District) North LampungProvince : Lampung
b. Village : DwikoraKecamatan : Bukit KemuningKabupaten : North LampungProvince : Lampung
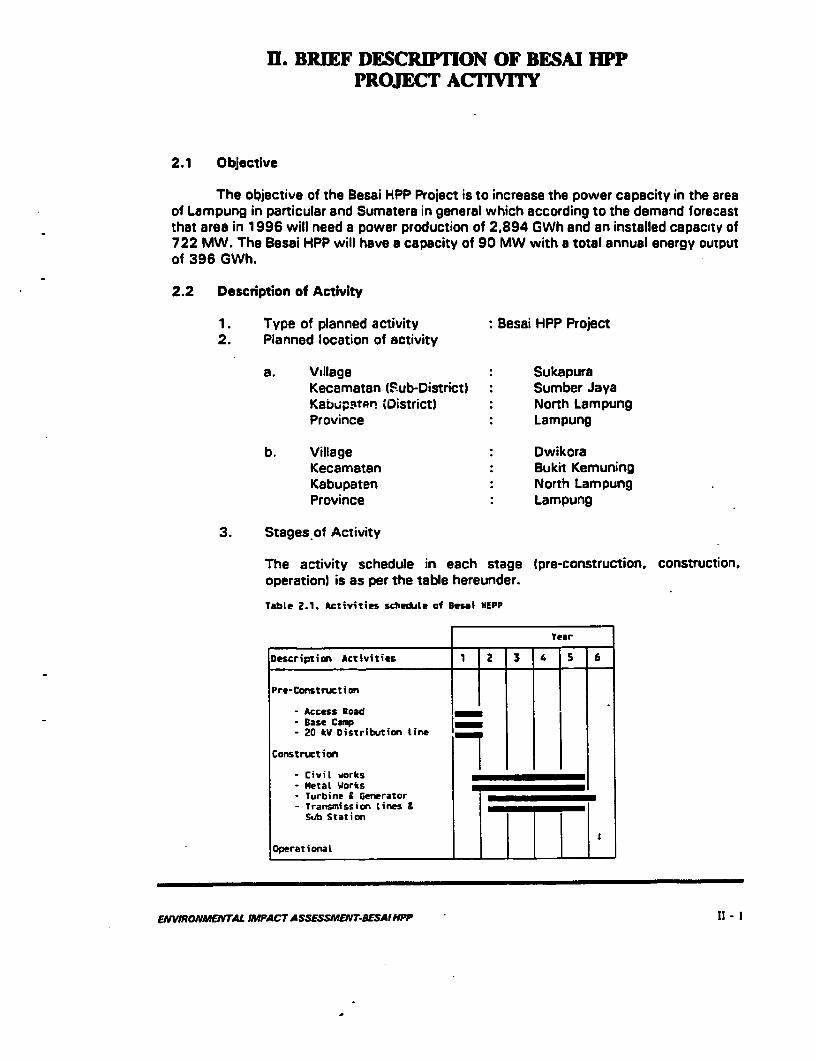
3. Stages of Activity
The activity schedule in each stage (pre-construction. construction,operation) is as per the table hereunder.
Table 2.1. Activities schedule of Bessi HEPP
Year
Description Activities 1 2 3 | 5 6
Pr*-Construct i on
Access Road* ase Camp
- 20 kV Distribution line
Construction
- Civil works- metal works- Turbine 6 Generator * o- Transmission Lines S *
Sub Station
Operational _
ENWVRONMEoTNAL IMPACT ASSESSMENT-BESAIPP _ I
4. Relationship of Project with Other Activities:
- The forest area used for paFt of the quarry and part of the accessroad;
- The forest area for the tunnel from the intake dam to the powerhouse with a length of 5.842 m;
- The plantation and bushes in the planned location of the dam;- Bridges made bV the activity of the community of Sukepura and Wai
Petai in the planned location of inundation (3 suspension bridges and1 semi-permanent bridge);
- Yards in part of the access road in Sukapura;
(1). Pre-Construction Stage
a. Plan for Land Acquisition
Land acquisition is implemented pursuant to the Regulation of the KEPRESNo. 55/1993 with the establishment of the Committee oi Land Acquisitionfor the State with PLN and the related Department/Authorit;11 as members.
b. System of Compensation
The amount of the payment of compensation for lard and plants will bebased on consultation between the Committee for Land Acquisition and thepopulation whose land is affected by the project.
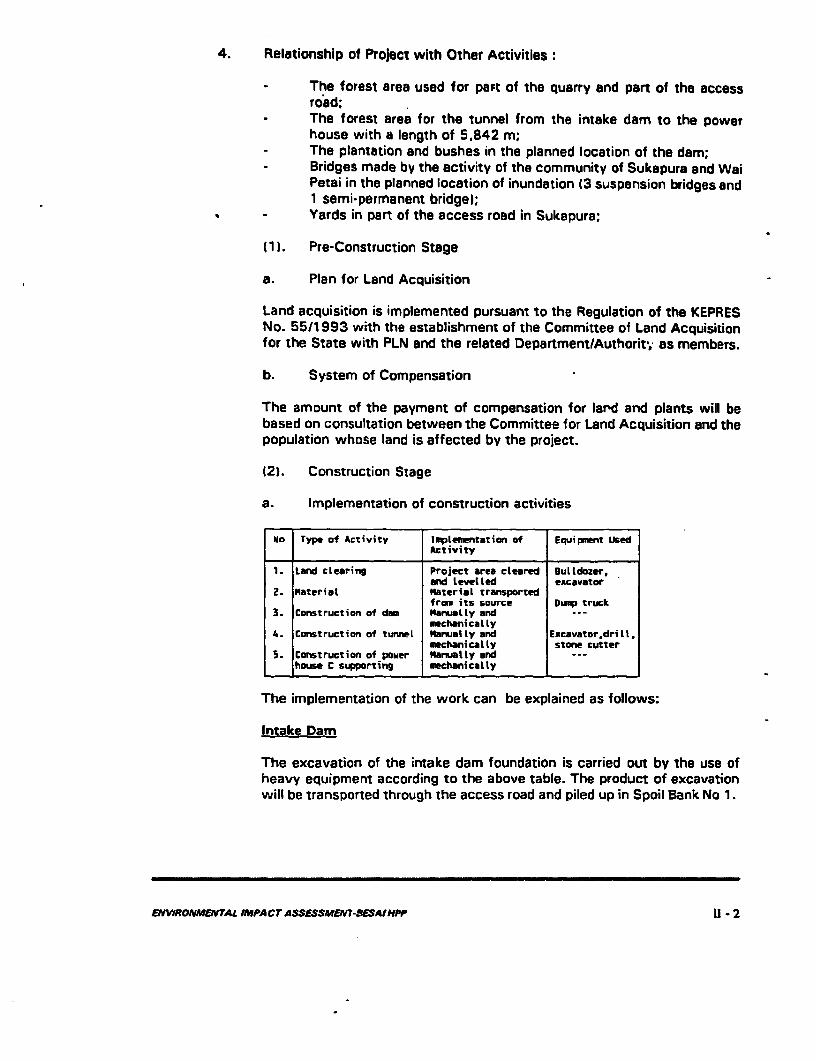
(2). Construction Stage
a. Implementation of construction activities
Mo Type of Activity Iplefnentation of Equipment UsedActivity
1. tand cLearing Project area cleared gulLdozer,and Levelled excavator
Z. Materiat Material transportedfrom its source Dump truck
3. Construction of dm ManualLy and _mechanically
4. Construction of tunnel Manually and Excavator,drilltmechanically stone cutter
5. Construction of power Manually and ...house C supporting mechanically
The implementation of the work can be explained as follows:
Intake Dam
The excavation of the intake dam foundation is carried out by the use ofheavy equipment according to the above table. The product of excavationwill be transported through the access road and piled up in Spoil Bank No 1.
ENVIRONMEIYTAL MPACTASSESSMEN7-ESAIPP 11 - 2
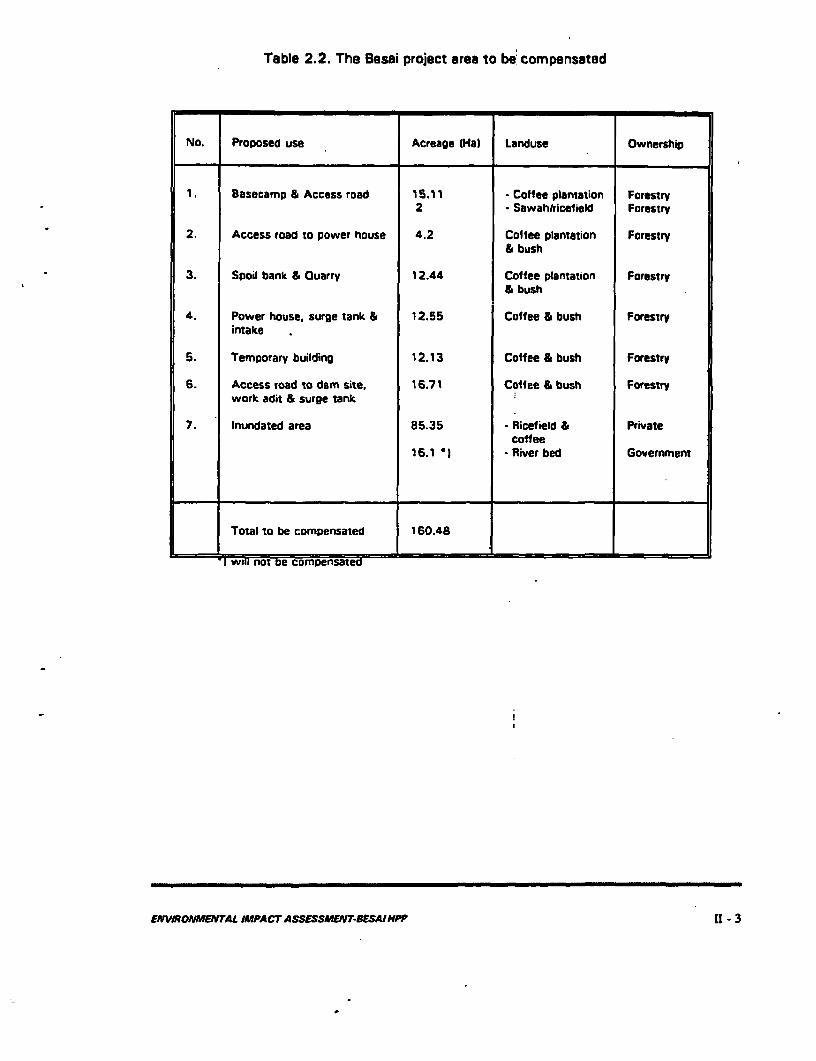
Table 2.2. The Basai project area to be compensated
No. Proposed use Acreage (Hal Landuse Ownership
1. Basecamp 8 Access road 15.11 - Col1ee plantation Forestry2 Sawahiricelield Forestry
2. Access road to power house 4.2 Coliee planbu tion ForestrySt bush
3. Spoil bank & Ouarry 12.44 Coltee plantation Forestry& bush
4. Power house, surge tank & 12.55 Colfee & bush ForestrVintake
5. Temporary building 12.13 Coffee & bush ForestrW
6. Access road to dam site. 16.71 CoNfee & bush Forestrywork adit & surge tank
7. Inundated area 85.35 - Ricelield & Privatecolfee
16.1 *I - River bed Government
L- Total to be compensated 150.48
'I wall not Be cDmpensatea
ENVIRONMENTAL IMPACTASSESSMENT-U>ESAINPP 11 -3
Head Race Tunnel
Because of the length of the headrace tunnel of * 5 km, before theexcavation work is carried out, adit tunnels No. 1, No. 2, and No.3 will bemade. Through these edit tunnels, the excavation of the headrace tunnel iscarried out to the left and the right. The product of excavation of theheadrace tunnel transported through adit tunnel No. 1 is piled up in SpoilBank 2 and the product of excavation transported through adit tunnel No. 2and No. 3 is respectively piled up in Spoil Bank 3 and Spoil Bank 4. Thetunnel is situated at an average of 100 m depth in the ground, so that theacti ity of excavation does not affect the land surface on top of it.
Access Rad
The access road to be constructed will run along the length of the Wai Beseito the mouth of adit tunnel no.,. 2, and 3 and further to the spoil bank sseeFigure I) .
The access road along the tunnel is not a permanent one. After completionof the project this access road may continue to be used or replanted.
Power house. surae tank. and oenstock
These parts will be dealt with manually and mechanically. The product ofexcavation of the power house will be piled up in Spoil Bank No.5 and No.6;the product of excavation of the surge tank will be piled up in Spoil Bank No.4 and No. 5. and that of the penstock in Spoil Bank No. 4.
The construction material used in the construction stage which is likely tobring about an impact are stone and sand during mining and transportation.
End disposal of disposed material in the construction stage:Disposed material will be piled up in layers and levelled with a thickness ofmaximum 20 cm for each layer and then compacted with a bulldozer.
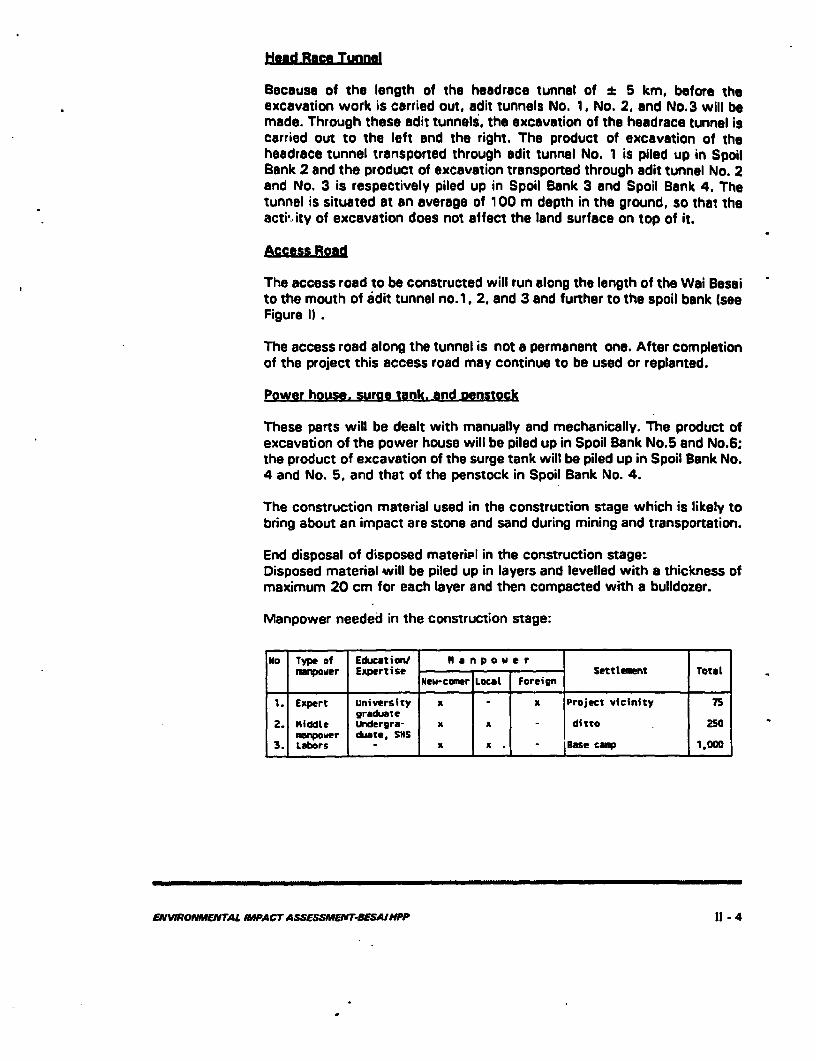
Manpower needed in the construction stage:
No Type of Education/ a n p o w e rmanpower Expertiser - Settlement Total_ ~~~~~~New-coiner Local Foreign
1. Expert university x x Project vicinity 75
2. MiddLe Urdergra- x x ditto 250manpower duate. SHS
3. Labors x x . Base ceo 1,000
ENWRONMENTAL IMPACTASSESSMEftIT-EESAIHPP 11 - 4
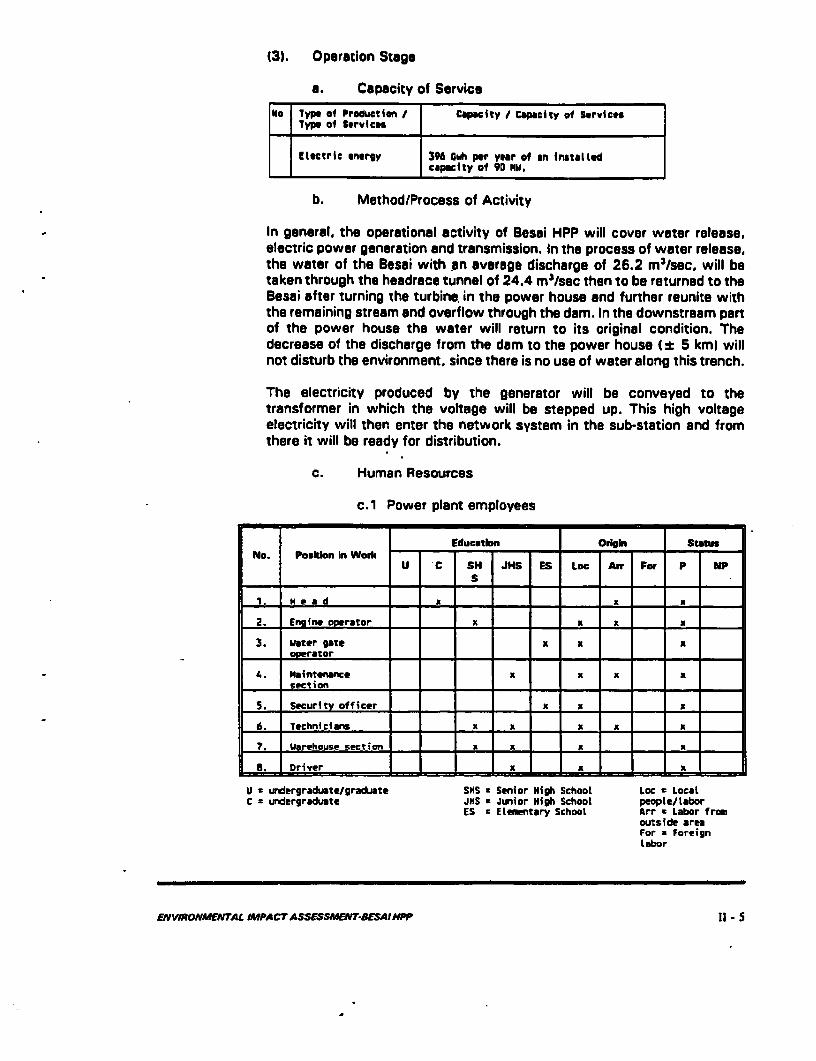
(31. Operation Stage
a. Capacity of Service
No 1ype of Production d Capacity / Capacity of ServiceType of Services
Electric energy 396 Gwh per year of an installedcapacity of 9D NIl.
b. Method/Process of Activity
In general, the operational activity of Besai HPP will cover water release,electric power generation and transmission. In the process of water release,the water of the Besai with an average discharge of 26.2 m3/sec, will betaken through the headrace tunnel of 24.4 m3/sec then to be returned to theBesai after turning the turbine. in the power house and further reunite withthe remaining stream and overflow through the dam. In the downstream partof the power house the water will return to its original condition. Thedecrease of the discharge from the dam to the power house (±t 5 km) willnot disturb the environment, since there is no use of water along this trench.
The electricity produced by the generator will be conveyed to thetransformer in which the voltage will be stepped up. This high voltageelectricity will then enter the network system in the sub-station and fromthere it will be ready for distribution.
c. Human Resources
c.1 Power plant employees
Educatlon Of ion statusNo. Posion In Work - _
U C SH JHS ES Loc Alr Fer P NP
E1.i It e a d - x - - = x = -
2. Engine operaTor x x x x3. water gate x a a
operator I
4. Maintenace x x x xsection
S. Security officer =_= = x x = =
6. Technicians =x x =_ x x = x
7 Warehouse section = = x x =___ a =
S. Driver x x - _ x
U a undergraduate/graduate SHS * Senior High School Loc * LocalC x undergraduate JHS a Junior High School people/labor
ES * Elementary School Arr * Labor fromoutside areaFor a ForeignLabor
EWVYONMENTAL IMPACTAS SEMENrTSSAHPP 11 - 5
c.2 Educational Facilities and Work Equipment
The education and courses given to the workers are a.o.: networkmaintenance, HPP basics, operation and maintenance, security guardtraining, and typewriting.
For the smooth execution of tasks, security and safety of the worker,work outfit will be needed, such as: work dress, safety helmet,voltage-proof shoes, voltage-proof gloves, leather/cotton gloves,raincoat, rubber shoes, safety belt, respiratory protection, eyeprotection, ear protection, flashlight, electricity welding mask, carbidewelding cye- glasses, asbestos welding gloves, and first aidmcdicines.
ENVIRONMENTAL IMPACT ASSESSMENT-RESAIHPP 11- 6
III. ENVIRONMENTAL BASELINE
3.1 Geophysical
(1) Climate and Air Oumlity
a. Rainfall and Temperature
The type of the climate in the area of study is categorized accordingto Koppen and the type of rainfall is categorized according to Schmidt andFerguson. In addition the agroclimatological zone in the area of study iscategori2ed according to Oldeman.
The area of study has a rainfall of 2,614 mm per year with anaverage dailv air temperature of 21.20C. The lowest average daily airtemperature is in August (20.30C) and the highest in March, April, andDecember of 21.7°C each.
The highest rain intensity is in December (16.1 mm/day) and thelowest in June (12.1 mm/day). The result of the processing of climatologicaldata is presented in Table 3.1.
Based on the division of the climate type according to Koppen, thearea ol studv has the climate type Af with the following description:
- The air temperature in the lowest month is 20.3°C (18 DC).3 X
- Much rainfall in the dry season. The data on rainfall in the area ofstudy show that there is no dry month (month with a rainfall of < 60mn) and that there are 11 wet months (rainfall of > 100 mm).
- The rainfall in the driest month is 93 mm ( 60 mm).
b. Wind
The average wind velocity in the area of study is 39.31 km/day with avariety of 27.1 km/day as the weakest wind velocity (May) and 54.1km/day as the strongest wind velocity in December.
The wind direction in the area of study is variable . The dominant winddirection all year long is from the North, i.e. in the months of April. June.July. August, and November and from the South-West and South-East inSeptember and from the North and South-West in December. In the monthsOf January. February, March. May. and October the wind direction isdominatingly from the North-East.
EMZWONMENTAL IMPACT ASSESSMEWTSESAI PP 111- 1
C. Air Humidity V
The average daily value o1 the relative air humidity in the area of study is84.3%. The lowest average daily relative air humidity is in November (82.3%l and the highest in February (85. 7%).
d. Solar Radiation
The average daily solar radiation in the area of study is 210.42 cal/cm2/day.The lowest average daily solar radiation is in January (177.2 callcm2/day)and the strongest in May (227.1 cal/cm2/day)
e. Duration of Radiation
The average daily duration of solar radiation in the area of study is between3.9 and 6.8 hourstday or an average of 5.2 hours/day. The shortest durationof radiation is in December and the longest in June.
f. Evaporation
The average daily evaporation in the area of study is 3.81 mm/day. The leastaverage daily evaporation is in July (4.41 mm/day) and the most is inDecember (4.9 mm/day).
9. Evapotranspiration
In this study the evapotranspiration is counted by the Thomwaite method.as this rnethod is considered quite proper for medium to wet areas. Theaverage evapotranspiration is 7.7 cm/month.
a < h. Rain Water Balance
The water balance will give important information on the net water receivedby a certain area, so that it can be known when the surplus months will beand when the months of water deficit.
Adjusted to its objective, the water balance model will be drawn up in. theform of a very common quantitative equation. i.e. as based on the rainfalldata and the potential evapotranspiration value in that area.
Of the result of analysis as per the Table 3.2. in the area of study there areno months of water deficit, or in other words the area of study has a wetclimate with high rain potential.
i. Air Quality
The air quality which should be observed in connection with the activity planof Besai HPP are noise, dust, and gases. The degree of noise, dust content.and gases in the project location and surroundings is considered to be stilllow.
ENIONMNT-AL IPA CT ASSESSMENT-SESAJNPP 111- 2
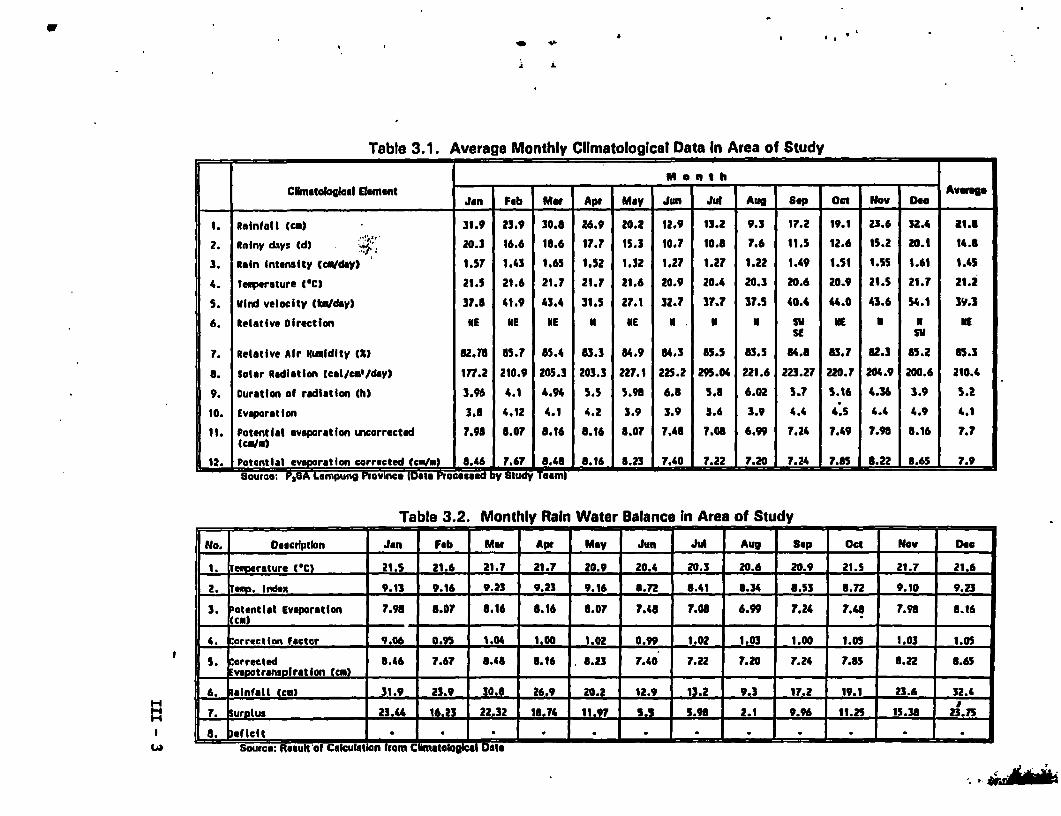
Table 3.1. Average Monthly Climatological Data In Area of Studyr ~~~~~~~~~~~~~~~~~M o n t bClmatological cement Averal
Jan Fab Maf Apt May Jun Jud Aug Sep oct Nov DcG
1. Rainfall (cm) 31.9 23.9 30.8 26.9 ZO.2 12.9 13.2 9.3 17.2 19.1 23.6 3.4 71.0
2. Rainy d-sys fd) W;20.3 16.6 18.6 17.7 15.3 10.7 10.8 7.6 11.5 12.6 15.2 20.1 14.6
3. Rain Intenity l cm/day) 1.5? 1.43 1.65 1.52 1.32 1.27 1.27 1.22 1.49 1.51 1.S5 1.61 1.4S
4. Teeperature (OC) 21.5 21.6 21.7 21.7 21.6 20.9 20.4 20.3 20.6 20.9 21.5 21.7 21.i
S. Vind velocity (kbday) 37.8 41.9 43.4 31.5 27.1 32.7 37.7 37.5 40.4 4.0 43.6 54.1 3V.3
6. Relative Direction RE RE ME N mE U U U Sg ME P N *ESE SM
7. Relative Air HumldIty (X) 82.78 8S.7 85.4 83.3 84.9 84.3 85.5 83.5 84.8 83.7 82.3 85.2 85.3
8. Solar Radiation (cal/c'/day) 177.2 210.9 205.3 203.3 227.1 225.2 29S.04 221.6 223.27 220.7 204.9 200.6 210.4
9. Duration of radiation (h) 3.96 4.1 4.94 5.5 5.98 6.8 5.8 6.02 5.7 S.16 4.36 3.9 5.2
10. Evaporation 3.8 4.12 4.1 4.2 3.9 3.9 3.6 3.9 4.4 4.5 4.4 4.9 4.1
11. Potential evaporatfon uacorrected 7.98 8.07 8.16 8.16 8.07 7.48 7.08 6.9 7.24 7.49 7.98 8.16 7.7(cu/.n)
'12. Potential evaporatIon corrected (cM/u) 8.46 7.67 8.48 8.16 8.23 7.40 7.22 7.20 7.24 7.8S 8.22 8.65 7.9- autceO P'3 5A LumpUng Province D* ec byF tud - -*- - = - -Ml
Table 3.2. Monthly Rain Water Balance In Area of Study
No. Deecription Jan Feb Maw Ape May Jun Jul Aug Sep Oct Nov Doe
1. Irperature (OC) 21.S 21.6 21.7 21.7 20.9 20.4 20.3 20.6 20.9 21.s 21.7 21.6
2. aep. Irdex 9.13 9.16 9.23 9.23 9.16 .72 8.41 8.34 8.53 8.72 9.10 9.23
3. otentiel Evaporation 7.98 8.07 8.16 8.16 8.07 7.48 7.08 6.99 7.24 7.48 7.9 | 8.16cm) I I -
4. orrectlon factor 9.06 O.95 1.04 1.00 1.02 0.99 1.02 1.03 1.00 1.05 1.03 1.05
S. orrected 8.46 7.67 8.48 8.16 8.23 7.40 7.22 7.20 7.24 7.5s 8.22 8.65vapotranspiration (cm) - _ -_ -
6. sinfall (co) 31.9 23.9 30.8 26.9 20.2 12.9 13.2 9.3 17.2 19.1 23.6 3Z.4
H 7. _nu 2J.4j tj.23 22.32 18.74 11.97 5.5 5.98 2.1 9.96 11.2S 15.38* 8. eflcit . -. . . . *
W Soure: Result FoCaul an from C aotog el ale _ - - - -
This is caused by the relatively imited transportation in this area, thenon-existence of industry as a source of pollution, and the activity of thepeople which is still focused on the agricultural sector.
(2) Physiography
a. Topography and Morphology
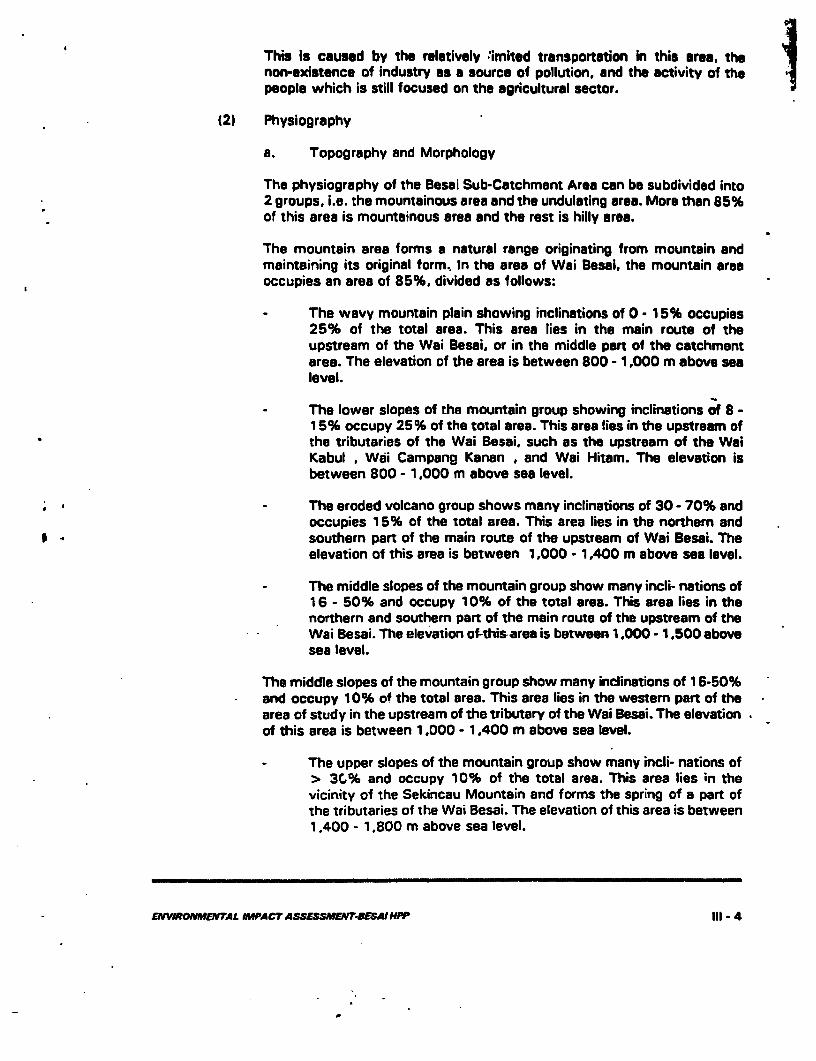
The physiography of the Besai Sub-Catchment Area can be subdivided into2 groups. i.e. the mountainous area and the undulating area. More than 85%of this area is mountainous area and the rest is hilly area.
The mountain area forms a natural range originating from mountain andmaintaining its original forms In the area of Wai Bessi. the mountain areaoccupies an area of 85%. divided as follows:
- The wavy mountain plain showing inclinations of 0 - 15% occupies25% of the total area. This area lies in the main route of theupstream of the Wai Besai, or in the middle part of the catchmentarea. The elevation of the area is between 800 - 1,000 m above sealevel.
- The lower slopes of the mountain group showing inclinations of 8 -15% occupy 25% of the total area. This area lies in the upstream ofthe tributaries of the Wai Besai. such as the upstream of the WaiKabul , Wai Campang Kanan , and Wai Hitam. The elevation isbetween 800 - 1.000 m above sea level.
.- The eroded volcano group shows many inclinations of 30- 70% andoccupies 15% of the total area. This area lies in the northern andsouthern part of the main route of the upstream of Wai Bessi. Theelevation of this area is between 1,000 - 1,400 m above sea level.
- The middle slopes of the mountain group show many incli- nations of16 - 50% and occupy 10% of the total area. This area lies in thenorthern and southern part of the main route of the upstream of theWai Besai. The elevation of-this-area is between 1.000 - 1,500 abovesea level.
The middle slopes of the mountain group show many inclinations of 16-50%and occupy 10% of the total area. This area lies in the western part of thearea of study in the upstream of the tributary of the Wai Besai. The elevationof this area is between 1.000 - 1,400 m above sea level.
- The upper slopes of the mountain group show many incli- nations of> 3C.% and occupy 10% of the total area. This area lies in thevicinity of the Sekincau Mountain and forms the spring of a part ofthe tributaries of the Wai Besai. The elevation of this area is between1,400 - 1,800 m above sea level.
ENWRONVENTAL IMPACT ASSES SMENTW"8J ESPP 111- 4
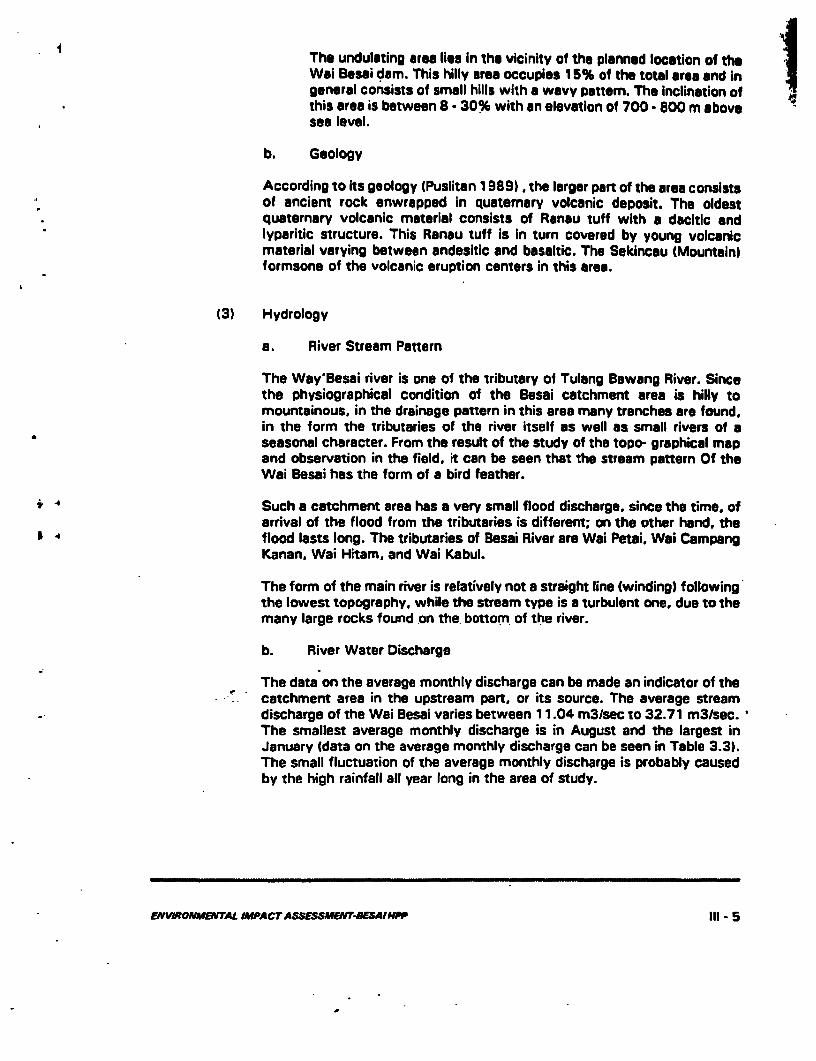
The undulating area lies In the vicinity of the planned location of theWei Besai dam. This hilly urea occupies 15% of the total area and Ingeneral consists of small hills with a wavy pattern. The inclination ofthis area is between 8 - 30% with an elevation of 700 - 800 m abovesea level.
b. Geology
According to its geology (Puslitan 1 989X, the larger part of the area consistsof ancient rock enwrapped in quaternary volcanic deposit. The oldestquaternary volcanic material consists of Ranau tuff with a dacitic andlyparitic structure. This Ranau tuff is In turn covered by young volcanicmaterial varying between andesitic and basaltic. The Sekincau (Mountain)formsone of the volcanic eruption centers in this area.
(3) Hydrology
a. River Stream Pattern
The WayBesai river is one of the tributary of Tulang Bawang River. Sincethe physiographical condition of the Besai catchment area is hilly tomountainous, in the drainage pattern in this area many trenches are found,in the form the tributaries of the river itself as well as small rivers of aseasonal character. From the result of the study of the topo- graphical mapand observation in the field, it can be seen that the stream pattern Of theWai Besai has the form of a bird feather.
Such a catchment area has a very small flood discharge, since the time, ofarrival of the flood from the tributaries is different; on the other hand, theflood lasts long. The tributaries of Besai River are Wai Petai. Wai CampangKanan. Wai Hitam. and Wai Kabul.
The form of the main river is relatively not a straight line (winding) followingthe lowest topography, while the stream type is a turbulent one, due to themany large rocks found on the, bottom of the river.
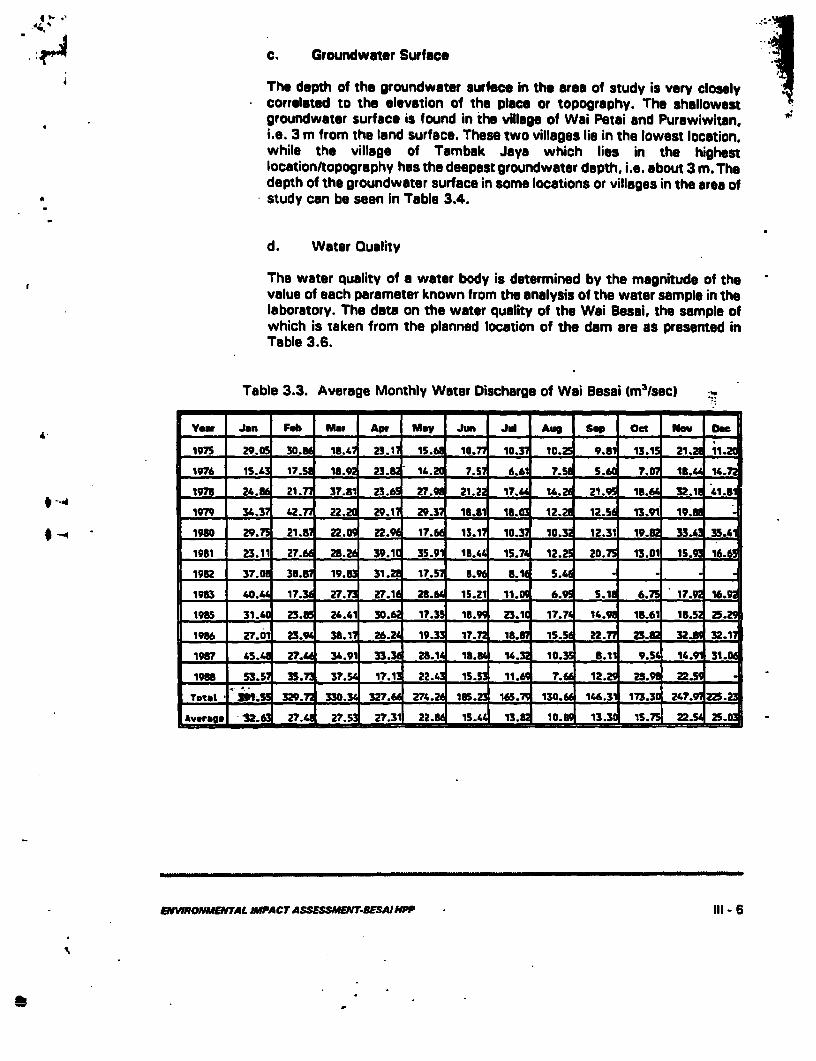
b. River Water Discharge
The data on the average monthly discharge can be made an indicator of thecatchment area in the upstream part, or its source. The average streamdischarge of the Wai Besai varies between 1 1.04 m3/sec to 32.71 m31sec.The smallest average monthly discharge is in August and the largest inJanuary (data on the average monthly discharge can be seen in Table 3.3).The small fluctuation of the average monthly discharge is probably causedby the high rainfall all year long in the area of study.
ENVIRONMENTAL IMPACTASSESSMENTrBESWfP 111 5
C. Groundwater Surface
The depth of the groundwater surface in the arao of study is very closelycorrelated to the elevation of the place or topography. The shallowestgroundwater surface is found in the village of Wai Petai and Purawiwitan.i.e. 3 m from the land surface. These two villages lie in the lowest location,while the village of Tambak Jaya which lies in the highestlocation/topography has the deepest groundwater depth, i.e. about 3 m. Thedepth of the groundwater surface in some locations or villages in the area of
a study can be seen in Table 3.4.
d. Water Quality
The water quality of a water body is determined by the magnitude of thevalue of each parameter known from the analysis of the water sample in thelaboratory. The data on the water quality of the Wai Besai, the sample ofwhich is taken from the planned location of the dam are as presented inTable 3.6.
Table 3.3. Average Monthly Water Discharge of Wai Besai (m3/sec) .
vowt Jun Feb Mo Apt May Jun Jld Aug Sop Oct No _
1975 29.05 30. 18.47 23.1' 1S. 18.7 10.3 10. 9.8 13.15 21. 11.
1976 15.A. 17. 15.9 23.1S 14. .57 6.6 7.5 5. 7.07 18. 17.
1978 21. 21.A 37.81 23.6 27. 21.221 17.& 1U.2 21. 18.6Q 32.1 1.1.1
1979 34.37 42.72 22.2 29.11 29.3 18.81 18. 12.2 12.56 13.91 19.A A
1980 29.75 21.0' 22.0 22.9 17. 13.1' 10.3 10.3 12.31 19.8 33. 35.411
1981 23.11 27.b 28.2 39.1 35.91 13.41 15.7 12.2 20.75 13.01 15.9 16.61982 37.0 30J' 19.U 31. 17.57L 8.1 S.L . -. -
1913 40.L 17. Z7. 27.1 28. 15.21 11.0 6.9 S.1 6.75 17. 16.
1935 31.1. 23.! 2.41 30. 17.3 18.9 23.1d 17.7 1L.9 18.61 1B.5 25.1936 27.01 23.9 38.17 26.2 19.3 17. 18. 1S.S 22.7 23.o 32.a 32.1
1987 1.5.4 27.4 36.91 33.31 23.1 l8. 14.3 10.3 8.14 9.S 1.91 31.
198 . 535.5' 3S.7 3P.5J 17'.1 22.4' 15.5 11.6 7. 12.2 25.9 22.5 =
Total Il.51 329.7 330.3 327.6 27.2 185. 165.7" 130. 1.6.31 173.3 2147.9 25.Z
lAvag 32.S 27. 27.5' 27.3 22.d 15. 13.E 10. 13.3 15.7 22. 25.0
NVJRONME&TAL MIPACTASSESSMEW-TESAIMPP ll - 6
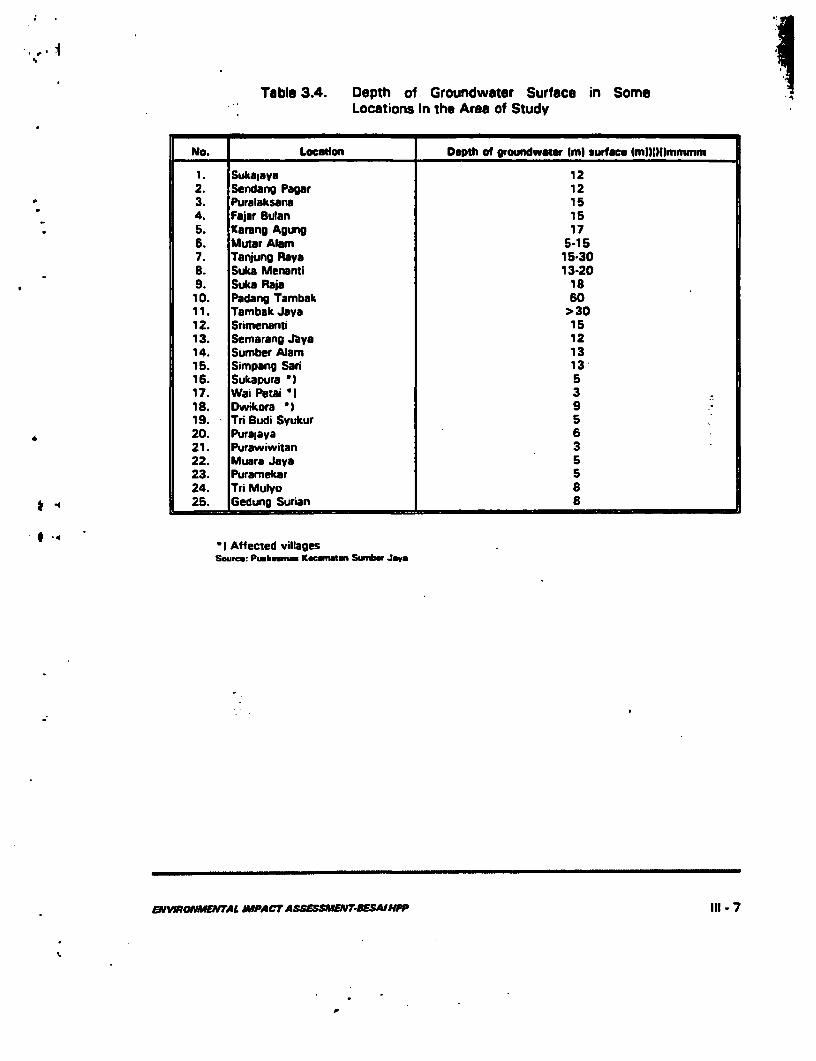
Table 3.4. Depth of Groundwater Surface in SomeLocations In the Area of Study
No. Locadon Depth of groundwatwr Iml surface ImM(lIlmmmm
1. Sukalays 122. Sendang Pagar 123. Puralaksana 154. Fajar Bulan 155. Karang Agung 176. MuLar Alam 5-157. Tanjung Rava 152308. Suka Menanti 13-20
.9 Suka Raja 1810. Padang Tambak 6011. Tambak Java 13O
12. Srimenanti 1513. Semarang Jaya 1214. Sumber Alam 1315. Simpang Sari 1316. Sukapura I 517. Wai Petail 318. Dwikora I 919. Tri Budi Syukur 520. Puralaya 621. Purawiwitan 322. Muara Jaya 523. Puramnekar 524. Tri Mulyo 825. Gedung Surian 8
0 1 Affected villagesSource: Puskoumn.s K.cavma Sumbu JSaV
ENVIRONMENTAL IPACTASSESSMENV-ESAIHPP 111- 7
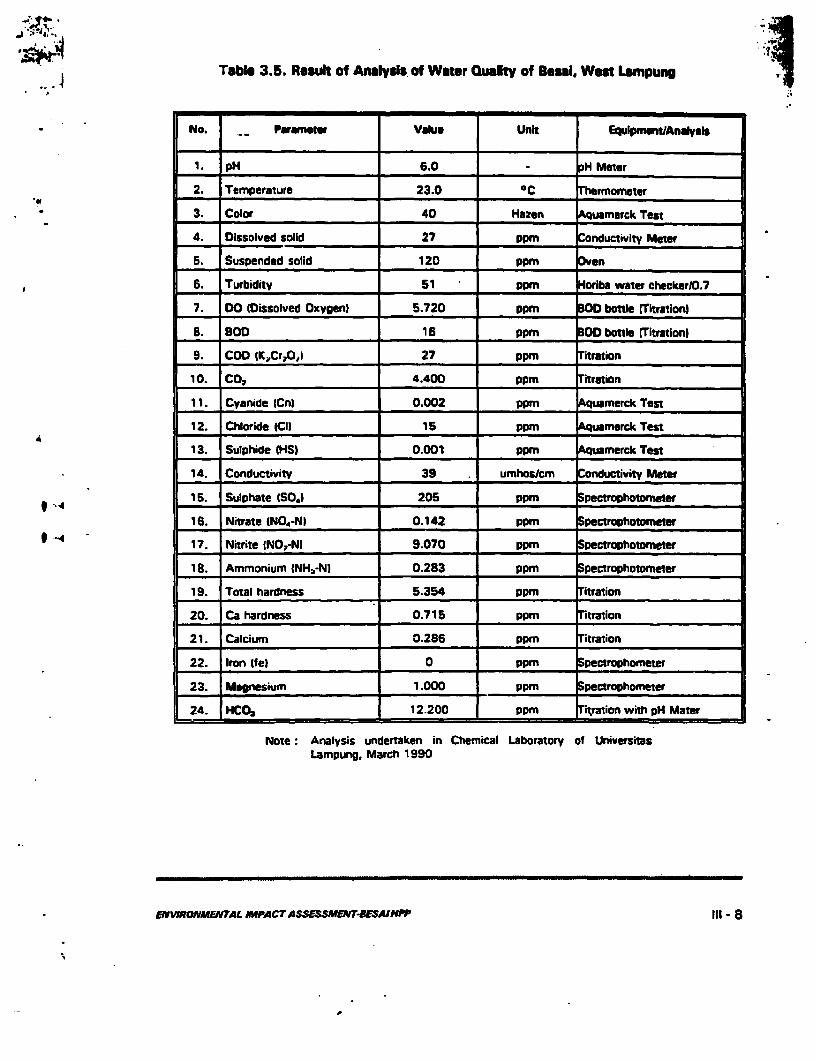
Table 3.5. Result of Analysi of Wtr Qualty of Basel Wet Lempung4 of ;-u~ T SS UUIy
No. - Pwrmtw Valu Unit EqulpmmtAnalVuls
1. pH 6.0 p H Meter
2. Temperature 23.0 c hermometer
3. Color 40 Hazen quammrck Test
4. Dissolved solid 27 ppm onductivity Meter
5. Suspended solid 120 PPm ven
6. Turbidity 51 ppm oriba water checkerlO.7
7. DO (Dissolved OxVgen) 5.720 PPm bottle =Titration)
S. BoD 16 PPm 3D bottle rTitrationi
9. COD (K,Cr,O,I 27 PPm ir_
10. co0 4.400 ppm itratn
11. Cyanide ICnl 0.002 ppm quamerck Test
12. Chloride ICII 15 PPM Aquamerck Test
13. Sulphide IHS) 0.001 ppm Aquamerck Test
14. Conductivity 39 umhos/cm onductivity Meter
1 5. Sulphate (SO,I 205 PPm pectrophotoneter
16. Nitrate (NOs-NI 0.142 PPm pectrophotometer
* 17. Nitrite INO7-N| 9.070 Ppm pectrophotomeer
18. Ammonium (NH3-N) 0.283 PPM Spectrophotomneer
19. Total hardness 5.354 Pppm itration
20. Ca hardness 0.715 PPm itration
21. Calcicum < 0.286 PPm itration
22. Iron lfel 0 PPm pectrophometer
23. Magnesium 1.000 PPm pectrophometer
24. HC02 12.200 PPM iration with pH Mater
Note: Analysis undertaken in Chemical Laboratory of UniversitasLampung. March 1990
ENVVJWONMENTAL AMPACTASSESSMENT49ESIP Ill - 8
(4) Soil I
a. Soil Classification
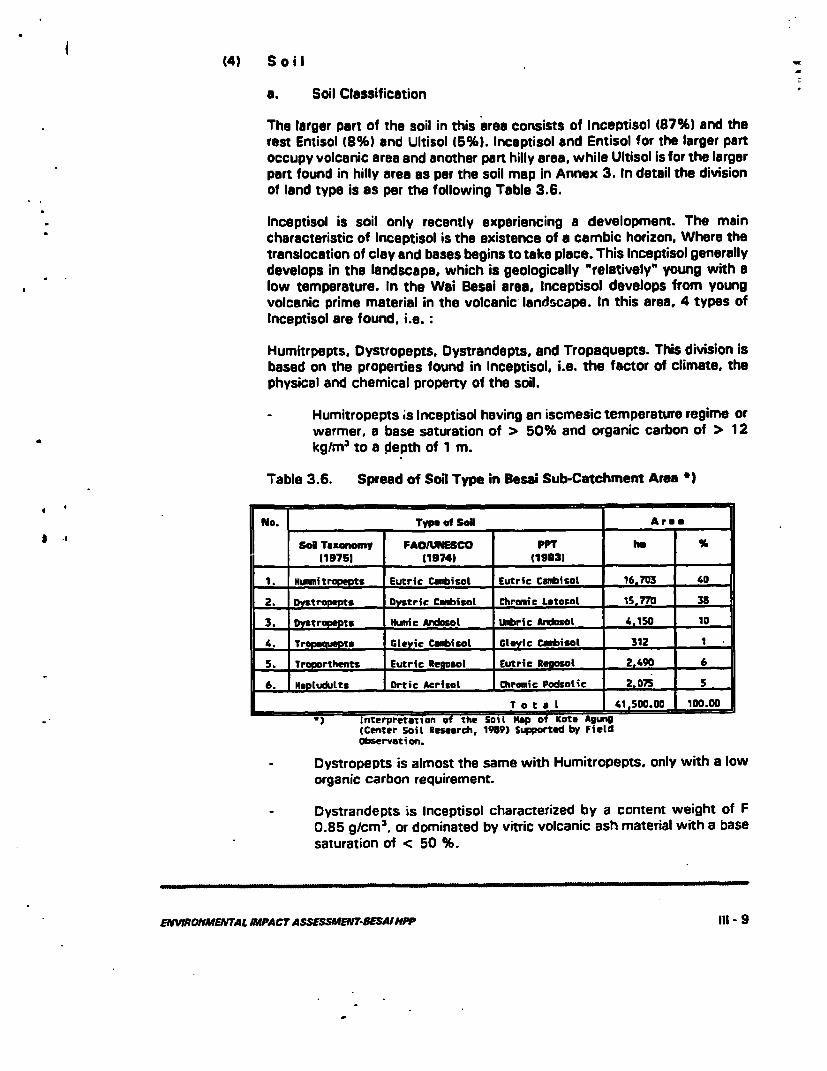
The larger part of the soil in this area consists of Inceptisol (87%) and therest Entisol (8%) and Ultisol (5%). Inceptisol and Entisol for the larger partoccupy volcanic area and another part hilly area, while Ultisol is for the largerpart found in hilly area as per the soil map in Annex 3. In detail the divisionof land type is as per the following Table 3.6.
Inceptisol is soil only recently experiencing a development. The maincharacteristic of Inceptisol is the existence of a cambic horizon, Where thetranslocation of clay and bases begins to take place. This Inceptisol generallydevelops in the landscape, which is geologically "relatively" young with alow temperature. In the Wei Besai area, Inceptisol develops from youngvolcanic prime material in the volcanic landscape. In this area. 4 types ofInceptisol are found. i.e.:
Humitrpepts. Dystropepts. Dystrandepts. and Tropaquepts. This division isbased on the properties found in Inceptisol, i.e. the factor of climate, thephysical and chemical property of the soil.
- Humitropepts is Inceptisol having an iscmesic temperature regime orwarmer, a base saturation of > 50% and organic carbon of > 12kg/m3 to a depth of 1 m.
Table 3.6. Spread of Soil Type in Besai Sub-Catchment Area )
No. ~~~~~~Type ofSol Aram
Sol Taxonom,y FAOJUNE5CO PPT he119751 (19741 (19833 -
I HwImitrCpepts Eutric Canbisol Eutric Caubisot 16.703 40
2 Dv trou pts Dystric C.ubisol, Chromic Latorol 15 770 38
3 ytrapevts Hwuic Ardosol Urbric A o t 4.150 10l
*. Trpopaumpts GLeyic Cawbisot Clayic Canbisol 312 1
S. Tropor hents Eutric Rempsol tutric Re at 2 9
6. HaptuduLts Ortic Acrisot ChromicPodtic 2.075 5
T o t a l 411500.00 100.00
Interpretation of the Soil Map of Kota Agung(Center Soil Research, 1989) supported by Fieldobservation.
- Dystropepts is almost the same with Humitropepts. only with a loworganic carbon requirement.
- Dystrandepts is Inceptisol characterized by a content weight of F0.85 gicm
3 . or dominated by vitric volcanic ash material with a basesaturation of < 50 %.
ENIVIRONME.TAL IUPACT ASSESSM-UMEIPP 111 - 9
- Tropoquepts is Inceptisol having an aquic humidity regum and anannual temperature difference of < 5 OC in the warm season andcold season.
Entisol is soil not having developed and the larger part of its property isdetermined by its prime material. No horizon development of this soil hasbeen observed and if any, then very little. This soil develops in the erodedvolcanic landscape. In the Besai Sub-Catchment Area only Troporthepts isfound, i.e. Entisol developing from young volcanoes with an upper coursehumidity regime and a temperature difference o1 < 5°C.
Ultisol is soil having developed characterized by the existence of an argilichorizon and a base saturation of < 35%. Developing in ancient landscapein the hilly area of Wai Besai.
Hapludults is Ultisol having an upper course humidity reg.me and no othersignificant characteristics.
b. Erosion
A large part of the Besai Sub-Catchment Area is sensitive to erosion. Severalfactors which are of much influence in inducing erosion in this area are, a.o
- The physiography of the area is volcanic and hilly with an averageinclination of more than 15%.
- The type of soil which for a large part is sensitive to erosion(Inceptisol and Ultisoli.
- The high erodibility of rain (erodibility index between 1.500 - 2,500).- The factor of land management, where a large part of the agricultural
area does not take conservational actions.
From the survey undertaken by PT. Indra Karya and Nippon Koei (1 984i therate of erosion of 0.13 mm/year is obtained (equivalent to 53.950 ton/year).
c. Land Use
The use of land in Wai Besai can roughly be distinguished into two types, i.e.sawah (wet rice cultivation) land and dry land. The use of land in the Besaiarea can be seen in Table 3.7.
From observations in the field and interviews with farmer, it appears thatmost of the farmers have not taken conservational measures in their land.Coffee plants which form the main crop in the private plantation are alwaysclear from weeds all year long (cleared/ scraped intensively). This contributesto the high rate of erosion, particularly on land with an inclination of morethan 15%.
ENRONMENTAL IMPA CT ASSESSMENT-BESAIHPP 111- 10
The research undertaken by the RLKT Station 0 989) shows that the valueof "plant factor" or C is between 0.007 - 0.541, or an average of 0.226. Asa comparison, the value C of a dense forest is 0.0001 and land withoutplants is 1 (one). Furthermore, the value of the land management factor (P1is between 0.965-2.00. or an average of 0.983.
As a comparison, at an inclination of 15% with terraces (as a conservationalmeasure) the value of P is 0.1 and for land without management, P = one (1 I.
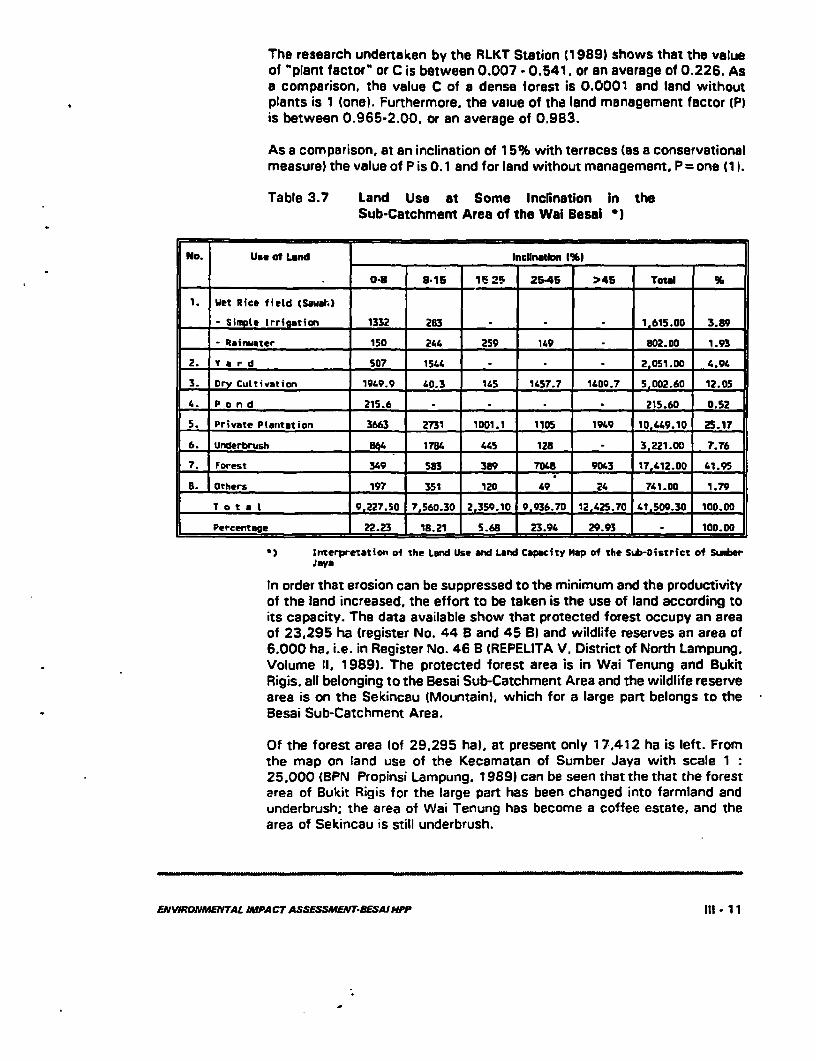
Table 3.7 Land Use at Some Inclination In theSub-Catchment Area of the Wai Besai 9)
No. Use of Land Incnadton lI__
.__________ 0-8 8-15 is 2F 25-45 >45 Total %
1. Wet Rice field (Sawat)
- SinwLe Irrigation 1332 2B3 . . _ ._ 1 615.00 3.89
- Rainwater 150 241. 259 11.9 - 802.00 1.93
2. V a r d 507 151.U . . 2.051.O0 *.91.
3. Dry Cultivation 191.9.9 1.0.3 145 1f.57.7 1L09.7 5 002.60 12.05
4. P a n d 215.6 . . 215.60 O.S2
5. Private Plantation 3663 2731 1001.1 1105 1949 10,49.10 25.17
6. Underbrush oA4 178L 445 1Z8 - 3,221.00 7.76
7. Forest 349 583 3B9 7048 9043 17.412.00 41.95
8. Others 197 351 120 49 21 71.1.00 1.79
Toa t alt 9,227.50 7,560.30 2 359.10 9 936.70 12 425.70 41 509.30 100.00
Percentage 22.23 18.21 5.68 23.91 29.93 . 100.00
interpretation of the Land Use and Land Capacity Map of the Sub-District of SuwberJaya
In order that erosion can be suppressed to the minimum and the productivityof the land increased, the effort to be taken is the use of land according toits capacity. The data available show that protected forest occupy an areaof 23,295 ha (register No. 44 B and 45 B) and wildlife reserves an area of6.000 ha, i.e. in Register No. 46 B (REPELITA V, District of North Lampung,Volume II, 1989). The protected forest area is in Wai Tenung and BukitRigis. all belonging to the Besai Sub-Catchment Area and the wildlife reservearea is on the Sekincau (Mountain), which for a large part belongs to theBesai Sub-Catchment Area.
Of the forest area (of 29.295 ha), at present only 17,412 ha is left. Fromthe map on land use of the Kecamatan of Sumber Jaya with scale 1:25.000 (BPN Propinsi Lampung, 1989) can be seen that the that the forestarea of Bukit Rigis for the large part has been changed into farmland andunderbrush; the area of Wai Tenung has become a coffee estate, and thearea of Sekincau is still underbrush.
ENVWRONMENTAL IMPACT ASSESSMENT-BESAI HPP III- 1l
In connection with the development plan of the Besai HPP and the reservoirfor irrigation in part of the Besai HPP downstream area, it has become timeto arrange the use of land in the Besai Sub Catchment Area according to itsdestination.
The rate of erosion in this area is naturally high due to the high rainfall,topography, and land properties. This rate of erosion is more accelerated bythe people (farmers). as the farming pattern does not consider the norms ofland conservation.
In order that the hydrology of the catchment area will remain fair, thefollowing should be observed:
- The land management should adopt the norms of conservation, suchas making of terraces.
- The use of land should be in accordance with its allocation.- Part of the protected forest area which has now become farmland
should be rearranged.- Replanting and reforestation should be carried out with a priority for
land having a high decree of danger of erosion.
d. Land Use Planning in the Downstream Area
From it information obtained, it appears that no plan has been made for landuse in the downstream area oi the dam, particularly for sawah land.
e. Land Use in the project site
3.2 Biology
(1) Terrestrial Biota
a. Flora
nhe vegetation of the Kecamatan (Sub-District) of Sumber jaya. which formsthe Sub-Catchment Area of the Wai Tulang Bawang Hulu. can ecologicallybe sub-devided into six types, i.e. yard vegetation, sawah (wet ricecultivation), ladang/tegalan (dry cultivation), garden/estate, underbrush, andforest. These six t,,yes of -vegetation area spread sporadically, with theexception of forest vegetation which is more concentrated in the upstreamarea.
a. t Home Yard (Home Garden)
A yard is a plot of land lying adjacent to the house (dwelling place) and hasusually distinct borders. Yard land in the Kecamatan of Sumber Jaya covers anarea of 2.051 ha (4.90%).
ENVIRONMENTAL IMPACT ASSESSMEA'T-BESAIIfPP 111- 12
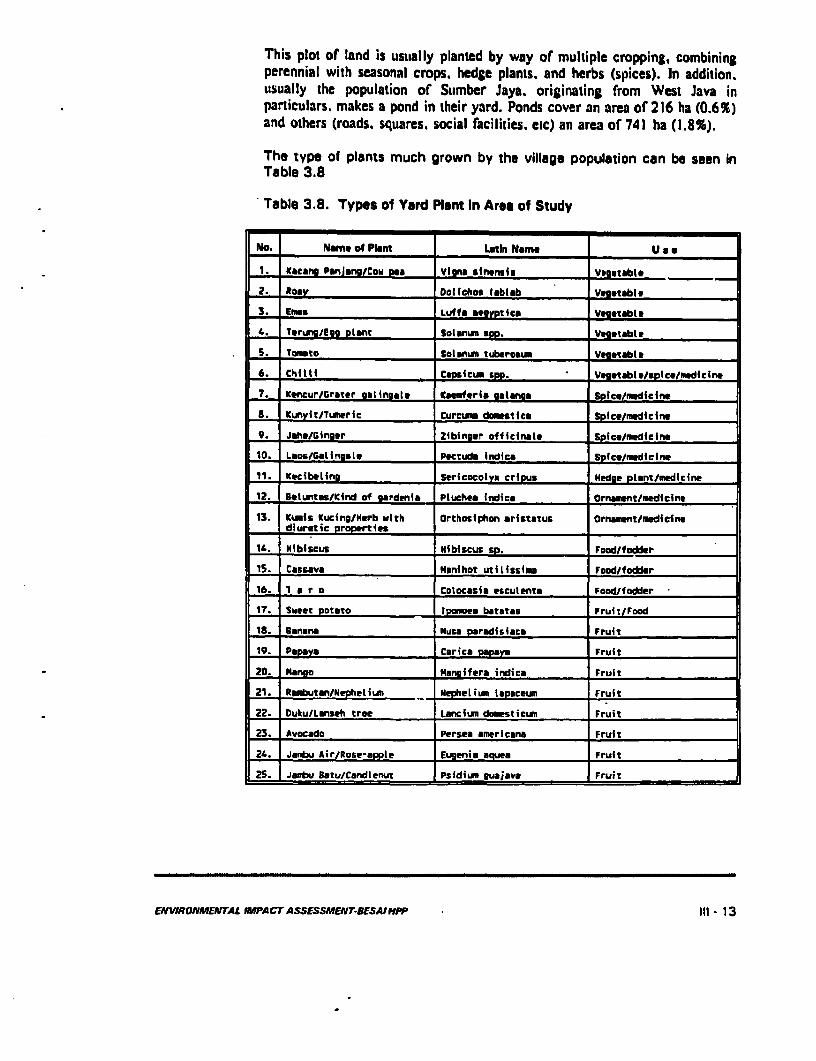
This plot of land is ustially planted by way of multiple cropping, combiningperennial with seasonal crops. hedge plants. and herbs (spices). In addition.usually the population of Sumber Jaya. originating from West Java inparticulars, makes a pond in their yard. Ponds cover an area of 216 ha (0.6%)and others (roads. squares. social facilities. etc) an area of 741 ha (1.8%).
The type of plants much grown by the village population can be seen inTable 3.8
Table 3.8. Types of Yard Plant In Area of Study
No. Name of Plant Latin Name U sa
1. Kacano Panjang/Cow Rea Vigno sinensus Vgeetable _
2. Roay Dolichos lablab Vegetable
3. Emus Luffa Oegyptica Veoettble
4. Terung/Egg plant Solanum cpp. Vegetable
5. Tomato Solanum tuberosum Vegotable
6. Chitti Cepeicum sop. Vogetable/spice/mdiclne
7. Kencur/Grater out Ingate temf erIa ogaIsng Soice/medicine
S. Kunvit/Tumeric Currumo domestice Spice/medicine
9. Jahe/Glnger Zibinger officinale Spice/medicIne
10. LaootGalingsle Pectuds Indic_ Spice/medicine
11. Keclbelln_ Sericocolyx cripus Hedge plmnt/midicine
12. leluntas/Kind of gardenia Ptuchea indiea Ornament/medIcine
13. Kumis Kucing/H.rb with Orthosiphon aristatus Ornwmentemdlcinediuretic propertles
1. HNibiscus Hibiscus gp. Food/fodder
15. Cassava Mmnihot utilIlssima Foodifodder
16. T a r a Cotocesim esculenta Foodifodder
17. Sweet potato Ipamoea batatac Fruit/food
15. Banane Musa paradisiace Fruit
19. Papaya Corica papaya Fruit
20. Mango Fangifera indica Fruit
21. Rembutan/Nepheti um _ Mephelfium Iapsceum Fruit
22. Duku/Lonseh tree Lancium domesticen Fruit
23. Avocado Persea americans Fruit
24. Jamiiu Air/Rose-appie Eugenia aquea Fruit
25. JaIwbu Batu/Candlenut Psidium guaiava Fruit
ENWRONMENTAL MIMPACT ASSESSMENJVTESAIPfPP 1ll - 13
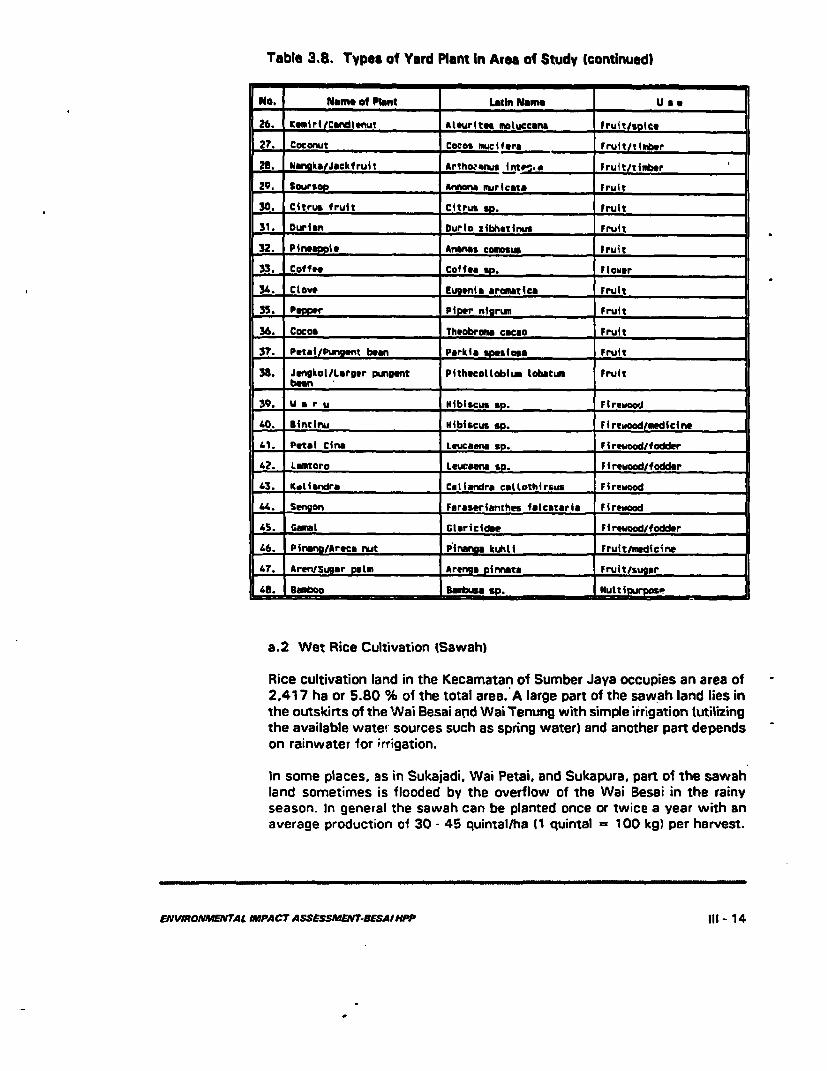
Table 3.8. Types of Yard Plant In Area of Study (continued)
No. Name o1 Plant Latin Name U * a
26. Kmri/Cndlenut Aleurites motuccans Fruitispice
27. Coconut Cocos muclfers Frumt timber
28. INngkakJackfruit Artho.n sInt,. a Fruit/timber
29. SDursop Annona murlcato Fruit
30. Citrus fruit Citrus up. Fruit
31. Durian Durlo zibhetirns Fruit
32. Pineapple Ananas comosus Fruit
33. Coffee Coffea up. Fltuer
34. Clove Eueents aromatica Fruit
35. Pepger Piper nigrum Fruit
36. Cocoa Theobroa cacao Fruit
3?. Petal/Pungent bean Parkia sPes fa o Fruit
38. Jangkol/Larger pungent PithecolloWuim lobatum Fruitbean_ _ _ _ _ _ _ _ _ _ _ _ _
39. W a r u Hibiscus Sp. Firewood
4.. Bintinu Hibiscus sp. Firewood/medicine
41. Petal Cina LeUCamn SP. Firewood/fodder
42. Lwntoro Leucamna Firewood/fodder
43. Ktliandra Cealandre caltothirsus Firewood
4 Sengon Faraserianthes flncataris Firewood
45. Camal Glaricidae Firewood/fodder
6 Pinsn!/Arece nut Finanpa kuhti Fruit/medicine
L7. Aren/Sugar palm Arenge pinnrta Fruit/sugar
48. Suibo DBambusa sp. Multirrp
a.2 Wet Rice Cultivation (Sawah)
Rice cultivation land in the Kecamatan of Sumber Java occupies an area of2,417 ha or 5.80 % of the total area. A large part of the sawah land lies inthe outskirts of the Wai Besai and Wai Tenung with simple irrigation (utilizingthe available water- sources such as spring water) and another part dependson rainwater for ;rrigation.
In some places, as in Sukajadi. Wai Petai. and Sukapura. part of the sawahland sometimes is flooded by the overflow of the Wai Besai in the rainyseason. In general the sawah can be planted once or twice a year with anaverage production of 30 - 45 quintal/ha 11 quintal = 100 kg) per harvest.
ENVIRONMENTAL IMPACTASSESSMENT-SESAIMPP il- 14
a.3 Dry Cultivation (Ladang)
Tegalan/Ladang (dry cultivation) covers an area of 4,993 ha 1 2%). Thisvegetation occupies a flat area, inclined to very inclined plane (more than45 0) and is spread sporadically between the garden/estate and underbrush.
The ladang/tegalan vegetation is generally a combination of seasonal cropsand perennial with difterent composition of types. The types of plants mostlyfound are presented in Table 3.9.
a.4 Private Plantation
The private plantation vegetation covers a quite large area, i.e. 10,449 ha(25.20%). It found in the area of the Kecamatan of Sumber Jaya form smallholder's estates with coffee as the main commodity. Smallholder's coffeeestate are generally found and land with a great inclination, even in aninclination of more than 100% (45 0). In order to have a high production, theground under the coffee trees is always cleared, usually by scraping. Thisscraping besides clearing the undergrowth, also destroys the surfacestructure, so as to aggravate erosion.
From the viewpoint of land and water conservation, this vegetation is of adamaging character.
a.5 Bushes
Bushes vegetation occupies an area of 3,221 ha (7.8 %) and is seeminglya former site of ladang or coffee estate left and abandoned by the owner. Inthe bushes sometimes forest plants or other perennial are found growingsolitair! In addition, often some coffee plants are found which spreadlywild, or neglected. The spread of bushes vegetation is almost even, oneconnected to each other, so as to give an impression of vastness, from thevalleys, river banks to mountain slopes. The vegetation is dense with a quitehigh diversity (covering tress, shrubs, bushes, grasses, and ferns), Table3.10.
ENWRONMENTAL IMPACT ASSESSMENT-BESAlIPP 1II- 15
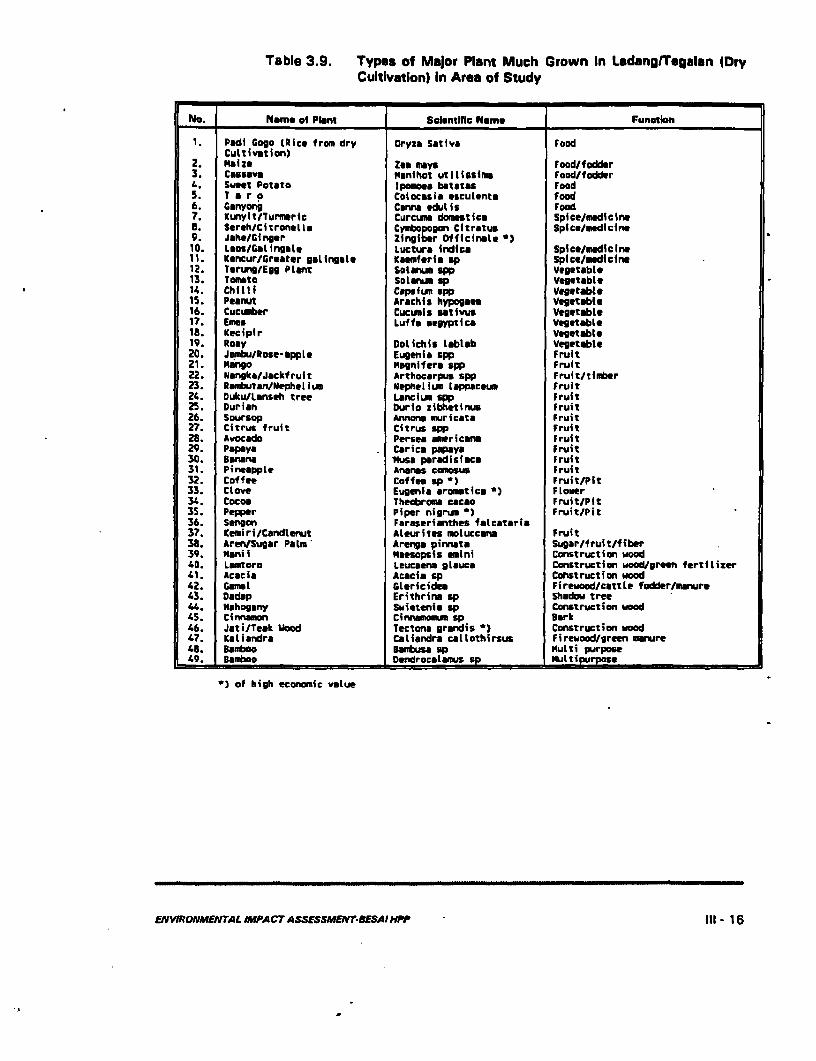
Table 3.9. Types of Major Plant Much Grown In LadanglTegalan DfryCultivation) in Area of Study
No Name of Plant Scientific Name Function
1. Padi Cogo (Rice from dry Oryzi Sativa FoodCultivation)
2. maize Zem may. Food/fodder3. Cassava Mmnihot utillasims Food/fodder4. Sweet Potato Ipomosa batatas Food5. T a r 0 Colocassa *sculenta Food6. Ganyorig Canna dulis Food7. Kunylt/Turmeric Curcums domwstica Spice/msdicrewB. Sereh/CitronelLe Cyiopogon Citratus Spice/medicine9. Jashe/Ginger Zingiber Ollicinale 0)10. Luos/Galingsle Luctura indicm Spice/medicire11. Kencur/Greater galingate Keemferis ap Spice/mdicine12. TerwglEgg Plant Solanum spp Vegetable13. Tomato Solanun sp Vegetable14. Chilli Capsium app Vegetable15. Peanut Arachis hypogeas Vegeteble16. Cucumber Cucuuis eativus Vegetable17. Emes Luffe aegyptics Vegetoble18. Iecipir Vegetable19. Rory Dolichis ltobtb Vegetable20. J!mbu/Roseapple Eugenic spp Fruit21. Mango Magnifera app Fruit22. Nangka/Jeckfrult Arthocarpus app Fruit/timber23. Rautan/Nephelium Uephelium tlppaeets Fruit24. Duku/Lanseh tree Lanclium spp Fruit25. Durian Durio zibhetinus Fruit26. Sourscp Annora muricata Fruit27. Citrus fruit Citrus spp Fruit28. Avocado Perse americans Fruit29. Papaya Carica papaya Fruit30. Bsnana Muse paradisfsce Fruit31. Pineapple Ananes comosus Fruit32. Coffee Coffs BP *) Fruit/Pit33. Clove Eugenia aromatica ) Flower34. Cocoa Theobroma cacao Fruit/Pit35. Pepper Piper nigrua ) Fruit/Pit36. Sengon Faraserianthes falcataria37. Kemiri/Candtenjt Ateurites moluccana Fruit38. Aren/Sugar Palm' Arenrg pirnata Sugar/fruit/fiber39. 'anil asesopsia emini Construction wood40. Lamtoro Leucaena glauca Construction wood/green fertilizer41. Aac&Cia Acacia sp Cohstruction woodl2. Camel Glericides Firewood/cattle fodder/_rnure43. Dadap Erithrins sp Shadow tree44. Mahogany Smietenia sp Construction wood45. Cinnmon Cinamn Sp Bark46. Jeti/Teak Wood Tectons grandis ) Construction wood47. Kaliandra Calisndrz caltothirsus Firewood/green mnure48. Bamboo Baniusa sp Multi purpoe49. tanBboo DendrocalamIS sp Multipurpose
*) of high economic value
EWVIRONMENTAL IMPACT ASSESSMENrT-ESAJHAPP III- 16
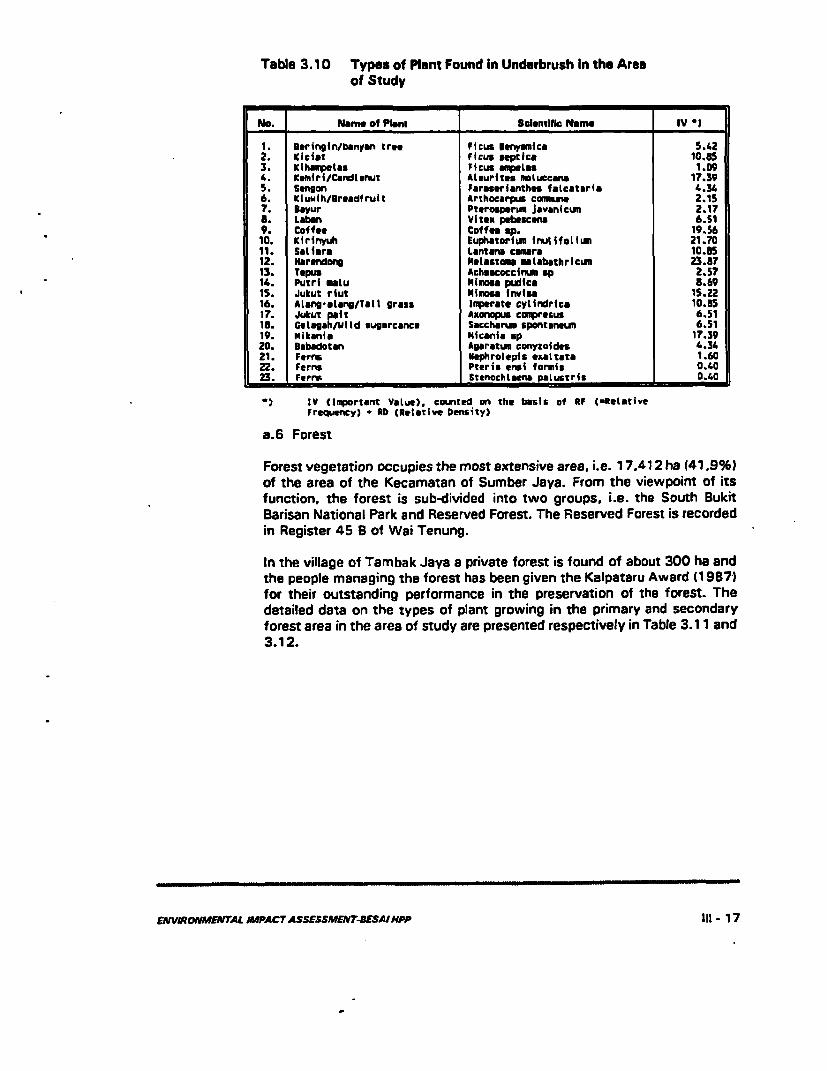
Table 3.10 Types of Plant Found in Underbrush In the Areaof Study
No. Nome of Plant Scientific Name IV * o
1. Beringin/banyan tree Flcus enymmilca 5.422. Kaicit Ficus septic. 10.853 Kihumpetas Ficus am;*Lms 1.094. KaMirI/Condltnut Ateurites moluccana 17.395. Sungon Faraserianthst faicateria 4.346. IKtuih/Breadfruit Arthocarpus commune 2.157. Bmyur Pterosperum javanicun 2.17S. Laban Vitaex pecO 6.519. Coffee Cotfea Sp. 19.5610. Kirinyuh Euphatorium inulifolum 21.7011. Sat era Lantana c amra 10.J512. Harundong ,Lassiuam mlabathrlcIm 23.8713. Trpu. Achuacoccinun sp 2.5714. Putri mtu Mimos pudfca 5.6915. Jukut rNut mimosa rnvisa 15.2216. ALang-slang/Tall grass Inmerate cylindrica 10.1517. Jukut palt Axnopus compresus 6.5118. Gelagah/Uild sugurcence SaccharL, spontcneun 6.5119. Nikanim Micania Sp 17.3920. Babodotan Agaratum conyoides 4.3421. Ferns wephrolepis exattata 1.6022. Ferns Pteris ensi formis 0.4023. Ferns Stenocha ate ' is 0.40
IV (Important VaLue). counted on the basis of RF (uRelativeFrequency) # RD CetRative Density)
a.6 Forest
Forest vegetation occupies the most extensive area, i.e. 17.412 ha (41.9%)of the area of the Kecamatan of Sumber Jaya. From the viewpoint of itsfunction, the forest is sub-divided into two groups, i.e. the South BukitBarisan National Park and Reserved Forest. The Reserved Forest is recordedin Register 45 B of Wai Tenung.
In the village of Tambak Jaya a private forest is found of about 300 ha andthe people managing the forest has been given the Kalpataru Award (1987)for their outstanding performance in the preservation of the forest. Thedetailed data on the types of plant growing in the primary and secondaryforest area in the area of study are presented respectively in Table 3.1 1 and3.12.
EVVIRONMENTAL IMPACT ASSESSMENT-BESAI PP III - 17
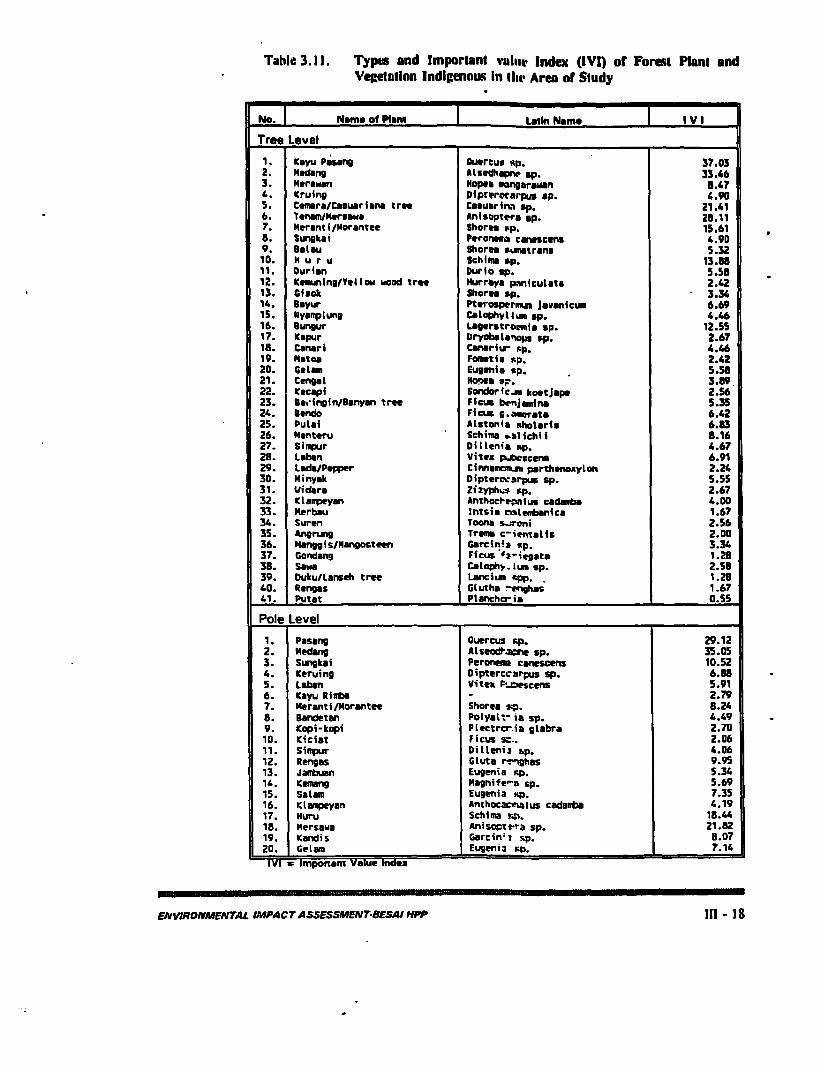
Table 3.11. Types and Important vuliut' Index (IVI) or Forest Plant andVegetation Indigenous In 1li Area or Study
No. Name DI Plant Latin Name I VI
Tree Level
1 Kayu Pasing cuertus %p. 37.032. Madang Altzihipnc. sp. 33.463. Meraren Hone mangarawan 8.474. Kruing Dlpreroearpus op. 4.905. Cmrlsmasuerlana tree Casuarina up. 21.416. Tensa/Mersawa Anisuptera sp. 28.117. Meranti/?4orantee Share ep. 15.618. Sunglui Peronma carwscans 4.9D9. BSlau Shonres sutrani 5.3Z
10. H u r u Schie sp. 13.8811. Durian Durio sp. 5.5812. Klm~ingnYellow wood tre Murrnya panicutas 2.4213. Clfok Shores sp. 3.3414. Sayur Pterospermum Javanicum 6.6915. llyanplung CaLophytlwu Sp. 4.4616. Bungur Lagerstromla sp. 12.5517. Kapur tryobetenops up. 2.6718. Cancrl Canarieu sp. 4.4619. Matoc Foawtd sp. 2.4220. Gelam Eugenia up. 5.5121. Cengal HoPne Sp. 3.8922. aecapf Sowdorica koetJape 2.S623. Ueailnin/Banyon tree Ficus benjamina 5.3524. Bendo Ficus c -afereta 6.4225. Puta1 Alstonia sholaris 6.8326. Menteru Schima .iichii 8.1627. SimPur Dillenia sp. 4.6728. Laban Vitex pm.escens 6.9129. Lade/Pepper Cimnnamcn parthenoxyLon 2.2430. Minyak Dipterccarpue sp. 5.5531. UWider Zizyphss rp. 2.6732. K L Lapyan AnthocNpanlus cadairba 4.0033. Merbau Intsia atermbanica 1.6734. Suren Toona sarenj 2.5635. AngrUng Treme c-ientalis 2.0036. Nanggis/Mangostemn Garcini sp. 3.3437. Gondang Ficus asriegate 1.2838. Seea Calophp.Lum sp. 2.5339. Duku/Lanseh tree Lancium spp. 1.2840. Rengas Glutha 'negehas 1.6741. Putat _Ptancherian 0.55
Pole Level
1. Pasang Ouercus sp. 29.122. Nedang AluseoaexFne sp. 35.053. Sungkai Peronem canescens 10.524. Keruing Dipterccarpus sp. 6.385. Latin Vitex Pt.bescens 5.916. Kayu Rimb 2.797* Meranti/Morantee Shore xp. 8.248. Bandetan Polyalt- ia sp. 4.499. Kopi-kopi Plectrcria glabra 2.7010. Kiciat Ficus Sc.. 2.0611. S;irpur Dillenia sp. 4.0612. Rengas Gluta rreg,has 9.9513. Jambuan Eugenia sp. 5.3414. Kemang Magnife-a sp. 5.6915. Salam Eugenia sp. 7.3516. Ktampeyan Anthocaciialus cadanba 4.1917. Huru Schima p. 13.4418. Mersasa Anisopts-ra sp. 21.8219. Kandi s Garcin' sp. 8.0720. GeLam j Eugenia sp. 7.14
* Important Value Index
ENVIRONMENTAL IMPACT ASSESSMENATBESAI IPP 111 - 18
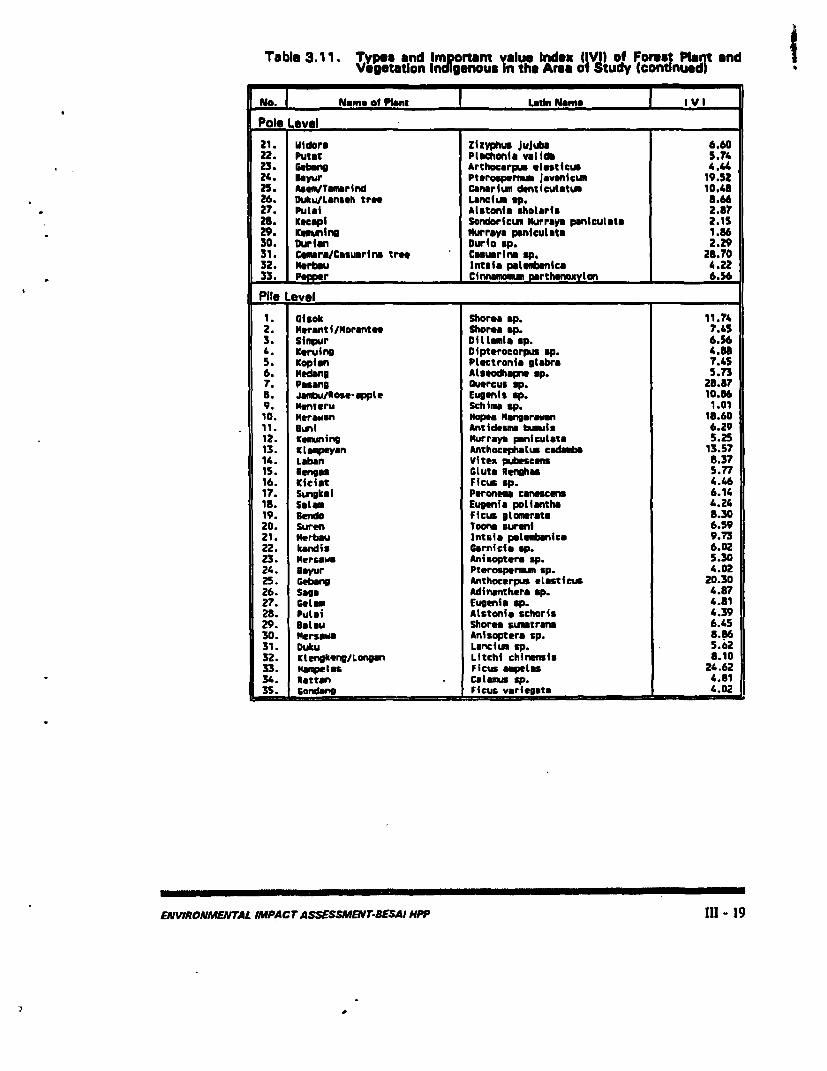
Table 3. 11. Typos nd Imortant value Index IIVI) of Forest Plant andVegetation Indigenous In the Area of Study (cont nued)
No. Name of Plant LatiNoamo I V I
Pole Level _
21. uldors Zizyphus Jujuba 6.6022. Putat Plachonla val di 5.7423. Gong Arthocarpus elesticus 4.4"24. Iayur Pteroupenrm javanicus 19.522S. Auem/T'morlnd Conerium denticulatum 10.4826. Duku/Lsnseh tree Lanclun up. 3."O27. PuLal Alstonla sholaris 2.5728. KLcapl SendorIcs Nurrays paniculata 2.1529. lamuning Nurrays panicutsta 1.8630. Ourlin Duris op. 2.2931. CumruClsuarln tree Cesusrina op. 28.7032. Nerbau Intale pelemanice 4.2233. Power Cinnram psrthneoxylon 6.56
Pile Level1. Glsek Shorn up. 11.742. merantl/Norantce Shoren sp. 7.r3. Sihnpr DIlltmI Bp. 6.564. Keruing Dlpterocorpus up. 4.88S. Kopln Plectronmi glabra 7.456. Nedeng Alteodhopne sp. 5.737. Posang GuercuB up. 28.878. iaeui/eon-apple Eugenls up. 10.869. Nenteru Schime up. 1.0110. Hercmn Hope Mangarawsn 15.6011. Bunt AntIdesm bauls 6.2912. Kenuning Nurraye paniculata 5.2513. Klameyan Anthocphutlu cadambs 13.5714. Laban Vitea pubeseen 8.3715. engos Gluts Renghas 5.7716. Kichit Ficus up. 4.4617. Sungkal Perenme canescens 6.1418. Salem Eugenfa poliantha 4.2419. BendO Ficus glne_rats 8.3020. Suren Tore surenl 6.5921. Herbsu Intris paLeenica 9.7322. kwnis Cemicie up. 6.0223. mersews Aniropters up. 5.3024. Bayur Pterospernum sp. 4.0225. Gebang Anthocerpus eLesticus 20.3026. Saga Adirnathera up. 4.8727. GeLam Eugenis up. 4.8128. PuLei Alstonia schoris 4.3929. BaLou Shores sLmtrana 6.4530. Hersasa Anisaptere sp. 5.8631. Dutu Laneiu sp. 5.o232. Ktlengkeng/Longan Litchi chinemis 8.1033. _ampetas Ficus auelms 24.6234. Rattan caIamus up. 4.8135. Condcng Picas variegate 4.02
ENJWRONMENTAL IMPACrASSESSMENVT-SESAI HPP 111 - 19
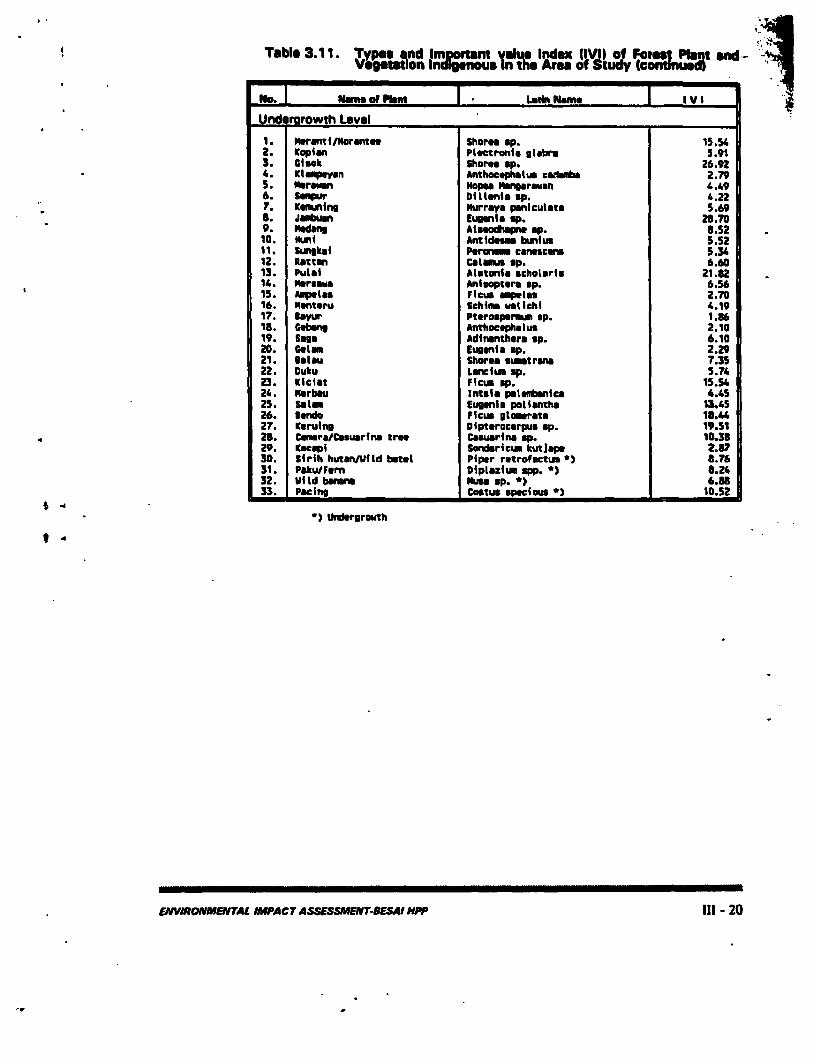
Table 3.1 1. Types ind lr ortant vslum Index (IVII of Fatl Plant *nd-T l 3tot1on m Ii Z genous In the Area of Study (coyanued n
no. NW"n of Plmn |T L dn Nmm nn| I V I
Und rarowth Level
I ftrc m l/Norenter Shoreo cp. lSS4Z. Kopian Plectronis lthre 5.913. Clsok Share sp. Z6.9Z4 . le Kafyn Anthoceph lucus1 miba 2.79S. Persom wHopes Nonagraen 4.496. Seqwu Ditlenia p.22T. Keouning Nurraya paniculata 5.69S. Jawbuan Eugenia p. 20709. edang Alueodhapne op. SS210. Nuni Antides.s bunium S S211. Sungkol Peronmse canstcena S 3412. Rattan CalOeus Bp 6.6013. Putal Alitoni scholaris 218214. mersam Anlwaptera up. 6.5615. Amploas Fieus mpelaes 2.7016. Nenteru Schlim nwllchi *1917. 3ayur Pterosperwm sp 1ap61. Cubang Anthocephalus 21019. Saon Adinanthera sp 6p1020. Chtm Eugenla up. 22921. Bmlau Shora suatrna 7S22. Duku Lunclum up. 7423. KIciat Ficus up. lS24. Nerbou Intals plat nica 44S25. Sate Eugenio poltintha26. Srndo Ficus glomnerata27. Kuruhng Dlpterocarpus up. I9512 2. Cmpra&/Casuarin tree Ccauarina sp 10u3p29. KucapI Sondaricum kutjape Z 830. girn butanjlfld betel Piper retrofactus l87631. Paku/Fmrn Diplazlum upp. 832432. Wltd bann NMu Sa *p. 6'8t33. PacIng Cas specious 1.52
Undergrowth
ENvvRoANMENrAL IMPAcrASSESSMENYTBESAf HPP 111- 20
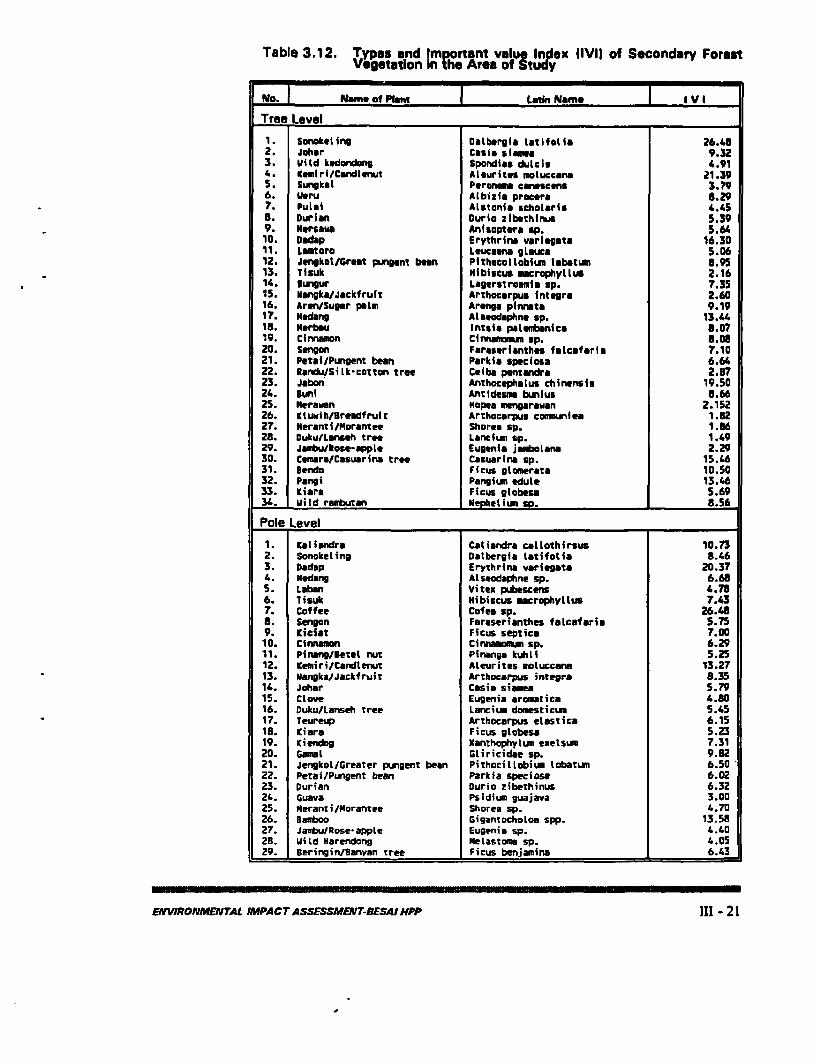
Table 3.12. Types and Imponant valu_ Index IIVI) of Secondary ForestVegetation in the Area of Study
No. Name of Plant Latin Name I V I
Tree Level1. SonoketIng Daobergia latifolla 26 482. Joher Ciia islims 9.323. Wild kedondong Spondles dutcis 4.914. Kemiri/Candlmnut Aleurites moluccnar 21.395. Sungkal Peroeura cinescens 3.796. Ueru Aibl2az procera 8.297. PuLel Aistonla schalars 4L.L58. Durlan Ouria zlbethinus 5.399. Mersaw Anhsopter sp. 5.6410. Dadip Erythrine variagtaU 16.3011. Lmtoro Leucieni gLiuce 5.0612. Jengkot/Grest pungant bean Pithecollobium labstum 8.9513. TisukI Hibiscus microphyllus 2.1614. Oungur Lagerstroumia sp. 7.3515. hangki/Jackfrult Arthocarpus Intcgra 2.6016. Aren/Suogr palm Arenga pinnata 9.1917. ieding AImsodaphne sp. 13.4418. Nerbeu Intsla palehnbnice 8.0719. Cinn mon Cinn omomup. 8.0820. Sengon Fareserianthes falcafarie 7.1021. Petal/Pungent bean Perkie speclosu 6.6422. Rardu/Silk cotton tree Ceiba pentindra 2.B7
23. Jabon Anthocephatus chinenuis 19.50
24. Ouni Antideua bunius 8.6625. Nerawan Hopes mangarawan 2.15226. Kluwih/Bremdfruli Arthocarpus commiunlea 1.1227. Merantimorantee Share sp. 1.8628. DukuLinsefh tree LanciL up. 1.4929. Jiambu/Rose-appLe Eugenia jambolan 2.2930. Ceoura/Casuarina tree Casuarina sp. 15.4631. Bnndo Ficus glamerata 10.5032. Pangi Pangium edule 13.4633. Klara Ficus globes 5.6934. uIid rarbutan IeNelitum Sp. 8.56
Pole Level
1. Kali ndra Catiandra catlothirsus 10.732. SonokeLing Dalbergie latifolia 8.463. Dadap Erythrinm variegate 20.374. Medang Atseodaphne sp. 6.685. Laban Vitex pubescens 4.786. lisuk Hibiscus mcrophytLur 7.437. Coffee Cofes sp. 26.488. Sengon Faraserianthes faLcaferia 5.759. Kiciat Ficus septica 7.0010. Cinnamon Cinnanoman sp. 6.2911. Pining/Betel nut Pinenga kuhil 5.2512. Kemiri/Caridtenut Aleurites moluccann 13.2713. Nanqka/Jackfruit Arthocarpus integra 8.35
14. Johar Cnsia siame 5.7915. Clove Eugenia aroamtica L.8016. Duku/Lanseh tree Lanciun domesticum 5.4517. Teureup Arthocarpus etastica 6.1518. Kiara Ficus globesa 5.2319. Kiendog Xanthophylum exetsum 7.3120. Garn l Gtiricidae sp. 9.8221. Jengkol/Greater pungent bean PithociLLobium lobatum 6.5022. Petai/Pungent bean Parkia speciosa 6.0223. Durian Duria zibethinus 6.3224. Guava Psidium guajava 3.0025. meranti/Morantee Shores sp. 4.7026. Bamboo GigantochoLoa spp. 13.5827. Jambu/Rose-appLe Eugenia sp. 4.4028. WiLd Harendong Melastoma sp. 4.0529. Beringin/Banyan tree Ficus benjamina 6.43
ENVIRONMENTAL IMPACT ASSESSMENT-BESAI HPP III - 21
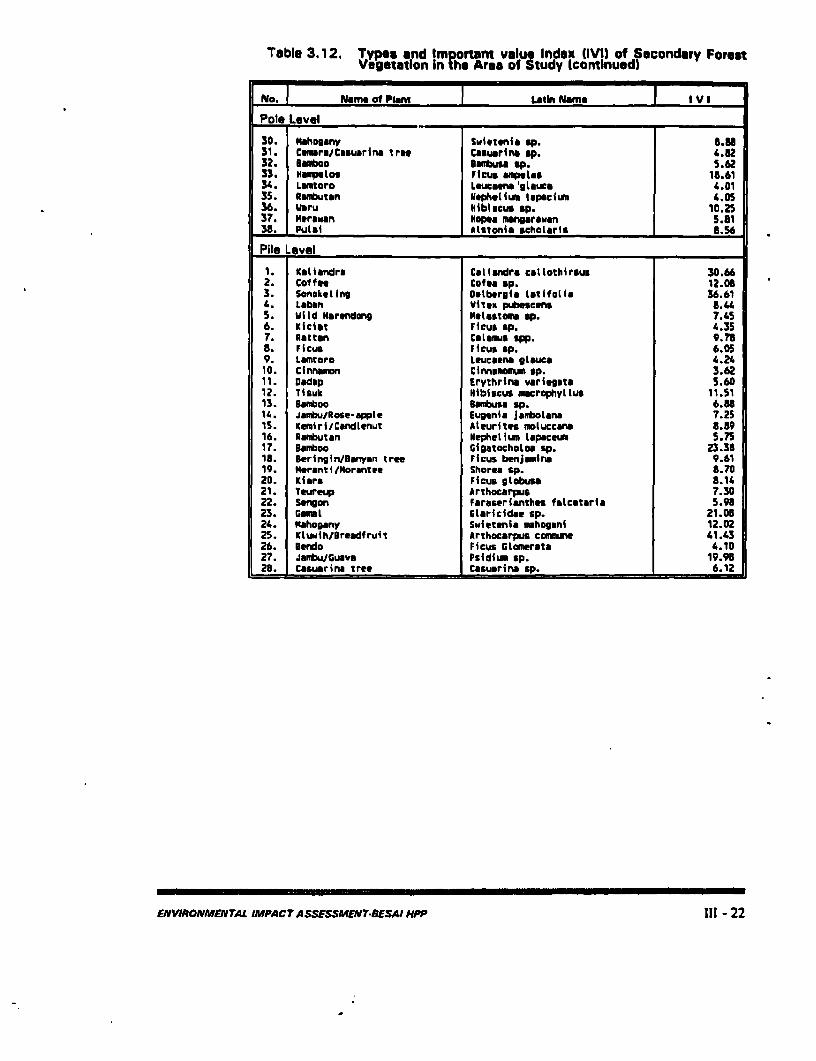
Table 3.12. Types and Imporant value Index (IVI) of Secondary ForestVegetation in the Area of Study (continued)
No. Name of Plant Latin Name I V I
Pole Level
30. Mahogany Swiotenia sp. 8.3831. Cemra/Cesuarins trne Casuarina ep. 4.8232. Bamboo Iambuse sp. 5.6233. No" toa Ficus ampetes 18.6134. Lamtoro Leusee 'Ltauce 4.0135. Renutan lephellun lapacium 4.0536. waru Hibiscus Sp. 10.2537. Morawan Nopa mengerawan 5.8138. Pulal Aastonis scholeris 8.56
Pile Level _ _ _ _ _ _ _ _ _ _ _ _ _ _ _ _ _ _
1. IKatindra Cilanedre catlothirsus 30.662. Coffee Coloa Bp. 12.083. SonokeLing Datbergis Istifolie 36.614. Laben Vitex pubese, B.445. Illd Harmndong Nelastoma Bp. 7.456. ICicit FicuB BP. 4.357. Rattan Cslemus spp. 9.788. Flcus Ficus sp. 6.059. Lamtoro Leucasna gleuca 4.2410. Cinnamon Clnnmmus 'p. 3.6211. Dedrp Erythrina varlegpta 5.6012. Ytsuk Hibiscus macrophyltus 11.5113. BaDoo Iahmbusa sp. 6.8814. Jambu/Rose-eppte Eugenia jaiboLane 7.2515. KCemiri/CandLenut Ateurites moluccun 8.8916. Rwbutan Nephelium lepaceum 5.7517. Bamboo CigatochoLao 'p. 23.3618. Beringin/Banyon tree Ficus benjumirw 9.6119. mrentl/Morantee Shorea sp. 8.7020. Kiare Ficus gtobusa 8.1421. Yeureup Arthocarpus 7.3022. Sengon Faraserianthes fatcatarla 5.9823. GCt Glericidee sp. 21.0B24. mahogany Swietmenia mhogeni 12.0225. KLtaih/Breadfruit Arthocarpus caune 41.4326. Bendo Ficus Glomereta 4.1027. Janbu/Guave Psidium sp. 19.9820. Casuarina tree Cssusrina sp. 6.12
ENVIRONMENTAL IMPACT ASSESSMENTrBESAI HPP III - 22
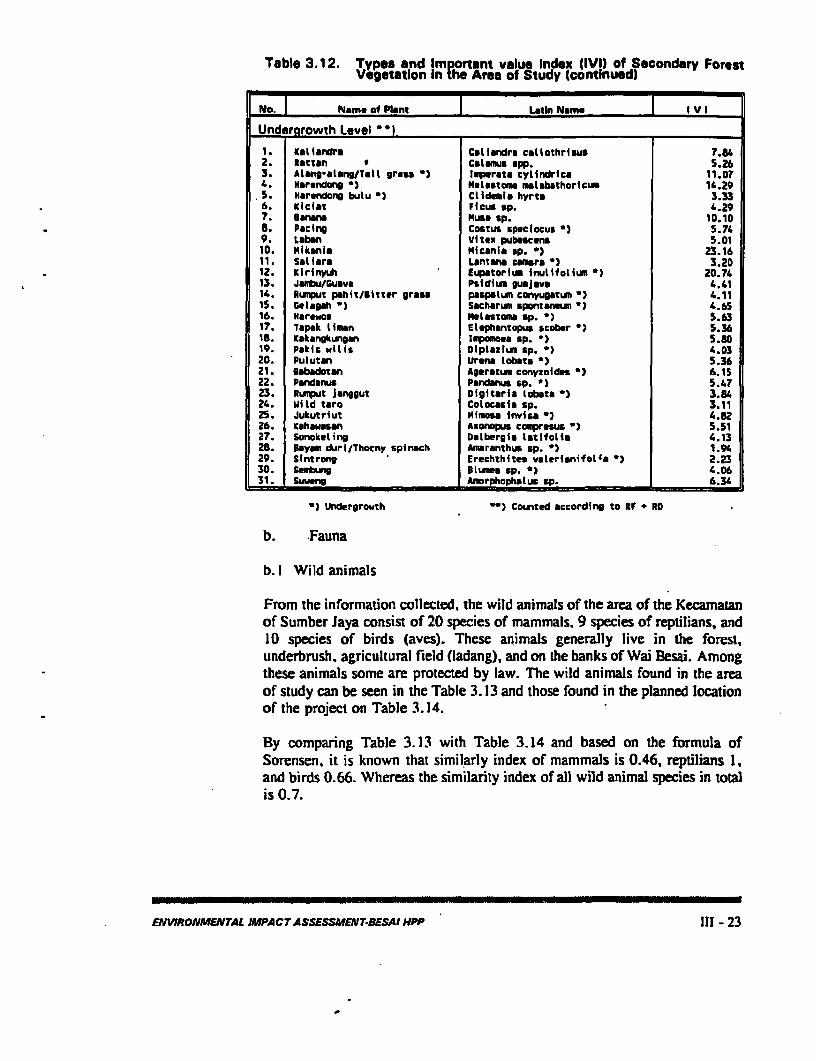
Table 3.12. Types and Im onant value Index (IVI) of Secondary ForestVegetation In !he Area of Study (continuedi
No. Name of Plant Latin Name I V I
Underarowth Level __
I. Kaliandra Ctllandra catlothrlsus 7.842. Rattan Calamh app. 5.263. ALtng-alang/Talt grass m Impersta cylindrics 11.074. Hermndang *) NsLastome malobathoricum 1".29S. Narndong bulu *u CLideal. hyrto 3.336. Kiciat Fleus sp. 4.297. Eanana Mus* $p. 1D.108. Pacing Coitus spaclocus *) 5.749. Laban Viten pubmsaens 5.0110. mliknia Micanla sp. ) 23.1611. Satirs Lantama caemra 0) 3.2012. KIrinyuh Eupatariun Inutifollwu ) 20.7413. Jambu/Guava Psidium guajava 4.4114. *uMpun philt/jitter grass paspslum conyugatum ') 4.1115. Gelagah 0) Sacharwi Bpontan um *) 4.6516. Herewos Meltostna sp. * 5.6317. 7apok tlman Elephantopus scober *) 5.3618. Kakangkun*an Impomo.a sp. ') 5.8019. Pakfs wilis Diptazimu Bp. 0) 4.0320. Pulutan Urna lobato *) 5.3621. Beabdotn AgeratuL conyzoldes 0 6.1522. Pandanus Pandanus sp. *) 5.4723. Rumput janggut Digitaria Lobt a) 3*8424. MiLd taro Colocasi Sp. 3.1125. Jukutriut Mimose invisa 4.8226. Kahawosan AxOnOpuB co lpesus ) 5 5127. Sonokeling Dalbergia LotifoLim 4.1328. B*ym duri/Thotny spinach Amranthus p. *) 1.9429. Slntrong Erechthites vaLerimnifol'a 2.2330. sewbung BLunem sp. *) 4.0631. Suueng Amorphophatus sp. 6.34
-) Undergrowth *) Counted according to RF * RD
b. Fauna
b. I Wild animals
From the information collected, the wild animals of the area of the Kecamatanof Sumber Jaya consist of 20 species of mammals, 9 species of reptilians, and10 species of birds (aves). These animals generally live in the forest,underbrush. agricultural field (ladang), and on the banks of Wai Besai. Amongthese animals some are protected by law. The wild animals found in the areaof study can be seen in the Table 3.13 and those found in the planned locationof the project on Table 3.14.
By comparing Table 3.13 with Table 3.14 and based on the formula ofSorensen. it is known that similarly index of mammals is 0.46, reptilians 1,and birds 0.66. Whereas the similarity index of all wild animal species in totalis 0.7.
ENWRONMENTAL IMPACT ASSESSMENT-ESAI HPP liI - 23
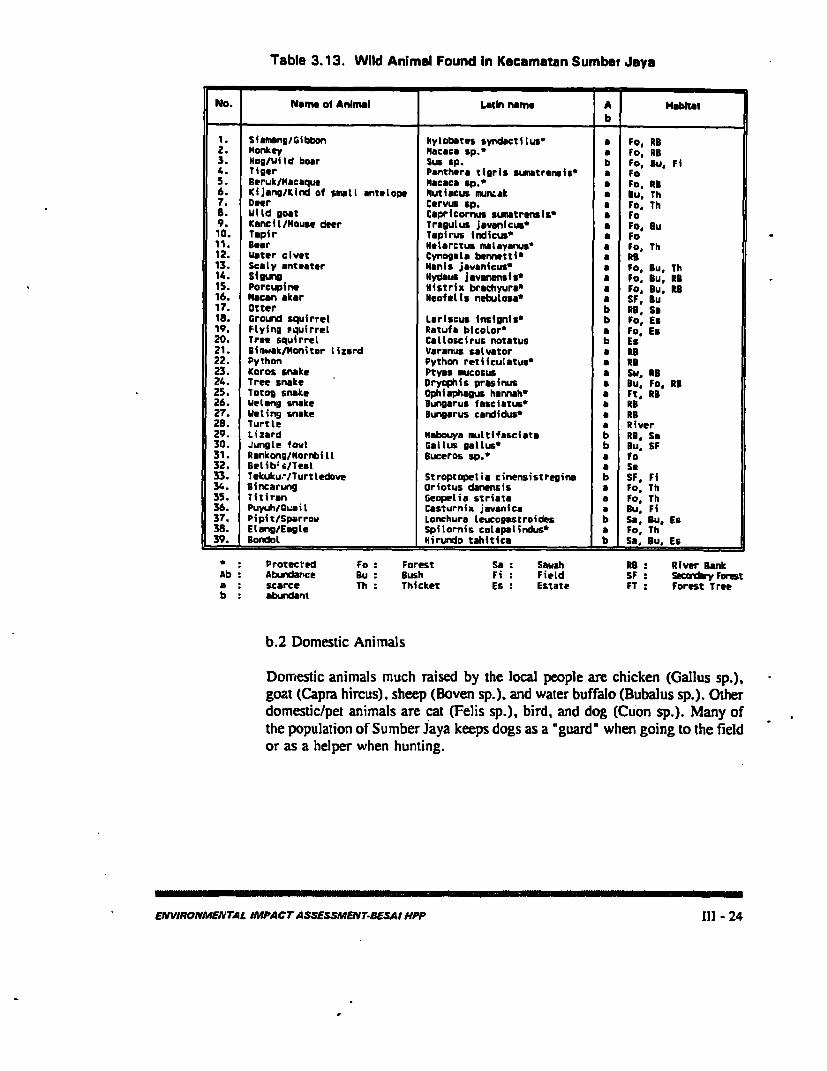
Table 3.13. Wild Animal Found in Kecamatan Sumbef Jaya
No. Name of Animal Latin name A Hebktab
1. Siamang/Gibbon Nylobates syndactiIus' a Fo, RB2. Monkey Macacm sp.* a Fo, RB3. Hog/UWid boar Sus Sp. b Fo, Su. Fl4. Tiger Panthera tigris sumatrensis* a Fo5. Beruk/Macaque MaCaem sp.* a Fo, RE6. KIjang/Kind of smatl antelope Nutiacus munmak *u. Th7. Deer Corvus sp. Fo Th8. Ulid goat Capricornus sumatrensise a Fo9. KanclL/Mouse deer Tragulus javanicus- a F Bu10. Tapir Tapirus indicugn a Fo11. Beer Helarctus malayanus a Fo, Th12. Uater civet Cynogmta bennetti* a RB13. Scaly anteater Manis javanicus* a Feo Bu. Th14. Sigung Hydaus Javenensis' a Fo, Bu. RB15. Porcupine Nistrix brachyura* a Foe Bu. RS16. Macan skar Neofelis nebulosa' a SF, Eu17. Otter b RS So18. Ground squirrel Lariscus. Insignis' b Fo, Es19. Flying squirrel Ratufa bicolor' a Fo. Ec20. Tree squirrel Calloscirus notatus b Es21. Biawak/Monitor lizard Varanus salvator a RB22. Python Python retiiculatus* a Re23. Kores snake Ptyas mucosus a Swu RB24. Tree snake Dryephis prasinus a Bu, Fo. RE25. Totog snake Ophiaphagur hannah- a Ft, RB26. welang snake Bungarus fasciatus' a RB27. Weting snake Bungarus candidus' a RE28. Turtle a River29. Lizard Mabouva multifasciata b RE. So30. Jungte owtl Gallus gallus' b Bu, SF31. Rankong/Mornbill Buceros sp.- a Fo32. Belib;s/Teal a Sa33. 7ekuku-/Turtledove Stroptopelia cinensistregina b SF, Fi34. Bincarung Oriotus danensis a Foe Tit35. Titiran Geopelia striata a Foe Th36. Puyuh/Ouail Casturnix javanica a Bu. Fi37. Pipit/Sparrow Lonchura leucogastroides b Sa, Bu, Es38. Etang/Eagte Spilornis cotapalindus' a Fo, Th39. BondoL Hirundo tahitica b So. Eu. Es
Protected Fo : Forest Sa : Sawah RB River BankLb Abundawce Bu : Bush Fi Field SF Seordbry Foresta scarce Th : Thicket Es Estate FT Forest Treeb abundant
b.2 Domestic Animals
Domestic animals much raised by the local people are chicken (Gallus sp.),goat (Capra hircus), sheep (Boven sp.), and water buffalo (Bubalus sp.). Otherdomestic/pet animals are cat (Felis sp.), bird, and dog (Cuon sp.). Many ofthe population of S umber Jaya keeps dogs as a "guard" when going to the fieldor as a helper when hunting.
ENIRONMENTAL IMPACTA SSESSMENT.-ESAJ HPP Ill - 24
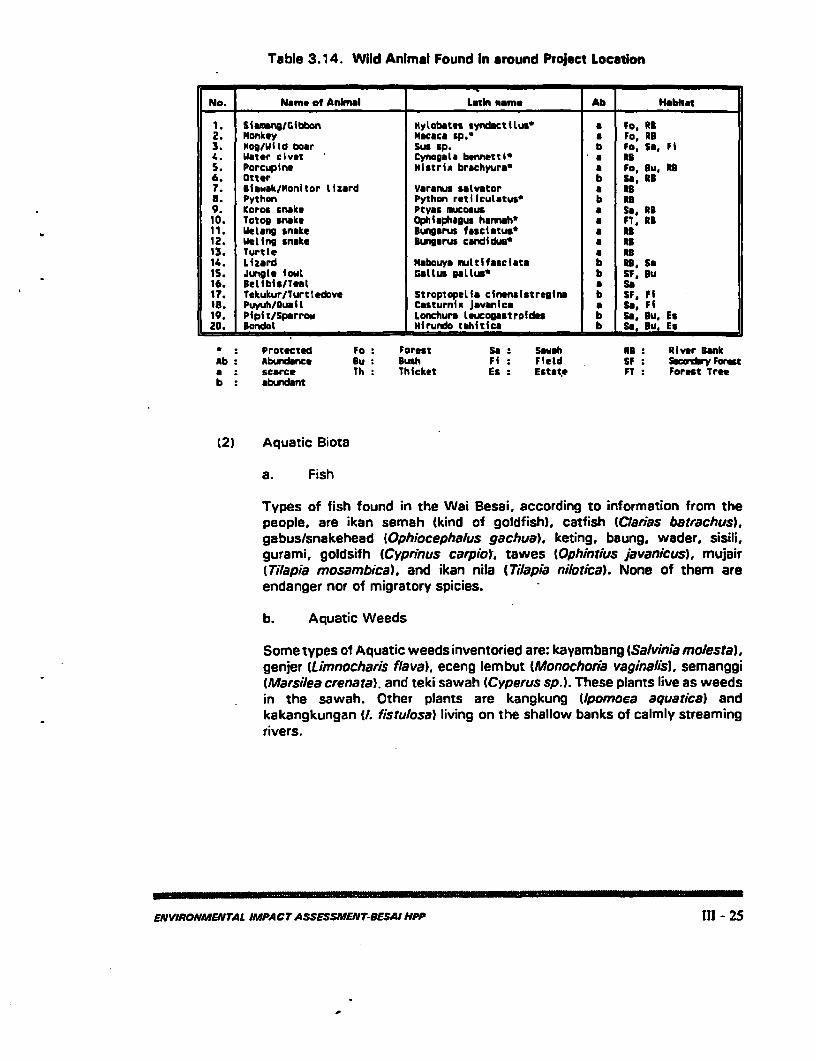
Table 3.14. Wild Animal Found In around Project Location
No. Name of Animal Lati n am* Ab Habhat
1. SiamangJiGbbon mytobates syndactitus' a Fo. Re2. Monkey Mmcace sp.* a Fa, RS3. HogS/Wild boar SuB Sp. b Fo, So, Fl4.. Water civet Cynoagal bennetti' a RS5. Porcupine Hlstria brachyurs* a Fa, fu, RI6. Otter b S, RB7. Btawmk/Monitor lizard Varanus stlvator a RB8. Python Python retilculatus' b RB9. Karom snake Ptyam mucoaus a S, RB10. Totog snake Ophlaphalus hannah' a Fl. RB11. WeLang snake Bungarus fasciatus a RB12. Weling snake Bungarus candldus a RB13. Turtte a RB14. Lizard Mabouya multifasciats b RB, So15. Jungle taut Galtus gaLLusW b SF, Bu16. BelIbl/Tetl s So17. Tekukur/Turtledove Stroptopetis cinenmsstregin b SF FiI8. Puyuht/Ouall Casturnix Javanicn a Soa Ft19. Pipit/Sparrow Lonchura Leucoosmtroides b So. Bu, Es20. Bondol Hirundo tahitica b So. Bu, Es
Protected Fo Forest S : Smush Re River BankAb : Abundance Su Bush Ff : FIeld SF : S owcy Fonesta scarce Th Thicket Es : Estate FT : Forest Treeb : abundant
(2) Aquatic Biota
a. Fish
Types of fish found in the Wai Besai, according to information from thepeople, are ikan semah (kind of goldfish), catfish (Clarias batrachusi.gabus/snakehead (Ophiocephalus gachua), keting. baung, wader, sisili,gurami, goldsifh (Cyprinus carpioY, tawes (Ophintius javanicus), mujair(Tilapia mosamnbica). and ikan nila (Tilapia nilotica). None of them areendanger nor of migratory spicies.
b. Aquatic Weeds
Some types of Aquatic weeds inventoried are: kayambang (Salvinia molesta),genjer (Limnocharis flava), eceng lembut (Monochoria vaginalis), semanggi(Marsilea crenata). and teki sawah (Cyperus sp.). These plants live as weedsin the sawah. Other plants are kangkung (Jpomoca aquatica) andkakangkungan (/. fistulosa) living on the shallow banks of calmly streamingrivers.
ENVIRONMENTAL IMPACT ASSESSMENT-BESAI HPP I - 25
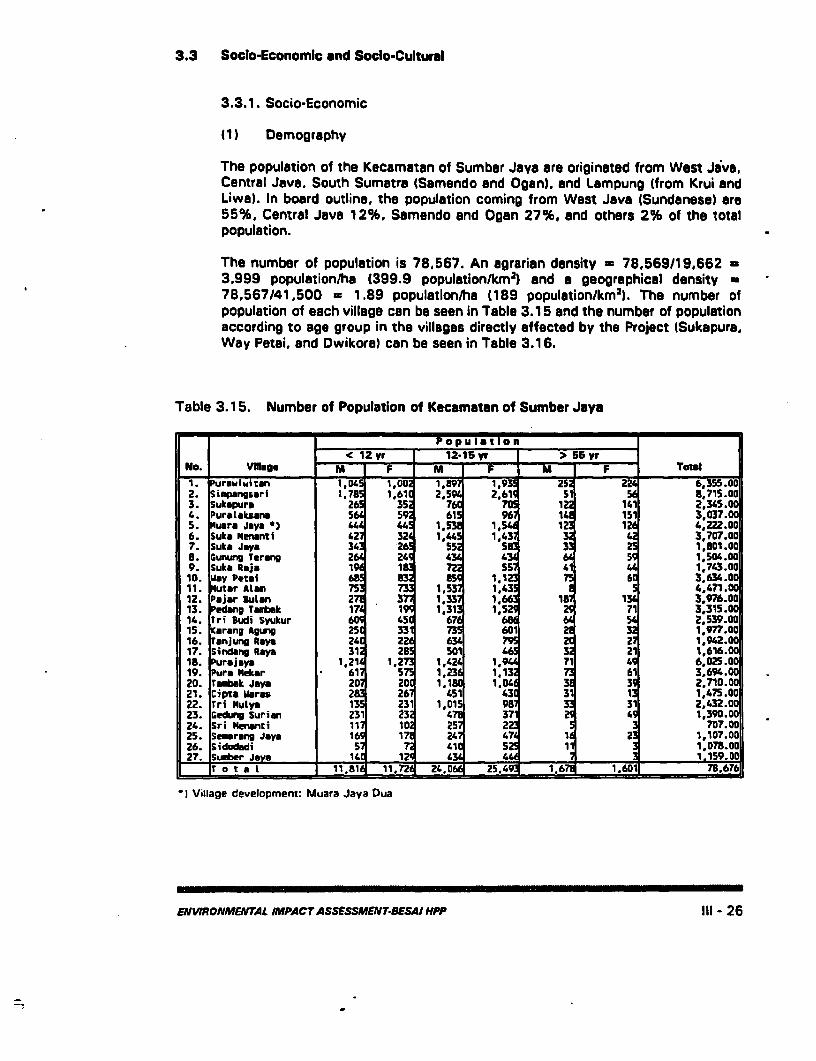
3.3 Sodo-Economic and Soca-Cultural
3.3.1. Socio-Economic
11) Demography
The population of the Kecamatan of Sumber Java are originated from West Jiva,Central Java. South Sumatra (Samendo and Ogan), and Lampung (from Krui andLiwa). In board outline, the population coming from West Java (Sundanese) are55%, Central Java 12%, Samendo and Ogan 27%. and others 2% of the totalpopulation.
The number of population is 78,567. An agrarian density - 78.569/19,662 -3,999 population/ha (399.9 population/kM2) and a geographical density -
78,567/41,500 = 1.89 population/ha (189 population/km2. The number ofpopulation of each village can be seen in Table 3.15 and the number of populationaccording to age group in the villages directly affected by the Project (Sukapura,Way Petai. and Dwikora) can be seen in Table 3.16.
Table 3.15. Number of Population of Kecamatan of Sumber Jaya
Populatlon _______
N< 12 r 12-15 yr >5S yrNo. VE. F TolM F M F M F
T Purawiwitirn 1,0. 1,00 1,89 1,93 25 22 6,355.002. Simparnrgri 1,78 1,41 2,59 1,61 51 5 8,715.003. Sukepur 26 35 76 70 1 141 2,345.004. Puralakrrna 5 5 61 96 1 151 3 037.005. uara Joys * U 44 1,5 1.54 1 12 4,222.006. Suka lenanti 42 32 1 L4 1,L3 3 4 3,707.07. Suka J.a3 55 5 3 2 1,101.00D. Gunung Terang 2 24 4 4 5 1,504.009. Suka Rja 1 1 55 41 4 1,743.0010. Way Petmi 6 13 15 1,1 5 3,63L A11. utar Ai 75 73 1,53 1.43 4,471.0012. Pajar 8uLan 2 3 1,33 1,66 1 1 3,976.0013. Pidang Tambak 1 1 1.31 1,52 71 3,315.0014. Tri Budi Syukur 45 67 5 2,539.0015. Karang Agung 2S 33 73 60 2 3 1,977.0016. Tanjung Raya 24 22 4 2 2 1,942.0017. 5indang Raya 31 23 501 6 3 21 1,616.0018. Purajaya 1,21 1,2 1,42 1,94 7 4 6,025.0019. ura 1ekar 61 5 13 1.13 61 3,694.0020. Trbak Jaya 20 20 1.1B 1,04 3 3 2,710.0021. Cipta Waras 2 2 451 43 3 1 1,475.0022. Tri Nulya 13 231 1,01 2 3 31 2,432.0023. Gedung Surian 2 23 4 37 4 1,390.0024. Sri enranti 11 10 25 2 707.0025. Semlrang Jaya 16 1 24 4 l 2 1,107.0026. Sidodadi 5 41 52 11 1,078.0027. ;Suber Jaya 1 12 4 U _ 1.159.DI
IT a t a I 11,81, 11.72 24. 0* 25,49 1,67E 1.601 78,676
11 Village development: Muara Jaya Dua
NJVIRONMENTAL IMPACT ASSESSMENT-BESAI MPP 1ll - 26
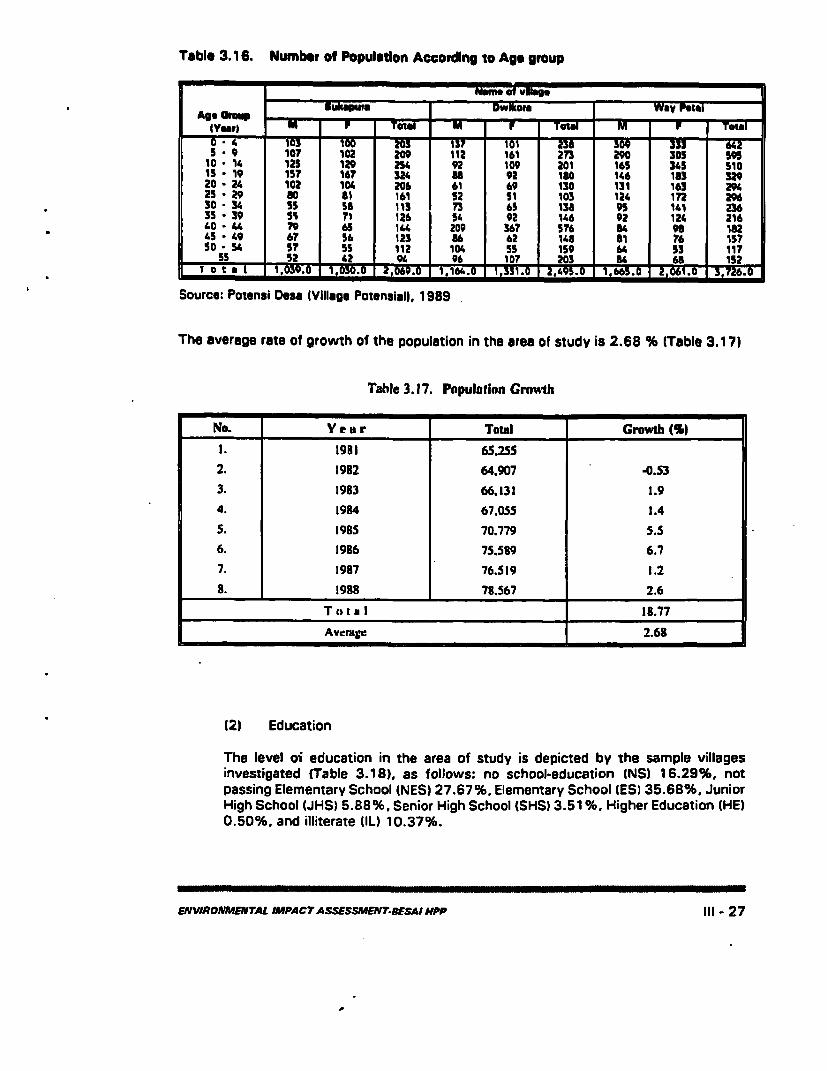
Table 3.16. Number of Populbtion According to Age group
Nome of vuag.
Age Group Cukaua Dwilkor Way Petal
( F P * V = Tottl M r Total
5 9 or107 102 209 112 161 273 290 305 59510 14 125 129 2S4 92 109 201 165 345 51015 19 157 167 324 as 92 10 146 11s *2920 24 102 104 206 61 69 130 131 163 29425 *29 so e 161 52 51 103 124 172 29630 34 SS 5 113 73 65 138 95 141 23635* 39 5% 71 121 54 92 146 92 124 216*04 79 65 144 209 367 576 S4 98 1U2
*5.9 67 56 123 u6 62 148 B1 76 15750 54 57 5s 112 104 55 159 64 53 117
55 52 42 94 96 107 203 u 6 152T 0 t a 1,14.0 2495. 1 6650 T1 060 3,
Source: Potensi Doss (Village PotenSIhlD, 1 989
The average rate of growth of the population in the area of study is 2.68 % (Table 3.17)
Table 3.17. Population Gromlh
No. Y e a r Total Growth (%
1. 1 981 65.2552. 1982 64.907 -0.53
3. 19B3 66.131 1.9
4. 1984 67.055 1.4
S. 3 1985 70.779 5.56. 19B6 75.589 6.77. 1987 76.519 i.28. 3 J988 1 78.567 2.6
T ot I.1 18.77
Average 2.68
(2) Education
The level oi education in the area of study is depicted by the sample villagesinvestigated (Table 3.18), as follows: no school-education INS) 16.29%, notpassing Elementary School (NES) 27.67%. Elementary School (ES) 35.68%. JuniorHigh School (JHS) 5.88%. Senior High School (SHS) 3.51 %, Higher Education (HE)0.50%, and illiterate (IL) 10.37%.
ENWRONMENTAL MPACT ASSESSMENT.BESAI HPP Ill - 27
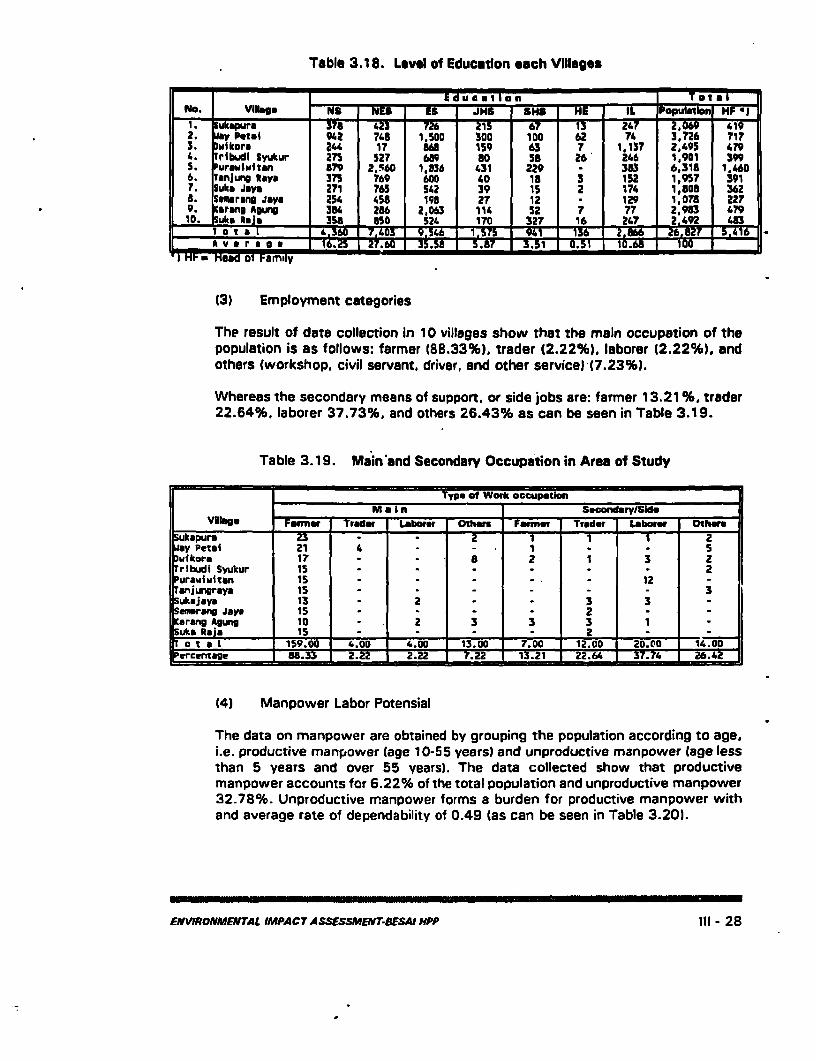
Table 3.18. Level of Education each Villages
Edueai Ien TotEaNo. Vlb. NS F NES ES I - -S * HE IL Populati HF al-l Sukpura W8 41T F76 2 I1 6 13 2L4 7 2,069 .19-2. Py Petal 942 748 1,500 300 100 62 74 3,726 7173. kilkora 24. 17 868 159 63 7 1,137 2,495 4.794. Trlbudi syukur 275 527 619 WO 58 26 246 1, 901 395. urawtlmtan 879 2,560 1,836 431 229 383 6,315 1,4.606. Tanjung *y 375 769 600 40 18 3 152 1,957 3917. uke Jaye 271 765 542 39 1S 2 174 1,808 3628. hrmn Jaya 254 45e 198 27 12 . 129 1,078 2279. arang AgUng 384. 286 2,063 114 52 7 77 2,983 47910. Su Raja 358 850 524 170 327 16 247 24.92 4.8
a e *I360 -7,403 1 9,546 1,36575 1 2,e66 I 26, eZ _A * r Oa I 16.25 _ .eO 15.58 5.e7 3.51 10.eI 100
'I "I Head 01 Iamiiy
(3) Employment categories
The result of date collection in 10 villages show that the main occupation of thepopulation is as follows: farmer 188.33%), trader (2.22%). laborer (2.22%). andothers (workshop, civil servant, driver, and other service) (7.23%).
Whereas the secondary means of support, or side jobs are: farmer 13.21 %. trader22.64%. laborer 37.73%, and others 26.43% as can be seen in Table 3.19.
Table 3.19. Main-and Secondary Occupation in Area of Study
Type of Work occupationM a In SecondarylSide
VEige Farmer Trd Laborer Others Fa rmw Trader Laborwe Othe
ukapurm . - 2 I 1 1 2way Petml 21 4 - 1 5Dwikora 17 a 2 1 3 2ribudi Syukur 15 . . . . . 2urawldtan 15 . . . . 12 -anjungra is .- 3ukajaym 13 2 3 3emarang Jaya 15 i s 2 .arang Agung 10 2 3 3 3 1auk 15 _ Z _2a ot a I 159.00 4.00 4.00 13.00 7.O0 12.00 20.00 l4.00
tercentage 58.33 Z.22 7 2.ZZ J._22 13.21 22.64 3 Zb.4
(4T Manpower Labor Potensial
The data on manpower are obtained by grouping the population according to age,i.e. productive manpower (age 10-55 years) and unproductive manpower (age lessthan 5 years and over 55 years). The data collected show that productivemanpower accounts for 6.22% of the total population and unproductive manpower32.78%. Unproductive manpower forms a burden for productive manpower withand average rate of dependability of 0.49 (as can be seen in Table 3.201.
ENWRONMENTAL IMPACTASSESSMENT-8ESAI PP 111- 28
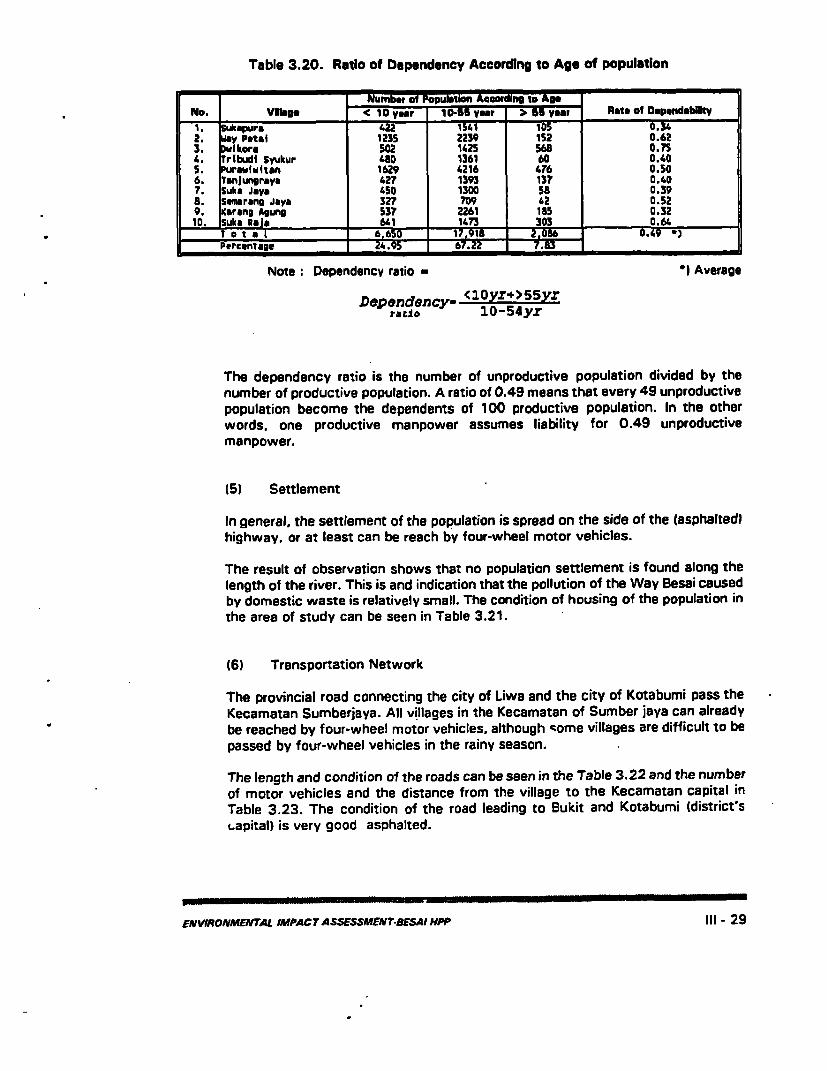
Table 3.20. Ratio of Dependency According to Age of population
Number of Population AGo#dng -D ANo. Villb < 10 year 1041f yes;r 2 55 V. Rate of DepmndbilktV1. sukapura 422 1541 lO5 0.342. i Petal 1235 2239 152 0.623. ilkar. 502 1425 568 0.754. Tribud Syukur '80 1361 60 0.405. Purwiwton 1629 4216 476 0.506. Tnjungraya 427 1393 137 0.407. Suka Jaya 450 1300 58 0.398. Semrang Jaya 327 709 42 0.529. arn* Agun 537 2261 185 0.3210 Suka Raja 1 14 303 0.64
T o t a t 1 6650 17918 2, 0.49 Percentage 2 .9 67.ZZ r.ss
Note DependencV ratio - I Average
Dependency (OYZ*> 55yrratio 10-54yr
The dependency ratio is the number of unproductive population divided by thenumber of productive population. A ratio of 0.49 means that every 49 unproductivepopulation become the dependents of 100 productive population. In the otherwords, one productive manpower assumes liability for 0.49 unproductivemanpower.
(5) Settlement
In general, the settlement of the population is spread on the side of the (asphalted)highway, or at least can be reach by four-wheel motor vehicles.
The result of observation shows that no population settlement is found along thelength of the river. This is and indication that the pollution of the Way Besai causedby domestic waste is relatively small. The condition of housing of the population inthe area of study can be seen in Table 3.21.
(6) Transportation Network
The provincial road connecting the city of Liwa and the city of Kotabumi pass theKecamatan Sumberjaya. All villages in the Kecamatan of Sumber jaya can alreadybe reached by four-wheel motor vehicles, although come villages are difficult to bepassed by four-wheel vehicles in the rainy season.
The length and condition of the roads can be seen in the Table 3.22 and the numberof motor vehicles and the distance from the village to the Kecamatan capital inTable 3.23. The condition of the road leading to Bukit and Kotabumi (district'sLapital) is very good asphalted.
ENVIRONMENTAL IMPACT ASSESSMENT-BESAI HPP 111 - 29
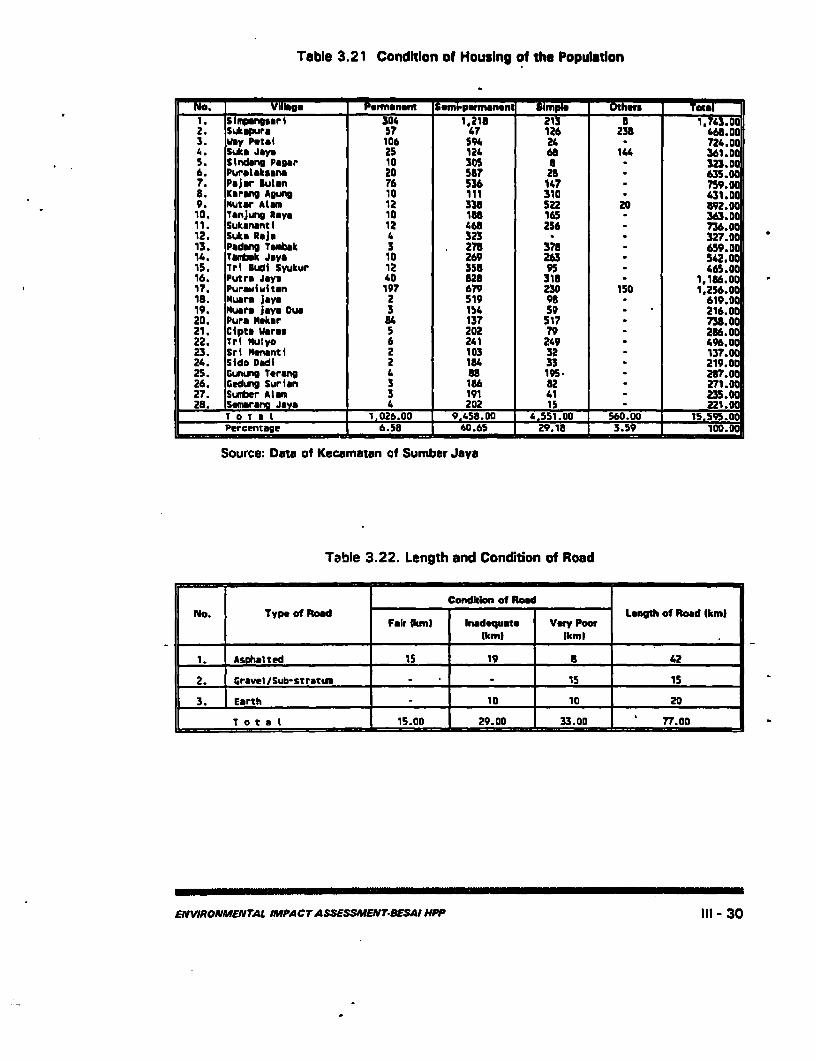
Tab:e 3.21 Condition of Housing of the Population
Village P:r;n:n SImspermaneni sm pe;" Othr T1. Smporntsgri 304 1.218 213 a2. Sukapura 57 47 126 238 468.003. Way Petal 106 594 24 724.004. Suke Jaya 25 124 68 1L4 361.05. Slndeng Pager 10 305 8 323.006. PuraLaksans 20 587 21 6 35.007. Pajur 2ulaen 76 536 147 . 759.008. Kering Agung 10 111 310 431.09. Muter Atm 12 338 522 20 892.10. Tanjung Roym 10 188 165 . 363.011. Sukenantl 12 468 256 . 736.012. SukE Raja 4 323 327.013. Pedang Tambek 3 278 378 659.014. Tembak Jaya 10 269 263 542.015. 7e1 Budi Syukur 12 358 95 . 465.016. Putrt Joys 40 828 318 . 1.186.017. Purawiiwtan 197 679 230 150 1.256.018. Munro Jays 2 519 98 619.019. Musra Jays Dua 3 154 59 216.020. Pura Mekar 84 137 517 . 738.021. Cipta Wares 5 202 79 . 286.022. Trl Nulyo 6 241 249 . 496.023. Sri Menantl 2 103 32 137.24. 51do Dadi 2 184 33 219.025. Gunung Terang 4 88 195- . 287.026. Cedung Surlan 3 186 82 . 271.27. Sumber AluM 3 191 41 . 235.0028. Seomrano Jav 4 Z02 15 - 221.0t
I rJ t r I 1_02b.OO 9.458.00 4.551.00 560.00 15.595.0OtPercentage 6.58 60.65 29.10 3.59 10 W.30
Source: Data of Kecamatan of Sumber Jaya
Table 3.22. Length and Condition of Road
Candkion of RoadNo. Type of Road Length of Road Ikml
Fair 1kml Inadequate Very Poor(km) (kml
1. Asphatted 15 19 8 42
2. Gravel/Sub-stratum 15 15
3. Earth 10 10 20
T a t a t 15.00 29.00 33.0D 77.00
ENVWRONMENTAL IMPACTASSESSMENrTBESAI PP 1l - 30
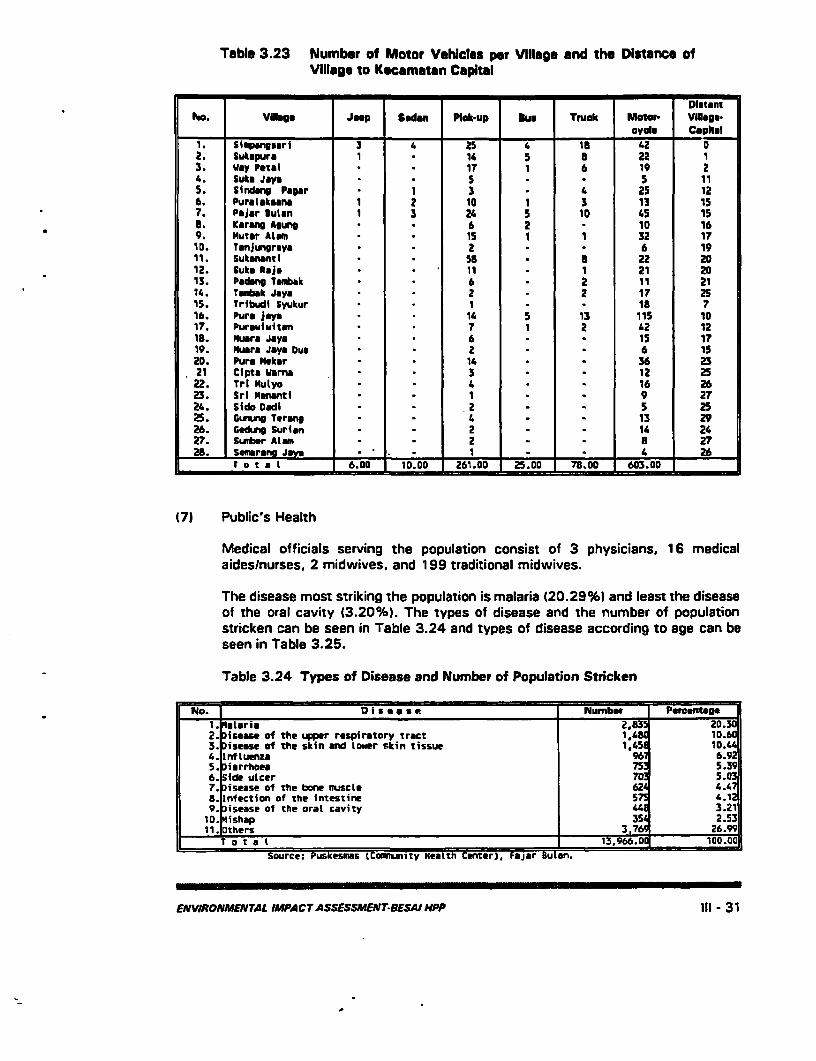
Table 3.23 Number of Motor Vehicles per Village and the Distance ofVillage to Kecamatan Capital
Distantho. Vgbge Jeep Sedan Pili-up Du$ Trumk Moete- Vageo.
ycle Caphal1 Slimpangsrl 3 4 25 4 10 42 02. Sukapura 1 14 5 8 22 13. way Petal 17 1 6 19 24. Sukt JOy 5 5 115. Slndeng Pagar 1 3 4 25 126. Puralkasna 1 2 10 1 3 13 157. PaJar Sulan 1 3 24 5 10 45 158. Karang Aguno 6 2 10 169. Muter Als 15 1 1 32 171D. TmnJungrays 2 6 1911. Sukanntl 51 5 22 2012. Suk Raja 11 1 21 2013. Pad nglTabak 6 2 11 2114. rTmak Jays 2 2 17 2515. Tribudl Syukur 1 la 716. Pure J)y . 14 5 13 115 1017. Purailmitan 7 1 2 42 1218. Nura Jays 6 15 1719. Nuara Jay Due 2 6 1520. Pure ekar 14 36 2321 CiptU Wrnao 3 12 2522. Trl Muyo 4 16 2623. Sri mnanti 1 9 2724. Sido Dedi 2 5 2525. Gunung Terang 4 13 2926. Gedung Surlan 2 14 2427. Sumber Alm 2 2728. Sc_mrang Jays 1 4 / 26
T o ~ta 1~ 6.00 1 10.00 261.00 25.00 78.00 603.00
(7) Public's Health
Medical officials serving the population consist of 3 physicians, 16 medicalaides/nurses, 2 midwives, and 199 traditional midwives.
The disease most striking the population is malaria (20.29%) and least the diseaseof the oral cavity (3.20%). The types of disease and the number of populationstricken can be seen in Table 3.24 and tvpes of disease according to age can beseen in Table 3.25.
Table 3.24 Types of Disease and Number of Population Stricken
i a. 0 N | a * Number PercentageI eLrai 2.a83 20.302 isease of the upper respiratory tract 1 4 10.603 isease ef the skin and Loier skin tissue 1,45 10.444 Inftuenza 6.925 iarrhoe 75 5.396 5ide ulcer .503T. isease of the bone muscLe 4.4B. Inection of the intestine 5 4.129 isease o1 the oral cavity 3.21ID. ishap 3 2.5311. others 3, 26.99
T D t a t 13,966.01 100.00Source: Puskesmas (Conmunity Heatth Center), Fajar Bulan.
ENVIRONMEVTAL IMPACT ASSESSMENT-BESAI PP 111- 31
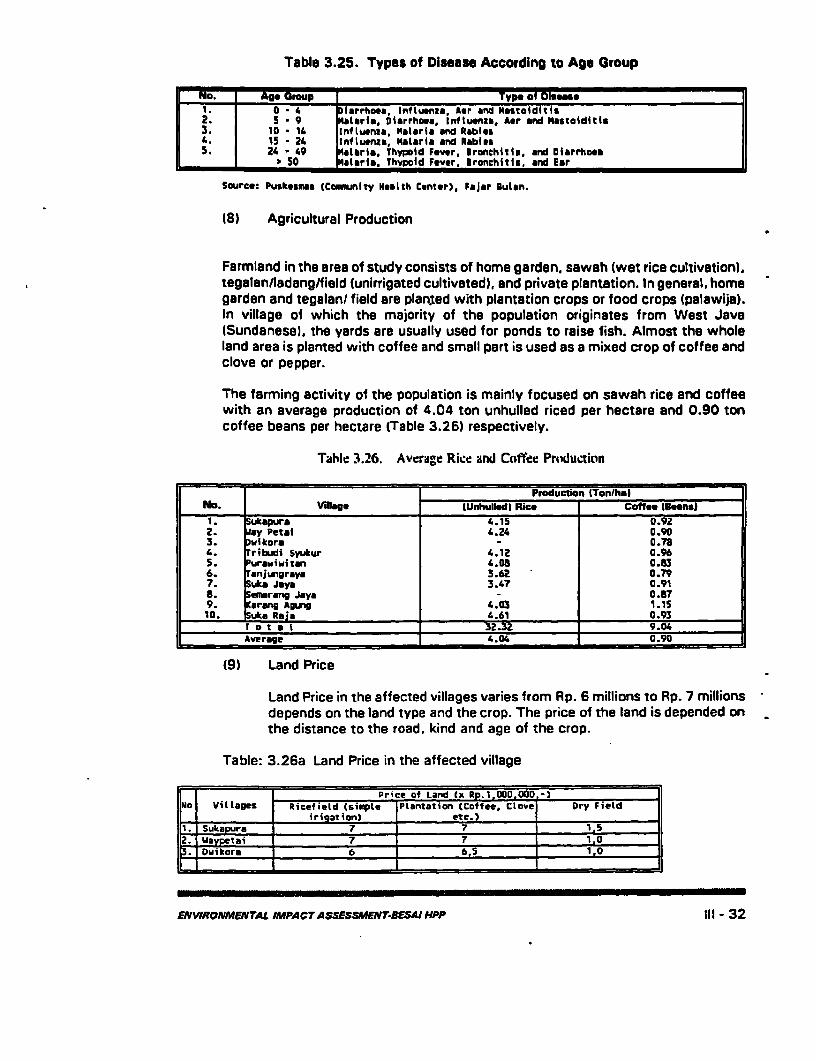
Table 3.25. Types of Disease According to Age Group
Age Group TVpe e1 Dsaase I1.0 1. iarrhoea, Influenza, Aer and Mastoiditis2. 5 al9 Loria, Diarrhoea. Inftuenza, Aer *nd mastaiditis3. 10 1L Influewna, Malaria and Rabies3. 15 2. Influenas, Malaria and Rabies5 2 - 1.9 ataria. Thypold Fever, Ironchitim, and Dlarrhoem
50 &aara.. Thypcid Fever. Bronchitis, and Ear
Source: Puskesmat (CCmaunity Nialth Center), Fajar Bulen.
(8) Agricultural Production
Farmland in the area of study consists of home garden. sawah (wet rice cultivation).tegalan/ladang/field (unirrigated cultivated), and private plantation. In general, homegarden and tegalanl field are planrted with plantation crops or food crops (palawija).In village of which the majority of the population originates from West Java(Sundanese). the yards are usually used for ponds to raise fish. Almost the wholeland area is planted with coffee and small part is used as a mixed crop of coffee andclove or pepper.
The farming activity of the population is mainly focused on sawah rice and coffeewith an average production of 4.04 ton unhulled riced per hectare and 0.90 toncoffee beans per hectare (Table 3.26) respectively.
Tahle 3.26. Average Rice and Coffee Production
Production (TonihalNo. vilage (Unhullidi Rice Cofaee (Beans)
1. &capura 4.15 0.922. y Petal *.24 0.903. ikor _ 0.78-. .* Tribudi Syukur 4.12 0.9611 5. Prauiwitan 1..08 0.836. jnungrays 3.62 0.797. uka Jaya 3.47 0.91S:. emrang Jays 0.87
l 9. &trang Agung 4.03 1.1510. uka Raia *.61 0.93
r o t a l 32.3Z 9.0KAverage s X 0.90
(9) Land Price
Land Price in the affected villages varies from Rp. 6 millions to Rp. 7 millionsdepends on the land type and the crop. The price of the land is depended onthe distance to the road, kind and age of the crop.
Table: 3.26a Land Price in the affected village
I ~~~~Price of Land (x Rp.1.000.000.-)lNo VilLoges RicefieLd CsimpLe Plantatian (Coffee, Ctove Dry Field
_ _ _ ~~~~irigation) _ere.)lSukapura 7 7 '1 .Waypetai7 7 1.0Dmikor 6_ 6,5 1,0
= .R = I
ENVIRONMENTAL IMPACT ASSESSMENT.SESAJ HPP Ill - 32
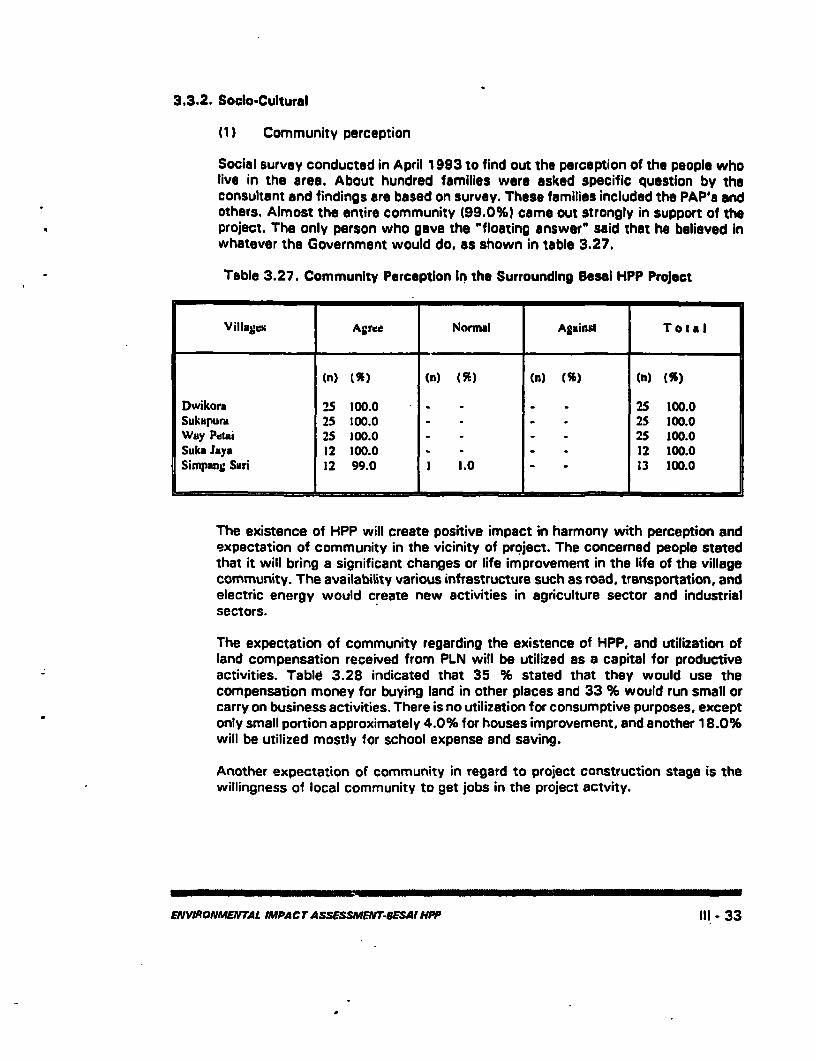
3.3.2. Socio-Cultural
(1) Community perception
Social survey conducted in April 1993 to find out the perception of the people wholive in the area. About hundred families were asked specific question by theconsultant and findings are based on survey. These families included the PAP's andothers. Almost the entire community (99.0%) came out strongly in support of theproject. The only person who gave the "floating answer" said that he believed inwhatever the Government would do, as shown in table 3.27.
Table 3.27. Community Perception In the Surrounding Besel HPP Project
Villagem Agree Normal AgainS T O t a I
(n) (5M (n) M% (n) M% (n) (%
Dwikora 25 100.0 . . . . 25 100.0Sukapura 25 100.0 . . , 25 100.0Way Petai 25 100.0 . 2S 100.0Suka iaya 12 100.0 . . . 12 100.0Simpang Suri 12 99.0 1 1.0 . 13 100.0
The existence of HPP will create positive impact in harmony with perception andexpectation of community in the vicinity of project. The concerned people statedthat it will bring a significant changes or life improvement in the life of the villagecommunity. The availability various infrastructure such as road, transportation, andelectric energy would create new activities in agriculture sector and industrialsectors.
The expectation of community regarding the existence of HPP, and utilization ofland compensation received from PLN will be utilized as a capital for productiveactivities. Table 3.28 indicated that 35 % stated that they would use thecompensation money for buying land in other places and 33 % would run small orcarry on business activities. There is no utilization for consumptive purposes, exceptonly small portion approximately 4.0% for houses improvement, and another 18.0%will be utilized mostly for school expense and saving.
Another expectation of community in regard to project construction stage is thewillingness of local community to get jobs in the project actvity.
ENWRONMENTAL IMPACTASSESSMENT-BESAI P 11| - 33
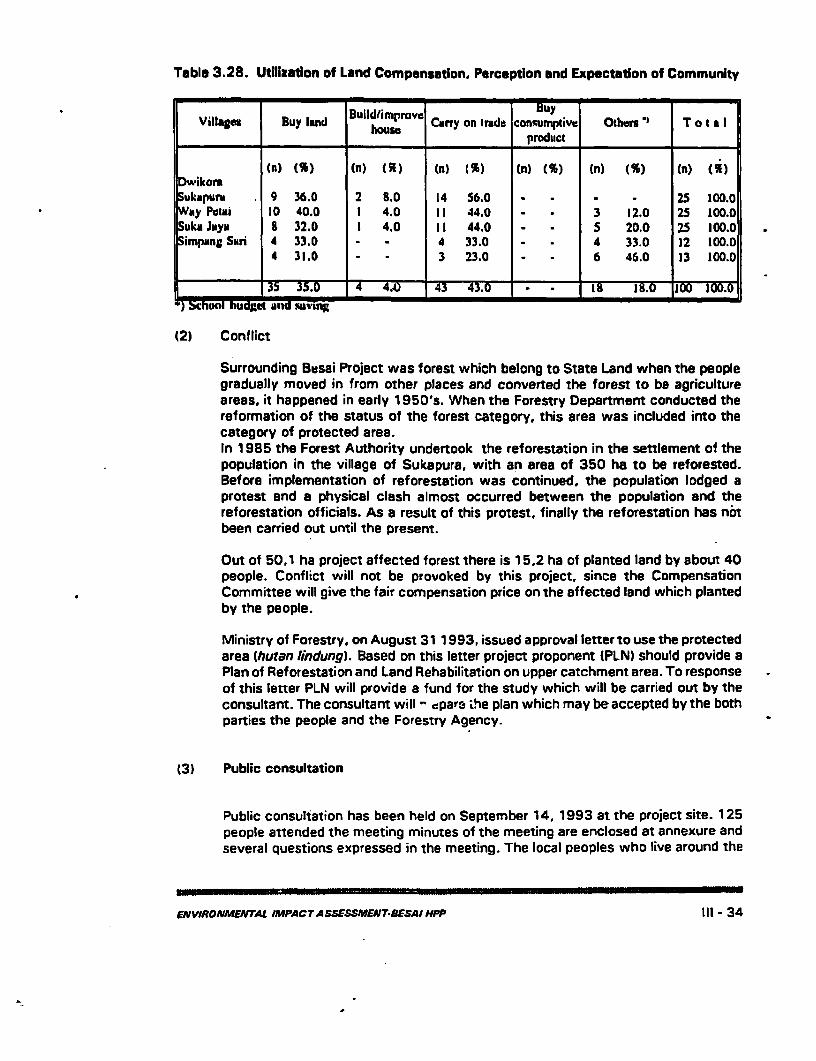
Table 3.28. Utilization of Land Compensation. Perception and Expectation of Community
mm ~~~~~~~ul/ipoeBuy-Village Buy land Bul e Carry on Irade consumplive Othersa T o t a I
house ~~~product __ _ _ _ _ _ _ _ _ _ _
DwikormSukapura 9 36.0 2 8.0 14 56.0 . . 25 100.0Wily Ptaii 10 40.0 1 4.0 11 44.0 . 3 12.0 25 100.0Suka Joys 8 32.0 1 4.0 11 44.0 . . 5 20.0 25 100.0Simpengl San 4 33.0 . 4 33.0 . . 4 33.0 12 100.0
4 31.0 . . 3 23.0 . . 6 46.0 13 100.0
m135 35.D0 4 4J) 43 43.U 18 18.0 0 0.
Schiol budg,et nni sovin
(2) Conflict
Surrounding Besai Project was forest which belong to State Land when the peoplegradually moved in from other places and converted the forest to be agricultureareas, it happened in early 1 950's. When the Forestry Department conducted thereformation of the status of the forest category, this area was included into thecategory of protected area.In 1985 the Forest Authority undertook the reforestation in the settlement of thepopulation in the village of Sukapura, with an area of 350 ha to be reforested.Before implementation of reforestation was continued. the population lodged aprotest and a physical clash almost occurred between the population and thereforestation officials. As a result of this protest, finally the reforestation has notbeen carried out until the present.
Out of 50.1 ha project affected forest there is 15.2 ha of planted land by about 40people. Conflict will not be provoked by this project, since the CompensationCommittee will give the fair compensation price on the affected land which plantedby the people.
Ministry of Forestry, on August 31 1993, issued approval letter to use the protectedarea (hutan lindung). Based on this letter project proponent (PLN) should provide aPlan of Reforestation and Land Rehabilitation on upper catchment area. To responseof this letter PLN will provide a fund for the study which will be carried out by theconsultant. The consultant will - epare ihe plan which may be accepted by the bothparties the people and the Forestry Agency.
(3) Public consultation
Public consultation has been held on September 14, 1993 at the project site. 125people attended the meeting minutes of the meeting are enclosed at annexure andseveral questions expressed in the meeting. The local peoples who live around the
ENVIRONMENTAL IMPACT ASSESSMENTBESAI HPP Ill - 34
project, stated that they agree to the plan of government to develop the BosalHydro Electric Power Plant Project.
The important questions asked in that meeting were as follows:
1. Explanation of the basic principle of compensation that will be fixed for theland, plants, and buildings.
2. When will the compensation be given 7.
3. The details of the area especially for Dwikora village which will be affectedby the 1e_ai HEPP Project.
4. What is the status of the land which will be affected by the constructionactivity of the project despite the fact that the land has not been acquiredyet?
5. Can the acquired land be used by the people before it is inundated by thewater.
6. Can the people who live around the project get work in the constructionactivities?
7. Someone just bought some bush land. Can he ask for the compensation ofit?
The response of the project proponent (PLN and the members of the compensationcommittee were as follows to the above question:
1. The land acquisition for the Government/public services is according toKeppres (President Decree No. 55/1993) which provides deliberationbetween the land Acquisition Committee and the owner of land.
2. The compensation will be given after the stacking out, cadastral survey, andthe inventory of the land, plants, and other temporary structures are donecompletely. The compensation will be on principle of replacement costs.
3. To know the exact area that will be affected by the project one must gothrough these following steps:
a. Stacking out : to define the area's borderb. Cadastral survey : to make the detailed border of each
piece of land
c. Inventory : to Collect the data of all the land,plants, and buildings.
This activity has already started at the local level and a time-schedule inannexed
ENVIRONMENTAL IMPACTASSESSMENT-BESAIHPP III - 35
4. Once the acquisition proceeding has been initiated. land holder can continueto use the same but cannot sell it to others.
5. The acquired land will belong to the PLN. so it may not be used by thepeople anymore.
6. PLN will encourage the Contractor to employ as many eligible local workersas possible.
7. All types of land holdings, irrespective of legal ownership will getcompensation. But it must follow the procedure such as the inventory of theland and its status, number of plants and the size and condition of temporarystructures.The presidential decree provides for full compensation at a replacementvalue.
ENVIRONMENTAL IMPACT ASSESSMENT-BESAI HPP Ill - 36
IV. ENVRONMETALIMPACT
1. Negative environmeatal effects of construction:
a). Air and water pollution from construction and waste disposal.
Air quality in the village might be affected by the construction traffic such as dustor noise. To overcome those problems, several measures will be applied. The dustfrom the access road will be suppressed by the water spraying especially during thedry season. Noise will be suppressed by enforcement to use noise abatement inevery construction vehicles. The exhaust gas emitted by the construction vehicleswill disperse and the ambient concentration can be neglected in the village. So theimpact of construction on air quality is considered a minor one if those measuresare taken properly
The waste produce from the project activities can be divided into two categories,i.e. domestic waste and construction waste.
The domestic waste will be collected and disposed in the special disposal area farfrom the village.
The construction activities will produce several type of waste such as metal, paper,wood, soil or concrete aggregate. Metal, paper and wood will be recycled (collectedand sold or re-use) so no waste on this categories will be disposed. Soil andconcrete aggregate will be used for land reclamation or disposed in the soil disposalarea. Reclamation of soil disposal area will be conducted such as terracering andreplanting of trees and grasses.
b). Soii Erosion
Land clearing, cut and fill and soil disposal area can increase the rate of soil erosionif not carefully managed.
The erosion rate will be suppressed by several measures:
* Soil trap such as land holes if applicable in such area will be developed totrap the soil transported by the run off.
The water embankment will be avoided to prevent mosquito breeding area.
* Terracering and land reclamation on soil disposal area and on bare land areawill be adopted
* Grasses or trees will be planted on the bareland caused by constructionactivities and on disposal area after the work finished.
ENVIRONMENJTAL IMPACTASSESSAENT-BESAIHEPP IV - 1
c). The impact of construction worker camps.
There is several base camps which will be develop for the constructionlabors and employees. PLN will develop the camps for the PLN Project'semployees and for the project engineers. The contractors will develop theirown camp after the design being approved by the project engineers. Projectproponent will ask that the camps should be provided with the health carefacilities, standard sanitation facilities and sport/entertainment facilities. Thepolyclinic develops by the project proponent and the health care facilitiesdeveloped by the contractors will support with each other. The local peoplemay use those facilities as emergency besides the Health Center(PUSKESMAS) which exists on that area.
There are also benefit opportunities for local people to get the contract oflodging facilities for the outside construction workers.
2. Dislocation of people living in inundation zone.
No families living in the inundation zone.
The project will pay the fair compensation of land, crop/vegetation andhouses/building based on negotiation between the people and land compensationcommittee.After the project they will get better access road and electricity. They may use thepolyclinic developed by the project. Priority of employment in the project will alsobe given to the affected people.
3. Lost of agricultural and forest land by inundation to form reservoir.
Besai HEPP is a run off river type power plant, the reservoir is designed to holdwater for daily power generation, so the acreage of land for reservoir is only 140ha and the impact is considered medium.
The land which belong to the people (agriculture land) will be compensatedaccording to the President Republic of Indonesia Decree No. 15 of June 17, 1993.The owner and the compensation committee will sit together to negotiate thecompensation value. The compensation payment will account for land, building andvegetation (crops).
The land which belong to Forestry agency will be replaced with such kind ot landto be reforested in ratio of replacement of 1: 1. The area of replacement has notdecided yet, the Forestry Agency will give the condition of replacement land. Thecompensation of the replacement land will be proceeded according the regulationand the procedure as well as above.
4. Loss of historic, cultural or aesthetic features by inundation.
No historic, cultural and aesthetic features in the reservoir area. So this project willgive no impact on these objects.
ENVIRONMENTAL IMPACTASSESSMENT-SAI MEP IV - 2
5. Loss of wildiands and wildlife habitat.
The project will use part of agriculture converted land forest or bushes forest land.The acreage of forest land to be used will be small compared those the adjacentforest area. Most of the forest area used by the project has been converted intocoffee plantation.
The impact on wildlands and wildlife habitat is not considered to be significantlyadverse for the following reasons. Although there are several protected animalssuch as gibbon, Monkey, water civet, porcupine and several snake sometimereported show up in the proposed project area, the main habitat of those animalsarea in adjacent forest area. Construction activity might disturb those enimals, butthey will naturally avoid the construction area. The habitat will be insignificantlyreduced, so the impact is considered insignificant.
6. Proliferation of aquatic weeds In reservoir and downstream Impairing dam discharge.irrigation, navigation and fisheries and increasing water loss through transpiration
Vegetation in the reservoir area prior inundation will be cleared to reduce thenutrient source for future aquatic weeds.The area of reservoir is relatively small, so aquatic weeds ca be removed easily inregular basis so it will not grow out of control.
7. Deterioration of water quality in reservoir
The vegetation in reservoir area if it is let uncleared. when it is inundated, it mightcause eutrophication.The area of future reservoir consist of agriculture area and secondary forest (shrub,brush etc.) it relatively contains few trees. Total vegetation clearing will beconducted to avoid deterioration of water quality in future reservoir area.
S. Sedimentation of reservoir and loss of storage
Erosion in upper catchment area will affect the storage of reservoir. To overcomethe problem several measures will be taken:
- The Agency for Soil Conservation and Rehabilitation will make extensioninformation to the farmer for better agriculture practice. Regreening will alsobe conducted in the bare land area.
- Flushing of sediment in reservoir will be conducted regularly.
9. Formation of sediment deposit at reservoir entrance creating backwater effect andflooding and waterlogging upstream.
Besai HEPP is a run off river type power plant, the reservoir is designed to holdwater for daily power generation, so the volume of reservoir is relatively small andthe current of water is also relatively high. It is considered that it will not cause theformation of sediment deposit at reservoir so much. During the h:gh discharge
ENVIRONMENTAL IMPACT ASSESSMENr-BESEAI HEPP IV - 3
scouring elfect of sediment in reservoir will make the balance of it. There is nodwelling areas or agricultural area which might be affected by the back water ofBesai HEPP.
10. Scouring of riverbed below dam
The power plant has been designed to overcome the potential scouring effect of.thewater release through the sluiceway. The horizontal stilling basin of 33.5 m wideand 16.0 m long is designed to dissipate the energy of design flood equivalent to100 years probable peak discharge. The scouringway o1 16.5 m wide and 25.4 mlong is facilitated with each two numbers of upper and lower-scouring gates, for thepurpose of flushing out bed loads through the lower scouring gates and suspendedloads through the upper ones. each gate is 6.0 m wide and 1.5 high. The size ofscouringway is designed so as to ensure at least the same scouring capacity asexisting river.The impact of scouring of riverbed below the dam is considered insignificant.
11. Decrease in floodplain (recession) agriculture
There is no irrigation downstream of the dam.
12. Salinization of floodplain lands
Besai River is small tributaries of Tulang Bawang River.There is no anticipated impact of Besai HEPP on salinization of floodplain lands.
13. Salt water intrusion in estuary and upstream
There is no impact of Besai HEPP on salt water intrusion in estuary and upstream.
14. Disruption of fiverine fisheries due to changes in flow, blocking migration, andchanges in water quality and limnology.
River flow will be greatly reduced in the approximately 5 Km section of riverbetween the diversion weir and the power station outlet. particularly during the dryseason. This will reduce the available habitat for aquatic organisms in the followingways.
- The volume of water and hence aquatic habitat, will be less.
- Reduce water velocity may render the river less suitable for species adaptedto fast flowing waters.
These impacts will be long term and to a large extent irreversible, but it does notconsider to be significant for the following reasons:
- The fish species and major invertebrate groups found in the affected riversection are also found in abundance both upstream and downstream ofproject area.
ENViRONMENTAL IMPACT ASSESSMENT.8ESA1 IEPP IV - 4
* The river does not support an imponant economic, subsistence orrecreational fishery.
* The fish specios within the Basal Rlver do not appear to be unique orendemic or migratory one to the Tulang,Bawang river and are found throughout Sumatra.
15. Snagging of fishing nets In submerged vageta;ton In reservoir.
The area of future reservoir consist of agriculture area and secondary 1orest (shrub,brush etc.) it contains few trees.Total vegetation clearing will be conducted to avoid snagging of fishing nets insubmerged vegetation in reservoir area.
16. Increase of water related diseases.
The addition of water surface might provide the habitat of mosquito to breed, inother hand the rate of malaria incidence in the area is relatively high. So there is apotential of new habitat for malaria mosquito to breed.
Fortunately, reservoir of Bessi HEPP is a daily pondage for daily generation, so thecurrent of the reservoir will be too strong for the mosquito to breed. In case that themosquito successfully breed in the reservoir, it will be overcome by restocking offish that will eat mosquito larvae.
The Health center will elaborate to dismiss the rate of malaria prevalence andmosquito.
17. Conflicting demands for water use.
There is no conflicting demands for water use since there are no river water usagesalong the river down stream of the dam (riparian people, navigation, irrigation andother).
18. Social disruption and decrease in standard of living of resettled people.
Lost of agricultural land might result the decreasing of income and in turn it willdecrease the standard of living as well.
Fc - the Besai people, this condition will likely be happened for temporary basis.More than 78 % of affected people expressed their willingness that they will usetheir compensation money for productive use (purchase agriculture land, open newbusiness etc.) and none of them will use their money to buy consumptive goods.To dismiss the using money unwisely, extension of information will be conductedby project proponent to affected people.
To minimiz-e the negative impact and to enhapce the positive impact the projectproponent (PLN) will also initiate several measures, such as:
a. To give priority to local people (affected people) to work on project.
ENVIRONMENTAL IMPACTASSESSMENT.BESAIHEPP IV- 5
b. To provide services such as: electricity, access to polyclinic developed bythe project.
c. To provide the training on several skills such as:
* Home industries* Carpenter, masonry, mechanical technicians etc.- Fisheries, animal husbandry- Small trading
19. Environmental degradation from Increased pressure on land.
To overcome the problem the sectoral agency such Agricultural Agency. PlantationAgency and Soil Conservation and Rehabilitation Station and will elaborate toextend the information regarding better practice of agriculture work.
20. Disruption/destruction of triballindigenous groups.
There is no tribal/indigenous groups in the affected area of Besai HE"P.
21. Increase in humidity and fog locally, creating favorable hablitat for insect diseasevectors (mosquitos).
The climate in the surrounding Besai area is humid. Reservoir surface of Besai HEPPof 101 Ha is considered too small to change the humidity in the area. Reservoir ofBessi HEPP is a daily pondage for daily generation, so the current of the reservoirwill be too strong for the mosquito to breed. In case that the mosquito successfullybreed in the reservoir, it will be overcome by restocking of fish that will eatmosquito larvae.
22. Impact of reservoir on drinking water pumped from shallow wAell.
Reservoir of Besai HEPP is relatively far from the dwelling area. Most of the dwellingarea are located along the high way of Liwa - Kotabumi or along the village road.The people get the drinking water from the spring water or shallow water near theirhouses, so no impact of future reservoir on existing drinking water.
23. Impact of dry river bed between dam to the power house.
During the dry season the river bed between dam to the power house will beregularly dry for several days or weeks, especially when the incoming flow lowerthan the power generation outflow.There are no people living in that area, since that area is very steep. There are nowild animal which will be affected by those condition. There is no migratory fishfound in the river.
24. Impacts of eanhquakes and floods
The project has been designed to accommodate the seismic acceleration for thisarea. The weir of Besai HEPP is only 8 m high and the surface area of the reservoiris only 101 Ha. so the induced seismic of the reservoir can be neglected and it will
ENVIRONMENTAL IMPACT ASSESSMENT-BESAI HEPP IV - 6
not likely cause the hazard to environment.
The holding capacity of the reservoir to reduce the floods water from upstream willbe small due to its capacity. Most of the floods will be passed through thesluicewaV. The sluiceway is designed as a wholiv gated concrete overflow weir of33.5 m wide, 25.2 m long and 6.5 m high which is provided with four numbers ofsluice gates. It is sufficiently to release not only 100 years probable peak dischargeof BOO m3/sac but also 10,000 years probable peak discharge of 1.400 m3/sec.
25. Impact of waste lubricant oil
The waste of lubricant oil will come from several sources such as- Vehicles used for construction and operation activities- Bearing of the movement part of the power plant.
The waste lubricant oil will be managed in environmentally acceptable manner, itwill be collected in drums and will be sent to PERTAMIMA (the agency who havethe authority to collect the waste lubricant oil!.
26. Impact of transmission lines
The Electric power generated by this project will be transmitted through 150 KVhigh voltage to Bukit Kemuning Sub station. The distance of the Besai powerhouseto Bukit Kemuning is 16 Km. It pass the bushes and agriculture area, and no houseswill be passed by the transmission lines. The impact of the transmission lines isconsidered insignificant.
I N D I R E C T
27. Uncontrolled migration of people into the area made possible by access roads andtransmission lines.
The project area is located between the city of Liwa and Kotabumi. and havesmooth surfaced asphalt high way, so this area is relatively an open area.The access road of the project is relatively short (2 Km) and it through agriculturearea. The uncontrolled migration of people into the area will likely not be happened.
The transmission line will be built in parallel 4vith the existing high way to BukitKemuning High way. Based on experience on the recent transmission that there isno uncontrolled migration of people along the transmission lines.
28. Environmental problems arising from development made possible by dam (irrigatedagriculture, industries, municipal growth).
Due to topographic condition there is no possibility to develop irrigation in this area.Electric energy from Besai HEPP will stimulate the industrial growth in this region.especially near the city of Bandar Lampung. but it is unlikely in the surrounding ofBesai HEPP.
ENVIRONMEDJTAL IMPACT ASSESSMENT-DESAI NEPP IV - 7
EXTERNAL
29. Poor land use practices In catchment areas above reservoir resulting In Increasedsiltation and changes in watar quality.
The agriculture practice in the catchment area that might share the major erosionrate is private coffee plantation. The habit of people to clear all of the weed underthe coffee tree will increase the erosion rate.
To overcome the problem of erosion, the Agency for Soil Conservation andRehabilitation and other involved agencles will make extension information to thefarmer for better agriculture practice and. regreening in the critical land.
ENVIRONMENTAL IMPACT ASSESSMENT-SESAI HIEPP IV - 8
V. ANALYSIS OF ALTERNATIVES
5.1. Background
PLN's Region IV is the largest of its fourteen regions in terms of thegeographic area covered. it includes four provinces in Sumatra. viz., South Sumatra.Bengkulu, Lempung and Jambi.
The total installed generating capacity in the region is 620 MW, of which454 MW is in the South Sumatra and Lampung provinces. dn addition to the centralgenerating stations at Kramasan (2 x 12.5 MW'oil fired steam turbines and 3 x 14.7MW oil-fired gas turbines), Bukit Asam (2 x 65 MW coal-fired units), and the centralplant at Tarahan (77.7 MW). there are about 400 diesel units, operating in over 150independent generating centers. The Region IV has about 1.500 km of 150 kV and70 kV Transmission lines, 4,800 km of medium voltage (20 kV and 12 kV) lines andabout 6.400 km of low voltage lines.
In addition to PLN's generating facilities, there are about 487 captivegenerating installations totalling 790 MVA; none of them connected to the PLNnetwork. Two major captive installations in Palembang are owned by Pusri Fertilizer(60 MWI. and Pertamina (40 MW).
Bukit Asam coal-fired thermal power plant 2 x 65 MW units 3 and 4 areunder construction at the unit 3 is due for commissioning in January 1994.Another 60 MW of gas turbines will be commissioned at Palembang in 1993/94.
5.1 Necessity of the Project
The population of the region is about 16 million, i.e., approximately 3.2million households. The region has 5,734 villages. The total number of electrifiedhouseholds is about 690.000 (22%) and electrified villages is 1,749 (30.5%).Since 1991, the region has been declares as critical" in terms of supply capacityand new industrial connections are not provided. Also, new residential consumershave to restrict their connected load under 2.2 kVA.
The major power sources planned to be developed by PLN for the system are asfollows:
ENVIRONMENrJAL IMACrASSESSAEPr-DESAINPP V 1
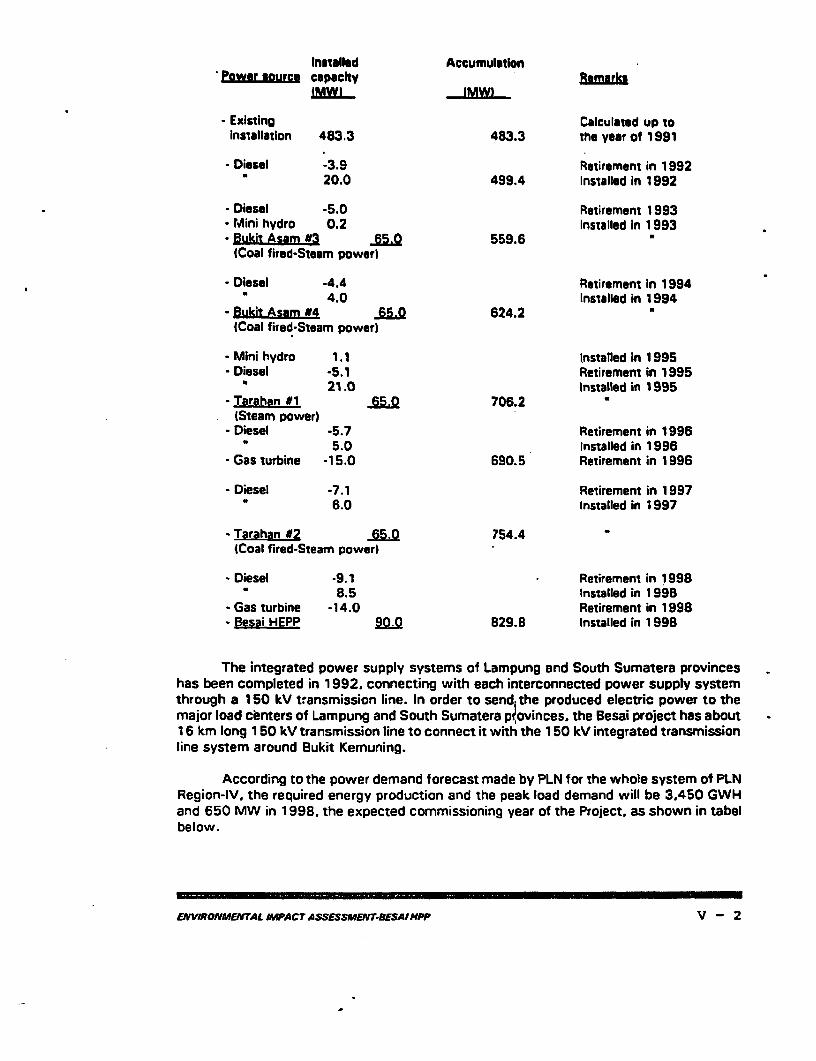
Inutalled AccumulationPower seguz&e capacity emuzlm
IMWi (MW)
Existing Calculated up toinsiallation 483.3 483.3 the Vear of 1991
- Diesel -3.9 Retirement in 199220.0 499.4 Installed in 1992
- Diesel -5.0 Retirement 1993Mini hydro 0.2 Installed In 1993Bukit Asam #a 65 0 559.6(Coal fired-Steam power)
-Diesel -4.4 Retirement In 1994- 4.0 Installed in 1994
B Rukit Asam #4 65 624.2ICoat fired-Steam power)
-Mini hydro 1.1 Installed in 1995- Diesel -5.1 Retirement in 1995
a 21.0 Installed in 1995-Tarahan #1 65 706.2
(Steam power)- Diesel -5.7 Retirement in 1996
5.0 Installed in 1996- Gas turbine -15.0 690.5 Retirement in 1996
- Diesel -7.1 Retirement in 1997* 6.0 Installed in 1997
-Tarahan #2 65.k 754.4(Coal fired-Steam power)
- Diesel -9.1 Retirement in 1998* 8.5 Installed in 1998
-Gas turbine -14.0 Retirement in 1998- Besai HEPP 900 829.8 Installed in 1998
The integrated power supply systems of Lampung and South Sumatera provinceshas been completed in 1992. connecting with each interconnected power supply systemthrough a 1 50 kV transmission line. In order to send. the produced electric power to themajor load centers of Lampung and South Sumatera piovinces. the Besai project has about1 6 km long 1 50 kV transmission line to connect it with the 150 kV integrated transmissionline system around Bukit Kemuning.
According to the power demand forecast made by PLN for the whole system of PLNRegion-IV. the required energy production and the peak load demand will be 3.450 GWHand 650 MW in 1998, the expected commissioning year of the Project, as shown in tabelbelow.
ENWVRONMENTAL IMPACT ASSESSMFAT-BESAI HPP V - 2
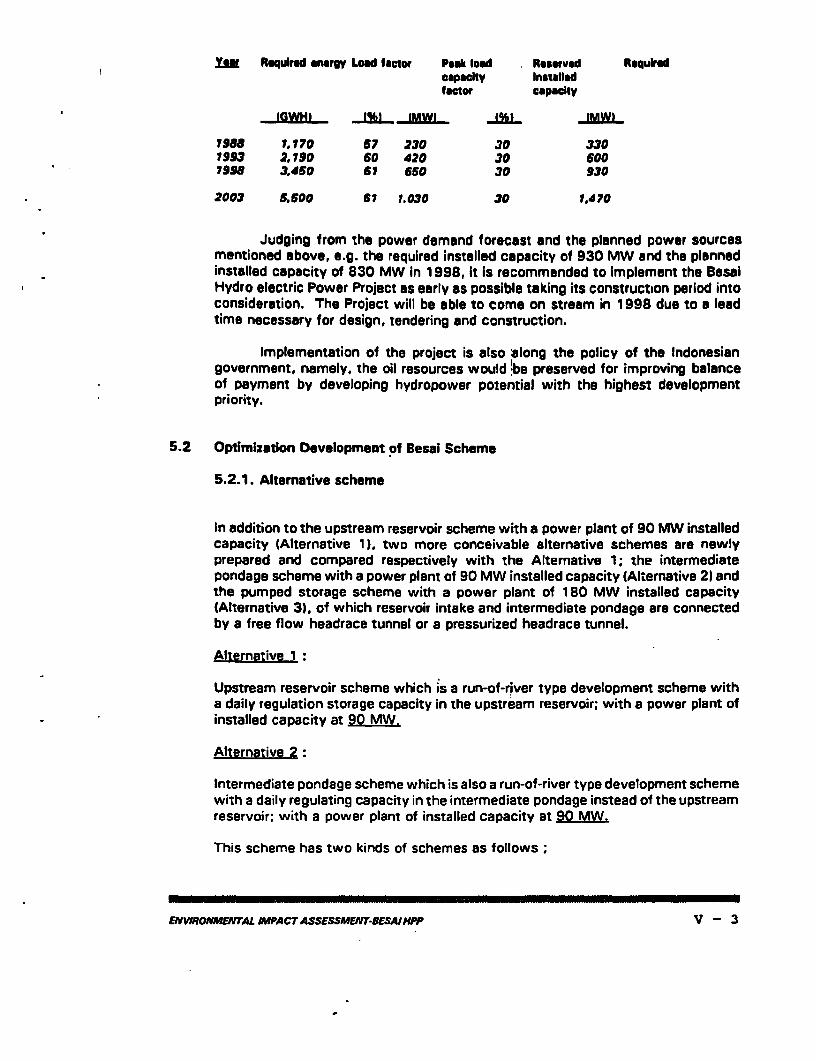
I= Required energy Load factor Peak load Reserved Requiredcapacity Instatledfactor capacity
IGWH8 1%] 4mL IMW MWI
7988 1.170 67 230 30 3301993 2.190 60 420 30 6001998 3,450 61 650 30 930
2003 5.600 61 1.030 30 1.470
Judging from the power demand forecast and the planned power sourcesmentioned above, e.g. the required installed capacity of 930 MW and the plannedinstalled capacity of 830 MW in 1998, it is recommended to implement the BesalHydro electric Power Project as early as possible taking its construction period intoconsideration. The Project will be able to come on stream in 1998 due to a leadtime necessary for design, tendering and construction.
Implementation of the project is also along the policy of the Indonesiangovernment, namely, the oil resources would be preserved for improving balanceof payment by developing hydropower potential with the highest developmentpriority.
5.2 Optimization Development of Besai Scheme
5.2.1. Alternative scheme
In addition to the upstream reservoir scheme with a power plant of 90 MW installedcapacity (Alternative 1). two more conceivable alternative schemes are newlyprepared and compared respectively with the Alternative 1; the intermediatepondage scheme with a power plant of 90 MW installed capacity (Alternative 21 andthe pumped storage scheme with a power plant of 1 80 MW installed capacity(Alternative 3). of which reservoir intake and intermediate pondage are connectedby a free flow headrace tunnel or a pressurized headrace tunnel.
Alternative 1
Upstream reservoir scheme which is a run-of-river type development scheme witha daily regulation storage capacity in the upstream reservoir; with a power plant ofinstalled capacity at 90 MW.
Alternative 2:
Intermediate pondage scheme which is also a run-of-river type development schemewith a daily regulating capacity in the intermediate pondage instead of the upstreamreservoir; with a power plant of installed capacity at 90 MW.
This scheme has two kinds of schemes as follows;
ENVRONMENTAL I1PACTASSESSMENIT-ESAIMPP V - 3
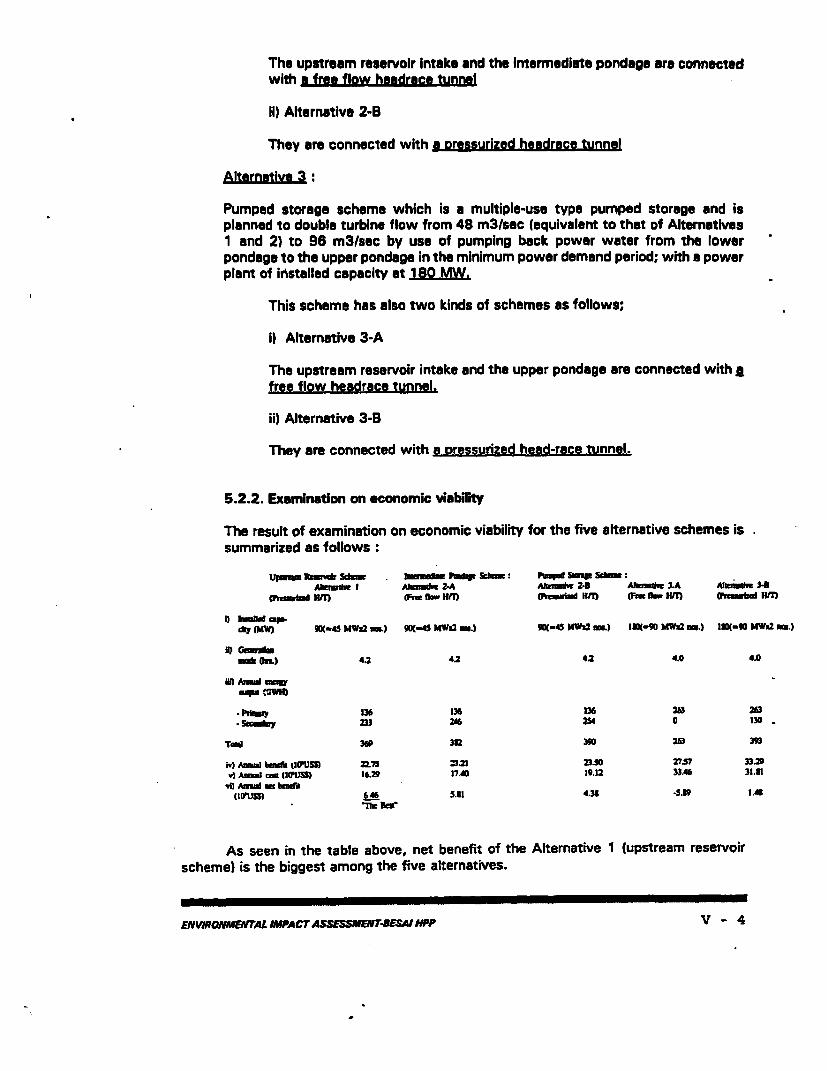
The upstream reservoir intake and the Intermediate pondage are connectedwith a free flow hesdrece tunnel
ii) Alternative 2-B
They are connected with a pressurized heedrece tunnel
Alternative I :
Pumped storage scheme which is a multiple-use type pumped storage and isplanned to double turbine flow from 48 m3/sec (equivalent to that of Alternatives1 and 2) to 96 m3/sec by use of pumping back power water from the lowerpondage to the upper pondage in the minimum power demand period; with a powerplant of iristalled capacity at 180 MW.
This scheme has also two kinds of schemes as follows;
i} Alternative 3-A
The upstream reservoir intake and the upper pondage are connected with JRfree flow headrace tunnel.
ii) Alternative 3-B
They are connected with a oressurized head-race tunnel.
5.2.2. Examination on economic viability
The result of examination on economic viability for the five alternative schemes issummarized as follows:
Updrem ReWd rfm X A. PW kkin Pumped SmW 5cm:AbuUdw I AknudW 2-A AIiadv 24 Al_ncj 3.A AVg1 34
(h- un MM flow HNM 0odr fId) KM (Few OmfH (PWImm KIM
I) llbtt cppcoy Mm 9X-45 M1l2 m) SI0-45 *4- 2.) UC-45 4WX2 mu.) IUR-90 MW1a2 mo.) 10n-90 MW12 M.)
1011 ) 4.2 4.2 2 4.0 40
ifi Aiu -a _
-Pbky 136 136 136 203 263-SeC 5y 233 24 254 0 130
TOl 30 332 350 20 39
iv) Aiua IuI (IOUSS) 2.7 Zt.21 23.50 27.7 33.2v) A=mJ cau (IWISS) 629 137A 19.12 3346 31.1
vl Amenl i 1muit
(IOUSS) 46 5.31 4.3C -5.9 I.A*11 NW
As seen in the table above, net benefit of the Alternative 1 (upstream reservoirscheme) is the biggest among the five alternatives.
EN VIONMEirAL AMPA CT ASSESSMENT-DEW OPP V- 4
As seen in the table above, net benefit of the Alternative 1 (upstream reservoirscheme) is the biggest among the five alternatives.
5.3 Conclusion
As stated above in Sections 5.2. the Alternative 1 of the upstream reservoirscheme with a plant of 90 MW installed capacity islthe best in economical comparisonamong the five conceivable alternative schemes.
Judging from the power demand forecast and the required installed capacity,it is recommended to implement the Besai Hydro electiic Power Project as early as possibletaking its construction period into consideration.
ENVIRONMENrAL IMPACT ASSESSMENr-SESAIMP VP- 5
VI. MTIGATION PLAN
1. Negative environmental effects of construction:
The construction impacts need to be mitigated are as follows:
a). Impact on air quality such as dust, noise etc.
Air quality in the village might be affected by the construction traffic suchas dust or noise. To overcome those problems, several measures will beapplied. The dust from the access road will be suppressed by the waterspraying especially during the dry season. Noise will be suppressed byenforcement to use noise abatement in every construction vehicles. Theexhaust gas emitted by the construction vehicles will disperse and theambient concentration can be neglected in the village. So the impact ofconstruction on air quality is considered a minor one if those measures aretaken properly.
b). Impact of waste disposal.
The waste produce from the project activities can be divided into twocategories. i.e. domestic waste and construction waste.
The domestic waste will be collected and disposed in the special disposalarea far from the village.
The construction activities will produce several type of waste such as metal,paper, wood, soil or concrete aggregate. Metal, paper and wood will berecycled (collected and sold re-use) so no waste on this categories will bedisposed. Soil and concrete aggregate will be used for land reclamation ordisposed in the soil disposal area. Reclamation of soil disposal area will beconducted such as terracering and replanting of trees and grasses.
c). Impact on soil erosion
The erosion rate will be suppressed by several measures:
* Soil trap such as land holes if applicable in such area will bedeveloped to trap the soil transported by the run off.
The water embankment will be avoided to prevent mosquito breedingarea.
Terracering and land reclamation on soil disposal area and on bareland area will be adopted
Grasses or trees will be planted on the bareland caused byconstruction activities and on disposal area after the work finished.
ENVIRONMENTAL IMPACr ASSESSMENT-SESAIHPP VI - 1
d). The impact of construction worker camps.
There is several base camps which will be develop for the constructionlabors and employees. PLN will develop the camps for the PLN Project'semployees and for the project engineers. The contractors will develop theirown camp after the design being approved by the project engineers. Projectproponent will ask that the camps should be provided with the health carefacilities, standard sanitation facilities and sport/entertainment facilities. Thepolyclinic develops by the project proponent and the health care facilitiesdeveloped by the contractors will support with each other. The local peoplemay use those facilities as emergency besides the Health Center(PUSKESMAS) which exists on that area.
There are also benefit opportunities for local people to get the contract oflodging facilities for the outside construction workers.
Since most ot the construction work will be carried out by the contractors, so mostof the mitigation of construction impact will be conducted by the assignedcontractor. PLN as project proponent will enforce the impact mitigation throughdevelopment of several precautions such as:
- To develop the sound design and contracts to accommodate the necessitymitigation.
- To conduct regular coordination among Contractors, Consultants and ProjectProponent.
- To conduct monitoring
- To enforce the sanction to the neglected contractors.
2. Dislocation of people living in construction area and inundation area.
No families living in the inundation zone and construction area. There are 129families which will be affected because part of their land will be used for theconstruction and inundation areas.
The mitigation of the impact to the affected people is described on the resettlementplan as presented on chapter 7.
3. Lost of agricultural and forest land by inundation to form reservoir.
The land which belong to Forestry agency will be replaced with such kind of landto be reforested in ratio of replacement of 1: 1. The area of replacement has notdecided yet, the Forestry Agency will provide the condition of replacement land.
ENVARONMENTAL IMPACTASSESSMENT-SESAIMVPP VI - 2
4. Loss of historic, cultural or aesthetic features by Inundation.
No mitigation measures will be anticipated because there Is no historic, cultural andaesthetic features in the reservoir area.
5. Loss of wildlands and wildlife habitat.
The restriction to disturb the wildlife if exist or show up will be enforced by theproject proponent. The Sign Board and announcement will be provided by theproject proponent. The project has been designed to use the forest land as efficientas possible.
6. Proliferation of aquatic weeds In reservoir and downstream Impairing dam discharge,Irrigation, navigation and fisheries and increasing water loss through transpiration
Vegetation in the reservoir area prior inundation will be cleared to reduce thenutrient source, the aquatic weeds grow less. This will be conducted by the project.
During the power plant operation period the aquatic weeds will be removed inregular basis by the Plant Operation Division in regular basis.
7. Deterioration of water quality in reservoir
Total vegetation clearing will be conducted by Project Proponent to avoiddeterioration of water quality in future reservoir area.
S. Sedimentation of reservoir and loss of storage
To overcome the problem of erosion several agencies will be involved:
- Ministry of Forestry on August 31 1993 issued approval letter to use theprotected area (hutan lindung). Based on this letter project proponent (PLN)should provide a Plan of Reforestation and Land Rehabilitation on uppercatchment area. To response of this letter PLN will provide a fund for thestudy which will be carried out by the consultant. Close collaboration will beconducted with the involved agencies such as Forestry Agency, The Agencyfor Soil Conservation and Rehabilitation, Plantation Agency, Food CropAgency and Local Government.
The plan of Reforestation and Land Rehabilitation on upper catchment areato be approved to BAPPEDA Lampung Province for erosion abatement in theBesai Catchment area. The basic plan will be used for several agencies suchas Forestry Agency. Plantation Agency, Agriculture Agency, Public Worketc. to develop further plan.Forestry Agency basically will be respon.sible in regreening the critical areasbelong to Forestry agency. Plantation agency will be responsible in providingextension information to the coffee farmer which abundant in the upstreamcatchment area. The Agriculture Agency will be responsible in the extensioninformation on dry land farmer. The farmer will be taught on developingfriendly soil conservation agriculture. The Public Work Agency will developchecks dam to control erosion, if necessary.
ENVIWONMENTAL IMPACT ASSESSMENT.BESAINPP VI - 3
The project has been designed to accommodate the high level of erosion, sothe flushing of sediment in reservoir will be conducted regularly. This workwill be carried out by the Power Plant Operation Division.
9. Formation of sediment deposit at reservoir entrance creating backwater effect andflooding and waterlogging upstream.
It is anticipated that this problem will not be significant, since no agricultural ordwelling area near the back water of reservoir. Relatively high flow of water inthose area will prevent of sediment deposition and it also will provide naturalscouring effect of the sediment deposited during low flow. The power plant hasbeen designed to have the sediment trap and flushing facility. Flushing of sedimentin reservoir will be conducted regularly. This work will be carried out by the PowerPlant Operation Division.
10. Scouring of riverbed below dam
The power plant has been designed to overcome the potential scouring effect of thewater release through the sluiceway.
11. Decrease in floodplain (recession) agriculture
There is no irrigation downstream of the dam.No mitigation will be conducted.
12. Salinization of floodplain lands
There is no anticipated impact of Besai HEPP on salinization of floodplain lands. NoMitigation will be conducted.
13. Salt water intrusion in estuary and upstream
There is no impact of Besai HEPP on salt water intrusion in estuary and upstream.No Mitigation will be conducted.
14. Disruption of riverine fisheries due to changes in flow, blocking migration, andchanges in water quality and limnology.
Although the fisheries activities conducted by the people is insignificant, toenhance the positive impact, the fisheries agency will restock the fish in futurereservoir.
15. Snagging of fishing nets in submerged vegetation in reservoir.
Total vegetation clearing will be conducted to avoid snagging of fishing nets insubmerged vegetation in reservoir area. This will be conducted by the project.
ENVMRONMENTAL MIfPACT ASSESSMENVT-SESAIHPP VI - 4
16. Increase of water related diseases.
In case that the mosquito successfully breed in the reservoir, it will be overcome byrestocking of fish that will eat mosquito larvae. This work will be conducted byFisheries Agency.The Public Health center will elaborate to dismiss the rate of malaria prevalence andeducate the people how to control mosquito.
17. Conflicting demands for water use.No mitigation is necessary since there is no conflicting demands for water use.
18. Social disruption and decrease In standard of living of resettled people.
To minimize the negative impact and to enhance the positive impact the projectproponent (bLN) will also initiate several measures as discussed on chapter 7.
19. Environmental degradation from increased pressure on land.
To overcome the problem on possibility of environmental degradation such, thesectoral agency such Agricultural Agency. Plantation Agency and Soil Conservation& Rehabilitation Station and will elaborate to extend the information regarding betterpractice of agriculture work.
20. Disruption/destruction of tribalrindigenous groups.
There is no tribal/indigenous groups in the affected area of Besai HEPP. Nomitigation will be conducted.
21. Increase in humidity and fog locally, creating favorable habitat for Insect diseasevectors (mosquitos).
In case that the mosquito successfully breed in the reservoir, it will be overcome byrestocking of fish that will eat mosquito larvae. This kind of work will be conductedby the Fisheries Agency.
22. Impact of reservoir on drinking water pumped from shallow well.
Since no impact of future reservoir on existing drinking water, no mitigation isanticipated.
23. Impact of dry nrver bed between dam to the power house.
Since no impact is anticipated, so no mitigation will be conducted.
24. Impacts of earthquakes and floods
The induced seismic of the reservoir can be neglected and it will not likely cause thehazard to environment. No mitigation is anticipated.The holding capacity of the reservoir to reduce the floods water from upstream willbe small due to its capacity. Most of the floods will be passed through thesluiceway. No mitigation is anticipated.
ENWVRONMENTAL IMPACT ASSESSMENT8BESAI MPP VI - 5
25. Impact of waste lubricant oal
The waste lubricant oil will be managed in environmentally acceptable manner, Itwill be collected in drums and will be sent to PERTAMIMA (the agency who havethe authority to collect the waste lubricant oil).
26. Impact of transmission lines
The Electric power generated by this project will be transmitted through 150 KVhigh voltage to Bukit Kemuning Sub station. The distance of the Besal powerhouseto Bukit Kemuning is 12,5 Km. It pass the bushes and agrIculture area, and nohouses will be passed by the transmission lines. Although the Impact of thetransio.!ssion lines is considered insignificant, the extension information will beconducted by the project proponent. The irnpact check list Is presented on annex1 &2.
INDIRECT
27. Uncontrolled migration of people Into the are. made possible by access roads andtransmission lines.
The project area is located between the city of LiwB and Kotabumi, and havesmooth surfaced asphalt high way, so this area is relatively an open area.The access road of the project is relatively short 12 Kml and it through agriculturearea.The uncontrolled migration of people into the area will likely not be happened.
The transmission line will be built in parallel with the existing high way to BukitKemuning High way. Based on experience on the recent transmission that there isno uncontrolled migration of people along the transmission lines.No mitigation is anticipated.
28. Environmental problems arising from development made possible by dam (irrigatedagriculture. industries. municipal growth).
Due to tophograpic condition there is no possibility to develop irrigation in this area.Electric energy from Besai HEPP will stimulate the industrial growth away of thisregion, especially near the city of Bandar Lampung. No mitigation measure isanticipated.
ENWRONMEPJAL INPACTASSESSMENT-S4ESW# Vi-6
EXTERNAL
29. Poor land use practices in catchment areas above reservoir resulting in Increasedsiltation and changes In water quality.
The plan of Reforestation and Land Rehabilitation on uppor catchment area prepareby the project proponent is to be approved by BAPPEDA Lampung Province forerosion abatement in the Besai Catchment area. The basic plan will be used forseveral agencies such as Forestry Agency, Plantetion Agency, Agriculture Agency,Public Work etc. to develop further plan.Forestry Agency basically will be responsible in regreening the critical areas belongto Forestry agency. Plantation agency will be responsible in providing extensioninformation to the coffee farmer which abundant in the upstream catchment area.The Agriculture Agency will be responsible in the extension information on dry landfarmer. The farmer will be taught on developing friendly soil conservationagriculture. The Public Work Agency will develop checks dam to control erosion. ifnecessary.
ENVMOlMENJTAL IMPACT ASSESSMENTMDESAAIMAP VI - 7
* , , _~~~~~~~
VI. RESErrLEMENT PLAN
1. OBJECTIVE
a. The Resettlement plan of affected people at Besai HEPP will be useful forproviding the input of parties involved:
* To developed a timebound resettlement plan, bused on the valuationand compensation principles ot land and other assets affected by theproject
* To establish a budget and an implementation schedule
* To identifV organizational responsibilities for implementation
b. To collate the people's desire and develop other alternatives which may beacceptable to the alfected people, this can be developed by the projectproponent and involved agencies.
2. THE AFFECTED PEOPLE
There are 129 families which will be affected by the Besai Project : 88 families willbe affected by the inundation area and the rest (41 families) will be affected by theconstruction area. The construction area belongs to the Forestry Agency and severalpeople have planted coffee trees on it.The list of affected people is presented on Table 7.1 - 7.4.
3. RESETTLEMENT OPTIONS
The suggested options which may be chosen by the affected people:
a). Purchase other agriculture land
The land compensation money may be used to buy other agriculture land inother locations, because the land compensation money is consideredappropriate to buy other land in other location. So by this option. theaffected people may still continue with agricultural activities. PLN will buythe alternative land, with the concurrence of PAPs who might exercise thisoption, and hand it over to them.
b). Trading.
After receiving the compensation money, the people may use their moneyfor the small trading capital as follows:
ENVIRONMENTAL IMPACT ASSESSMENT-BESAIHEPP Vil - 1
Trade In agriculture commodity abundant in that area such as coffeebean, and other annual crops.
* Open small shop
0 Open small restaurant
PLN will ensure appropriate counsalling for those who want it on theirendeavor.
c). Small business
Besides acting ma farmer on the remaining land, the other option is to opensmall business. The land compensation money may be used as a capital forfollowing business activities
a Tran3portation business : Motor bike transportation, small vehicletransportation.
v Workshop
v Tailors
* Home industry such as: handicraft, coffee bean processing, otheragriculture commodity processing.
Catering.
* Animal husbandry: Chicken, goat, sheep, dairy cow.
PLN will ensure appropriate counselling is available for those who want it.
d). Transmigration.
This option will be given to the people who occupy the Forestry land whomay wish to transmigrato. In case the people are willing to move to otherlocation through local transmigration or even to other island, it may beimplemented. The local government of Lampung province through theDepartment of Transmigration and Resettlement of Forest Encroacher has aprogram to resettle of 2000 families per year.
e). Working at Besai HEPP Project
If the affected/local people meet the qualification stated by the project, theyare welcome to send the application to work on the Besai Project. There arethree parties which would needlemployees i.e.:
- PLN (Perusahaan Umum Listrik Negara) as project proponent consistsof two parties.
ENVIROMENTAL IMPACT ASSESSMEI-6ESAWH VII - 2
PLN Boeu Project (Under the coordination of Project Principalof Generation and Transmission of Southern Part of Sumatraat Palembang). This PL'N unit Is responsible in the constructionof Besal Project. There are few positions which may beavailable for the local people if they are qualified. Most of thePLN Beasi project employees will come from other PLNoffices.
PLN Basal Sector lUnder the coordination of PLN Region I atPalembang).This PLN Unit will be responsible on operation andmaintenance of Besel HEPP. There are few position whichmay be available to the local people If they are qualified. Mostof the PLN Besei project employees will come from other PLNoffices.PLN of Basal Sector in operation and maintenance work willneed cooperation of several maintenance contractors, supplierand cleaning service. Those companies will need the skilled,semiskilled and unskilled employees which may be recruitedfrom the local people.
- Contractors and suppliers of Besal HEPP project.
All of the Basail project work will be entrusted to contractors. Variouscontractors of civil, electrical and mechanical works will need skilled,semiskilled and unskilled labor. The people may apply for positionsaccording to their qualifications. Most of the work and positions willbe provided by those contractors.
-. Consultant of Besai HEPP Project.
Most of position of consultant employee will be dominated by thehigh education skill; in other word the position for the unskilled/semi-skilled employee will be very limited here.
f). Education and training
PLN encourages PAPs to improve their standard of living by learning newskills. Training for new skills in vocational training schools will be madeavailable to these PAPs who might opt for such education and training. Thiseffort will facilitate complete restoration of the income level PAPs. PLN willensure this.
4. LAND COMPENSATION PLAN
4.1. Land Compensation Implementation
Land acquisition is implemented pursuant to the Regulation of the KEPPRES(President Decree) No. 55/1993 with the establishment of the Committee of LandAcquisition for the public uses. The amount of the payment of compensation for
ENVIRONMENTAL IMPACT ASSESSMENT4E1 IIH VIli - 3
land and plants will be decided during consultation between the Committee for LendAcquisition and the population whose land Is affected by the project.
The land compensation will be Implemented as per the following procedure:
a. Extension of information to the affected people will be conducted prior to thepayment of compensation. These activities will be conducted by the projectproponent and the land compensation committee.
b. The next stop Is conducting the stacking out of the boundary of the neededland. This activities are being conducted by the project proponent.
c. The detailed mapping of the land holding, Is being done. This activity will beconducted by the land compensation committee.
d. After the maps are ready then the Inventory of crop, vegetation, building orother asset will be conducted. These activities will be conducted by the landcompensation committee.
a. The next step Is preparing the list of the acreage of land holding, lists ofaffected crops and temporary structures. These activities will be conductedby the land compensation committee.
f. The last step is the payment of compensation. The payment will be givendirectly to the land owner through the Bank. Price negotiation will beconducted by the Land compensation Committee and will invite the projectproponent and the. affected people. Compensation payment will beconducted through the local Bank.
The implementation of the procedure stated above will be conducted in severa.stages. It depends on the priority of the land requirement or construction priorities.For example, the land for the access road and base camp will be the first priorityand inundated area will be the last priority.The compensation stages will be conducted as follows:
a. Access road and Base campb. Access road to PowerhouseC. Spoil bank No. 1 - 7d. Powerhouse, Surge tank, Intake dama. Temporary building yardf. Access road to work audit No 1-3. Dam site and Surge Tankg. Inundated areah. Forestry replacement land.
4.2 Land compensation organization/supervision
The Land Compensation Committee has been established by The Governor ofLampung Province. The committee will be chaired by Bupati (Head of District) WestLampung and North Lampung. The committee consists of:
ENVRONMEITAL IMPACT ASSESSMENE-BESAI tEPP VIl - 4
b
1. Bupati (Head of West Lampung and North Lampung Dlstrict)2. The Head of Agrurian Affairs3. The Head of Lund & Building Tax Services4. The Agency of Local Government which responsible on Building aspects.5. The Agency of Local Government which responsible on Agriculture services6. The Head of Sub Districts7. The Head of Villages
The secretary of the committee but not as a member:
1. The Head of Subdivislon of District Administration2. The Head of Agrarian Affairs Sections
4.3. Allocated budget for Land Compensation
The expenditures of land compensation budget can be divided into three categories:
a. Land compensation payment.
The compensation payment of the land asset will be three categories:- Land.- Vegetation/crop- Building
The payment will follow the standard issued by the Bupati Decree.
The allocation money for this payment is approximatelyRp. 2,261,510,000,-. This money will come from PLN.
b. Honorarium and expenditures of the Land Compensation Committee.
The allocation money for this expenditures is approximately Rp.73,005.000.This money will come from PLN.
C. Replacement land of the Forestry Land
The allocation money for this expenditures is approximatelyRp.1,925,500,000. This money will come from PLN.
d. Land Boundary stacking out
The allocation money for this expenditures is approximatelyRp.660,000,000. This money will come from PLN.
The semi detailed land compensation cost is presented in the end of this chapter.
4.4. Schedule of Land Compensation
The Land compensation schedule is presented in the following of this page (Figure7.1).
ENlONMEA,TAL IMPACTASSESSMENT-5ESAI EW V I- 5
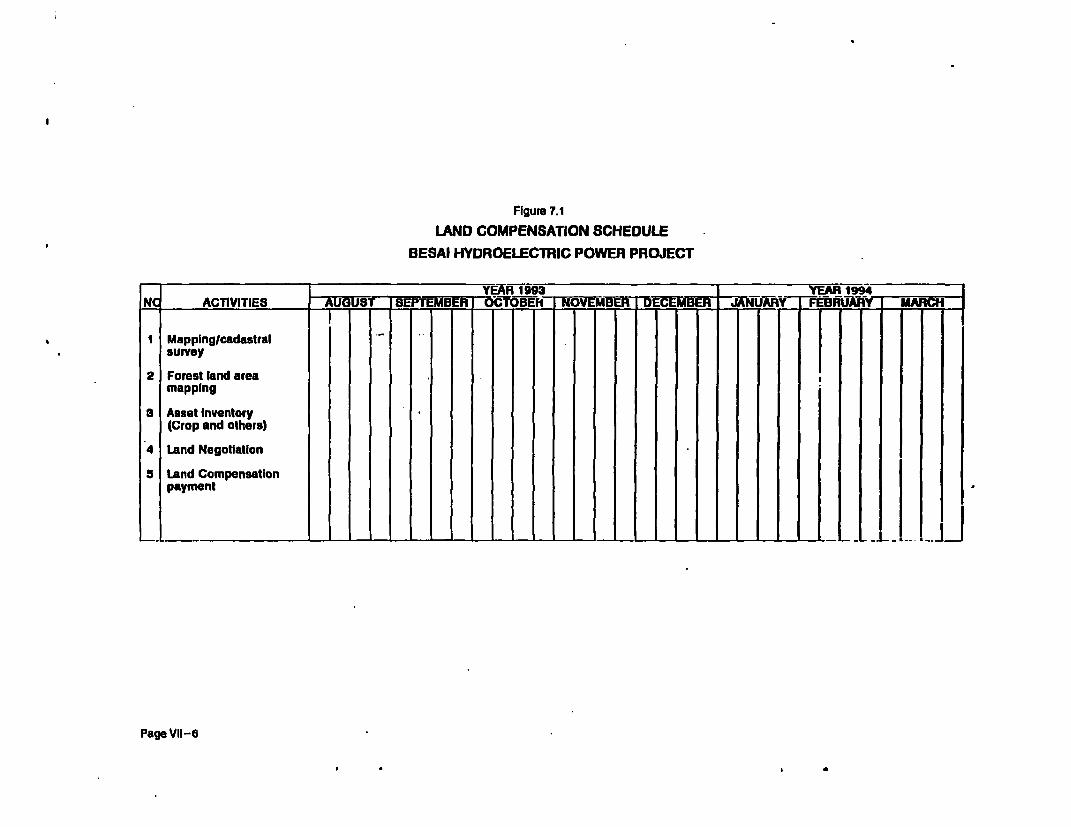
Figure 7.1
LAND COMPENSATION SCHEDULE
BESAI HYDROELECTRIC POWER PROJECT
______ ______ 993YEAR 194 _ _ _ _
NC ACTIVITIES AU3US IBET M R _ NOVEMB DECEMB R jANUY F _
I Mapplnglcadastralsurvey
2 Forest land areamapping
3 Asset inventory(Crap and others)
4 Land Negotiation
5 Land Compensationpayment
Page VIl-6
a
5. RESETTLEMENT PLAN
The resettlement plan will help the affected people to improve the condition of theirsource of income which may be disturbed by the project because part of their landor even entire land in some cases will be compensated.
5.1. Implementation of the Resettlement Plan:
a). Purchase other agriculture land
The implementation of this option will be assisted by the ResettlementImplementation Team. Based on the last negotiation between the LandCompensation Committee and the PAP's, there is no PAP's who opt for land.All of the PAP's prefer to arrange the purchasing of the new land by themselves. But the project proponent through the Land compensation Committeewill solve to entertaining such request of PAP's if anybody from them shouldchange their mind and ask for land compensation.
b). Transmigration.
Transmigration will be encouraged to the affected people who belong to thecategory of forest encroacher. The implementation agency will be theDepartment of Transmigration and Forest Encroacher Resettlement and it willbe coordinated by the Resettlement Implementation Team.
c). Training on several skills
The training will be encouraged to the people who lost partly or totally oftheir income, because of land compensation. The implementation agency willbe conducted by the Department of Manpower (Industrial Training Stationand Agricultural Training Station) and it will be coordinated by theResettlement Implementation Team.
Implementation of the resettlement plan is already in progress. PLN will ensure thatit is completed in a phased manner well ahead of the actual construction of theproposed hydroelectric project.
5.2. Resettlement organization/supervision.
The resettlement work will be implemented by The Resettlement ImplementationTeam. The team will chaired be by Bupati (Head of District) West Lampung andNorth Lampung. The team will consist of:
1. The Agrarian Affairs2. The Department of Transmigration and Resettlement of forest encroacher
ENVWRONMENrAL MIPACTASSESSMENT-BESAI HEM VIl - 7
3. The Head of Subdivilsion of Governmentation4. The Department of Man Power5. The Industrial agency6. The Food Crop Agency7. The Plantation Agency8. The Forestry Agency9. The Department of Social10. The Head of Sub Districts11. The Head of Villages
Because the Resettlement Implementation Team will consist of two districts, it willbe coordinated by the Provincial Authorities IChief ol Governor of DevelopmentAffairs) or Head of Planning Coordinating Board (BAPPEDA) of Lampung provinces.
5.3. The counselling/assistance and grievance mechanism
The implementation team will provide the counselling facilities for the PAP's. Thesectoral agencies which involved in the Resettlement Implementation Team willassist the PAP's in developing of their desire program. The implementation team willprovide the limited/emergency financial assistance for the PAP's. The creditassistance to get the capital to run the business will also be provided by theResettlement Implementation Team.
The grievance of the PAP's will be channelled through the informal leader of thePAP's or the head of the village and it will be conveyed to the ResettlementImplementation Team and Land Compensation Committee. The committee will sittogether with PLN as project proponent and discuss to solve the problem. If theResettlement Implementation Team and Land Compensation Committee can notsolve the problem, it will be handed over by the Provincial Government level(Governor of Lampung Province). If the result of the problem solving is notsatisfactorily for the PAP's, it will be discuss in the interdepartmental level whichwill be coordinated by the National Coordinating Board (BAPPENAS).
5.4. Allocated budget for Resettlement
The allocated budget for resettlement will be as follows:
a. Training cost for about 120 persons.
The allocation money for this expenditures is approximatelyRp. 244,000,000,-. This money will be provided by PLN.
ENVWRONMETAL IMPACT ASSESSMEJT-BESAI HEPP Vil - 8
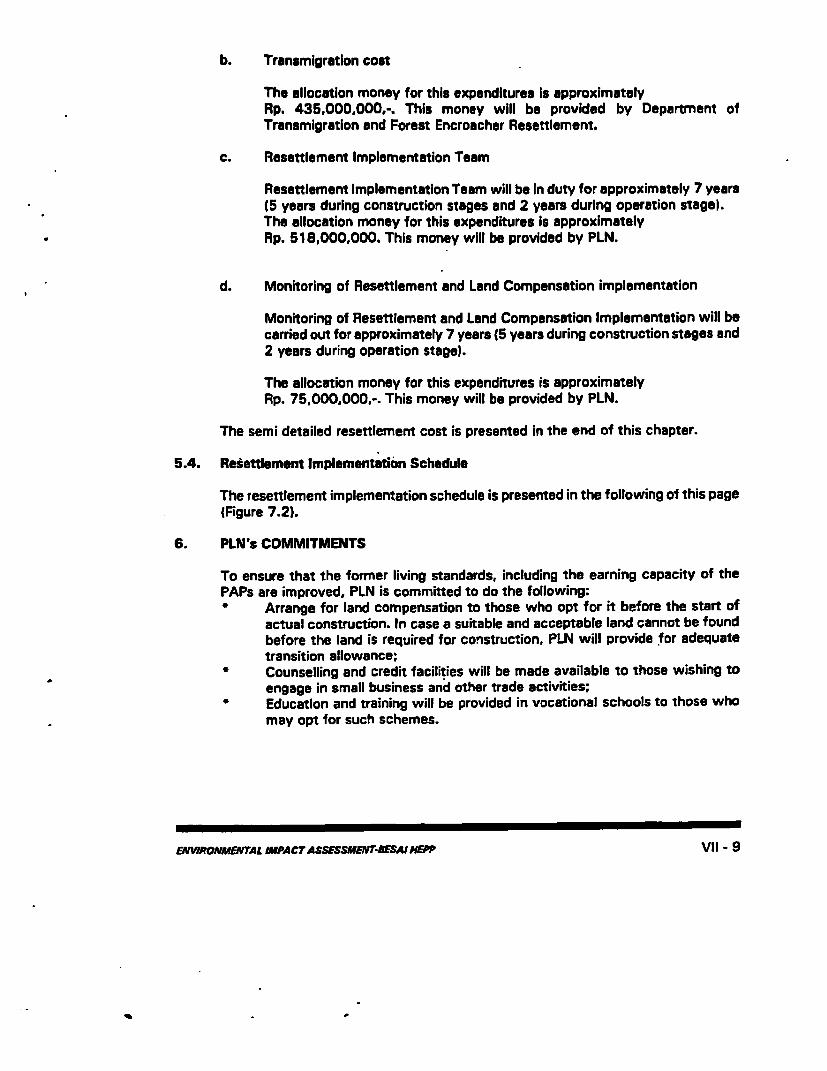
b. Transmigration cost
The allocation money for this expenditures is approximatelyRp. 435,000.000,-. This money will be provided by Department ofTransmigration and Forest Encroacher Resettlement.
c. Resettlement Implementation Team
Resettlement Implementation Team will be In duty for approximately 7 years(5 years during construction stages and 2 years during operation stage}.The allocation money for this expenditures is approximatelyRp. 518,000,000. This money will be provided by PLN.
d. Monitoring of Resettlement and Land Compensation implementation
Monitoring of Resettlement and Land Compensation Implementation will becarried out for approximately 7 years (5 years during construction stages and2 years during operation stage).
The allocation money for this expenditures is approximatelyRp. 75.000,000,-. This money will be provided by PLN.
The semi detailed resettlement cost is presented in the end of this chapter.
5.4. Resettlement Implementation Schedule
The resettlement implementation schedule is presented in the following of this page(Figure 7.2).
6. PLN's COMMITMENTS
To ensure that the former living standards, including the earning capacity of thePAPs are improved, PLN is committed to do the following:
Arrange for land compensation to those who opt for it before the start ofactual construction. In case a suitable and acceptable land cannot be foundbefore the land is required for construction, PLN will provide for adequatetransition allowance;
* Counselling and credit facilities will be made available to those wishing toengage in small business and other trade activities;Education and training will be provided in vocational schools to those whomay opt for such schemes.
ENVIRONMENTAL IMPACTASSESSMENr-BESAIEPP VIl - 9
7. MONITORING
Monitoring of the resettlement and land compensation processes and Impacts willbe carried out by independent agency, i.e. local university in cooperation with localNon Government Organizatlon (NGO).Reporting will be made twice a year during construction stage (5 years) and twoyears after the project completion. PLN should send the monitoring Reports to theWorld Bunk, Washington (with copy to tha Resident Mission of the Bank at Jakarta)within two weeks of the relevant period.
ENVIRONMENTAL IMPACTASSESSMEAITESAMHEPP Vil - 10
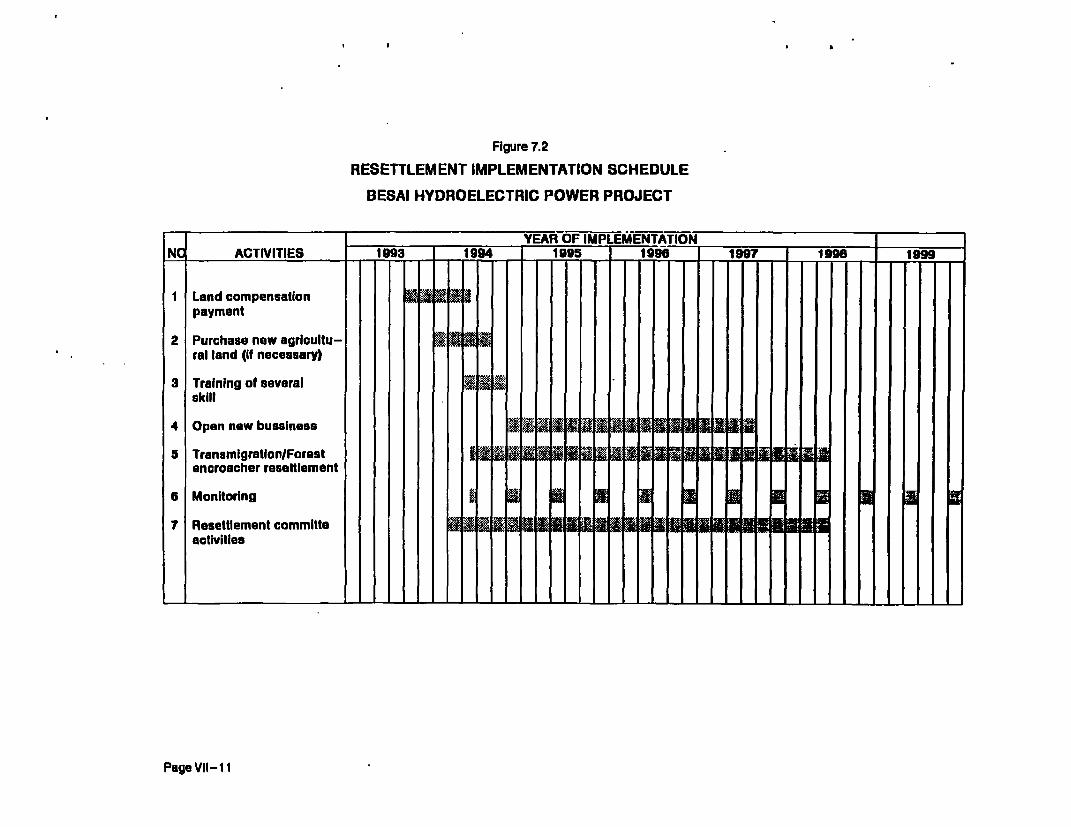
Figure 7.2
RESETTLEMENT IMPLEMENTATION SCHEDULE
BESAI HYDROELECTRIC POWER PROJECT
_________ _______ YEAi OF IMPLEMENTATIONNC ACTIVITIES - 1993 1994 1 1995 1 1996 - 1997 1998 1999
1 Land compensation IN Itspayment
2 Purchase new agricultu-ral land (if necessary)
3 Training of severalskill
4 Open new bussiness X I I i 11 1
5 Tranumigration/Forest encroacher resettlement
6 Monitoring
7 Resettlementcommitte 9
activities
Page VIl-11
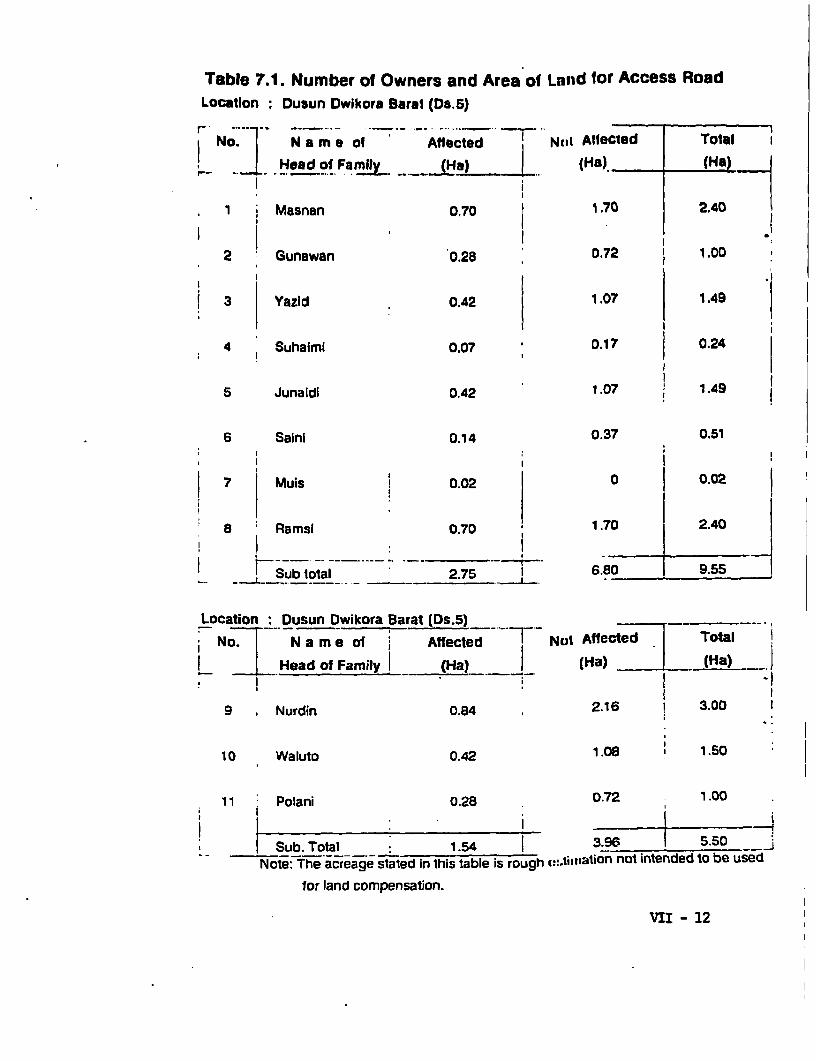
Table 7.1. Number of Owners and Area of Lntd for Access RoadLocation : Dusun Dwikora Barat (Ds.5)
No. N a m e of Atlected Notl Affecled Total
_ Head of Fa (H) (Ha). (Ha)
1 Masnan 0.70 1.70 2.40
2 Gunawan 0.28 0.72 j 1.00
1 3 V Yazld 0.42 1.07 1.49
4 l Suhalmi 0.07 0.17 0.24
5 Junaidi 0.42 1.07 1.49
5 Saini 0.14 0.37 0.51
IiII I
7 Muis 0.02 0 0.02
8 Ramsi 0.70 1.70 2.40*~~~~~~~~ ____ I
l l Sub total 2.75 1 6.80 9.55
Location Dusun Dwikora Barat (Ds.5)
No. N a me of Affected I Not Affected Total
__ Head of Family I (Ha) (Ha)_ (Ha)
9 Nurdin 0.84 2.16 1 3.00
10 Waluto 0.42 1.08 1.50
11 Polani 0.28 0.72 1.00
i : ii .
Sub. Total 1.54 3.96 1 5.50 jNote: The acreage stated in this table is rough :.isitafl not intended to be used
for land compensation.
VII - 12
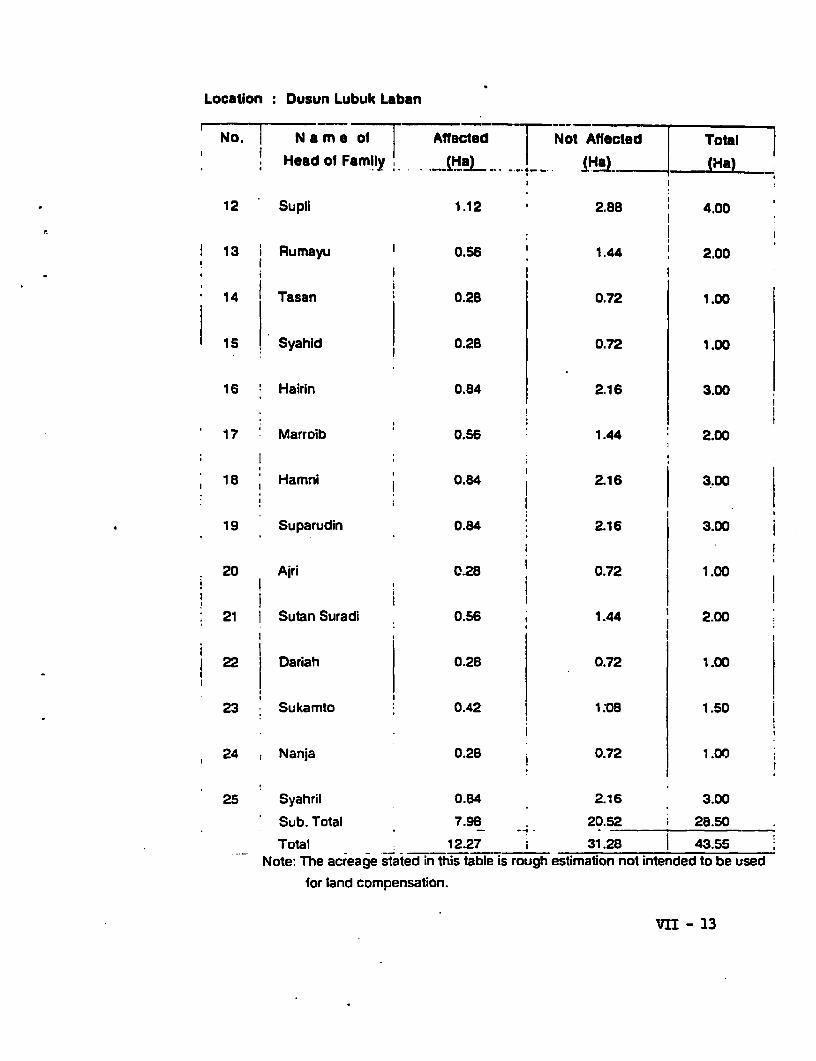
Location: Dusun Lubuk Laban
No. Name of Affected lNot Affectd Total
Head of Family, (Ha)
12 Supli 1.12 2.88 I 4.00
13 j Rumayu 0.56 1.44 2.00
* 14 1 Tasan 0.28 0.72 1.00
1S Syahid 0.28 0.72 1.00
16 Hairin 0.84 2.16 3.00
17 Marroib 0.56 1.44 2.00
18 Hamni 0.84 2.16 3.00
19 Suparudin 0.84 2.16 3.D00
20 Ajri 0.28 0.72 1.00
21 I Sutan Suradi 0.56 1.44 2.00
22 Dariah 0.28 0.72 1.00
23 Sukamto 0.42 1:08 1.50
24 Nanja 0.28 0.72 1.00
25 Syahril 0.84 2.16 3.00Sub. Total 7.98 20.52 28.50
Total 12.27 i 31.28 I 43.55Note: The acreage stated in this table is rough estimation not intended to be used
for land compensation.
VII - 13
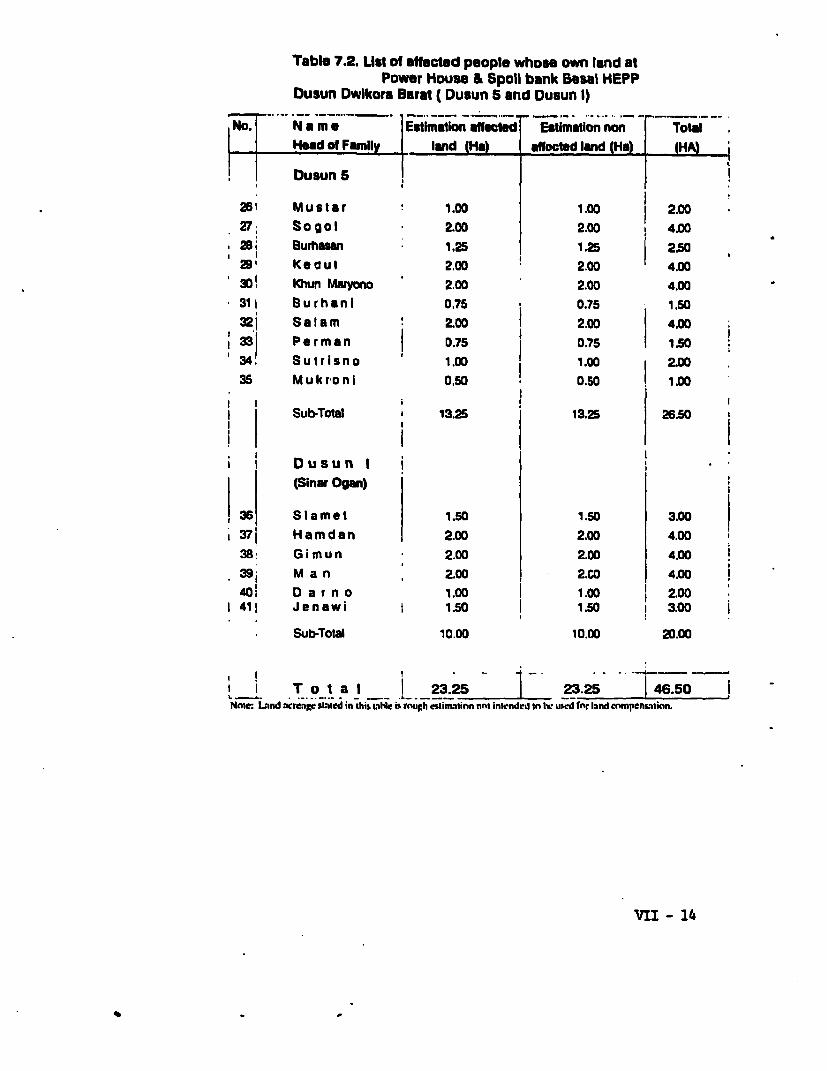
Table 7.2. Ust of affected people whose own land atPower House & Spoil bank Besal HEPP
Dusun Dwikora Buat ( Dusun 5 and Dusun 1)
No. i N * rn e Estimamion aected Estimtlion non TotalHead of Family land (Ha) affocted land (Ha) (HA)
Dusun 5 f26? Mustar 1.00 1.00 n2.0027, Sogol 2.00 2.00 4.0028 1 Burhrn 1.25 1.25 2.5029t Keoul 2.00 2.00 4.00301 Khun Maryono 2.00 2.00 4.0031I Burhan1 0.75 0.75 1.5032 j Slam 2.00 2.00 4.00331 Perman 0.75 0.75 IS034 . Sutrisno 1.00 1.00 2.0035 Mukroni 0.50 0.50 1.00
Sub-Total 13.25 13.25 26.50
i t Dusun I(Sinar Ogan)
36 Slamet 1.50 1.50 3.00
37 Hamdan 2.00 2.00 4.0038 G i m u n 2.00 2.00 4.0039 M a n , 2.00 2.CO 4.00401 D a r n o 1.00 I 1.00 2.00411 Jenawi I 1.50 ! 1.50 I 3.00
Sub-Total 10.00 10.00 20.00
I T o t a I 23.25 23.25 i 46.50Nnte: Lind mcreage sinted in this Lihle is, mugh esimAtinn not intended in h. used far land cnmpensatinn.
ViI - 14
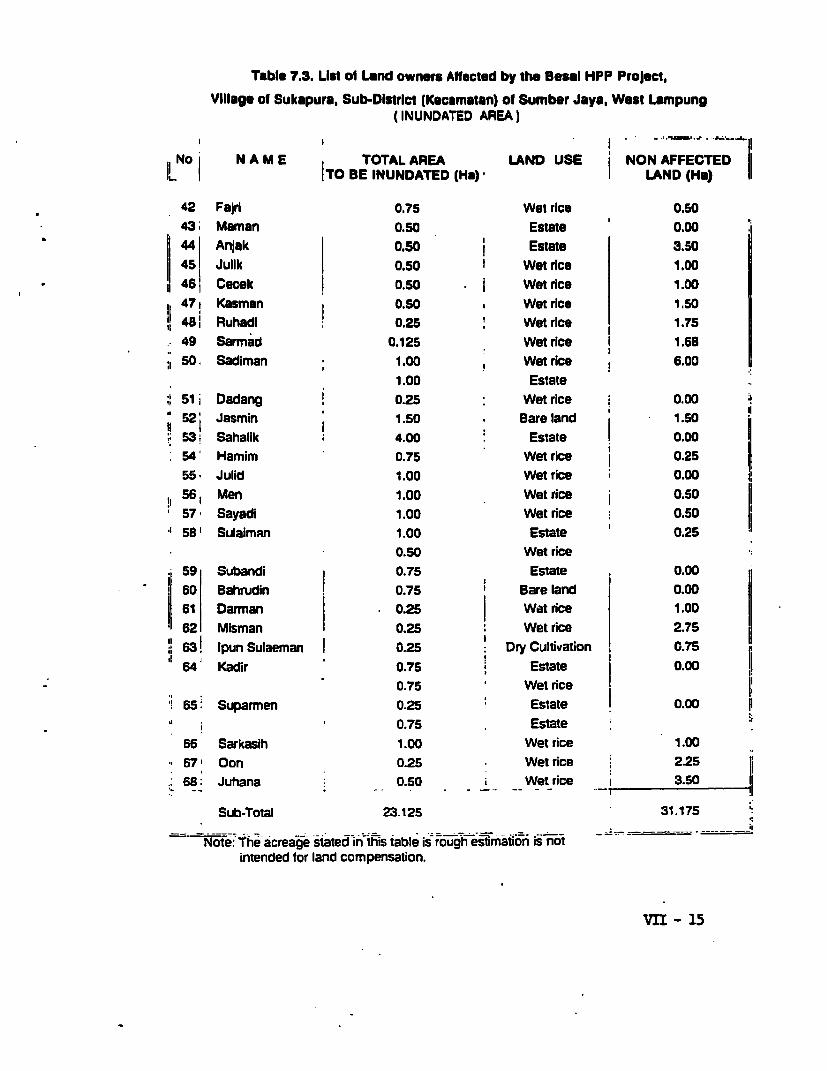
Table 7.3. List of Land owners Affected by the Besal HPP Project,Village of Sukapurs, Sub-District (Kecamatan) of Sumber Jaya, West Lampung
(INUNDATED AREA)
No N A M E TOTAL AREA LAND USE j NON AFFECTEDIL 1 ITO BE INUNDATED (Ha) I LAND (Ha)
42 Fairn 0.75 Wet rice 0.50431 Maman 0.50 Estate 0.0044 Anjak 0.50 Estate 3.5045 Julik 0.50 Wet rice 1.00
l 46 Cecok M S.so . Wet rice 1.001 47 Kasman 0.50 * Wet rice 1.50
48 Ruhadi 0.25 Wet rice 1.7549 Sarmad 0.125 Wet rice 1 1.6850, Sadiman 1.00 Wet rice 6.00
1.00 Estate51 i Dadang i 0.25 Wet rice 0.0052j Jasmin 1.50 , Bare land 1.5053; Sahalik . 4.00 Estate ! 0.0054' Hamim 0.75 Wet rice 0.2555. Julid 1.00 Wet rice 0.00561 Men 1.00 Wet rice 0.5057 Sayadi 1.00 Wet rice 0.5058' Sulaiman 1.00 Estate 0.25
0.50 Wet rice59 Subandi 1 0.75 Estate 0.0060 Bahrudin I 0.75 ' Bare land 0.061 Darrnan | 0.25 Wet rice 1.0062 Misman 0.25 Wet rice 2.7563! Ipun Sulaeman I 0.25 Dry Cultivation 0.7564 Kadir 0.75 Estate 0.00
0.75 Wet rice65: Suparmen 0.25 Estate 0.00
0.75 Estate66 Sarkasih 1.00 Wet rice 1.0067 Oon 0.25 Wet rice 2.2568: Juhana 0.50 i Wet rice i 3.50
Sub-Total 23.125 31.175
Note: The acreage stated in this table is rough es-timation is notintended tor land compensation.
VII - 15
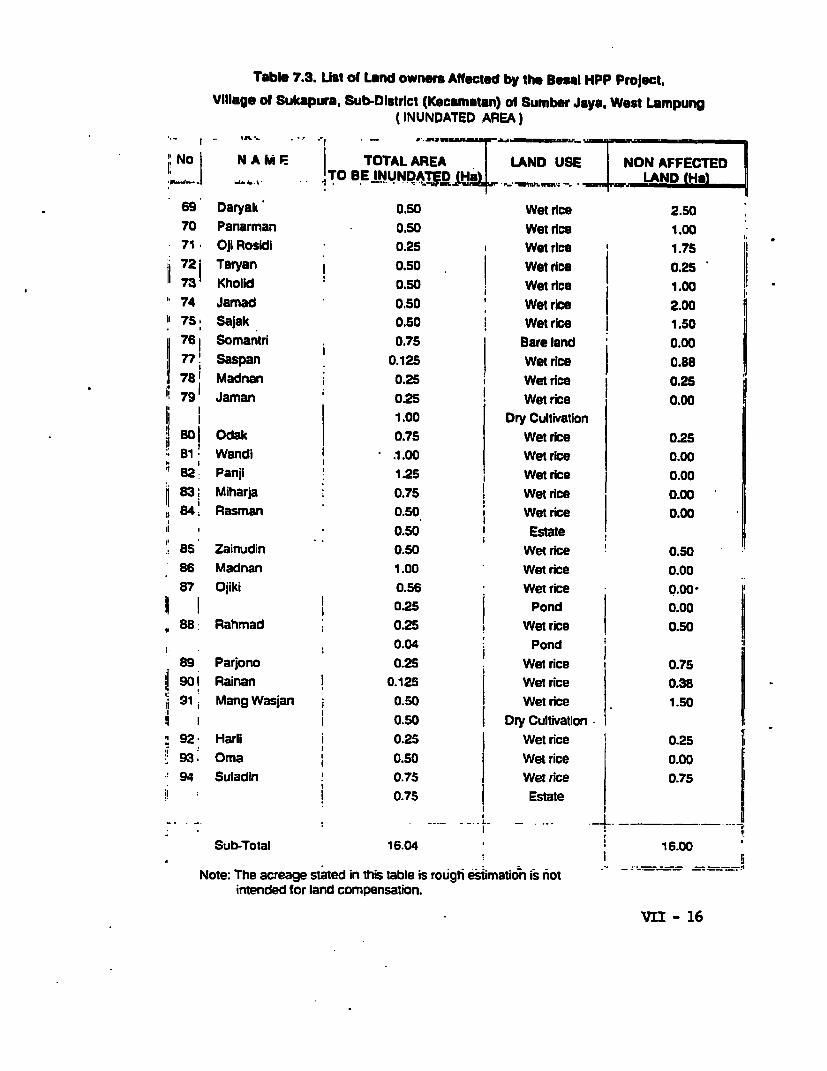
Table 7.3. List of Land owner Affected by the Bega HPP Project.
Village ol Sukapura, Sub-District (Kecamatan) of Sumber Jaya, West Lampung(INUNDATED AREA)
No N A M F | TOTAL AREA LAND USE1.1N AFFECTED*.4 | ,q, ,. stTO BE INUNDATEDJj) * LAND (H.d
69 Daryak 0.50 Wet rice 2.5070 Panarman 0.50 Wet rice 1.0071. Opl Rosidi 0.25 Wet rice 1.75721 Taryan 0 o.so Wet rice 0.2573 Khoiid 0.50 Wet rice 1.0074 Jamad 0.50 Wet rice 2.00
h75: Sajak: 0.50 Wet rice I 1.5076 i Somantri . 0.75 Bare land 0.0077' Saspan 0.125 Wet rice | 0.88781 Madnan 0.25 Wet rice 0.2579 Jaman 0.25 Wet rice 0.00
1.00 Dry Cultivation|B0! Odak 0.75 Wet rice 0.25
81 Wandi . .1.00 Wet rice 0.0082 Panji 1.25 Wet rice 0.0083; Miharja i 0.75 ! Wet rice 0.0084; Rasman 0.50 Wet rice 0.00
, 0 o.o0 Estate85 Zainudin 0.50 Wet rice 0.5086 Madnan 1.00 Wet rice 0.0087 Ojiki 0.56 Wet rice 0.00-
I I t 0.25 Pond 0.00
0.04 Pond89 Parjono 0.25 Wet rice 0.75
il 90 i Rainan 0.125 j Wet rice 0.38l 91i Mang Wasian 0.50 Wet rice 1.50
i i 1 0.50 | Dry Cultivation92: Harli 0.25 Wet rice 0.2593. Oma 0.50 Wet rice 0.0094 Suladin 0.75 Wet rice 0.75
0.75 ! Estate
Sub-Total 16.04 . 16.00
Note: The acreage stated in this table is rough estimation i-s not -- -
intended for land compensation.
VII - 16
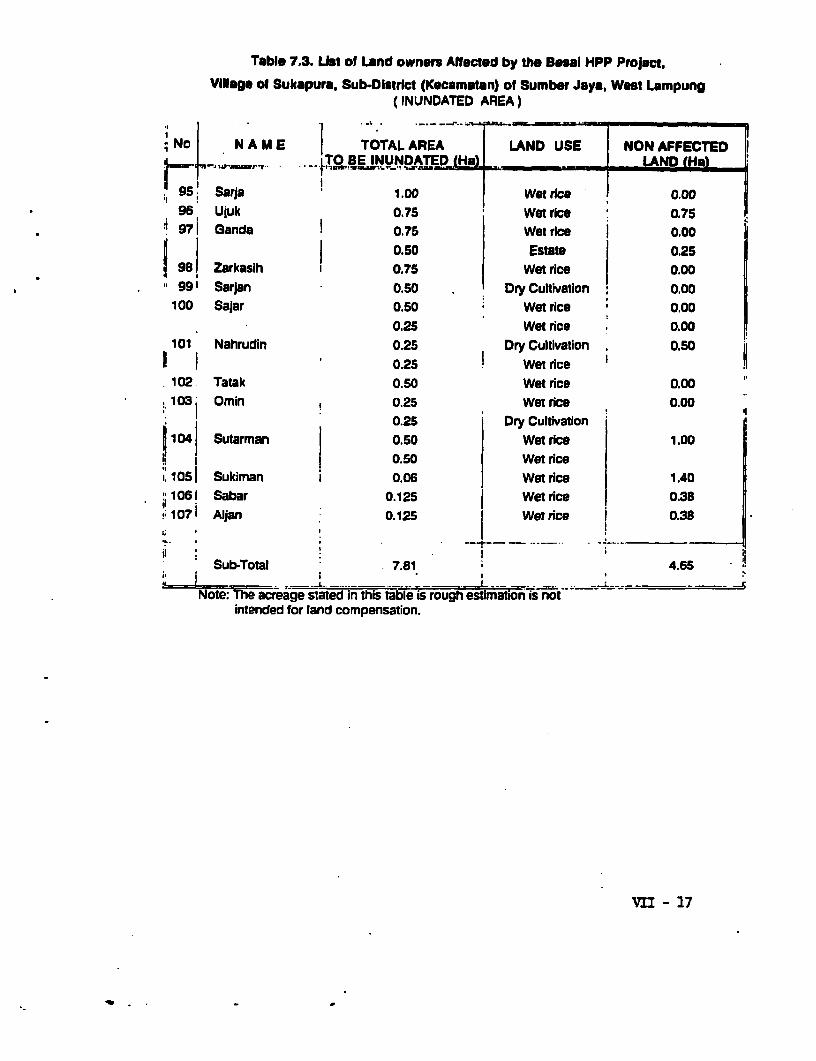
Table 7.3. List of Land owners Affected by the Besal HPP Project,
Village of Sukapura. Sub-District (Kecamatan) of Sumber Jaya, West Lampung(INUNDATED AREA)
No N N A M E TOTAL AREA LAND USE NON AFFECTED-i .TO BE INUNDAED fS _ ._,,,, LAND (Hal
;! 95, Sar,a ! 1.00 Wet rice o.o096 Ujuk 0.75 Wet rice 0.75
1 971 Ganda ! 0.75 Wet rice i ° °
|I I 0.50 Estate 0,25981 Zarkasih I 0.75 Wet rice 0.0099' Sardan 0.50 Dry Cultivation 0.00
100 Salar 0.50 Wet rice ' 0.000.25 Wet rice . 0.00
101 Nahrudin 0.25 Dry Cultivation . 0.50B 1 0.25 Wet rice
102 Tatak 0.50 Wet rice 0.00.103 Omin! 0.25 Wet rice 0.00
0.25 Dry Cultivation104 Sutarman 0.50 Wet rice 1.00
0.50 Wet rice,1051 Sukiman 0.06 Wet rice 1.40,106! Sabar 0.125 Wet rice 0.38!;1071 Alijan 0.125 Wet rice 0.38
Sub-Total 7.81 4.65
Note: The acreage stated in this table is rough estimation is notintended for land compensation.
VII - 17
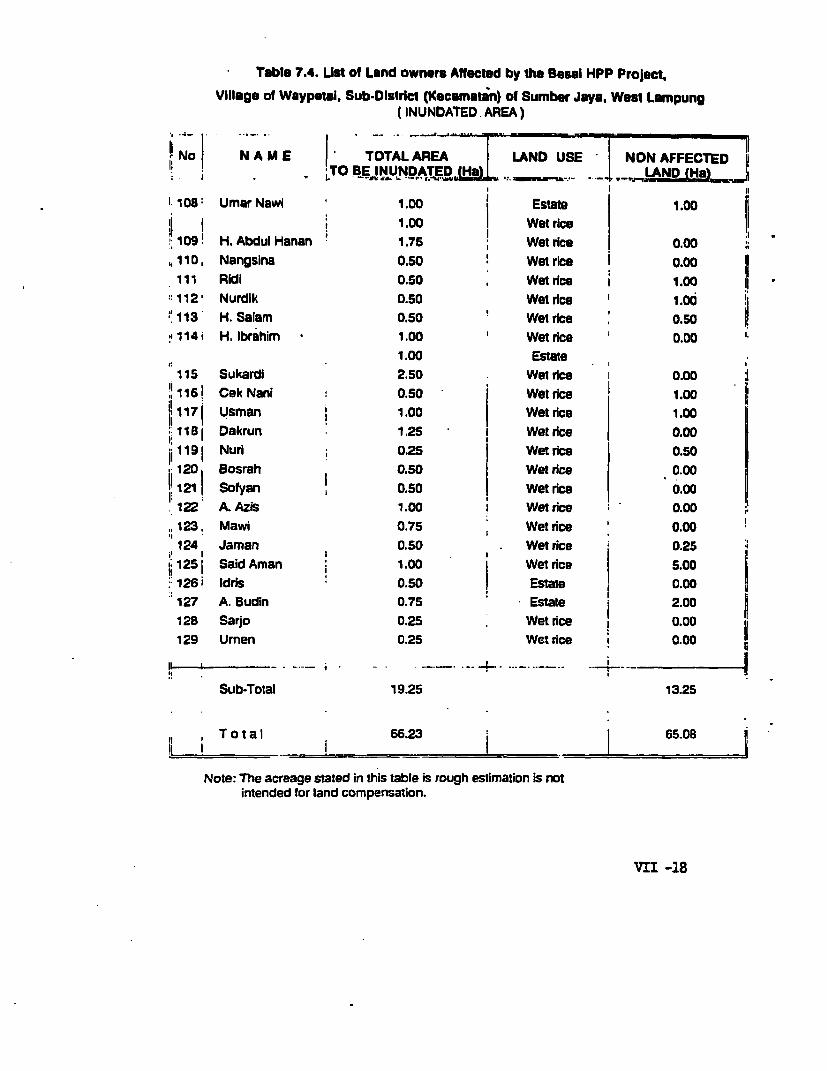
Table 7.4. List of Lend owners Affected by the Besal HPP Project.
Village of Waypetal, Sub-Dlsirict (Kecamatan) of Sumber Jays, Wesl Lampung
(INUNDATED. AREA)
, No | NAME TOTALAREA LAND U NON AFFECTED'TO BE INUNDU AT^E0,_,. _ .uuI
I. 108: Umar Nawi 1.00 Estate 1.00
| i , ~~~~ ~ ~~~~1.00 | Wet rice
109! H. Abdul Hanan 1.75 Wet rice 0.00
,110, Nangsina 0.50 Wet rice I 0.00
111 Ridl 0.50 ; Wet rice I 1.00
:112' Nurdik 0.50 Wet rice s 1.00S 113 H. Salam 0.50 Wet rice 0.50
'114i H. Ibrahim 1.00 Wetrice 0.00
1.00 Estate
115 Sukardl 2.50 Wet rce I 0.00
,!1161 Cek Nani : 0.50 Wetrice 1.001171 Usman 1.00 Wet rice 1.00
11t1 Dakrun 1.25 Wet rice 0.00
1i i 19 1Nuri 0.25 I Wet rice 0.50
.120 Bosrah 0.50 Wet rice 0.00
1211 Sofyan 0.50 Wet rice 0.00122 A.Azis 1.00 Wetrice 0.00
,123, Mawi 0.75 Wet rice ' 0.00
124 Jaman 0.50 . Wet rice 0.25il I ,-
j 1251 Said Aman : 1.00 Wet rice 5.00
:1263 idris 0.50 Estate 0.00
127 A. Budin 0.75 Estate 2.00
128 Sarjo 0.25 Wet rice 0.00
129 Urnen 0.25 "Wet rice 0.00
II I . . -.--- t -. +.-----..-.--. +... .
Sub-Total 19.25 13.25
Total 66.23 65.018!l I _ I _ ,I.
Note: The acreage stated in this table is rough estirnation is notintended for land compensation.
VII -18
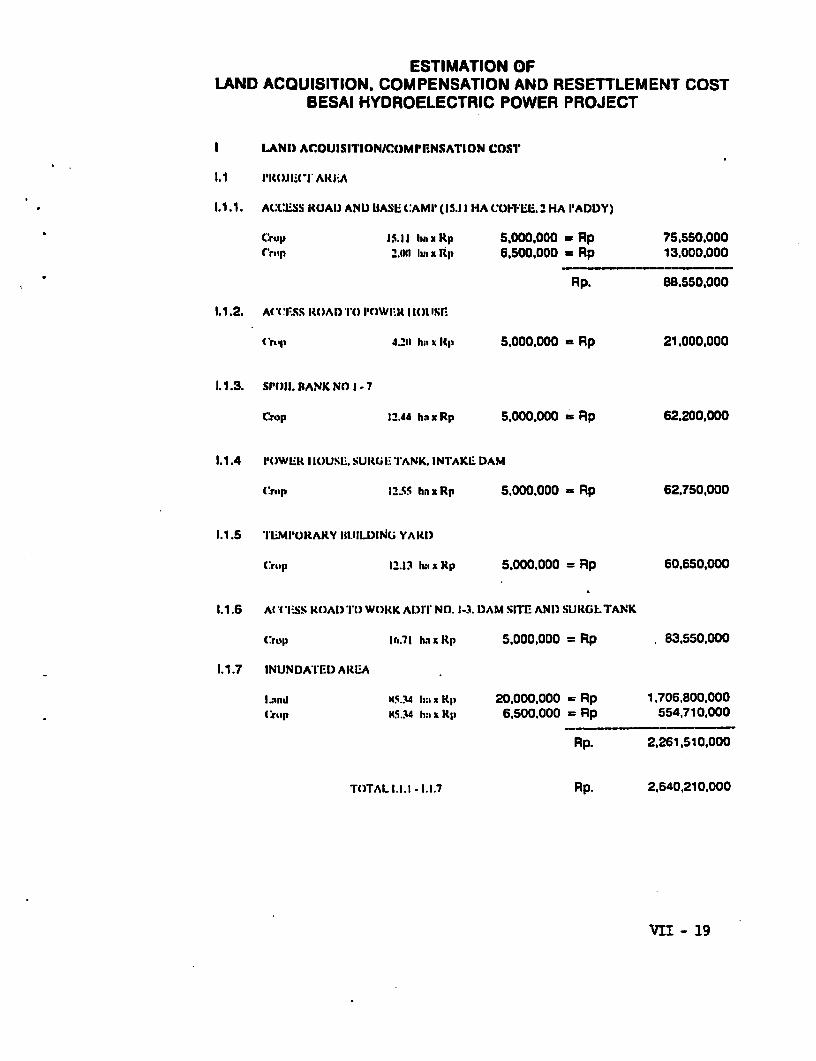
ESTIMATION OFLAND ACQUISITION, COMPENSATION AND RESETTLEMENT COST
BESAI HYDROELECTRIC POWER PROJECT
I LAND ACOUISITION/COMPrNSA`Tl'ION COSIT
II R0-IiI -lARE;A
1.1.1. ACCiESS ROAD ANl) BASE CAMI' (15.1 I llA COIVILi. 2 HA l'ADDY)
C:rup 15.11 ha nx Rp 5,000,000 - Rp 75.550.000(-rstp ZIN 11:1 x fllp 6,500,000 - Rp 13,000.000
Rp. 8B.550,000
1.1.2. A('ll '.S5 lRoAl)'l' I'n}WiRI 10 IS[)XE
C'ri.p 4.20 ha x Iiz 5,000,000 - Rp 21.000.000
1. 1.3. SPOIl. RANX NO 1- 7
Crop 12.44 ha x Rp 5,000.000 = Rp 62.200,000
1.1.4 t)OWER imUSE. SUROJETIANK. INTAKE DAM
Crop 12.55 ha x Rp 5,000.000 - Rp 62.750,000
1.1.5 I'LMI'URAI&Y IBUILDING YARI)
trUp 12.13 II x lItp 5.000.000 = Rp 60,650,000
1.1.6 Al *( I:.SS ROAI) DIT) WORK ADIT NO. 1-3. DAM SIlE AND SURGLTANK
C:rop t.71 I hla x Rp 5,000,000 = Rp 83,550.000
1.1.7 INUNDATIED AREA
Land N5.34 Im x Rp 20.000,000 = Rp 1.706,800,000Crasp K..14. h: x Kp3 6.500.000 = Rp 554,710.000
Rp. 2,261,510,000
TOTAL 1.1.1 -1.1.7 Rp. 2,640,210,000
VII - 19
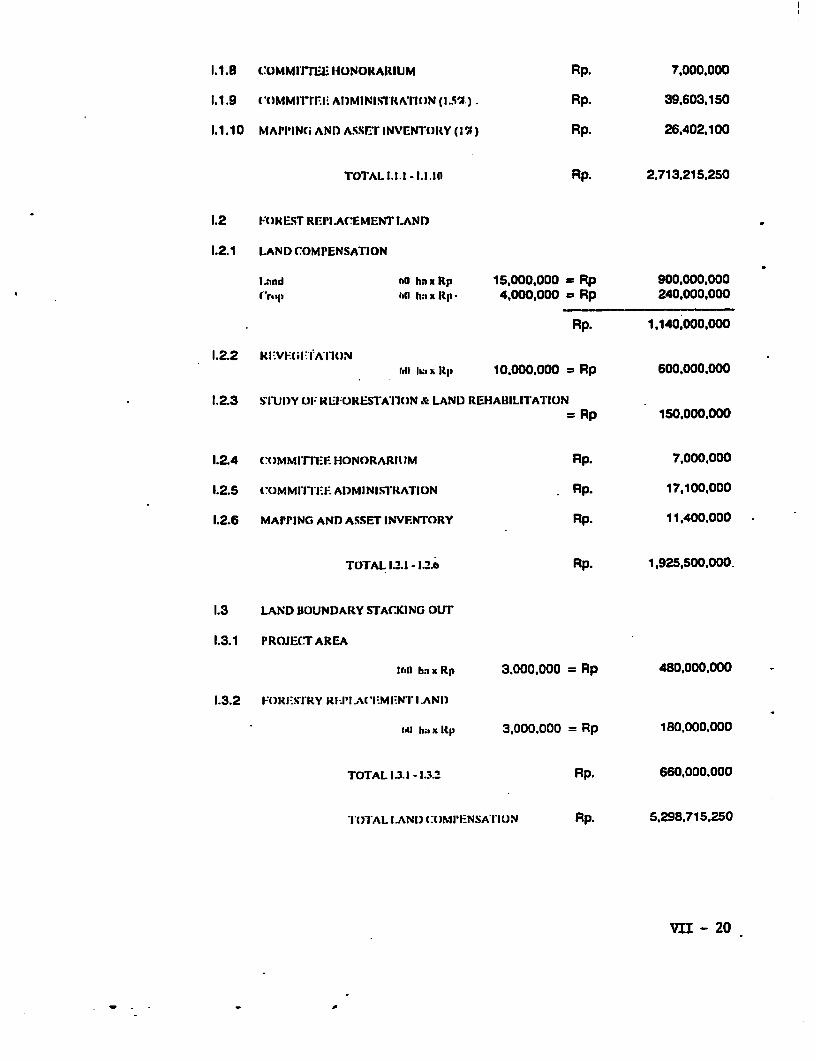
i.1.8 :oMMInLEE HONO01ARIUM Rp. 7,000.000
1.1.9 cMM1.rrIlI^ ADMINISTRlATION (1.5%Z). Rp. 39,603,150
1.1.10 MArPPING AND ASSET INVENTORY (1') Rp. 26,402,100
TOT-AL 1.1.1 -1.1.In Rp. 2,713,215,250
1.2 I:OFI(ST REP'L.AC:EMENT LAND
1.2.1 LAND rOMPENSATION
Ijind nil hn x Rp 15.000,000 m Rp 900,000,000(t.O hWe x Ri- 4.000,000 a Rp 240,000,000
Rp. 1,140.000.000
1.2.2 Rl.VF.li.FAION'.o ii.. R1l 10,000.000 = Rp 600.000,000
1.2.3 SIUU)Y Ut: REIFURESTATII)N a LAND REHABILITATION- Rp 150,000,000
1.2.4 c:CiMMirlaI 1H0NORARIIIM Rp. 7,000,000
1.2.5 (.OMMI I-I I.I-. ADMMI NI'RkAriON Rp. 17,100,000
1.2.6 MAPPING AND ASSET INVENTt)RY Rp. 11,400,000
TOTAL 1.2.1 - 12.o Rp. 1,925,500,000.
1.3 LAND IBOUNDARY STACKING OUT
1.3.1 I'ROJECT AREA
I1.1 h: x Rp 3.000,000 = Rp 480.000.000
1.3.2 F0R1-.s-ITRY R-lI'-..ACIlMl-NT I .ANI)
h., x Rp 3,000.000 = Rp 180.000,000
TOTAL 1.3.1 -1.32 Rp. 660,000.000
11)OT AL l.AND (:OMP'ENSATIUN Rp. 5,298,715.250
VII - 20
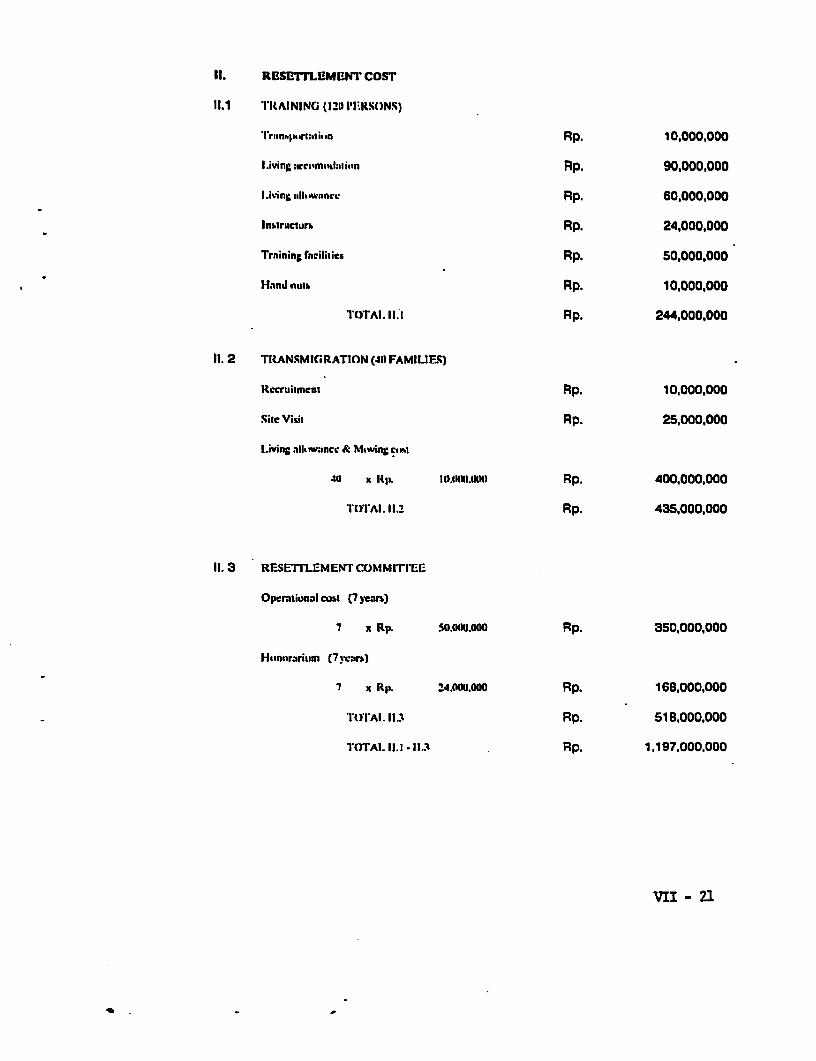
It. RESETFLEM ENT COST
11.1 l'IAI NI NG (120 I' RSONS)
Irlnh;ImrtimtIf Rp. 10,000,000
I.iving :gccnmuda:ii4n Rp. 90.000,000
I.iving all;Iwnce Rp. 60,000.000
InbtTructUr Rp. 24,000.000
Training facilities Rp. 50,000,000
Hand tluth Rp. 10,000.000
TOTALI.II.I- Rp. 244,000,000
11. 2 TRANSMi6RATION (40 FAMILIFS)
Recruitment Rp. 10,000,000
Site Visit Rp. 25,000,000
Living allarwuncc & Mowing Soe
411 x Rla. 10M.IAH0WAH Rp. 400,000.000
rOTAIl. 11.2 Rp. 435.000,000
11.3 RESETTLEMENT COMMIIT1TEE
Opcrational cost (7 years)
7 x Rp. 50.000.000 Rp. 350,000,000
HKnnnrrium (7 ycrs)
7 x Rp. Z4.00U.000 Rp. 168,000,000
TIoT AI. lII1 Rp. 518.000.000
TOTAL 11.1 - lII Rp. 1.197.000.000
VII - 21
t
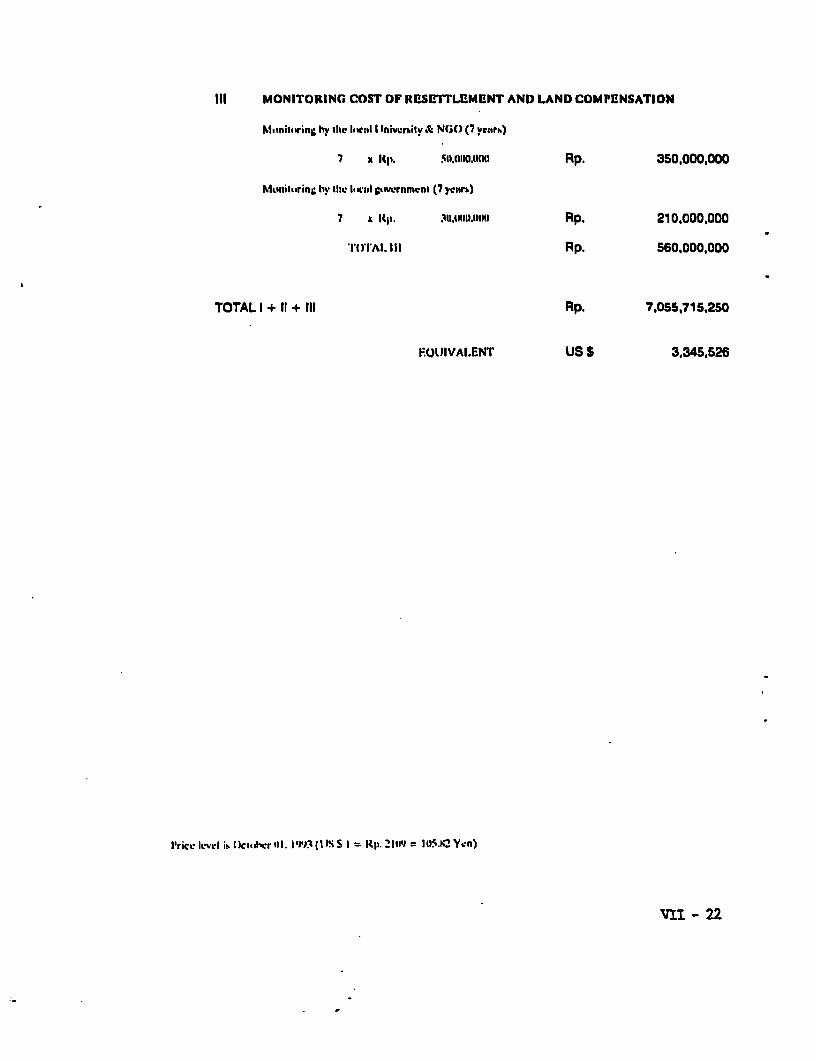
111 MONITORING COS1 OF RESETFLEMENT AND LAND COMPENSATION
M.inil.ring h%v the IlnclI I Inivertity & NGO (7 yar:r)
7 x lit. 50.flhI Rp. 350,000,000
Mtiimiiisrini, hy tIlh l'caIl swiernmrnm (7 yeurh)
7 X Kp. ,QII.INIII Rp. 210,000.000
TIOTA l. I Rp. 560,000,000
TOTAL I + II + III Rp. 7,055,715,250
1:111VAI.ENT US S 3,345,526
I'rice Ievl is tct,shLr Oil. 1')3 (I IS S I =RP. 2ItI9 = 1125.142 Yen)
VIf - 22
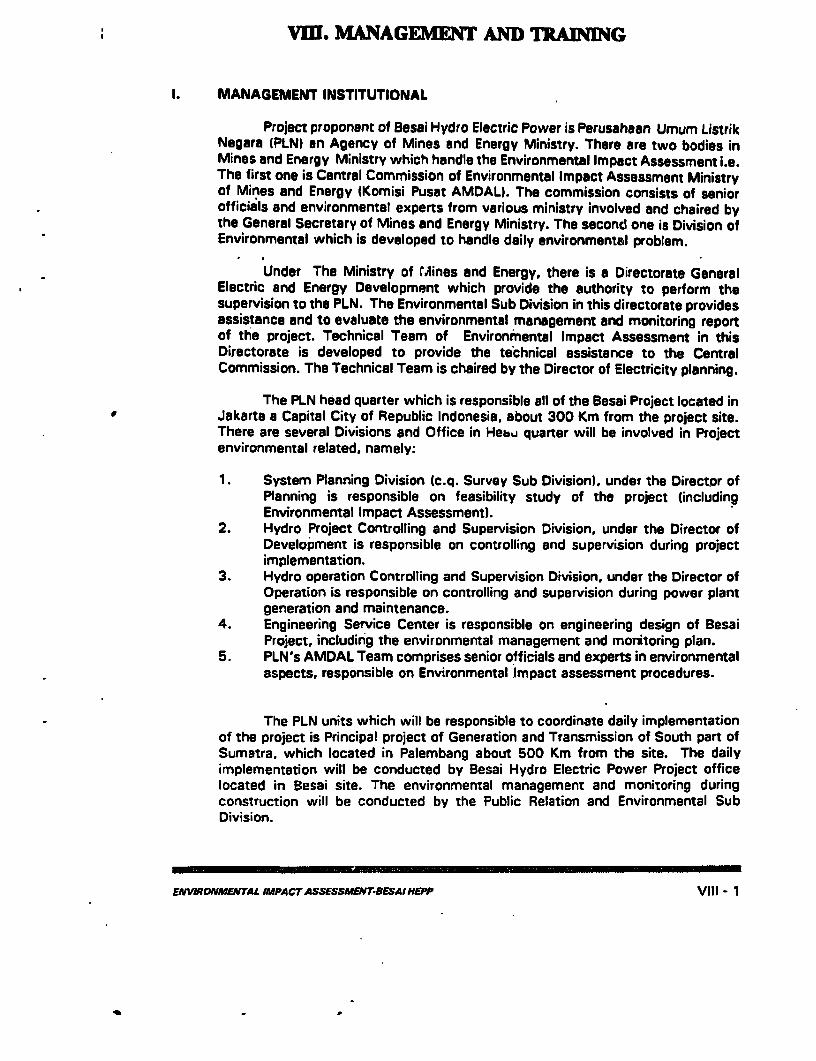
Vm. MANAGEMENT AND TRAINING
1. MANAGEMENT INSTITUTIONAL
Project proponent of Besai Hydro Electric Power is Perusahaan Umum ListrikNegara (PLNI an Agency of Mines and Energy Ministry. There are two bodies inMines and Energy Ministry which handle the Environmental Impact Assessment i.e.The first one is Central Commission of Environmentel Impact Assessment Ministryof Mines and Energy (Komisi Pusat AMDAL). The commission consists of seniorofficials and environmental experts from various ministry involved and chaired bythe General Secretary of Mines and Energy Ministry. The second one is Division ofEnvironmental which is developed to handle daily environmental problem.
Under The Ministry of MAines and Energy, there is a Directorate GeneralElectric and Energy Development which provide the authority to perform thesupervision to the PLN. The Environmental Sub Division in this directorate providesassistance and to evaluate the environmental management and monitoring reportof the project. Technical Team of Environmental Impact Assessment in thisDirectorate is developed to provide the technical assistance to the CentralCommission. The Technical Team is chaired by the Director of Electricity planning.
The PLN head quarter which is responsible all of the Besai Project located ini Jakarta a Capital City of Republic Indonesia, about 300 Km from the project site.
There are several Divisions and Office in Hebau quarter will be involved in Projectenvironmental related, namely:
1. System Planning Division (c.q. Survey Sub Division). under the Director ofPlanning is responsible on feasibility study of the project (includingEnvironmental Impact Assessment).
2. Hydro Project Controlling and Supervision Division, under the Director ofDevelopment is responsible on controlling and supervision during projectimplementation.
3. Hydro operation Controlling and Supervision Division, under the Director ofOperation is responsible on controlling and supervision during power plantgeneration and maintenance.
4. Engineering Service Center is responsible on engineering design of BesaiProject, including the environmental management and monitoring plan.
5. PLN's AMDAL Team comprises senior officials and experts in environmentalaspects, responsible on Environmental Jmpact assessment procedures.
The PLN units which will be responsible to coordinate daily implementationof the project is Principal project of Generation and Transmission of South part ofSumatra. which located in Palembang about 500 Km from the site. The dailyimplementation will be conducted by Besai Hydro Electric Power Project officelocated in Besai site. The environmental management and monitoring duringconstruction will be conducted by the Public Relation and Environmental SubDivision.
ENVWRONMENTAL IMPACT ASSESSMENT-BESAfHEPP Vill - 1
After the project completed the management of power plant will be shiftedto PLN Region IV which cover Lampung, Bengkulu, South Sumatra and JambiProvinces. The management office at site will be formed namely PLN Sector Besai.The environmental management and monitoring during power plant operation willbe conducted by the Environmental Section.
According to law and Government regulation, PLN as a project proponent hasspecific authority in dealing with environmental aspect of project related. Severalenvironmental impact mitigation and management should be conducted by theinvolved sectoral agencies, although it is project impact related such as:
Management of Impact on Fisheries Should be conducted by FisheriesAgencies
- Erosion control In the upper catchment area will be conducted by severalagencies such as:
* Department of Forestry to rehabilitate the bald/critical area of landunder their jurisdiction.
* Department of Agriculture (Food Crop Agency) to supervise andprovide information extension to the farmer to develop better soilconservation on food crop land
* Department of Agriculture (Plantation Crop Agency) to supervise andprovide information extension to the farmer to develop better soilconservation on private plantation land.
- *Land compensation and associated problem of it will be conducted by LandCompensation Committee developed by the Governor of Lampung Province
- etc.
II. TRAINING
1. PLN PRINCIPAL PROJECT OF GENERATION AND TRANSMISSION OFSOUTH PART OF SUMATRA AND BESAI PROJECT.
Training of personnel of Public Relation and Environmental sub division atPLN PRINCIPAL PROJECT OF GENERATION AND TRANSMISSION OF SOUTH PARTOF SUMATRA on environmental management and monitoring will be needed.Comparative study to similar project will also be conducted.
Personnel of Civil sub division at PLN Besai Project uill also be trained tohandle the project in environmentally manner.
2. PLN REGION IV AND PLN BESAI SECTOR.
Personnel of Environmental subsection who will handle the environmentalmanagement and monitoring of Besai Project will be trained on its aspects.
ENVJRONMENTAL IMPACTASSESSMEN EJW HOEPW Vill - 2
_ * , . _
IX. MONIrORING
1. PUBLIC HEALTH AND DISEASE VECTOR
Monitoring of pyblic health will be conducted through the PUSKESMAS (PublicHealth Center) and at Polyclinic at construction camp. The malaria, and infection ofintestine disease will be the main attention to be monitored. The monitoring will becarried out during construction and during the operation stage.Mosquito is a malaria disease vector will be monitored in the adult stage as well inlarvae stagp. The reservoir will be monitored whether it will be a good new habitatfor the mosquito larvae.
2. EROSION RATE AND SEDIMENT DEPOSITION
Monitoring of erosion rate will be conducted at the upstream river discharge. Thiswill be conducted each month, especially during the rainy season.Sediment deposition monitoring at reservoir will be conducted yearly.
3. WATER DISCHARGE
Monitoring of water discharge will be conducted by continuous automatic monitorequipment at dam site.
4. WATER QUALITY
Water quality will be monitored quarterly at reservoir.
5. AQUATIC WEED
The spreading area of floating and submerged aquatic weed at reservoir will bemonitored each month.
6. WILDLIFE
The possibility disturbance of construction activity will be monitored.
7. CONSTRUCTION WORKER
The number of construction worker will be monitored each month. consist of localworker and migration worker.
ENVIRONMEVTAL MPACTASSESSMENTBSAMEPP IX- 1
S. SOCIO-ECONOMIC OF AFFECTED PEOPLE
The socia-economic condition of the affected people will be monitored each year.
9. WATERSHED CONDITION
Monitoring of watershed condition will be contlucted by the Land Rehabilitation andConservation Station each year.
10. FISHERY
Fish production, fish species, number of people dealing with fisheries will bemonitored by the Fisheries Agency.
ENVIRONMENTAL IMPACT ASSESSMENT-SESAIHEPP IX - 2
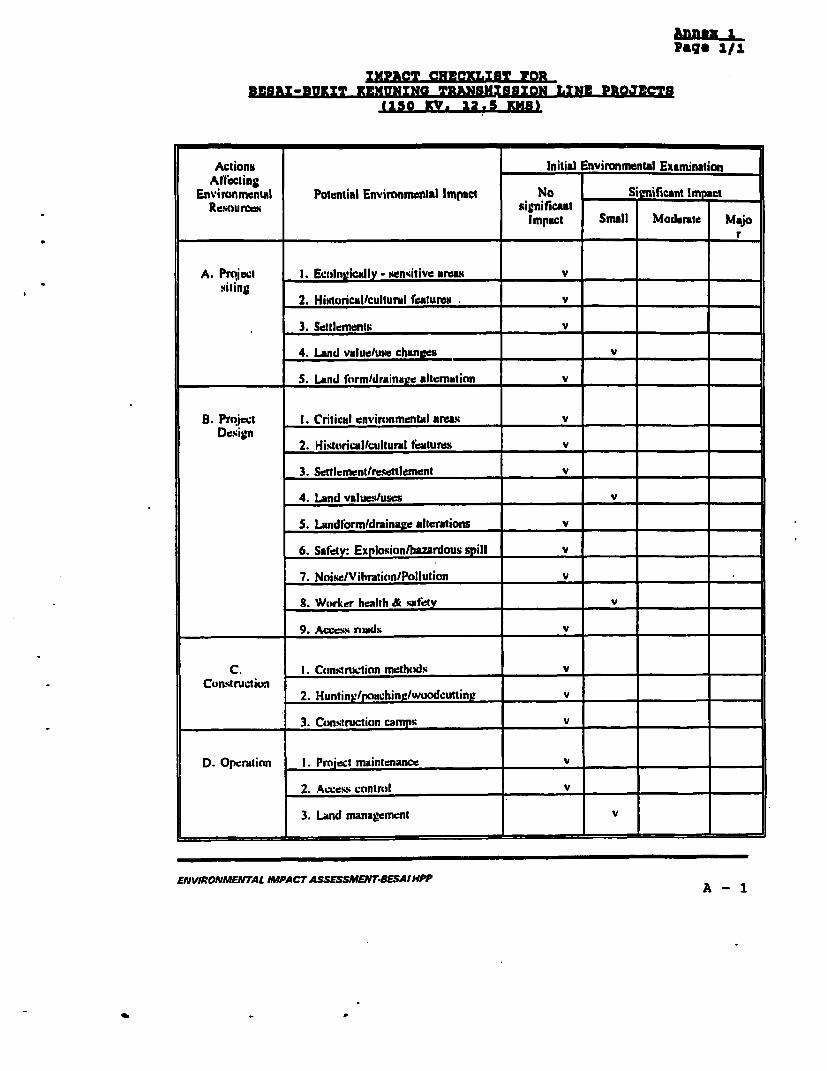
Annx i1
IxPacT CHNRXLIZB FORBEB3X-BUKRT XEMUNXNG TRANB3lB8XON LINE PROJECT8
(150 RV. 12.5 NSI
Actions Initial Environmental ExamninationAffecting
Environmental Potential Environmental Imact No gnificant I_Rewiourcem significan -I
Impact Small Moderae Majo
A. Prqjeci 1. Eu.loniically - i;endtiive areaa v -
2. Historicallcultural fealture v
3. Setilements v
4. Land value/use change= v
5. Land thrmidrainaz!e alternation v
B. Project 1. Critical environmental areas vDesign 2Hs I: u
2. lIistuflciulCIturlIl features v _____
3. Settlement/resettlemeenl v -
4. Land vluesuses __ v
5. L.ndr'orm/drainage alterations v _____
6. Safety: Explo%ion/hazardous spill v
7. Noise/Vibration/Pollution v
8. Woirker health & mafety v
9. Accews ronds v _
C. 1. COnsiruction methodJs vConstruction
2. Hunting/poauching/woodcutting v
3. Cmstruction campx v -
D. Operation 1. Pro*ect maintenance v _
2. Aceess contrnl v =_=
3. Land management v
ENVIRONMENTAL OMPACT ASSESSMENT.BESAIMPPA -1
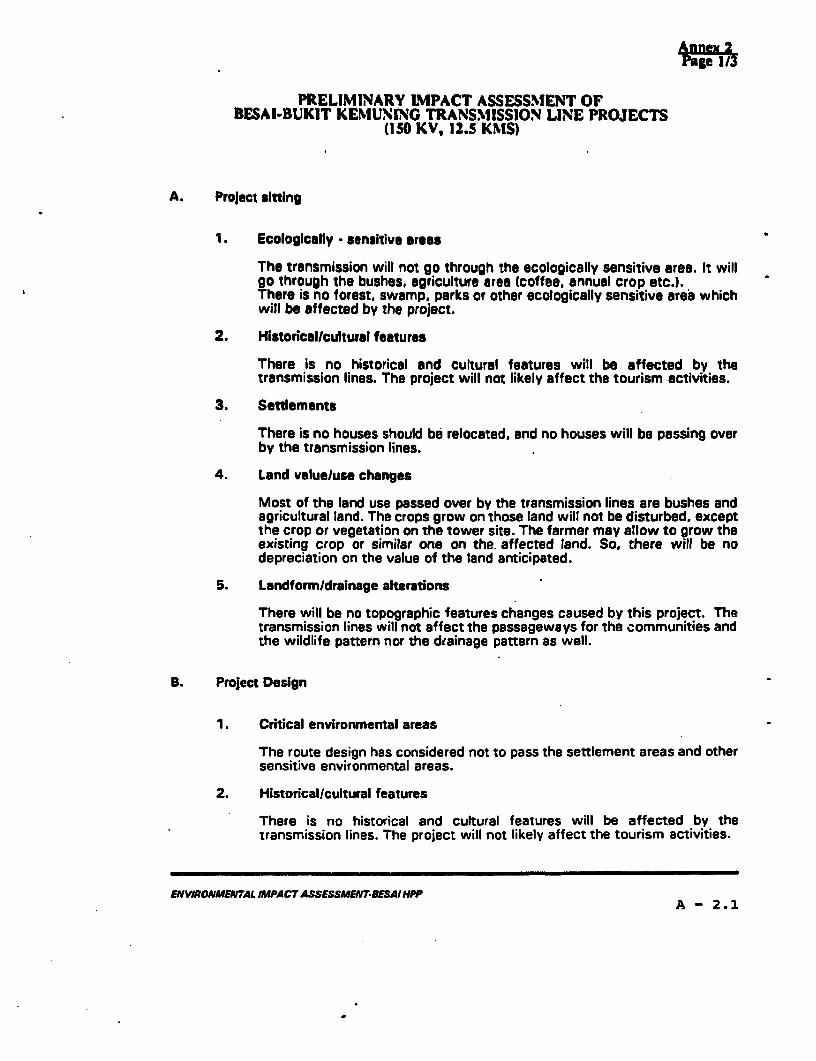
Annex 2
PRELIMINARY IMPACT ASSESSMENT OFBESAI-BUKIT KEMUNING TRANSMISSION LINE PROJECTS
(150 KV, 12.5 KNIS)
A. Project sitting
1. Ecologically - sensitive areas
The transmission will not go through the ecologically sensitive area. It willgo through the bushes, agriculture area (coffee, annual crop etc.).There is no forest, swamp. parks or other ecologically sensitive area whichwill be affected by the project.
2. HIstorical/cultural features
There is no historical and cultural features wHi be affected by thetransmission lines. The project will not likely affect the tourism activities.
3. Settlements
There is no houses should be relocated, and no houses will be passing overby the transmission lines.
4. Land valueluse changes
Most of the land use passed over by the transmission lines are bushes andagricultural land. The crops grow on those land will not be disturbed. exceptthe crop or vegetation on the tower site. The farmer may allow to grow theexisting crop or similar one on the. affected land. So. there will be nodepreciation on the value of the land anticipated.
5. Landform/drainage alterations
There will be no topographic features changes caused by this project. Thetransmission lines will not affect the passageways for the communities andthe wildlife pattern nor the drainage pattern as well.
B. Project Design
1. Critical environmental areas
The route design has considered not to pass the settlement areas and othersensitive environmental areas.
2. Historical/cultural features
There is no historical and cultural features will be affected by thetransmission lines. The project will not likely affect the tourism activities.
ENVIRONMENTAL IMPACT ASSESSMENTDEESAIHPPA - 2.1
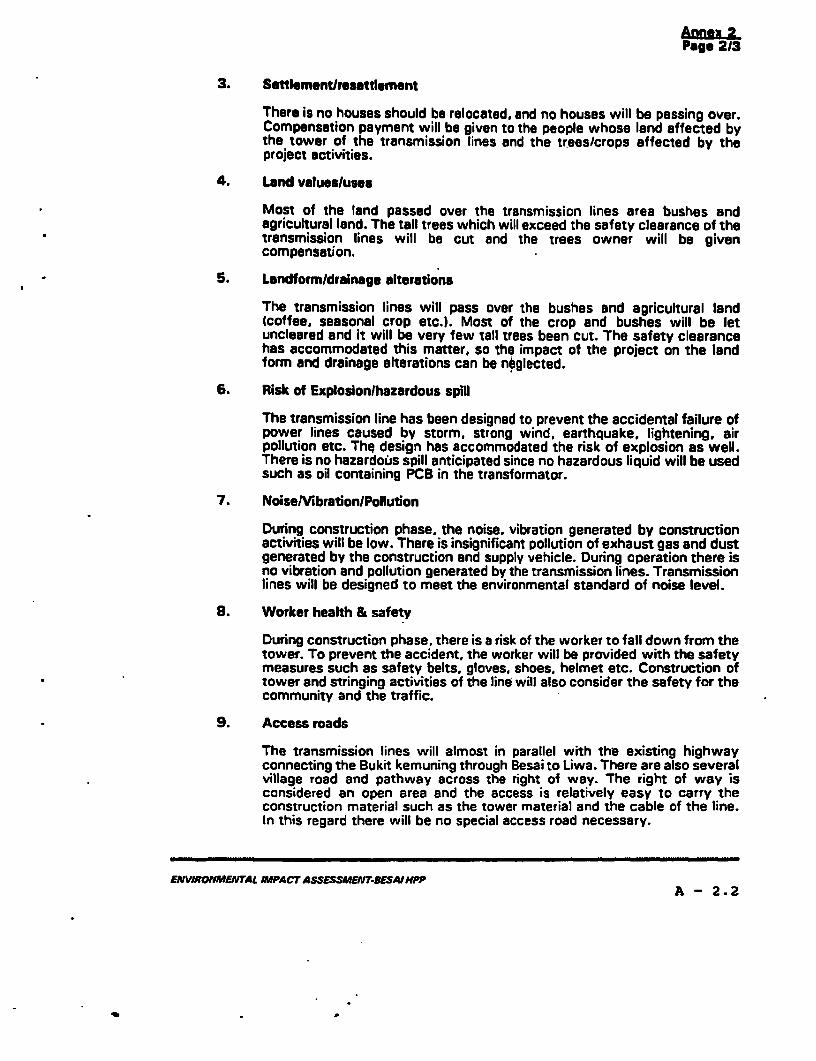
Aanr 2Page 213
3. Settlement/resettlement
There is no houses should be relocated, and no houses will be passing over.Compensation payment will be given to the people whose land affected bythe tower of the transmission lines and the trees/crops affected by theproject activities.
4. Land values/uses
Most of the land passed over the transmission lines area bushes andagricultural land. The tall trees which will exceed the safety clearance of thetransmission lines will be cut and the trees owner will be givencompensation.
5. Landform/drainage alterations
The transmission lines will pass over the bushes and agricultural land(coffee, seasonal crop etc.). Most of the crop and bushes will be letuncleared and it will be very few tall trees been cut. The safety clearancehas accommodated this matter, so the impact of the project on the landform and drainage alterations can be nbglected.
6. Risk of Explosionlhazardous spill
The transmission line has been designed to prevent the accidental failure ofpower lines caused by storm, strong wind, earthquake, lightening, airpollution etc. The design has accommodated the risk of explosion as well.There is no hazardous spill anticipated since no hazardous liquid will be usedsuch as oil containing PCB in the transformator.
7. Noise/Vibration/Pollution
During construction phase, the noise, vibration generated by constructionactivities will be low. There is insignificant pollution of exhaust gas and dustgenerated by the construction and supply vehicle. During operation there isno vibration and pollution generated by the transmission lines. Transmissionlines will be designed to meet the environmental standard of noise level.
S. Worker health & safety
During construction phase, there is a risk of the worker to fall down from thetower. To prevent the accident, the worker will be provided with the safetymeasures such as safety belts, gloves, shoes, helmet etc. Construction oftower and stringing activities of the line will also consider the safety for thecommunity and the traffic.
9. Access roads
The transmission lines will almost in parallel with the existing highwayconnecting the Bukit kemuning through Besai to Liwa. There are also severalvillage road and pathway across the right of way. The right of way isconsidered an open area and the access is relatively easy to carry theconstruction material such as the tower material and the cable of the line.In this regard there will be no special access road necessary.
ENVIRONMENTAL IPACTASSESSMENT.IESAIHPPA - 2.2
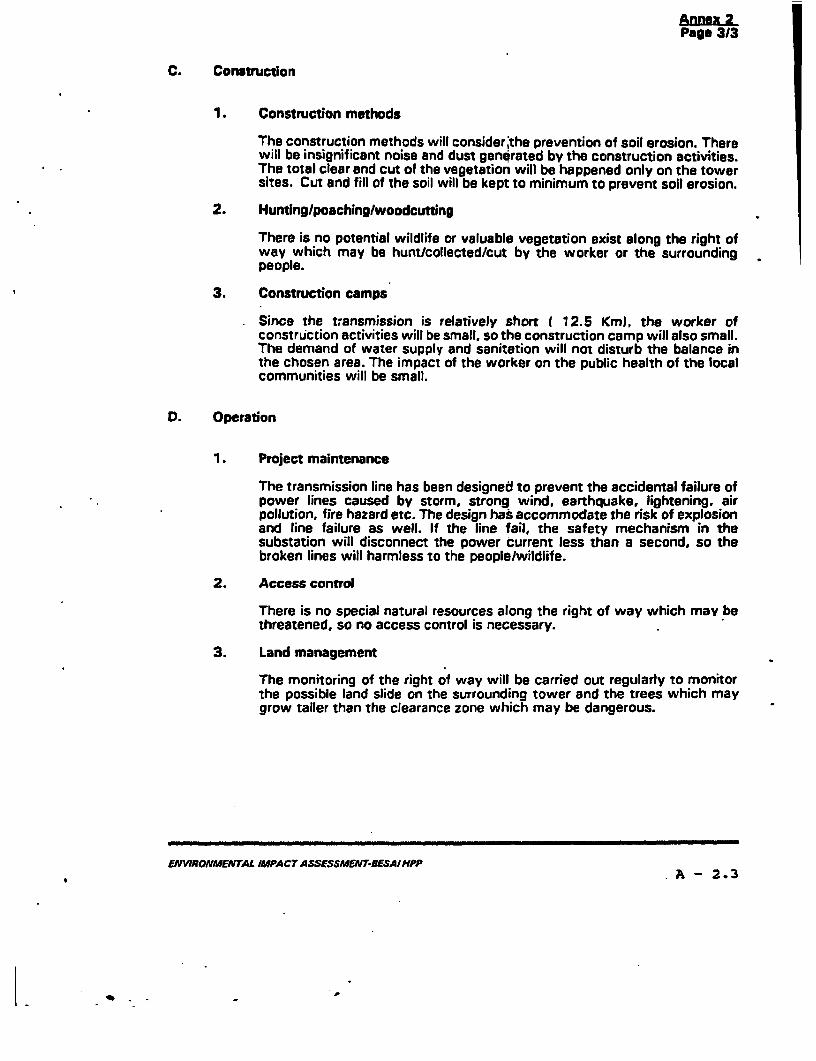
Annex 2Page 313
C. Construction
1. Construction methods
The construction methods will consider;the prevention of soil erosion. Therewill be insignificant noise and dust generated by the construction activities.The total clear and cut of the vegetation will be happened only on the towersites. Cut and fill of the soil will be kept to minimum to prevent soil erosion.
2. Hunting/poaching/woodcutting
There is no potential wildlife or valuable vegetation exist along the right ofway which may be hunt/collectedlcut by the worker or the surroundingpeople.
3. Construction camps
Since the transmission is relatively short ( 12.5 Km), the worker ofconstruction activities will be small, so the construction camp will also small.The demand of water supply and sanitation will not disturb the balance inthe chosen area. The impact of the worker on the public health of the localcommunities will be small.
D. Operation
1. Project maintenance
The transmission line has been designed to prevent the accidental failure ofpower lines caused by storm, strong wind, earthquake, lightening, airpollution, fire hazard etc. The design has accommodate the risk of explosionand line failure as well. If the line fail, the safety mechanism in thesubstation will disconnect the power current less than a second, so thebroken lines will harmless to the people/wildlife.
2. Access control
There is no special natural resources along the right of way which mav bethreatened, so no access control is necessary.
3. Land management
The monitoring of the right of way will be carried out regularly to monitorthe possible land slide on the surrounding tower and the trees which maygrow taller than the clearance zone which may be dangerous.
ENVIRONMENTAL JMPACTASSESSMElf-HESAIMPPA - 2.3
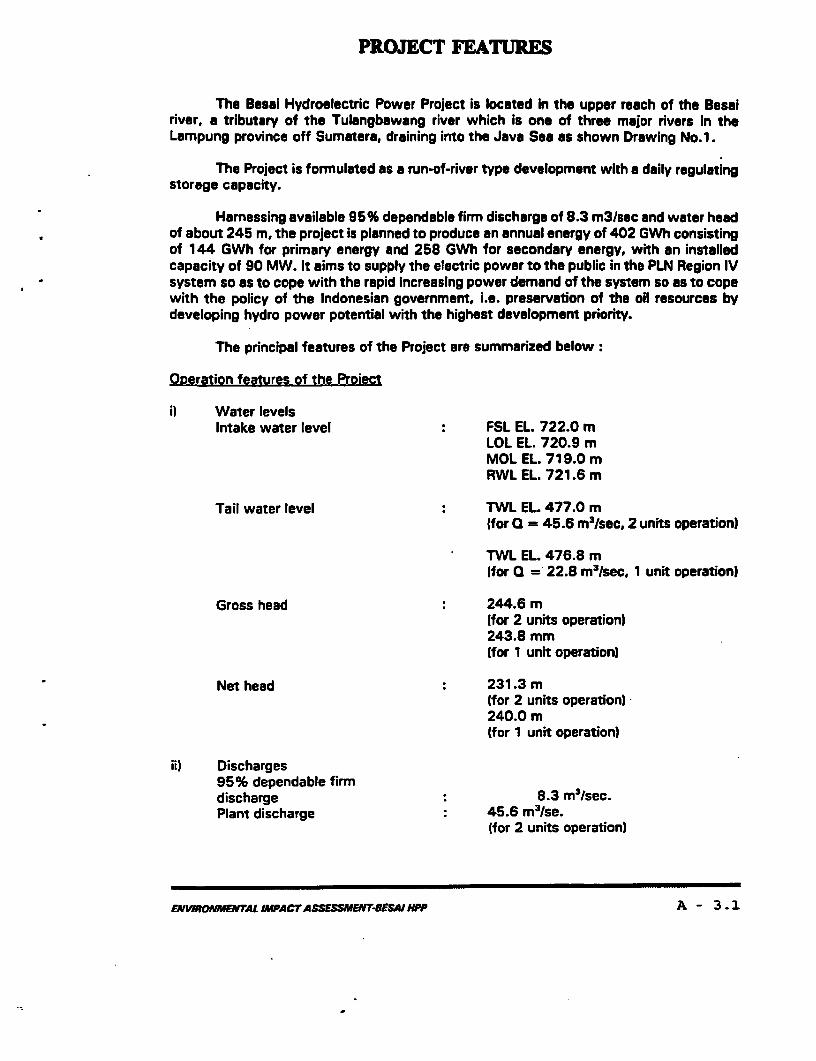
PROJECT FEATURES
The Besal Hydroelectric Power Project is located In the upper reach of the Basalriver, a tributary of the Tulangbawang river which is one of three major rivers In theLampung province off Sumatera, draining into the Java Sea as shown Drawing No.1.
The Project is formulated as a run-of-river type development with a daily regulatingstorage capacity.
Harnessing available 95% dependable firm discharge of 8.3 m3lsec and water headof about 245 m, the project is planned to produce an annual energy of 402 GWh consistingof 144 GWh for primary energy and 258 GWh for secondary energy, with an installedcapacity of 90 MW. It aims to supply the electric power to the public in the PLN Region IVsystem so as to cope with the rapid increasing power demand of the system so as to copewith the policy of the Indonesian government, i.e. preservation of the oil resources bydeveloping hydro power potential with the highest development priority.
The principal features of the Project are summarized below:
Operation features of the Proiect
ii Water levelsIntake water level : FSL EL. 722.0 m
LOL EL. 720.9 mMOL EL. 719.0 mRWL EL. 721.6 m
Tail water level : TWL EL. 477.0 m{for Q = 45.6 m 3rsec, 2 units operation)
TWL EL. 476.8 m[for Q = 22.8 m3/sec, 1 unit operation)
Gross head : 244.6 m(for 2 units operation)243.8 mm(for 1 unit operation)
Nethead : 231.3 m(for 2 units operation) -240.0 m(for 1 unit operation)
ii) Discharges95% dependable firndischarge 8.3 m3/sec.Plant discharge : 45.6 m3/se.
(for 2 units operation)
ENVIRONMENTAL IMPACT ASSESSMENT-BESAI lP, A - 3.1
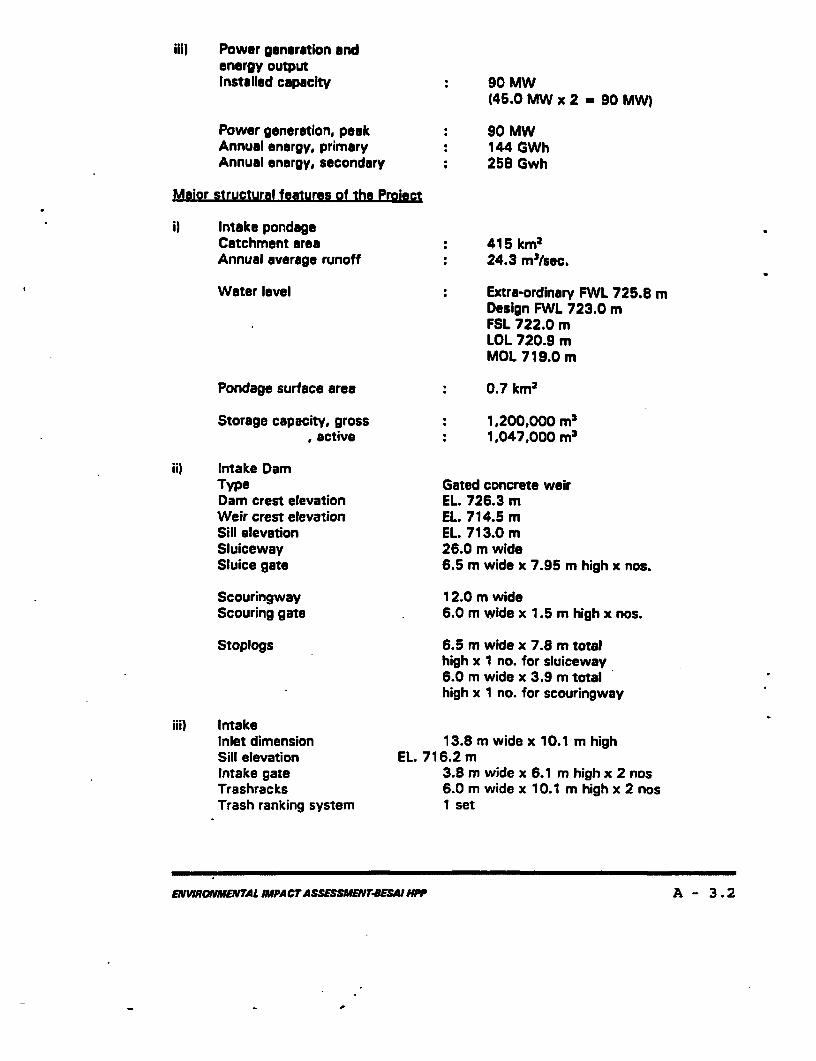
iii) Power generation andenergy outputInstalled capacity 90 MW
(45.0 MW x 2 - 90MWi
Power generation, peak 90 MWAnnual energy, primary 144 GWhAnnual energy, secondary 258 Gwh
Malor structural features of the Prolect
il Intake pondageCatchment area 415 km2Annual average runoff 24.3 m3tsec.
Water level : Extra-ordinary FWL 725.8 mDesign FWL 723.0 mFSL 722.0 mLOL 720.9 mMOL 719.0 m
Pondage surface area 0.7 km2
Storage capacity, gross 1,200,000 m 3
active 1,047,000m3
ii) Intake DamType Gated concrete weirDam crest elevation EL. 726.3 mWeir crest elevation EL. 714.5 mSill elevation EL. 713.0 mSluiceway 26.0 m wideSluice gate 6.5 m wide x 7.95 m high x nos.
Scouringway 12.0 m wideScouring gate 6.0 m wide x 1.5 m high x nos.
Stoplogs 6.5 m wide x 7.8 m totalhigh x 1 no. for sluiceway6.0 m wide x 3.9 m totalhigh x 1 no. for scouringway
iii) IntakeInlet dimension 13.8 m wide x 10.1 m highSill elevation EL. 716.2 mIntake gate 3.8 m wide x 6.1 m high x 2 nosTrashracks 6.0 m wide x 10.1 m high x 2 nosTrash ranking system 1 set
ENWRONMENTAL MIPACTASSESSVET4EW= HPP A - 3.2
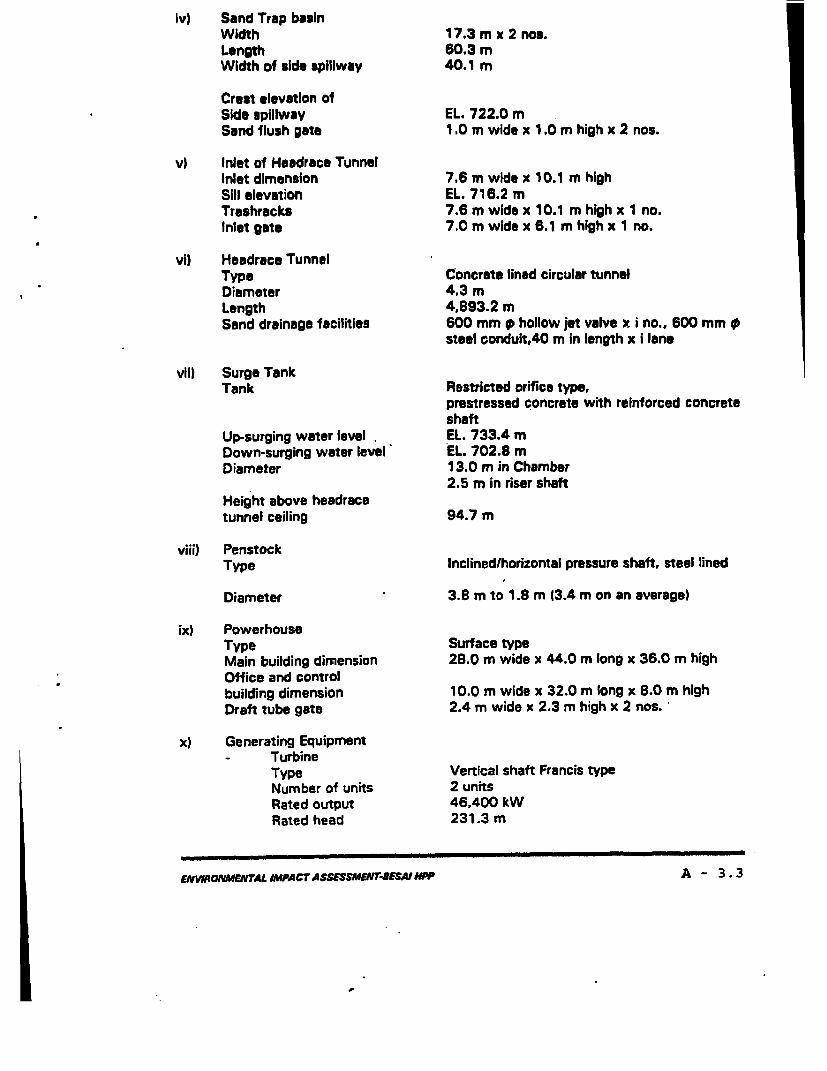
iv) Sand Trap basinWidth 17.3 m x 2 nos.Length 60.3 mWidth of side spillway 40.1 m
Crest elevation olSide spillway EL. 722.0 mSand flush gate 1.0 m wide x 1.0 m high x 2 nos.
v) Inlet of Hosdrace TunnelInlet dimension 7.6 m wide x 10.1 m highSill elevation EL. 716.2 mTrashracks 7.6 m wide x 10.1 m high x 1 no.Inlet gate 7.0 m wide x 6.1 m high x 1 no.
vi) Headrace TunnelType Concrete lined circular tunnelDiameter 4.3 mLength 4,893.2 mSand drainage facilities 600 mm 0 hollow jet valve x i no., 600 mm 0
steel conduTt.40 m in length x I lane
vii) Surge TankTank Restricted orifice type,
prestressed concrete with reinforced concreteshaft
Up-surging water level EL. 733.4 mDown-surging water level EL. 702.8 mDiameter 13.0 m in Chamber
2.5 mn in riser shaftHeight above headracetunnel ceiling 94.7 m
viii) PenstockType Inclined/horizontal pressure shaft, steel lined
Diameter 3.8 m to 1.8 m 13.4 m on an average)
ix) PowerhouseType Surface typeMain building dimension 28.0 m wide x 44.0 m long x 36.0 m highOffice and controlbuilding dimension 10.0 m wide x 32.0 m long x 8.0 m highDraft tube gate 2.4 m wide x 2.3 m high x 2 nos.
x) Generating Equipment- Turbine
Type Vertical shaft Francis typeNumber of units 2 unitsRated output 46.400 kWRated head 231.3 m
EDTVIRONMAL IMPACTASSESSMENr-SESAIHPP A- 3.3
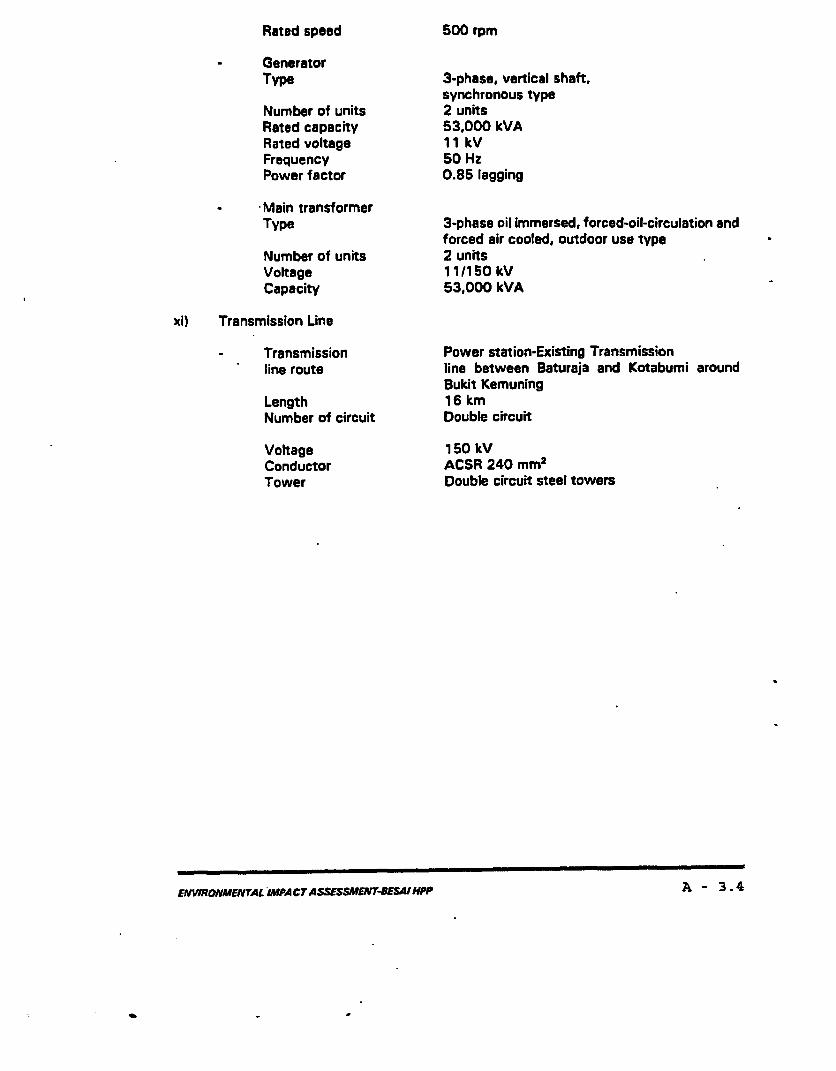
Rated speed 500 rpm
GeneratorType 3-phase, vertical shaft,
synchronous typeNumber of units 2 unitsRated capacity 53,000 kVARated voltage 11 kVFrequency 50 HzPower factor 0.85 lagging
-Main transformerType 3-phase oil immersed, forced-oil-circulation and
forced air cooled, outdoor use typeNumber of units 2 unitsVoltage 1 1/150 kVCapacity 53,000 kVA
xi) Transmission Line
Transmission Power station-Existing Transmissionline route line between Baturaja and Kotabumi around
Bukit KemuningLength 16 kmNumber of circuit Double circuit
Voltage 150 kVConductor ACSR 240 mm2
Tower Double circuit steel towers
ENwRONMENrAL IlPACTASSESSMENT-BEWHPP A - 3.4
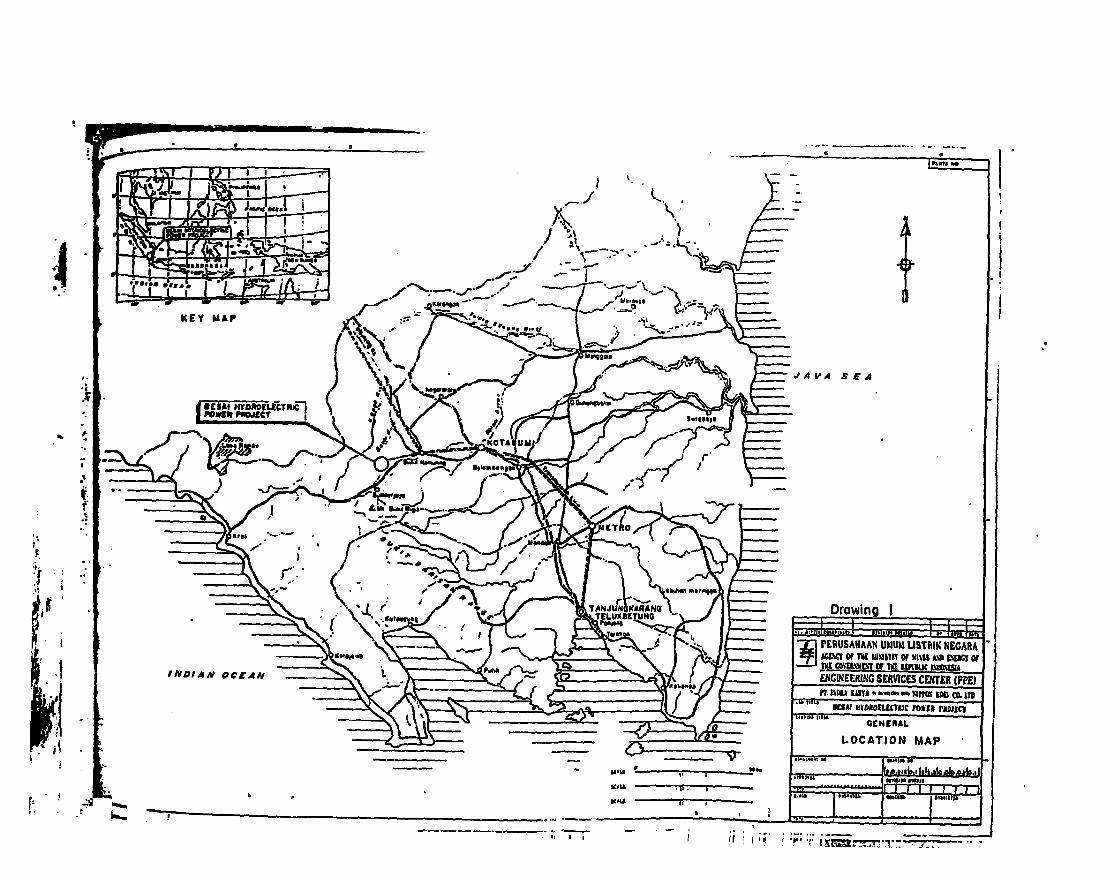
I I IF 7h-1 -e-
XS~~~~~~~- -- .- ± --
KEY MAP
.4.~~~~~~~~
.ESAI HYDADIE CCTRIC-' NE 1S---x __ a n <%o .- \ ,_F { *9t - X PERUSAN^ANU
POWER mwgclr I~~~~~~~~~~~~~~~~~~~~~~~~~~~~~~~E IbOLZTJ fll IPJC
M TA m ~ l~tA ~
! t . .0 _ ; LO T * 4M
-~~~~~~~~~~~~~~~~~~~~~A or YU MM or , .u ,' bcm Or^,i
r~~~~~~~~~~~~~~~~~~ I a,,, I ;wXs' _1§. 't
!_~~~~~~~~~~~~~~~~~~~~~~~~~~~~~~~~~~~~~~~~~~~~~~A LY -ftd. off MP NM M ! _F
_____,_~~~~*1 . , ;; ". ;jj; r' j@-
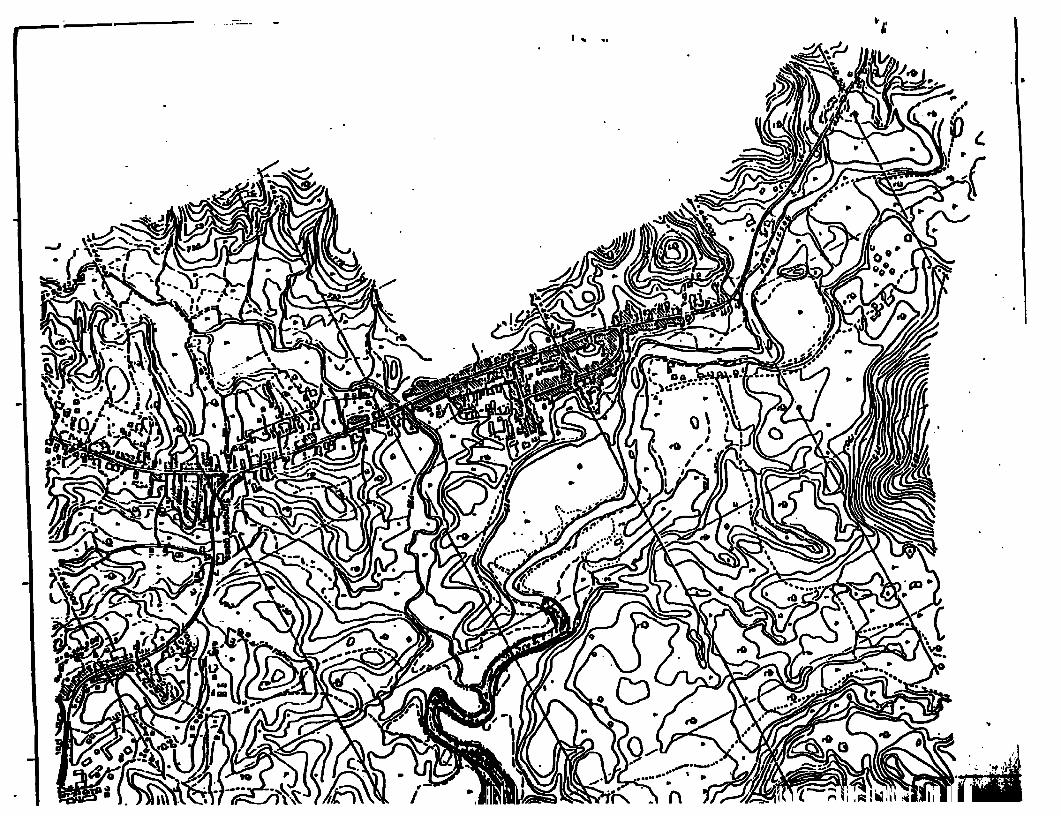
LI~~~~~~~~~~~~~~~~~~~~~~~~~~~~
lp) .
-
' eZ
1~~~~~S..
Ke*t .
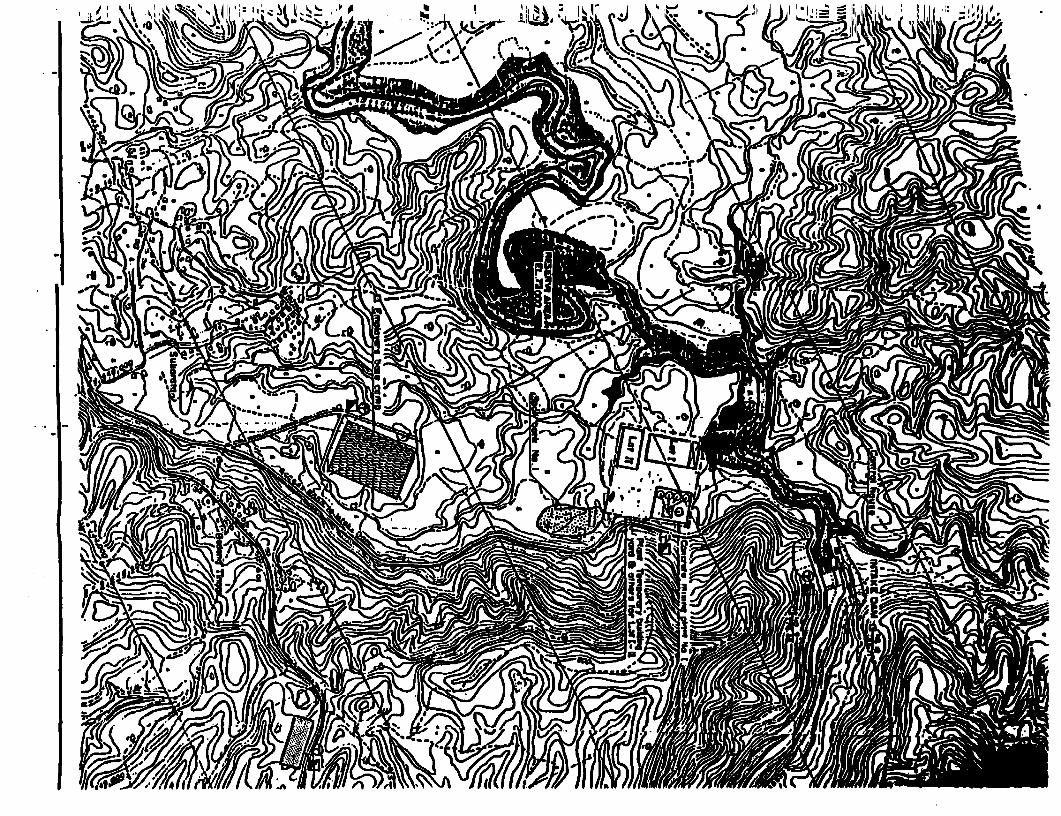
I ~~~~~~~~~: 1
SL~~~~~~~~~~~~~~~~~~~~~~~~~~~~~~~~~~~~~~~~~~~~~~~~~~~~~~~~~~~~~~
1~~~~~~~~~~~~~~~~~~~~~~~~~~~AŽ ~~~~~~~~~~~~~~~~~~~~~~~~0
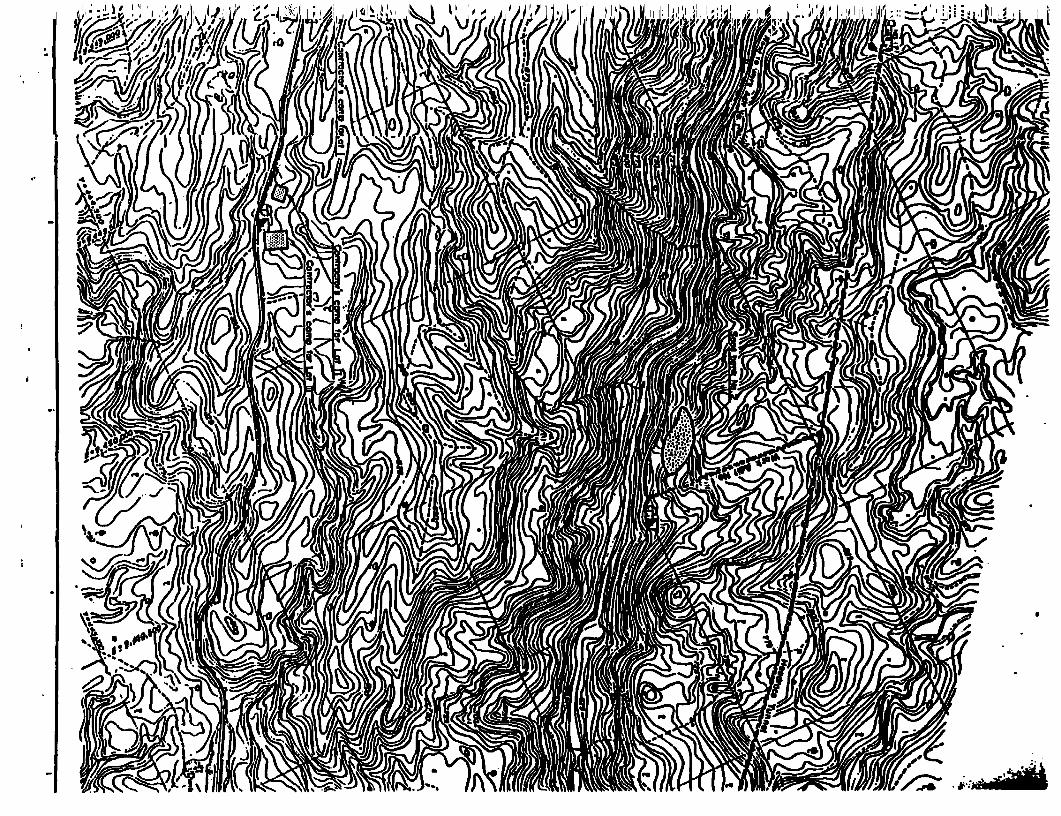
a,I~~ V
* /~~~,U
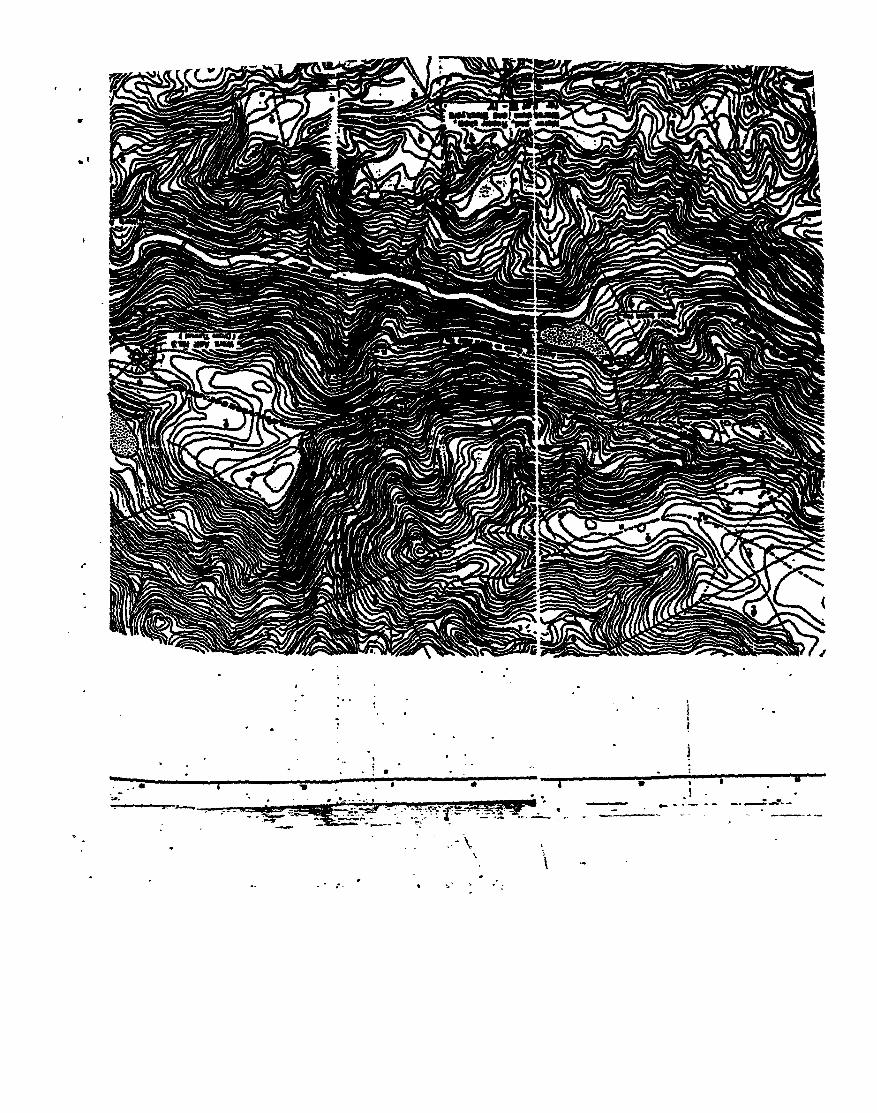
* . 9 -,*
'i
W~ ~~~~ *,
-___
w~~~~~~~~~~~~~~~~~~~~I
-
I ,
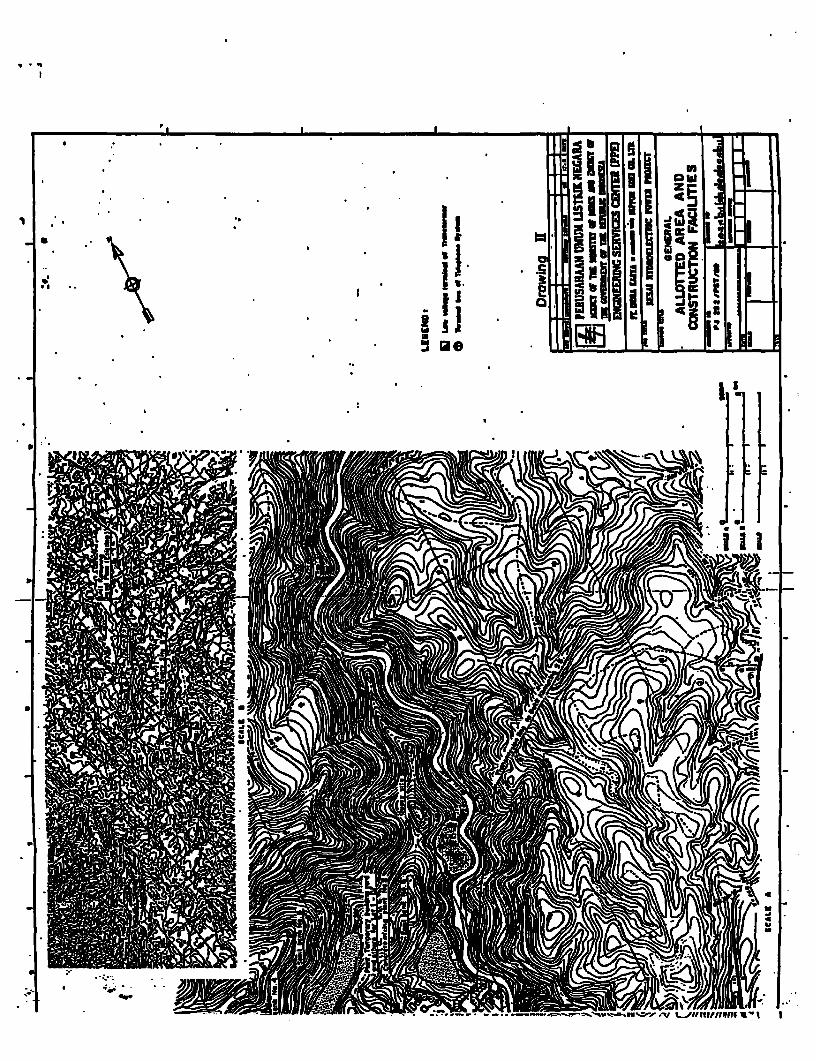
I' 111111 01~~~~~~~~~~~~1
t ~ ~ ~ ~ ~ ~ ~ ~ ~ ~ -* v
--------B--. v - I