Embed Size (px)
Citation preview
Journal of Socioeconomics and Development. 2021. 4(1): 120-133
Journal of Socioeconomics and Development
https://publishing-widyagama.ac.id/ejournal-v2/index.php/jsed
Indonesian coffee exports and its relation to global market integration
Fitriani1*, Bustanul Arifin2, and Hanung Ismono2
1State Polytechnic of Lampung, Indonesia 2University of Lampung, Indonesia
*Correspondence email: [email protected]
INTRODUCTION
The global economic condition has been broadly
driven by international trade which is considered an
important source of income in developing countries.
Coffee is one of the valuable international trade
commodities across countries. The cash crop coffee
trade involves many countries as producers,
industries, global chains, and consumers. Dominantly,
in consumer countries, global coffee chains have
extended rapidly. Consumers do not only justify on
quality of material but typically emblematic on quality
and in-person services as a lifestyle manifestation.
Global coffee industry wave achieves a highly
successful, high-quality, customer-centric, and
sustained coffee business that meets the desires and
needs of today’s demanding and knowledgeable
coffee drinkers. In the European Union in 2018, the
share of coffee consumption had the highest growth
include France (32% of all coffee consumption), the
Netherlands (31%), and Belgium (27%). The leading
countries in Europe are Germany, France and Italy
(CBI, 2020). The increasingly sustainable coffee
certification consumption also becomes a global trend.
Consumers’ willingness to pay premium prices to
To cite this article: Fitriani, Arifin, B., & Ismono, H. (2021). Indonesian coffee exports and its relation to global market
integration. Journal of Socioeconomics and Development, 4(1), 120-133. https://doi.org/10.31328/jsed.v4i1.2115
ISSN 2615-6075 online; ISSN 2615-6946 print ©UWG Press, 2021
ABSTRACT
Coffee price is an important indicator that stimulates farmers to advance their welfare. Unfortunately, coffee crisis makes the farm gate price uncertain and volatile. This study aims to explore the Indonesian coffee export situation related to price risks and coffee market integration between Indonesian coffee price and international price. The time series data were the coffee price from 1987 to 2014 in Indonesian domestic market and in global trade in London. Vector Error Correction Model (VECM) approach was applied to test market integration based on Ravallion’s equation. Based on the analysis, the results of the study revealed that Indonesian coffee export performed progressively in the last decade. Export destination countries for Indonesian coffee also developed broadly. There was market integration on the Indonesian coffee market and global price in the London terminal. Although not fully, the shock in the international price was somehow felt in the Indonesian coffee market. There were sufficient shreds of evidence to conclude that the Indonesian coffee market is well integrated with the international market in the long run. The changing coffee price in Indonesia and the International market adjusted in the next three years. In short term, Indonesian coffee price was 76% influenced by international price changes, but not vice versa.
ARTICLE INFO
►Research Article
Article History Received 14 January 2021 Accepted 16 March 2021 Published 30 April 2021
Keywords coffee; export; market integration; price
JEL Classification D49; Q02; Q17
121
Journal of Socioeconomics and Development, Vol 4, No 1, April 2021
obtain organic products, which can be viewed as the
cost of investment in human health, is encouraging
(Mengistie, 2020).
The essential characteristics of the global coffee
chain in the last 40 years can be described with two
broad historical periods: the International Coffee
Agreement (ICA) regime (1962-89) and the post-ICA
regime (1989–present). The post-ICA regime exhibits
calls a “buyer-driven” chain, specifically labeled as a
“roaster-driven” chain. The processes of a commodity
supply chain need to understand its internal and
external relations with each of its members and accept
the positive effects of the supply chain integration in
the operational performance of a company (Ramos et
al., 2019). The liberalization of the coffee industry has
started competition among members. The
appearance of a global coffee chain with voluntary
regulatory systems excess coincided with the coffee
crisis (Muradian & Pelupessy, 2005). Important
changes in the governance and institutional
arrangement of the coffee commodity chain have been
the reasons for explaining the coffee paradox. The
coffee paradox is the coexistence of a 'coffee boom' in
consuming countries and a 'coffee crisis' in producing
countries. When the international coffee prices falls
dramatically, the producers receive the lowest prices
in decades. Thus, the exporter countries are still poor
and of low income. Social accountability has been
applied in various forms of effective interactions
between the community and village government.
Many efforts are required to improve the quality of
human resources through more stakeholder
engagement, training activity, and community
empowerment (Zeho et al., 2020).
The global coffee chain has changed dramatically
as a result of deregulation, new consumption patterns,
and evolving corporate strategies. Disaggregation
embedded in a network of activities controlled by
global firms changes the structure of production,
trade, and consumption of commodities (Lee et al.,
2012). Global Value Chains (GVC) analysis emerges.
‘Value chains’ requires coherent link on input supply,
production, trade, and consumption explicitly. GVCs
lead to the relationship between the level of
coordination and strength asymmetry indirectly. The
formulation of the success of production standards is
steered by the market. Given the vertical nature of
these markets, they are most appropriately
characterized by successive oligopoly and or
oligopsony.
Indonesian coffee has been getting famous and
commercially classified as an agricultural commodity
since its first export in 1711. It is the most outstanding
commodity in international transactions, as well as the
domestic supply, in terms of quantity and value. The
major suppliers are located in developing countries
and the major customers are the developed countries,
where coffee demand is concentrated (de Almeida &
Vegro, 2020). Global coffee establishment was well
before the first outbreak of rust in Ceylon (Sri Lanka)
in 1869 (Igo, 2020). Nowadays, Indonesia is the fourth
biggest coffee producer in the world with Brazil,
Vietnam, and Colombia. Coffee production within
2014—2018 in average amount was 662.75 thousand
ton per year and 70% of it was exported. Coffee
production was mostly cultivated by smallholder
farmers (95.45%). Robusta coffee was more
dominantly produced than arabica coffee, reaching
72.66%. The estimation of Indonesian coffee
production in 2020-2024 is 777.73 thousand tons of
coffee beans with the increasing growth of 1.36% per
year (BPS, 2019). Almost half of the coffee trade in
the EU is dominantly controlled by some Indonesian
importers: Nestlé (Switzerland), DE Masterblenders
(the Netherlands), Tchibo (Germany), Lavazza (Italy),
Aldi (Germany), and Segafredo (Italy) (Simamora,
2014). This relationship forms a vertical integration
between roasters and international traders.
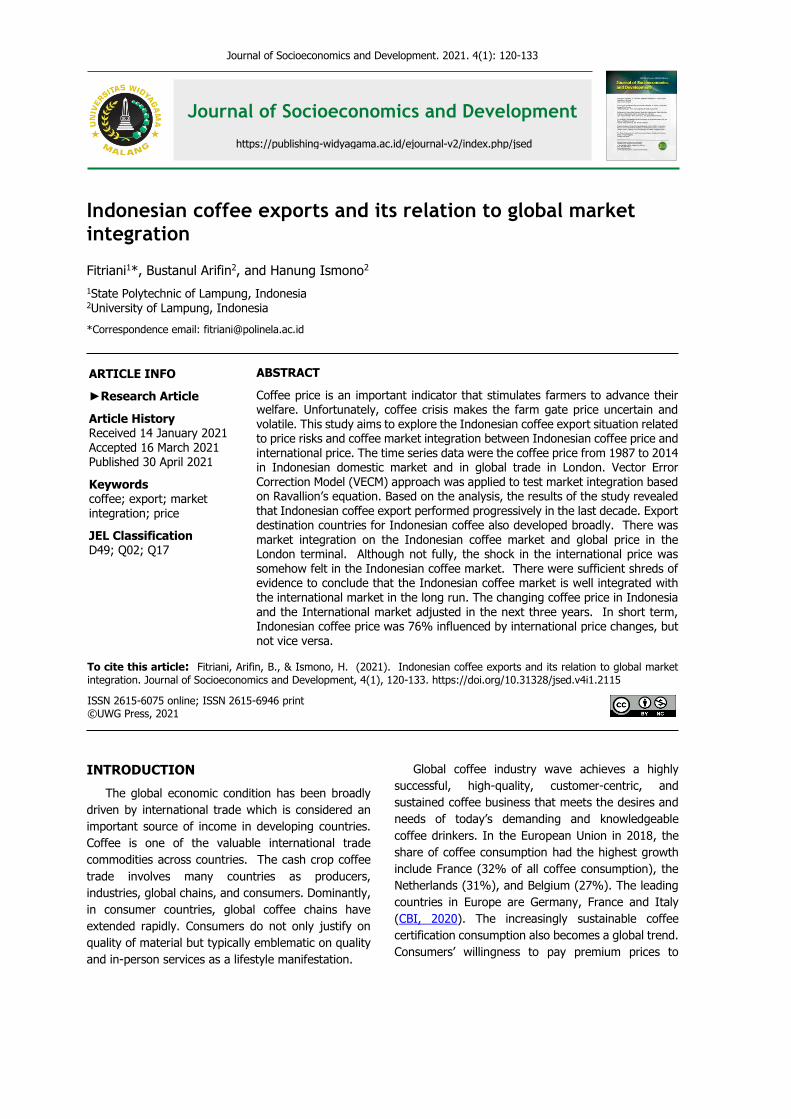
Globally, ICO noted that coffee export supply is
higher than that of the world coffee consumption in
2017-2018. This is contrary to the situation in 2018-
2019, where the world coffee consumption was higher
than its production (Figure 1).
The changing global coffee supply is linked with
the cyclical coffee production pattern in the coffee
producer. Mostly it is the global climate change that
disturbs the production situation. The data remains a
prior work on exchange rate pass-through and export
supply curves (Amiti et al., 2019). On the other hand,
coffee consumption raised in 2020 after the decline in
2019. When the consumption was higher than
production, the farm gate price has an opportunity to
have a better price. Global coffee price also depends
on consumers’ country lifestyle. It links with the trend
of sustainable coffee with certification commodities
platform (buyer’s driven). The coffee market will most
likely keep adapting itself to satisfy such changes.
Consumer behavior will certainly continue to change.
The whole chain currently generates thousands of jobs
across the globe, and the potential for new consumers
122
Fitriani et al., Indonesian coffee exports and...
to begin purchasing and drinking coffee is enormous
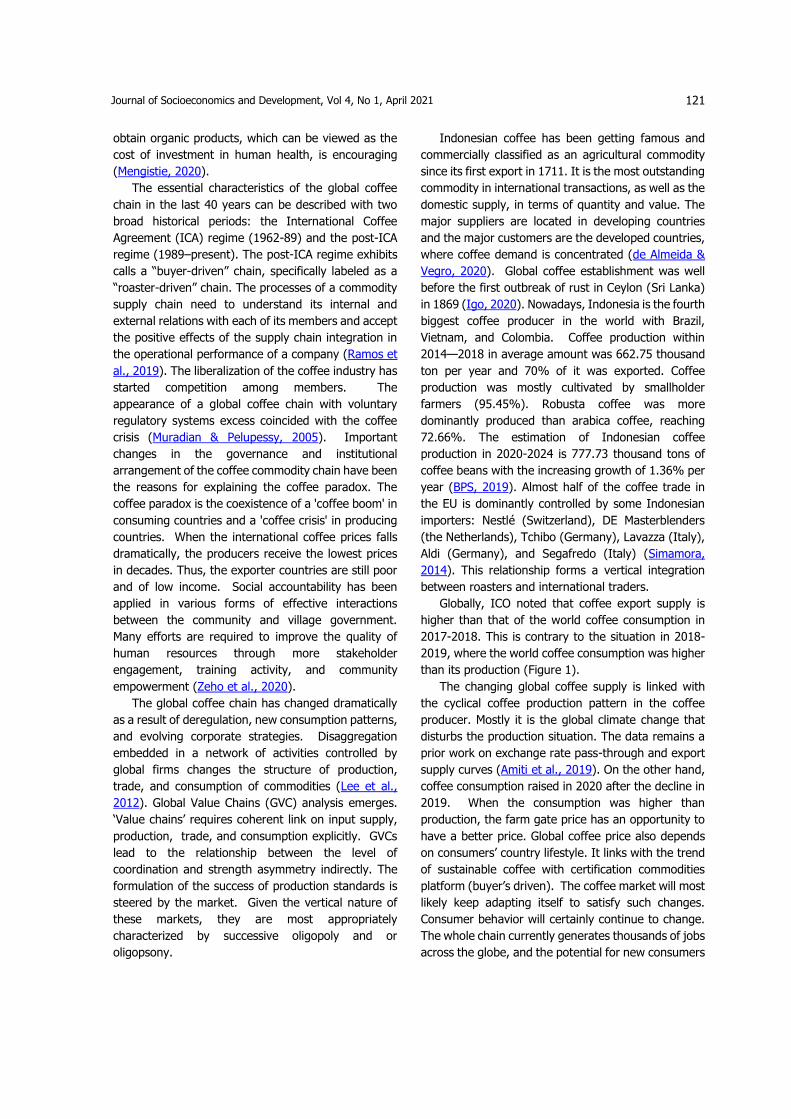
(de Lima et al., 2019). Furthermore, the coffee price
in domestic producer region and global tends to be
dynamic and volatile (Figure 2).
Figure 1. World coffee production and consumption (ICO, 2021)
Figure 2. World coffee price 2018-2019 (ICO, 2021)
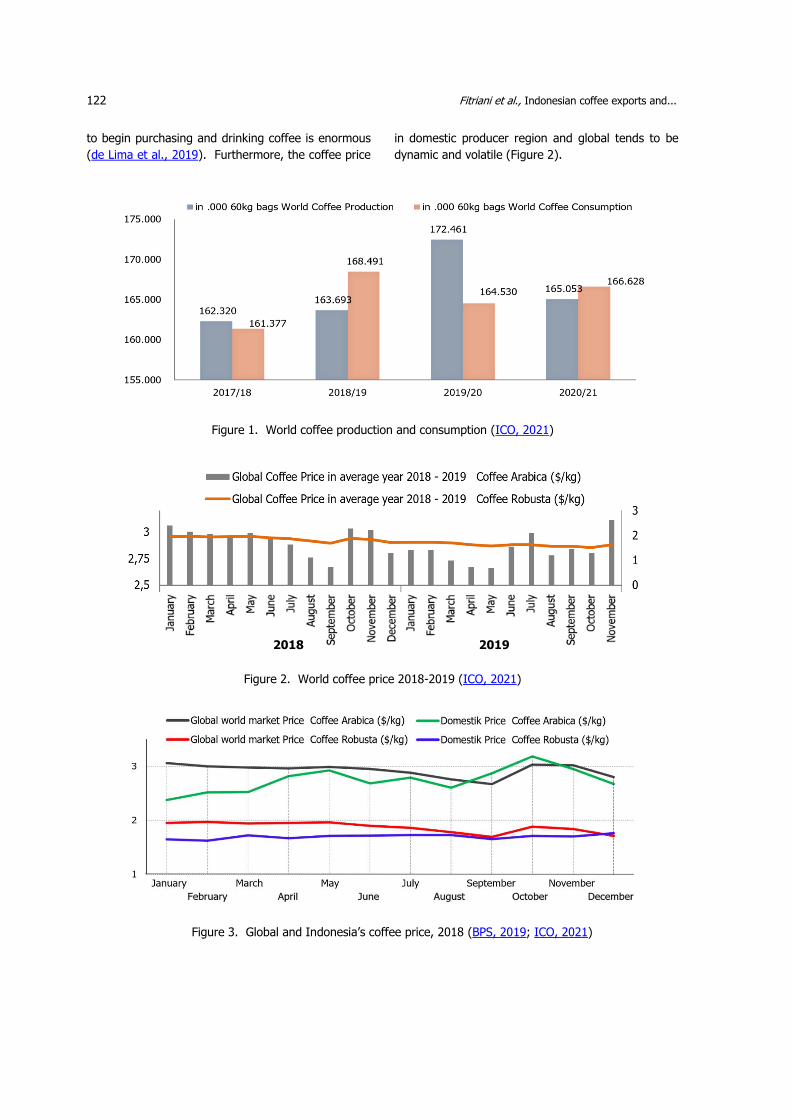
Figure 3. Global and Indonesia’s coffee price, 2018 (BPS, 2019; ICO, 2021)
2018 2019
123
Journal of Socioeconomics and Development, Vol 4, No 1, April 2021
Coffee as a tradable commodity has high volatility
in price (Suyamto and Noordwijk, 2004). Uncertainty
and the volatility of Indonesian coffee prices reflected
by the variations for prices have been experienced by
coffee producers in Indonesia, different from the
prices paid by consumers in the developed countries.
Coffee price in East Java is only valued between 4.8 to
24.2% of the retail price in the importing countries.
Coffee price in Lampung is much lower, only about 1.2
to 7.5% of the retail price in the importing countries
(Hutabarat, 2006).
The price of both robusta and arabica coffees at
the farm gate in Indonesia tends to fluctuate
compared to the global price (Figure 3). Arabica’s price
tends to fluctuate more than robusta’s. There is a
wide disparity of price between arabica and robusta.
Price is an important indicator for farmers as an
incentive for their production (Stigler, 1987). Price is
a key to better income and improving coffee grower’s
welfare. Even though coffee bean prices in Indonesia
is quite low, there is a strong relationship between the
coffee industry in Western Europe and the one in
Lampung, and a less stronger one between that and
the one in Jawa Timur (Hutabarat, 2006).
The dynamic movement of global coffee price is
linked with the coffee farm gate at the farmers’ level.
Previous studies about coffee farmer’s income in the
production center in West Lampung revealed that the
income from coffee farming (Incamilla et al., 2015)
was lower than Lampung's regional minimum wage
standard. This fact shows that smallholder's coffee
farming is not economically sustainable yet. Coffee
farmers face poverty and are still underdeveloped.
Vulnerability on coffee prices can reduce farmer's
motivation to improve their coffee farming. In many
producer countries, farmers are concerned with price
stability and access to market information, because
constraints in the coffee market evoke high exposure
to risks. During the past two decades, the “coffee
crisis” has threatened the social structure of
communities that rely heavily on coffee cultivation for
their livelihood. The crisis was more severe in Vietnam
than in Columbia. The change in commodity prices
affected land-use decisions on farms, and the
environmental services they provide (Li, 2013; Haggar
et al., 2013).
Based on the importance of prices for the welfare
of coffee farmers, this research seeks to find out such
issues as (1) How does the Indonesian coffee export
situation deal with price risks? (2) How does
Indonesian coffee export progress in the last two
decades and contribute to farmer’s welfare? and (3)
How does the relationship between coffee prices in
Indonesia and global prices?
The study of market integration will inform the
phenomenon of the price disparity between producers
and consumers. It has been exposed through several
studies, among which is Pioneer publication’s in spatial
market integration that belongs to Ravallion (1986).
Therefore, this study focuses on the Indonesian coffee
situation due to market connection or integration with
global trade. This deals with the Indonesian coffee
export situation related to global market participation.
Beside that, the study investigates the Indonesia
coffee market condition to pursue market integration
with global trade (London terminal). This information
will be meaningful to improve the coffee market
structure at the local and regional levels.
RESEARCH METHOD
The spatial market integration in agriculture
commodities is commonly measured by static price
correlations. Yet, a dynamic model can also be
advantageous through which one can distinguish
between the concepts of instantaneous market
integration and the less restrictive idea of integration
as a long-run target of the short-run dynamic
adjustment process. An influential change in spatial
market integration literature by using an error
correction model which allowed autocorrelation
problems distinguishes long and short-run dynamics
and seasonal components for spatial price differentials
(Ravallion, 1986). The prices of a commodity in two
markets are equal and their co-movement is perfect,
and when markets are integrated, price changes in a
market will be transmitted to the other market on a
one-for-one basis. The basic simple bivariate form is
tested by estimating (Eryigit & Karaman, 2011):
Pit = β1 +β2Pjt +εt ) ……… (1)
where Pit and Pjt are the logarithms of the prices in
the region i and j respectively. The satisfaction of
restrictions β1 = 0 and β2 = 1. Estimating an equation
of the above form, however, can lead to spurious
regression problems, since regressions of price levels
necessitate that the price series be stationary. The
most common approach is to take first the differences
of all non-stationary variables before specifying the
model. Time-series data may trend over time, i.e.,
124
Fitriani et al., Indonesian coffee exports and...
stochastic trends, a spurious regression might exist in
the presence of non-stationary variables. In this
situation, the method of co-integration can provide a
better way to test a more general notion of market
integration.
Suppose that trade is infinitely costly between two
market locations but that the time series of prices at
the two locations are synchronously, identically, and
linearly affected by another variable, in term of good
trade in a common market or a shared dynamic
seasonal structure in production, then one can readily
express price in one market as a linear function of
price in the other market, with slope unity, even
though the markets are segmented. Measurement of
market integration can be viewed as basic data for an
understanding of how specific markets work
(Ravallion, 1986).
Unit root test analysis is the first step to estimate
the model. Augmented Dickey-Fuller tests were
conducted to verify stationary or presence of unit root
in the individual series of the model. The next step
was cointegration tested by Johansen criteria. An
obvious procedure estimated a Vector Error Correction
Model (VECM) on the difference series to define the
lag order for the data analysis. The coffee market
integration model adopted the spatial market structure
by Ravallion (1986). The model is summarized as
follows.
P1 = f1 (P2, P3, ……….PN, X1) ……… (2)
Pi = fi (P1, X1) (i= 2, …. N) ……… (3)
with Xi (i=1, ……., N) a vector of other influences
on the local market. The function f1 (i=1, …..N) can
be thought of as a solution of appropriate conditions
for market equilibrium. Considering the dynamic effect
can arise from several conditions underlying
behavioral relations, the econometric model of the T-
period series of the price of N region was assumed:
P1t = ∑ 𝑎1𝑗𝑛𝑗=1 𝑃1𝑡 − 𝑗 +
∑ 𝑁𝑘=2 ∑ 𝑏𝑘1𝑗𝑛
𝑗=0 𝑃𝑘𝑡 − 𝑗 ……. (4)
Pit = ∑ 𝑎𝑖𝑗𝑛𝑗=1 𝑃𝑖𝑡 − 𝑗 + ∑ 𝑏𝑖𝑗𝑛
𝑗=0 𝑃 1𝑡 − 𝑗 +
𝑋𝑖𝑡 𝑐𝑖 + 𝑒 𝑖𝑡 ……. (5)
The e’s were appropriate error processes and the
a’s, b’s, and c’s were fixed.
The following hypotheses usually are testable:
1. Market segmentation (bij = 0; (j= 0, ......., n))
2. Short-run market integration (bio = 1)
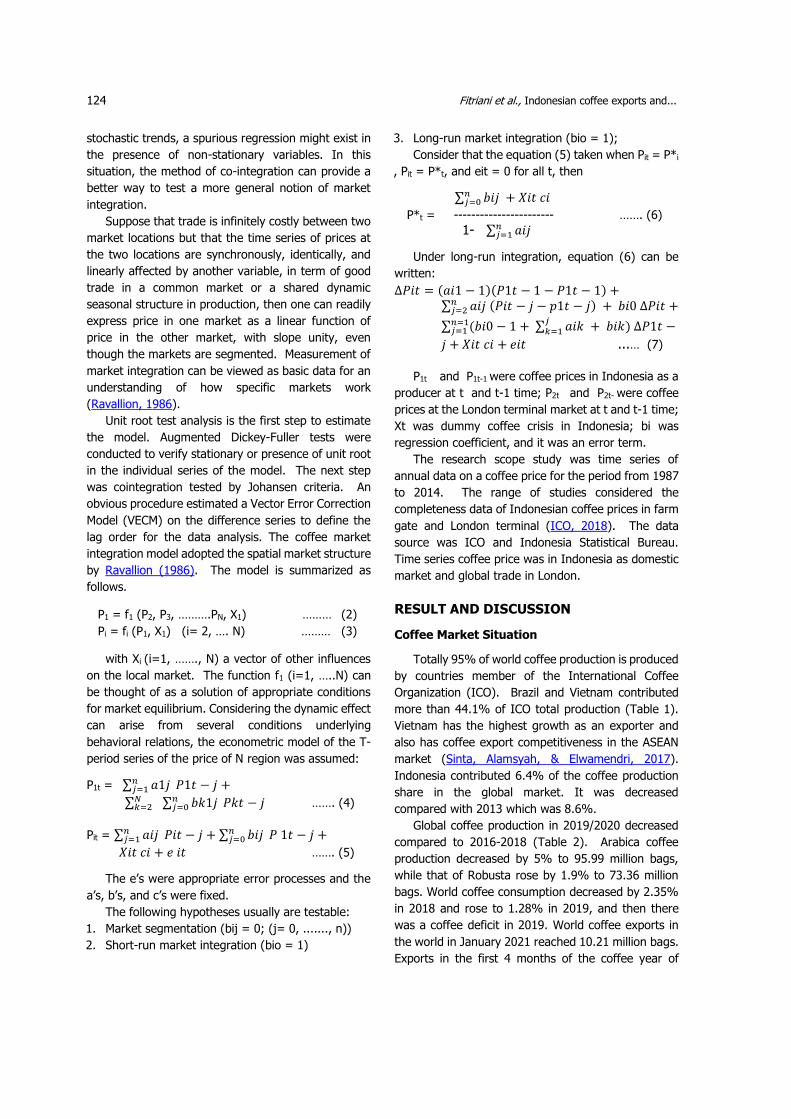
3. Long-run market integration (bio = 1);
Consider that the equation (5) taken when Pit = P*i
, Pit = P*t, and eit = 0 for all t, then
∑ 𝑏𝑖𝑗𝑛𝑗=0 + 𝑋𝑖𝑡 𝑐𝑖
P*t = ----------------------- ……. (6)
1- ∑ 𝑎𝑖𝑗𝑛𝑗=1
Under long-run integration, equation (6) can be
written:
∆𝑃𝑖𝑡 = (𝑎𝑖1 − 1)(𝑃1𝑡 − 1 − 𝑃1𝑡 − 1) + ∑ 𝑎𝑖𝑗 (𝑃𝑖𝑡 − 𝑗 − 𝑝1𝑡 − 𝑗) 𝑛
𝑗=2 + 𝑏𝑖0 ∆𝑃𝑖𝑡 +
∑ (𝑏𝑖0 − 1𝑛=1𝑗=1 + ∑ 𝑎𝑖𝑘
𝑗𝑘=1 + 𝑏𝑖𝑘) ∆𝑃1𝑡 −
𝑗 + 𝑋𝑖𝑡 𝑐𝑖 + 𝑒𝑖𝑡 ...… (7)
P1t and P1t-1 were coffee prices in Indonesia as a
producer at t and t-1 time; P2t and P2t- were coffee
prices at the London terminal market at t and t-1 time;
Xt was dummy coffee crisis in Indonesia; bi was
regression coefficient, and it was an error term.
The research scope study was time series of
annual data on a coffee price for the period from 1987
to 2014. The range of studies considered the
completeness data of Indonesian coffee prices in farm
gate and London terminal (ICO, 2018). The data
source was ICO and Indonesia Statistical Bureau.
Time series coffee price was in Indonesia as domestic
market and global trade in London.
RESULT AND DISCUSSION
Coffee Market Situation
Totally 95% of world coffee production is produced
by countries member of the International Coffee
Organization (ICO). Brazil and Vietnam contributed
more than 44.1% of ICO total production (Table 1).
Vietnam has the highest growth as an exporter and
also has coffee export competitiveness in the ASEAN
market (Sinta, Alamsyah, & Elwamendri, 2017).
Indonesia contributed 6.4% of the coffee production
share in the global market. It was decreased
compared with 2013 which was 8.6%.
Global coffee production in 2019/2020 decreased
compared to 2016-2018 (Table 2). Arabica coffee
production decreased by 5% to 95.99 million bags,
while that of Robusta rose by 1.9% to 73.36 million
bags. World coffee consumption decreased by 2.35%
in 2018 and rose to 1.28% in 2019, and then there
was a coffee deficit in 2019. World coffee exports in
the world in January 2021 reached 10.21 million bags.
Exports in the first 4 months of the coffee year of
125
Journal of Socioeconomics and Development, Vol 4, No 1, April 2021
2020/21 (Oct 20 to Jan 21) increased by 3.7% to
41.88 million bags compared to 40.38 million bags in
the same period in 2019/20. The Covid-19 pandemic
continues to put pressure on the global economy and
greatly limits out-of-home coffee consumption in
2020.
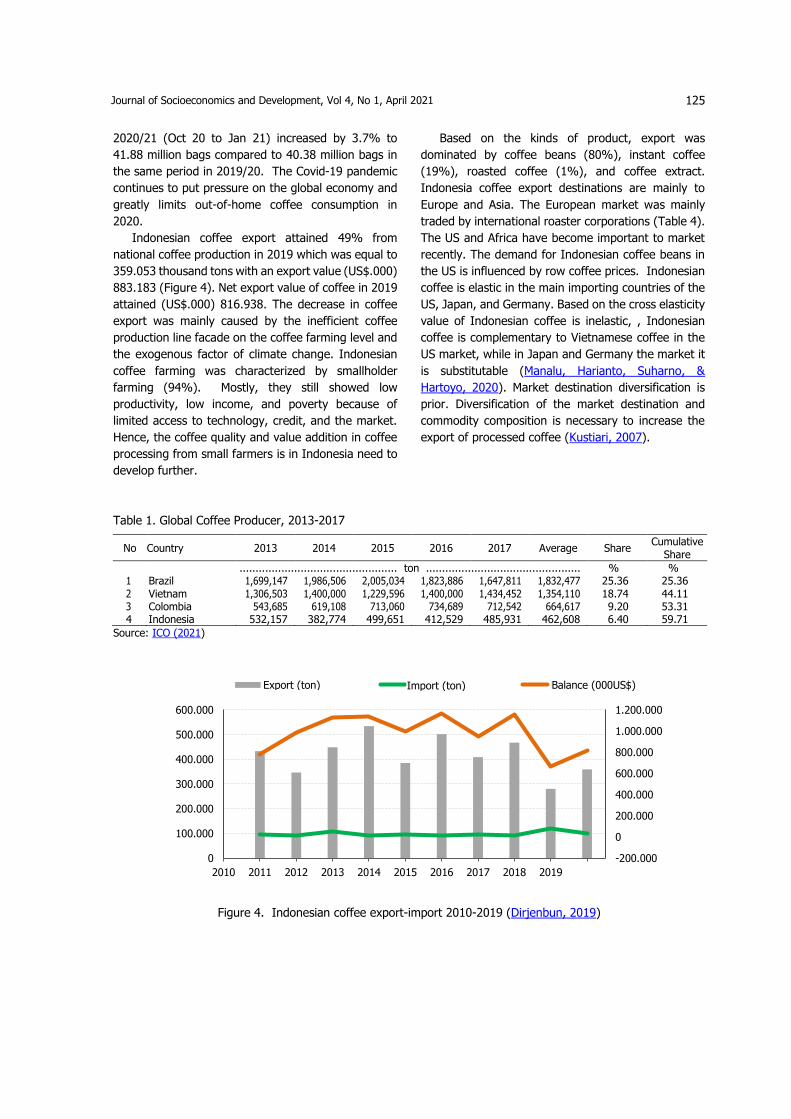
Indonesian coffee export attained 49% from
national coffee production in 2019 which was equal to
359.053 thousand tons with an export value (US$.000)
883.183 (Figure 4). Net export value of coffee in 2019
attained (US$.000) 816.938. The decrease in coffee
export was mainly caused by the inefficient coffee
production line facade on the coffee farming level and
the exogenous factor of climate change. Indonesian
coffee farming was characterized by smallholder
farming (94%). Mostly, they still showed low
productivity, low income, and poverty because of
limited access to technology, credit, and the market.
Hence, the coffee quality and value addition in coffee
processing from small farmers is in Indonesia need to
develop further.
Based on the kinds of product, export was
dominated by coffee beans (80%), instant coffee
(19%), roasted coffee (1%), and coffee extract.
Indonesia coffee export destinations are mainly to
Europe and Asia. The European market was mainly
traded by international roaster corporations (Table 4).
The US and Africa have become important to market
recently. The demand for Indonesian coffee beans in
the US is influenced by row coffee prices. Indonesian
coffee is elastic in the main importing countries of the
US, Japan, and Germany. Based on the cross elasticity
value of Indonesian coffee is inelastic, , Indonesian
coffee is complementary to Vietnamese coffee in the
US market, while in Japan and Germany the market it
is substitutable (Manalu, Harianto, Suharno, &
Hartoyo, 2020). Market destination diversification is
prior. Diversification of the market destination and
commodity composition is necessary to increase the
export of processed coffee (Kustiari, 2007).
Table 1. Global Coffee Producer, 2013-2017
No Country 2013 2014 2015 2016 2017 Average Share Cumulative
Share
................................................. ton ................................................ % % 1 Brazil 1,699,147 1,986,506 2,005,034 1,823,886 1,647,811 1,832,477 25.36 25.36 2 Vietnam 1,306,503 1,400,000 1,229,596 1,400,000 1,434,452 1,354,110 18.74 44.11 3 Colombia 543,685 619,108 713,060 734,689 712,542 664,617 9.20 53.31 4 Indonesia 532,157 382,774 499,651 412,529 485,931 462,608 6.40 59.71
Source: ICO (2021)
Figure 4. Indonesian coffee export-import 2010-2019 (Dirjenbun, 2019)
-200.000
0
200.000
400.000
600.000
800.000
1.000.000
1.200.000
0
100.000
200.000
300.000
400.000
500.000
600.000
2010 2011 2012 2013 2014 2015 2016 2017 2018 2019
Ekspor Volume (Ton) Impor Volume (Ton) Neraca Nilai (000 US$)Export (ton) Balance (000US$) Import (ton)
126
Fitriani et al., Indonesian coffee exports and...
Tabel 2. The Global Coffee Production and Consumption, 2016-2020
Year Production Growth Consumption Growth
000 60 kg % 000 60 kg % 2016/17 162,320 161,377 2017/18 163,693 0.85 168,491 4.41 2018/19 172,461 5.36 164,530 -2.35 2019/20 165,053 -4.30 166,628 1.28
Source: ICO (2021)
Table 3. Export-Import Value of Indonesian coffee 1980-2019
Year Export Import Balance
ton ton 000 US$ 2010 433,595 19,755 779,459 2011 346,493 18,108 987,552 2012 448,591 52,645 1,132,345 2013 534,023 15,800 1,135,191 2014 384,816 19,111 992,573 2015 502,021 12,462 1,166,243 2016 408,838 23,634 949,588 2017 467,790 14,221 1,153,304 2018 279,961 78,847 662,011 2019 359,053 32,102 816,938
Source: Dirjenbun (2019)
Indonesian Coffee Market Integration
Time series variables are faction from random and
stochastic processes. Stationery data need to run the
regression for time series analysis. Time series data
are often confined in non-stationary conditions. The
consequence makes the regression spurious. The unit
root test developed by Dickey-Fuller was one of the
robust tools to detect the stationery data. Integration
market analysis involved time series data prices at the
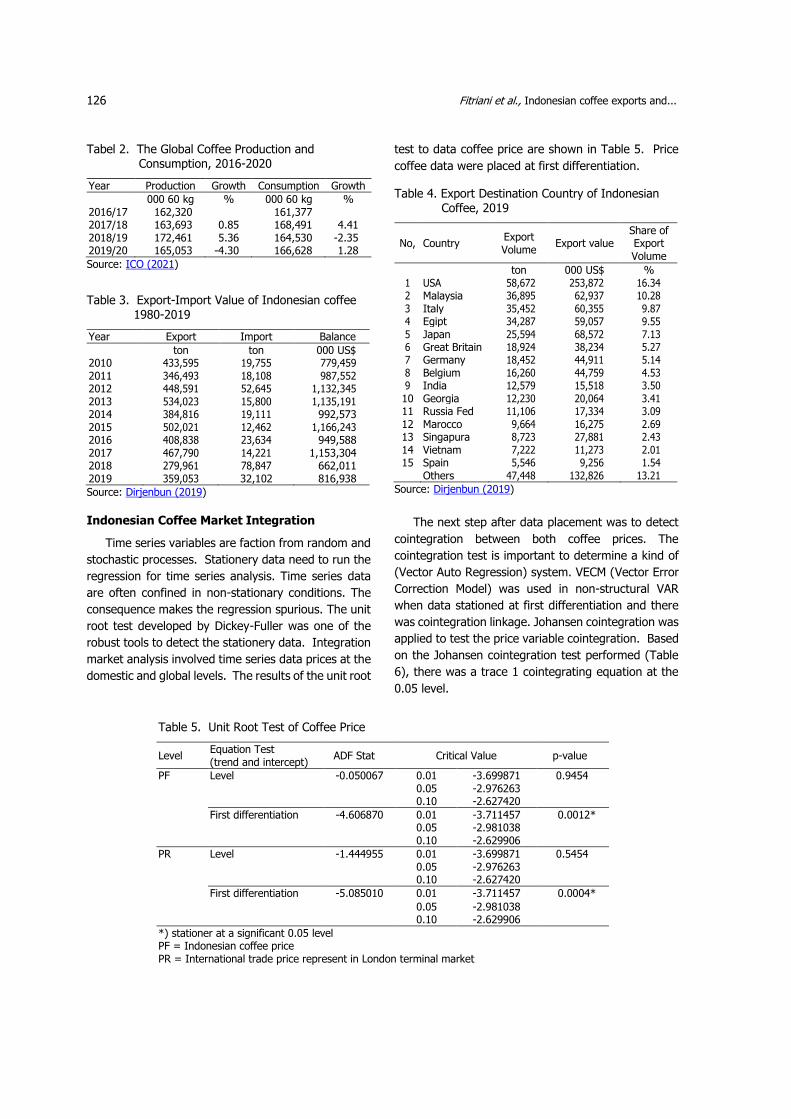
domestic and global levels. The results of the unit root
test to data coffee price are shown in Table 5. Price
coffee data were placed at first differentiation.
Table 4. Export Destination Country of Indonesian Coffee, 2019
No, Country Export Volume
Export value Share of Export Volume
ton 000 US$ % 1 USA 58,672 253,872 16.34 2 Malaysia 36,895 62,937 10.28 3 Italy 35,452 60,355 9.87 4 Egipt 34,287 59,057 9.55 5 Japan 25,594 68,572 7.13 6 Great Britain 18,924 38,234 5.27 7 Germany 18,452 44,911 5.14 8 Belgium 16,260 44,759 4.53 9 India 12,579 15,518 3.50 10 Georgia 12,230 20,064 3.41 11 Russia Fed 11,106 17,334 3.09 12 Marocco 9,664 16,275 2.69 13 Singapura 8,723 27,881 2.43 14 Vietnam 7,222 11,273 2.01 15 Spain 5,546 9,256 1.54
Others 47,448 132,826 13.21
Source: Dirjenbun (2019)
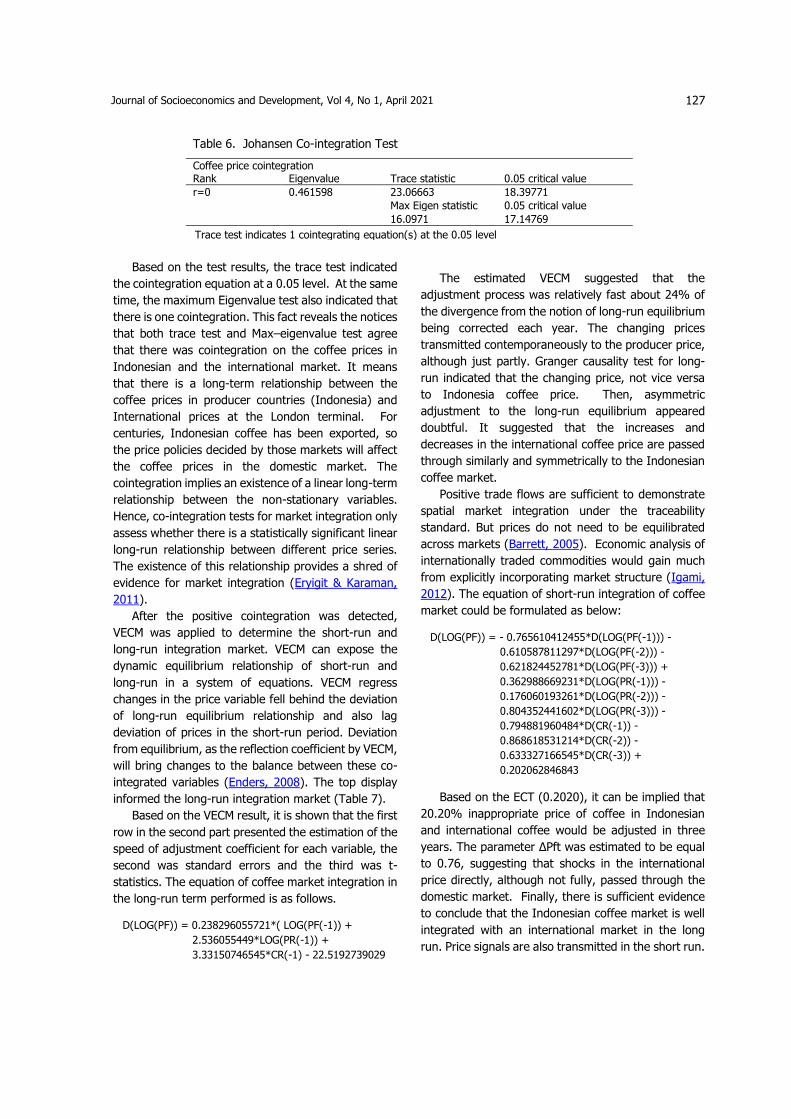
The next step after data placement was to detect
cointegration between both coffee prices. The
cointegration test is important to determine a kind of
(Vector Auto Regression) system. VECM (Vector Error
Correction Model) was used in non-structural VAR
when data stationed at first differentiation and there
was cointegration linkage. Johansen cointegration was
applied to test the price variable cointegration. Based
on the Johansen cointegration test performed (Table
6), there was a trace 1 cointegrating equation at the
0.05 level.
Table 5. Unit Root Test of Coffee Price
Level Equation Test (trend and intercept)
ADF Stat Critical Value p-value
PF Level -0.050067 0.01 -3.699871 0.9454 0.05 -2.976263 0.10 -2.627420
First differentiation -4.606870 0.01 -3.711457 0.0012* 0.05 -2.981038 0.10 -2.629906
PR Level -1.444955 0.01 -3.699871 0.5454 0.05 -2.976263 0.10 -2.627420
First differentiation -5.085010 0.01 -3.711457 0.0004*
0.05 -2.981038 0.10 -2.629906
*) stationer at a significant 0.05 level PF = Indonesian coffee price PR = International trade price represent in London terminal market
127
Journal of Socioeconomics and Development, Vol 4, No 1, April 2021
Table 6. Johansen Co-integration Test
Coffee price cointegration Rank Eigenvalue Trace statistic 0.05 critical value
r=0 0.461598 23.06663 18.39771
Max Eigen statistic 0.05 critical value
16.0971 17.14769
Trace test indicates 1 cointegrating equation(s) at the 0.05 level
Based on the test results, the trace test indicated
the cointegration equation at a 0.05 level. At the same
time, the maximum Eigenvalue test also indicated that
there is one cointegration. This fact reveals the notices
that both trace test and Max–eigenvalue test agree
that there was cointegration on the coffee prices in
Indonesian and the international market. It means
that there is a long-term relationship between the
coffee prices in producer countries (Indonesia) and
International prices at the London terminal. For
centuries, Indonesian coffee has been exported, so
the price policies decided by those markets will affect
the coffee prices in the domestic market. The
cointegration implies an existence of a linear long-term
relationship between the non-stationary variables.
Hence, co-integration tests for market integration only
assess whether there is a statistically significant linear
long-run relationship between different price series.
The existence of this relationship provides a shred of
evidence for market integration (Eryigit & Karaman,
2011).
After the positive cointegration was detected,
VECM was applied to determine the short-run and
long-run integration market. VECM can expose the
dynamic equilibrium relationship of short-run and
long-run in a system of equations. VECM regress
changes in the price variable fell behind the deviation
of long-run equilibrium relationship and also lag
deviation of prices in the short-run period. Deviation
from equilibrium, as the reflection coefficient by VECM,
will bring changes to the balance between these co-
integrated variables (Enders, 2008). The top display
informed the long-run integration market (Table 7).
Based on the VECM result, it is shown that the first
row in the second part presented the estimation of the
speed of adjustment coefficient for each variable, the
second was standard errors and the third was t-
statistics. The equation of coffee market integration in
the long-run term performed is as follows.
D(LOG(PF)) = 0.238296055721*( LOG(PF(-1)) +
2.536055449*LOG(PR(-1)) +
3.33150746545*CR(-1) - 22.5192739029
The estimated VECM suggested that the
adjustment process was relatively fast about 24% of
the divergence from the notion of long-run equilibrium
being corrected each year. The changing prices
transmitted contemporaneously to the producer price,
although just partly. Granger causality test for long-
run indicated that the changing price, not vice versa
to Indonesia coffee price. Then, asymmetric
adjustment to the long-run equilibrium appeared
doubtful. It suggested that the increases and
decreases in the international coffee price are passed
through similarly and symmetrically to the Indonesian
coffee market.
Positive trade flows are sufficient to demonstrate
spatial market integration under the traceability
standard. But prices do not need to be equilibrated
across markets (Barrett, 2005). Economic analysis of
internationally traded commodities would gain much
from explicitly incorporating market structure (Igami,
2012). The equation of short-run integration of coffee
market could be formulated as below:
D(LOG(PF)) = - 0.765610412455*D(LOG(PF(-1))) -
0.610587811297*D(LOG(PF(-2))) -
0.621824452781*D(LOG(PF(-3))) +
0.362988669231*D(LOG(PR(-1))) -
0.176060193261*D(LOG(PR(-2))) -
0.804352441602*D(LOG(PR(-3))) -
0.794881960484*D(CR(-1)) -
0.868618531214*D(CR(-2)) -
0.633327166545*D(CR(-3)) +
0.202062846843
Based on the ECT (0.2020), it can be implied that
20.20% inappropriate price of coffee in Indonesian
and international coffee would be adjusted in three
years. The parameter ∆Pft was estimated to be equal
to 0.76, suggesting that shocks in the international
price directly, although not fully, passed through the
domestic market. Finally, there is sufficient evidence
to conclude that the Indonesian coffee market is well
integrated with an international market in the long
run. Price signals are also transmitted in the short run.
128
Fitriani et al., Indonesian coffee exports and...
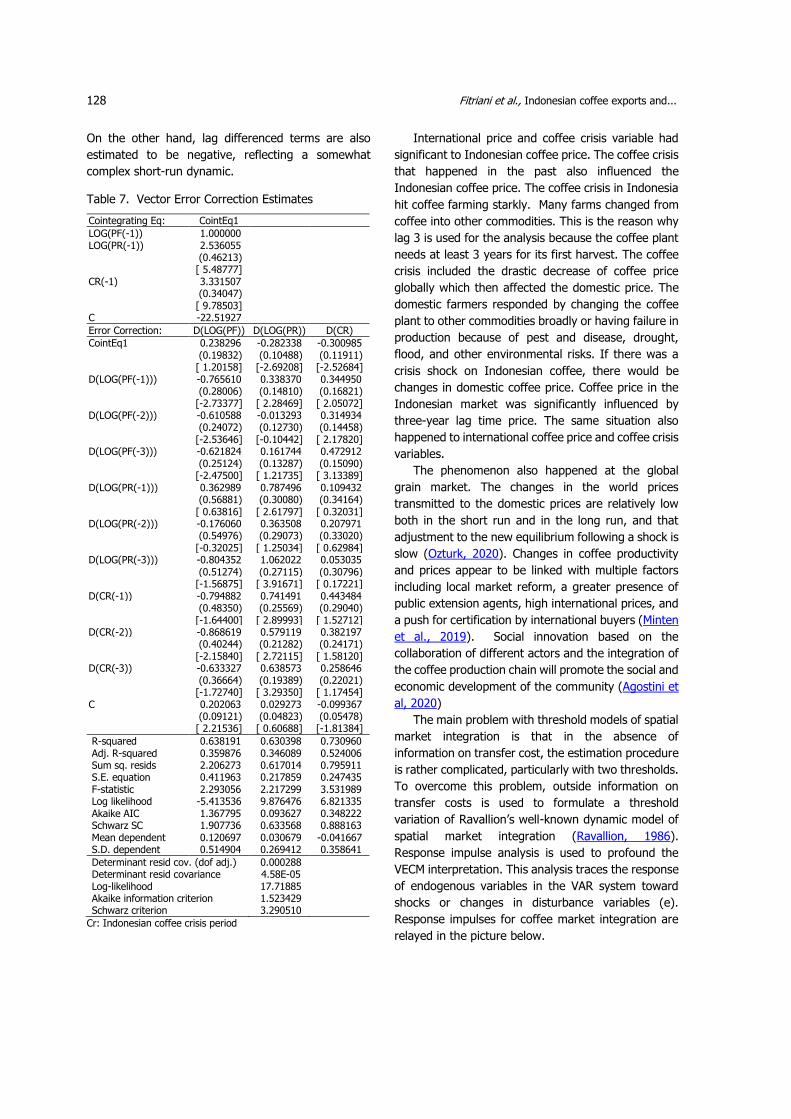
On the other hand, lag differenced terms are also
estimated to be negative, reflecting a somewhat
complex short-run dynamic.
Table 7. Vector Error Correction Estimates
Cointegrating Eq: CointEq1
LOG(PF(-1)) 1.000000 LOG(PR(-1)) 2.536055 (0.46213) [ 5.48777] CR(-1) 3.331507 (0.34047) [ 9.78503] C -22.51927
Error Correction: D(LOG(PF)) D(LOG(PR)) D(CR)
CointEq1 0.238296 -0.282338 -0.300985 (0.19832) (0.10488) (0.11911) [ 1.20158] [-2.69208] [-2.52684] D(LOG(PF(-1))) -0.765610 0.338370 0.344950 (0.28006) (0.14810) (0.16821) [-2.73377] [ 2.28469] [ 2.05072] D(LOG(PF(-2))) -0.610588 -0.013293 0.314934 (0.24072) (0.12730) (0.14458) [-2.53646] [-0.10442] [ 2.17820] D(LOG(PF(-3))) -0.621824 0.161744 0.472912 (0.25124) (0.13287) (0.15090) [-2.47500] [ 1.21735] [ 3.13389] D(LOG(PR(-1))) 0.362989 0.787496 0.109432 (0.56881) (0.30080) (0.34164) [ 0.63816] [ 2.61797] [ 0.32031] D(LOG(PR(-2))) -0.176060 0.363508 0.207971 (0.54976) (0.29073) (0.33020) [-0.32025] [ 1.25034] [ 0.62984] D(LOG(PR(-3))) -0.804352 1.062022 0.053035 (0.51274) (0.27115) (0.30796) [-1.56875] [ 3.91671] [ 0.17221] D(CR(-1)) -0.794882 0.741491 0.443484 (0.48350) (0.25569) (0.29040) [-1.64400] [ 2.89993] [ 1.52712] D(CR(-2)) -0.868619 0.579119 0.382197 (0.40244) (0.21282) (0.24171) [-2.15840] [ 2.72115] [ 1.58120] D(CR(-3)) -0.633327 0.638573 0.258646 (0.36664) (0.19389) (0.22021) [-1.72740] [ 3.29350] [ 1.17454] C 0.202063 0.029273 -0.099367 (0.09121) (0.04823) (0.05478) [ 2.21536] [ 0.60688] [-1.81384]
R-squared 0.638191 0.630398 0.730960 Adj. R-squared 0.359876 0.346089 0.524006 Sum sq. resids 2.206273 0.617014 0.795911 S.E. equation 0.411963 0.217859 0.247435 F-statistic 2.293056 2.217299 3.531989 Log likelihood -5.413536 9.876476 6.821335 Akaike AIC 1.367795 0.093627 0.348222 Schwarz SC 1.907736 0.633568 0.888163 Mean dependent 0.120697 0.030679 -0.041667 S.D. dependent 0.514904 0.269412 0.358641
Determinant resid cov. (dof adj.) 0.000288 Determinant resid covariance 4.58E-05 Log-likelihood 17.71885 Akaike information criterion 1.523429 Schwarz criterion 3.290510
Cr: Indonesian coffee crisis period
International price and coffee crisis variable had
significant to Indonesian coffee price. The coffee crisis
that happened in the past also influenced the
Indonesian coffee price. The coffee crisis in Indonesia
hit coffee farming starkly. Many farms changed from
coffee into other commodities. This is the reason why
lag 3 is used for the analysis because the coffee plant
needs at least 3 years for its first harvest. The coffee
crisis included the drastic decrease of coffee price
globally which then affected the domestic price. The
domestic farmers responded by changing the coffee
plant to other commodities broadly or having failure in
production because of pest and disease, drought,
flood, and other environmental risks. If there was a
crisis shock on Indonesian coffee, there would be
changes in domestic coffee price. Coffee price in the
Indonesian market was significantly influenced by
three-year lag time price. The same situation also
happened to international coffee price and coffee crisis
variables.
The phenomenon also happened at the global
grain market. The changes in the world prices
transmitted to the domestic prices are relatively low
both in the short run and in the long run, and that
adjustment to the new equilibrium following a shock is
slow (Ozturk, 2020). Changes in coffee productivity
and prices appear to be linked with multiple factors
including local market reform, a greater presence of
public extension agents, high international prices, and
a push for certification by international buyers (Minten
et al., 2019). Social innovation based on the
collaboration of different actors and the integration of
the coffee production chain will promote the social and
economic development of the community (Agostini et
al, 2020)
The main problem with threshold models of spatial
market integration is that in the absence of
information on transfer cost, the estimation procedure
is rather complicated, particularly with two thresholds.
To overcome this problem, outside information on
transfer costs is used to formulate a threshold
variation of Ravallion’s well-known dynamic model of
spatial market integration (Ravallion, 1986).
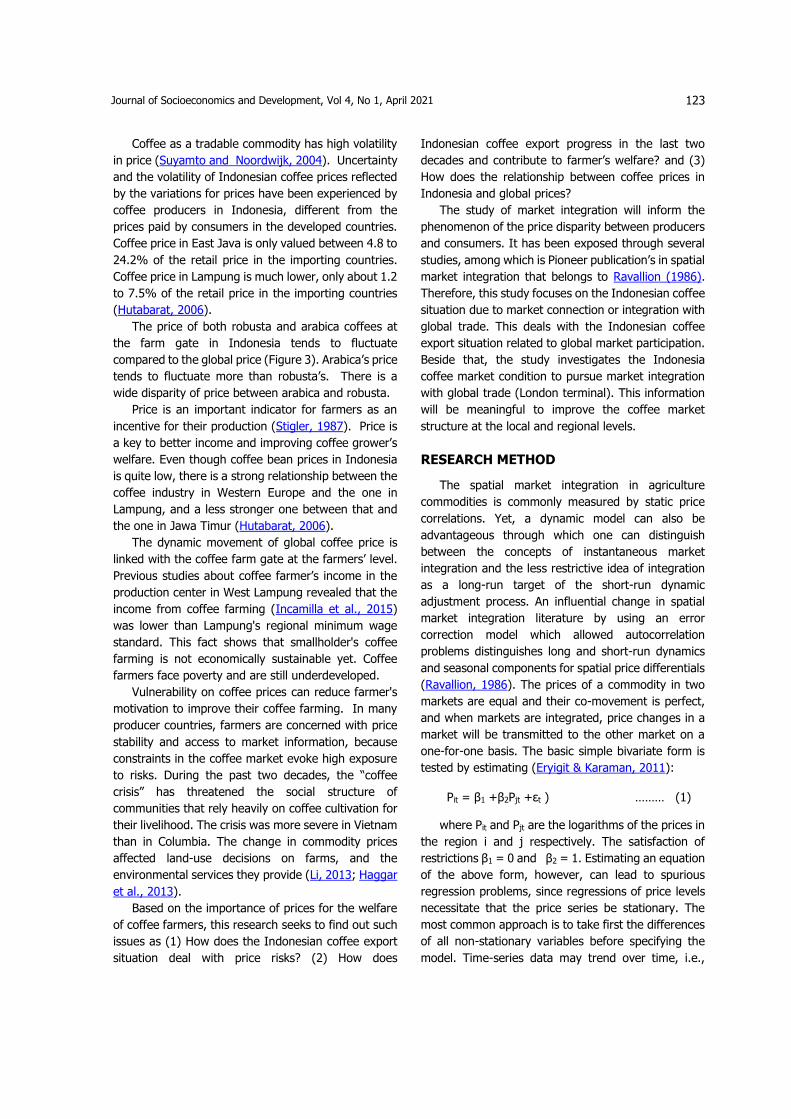
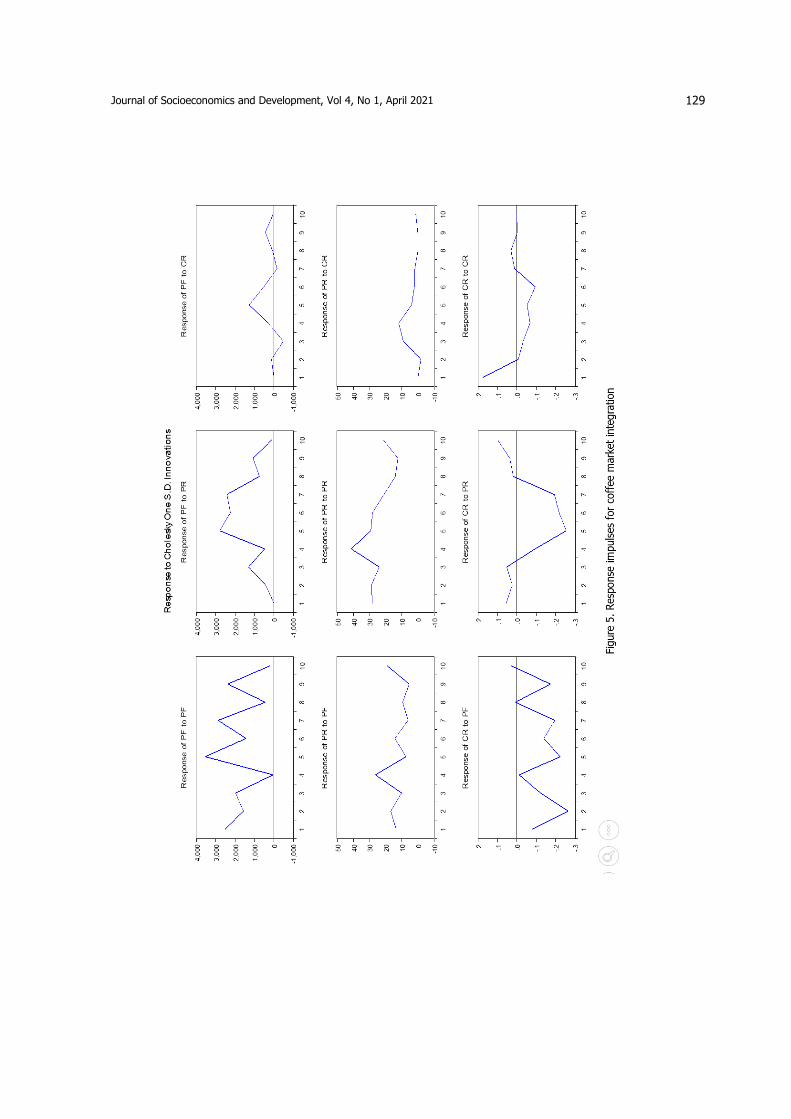
Response impulse analysis is used to profound the
VECM interpretation. This analysis traces the response
of endogenous variables in the VAR system toward
shocks or changes in disturbance variables (e).
Response impulses for coffee market integration are
relayed in the picture below.
129
Journal of Socioeconomics and Development, Vol 4, No 1, April 2021
130
Fitriani et al., Indonesian coffee exports and...
The top layer performed response of Log PF
toward shock in LOG PR and Log Cr. Shock caused by
the increasing international coffee price tended to be
followed by increasing Indonesian coffee price sharply
for 10 years forward. On the other hand, the coffee
crisis shocks affected Indonesian coffee price relatively
smoothly for 10 years forward. International coffee
price impulse response toward Indonesian coffee price
performed sharper than a coffee crisis for 10 years
forward. Some previous researches informed that a
few producers have the means required to successfully
achieve profitable and long-term market integration.
The opportunity for the biggest and best-connected
producers is necessary to exacerbate asymmetries
inside peasant smallholders farming communities and
weaken producers’ cooperatives (de la Vega-Leinert,
Brenner, & Stoll-Kleemann, 2016). There is strong
evidence of the link between the coffee price in the
European coffee industry and that in Lampung farm
gate as reported by Hutabarat (2006).
Research Implication
Based on the analysis, the implication of this
research focuses on the following issues. The
integration of commodity markets is very important in
determining an equitable value chain for all business
actors involved in it. An integrated market shows that
the information transmission that occurs at the
consumer market level is dispersed as information on
commodity prices at the producer level. The difference
in the results of the market integration index in the
short and long term is important to consider in the
policy of strengthening coffee farmers as the upstream
commodity supply chain. Global corporations that
drive vertical business value chains are important in
ensuring that their business practices do not come at
the expense of smallholders. Interconnections
between actors in the business chain need to be built
and intensively communicate various programs to
ensure the sustainability of quality coffee supplies
from farmers.
Price is the main incentive for farmers. The threat
of price fluctuations that tend to harm farmers can be
the reason for switching to other commodities that can
threaten the sustainability of coffee supplies.
Market price volatility can threaten sustainable
coffee, especially at the farm gate. The producer will
severely restrict the ability to pursue social,
environmental, and economic development.
Improving predictability and stability for producers,
exporters, and consumers alike through contractual
arrangements for promoting sustainability among
producers is necessary. The contractual arrangements
with an integrated approach addressing basic
economic issues within the context of other production
and trading practices are essential to provide a
reference point for all players along the supply chain,
especially enhance producer autonomy. Asymmetric
information on the actions of other players within the
coffee market usually lying between producers,
policymakers, roasters, and even consumers.
Minimum protectionist policies and lower levels of
government intervention increase the domestic
market integration with the international market
(Ozturk, 2020). For producers to successfully reap the
benefits of the international market, they must have
dependable, understandable, and up-to-date market
information as well as information on efficient
strategies for adjusting to market-changing market
conditions (Schuller et al., 2008).
Therefore, coffee business value chain actors
(form trade collector, roasting industry, intermediary
trader, manufactured industries, and exporter)
starting from a local and regional scale need to build
and develop the institutional capacity of partnerships,
especially in mutual- hubs corporation with coffee
farmers. The presence of corporate institutions at the
coffee farmer level is needed to capitalize on farming
capital, increase market access and price guarantees,
to sustain the supply chain capacity in the national to
the global coffee business value chain.
Changes appear to be linked with multiple factors
including local market reform, a greater presence of
public extension agents, high international prices, and
a push for certification by international buyers. On the
other hand, a combination of production (lack of
improved seedlings, weather, and disease shocks), as
well as institutional issues (saving constraints and lack
of vertical integration and traceability), have
seemingly impeded more widespread uptake of
improved practices and therefore better farm
performance. The eventually promote higher-value
coffee exports, with a better image of the country as
a high-quality coffee producer and a national trust-
worthy coffee bean classification system will improve
Indonesian coffee performance in global buyer sight.
The evolution of the coffee consumer profile with
131
Journal of Socioeconomics and Development, Vol 4, No 1, April 2021
market trends on coffee consumption is important (de
Lima et al., 2019).
The presence of the role of the government as a
regulator is needed to provide a business and
investment climate in favor of smallholder coffee
farmers, especially in access to capital, markets,
technology, and institutions. Fulfillment of the farmers’
needs-based approach is a priority. Enhance farmer's
access to credit and start-up funds for small producers
will provide the ability of such producers to enter into
such markets. Limitation on access to capital press the
ability of producers to adopt strategies towards
diversification both along the coffee supply chain as
well as into other product areas. The adoption of clear
and transparent management practices, combined
with the enhanced information on market conditions
typically associated with recognized sustainability
systems, improves the risk profile of producers,
thereby making them more worthy clients for credit.
It is also important to be present in facilitating the
improvement of the quality of human resources for
farmers through various field school programs and
training. The government also should prescribe export
and import policies. International trade policy is
necessary to enhance the productivity of coffee
agribusiness development.
CONCLUSION AND SUGGESTION
Indonesian coffee export performs progressively in
the last decade. The export destinations countries for
Indonesian coffee also develop broadly. There was
market integration on the Indonesian coffee market
and global price in the London terminal in the period
of 1987-2014. Although not fully, the shock in the
international price was somehow felt in the Indonesian
coffee market. There was a shred of sufficient
evidence to conclude that the Indonesian coffee
market is well integrated with the international market
in the long run. There was a 20.20% inappropriate
coffee price in Indonesia coffee and International
coffee will be adjusted in three years. In the short
term, 76% of Indonesian coffee price was influenced
by international price changes, but not vice versa.
The facts indicate that global coffee price mainly
steers the Indonesian coffee market, but this
Indonesian market information is not complete yet.
The market concentration on vertical integration
needs to be explored deeply. Market concentration is
another evidence related to the possibility of
asymmetric global coffee price workability.
The integrated transmission of coffee price
information at local, regional and global market levels
is important information in building a fair coffee
business value chain. The "coffee paradox"
phenomenon that has emerged due to the
contradiction between the condition of coffee farmers
with their poverty problem and the condition of
consumers who enjoy luxurious coffee needs to be
addressed carefully. Farmers as the starting point for
coffee production are the weakest actors. Only with
systematic and directed efforts with clear indicators of
achievement of improvement in farmer welfare can
coffee farmers be empowered. Strengthening and
increasing the capacity of farmers can be done
through the implementation of the principles of
corporate share value by corporate stakeholders in the
coffee business chain. Increasing the business
competitiveness of coffee entrepreneurs must be
integrated with efforts to strengthen equitable supply
chain lines. Empowered coffee farmers will be able to
ensure coffee production according to GAP, handle
harvest according to GMP, and have a good bargaining
position in price and market negotiations. Thus, coffee
farming income increases and farmers are empowered
and resilient.
REFERENCES
Agostini, M. R., Bitencourt, C. C., & Vieira, L. M. (2020). Social innovation in Mexican coffee production: filling ‘institutional voids.’ International Review of Applied Economics, 34(5), 607–625. https://doi.org/10.1080/02692171.2019.1638351
Amiti, M., Redding, S., & Weinstein, D. E. (2019). The Impact of the 2018 tariffs on prices and welfare. The Journal of Economic Perspective, 33(4), 187–
210. https://doi.org/10.1257/jep.33.4.187
Barrett, C. B. (2005). Spatial Market Integration. (August), 1–7. The New Palgrave Dictionary of Economics, 2nd Edition, Lawrence E. Blume, Steven N. Durlauf, eds., London: Palgrave Macmillan, Retrieved from https://ssrn.com/abstract=1142520
BPS. (2019). Indonesian Coffee Statistics. Jakarta: BPS Indonesia. Retrieved from https://www.bps.go.id/publication/2020/12/02/de27ead7c1c7e29fd0aa950d/statistik-kopi-indonesia-2019.html
132
Fitriani et al., Indonesian coffee exports and...
CBI. (2020). What trends offer opportunities or risks in the European coffee market? CBI - Centre for the Promotion of Imports from developing countries. In CBI market information tools. Retrieved from https://www.cbi.eu/node/796/pdf
de Almeida, L. F., & Vegro, C. L. R. (2020). Coffee consumption and industry strategies in Braziel global coffee market: Socio-economic and cultural dynamics. In de Almeida, L. F. & Spers, E. E. (Eds.), Coffee Consumption and Industry Strategies in Brazil (p. 398). Elsevier Inc. All rights reserved. https://books.google.co.id/books?id= 7XSvDwAAQBAJ
de la Vega-Leinert, A. C., Brenner, L., & Stoll-Kleemann, S. (2016). Peasant coffee in the Los Tuxtlas Biosphere Reserve, Mexico: A critical evaluation of sustainable intensification and market integration potential. Elementa: Science of the Anthropocene, 4, 000139. https:// doi.org/10.12952/journal.elementa.000139
de Lima, L. M., de Pellegrini Elias, L., e Silva, M. M. C. D., da Silva, K. V., & Pacheco, A. S. V. (2019). Behavioral aspects of the coffee consumer in different countries: The case of Brazil. In Coffee Consumption and Industry Strategies in Brazil: A Volume in the Consumer Science and Strategic
Marketing Series. https://doi.org/10.1016/B978-0-12-814721-4.00016-0
Dirjenbun. (2019). Statistik Perkebunan Indonesia 2018-2020. Buku Statistik Perkebunan Indonesia, 1–82. Retrieved from https://drive.google.com/file/d/1Ku4Nq8BzEcV4svDw1nV28eeaXqFjltfE/view
Enders, W. (2008). Applied Econometric Time Series. In John Wiley & Sons. https: //books.google.co.id/books?id=zvjcxeynHtoC
Eryigit, K. Y., & Karaman, S. (2011). Testing for spatial market integration and law of one price in Turkish wheat markets. Qual Quant, 45(April), 1519–1530.
https://doi.org/10.1007/s11135-010-9320-1
Haggar, J., Medina, B., Maria, R., & Sun, I. Á. (2013). Land use change on coffee farms in Southern Guatemala and its environmental consequences. 811–823. https://doi.org/10.1007/s00267-013-0019-7
Hutabarat, B. (2006). Analisis saling-pengaruh harga kopi Indonesia dan Dunia. Jurnal Agro Ekonomi, 24(1), 21–40. http://doi.org/10.21082/jae.v24n1.2006.21-40
ICO. (2018). Monthly data of coffee production. International Coffee Organization. London. Retrieved from http://www.ico.org/
ICO. (2021). Global Coffee Production. International Coffee Organization. London. Retrieved from http://www.ico.org/
Igami, M. (2012). Oligopoly in International Commodity Markets : The Case of Coffee Beans. 1–37. Retrieved from https://economics.yale.edu/ sites/default/files/igami-120926.pdf
Igo, S. E. (2020). Figuring the population bomb: gender and demography in the mid-twentieth century: By Carole R. McCann. Environmental History, 25(4), 811–813. https://doi.org/10.1093/envhis/emaa036
Incamilla, A., Arifin, B., & Nugraha, A. (2015). Keberlanjutan usahatani kopi agroforestri di Kecamatan Pulau Panggung Kabupaten Tanggamus. Jurnal Ilmu-Ilmu Agribisnis, 3(3), 260–267. Retrieved from http://jurnal. fp.unila.ac.id/index.php/JIA/article/view/1050
Kustiari, R. (2007). Perkembangan pasar kopi dunia dan implikasinya bagi Indonesia. Forum Penelitian Agro Ekonomi, 25(1), 43-55. https://doi.org/10.21082/fae.v25n1.2007.43-55
Lee, J., Geref, G., & Beauvais, J. (2012). Global value chains and agrifood standards : Challenges and possibilities for smallholders in developing
countries. PNAS (Proceedings of the National
Academy of Sciences), 109(July), 12326–12331. https://doi.org/10.1073/pnas.0913714108
Li, X. & Saghaian, S. (2013). An empirical comparison of coffee price transmission in Vietnam and Colombia. Agricultural and Applied Economics Association (AAEA) Conferences, 2013 Annual Meeting, August 4-6, 2013, Washington, D.C. 1–18. Retrieved from https://ageconsearch.umn.edu/record/150625/
Manalu, D. S. T., Harianto, H., Suharno, S., & Hartoyo, S. (2020). Permintaan kopi biji indonesia di pasar internasional. Agriekonomika, 9(1), 114–126. https://doi.org/10.21107/agriekonomika.v9i1.7346
Mengistie, B. T. (2020). Consumers’ awareness on their basic rights and willingness to pay for organic vegetables in Ethiopia. Journal of Socioeconomics and Development, 3(1), 1-15. https://doi.org/10.31328/jsed.v3i1.1278
Minten, B., Dereje, M., Engida, E., & Kuma, T. (2019). Coffee value chains on the move: Evidence in Ethiopia. Food Policy, 83, 370–383. https://doi.org/10.1016/j.foodpol.2017.07.012
Muradian, R., & Pelupessy, W. (2005). Governing the coffee chain : The role of voluntary regulatory
133
Journal of Socioeconomics and Development, Vol 4, No 1, April 2021
systems. World Development, 33(12), 2029–2044. https://doi.org/10.1016/j.worlddev.2005.06.007
Ozturk, O. (2020). Market integration and spatial price transmission in grain markets of Turkey. Applied Economics, 52(18), 1936–1948. https://doi.org/10.1080/00036846.2020.1726862
Ramos, E., Mesia, R., Matos, D., & Ruiz, S. (2019). Organic coffee supply chain source process integration: A Peruvian case. International Journal of Supply Chain Management, 8(6), 133–145. Retrieved from https://ojs.excelingtech.co.uk/ index.php/IJSCM/article/view/2623
Ravallion, M. (1986). Testing market integration. American Journal of Agricultural Economics, 68(1), 102-107. https://doi.org/10.2307/1241654
Schuller, S., Vagneron, I., Killian, B., Pinard, F., Schroeder, K., Potts, J., … Giovannucci, D. (2008). Seeking Sustainability: COSA preliminary analysis of sustainability initiatives in the coffee sector. International Institute of Sustainable Development (IISD). Retrieved from https://www.iisd.org/system/files/publications/seeking_sustainability.pdf
Simamora, S. D. (2014). Market Brief: Langkah dan Strategi Ekspor ke Uni Eropa: Produk Kopi. Retrieved from https://apindo.or.id/id/publikasi/ makalah-penelitian/market-brief-langkah-dan-strategi-ekspor-ke-uni-eropa-produk-kopi.
Sinta, N. M., Alamsyah, Z., & Elwamendri. (2017). Analisis daya saing ekspor kopi Indonesia dan Vietnam di pasar Asean. Jurnal Ilmiah Sosio
Ekonomika Bisnis, 20(1). 3-11. https://doi.org/10.22437/jiseb.v20i1.5028
Stigler, G. J. (1987). The Theory of Price. MacMillan Publishing Company. https://books.google.co.id/ books?id=3hO8AAAAIAAJ
Suyamto, D. A., & Noordwijk, M. Van. (2004). Respon petani kopi terhadap gejolak pasar dan konsekuensinya terhadap fungsi tata air: Suatu pendekatan pemodelan. AGRIVITA, 26(1), 14–17.
Zeho, F. H., Prabowo, A., Estiningtyas, R. A., Mahadiansar, M., & Sentanu, I. G. E. P. S. (2020). Stakeholder collaboration to support accountability in village fund management and rural development. Journal of Socioeconomics and Development, 3(2), 89-100. https://doi.org/10.31328/jsed.v3i2.1395