Embed Size (px)
Citation preview
Indonesian Palm Oil Industry Outlook 2017
M. Fadhil Hasan
Indonesian Palm Oil Association (IPOA)
Council of Palm Oil Producing Countries (CPOPC)
Outline presentation
• Global market situation and trends.
• Indonesian palm oil production: historical and trends.
• Trends in consumption and exports.
• Price: historical and trends.
• Prospect 2017

Global market situation and trends
• Key drivers of growth; rising population and income, most efficient and productive vegetable oils, expansion of use (alternate source of energy), increasing demand of biodiesel.
• Key challenges of growth; slowing down of world economic growth, narrowing gap of price with other vegetable oils, increasing cost of production, continue negative campaign,and adverse weather conditions.
• Key trends in the future; increasing consumpton of biodiesel, increasing use of sustainable palm oil, more scare lands, and increasing cost of production especially labor, consolidation of industry (mergers and acquisitions).
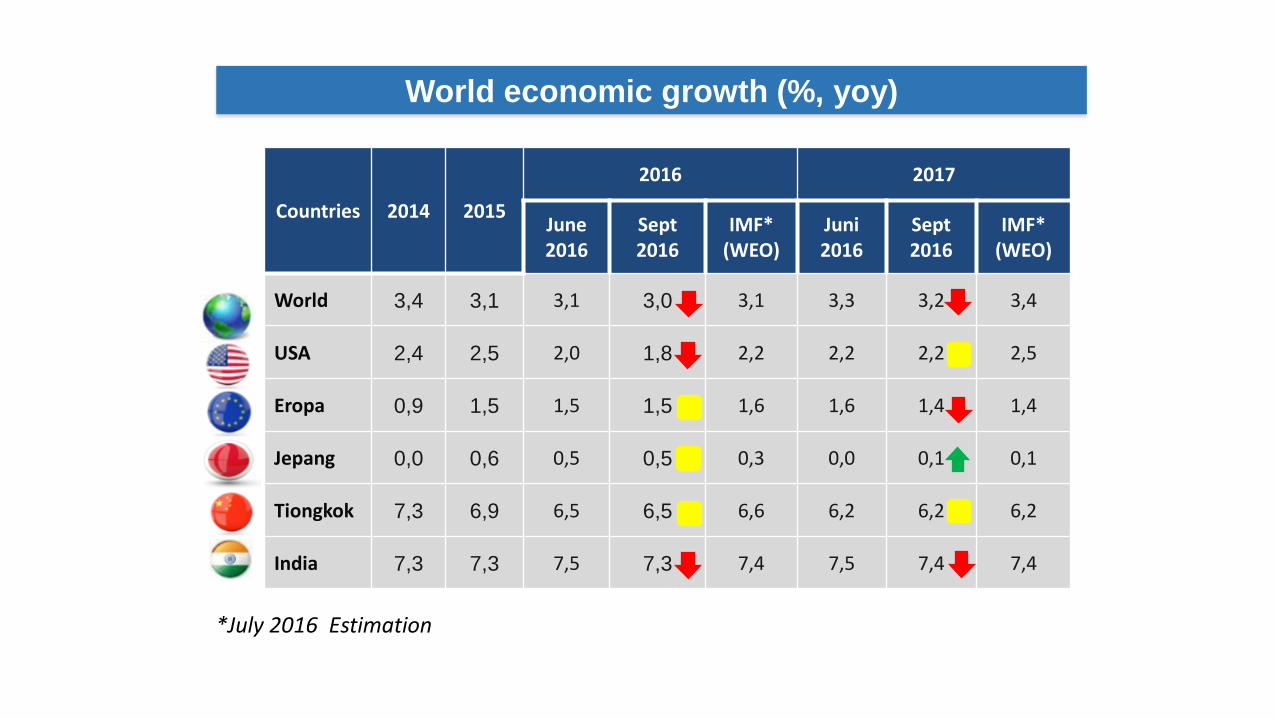
World economic growth (%, yoy)
Countries 2014 2015
2016 2017
June 2016
Sept 2016
IMF* (WEO)
Juni 2016
Sept 2016
IMF* (WEO)
World 3,4 3,1 3,1 3,0 3,1 3,3 3,2 3,4
USA 2,4 2,5 2,0 1,8 2,2 2,2 2,2 2,5
Eropa 0,9 1,5 1,5 1,5 1,6 1,6 1,4 1,4
Jepang 0,0 0,6 0,5 0,5 0,3 0,0 0,1 0,1
Tiongkok 7,3 6,9 6,5 6,5 6,6 6,2 6,2 6,2
India 7,3 7,3 7,5 7,3 7,4 7,5 7,4 7,4
*July 2016 Estimation
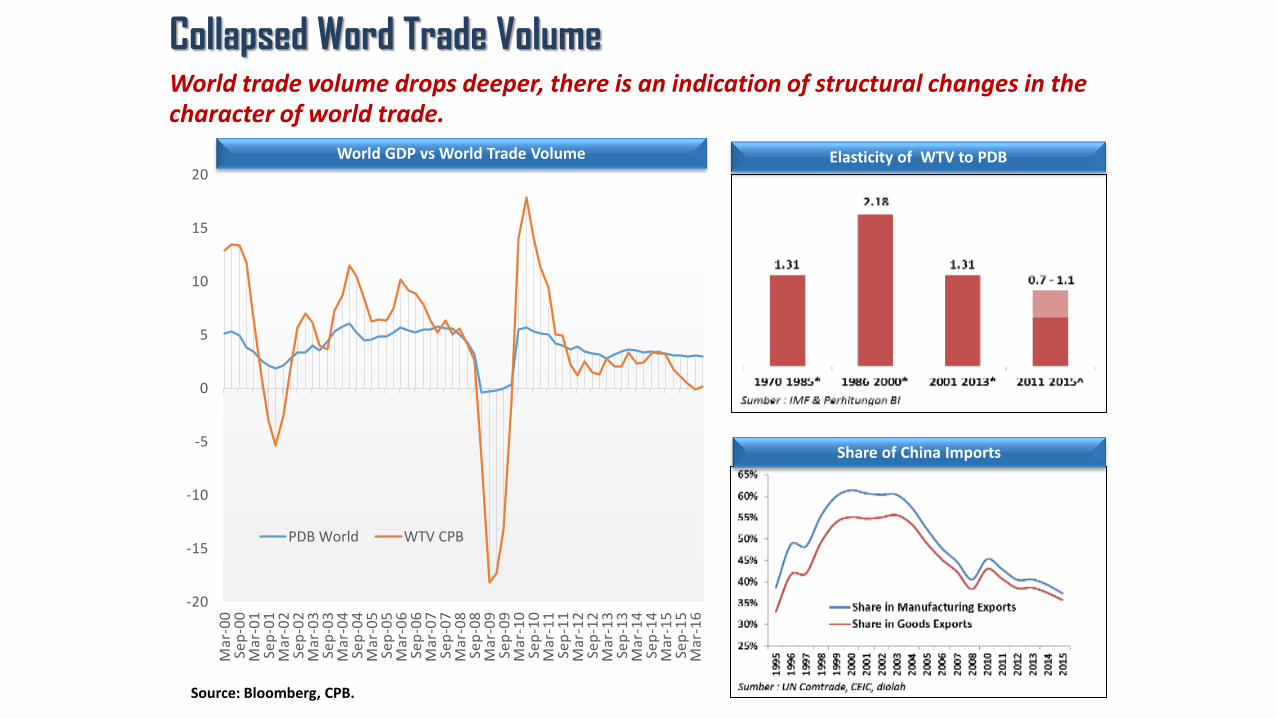
Collapsed Word Trade Volume
Source: Bloomberg, CPB.
World trade volume drops deeper, there is an indication of structural changes in the character of world trade.
-20
-15
-10
-5
0
5
10
15
20
Mar
-00
Se
p-0
0
Mar
-01
Se
p-0
1
Mar
-02
Se
p-0
2
Mar
-03
Se
p-0
3
Mar
-04
Se
p-0
4
Mar
-05
Se
p-0
5
Mar
-06
Se
p-0
6
Mar
-07
Se
p-0
7
Mar
-08
Se
p-0
8
Mar
-09
Se
p-0
9
Mar
-10
Se
p-1
0
Mar
-11
Se
p-1
1
Mar
-12
Se
p-1
2
Mar
-13
Se
p-1
3
Mar
-14
Se
p-1
4
Mar
-15
Se
p-1
5
Mar
-16
PDB World WTV CPB
Elasticity of WTV to PDB World GDP vs World Trade Volume
Share of China Imports
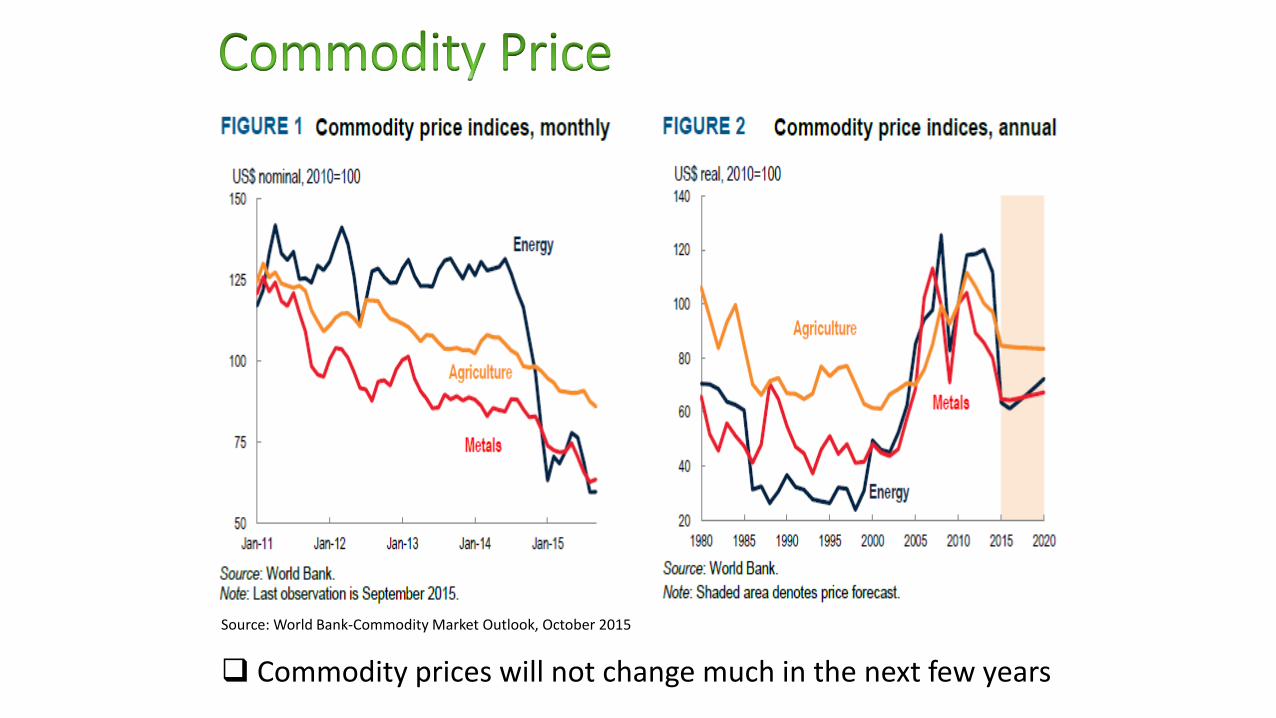
Commodity prices will not change much in the next few years
Source: World Bank-Commodity Market Outlook, October 2015
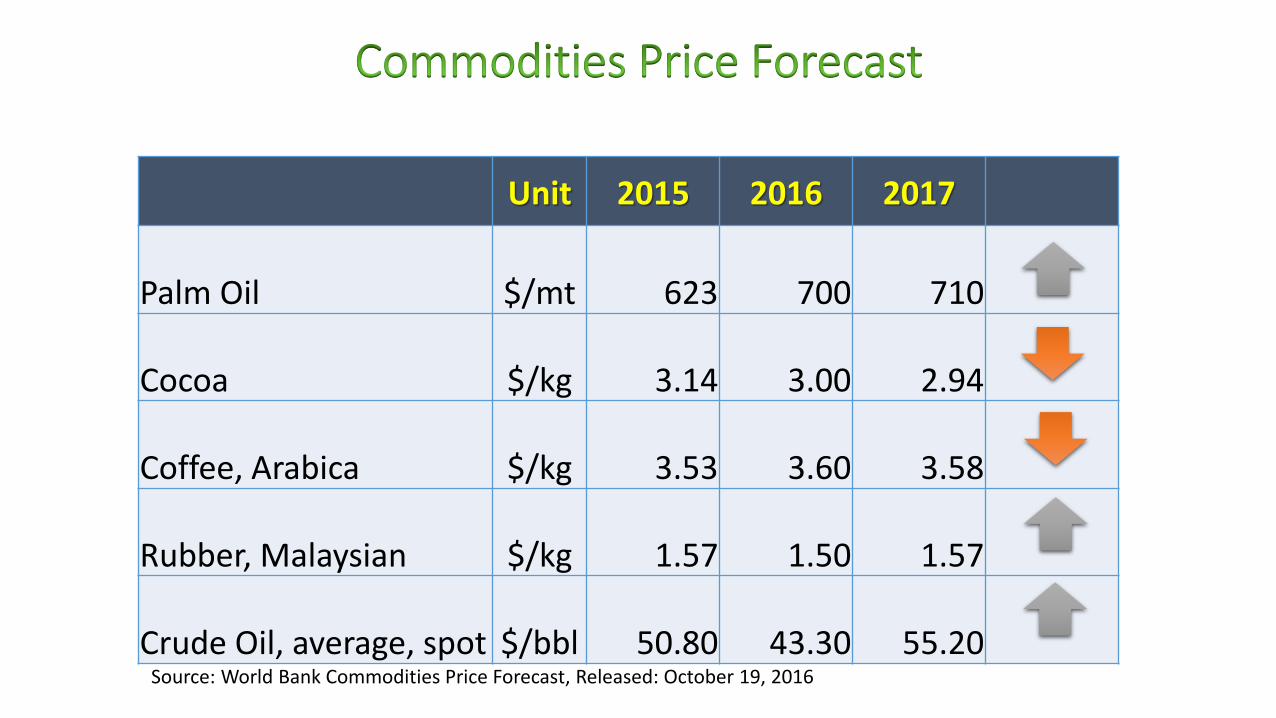
Unit 2015 2016 2017
Palm Oil $/mt
623
700
710
Cocoa $/kg
3.14
3.00
2.94
Coffee, Arabica $/kg
3.53
3.60
3.58
Rubber, Malaysian $/kg
1.57
1.50
1.57
Crude Oil, average, spot $/bbl
50.80
43.30
55.20 Source: World Bank Commodities Price Forecast, Released: October 19, 2016
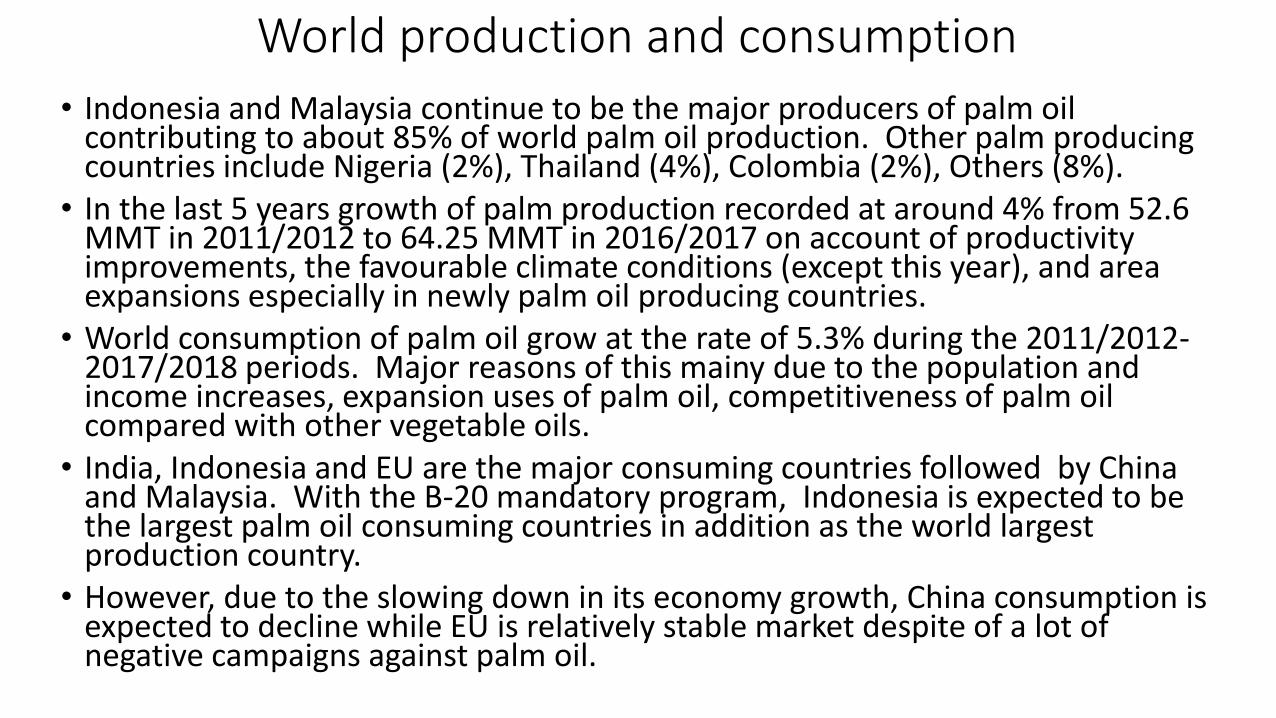
World production and consumption
• Indonesia and Malaysia continue to be the major producers of palm oil contributing to about 85% of world palm oil production. Other palm producing countries include Nigeria (2%), Thailand (4%), Colombia (2%), Others (8%).
• In the last 5 years growth of palm production recorded at around 4% from 52.6 MMT in 2011/2012 to 64.25 MMT in 2016/2017 on account of productivity improvements, the favourable climate conditions (except this year), and area expansions especially in newly palm oil producing countries.
• World consumption of palm oil grow at the rate of 5.3% during the 2011/2012-2017/2018 periods. Major reasons of this mainy due to the population and income increases, expansion uses of palm oil, competitiveness of palm oil compared with other vegetable oils.
• India, Indonesia and EU are the major consuming countries followed by China and Malaysia. With the B-20 mandatory program, Indonesia is expected to be the largest palm oil consuming countries in addition as the world largest production country.
• However, due to the slowing down in its economy growth, China consumption is expected to decline while EU is relatively stable market despite of a lot of negative campaigns against palm oil.
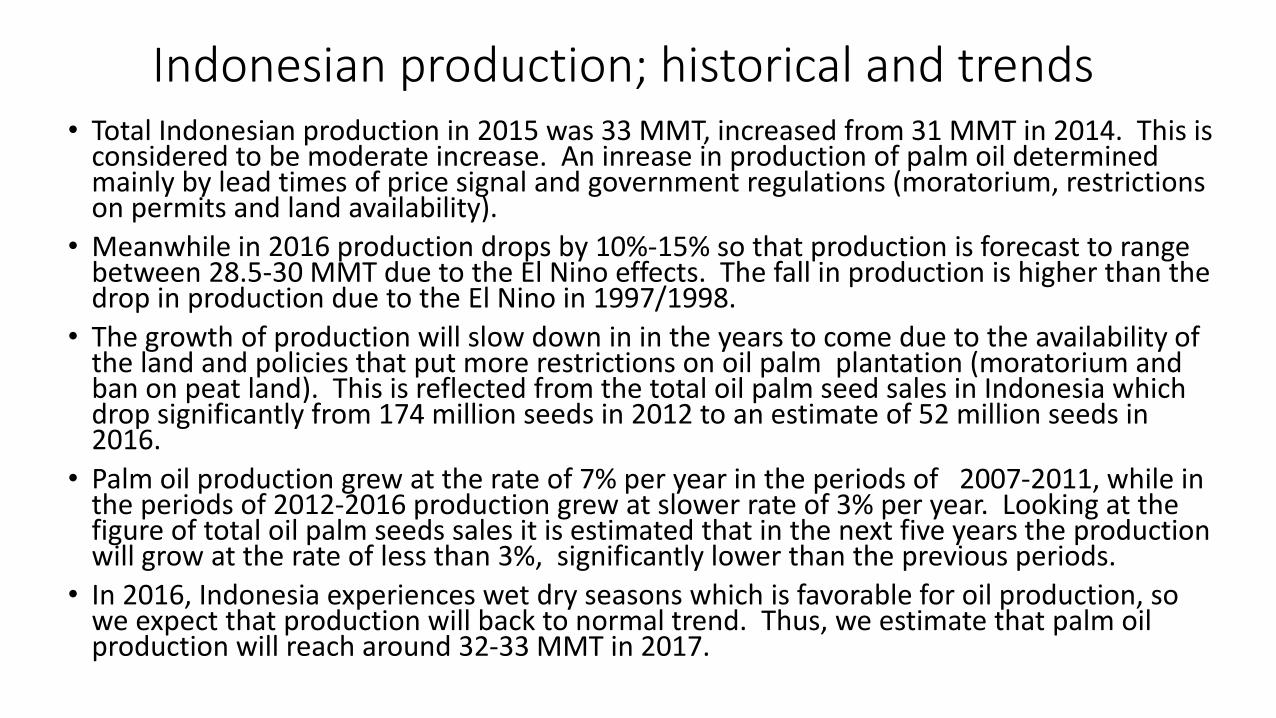
Indonesian production; historical and trends • Total Indonesian production in 2015 was 33 MMT, increased from 31 MMT in 2014. This is
considered to be moderate increase. An inrease in production of palm oil determined mainly by lead times of price signal and government regulations (moratorium, restrictions on permits and land availability).
• Meanwhile in 2016 production drops by 10%-15% so that production is forecast to range between 28.5-30 MMT due to the El Nino effects. The fall in production is higher than the drop in production due to the El Nino in 1997/1998.
• The growth of production will slow down in in the years to come due to the availability of the land and policies that put more restrictions on oil palm plantation (moratorium and ban on peat land). This is reflected from the total oil palm seed sales in Indonesia which drop significantly from 174 million seeds in 2012 to an estimate of 52 million seeds in 2016.
• Palm oil production grew at the rate of 7% per year in the periods of 2007-2011, while in the periods of 2012-2016 production grew at slower rate of 3% per year. Looking at the figure of total oil palm seeds sales it is estimated that in the next five years the production will grow at the rate of less than 3%, significantly lower than the previous periods.
• In 2016, Indonesia experiences wet dry seasons which is favorable for oil production, so we expect that production will back to normal trend. Thus, we estimate that palm oil production will reach around 32-33 MMT in 2017.
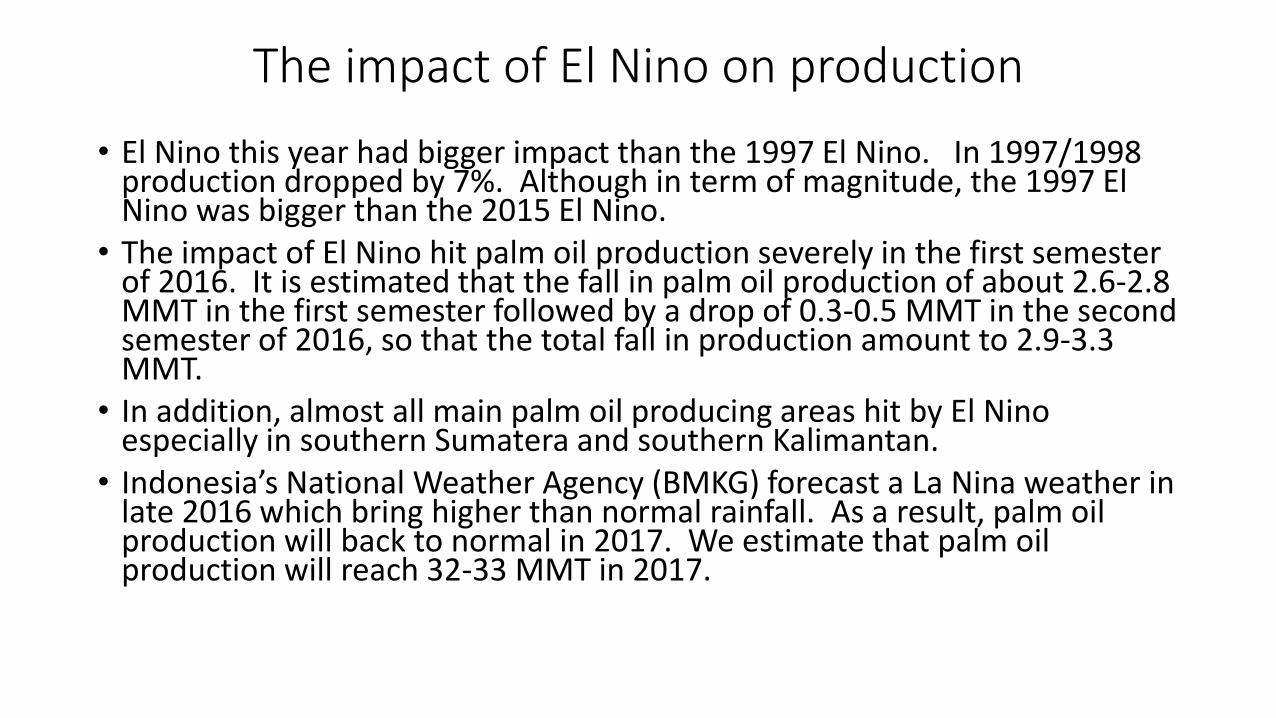
The impact of El Nino on production
• El Nino this year had bigger impact than the 1997 El Nino. In 1997/1998 production dropped by 7%. Although in term of magnitude, the 1997 El Nino was bigger than the 2015 El Nino.
• The impact of El Nino hit palm oil production severely in the first semester of 2016. It is estimated that the fall in palm oil production of about 2.6-2.8 MMT in the first semester followed by a drop of 0.3-0.5 MMT in the second semester of 2016, so that the total fall in production amount to 2.9-3.3 MMT.
• In addition, almost all main palm oil producing areas hit by El Nino especially in southern Sumatera and southern Kalimantan.
• Indonesia’s National Weather Agency (BMKG) forecast a La Nina weather in late 2016 which bring higher than normal rainfall. As a result, palm oil production will back to normal in 2017. We estimate that palm oil production will reach 32-33 MMT in 2017.

Expansion constraints
• Government put more restrictions on land acquisitions especially on peatland, thus palm oil can only be cultivated in marginal land.
• Government plan to review and evaluate existing licenses issued and and overlapping land used (in effect stop temporarily the issuance of new license).
• Continuing negative campaigns against expansion of oil palm plantations.
• Increasing labor costs due to the difficulty in recruiting labor (local), and mechanization is very slow in the palm oil industry.
• The policies have been successful in reducing significantly rate of expansion as reflected in the drop of total he effect of these policy have been already reflected in total oil palm seedsales in the periods of 2012-2016.

Total Oil Palm Seed Sales in Indonesia (2012-2015)
Nu
mb
er o
f se
ed
(x 1
:1.0
00
) 171,091
127,971
102,827 94,048
52,000
-
20,000
40,000
60,000
80,000
100,000
120,000
140,000
160,000
180,000
2012 2013 2014 2015 2016
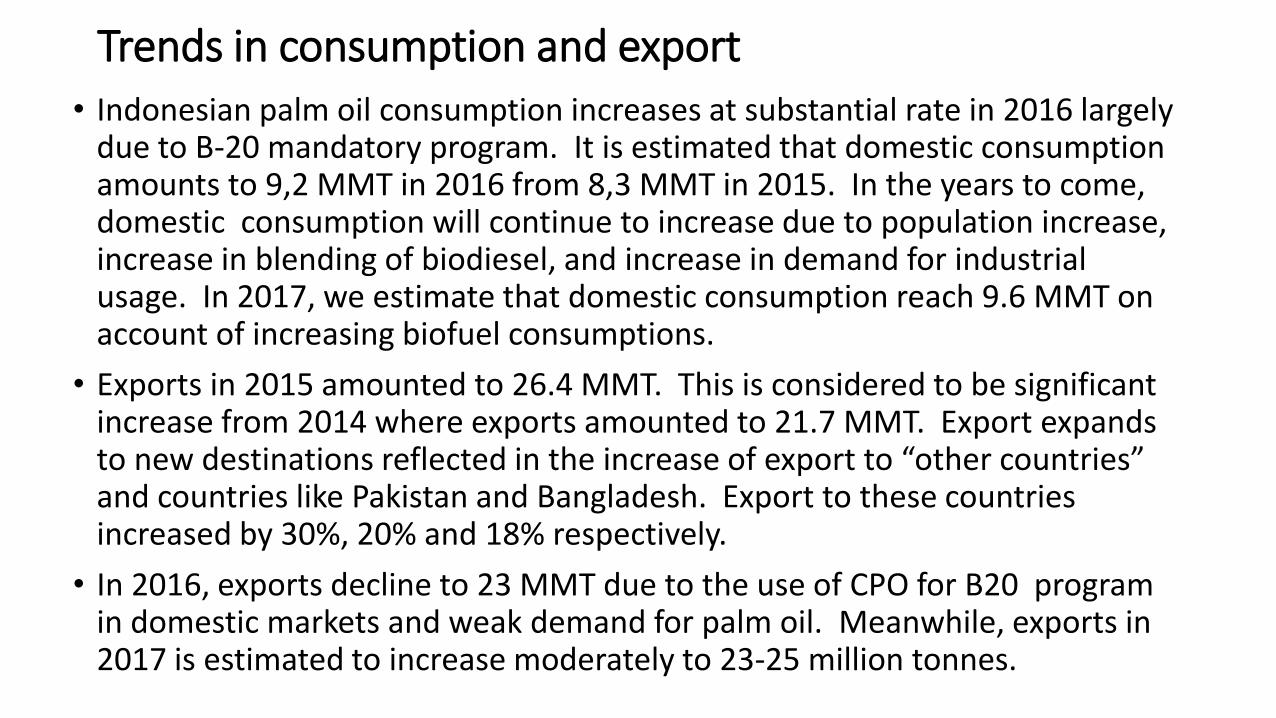
Trends in consumption and export • Indonesian palm oil consumption increases at substantial rate in 2016 largely
due to B-20 mandatory program. It is estimated that domestic consumption amounts to 9,2 MMT in 2016 from 8,3 MMT in 2015. In the years to come, domestic consumption will continue to increase due to population increase, increase in blending of biodiesel, and increase in demand for industrial usage. In 2017, we estimate that domestic consumption reach 9.6 MMT on account of increasing biofuel consumptions.
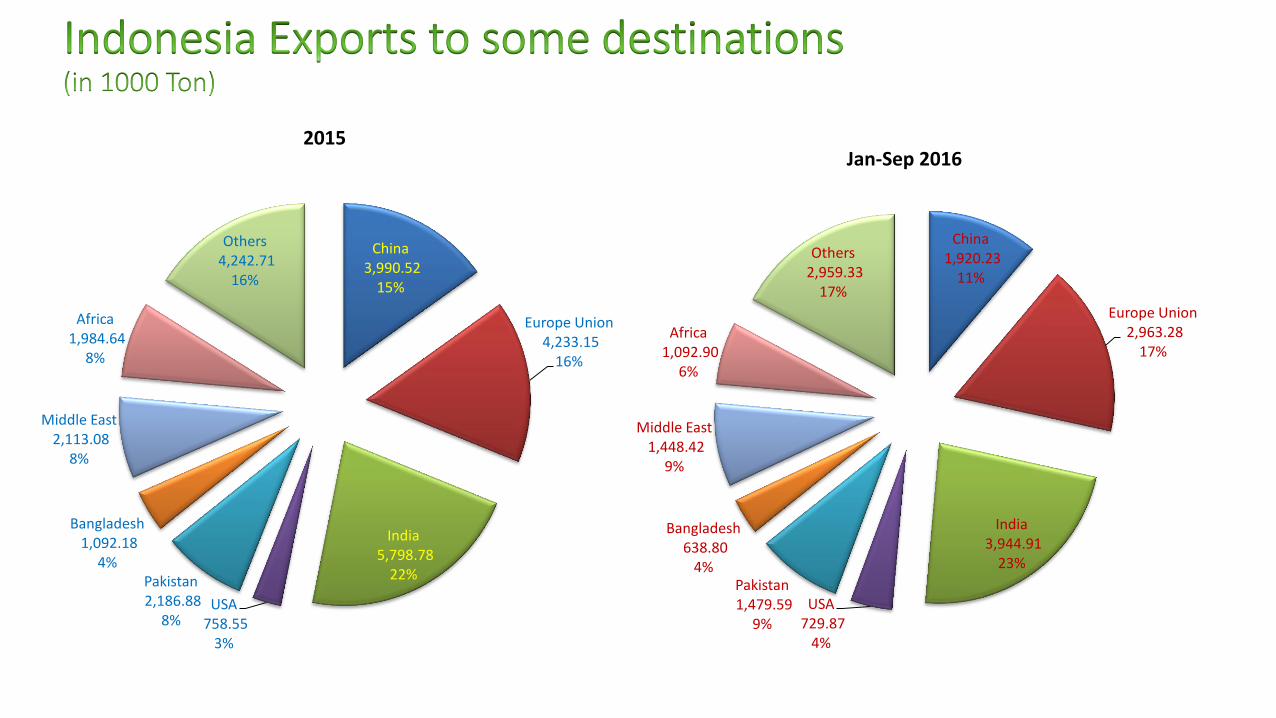
• Exports in 2015 amounted to 26.4 MMT. This is considered to be significant increase from 2014 where exports amounted to 21.7 MMT. Export expands to new destinations reflected in the increase of export to “other countries” and countries like Pakistan and Bangladesh. Export to these countries increased by 30%, 20% and 18% respectively.
• In 2016, exports decline to 23 MMT due to the use of CPO for B20 program in domestic markets and weak demand for palm oil. Meanwhile, exports in 2017 is estimated to increase moderately to 23-25 million tonnes.
Exports composition and destinations
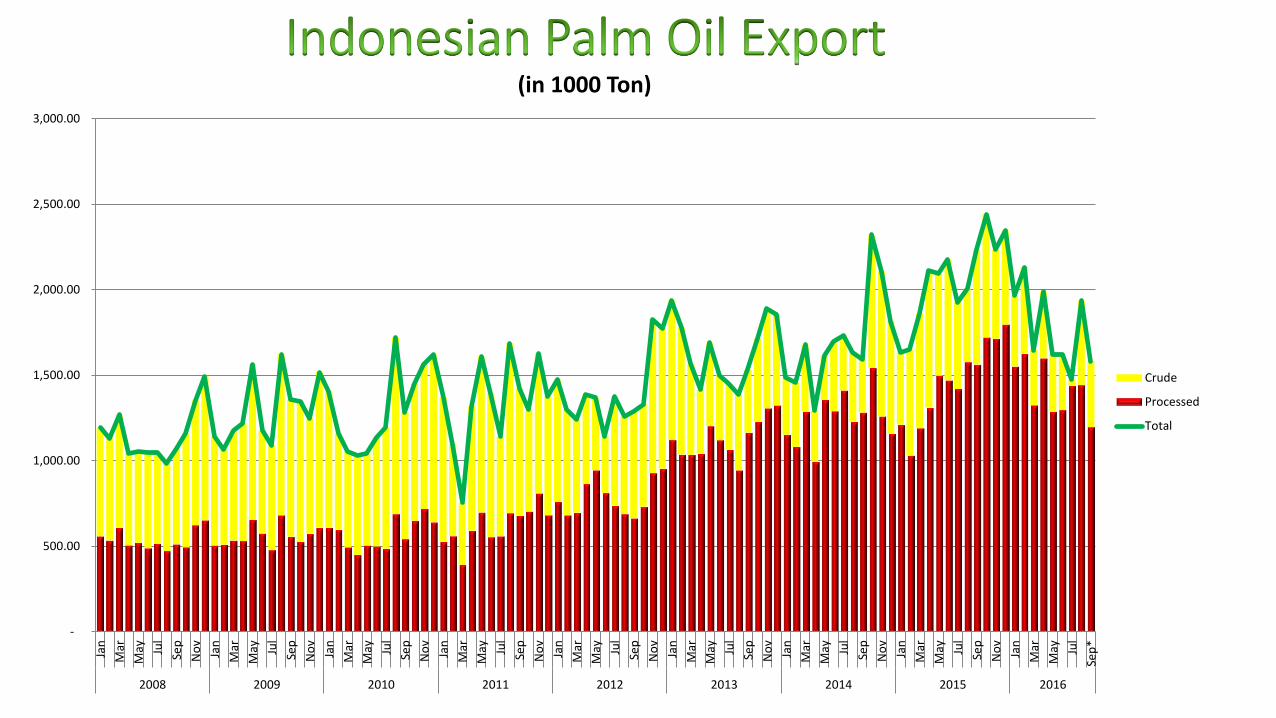
• Since 2012 Indonesian exports composition changed gradually in which processed products become more dominant than CPO. This trend continues to increase so that in 2016, processed products accounts for more than 80% of the exports while CPO exports are around 20%. Thanks to the policy which differenciates CPO and processed products export tax imposed government in late 2011. The export levies also significantly imposed higher level of levy for CPO compared to processed products.
• There is not much differences in export destination countries of palm oil. India, EU and China are the three largest importing countries, but in 2016 their exports drops considerably. While exports to Paksitan, Middle East, Bangladesh and USA slightly increase in percentage terms.
-
500.00
1,000.00
1,500.00
2,000.00
2,500.00
3,000.00
Jan
Mar
May Ju
l
Sep
No
v
Jan
Mar
May Ju
l
Sep
No
v
Jan
Mar
May Ju
l
Sep
No
v
Jan
Mar
May Ju
l
Sep
No
v
Jan
Mar
May Ju
l
Sep
No
v
Jan
Mar
May Ju
l
Sep
No
v
Jan
Mar
May Ju
l
Sep
No
v
Jan
Mar
May Ju
l
Sep
No
v
Jan
Mar
May Ju
l
Sep
*
2008 2009 2010 2011 2012 2013 2014 2015 2016
Crude
Processed
Total
(in 1000 Ton)
China 1,920.23
11%
Europe Union 2,963.28
17%
India 3,944.91
23%
USA 729.87
4%
Pakistan 1,479.59
9%
Bangladesh 638.80
4%
Middle East 1,448.42
9%
Africa 1,092.90
6%
Others 2,959.33
17%
Jan-Sep 2016
China 3,990.52
15%
Europe Union 4,233.15
16%
India 5,798.78
22%
USA 758.55
3%
Pakistan 2,186.88
8%
Bangladesh 1,092.18
4%
Middle East 2,113.08
8%
Africa 1,984.64
8%
Others 4,242.71
16%
2015
Mandatory B20 program: impact and sustainability
• Total fund collected up to September 2016 is Rp 14,39 triliun include carry over from last year. This is not included return from investment.
• Absorption of B-20 in 2016 targeted at 3 millions kiloliter, and the progress up to October, volume of biodiesel absorped is 2,14 million kiloliters. Thus, the more realistic projection would be around 2.5 millions kiloliter in 2016.
• With the assumption of total volume used of 2.5 millions kiloliter, the total fund needed for subsidizing biodiesel in 2016 is Rp 10 triliun with the assumption the amount of subisized per kiloliter is Rp 4000 (average).
• So, for this year CPO Fund will have adequate fund to run the program. However, in the future there is question about the sustainability of the program. The sustainability of the program largely depends on palm oil and crude oil prices. Under current price differences between CPO and crude oil prices, the amount of biodiesel subsidized is around 2 millions.
• In 2017, absorption is targeted at 5,5 millions kiloliter with 3 million kiloliter for PSO, and 2,5 millions kiloliter for non-PSO. Therefore, program B-20 in Indonesia still be the major factors that determines CPO prices in 2017.
Impact on price • Fund first collected when price of CPO (fob dumai) was at US $
535/ton in July 2015, and first delivery was on August 2015 when price of CPO hit the bottom. After that price fluctuates and shows an increasing trend until now.
• Presently prices of palm oil reaches US $ 664 per ton (fob dumai) in October Octoer 2016. Thus, the Fund is successful in preventing further decline in and one of the factors that contributes in gradually increasing price of CPO to the level that we see right now. At the farmers gate prices of FFB (Fresh Fruit Bunch) also shows considerable increase of 45% from Rp 898/kg to Rp 1,500-1600/kg in October 2016.
• Mandatory program of B-20 is going to be one important variables in determining CPO prices, especially when target of 5,5 million kiloliter of absorption can be achieved.
CPO Fund and B20 Program challenges
1. Weak supervision and enforcement; although regulation on penalty system have been issued but it has not been enforced effectively.
2. Logistical problems; logistic system is not efficient as blending mechanism are not centralized.
3. Weak demand for diesel fuel also contributes to the absorption of biodiesel.
4. CPO Fund has to be credible for all stakeholders.
5. Better allocation of fund especially for replanting for smallholders, strengthening R&D, and ISPO.
Price—historical and trends
• Due to the oversupply, the availability of substitutes, and drop in price of commodities in general, palm oil price declined to the lowest level ini 2015. Price of palm oil drop from average of US$ 821 per ton in 2013 to US $ 629 per ton in 2015.
• However, price of palm oil started to recover since 2016 on account of low stock due to the El Nino and price of crude oil and Indonesia and Malaysia biodiesel mandatory program. In 2016, we estimate that an evarge price of CPO (CIF Roterdam) is US $ 670 per ton.
• In 2017, factors that will determined price of palm oil will not be very different than last years. These are further effect of El Nino (recovery from El Nino), biodiesel markets in Indonesia, Malaysia, EU and US, price differences between palm oil and soybean oil, and crude oil prices. In fact, considering back to normal production of palm oil, continue slow economic growth, and narrowing gap of palm oil and soybean oil, we expect that this year price of palm oil will be significantly determined by mandatory program of biodiesel in Indonesia and other countries.
• Based on these factors, we expect that price of palm oil in 2017 will overall higher than in 2016 considerably. It will be relatively stable by the end of this year, and increase in the first semester of 2017. In the second semester as main harvest seasons comes, price will decline. We estimate that an average price of CPO in 2017 ranges between US $ 680- 690 per ton (CIF Roterdam).
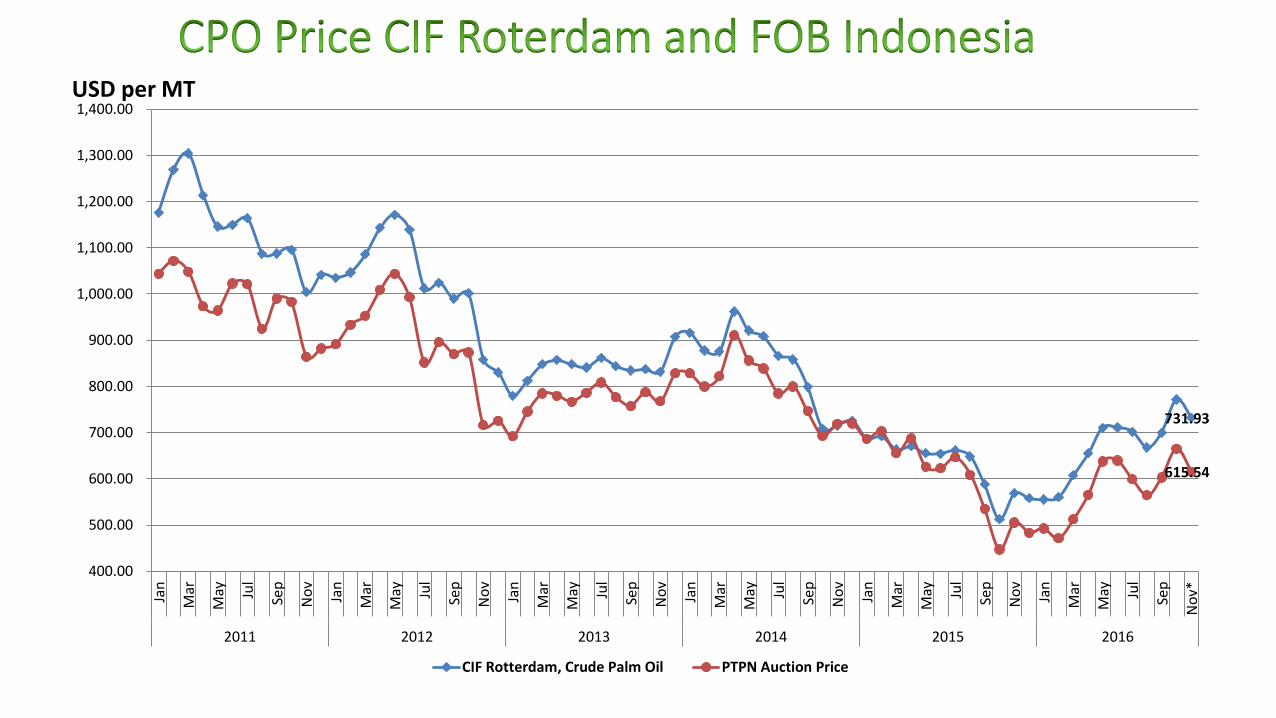
731.93
615.54
400.00
500.00
600.00
700.00
800.00
900.00
1,000.00
1,100.00
1,200.00
1,300.00
1,400.00
Jan
Mar
May Ju
l
Sep
No
v
Jan
Mar
May Ju
l
Sep
No
v
Jan
Mar
May Ju
l
Sep
No
v
Jan
Mar
May Ju
l
Sep
No
v
Jan
Mar
May Ju
l
Sep
No
v
Jan
Mar
May Ju
l
Sep
No
v*
2011 2012 2013 2014 2015 2016
CIF Rotterdam, Crude Palm Oil PTPN Auction Price
USD per MT
USD per MT
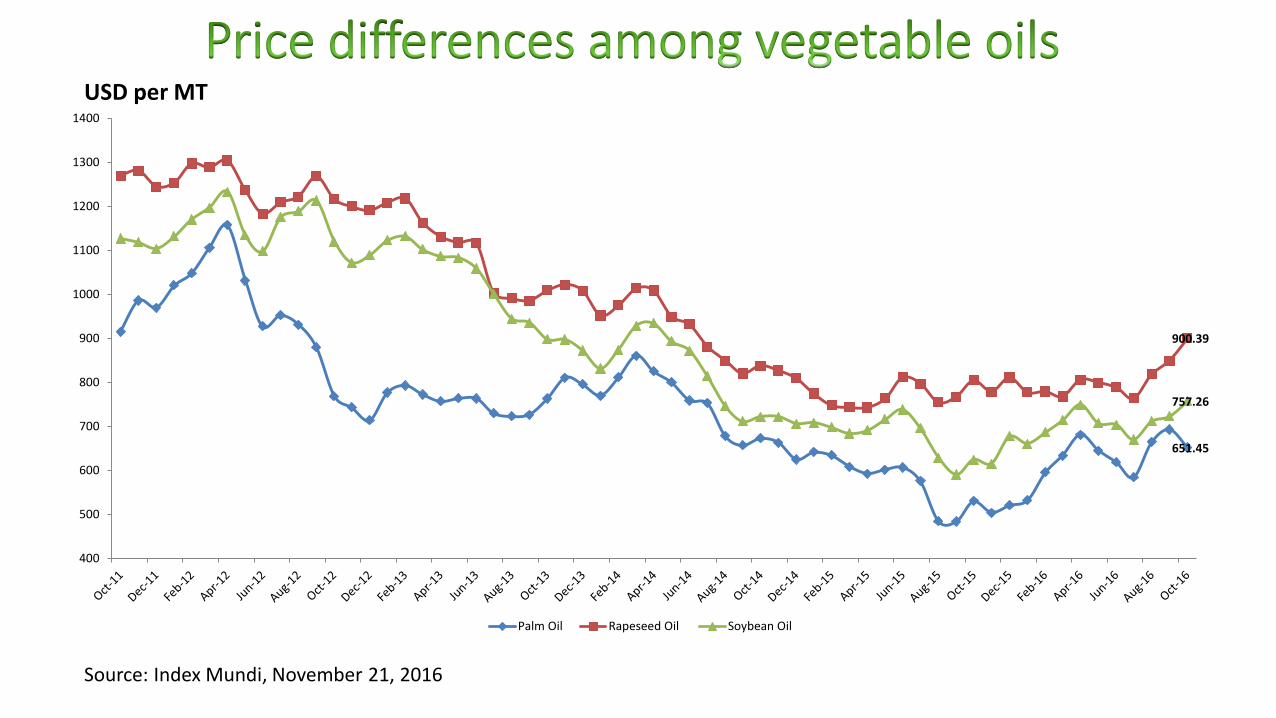
Source: Index Mundi, November 21, 2016
651.45
900.39
757.26
400
500
600
700
800
900
1000
1100
1200
1300
1400
Palm Oil Rapeseed Oil Soybean Oil
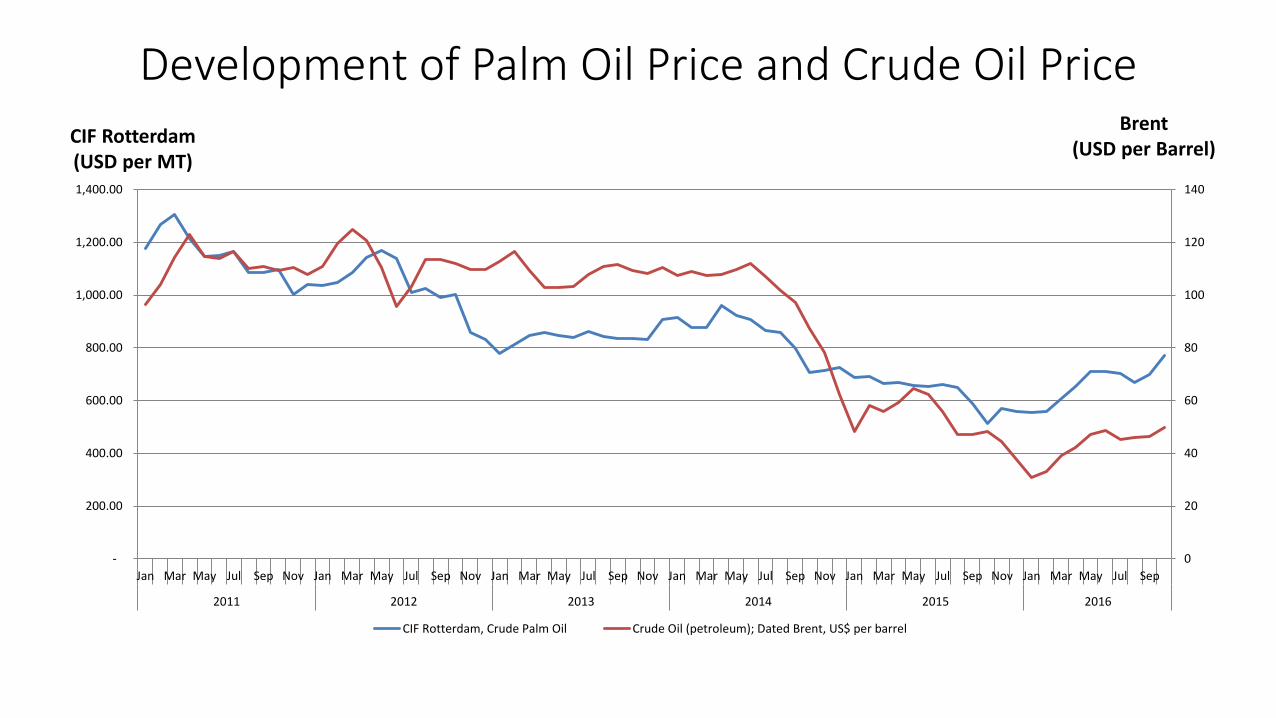
Development of Palm Oil Price and Crude Oil Price
0
20
40
60
80
100
120
140
-
200.00
400.00
600.00
800.00
1,000.00
1,200.00
1,400.00
Jan Mar May Jul Sep Nov Jan Mar May Jul Sep Nov Jan Mar May Jul Sep Nov Jan Mar May Jul Sep Nov Jan Mar May Jul Sep Nov Jan Mar May Jul Sep
2011 2012 2013 2014 2015 2016
CIF Rotterdam, Crude Palm Oil Crude Oil (petroleum); Dated Brent, US$ per barrel
CIF Rotterdam (USD per MT)
Brent (USD per Barrel)
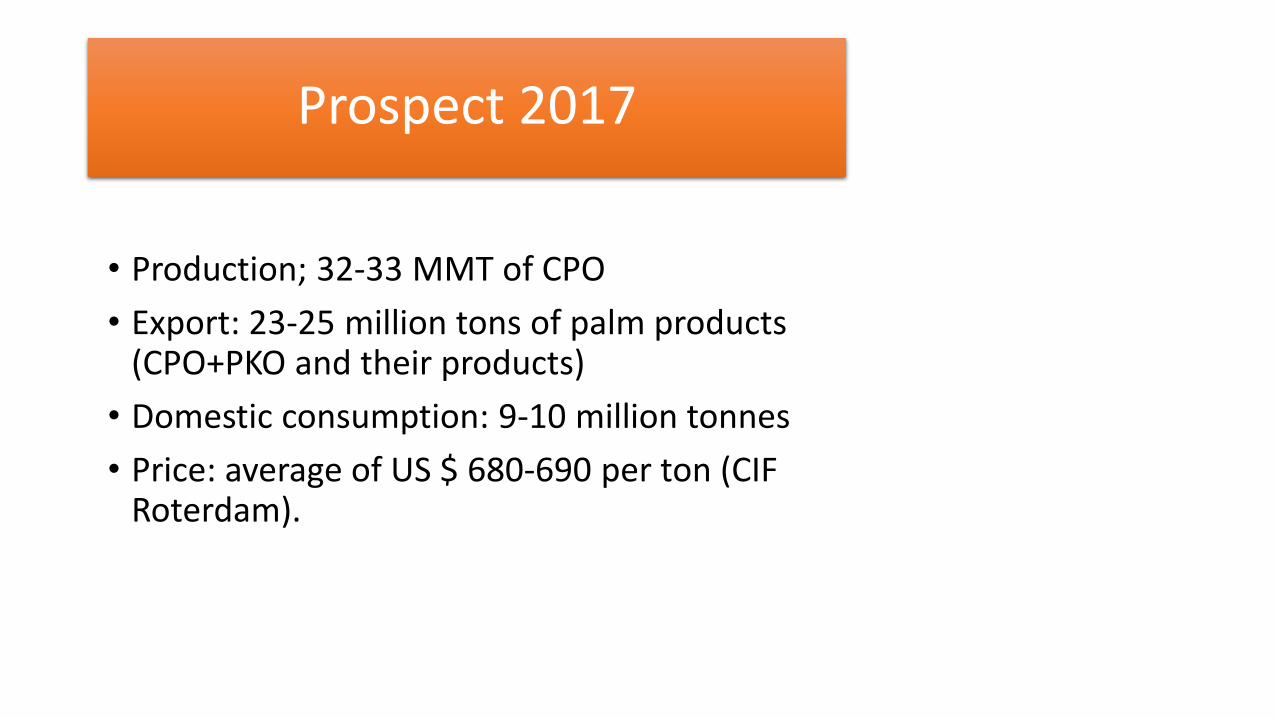
Prospect 2017
• Production; 32-33 MMT of CPO
• Export: 23-25 million tons of palm products (CPO+PKO and their products)
• Domestic consumption: 9-10 million tonnes
• Price: average of US $ 680-690 per ton (CIF Roterdam).