Embed Size (px)
Citation preview
EVALUATION OF INDOOR ENVIRONMENTAL CONDITIONS AND POTENTIAL HEALTH IMPACTS
Essex Agricultural and Technical SchoolAutomotive Shop, Science Building, Extension Hall
Maude Hall, Smith Hall, Barns, Greenhouses, and Underground Tunnel Structures
562 Maple St, Hathorne, MA
Prepared by:Massachusetts Department of Public Health
Bureau of Environmental HealthNovember 2014
Contents
Background/Introduction.................................................................................................................1
EATS Indoor Air Quality Assessment............................................................................................3IAQ Sampling Methods...............................................................................................................4IAQ Results and Discussion........................................................................................................4
Ventilation...............................................................................................................................4Microbial/Moisture Concerns..................................................................................................9Other IAQ Evaluations..........................................................................................................11
Evaluation of Other Environmental Concerns...............................................................................20Athletic Fields at NSTHS and East Street Field........................................................................20Removal of Contaminated Soil at EATS...................................................................................23Team Water Cooler Containers.................................................................................................252011 Bostik Explosion...............................................................................................................25
Medical Records Review...............................................................................................................27Comprehensive Efforts to Identify Students with Vocal Tics...................................................27Medical Records Review Methods............................................................................................28Results of Medical Records Review..........................................................................................30
Participation...........................................................................................................................30Evaluation of Available Medical Records.............................................................................31
Discussion......................................................................................................................................33
Conclusions....................................................................................................................................36
Recommendations..........................................................................................................................37Short-Term Recommendations..............................................................................................37Long-Term Recommendations..............................................................................................40
References......................................................................................................................................41
Figures...........................................................................................................................................44
Pictures..........................................................................................................................................47
Tables.............................................................................................................................................58
Appendices....................................................................................................................................66Appendix A: Carbon Dioxide and its Use in Evaluating Adequacy of Ventilation in Buildings...................................................................................................................................................67Appendix B: Mercury Action Levels........................................................................................75Appendix C: East Street Field Health Consultation Report......................................................78Appendix D: Letter and Consent Form Mailed to Physicians...................................................96
Background/Introduction
In late fall 2012, the Massachusetts Department of Public Health, Bureau of
Environmental Health, (MDPH/BEH) was contacted by Peter Mirandi, Health Director for the
Town of Danvers, requesting technical assistance regarding reports of vocal tics and repetitive
hiccups reported among female students who attended either Essex Agricultural and Technical
High School (EATS) or North Shore Technical High School (NSTHS), located in Danvers and
Middleton, respectively. As an initial step, MDPH/BEH staff met with school and local health
officials from Danvers and Middleton to gather more detailed information and propose a plan to
investigate. MDPH/BEH agreed to conduct investigations and to work with attending physicians
to identify and confirm the number of children who had been diagnosed with neurological vocal
tics or other vocal disorders to provide a review of their medical records. The purpose of the
medical record review was to identify any common factors (environmental or non-
environmental) that may have contributed to the development of the reported neurological vocal
tics and/or disorders.
Subsequent to the initial meeting in December 2012, MDPH/BEH was also contacted
directly by several parents of affected children who expressed their concerns. Anecdotal
information provided by parents indicated that there were approximately one to two dozen
female students who had developed vocal tics including chronic hiccup-like symptoms within the
previous year and one-half with what appeared to be increasing frequency. Parents reported that
many of the affected girls participated in team sport activities (e.g. soccer) through the merged
athletic programs associated with both schools.
1
In February 2013, the MDPH/BEH Associate Commissioner/Director Suzanne K.
Condon and Meg Blanchet, Assistant Director of the Bureau’s Environmental Toxicology
Program, met with a group of parents of affected children, as well as school and local health
officials from Danvers and Middleton, to discuss their planned approach for investigating the
prevalence of vocal symptoms among the students and to learn more about any specific
environmental concerns. Based on feedback provided by parents at this meeting, MDPH/BEH
recommended the following investigation activities in addition to the medical records review:
Conduct several environmental assessments that involved indoor air quality evaluations
and visual inspections (e.g. for the presence of mold) in school buildings and property
areas at both EATS and NSTHS that are accessible to students.
Investigate reports made by parents of student access to an underground tunnel system
located on or near the EATS campus.
Investigate the nature and location of contaminated soil discovered during construction of
new buildings at EATS.
Evaluate available environmental information for athletic fields located at NSTHS and
the East Street Field in Middleton where affected students practice sports.
Investigate drinking water provided in large water cooler containers to sports teams
during athletic events.
Evaluate whether a March 2011 explosion that occurred at the Bostik Corporation in
Middleton could have resulted in a common exposure to students exhibiting vocal tics.
This report describes results of indoor air quality (IAQ) assessments conducted at several
buildings at the EATS, 562 Maple Street in the Hathorne Village of Danvers, Massachusetts. In
2
addition, this report includes results of investigation activities conducted by MDPH/BEH in
response to other specific environmental concerns raised by parents, and results of the medical
records review. An earlier IAQ report summarizing investigations of other buildings at EATS
was issued in July 2013 and is available on the MDPH/BEH website at http://mass.gov/dph/iaq.
A third IAQ report summarizing investigations of NSTHS is being released concurrently with
this report under separate cover and is also available on the MDPH/BEH website.
EATS Indoor Air Quality Assessment
On May 22, 2013, a visit was made to the EATS campus by Ruth Alfasso, Environmental
Engineer/Inspector, Cory Holmes and Sharon Lee, Environmental Analysts/Inspectors, in BEH’s
IAQ Program. The IAQ Program conducted air sampling for carbon monoxide, volatile organic
compounds (VOCs) and mercury vapor, as well as general IAQ parameters (e.g. temperature,
carbon dioxide, relative humidity) in each building.
The EATS campus consists of more than 20 buildings that are accessible to students
(Picture 1). This assessment provides information on conditions observed in student-accessible
areas not previously assessed, including the automotive shop (AMS) and Science Buildings,
Extension, Maude and Smith Halls, barns, greenhouses, and some underground tunnel structures
reported by concerned parents. The EATS buildings were constructed at various times, but for
the most part larger building construction is of brick. Classrooms typically have openable
windows. The barns are wooden construction used for animal housing and equipment storage.
The greenhouses are steel-framed structures with glass and plastic window components.
3
IAQ Sampling Methods
Air tests for carbon dioxide, carbon monoxide, temperature, and relative humidity were
conducted with the TSI, Q-Trak, IAQ Monitor, Model 7565. Air tests for airborne particle
matter with a diameter less than 2.5 micrometers were taken with the TSI, DUSTTRAK™
Aerosol Monitor Model 8520. Air testing for total volatile organic compounds (TVOCs) was
conducted using a MiniRAE 2000 photo ionization detector (PID). Air tests for mercury vapor
were conducted using a Lumex Mercury analyzer RA-915+. BEH/IAQ staff also performed a
visual inspection of building materials for water damage and/or microbial growth.
IAQ Results and Discussion
The school serves approximately 500 high-school-age students and has approximately 50
staff members. Tests were taken during normal operations, and results appear in Table 1.
Ventilation
It can be seen from Table 1 that carbon dioxide levels were above 800 parts per million
(ppm) in 1 of 5 areas in the AMS, 3 of 4 areas in Maude Hall, 6 of 15 in the Science Building,
and 9 of 20 areas in Smith Hall, indicating poor air exchange in a number of areas at the time of
the assessment. Carbon dioxide levels in all areas of the Extension Hall, the greenhouses, and
the Red and Sheep Barns were below 800 ppm. It is important to note that some areas were
sparsely populated or had doors open to hallways or the outdoors, which can greatly reduce
carbon dioxide levels. Carbon dioxide levels would be expected to increase with higher
occupancy and closed windows and doors.
4
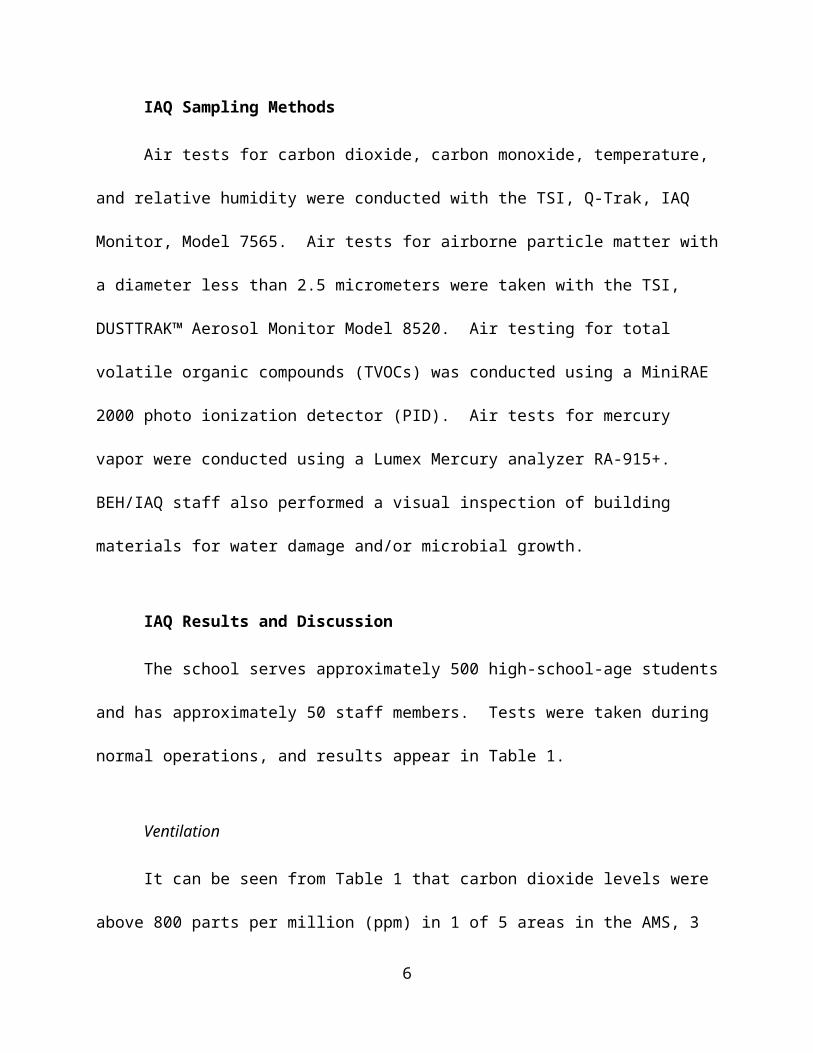
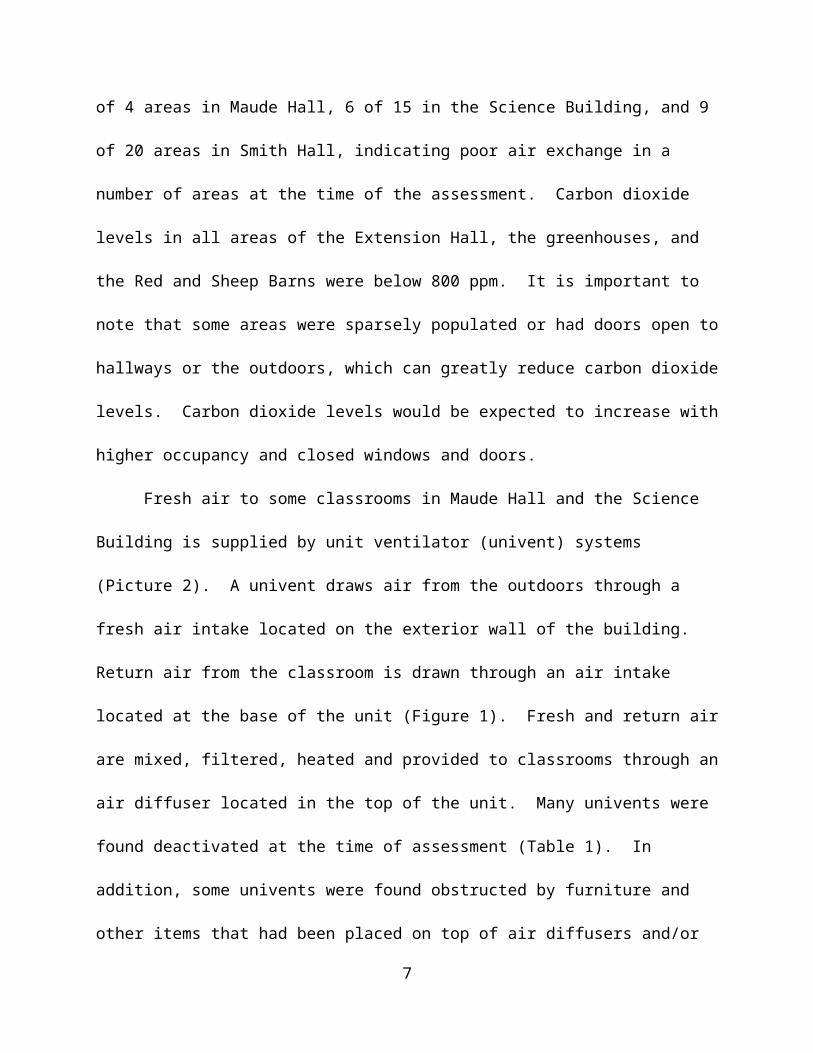
Fresh air to some classrooms in Maude Hall and the Science Building is supplied by unit
ventilator (univent) systems (Picture 2). A univent draws air from the outdoors through a fresh
air intake located on the exterior wall of the building. Return air from the classroom is drawn
through an air intake located at the base of the unit (Figure 1). Fresh and return air are mixed,
filtered, heated and provided to classrooms through an air diffuser located in the top of the unit.
Many univents were found deactivated at the time of assessment (Table 1). In addition, some
univents were found obstructed by furniture and other items that had been placed on top of air
diffusers and/or in front of return vents along the bottom of the units (Picture 3). Univents must
remain free of obstructions and be allowed to operate while rooms are occupied.
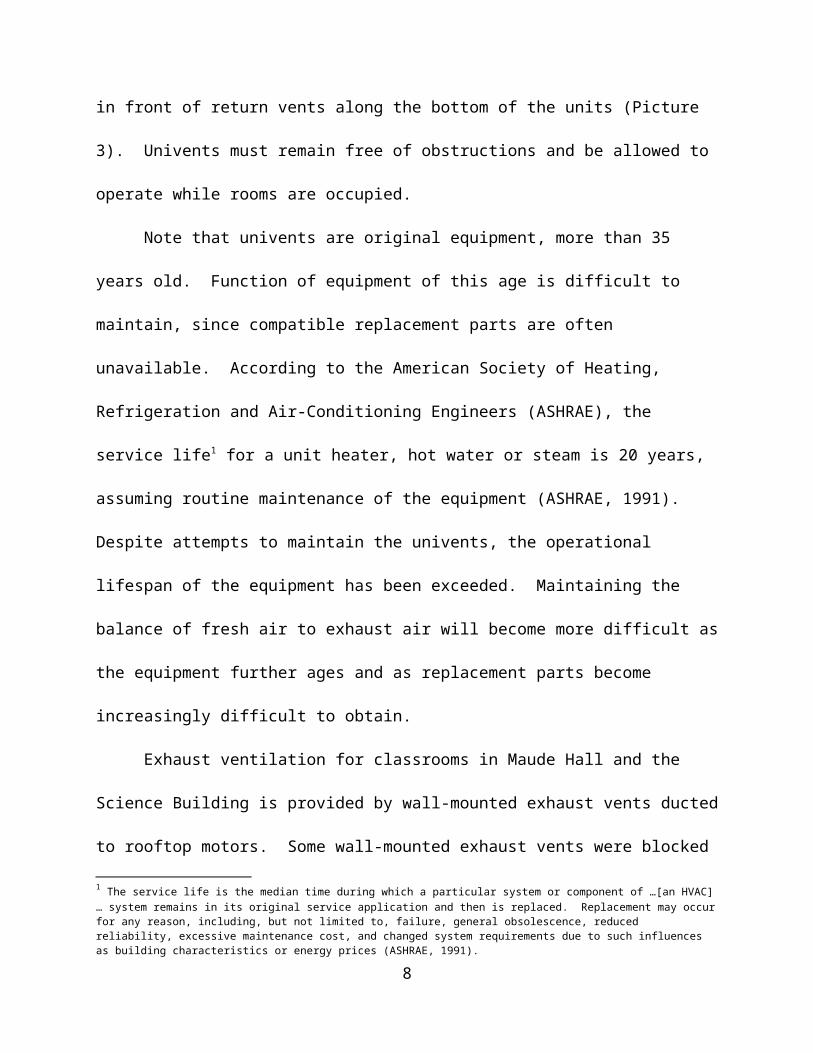
Note that univents are original equipment, more than 35 years old. Function of
equipment of this age is difficult to maintain, since compatible replacement parts are often
unavailable. According to the American Society of Heating, Refrigeration and Air-Conditioning
Engineers (ASHRAE), the service life1 for a unit heater, hot water or steam is 20 years, assuming
routine maintenance of the equipment (ASHRAE, 1991). Despite attempts to maintain the
univents, the operational lifespan of the equipment has been exceeded. Maintaining the balance
of fresh air to exhaust air will become more difficult as the equipment further ages and as
replacement parts become increasingly difficult to obtain.
Exhaust ventilation for classrooms in Maude Hall and the Science Building is provided
by wall-mounted exhaust vents ducted to rooftop motors. Some wall-mounted exhaust vents
were blocked at the time of the assessment. As with supply ventilation, exhaust ventilation must
be free of blockages and allowed to operate while the building is occupied.
1 The service life is the median time during which a particular system or component of …[an HVAC]… system remains in its original service application and then is replaced. Replacement may occur for any reason, including, but not limited to, failure, general obsolescence, reduced reliability, excessive maintenance cost, and changed system requirements due to such influences as building characteristics or energy prices (ASHRAE, 1991).
5
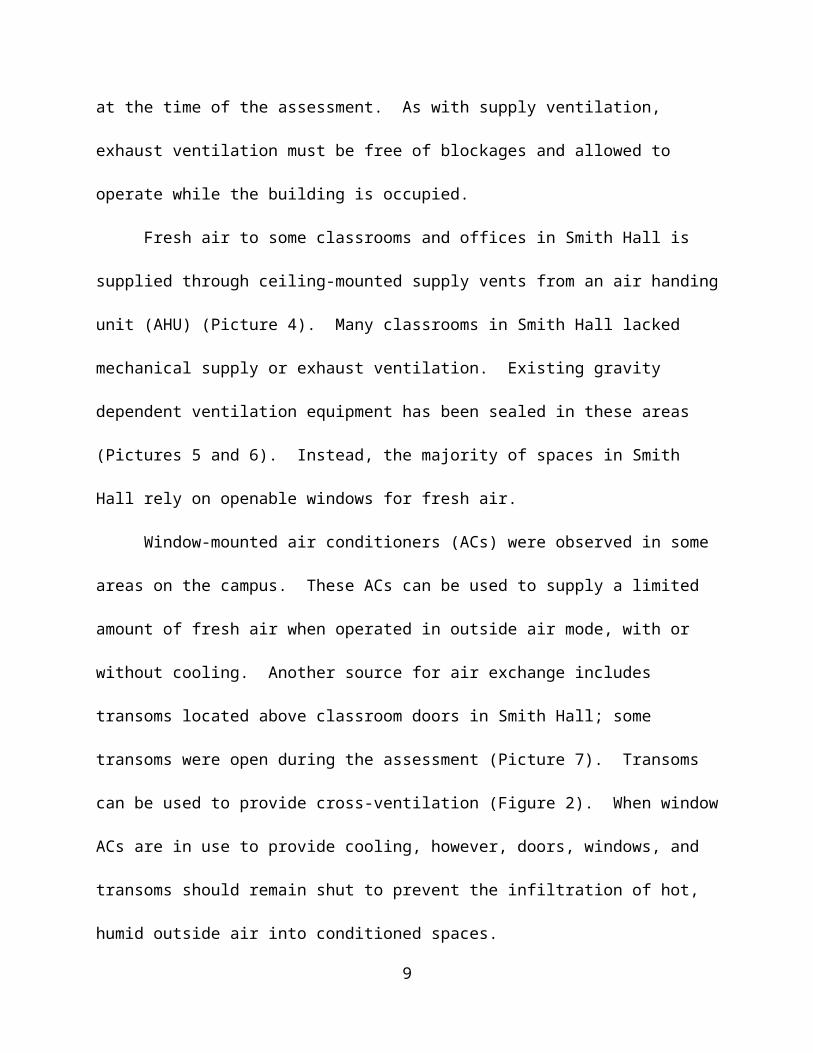
Fresh air to some classrooms and offices in Smith Hall is supplied through ceiling-
mounted supply vents from an air handing unit (AHU) (Picture 4). Many classrooms in Smith
Hall lacked mechanical supply or exhaust ventilation. Existing gravity dependent ventilation
equipment has been sealed in these areas (Pictures 5 and 6). Instead, the majority of spaces in
Smith Hall rely on openable windows for fresh air.
Window-mounted air conditioners (ACs) were observed in some areas on the campus.
These ACs can be used to supply a limited amount of fresh air when operated in outside air
mode, with or without cooling. Another source for air exchange includes transoms located above
classroom doors in Smith Hall; some transoms were open during the assessment (Picture 7).
Transoms can be used to provide cross-ventilation (Figure 2). When window ACs are in use to
provide cooling, however, doors, windows, and transoms should remain shut to prevent the
infiltration of hot, humid outside air into conditioned spaces.
Other buildings examined during the assessment -- the AMS, Extension Hall, two
greenhouses and two barns -- did not have any mechanical ventilation, instead relying on open
doors/windows, and in the case of the greenhouse, slatted louvers in the side of the building, for
fresh air. These buildings do not contain traditional classrooms or offices, but contain
workshops, storage areas, animal housing, and greenhouse plants/supplies.
To maximize air exchange, the MDPH recommends that both supply and exhaust
ventilation operate continuously during periods of occupancy. In order to have proper
ventilation with a mechanical supply and exhaust system, the systems must be balanced to
provide an adequate amount of fresh air to the interior of a room while removing stale air from
the room. It is recommended that HVAC systems be re-balanced every five years to ensure
6
adequate air systems function (SMACNA, 1994). The date of the last balancing of mechanical
ventilation systems was not available at the time of the assessment.
Minimum design ventilation rates are mandated by the Massachusetts State Building
Code (MSBC). Until 2011, the minimum ventilation rate in Massachusetts was higher for both
occupied office spaces and general classrooms, with similar requirements for other occupied
spaces (BOCA, 1993). The current version of the MSBC, was promulgated in 2011 by the State
Board of Building Regulations and Standards (SBBRS), and adopted the 2009 International
Mechanical Code (IMC) to set minimum ventilation rates. Please note that the MSBC is a
minimum standard that is not health-based. At lower rates of cubic feet per minute (cfm) per
occupant of fresh air, carbon dioxide levels would be expected to rise significantly. A
ventilation rate of 20 cfm per occupant of fresh air provides optimal air exchange resulting in
carbon dioxide levels at or below 800 ppm in the indoor environment in each area measured.
MDPH recommends that carbon dioxide levels be maintained at 800 ppm or below. This is
because most environmental and occupational health scientists involved with research on IAQ
and health effects have documented significant increases in indoor air quality complaints and/or
health effects when carbon dioxide levels rise above the MDPH guidelines of 800 ppm for
schools, office buildings and other occupied spaces (Sundell et al., 2011). The ventilation must
be on at all times that the room is occupied. Providing adequate fresh air ventilation with open
windows and maintaining the temperature in the comfort range during the cold weather season is
impractical. Mechanical ventilation is usually required to provide adequate fresh air ventilation.
Carbon dioxide is not a problem in and of itself. It is used as an indicator of the adequacy
of fresh air ventilation. As carbon dioxide levels rise, it indicates that the ventilating system is
malfunctioning or the design occupancy of the room is being exceeded. When this happens, a
7
buildup of common indoor air pollutants can occur, leading to discomfort or health complaints.
The Occupational Safety and Health Administration (OSHA) standard for carbon dioxide is
5,000 parts per million parts of air (ppm). Workers may be exposed to this level for 40
hours/week, based on a time-weighted average (OSHA, 1997).
The MDPH uses a guideline of 800 ppm for publicly occupied buildings. A guideline of
600 ppm or less is preferred in schools due to the fact that the majority of occupants are young
and considered to be a more sensitive population in the evaluation of environmental health
status. Inadequate ventilation and/or elevated temperatures are major causes of complaints such
as respiratory, eye, nose and throat irritation, lethargy and headaches. For more information
concerning carbon dioxide, consult Appendix A.
Temperatures ranged from 68°F to 69°F in the AMS, 67°F to 72°F in Extension Hall,
67°F to 71°F in Maude Hall, 67°F to 72°F in the Science Building, 71°F to 75°F in Smith Hall,
62°F to 63°F in the greenhouses, and 69°F in the two barns. Temperature ranges for the
classroom/office areas were within or close to the MDPH recommended range (Table 1). The
MDPH recommends that indoor air temperatures be maintained in a range of 70°F to 78°F in
order to provide for the comfort of building occupants. In many cases concerning indoor air
quality, fluctuations of temperature in occupied spaces are typically experienced, even in a
building with an adequate fresh air supply. In addition, it is difficult to control temperature and
maintain comfort without operating the ventilation equipment as designed (e.g., univents/exhaust
vents deactivated/obstructed).
Relative humidity measurements ranged from 56 to 63 percent in the AMS, 49 to 72
percent in Extension Hall, 45 to 68 percent in Maude Hall, 54 to 62 percent in the Science
Building, 42 to 60 percent in Smith Hall, 75 to 76 percent in the greenhouses, and 63 percent in
8
the two barns. Relative humidity ranges for the classroom/office areas were within or above the
MDPH recommended range (Table 1). The MDPH recommends a comfort range of 40 to 60
percent for indoor air relative humidity. Relative humidity measured in most areas is reflective
of outdoor relative humidity, which was measured at 53 percent at the time of assessment.
Relative humidity measurements above background may also indicate that the ventilation
system is not operating effectively to remove occupant-generated moisture from the building.
Moisture removal is important since higher humidity at a given temperature reduces the ability of
the body to cool itself by sweating; “heat index” is a measurement that takes into account the
impact of a combination of heat and humidity on how hot it feels. At a given indoor
temperature, the addition of humid air increases occupant discomfort and may generate heat
complaints. If moisture levels are decreased, the comfort of the individuals increases. Note that
several areas tested, including the greenhouses and reptile/bird rooms, are deliberately kept at an
elevated relative humidity.
Relative humidity levels in the buildings would be expected to drop during the winter
months due to heating. The sensation of dryness and irritation is common in a low relative
humidity environment. Low relative humidity is a very common problem during the heating
season in the northeast part of the United States.
Microbial/Moisture Concerns
Water-stained and missing ceiling tiles were observed in classrooms and hallways in the
Science Building, particularly in the library, and in Maude Hall (Picture 8; Table 1). Water-
damaged ceiling tiles can provide a source of mold and should be replaced after a water leak is
discovered and repaired.
9
Water-stained carpeting was observed in a number of areas (Table 1). Small refrigerators
and water coolers were observed to be located directly on carpet (Picture 9). Leaks or spills from
this equipment can contribute to staining, moisten carpet and potentially lead to microbial
growth.
The US EPA and the American Conference of Governmental Industrial Hygienists
(ACGIH) recommends that porous materials be dried with fans and heating within 24 to 48 hours
of becoming wet (US EPA, 2001; ACGIH, 1989). If porous materials are not dried within this
time frame, mold growth may occur. Water-damaged porous materials cannot be adequately
cleaned to remove mold growth. The application of a mildewcide to moldy porous materials is
not recommended.
The bird, fish, and reptile areas had aquariums and standing pools of water for animals.
Aquariums and terrariums were also observed in the Science Building and Smith Hall.
Aquariums, terrariums, and pools need to be properly maintained and cleaned to prevent
microbial/bacterial growth and associated odors.
In the AMS, a window AC unit was found stuffed with rags in an attempt to reduce noise
and drafts. Window ACs can generate condensate and the opening in which the rags are used
can allow them to become moistened with rainwater. If the rags are moistened repeatedly, they
can be a source of mold growth and odors.
Plants were observed in some classrooms and offices (Table 1). Plants should be
properly maintained and equipped with drip pans. Plants should also be located away from
ventilation sources to prevent aerosolization of dirt, pollen or mold. Plants should not be placed
on porous materials, since water damage to porous materials may lead to microbial growth.
10
An indoor garden was observed in the hallway of the Science Building (Picture 10). The
garden should be maintained to prevent water leakage, which can damage building materials.
Care should also be taken to prevent insects from inhabiting the soil.
Other IAQ Evaluations
Indoor air quality can be negatively influenced by the presence of respiratory irritants,
such as products of combustion. The process of combustion produces a number of pollutants.
Common combustion emissions include carbon monoxide, carbon dioxide, water vapor and
smoke (fine airborne particle material). Of these materials, exposure to carbon monoxide and
particulate matter with a diameter of 2.5 micrometers (μm) or less (PM2.5) can produce
immediate, acute health effects upon exposure. To determine whether combustion products were
present in the indoor environment, BEH/IAQ staff obtained measurements for carbon monoxide
and PM2.5.
Carbon Monoxide
Carbon monoxide is a by-product of incomplete combustion of organic matter (e.g.,
gasoline, wood and tobacco). Exposure to carbon monoxide can produce immediate and acute
health effects. Several air quality standards have been established to address carbon monoxide
and prevent symptoms from exposure to these substances. The MDPH established a corrective
action level concerning carbon monoxide in ice skating rinks that use fossil-fueled ice
resurfacing equipment. If an operator of an indoor ice rink measures a carbon monoxide level
over 30 ppm, taken 20 minutes after resurfacing within a rink, that operator must take actions to
reduce carbon monoxide levels (MDPH, 1997).
11
The American Society of Heating Refrigeration and Air-Conditioning Engineers
(ASHRAE) has adopted the National Ambient Air Quality Standards (NAAQS) as one set of
criteria for assessing indoor air quality and monitoring of fresh air introduced by HVAC systems
(ASHRAE, 1989). The NAAQS are standards established by the US EPA to protect the public
health from six criteria pollutants, including carbon monoxide and particulate matter (US EPA,
2006). As recommended by ASHRAE, pollutant levels of fresh air introduced to a building
should not exceed the NAAQS levels (ASHRAE, 1989). The NAAQS were adopted by
reference in the Building Officials & Code Administrators (BOCA) National Mechanical Code
of 1993 (BOCA, 1993), which is now an HVAC standard included in the MSBC (SBBRS,
2011). According to the NAAQS, carbon monoxide levels in outdoor air should not exceed 9
ppm in an eight-hour average (US EPA, 2006).
Carbon monoxide should not be present in a typical, indoor environment. If it is present,
indoor carbon monoxide levels should be less than or equal to outdoor levels. Outdoor carbon
monoxide concentrations were non-detect (ND) at the time of assessment (Table 1). No
measureable levels of carbon monoxide were detected inside any of the buildings during the
assessment (Table 1).
Particulate Matter
The US EPA has established NAAQS limits for exposure to particulate matter.
Particulate matter includes airborne solids that can be irritating to the eyes, nose and throat. The
NAAQS originally established exposure limits to PM with a diameter of 10 μm or less (PM10).
In 1997, US EPA established a more protective standard for fine airborne particulate matter with
a diameter of 2.5 μm or less (PM2.5). The NAAQS has subsequently been revised, and PM2.5
levels were reduced. This more stringent PM2.5 standard requires outdoor air particle levels be
12
maintained below 35 μg/m3 over a 24-hour average (US EPA, 2006). Although both the
ASHRAE standard and BOCA Code adopted the PM10 standard for evaluating air quality,
MDPH uses the more protective PM2.5 standard for evaluating airborne PM concentrations in
the indoor environment.
Outdoor PM2.5 concentration the day of the assessment was measured at 20 μg/m3.
PM2.5 levels measured inside all buildings ranged from 10 to 78 μg/m3 (Table 1). Apart from
the measurement of 78 μg/m3 in the bird room inside the Extension Hall, all indoor and outdoor
PM 2.5 levels were below the NAAQS PM2.5 level of 35 μg/m3. Frequently, indoor air levels of
particulates (including PM2.5) can be at higher levels than those measured outdoors. A number
of activities that occur indoors and/or mechanical devices can generate particulate during normal
operations. Sources of indoor airborne particulates may include but are not limited to particles
generated during the operation of fan belts in the HVAC system, use of stoves and/or microwave
ovens in kitchen areas; use of photocopiers, fax machines and computer printing devices;
operation of an ordinary vacuum cleaner and heavy foot traffic indoors.
Birds produce dander from feathers and particulates from dried fecal waste, which may
become airborne due to their movement. Bird wastes can be allergenic and a source of diseases
if the birds are not healthy. Increasing ventilation, particularly allowing for some sort of exhaust
from this room, may help lower the particulates in this room; however air velocities need to be
kept relatively low to protect the birds from drafts as well as avoid creating more airborne debris.
Increased cleaning of cages and surfaces with wet wiping or high efficiency particulate
arrestance (HEPA) filtered vacuums may also be helpful.
13
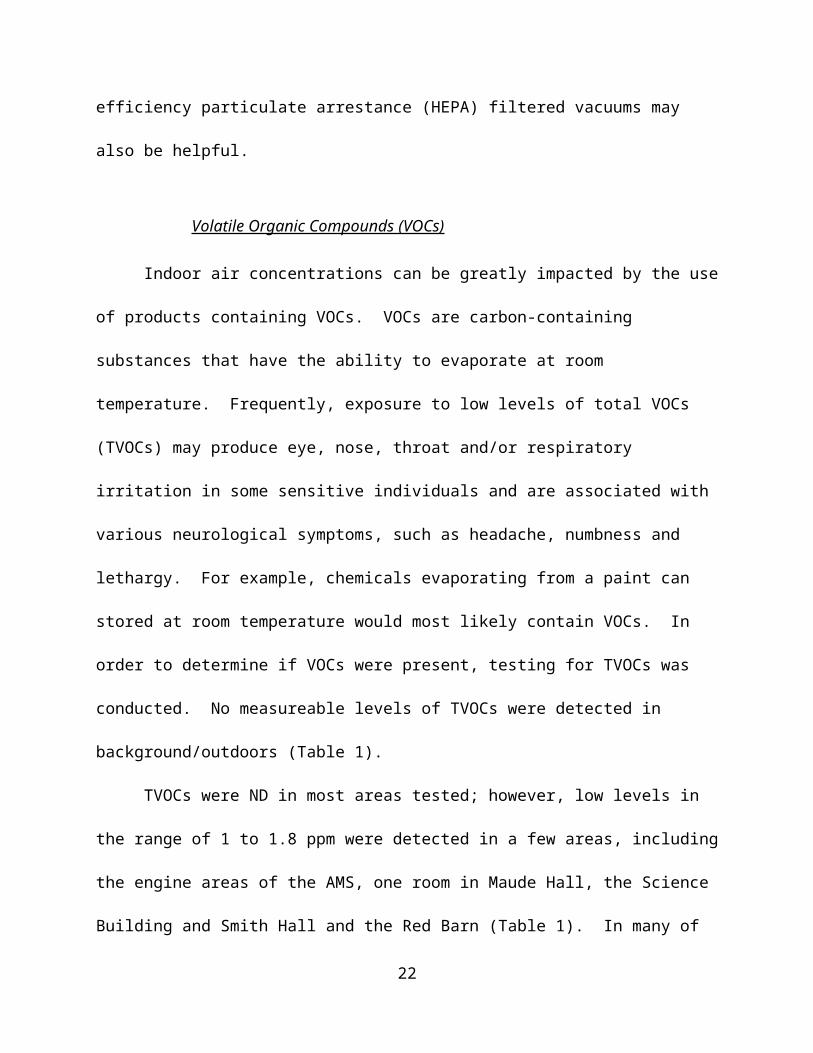
Volatile Organic Compounds (VOCs)
Indoor air concentrations can be greatly impacted by the use of products containing
VOCs. VOCs are carbon-containing substances that have the ability to evaporate at room
temperature. Frequently, exposure to low levels of total VOCs (TVOCs) may produce eye, nose,
throat and/or respiratory irritation in some sensitive individuals and are associated with various
neurological symptoms, such as headache, numbness and lethargy. For example, chemicals
evaporating from a paint can stored at room temperature would most likely contain VOCs. In
order to determine if VOCs were present, testing for TVOCs was conducted. No measureable
levels of TVOCs were detected in background/outdoors (Table 1).
TVOCs were ND in most areas tested; however, low levels in the range of 1 to 1.8 ppm
were detected in a few areas, including the engine areas of the AMS, one room in Maude Hall,
the Science Building and Smith Hall and the Red Barn (Table 1). In many of these areas,
equipment was present that used fuel, which contributes to the TVOC measurements for these
areas. Low levels of VOCs in the indoor environment may also be due to the use of
cleaners/deodorizers, personal care products, paint, dry erase markers and other common indoor
sources.
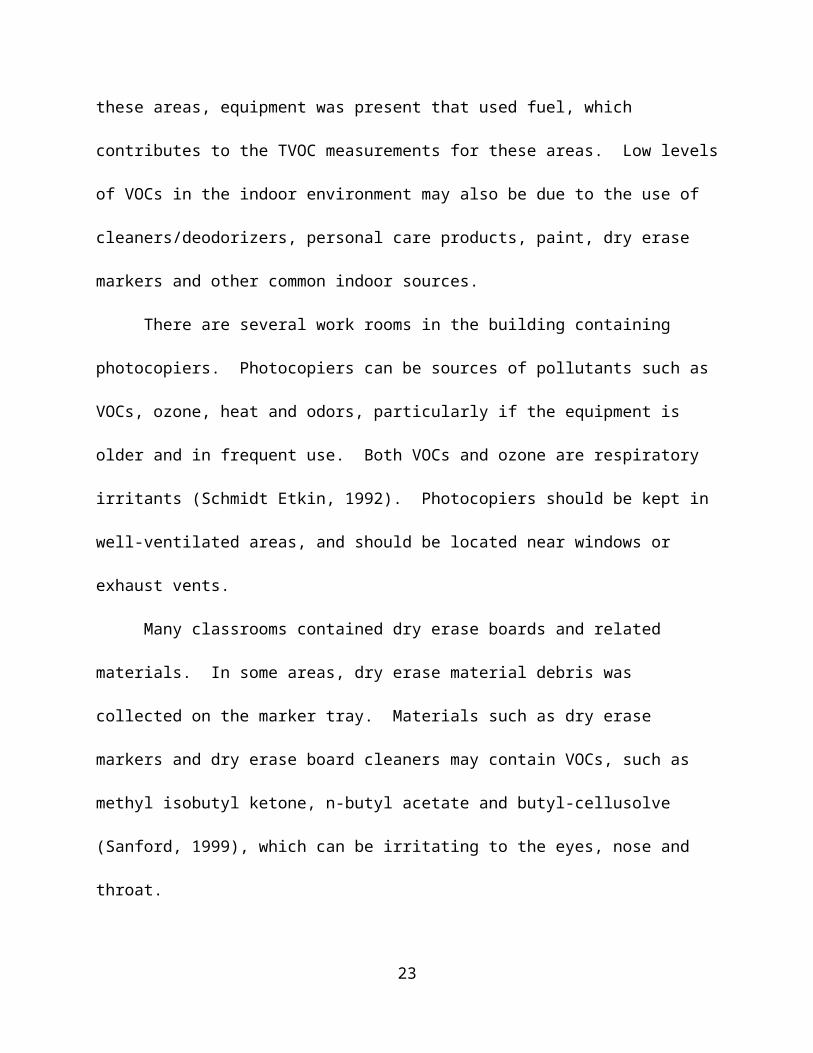
There are several work rooms in the building containing photocopiers. Photocopiers can
be sources of pollutants such as VOCs, ozone, heat and odors, particularly if the equipment is
older and in frequent use. Both VOCs and ozone are respiratory irritants (Schmidt Etkin, 1992).
Photocopiers should be kept in well-ventilated areas, and should be located near windows or
exhaust vents.
Many classrooms contained dry erase boards and related materials. In some areas, dry
erase material debris was collected on the marker tray. Materials such as dry erase markers and
14
dry erase board cleaners may contain VOCs, such as methyl isobutyl ketone, n-butyl acetate and
butyl-cellusolve (Sanford, 1999), which can be irritating to the eyes, nose and throat.
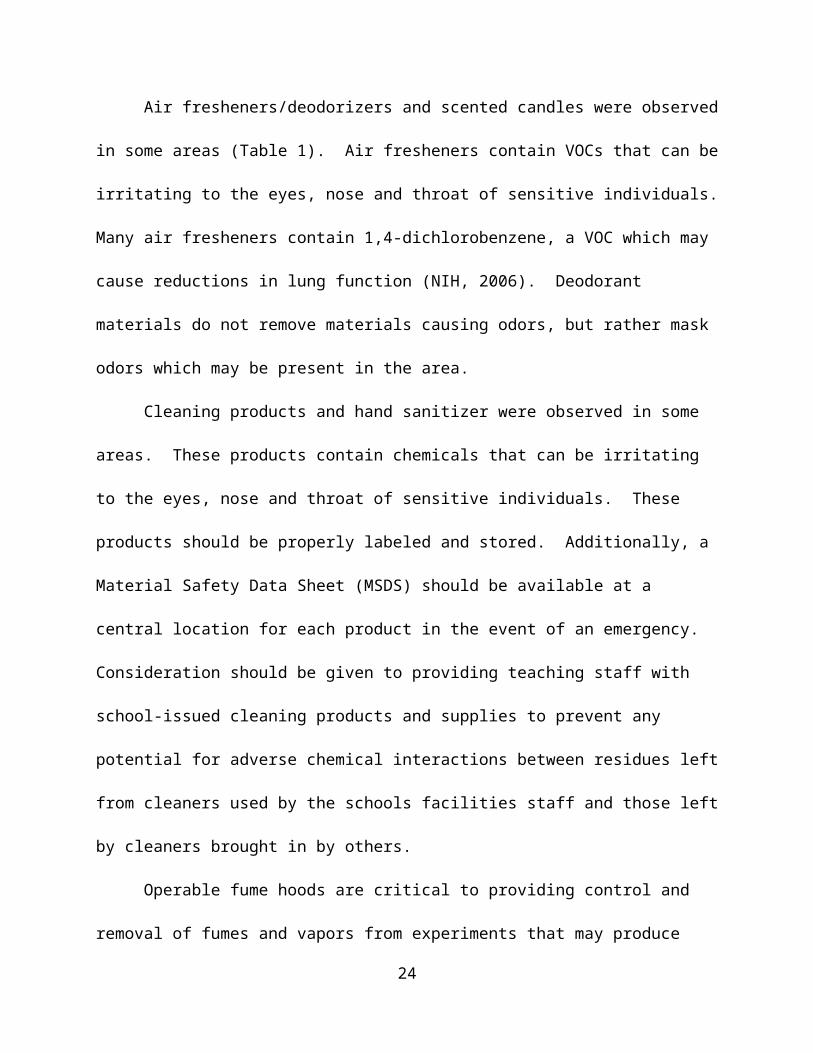
Air fresheners/deodorizers and scented candles were observed in some areas (Table 1).
Air fresheners contain VOCs that can be irritating to the eyes, nose and throat of sensitive
individuals. Many air fresheners contain 1,4-dichlorobenzene, a VOC which may cause
reductions in lung function (NIH, 2006). Deodorant materials do not remove materials causing
odors, but rather mask odors which may be present in the area.
Cleaning products and hand sanitizer were observed in some areas. These products
contain chemicals that can be irritating to the eyes, nose and throat of sensitive individuals.
These products should be properly labeled and stored. Additionally, a Material Safety Data
Sheet (MSDS) should be available at a central location for each product in the event of an
emergency. Consideration should be given to providing teaching staff with school-issued
cleaning products and supplies to prevent any potential for adverse chemical interactions
between residues left from cleaners used by the schools facilities staff and those left by cleaners
brought in by others.
Operable fume hoods are critical to providing control and removal of fumes and vapors
from experiments that may produce airborne products. If the school curriculum requires the use
of fume hoods, these fume hoods should be inspected and calibrated as per manufacturer’s
recommendations.
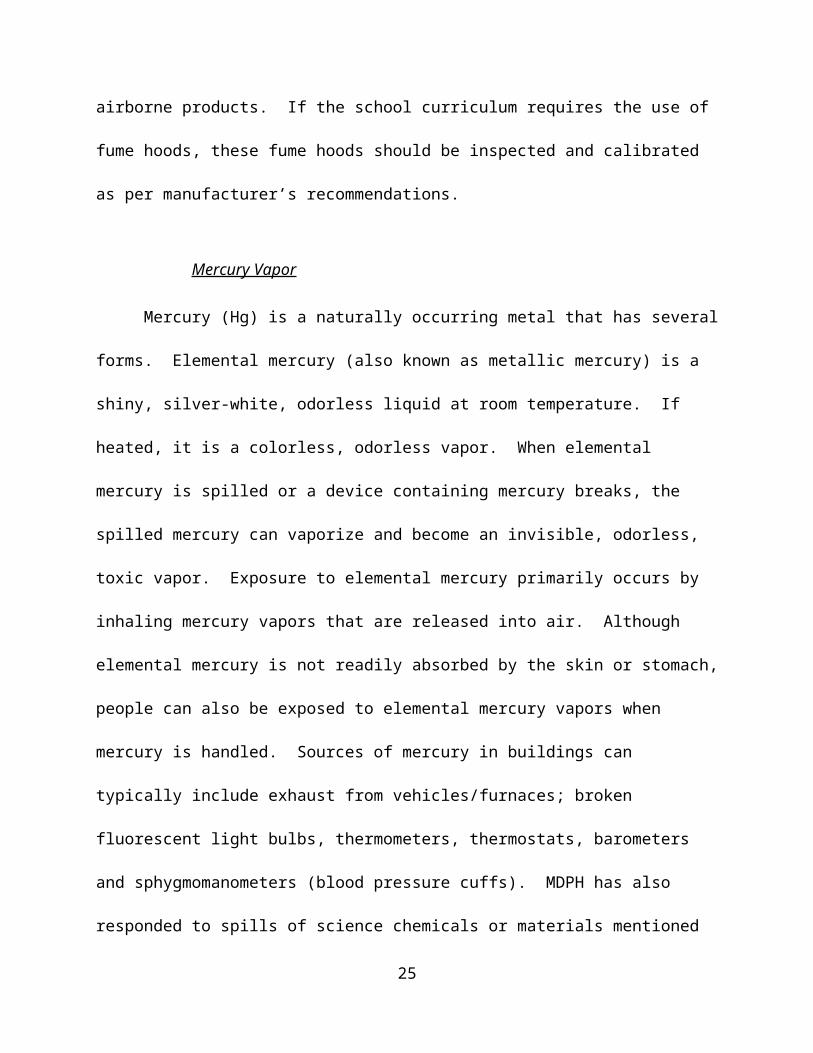
Mercury Vapor
Mercury (Hg) is a naturally occurring metal that has several forms. Elemental mercury
(also known as metallic mercury) is a shiny, silver-white, odorless liquid at room temperature. If
heated, it is a colorless, odorless vapor. When elemental mercury is spilled or a device
15
containing mercury breaks, the spilled mercury can vaporize and become an invisible, odorless,
toxic vapor. Exposure to elemental mercury primarily occurs by inhaling mercury vapors that
are released into air. Although elemental mercury is not readily absorbed by the skin or stomach,
people can also be exposed to elemental mercury vapors when mercury is handled. Sources of
mercury in buildings can typically include exhaust from vehicles/furnaces; broken fluorescent
light bulbs, thermometers, thermostats, barometers and sphygmomanometers (blood pressure
cuffs). MDPH has also responded to spills of science chemicals or materials mentioned above.
These types of materials can be found in classrooms/schools and public buildings across the
state.
Mercury also occurs naturally in the environment and can be found at low levels in air.
Mercury levels have been measured at levels between 0.010 and 0.020 µg/m3 in outdoor, urban
settings and 0.006 µg/m3 in ambient, non-urban settings (ATSDR, 1999). Background levels of
mercury outside the EATS were measured at 0.017 µg/m3. Indoor mercury levels ranged from
0.002 to 0.093 µg/ m3. Factors that may contribute to these background mercury levels include
the fossil-fueled lawn and field care equipment and traffic near the EATS.
The U.S. Agency for Toxic Substances and Disease Registry (ATSDR) has also
established suggested action levels for mercury indoors (Appendix B). The MDPH recommends
that buildings with mercury spills indoors be remediated/cleaned to where mercury air vapor
levels are below 1 µg/m3 within the relevant breathing zone of occupants based upon ATSDR
guidance. Mercury levels in all areas sampled were in a range 0.002 to 0.093 µg /m3, well below
the ATSDR suggested action level of 1 µg/m3.
Short-term exposure to high levels of elemental mercury vapors may cause effects
including, but not limited to: nausea, vomiting, diarrhea, increases in blood pressure or heart rate,
16
skin rashes, eye irritation, metallic taste in the mouth, and irritant effects to the respiratory
system and lung (such as coughing and sore throat). Longer-term health effects depend on the
amount and length of time of exposure to elemental mercury. Higher exposures to mercury can
result in a range of health effects, including effects to the central nervous system and liver and
kidney damage.
Fluorescent light fixtures were missing covers in a number of areas (Picture 11). Fixtures
should be equipped with access covers installed with bulbs fully secured in their sockets.
Breakage of glass can cause injuries and may release mercury and/or other hazardous
compounds.
Other Conditions
Other conditions that can affect indoor air quality were observed during the assessment.
In some classrooms and offices, items were observed on windowsills, tabletops, counters,
bookcases and desks (Table 1). The large number of items stored in classrooms provides a
source for dusts to accumulate. These items (e.g., papers, folders, boxes) make it difficult for
custodial staff to clean. Items should be relocated and/or be cleaned periodically to avoid
excessive dust build up. In addition, these materials can accumulate on flat surfaces (e.g.,
desktops, shelving and carpets) in occupied areas and subsequently be re-aerosolized causing
further irritation.
Chalk dust was observed to be accumulated in chalk trays (Picture 12). This material can
be irritating to the respiratory tract and eyes if it becomes airborne. Chalk and dry erase trays
should be cleaned regularly to prevent the build-up of materials.
A number of personal and wall-mounted fans in classrooms and common areas were
observed to have accumulated dust/debris (Picture 13). Re-activated fans can aerosolize dust
17
accumulated on fan blades/housing. Exhaust vents were also found to be dusty in some areas
(Table 1). Backdrafting from deactivated exhaust equipment can result in aerosolized dust.
Window-mounted or portable AC units are equipped with washable filters. These filters
should be cleaned/changed periodically as per manufacturer’s instructions to avoid the build-up
and re-aerosolization of dirt, dust and particulate matter. As stated previously, AC units are
often equipped with a “fan only” or “exhaust open” setting. In this mode of operation, the unit
can provide air circulation by delivering fresh air without cooling if needed.
Some areas, particularly Extension Hall and the barns, are used to house animals, which
may produce odors and particulates (such as described for the bird room above). Dogs are
present in some classrooms. Animals, animal wastes, and items used to care for animals should
be kept clean to prevent a buildup of aerosolizable particles, allergens and odors, as well as for
the health of the animals themselves.
Underground Structures
As reported by concerned parents, students reportedly have access to a tunnel system
located on or near the EATS campus. EATS staff identified two tunnel systems, which appear to
be remnants of the former Essex County Tuberculosis Sanatorium (ECTS) facility. The
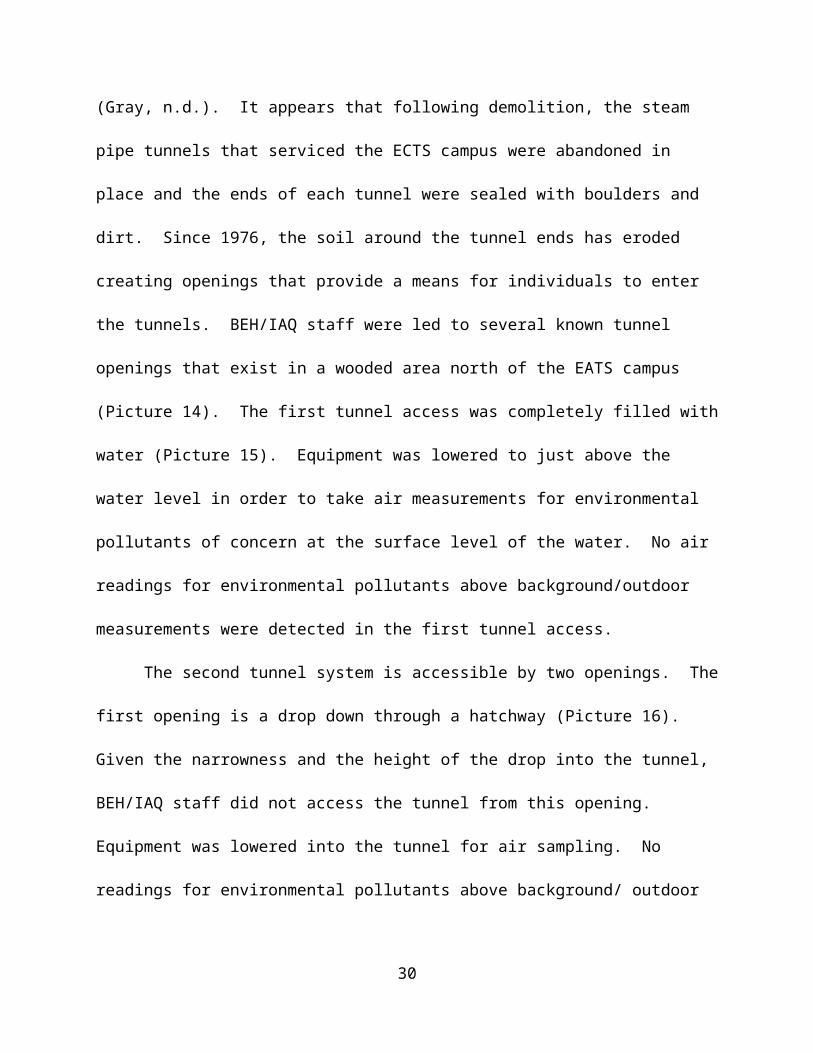
buildings of the ECTS were razed in 1976 (Gray, n.d.). It appears that following demolition, the
steam pipe tunnels that serviced the ECTS campus were abandoned in place and the ends of each
tunnel were sealed with boulders and dirt. Since 1976, the soil around the tunnel ends has
eroded creating openings that provide a means for individuals to enter the tunnels. BEH/IAQ
staff were led to several known tunnel openings that exist in a wooded area north of the EATS
campus (Picture 14). The first tunnel access was completely filled with water (Picture 15).
Equipment was lowered to just above the water level in order to take air measurements for
18
environmental pollutants of concern at the surface level of the water. No air readings for
environmental pollutants above background/outdoor measurements were detected in the first
tunnel access.
The second tunnel system is accessible by two openings. The first opening is a drop
down through a hatchway (Picture 16). Given the narrowness and the height of the drop into the
tunnel, BEH/IAQ staff did not access the tunnel from this opening. Equipment was lowered into
the tunnel for air sampling. No readings for environmental pollutants above background/
outdoor measurements were detected in the first access point to the second tunnel.
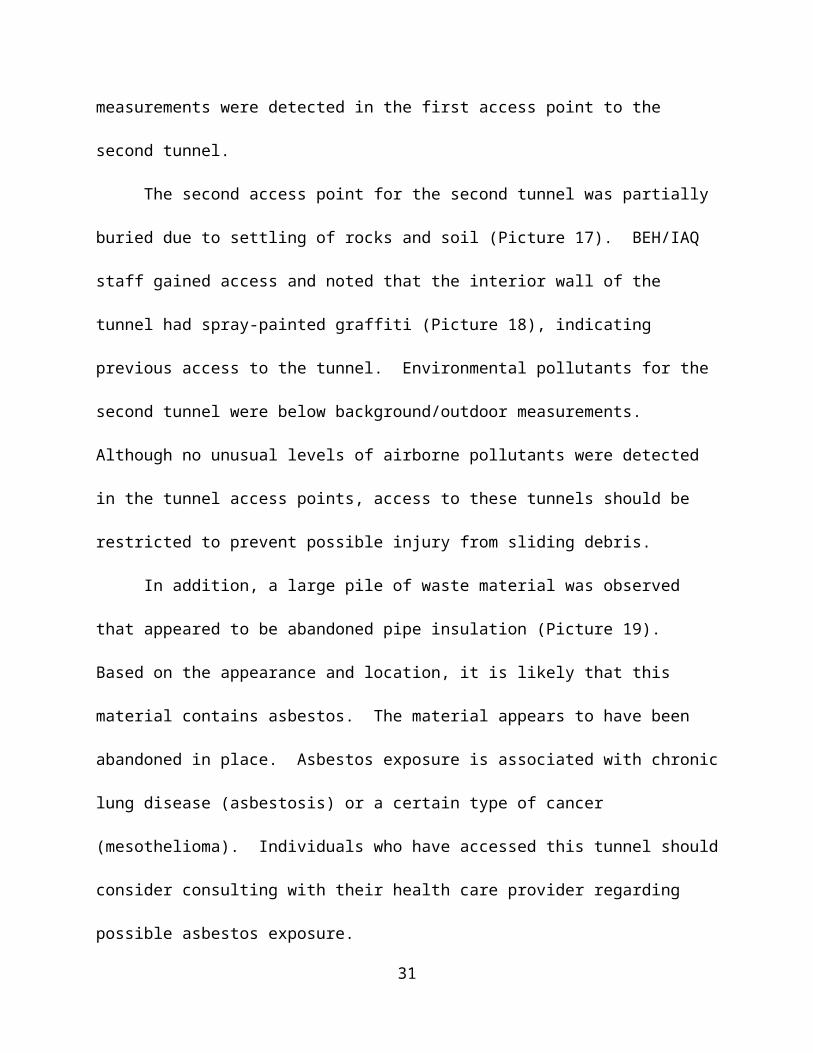
The second access point for the second tunnel was partially buried due to settling of rocks
and soil (Picture 17). BEH/IAQ staff gained access and noted that the interior wall of the tunnel
had spray-painted graffiti (Picture 18), indicating previous access to the tunnel. Environmental
pollutants for the second tunnel were below background/outdoor measurements. Although no
unusual levels of airborne pollutants were detected in the tunnel access points, access to these
tunnels should be restricted to prevent possible injury from sliding debris.
In addition, a large pile of waste material was observed that appeared to be abandoned
pipe insulation (Picture 19). Based on the appearance and location, it is likely that this material
contains asbestos. The material appears to have been abandoned in place. Asbestos exposure is
associated with chronic lung disease (asbestosis) or a certain type of cancer (mesothelioma).
Individuals who have accessed this tunnel should consider consulting with their health care
provider regarding possible asbestos exposure.
19
Evaluation of Other Environmental Concerns
In addition to the IAQ investigations and medical records review, MDPH/BEH agreed to
investigate several specific environmental concerns raised by parents who wondered about the
possibility of common factors associated with activities shared among the EATS and NSTHS
students exhibiting vocal tics/chronic hiccup symptoms. Specifically, to address concerns about
the students’ use of outdoor athletic fields located at both NSTHS and at the East Street Field in
Middleton, MDPH/BEH obtained and evaluated available information on the use and
maintenance of these fields, including information on what pesticides or other products have
been applied to the fields. In response to questions regarding the nature and extent of
contaminated soil discovered during EATS construction, MDPH/BEH reviewed records
available from the Massachusetts Department of Environmental Protection (MassDEP). In
follow-up to specific concerns raised at the 2013 parents meeting relative to water in large team
water cooler containers filled at NSTHS and consumed by students during athletic events,
MDPH/BEH collected two water samples and had them analyzed for drinking water
contaminants. To address concerns regarding potential exposures associated with the March
2011 explosion at the Bostik facility located in Middleton, MDPH/BEH reviewed available data
and evaluated whether it could be relevant to potential exposure among students experiencing
vocal tics/chronic hiccups.
Athletic Fields at NSTHS and East Street Field
As noted above, several parents reported that most of the students exhibiting vocal
tic/chronic hiccup symptoms play on the schools’ sports teams that have spent time on athletic
fields at NSTHS and East Street Field in Middleton. To follow-up on concerns expressed by
20
some parents that time spent on these fields could be associated with vocal tics/chronic hiccups,
MDPH contacted school and local health officials to learn more about the overall use and
maintenance of these fields, including the application of pesticides or other products, to
determine if further investigational activities (e.g. testing of fields) might be warranted.
Additional details regarding these fields are provided in the NSTHS IAQ report (released under
separate cover) and in the East Street Field Health Consultation Report located in Appendix C.
According to NSTHS officials, the school fields are used for a variety of student sporting
activities, team practices and game events that include physical education classes and sports
programs (e.g. soccer, baseball, softball, football). NSTHS physical education classes use the
school fields during the school day, and team sports programs consisting of students from both
EATS and NSTHS use the fields during the afternoons, evenings and weekends.
As required by state regulations, NSTHS has an Integrated Pest Management (IPM) plan
designed to achieve pest control in an environmentally responsible manner through a
combination of multiple pest control measures that minimize the reliance on chemical pesticides.
When pesticide applications are necessary, the plan calls for the selection of pesticide products
that pose the least amount of risk. State regulations also require that pesticides not be applied to
outdoor school properties when students are present, that signage be posted at conspicuous
access points, and that the school ensures students remain off the treated area(s) for at least eight
hours.
According to NSTHS officials, only fertilizers have been applied to the athletic fields
during the school year and historically; no pesticides have been applied on the fields during the
academic year. Any necessary chemical applications to the fields typically occur in mid to late
July by a licensed pesticide applicator who is required to follow the IPM plan. In July 2012 and
21
2013, two pesticide products were applied on outdoor school grounds (including fields) at
NSTHS to control weeds, and another product was applied for grub control. MDPH/BEH
reviewed the available product information for these pesticides. The active ingredients of the
pesticide products used on the NSTHS grounds are also commonly used throughout
Massachusetts and the U.S. for athletic fields and also for many other commercial and private
residential lawn settings (i.e. imidachloprid, glyphosate, dimethylamine salt of 2,4-
dichlorophenoxyacetic acid, quinclorac, Dicamba). These products are designed to be absorbed
by the plant material and upper soil within a short period of time and little to no residue is
expected shortly after their application.
In response to parent concerns about students with vocal tics/chronic hiccups using East
Street Field, MDPH/BEH conducted a site visit and evaluated available environmental data.
East Street field, located at 131 East Street in Middleton, is a multi-use recreational field owned
and operated by the Town of Middleton. The field is located adjacent to the former East Street
landfill which received official closure certification from MassDEP in 2001. Offsite soil was
brought in to construct the recreational fields. Local youth and adult sports leagues, along with
high school sports teams, began using the field in 2005. Review of available environmental data
for the closed landfill area indicated that exposure opportunities to constituents detected in
adjacent surface waters are unlikely to result in health effects, particularly given the low
potential for actual contact with surface waters that are difficult to access due to dense vegetation
and location. Subsurface gas samples (under the landfill cap) also did not reveal any detections
of landfill related constituents indicating that gas generated by the closed landfill is not reaching
the nearby field.
22
Although not applied directly to the grass of the playing fields, ground spray pesticide
applications have been conducted periodically in the area of NSTHS, East Street Field, and
throughout the region by the mosquito control district to reduce the risk of mosquito-borne
illnesses (i.e. West Nile Virus and Eastern Equine Encephalitis). The pesticide products
associated with mosquito control applications are also listed in the IPM plans (and are subject to
the plan’s notification requirements). Ground spraying activities are conducted with truck
mounted sprayers and typically occur close to the roads and outside fences. In 2012, ground
spraying in the vicinity of NSTHS consisted of two applications of the pesticide Duet in August
and September. In 2013, ground spraying of Duet in the vicinity of NSTHS occurred in August.
Ground spraying of Duet also occurred in the vicinity of East Street Field in August and
September 2012 and in September 2013. Another pesticide product, Suspend SC, was also
applied to brush and woodland areas (habitats where mosquitos may reside) lining the East Street
Field as a barrier control for mosquitoes in September 2013. Given the time of application (after
activities at the field ceased for the day), low concentrations of the active ingredients applied,
and rapid breakdown of the product in the environment, adverse health effects from these
applications would not be expected.
Removal of Contaminated Soil at EATS
Some parents expressed concern about ongoing construction activities at EATS and the
excavation and off-site disposal of contaminated soils discovered on the school property. Based
on information available from MassDEP, there are several areas on the EATS property where
petroleum contaminated subsurface soils have been identified and investigated resulting in soil
excavation and removal activities. In September 2012, during excavation of footings for the new
Animal Science Building, oily soils were discovered which prompted environmental sampling
23
(CDW, 2013). Results of sampling indicated the presence of fuel oil contaminated subsurface
soils which were required to be removed before the area was backfilled with dense grade
material to the elevation of the proposed Animal Science Building. During the soil excavation
activities, ambient air monitoring for VOCs was conducted with no exceedances and visual dust
monitoring did not result in the need to halt work due to excessive dust or other air quality
issues. Contaminated soils removed from this area were transported off site for proper disposal
in November 2012.
Petroleum contaminated subsurface soils have also been identified and remediated in
other localized areas on school property, such as those areas impacted by leaking underground
storage tanks (USTs). For example, removals of subsurface soils contaminated with fuel oil
from former USTs occurred at Berry Hall and Smith Hall in 1998 and 1992 respectively (CDW,
2012). Given that the contaminated soils identified in these areas were located beneath buildings
and below the ground surface, it is unlikely that students would have had sufficient opportunities
for direct contact with these soils prior to remediation. In addition, based on a review of the
MassDEP records for these and other petroleum constituent releases, no impacts to groundwater
or the indoor environments of buildings were noted. Further, during the IAQ inspections
conducted at EATS, no odors were observed or reported in Berry Hall, Smith Hall or other
campus buildings that would suggest any indoor air quality impacts associated with former
USTs. Measured TVOCs were non-detect in most buildings tested and although slight levels
were detected in a few areas (including at Smith Hall; Table 1), these detections were likely
attributed to use of cleaning products, dry erase markers, or other common indoor sources.
24
Team Water Cooler Containers
At the February 2013 parents meeting, drinking water provided to athletes in large team
water containers (e.g. 10 gallon water coolers) during the shared sports activities was identified
as being a possible common factor among some of the students who were reported as having
vocal tics and chronic hiccups. In response to these specific concerns MDPH spoke with school
officials at NSTHS responsible for managing drinking water provided for athletic activities and
learned there are approximately 25 large team water cooler containers that are cleaned, filled,
and rotated on a regular basis for sporting events. All water cooler containers are filled from the
same water tap which is supplied by municipal water and none of the water containers are
specifically assigned to one particular team.
In June 2013, MDPH collected two water samples; one from a randomly selected large
filled team 10 gallon water cooler container and another from the supply tap where the water
containers are filled. Both water samples were delivered to a private analytical lab where they
were analyzed for a suite of regulated drinking water contaminants including metals, volatile
organic compounds, and semi-volatile organic compounds (e.g. pesticides). No drinking water
contaminants were detected in either of the water samples.
2011 Bostik Explosion
Shortly after 7:30 pm on March 13, 2011, an explosion and fire occurred at Building 9 at
the Bostik Company Adhesive and Sealant manufacturing facility located at 211 Boston Street in
Middleton (US EPA, 2011; MassDEP, 2011; GEI, 2011). The cause of the explosion was not
immediately known, but due to the nature of chemicals used and stored at the facility, there was
initial concern about the potential release of hazardous materials. Numerous first responders and
25
HazMat teams responded to the incident, as did the MassDEP and the U.S. Environmental
Protection Agency (U.S. EPA).
During the event, MassDEP determined the winds were from the west (blowing east) at a
fairly constant rate of 3.5 to 4 mph which was consistent with information from a nearby weather
station located in Boxford. MassDEP conducted ambient air monitoring both at the facility and
immediately off-site on Boston Street. MassDEP and Fire Services HazMat teams also
conducted remote air monitoring in neighborhood areas located easterly and northeasterly of the
facility (approximately 1000 feet downwind of Bostik). Surface water sampling was also
conducted at the Ipswich River just downstream from the facility. Based on the sampling
conducted, MassDEP determined that no significant levels of chemicals were identified in the air
or water samples collected in the Ipswich River or in neighborhood air (MassDEP, 2011).
During the event, toluene was detected in the ambient air at the facility, but was not detected on
Boston Street (US EPA, 2011). No volatile organic compounds were detected in air at the
facility or off-site the following day (US EPA, 2011; MassDEP, 2011).
Thus, based on the available information and results of sampling conducted both during
and immediately following the Bostik explosion no significant offsite detections of chemicals in
either air or water associated with the explosion were measured. In addition, NSTHS, EATS,
and East Street Field are all located between 1.7 and 3.8 miles from Bostik, well beyond the
geographic area determined to be most impacted and cleared immediately after the event.
26
Medical Records Review
Comprehensive Efforts to Identify Students with Vocal Tics
Similar to most state health departments, Massachusetts does not have a registry or
surveillance system to track new diagnoses of neurological tic disorders such as vocal tics. As a
result, readily available statistics on the incidence of this health outcome in cities and towns
throughout the Commonwealth do not exist. In an effort to identify all possible cases of students
who attend EATS and NSTHS and who have been diagnosed with vocal tics including chronic
hiccups, MDPH/BEH worked with the Massachusetts Board of Registration in Medicine
(BORIM) to reach out to medical providers in the more than 50 communities where students
attending the two schools may live and the city of Boston. In addition MDPH/BEH also reached
out to medical specialists at the Pediatric Environmental Health Specialty Unit (PEHSU) at
Children’s Hospital in Boston to determine if students from these two schools had presented with
these symptoms.
Based on input regarding catchment areas from PEHSU physicians at Children’s Hospital
as well as from feedback received from participants at the parent meeting, MDPH worked with
BORIM to distribute letters to over 2600 attending physicians, encompassing more than a dozen
medical specialties. Letters to physicians described the MDPH/BEH investigation and requested
their assistance in identifying any patients they may treat with an acquired vocal disorder, such
as vocal tics or chronic hiccups, and that attend either EATS or NSTHS. Physicians were asked
to discuss the MDPH/BEH investigation with the parent of any patients diagnosed with the
outcomes of interest to determine their interest in participating and to provide a copy of an
enclosed Authorization for Disclosure of Medical Records consent form that, with signature,
27
allows MDPH/BEH to obtain and review their patient’s medical records. The parent or guardian
would need to complete the consent form (or patients age 18 or older complete and sign their
own form) and return it to MDPH/BEH. Copies of the letter and consent form sent to physicians
are included in Appendix D.
Letters were initially distributed to the physicians in March 2013. Follow-up outreach
was conducted to the same physicians list in May 2013. In addition to the outreach to area
physicians, a copy of the MDPH consent form was also provided directly to parents who
attended the February meeting and/or who contacted MDPH/BEH directly after learning about
the investigation from other parents, school officials or through one of three MDPH/BEH
investigation updates that were distributed to both school communities.
Medical Records Review Methods
Once a signed Authorization for Disclosure of Medical Records consent form was
received from parents (or patients if age 18 or older) who agreed to participate in the
investigation, MDPH/BEH contacted the physicians and/or health care facilities listed on the
consent form to request copies of medical records. The physicians and/or health care facilities
were responsible for copying and submitting the records to MDPH/BEH.
All medical records received by MDPH/BEH were reviewed by the Bureau’s Chief
Medical Officer, Dr. Jonathan Burstein. The purpose of the medical records review was to both
confirm the diagnosis of vocal tics or chronic hiccups, and to determine if there were any
common factors (either environmental or non-environmental) among them that may have
contributed to the development of these symptoms.
Tics are brief, repetitive movements (motor tics) or sounds (vocal tics). Simple tics
include such sounds or movements as eye blinking, head turning, muscle tensing, throat clearing,
28
barking and hiccupping, while complex tics include repeating parts of words or phrases, facial
grimacing and adjusting or picking at clothing (Bagheri MM 1999). The diagnosis of a tic
disorder is dependent on the duration of symptoms (American Psychiatric Association (APA)
2000). A chronic tic disorder is diagnosed if an individual has had either a motor or vocal tic for
over a year. A transient tic disorder is diagnosed if a motor or vocal tic is present for less than a
year (American Psychiatric Association 2000).
Tic disorders are believed to be the most common movement disorder in children and are
typically more common in males than females (Cubo, 2012; Knight et al., 2012; Intellihealth,
2004; Lanzi et al., 2004; Gadow et al., 2002; Snider et al., 2002; Behrman et al., 2000).
Estimates of the prevalence of tic disorders in children vary throughout the literature; it is
thought that between 2% and 24% of schoolchildren have experienced a simple or complex
motor or vocal tic during their lifetime, with some prevalence estimates among schoolchildren
reaching 46% (Cubo, 2012; Knight et al., 2012; Bitsko et al., 2011; Robertson, 2006, Bruun and
Budman, 2005; Penn Health, 2004; Shapiro et al., 1988). Tourette’s Syndrome is the most
studied tic disorder in Western populations and has also been reported in a variety of population
groups all over the world (Cubo, 2012, Robertson 2006). Prevalence estimates for vocal tics
alone do not seem to be well understood due to the challenges associated with diagnosis,
overlapping symptoms, and the use of different epidemiologic methods (Walkup, et al., 2010)
but appear to be less common than the prevalence of motor tics (Knight et al, 2012; Bagheri et
al., 1999).
Tics are classified as either primary (those with an unknown origin) or secondary. The
cause of primary tic disorders is unknown although they are thought to arise through a complex
combination of genetic predisposition and environmental factors (Bagheri et al., 1999). Possible
29
environmental factors suggested in the literature include an infectious agent or complications
during pregnancy (Walkup et al., 2010; Bagheri et al, 1999; Robertson, 2000). It has been
suggested that pediatric autoimmune neuropsychiatric disorders associated with streptococcal
infections (PANDAS) may play a role in development of tic disorders, although further research
is needed to confirm this (Robertson, 2000; Bagheri et al., 1999). Examples of conditions that
could cause secondary tic disorders include head trauma, stroke, encephalitis, carbon monoxide
poisoning, and Huntington’s disease (Bagheri et at., 1999). Certain drugs may also unmask tic
disorders, including amphetamines, cocaine, and certain anticonvulsants (Cardoso and Jankovic,
1993; Bagheri et al., 1999). It is unclear if stimulant medications for treatment of comorbid
conditions (e.g. ADHD) will unmask tic disorders or increase the severity of tic symptoms in
some individuals (Bagheri et al., 1999; Law and Schachar, 1999). Anxiety, stress, or fatigue can
exacerbate tic symptoms (Bagheri et al., 1999).
Results of Medical Records Review
Participation
A total of 15 families had originally contacted the MDPH/BEH with concerns about their
child’s vocal tic or chronic hiccup symptoms either by phone or through attendance at the parent
meeting in February 2013. Four additional families contacted MDPH/BEH in response to
receiving the department’s investigation updates that were distributed to the school communities
in May and August. Based on anecdotal information reported to MDPH/BEH by parents via
phone or at the parent meeting, all but one of the 19 students reported as having vocal
tics/chronic hiccups symptoms were female.
30
All families who contacted MDPH/BEH were invited to participate in the medical
records review and an Authorization for Disclosure of Medical Records consent form was
provided.
As mentioned, extensive outreach to more than 2600 physicians and specialists in more
than 50 communities was conducted in March and again in May 2013. MDPH/BEH was
contacted by several physicians who had received the mailing, who had questions about the
investigation, or who reported having adult patients with these symptoms who lived in other
areas and were not affiliated with the two schools in any way.
In response to these outreach efforts, between May and October 2013, MDPH/BEH
received signed medical records consent forms for slightly less than 50% (n=9) of the fifteen
students reported as having vocal tics/chronic hiccups, which allowed MDPH/BEH to obtain and
review their medical records. Consent for MDPH/BEH to request records from multiple medical
care providers and specialists was provided for the majority of the nine participants.
Evaluation of Available Medical Records
The nine students who participated in the review of medical records by the Bureau’s
Chief Medical Officer ranged in age from 15 to 18 years. Review of the medical records for
these nine individuals indicated that all nine were documented as having vocal tics, most
typically described as hiccups, yelps, or grunts. No motor tics were described. The onset of
vocal tics for all but one individual was reported to have occurred sometime within the previous
year (i.e. 2012). One of the individuals had been experiencing vocal tic symptoms for
approximately four years. For one individual, vocal tic symptoms were reported to be eased at
night, and in another, they ceased during school vacation.
31
Although participation in school sports teams was reported in the records for eight of the
nine individuals, no common medical factors were identified among the group that would
suggest a common neurological, mechanical, infectious, or toxic etiology based on the
information contained in the medical records. One of the nine individuals has had a previously
diagnosed chronic tic disorder (Tourette’s Syndrome) for approximately four years. Two other
individuals had a possible predisposition for vocal tics (i.e. personal/family history of seizures)
although the medical records did not specifically describe these as being associated with the
vocal tics.
None of the medical records reviewed identified a known exposure or specific agent of
environmental or infectious concern for these nine individuals. Although exposure to some
environmental agents (e.g. heavy metals, pesticides) can result in neurological effects (e.g. visual
or muscular effects in worker populations) in humans at higher doses of exposure, it would be
unusual for motor or vocal tics to occur in isolation of other more prominent neurological effects.
Based on information reported in the medical records, no other such neurological effects were
identified, and seven of the nine individuals were screened for other neurological effects (e.g.
liver or kidney damage) with no abnormal results reported. Six of the nine individuals had
specific lab results that ruled out recent or current strep infection and no other infectious
conditions were reported (e.g. meningitis, encephalitis). Four of the six individuals had
documented orthopedic injuries but none had head injuries noted in the medical records. Based
on information in the medical records, no new medications possibly attributed to unmasking tic
symptoms were introduced to these nine individuals’ regimens prior to the onset of vocal tic
symptoms.
32
Discussion
This report provides results for the May 22, 2013 IAQ investigation of indoor
environmental conditions in student-accessible areas at EATS not previously assessed (i.e., the
automotive shop (AMS) and Science Buildings, Extension, Maude, and Smith Halls, barns,
greenhouses, and underground tunnel structures). Based on these results, no substances that are
likely to have neurological effects (e.g., carbon monoxide, VOCs, or mercury) were found at
levels that would be associated with health impacts based upon the scientific/medical literature.
Previous indoor environmental inspections, including air testing, conducted by the MDPH IAQ
Program at other buildings on the EATS campus on March 26, 2013 also identified no significant
environmental factors at the school that would be expected to result in potential neurological
effects. No environmental pollutants were detected in air above background levels in the
abandoned tunnels and thus it is unlikely that exposure to chemical contaminants would result in
any neurological symptoms. However, as recommended to the EATS representative that
accompanied MDPH on the site visit, the insulation-like material observed in one of the tunnels
should be evaluated by a licensed asbestos inspector to determine whether it contains asbestos
and access to the tunnels should be restricted to prevent any exposure and/or physical injuries
(i.e. from sliding rocks). Asbestos exposure is specifically associated with chronic lung disease
(asbestosis) or a certain type of cancer (mesothelioma) and thus, any individual who entered the
tunnel in the past should consider consulting with their health care provider regarding possible
asbestos exposure. MDPH/BEH staff also identified various conditions that can affect indoor air
quality and comfort parameters of building occupants. A number of specific recommendations
(e.g. maximize air exchange in buildings) are provided in the recommendations section later in
this report to address these indoor environmental issues.
33
Based on the two IAQ investigations conducted at EATS and a third at NSTHS on May
31, 2013, no environmental conditions or indoor air quality results were identified at either
school that would indicate the presence of a common environmental risk factor expected to result
in neurological effects to students, including those experiencing vocal tic/chronic hiccups
symptoms.
Further, several concurrent investigations into other possible environmental factors
expressed as concerns by parents of students who contacted MDPH did not identify any unusual
exposure opportunities as being associated with school attendance or participation in school
sports teams, or were otherwise unique to the students with vocal tics/chronic hiccups. A
detailed review of field maintenance practices, history of pesticide applications, and the patterns
of use for sporting activities at both NSTHS and East Street Field, did not indicate anything
unusual about these fields that would suggest their use could play a primary causative role.
Further investigation (e.g. environmental testing) of these fields is not recommended. Although
it has been reported that some students with vocal tic/repetitive hiccup symptoms have spent
significant time on NSTHS fields, many other students have also regularly used these fields with
no similar symptoms being reported. Notably, the East Street Field is also regularly used by
many other residents of Middleton for a variety of recreational activities and sporting events with
no reports of similar vocal tic/chronic hiccup symptoms among other groups. In addition, field
maintenance practices at NSTHS and East Street Field are typical of what occurs at other schools
and recreational fields throughout Massachusetts. Implementation of the IPM plans applicable to
both fields helps to reduce chemical/pesticide use and, when required, pesticide products are
required to be applied in ways that restrict access and minimize exposure opportunities for
students and other members of the public using the fields.
34
In addition, based on a review of information obtained from MassDEP regarding soil
removal actions at EATS, historical releases of fuel oil to subsurface soils were remediated in
several localized areas on school property (e.g., beneath school buildings), however student
exposure or direct contact with these contaminated soils would not be expected. Samples of
water provided in large refillable water cooler containers for use by school sport teams were
collected from NSTHS by MDPH and analyzed for a suite of regulated drinking water
contaminant (e.g. metals, volatile organic compounds, pesticides) with no detections. Finally, a
review of available information and environmental sampling results following the 2011 Bostik
explosion did not suggest any likely exposure impacts that could be uniquely associated with the
onset of vocal tics/chronic hiccups among some EATS and NSTHS students.
Although prevalence estimates vary in the scientific literature, it is thought that between
2% and 24% of schoolchildren have experienced a simple or complex motor or vocal tic during
their lifetime, with some prevalence estimates for tic disorders among schoolchildren reaching
46% (Cubo, 2012; Knight et al., 2012; Robertson, 2006; Bitsko et at., 2011; Bruun and Budman,
2005; Penn Health, 2004; Shapiro et al., 1988). As noted above, a systematic surveillance
system for the reporting of tic disorders does not exist in Massachusetts, however a crude
prevalence estimate suggests that if all 19 students originally reported to MDPH/BEH as having
vocal tics/chronic hiccups were confirmed, that would suggest a prevalence estimate of 2%.
After conducting extensive outreach to over 2600 physicians and specialists in more than 50
communities and also providing consent forms directly to parents upon request, MDPH was able
to obtain and review medical records for nine students reported as having vocal tics/chronic
hiccups while attending either EATS or NSTHS, resulting in a crude prevalence of 1%.
35
Conclusions
In summary, based on the results of the indoor and ambient environmental investigations
conducted at EATS and NSTHS and related properties, evaluation of several additional
environmental exposure concerns raised by parents, and results of the medical records review, no
environmental exposure factors were identified as being specifically associated with school
attendance or participation in sports teams, or were otherwise unique to the students experiencing
vocal tics/chronic hiccups. Further, the crude prevalence estimate for individuals with confirmed
vocal tics/chronic hiccups at the schools is estimated at 1% which appears consistent with
prevalence estimates for tic disorders available in the scientific/medical literature. Finally, based
on the review of the available medical records, all nine of these individuals were confirmed as
experiencing vocal tics (i.e. hiccups, yelps, or grunts) with some variation in frequency of
occurrence. The onset of vocal tic symptoms occurred within the previous year (2012) for eight
of the nine individuals; one of the individuals has experienced vocal tics for approximately four
years and was diagnosed with a chronic vocal disorder. Based on anecdotal information reported
to MDPH by parents of children who did not participate in the medical records review, the onset
of vocal tic/chronic hiccup symptoms also occurred in their children sometime within the
previous year (i.e. 2012).
Three of the nine individuals who participated in the medical records review had at least
one possible predisposition for vocal tics (i.e. previous Tourette’s Syndrome diagnosis, or
personal/family history of seizure disorders), and none of the other six individuals had any
potential risk factors for vocal tics reported in their medical records. Other than specific mention
of participation in sporting events reported in the medical records for eight of the nine students,
no common factors were indicated that would suggest a common neurological, mechanical,
36
infectious, or toxic etiology for vocal tics. In addition, no other symptoms or effects that would
be indicative of a toxic exposure (e.g. liver or kidney damage) were identified in any of the
medical records reviewed.
Recommendations
As noted above, based on observations and air measurements taken during the May 22,
2013 IAQ visit at EATS, substances that are likely to have neurological effect (e. g., carbon
monoxide, VOCs, or mercury) were not found at levels associated with health impacts based
upon the scientific/medical literature. However, BEH/IAQ staff did identify various conditions
that can affect IAQ/comfort of building occupants and suggest a number of specific
recommendations.
It is important to note that a new building is being constructed at EATS that will house
the majority of students and classroom activity. Recommendations provided in this report are
designed to improve the indoor environmental conditions in the existing buildings in the interim.
Some of the conditions listed in this report can be remedied by actions of building occupants.
Other remediation efforts will require alteration to the building structure and equipment. For
these reasons, a two-phase approach is recommended. The first consists of short-term measures
to improve air quality and the second consists of long-term measures that will require planning
and resources to adequately address overall IAQ conditions.
Short-Term Recommendations
1. Determine whether the material found in the tunnel contains asbestos. If so, remediate
the material in a manner consistent with federal and state asbestos management and
37
disposal laws. One method would be to properly seal all entrances to these tunnels and
manage the materials in place.
2. Operate all ventilation systems throughout the buildings, including univents and AHUs,
continuously during periods of occupancy to maximize air exchange.
3. Use openable windows to supplement fresh air in classrooms during occupancy. If
thermal comfort is a concern, consider opening windows between classes and during
unoccupied periods. Care should be taken to ensure windows are closed at the day’s end
to prevent freezing of pipes during winter months.
4. Consider operating window-mounted and portable ACs in the “fan only” or “fresh air”
mode to introduce outside air by mechanical means.
5. Ensure AC filters are cleaned/changed as per manufacturer’s recommendation, or more
frequently as necessary.
6. Work with an HVAC engineering firm to adjust/repair univents and exhaust vents to
improve air exchange in classrooms.
7. Remove all blockages/items from the surface of univent air diffusers and return vents
(along front/bottom) as well as from exhaust vents to ensure adequate airflow.
8. For buildings in New England, periods of low relative humidity during the winter are
often unavoidable. Therefore, scrupulous cleaning practices should be adopted to
minimize common indoor air contaminants whose irritant effects can be enhanced when
the relative humidity is low. To control dusts, a high efficiency particulate arrestance
(HEPA) filter equipped vacuum cleaner in conjunction with wet wiping of all surfaces is
recommended. Avoid the use of feather dusters. Drinking water during the day can help
ease some symptoms associated with a dry environment (throat and sinus irritations).
38
9. Examine areas of leakage and ensure any water-damaged ceiling tiles and wall materials
are repaired and/or replaced. Examine the area above ceiling tiles for mold growth.
Disinfect areas of water leaks with an appropriate antimicrobial, as needed.
10. Maintain aquariums, pools and other sources of water properly to prevent odors and
microbial growth.
11. Ensure indoor plants are equipped with drip pans. Examine drip pans periodically for
mold growth and disinfect with an appropriate antimicrobial, as needed. Move plants
away from the air stream of mechanical ventilation equipment.
12. Consider moving water dispensing equipment to areas with non-porous flooring or place
on non-porous mat to protect against spills.
13. Increase exhaust ventilation and cleaning in the bird room to reduce levels of particulates.
14. Clean chalk and dry-erase marker trays of accumulated dust and debris regularly using a
damp cloth and/or HEPA vacuum.
15. Clean accumulated dust and debris periodically from the interior of univents, exhaust
vents, and blades of personal and ceiling fans.
16. Ensure chemical hoods are cleaned and calibrated as per manufacturer’s recommendation
if they are used in the school’s curriculum.
17. Store cleaning products properly and out of reach of students. All cleaning products used
at the facility should be approved by the school department with MSDSs available at a
central location.
18. Refrain from using air fresheners or other air deodorizers to prevent exposure to VOCs.
39
19. Consider adopting the US EPA (2000) document, “Tools for Schools”, as an instrument
for maintaining a good indoor air quality environment in the building. This document is
available at: http://www.epa.gov/iaq/schools/index.html.
20. Refer to resource manual and other related indoor air quality documents located on the
MDPH’s website for further building-wide evaluations and advice on maintaining public
buildings. These documents are available at: http://mass.gov/dph/iaq.
Long-Term Recommendations
1. Consult with an HVAC engineering firm for a plan to replace ventilation system
components. Take into consideration the current and likely future uses of building/space
to determine the placement of supply and exhaust ventilation to maximize airflow and
removal of pollutants and odors, including dedicated exhaust ventilation in areas where
copy machines, laminators, kilns, chemicals, and food preparation equipment are used.
2. Consult with an engineering firm to determine if any or all portions of building roofs
should be replaced.
40
References
ACGIH. 1989. Guidelines for the Assessment of Bioaerosols in the Indoor Environment. American Conference of Governmental Industrial Hygienists, Cincinnati, OH.
American Psychiatric Association (APA), Task Force on DSM-IV. Diagnostic and Statistical Manual of Mental Disorders DSM-IV-TR. 4th ed. Text revision ed. Washington, DC: American Psychiatric Association, 2000.
ASHRAE. 1989. Ventilation for Acceptable Indoor Air Quality. American Society of Heating, Refrigeration and Air Conditioning Engineers. ANSI/ASHRAE 62-1989.
ASHRAE. 1991. ASHRAE Applications Handbook, Chapter 33 “Owning and Operating Costs”. American Society of Heating, Refrigeration and Air Conditioning Engineers, Atlanta, GA.
ATSDR. 1999. Toxicological Profile For Mercury. Agency for Toxic Substances and Disease Registry, Atlanta, Georgia.
Bagheri MM, Kerbeshian J, and Burd L. 1999. Recognition and Management of Tourette’s Syndrome and Tic Disorders. Am Fam Physician. 59(8):2263-2274.
Behrman RE, Kliegman R, and Jenson H. 2000. Nelsome Textbook of Pediatrics. 16th ed. Philadelphia, PA: WB Saunders Company.
Bitsko, RH, Leeb R, Perou R, Visser S. Bridging the Gap Between Tourette Syndrome and Public Health. [2011, June 7]. http://www.cdc.gov/NCBDDD/tourette/documents/Bridging the GapTSandPH.pdf.
BOCA. 1993. The BOCA National Mechanical Code/1993. 8th ed. Building Officials & Code Administrators International, Inc., Country Club Hills, IL.
Bruun RD and Budman CL. 2005. The Natural History of Gilles de la Tourette Syndrome. In Roger Kurlan (ed.), Handbook of Tourette’s Syndrome and Related Tic and Behavioral Disorders. New York, NY: Marcel Dekker. P 24.
Cardoso F and Jankovic J. 1993. Movement Disorders. Neurologic Clinics. 11(3):625-38.
CDW. 2012. Phase I – Initial Site Investigation: Essex Agricultural and Technical High School, Building 18. CDW Consultants, Inc. December 14, 2012.
CDW. 2013. Release Abatement Measure Completion Report: Former Field Office, Milk Barn and Rodent Lab, Essex Agricultural and Technical High School. CDW Consultants, Inc. January 4, 2013.
Cubo, Esther, MD, PhD. Review of Prevalence Studies of Tic Disorders: Methodological Caveats. Tremor and Other Hyperkinetic Movements. The Center for Digital Research and Scholarship, Columbia University Libraries. May 18, 2012.
Gadow KD, Nolan EE, Sprafkin J, and Schwartz J. 2002. Tics and Psychiatric Comorbidity in Children and Adolescents. Dev Med Child Neurol. 44(5):330-8.
41
GEI 2011. Release Notification and Immediate Response Action Plan: Bostik-Middleton (RTN 3-29862). GEI Consultants, May 12, 2011.
Gray, J. n.d. Essex Sanatorium, Middleton, Massachusetts: History. Retrieved from http://www.danversstateinsaneasylum.com/sanhistory.html.
Intellihealth. 2004. Tics. Found at www.intellihealth.com. Accessed on 11.11.2013.
Knight T, Steeves T, Day L, Lowerison M, Jette N, Pringsheim T. 2012. Prevalence of Tic Disorders: A Systematic Review and Meta Analysis. Pediatric Neurology. 47:77-90.
Lanzi G, Zambrino CA, Termine C, Palestra M, Ginevra OF, Orcesi S, Manfredi P, and Beghi E. 2004. Prevalence of Tic Disorders among Primary School Students in the City of Pavia, Italy. Arch Dis Child. 89:45-47.
Law SF and Schachar RJ. 1999. Do Typical Clinical Doses of Methylphenidate Cause Tics in Children Treated for Attention-Deficit Hyperactivity Disorder? Am Acad Child Adolesc Psychiatry. 38(8): 944-51.
MassDEP. 2011. After Incident Report: Middleton - Bostik Chemical Facility Explosion. MassDEP Field Assessment and Support Team. March 2011.
MDPH. 1997. Requirements to Maintain Air Quality in Indoor Skating Rinks (State Sanitary Code, Chapter XI). 105 CMR 675.000. Massachusetts Department of Public Health, Boston, MA.
NIH. 2006. Chemical in Many Air Fresheners May Reduce Lung Function. NIH News. National Institute of Health. July 27, 2006. http://www.nih.gov/news/pr/jul2006/niehs-27.htm
OSHA. 1997. Limits for Air Contaminants. Occupational Safety and Health Administration. Code of Federal Regulations. 29 C.F.R 1910.1000 Table Z-1-A.
Robertson MM. 2000. Tourette Syndrome, Associated Conditions and the Complexities of Treatment. Brain. 123:425-462.
Robertson MM. 2006. Attention Deficit Hyperactivity Disorder, Tics, and Tourette’s Syndrome: the Relationship and Treatment Implications. A Commentary. European Child & Adolescent Psychiatry. 15:1-11.
Sanford. 1999. Material Safety Data Sheet (MSDS No: 198-17). Expo Dry Erase Markers Bullet, Chisel, and Ultra Fine Tip. Sanford Corporation. Bellwood, IL.
SBBRS. 2011. Mechanical Ventilation. State Board of Building Regulations and Standards. Code of Massachusetts Regulations, 8th edition. 780 CMR 1209.0.
Schmidt Etkin, D. 1992. Office Furnishings/Equipment & IAQ Health Impacts, Prevention & Mitigation. Cutter Information Corporation, Indoor Air Quality Update, Arlington, MA.
Shapiro AK, Shapiro SE, Young JG, Feinberg TE. 1988. Measurements in Tic Disorders. Gilles de la Tourette Syndrome. New York, NY: Raven Press; 451-480.
42
SMACNA. 1994. HVAC Systems Commissioning Manual. 1st ed. Sheet Metal and Air Conditioning Contractors’ National Association, Inc., Chantilly, VA.
Snider, L.A., Seligman, L.D., Ketchen, B.R., Levitt, S.J., Bates, L.R., Garvey, M.A. Swedo, S.E. Tics and Problem Behaviors in School Children: Prevalence, Characterization, and Associations. 2002. Pediatrics 110;331.
Sundell, J., H. Levin, W. W. Nazaroff, W. S. Cain, W. J. Fisk, D. T. Grimsrud, F. Gyntelberg, Y. Li, A. K. Persily, A. C. Pickering, J. M. Samet, J. D. Spengler, S. T. Taylor, and C. J. Weschler. 2011. Ventilation rates and health: multidisciplinary review of the scientific literature. Indoor Air, Volume 21: pp 191–204.
US EPA. 2000. Tools for Schools. Office of Air and Radiation, Office of Radiation and Indoor Air, Indoor Environments Division (6609J). EPA 402-K-95-001, Second Edition. http://www.epa.gov/iaq/schools/tools4s2.html.
US EPA. 2001. “Mold Remediation in Schools and Commercial Buildings”. Office of Air and Radiation, Indoor Environments Division, Washington, DC. EPA 402-K-01-001. March 2001. Available at: http://www.epa.gov/iaq/molds/mold_remediation.html.
US EPA. 2006. National Ambient Air Quality Standards (NAAQS). US Environmental Protection Agency, Office of Air Quality Planning and Standards, Washington, DC. http://www.epa. g ov/air/criteria.html .
US EPA 2011. Removal and Emergency Response Sites: Bostik Explosion, Middleton, MA. http://www.epa.gov/region1/removal-sites/BostikExplosion.html.
University of Pennsylvania Health System (Penn Health). 2004. Transient Tic Disorder. http://www.pennhealth.com. Accessed on 11.20.13.
Walkup, J.T., Ferrao, Y., Leckman, J.F., Stein, D.J., Singer, H. Tic Disorders: Some Key Issues for DSM-V. 2010. Depression and Anxiety. 27:600-610
43
FIGURES
44
Figure 1: Unit Ventilator (Univent)
45
Figure 2: Cross Ventilation in a Building Using Open Windows and Doors/Transoms
46
PICTURES
47
Picture 1
Campus map showing buildings investigated in this report
48
Picture 2
Classroom uninvent, note switch activation allowing easy deactivation
Picture 3
Classroom univent, note materials placed on top of diffuser preventing air flow
49
Picture 4
Ceiling-mounted supply vent
Picture 5
Sealed heating vent
50
Picture 6
Sealed gravity exhaust vent (arrow)
Picture 7
Transom
51
Picture 8
Water-damaged ceiling tiles above windows
Picture 9
Water cooler and fridge on carpet
52
Picture 10
Garden located in hallway
Picture 11
Missing light cover
53
Picture 12
Chalk dust in trays
Picture 13
Dust accumulated on fan blades and cover
54
Picture 14
Approximate location of tunnels
Picture 15
First tunnel, opening filled with water
55
Picture 16
Second tunnel, first access
Picture 17
Second tunnel, second access
56
Picture 18
Spray-painted graffiti, indicating access to tunnel
Picture 19
Mound of suspected asbestos
57
TABLES
58
Location: Essex Agricultural and Technical School Indoor Air Results
Address: 562 Maple St, Hathorne, MA Table 1 Date: May 22, 2013
Location
CarbonDioxide(ppm)
Carbon Monoxide
(ppm)Temp(°F)
RelativeHumidity
(%)PM2.5(µg/m3)
Hg(µg/m3)
TVOCs(ppm)
Occupantsin Room
WindowsOpenable
Ventilation
RemarksIntake Exhaust
Background 405 ND 66 53 20 0.017 ND Overcast
Automotive Shop (AMS)
AMS 02 (arbor workshop) 470 ND 68 60 20 0.030 ND 0 N N N Door open, planting equipment,
holes in wallboard and ceiling
AMS 03 729 ND 68 59 23 0.032 1.2 0 N N N Engines and engine repair equipment
AMS 05 engine 477 ND 68 61 25 0.023 1.3 0 N N N Large doors openable, vehicles
AMS 101 1077 ND 68 63 18 0.032 ND 17 Y N N sealed DEM, items, window AC- insulated with rags
AMS Wood Shop 578 ND 69 56 22 0.026 ND 0 Y N NRoom not used except by staff and infrequently, wood, shavings and machine items
Extension Hall
EH 01 (bird room) 712 ND 72 72 78 0.034 ND 0 Y N N ~ 15 caged birds
EH 03 (small mammals) 798 ND 72 49 22 0.032 ND 0 Y Y window
AC N Caged mammals, PF
ppm = parts per million AP = air purifier CPs = cleaning products FCU = fan coil unit PF = personal fan
µg/m3 = micrograms per cubic meter aqua = aquarium CT = ceiling tile MT = missing ceiling tile UV = univent
ND = non-detect AT = ajar tile DEM = dry erase materials PC = photocopier WD = water-damaged
AC = air-conditioner CD = chalk dust DO = door open
Comfort GuidelinesCarbon Dioxide: < 600 ppm = preferred Temperature: 70 - 78 °F
600 - 800 ppm = acceptable Relative Humidity: 40 - 60%> 800 ppm = indicative of ventilation problems
59
Location: Essex Agricultural and Technical School Indoor Air Results
Address: 562 Maple St, Hathorne, MA Table 1 (continued) Date: May 22, 2013
Location
CarbonDioxide(ppm)
Carbon Monoxide
(ppm)Temp(°F)
RelativeHumidity
(%)PM2.5(µg/m3)
Hg(µg/m3)
TVOCs(ppm)
Occupantsin Room
WindowsOpenable
Ventilation
RemarksIntake Exhaust
EH 06 (reptile) 537 ND 71 69 18 0.043 ND 0 Y N N PF dusty, heat lamps, open water tanks
EH 07 503 ND 67 60 28 0.027 ND 0 Y 2 open N N I MT, X-ray room
EH B03 (fish) 428 ND 70 57 21 0.027 ND 0 Y N N Many aqua, fish and supplies
Maude Hall
MH 112 748 ND 71 45 14 0.035 1 0 Y N N Window AC on, CPs, missing light cover
MH 118 919 ND 71 61 21 0.035 ND 18 Y1 open N N PF on, DEM, WD CTs
MH 124 1010 ND 67 68 21 0.032 ND 17 N Y Plants, PF, dog
MH 124 inner 881 ND 70 59 16 0.035 ND 0 N YUV N Window AC off, 2 WD-CT, DO
Science Building
SB 104 559 ND 67 62 0.023 ND 0 Y YUV off N PF, ~30 computers
ppm = parts per million AP = air purifier CPs = cleaning products FCU = fan coil unit PF = personal fan
µg/m3 = micrograms per cubic meter aqua = aquarium CT = ceiling tile MT = missing ceiling tile UV = univent
ND = non-detect AT = ajar tile DEM = dry erase materials PC = photocopier WD = water-damaged
AC = air-conditioner CD = chalk dust DO = door open
Comfort GuidelinesCarbon Dioxide: < 600 ppm = preferred Temperature: 70 - 78 °F
600 - 800 ppm = acceptable Relative Humidity: 40 - 60%> 800 ppm = indicative of ventilation problems
60
Location: Essex Agricultural and Technical School Indoor Air Results
Address: 562 Maple St, Hathorne, MA Table 1 (continued) Date: May 22, 2013
Location
CarbonDioxide(ppm)
Carbon Monoxide
(ppm)Temp(°F)
RelativeHumidity
(%)PM2.5(µg/m3)
Hg(µg/m3)
TVOCs(ppm)
Occupantsin Room
WindowsOpenable
Ventilation
RemarksIntake Exhaust
SB 106 631 ND 69 57 10 0.023 ND 0 N Y N PF, DO
SB 200 566 ND 70 58 14 0.017 ND 5 Y3 open
YUV off Aqua, PF dusty
SB 202 739 ND 71 56 12 0.021 ND 1 Y2 open
YUV off Plants, PF, DEM, aqua
SB 204 1162 ND 70 59 0.030 1.4 0 Y YUV off Y DEM, aqua, NC, PF dusty
SB 205 1051 ND 71 58 0.040 ND 0 Y YUV Y off Sinks, PF dusty, DEM, chemical
flame cabinet
SB 209 1267 ND 71 59 10 0.028 ND 0 Y YUV off Y wall off DEM, PF, CPs
SB 2nd floor women’s toilet
Yopen Y off AT
SB 302 884 ND 72 57 15 0.037 ND 1 Y Y off Y PF dusty, terrarium, DEM
SB 303 809 ND 69 57 12 0.063 ND 1 Y YUV off Y off Plants, DEM, DO
SB 304 778 ND 71 54 11 0.034 ND 1 Y open Y DEM, DO
SB 306 684 ND 69 55 13 0.093 ND 0 Y YUV
Y UV exhaust, Plants, CD, DEM
ppm = parts per million AP = air purifier CPs = cleaning products FCU = fan coil unit PF = personal fan
µg/m3 = micrograms per cubic meter aqua = aquarium CT = ceiling tile MT = missing ceiling tile UV = univent
ND = non-detect AT = ajar tile DEM = dry erase materials PC = photocopier WD = water-damaged
AC = air-conditioner CD = chalk dust DO = door open
Comfort GuidelinesCarbon Dioxide: < 600 ppm = preferred Temperature: 70 - 78 °F
600 - 800 ppm = acceptable Relative Humidity: 40 - 60%> 800 ppm = indicative of ventilation problems
61
Location: Essex Agricultural and Technical School Indoor Air Results
Address: 562 Maple St, Hathorne, MA Table 1 (continued) Date: May 22, 2013
Location
CarbonDioxide(ppm)
Carbon Monoxide
(ppm)Temp(°F)
RelativeHumidity
(%)PM2.5(µg/m3)
Hg(µg/m3)
TVOCs(ppm)
Occupantsin Room
WindowsOpenable
Ventilation
RemarksIntake Exhaustoff
SB 307 885 ND 71 55 14 0.041 ND 1 Y YUV Y UE WD CT and carpeting in hallway
outside
SB faculty kitchen 709 ND 70 59 10 0.024 ND 2 N N DO, PC, 2 WD-CT
SB info lab 660 ND 69 61 0.026 ND 11 N N N FCU, computers, PF
SB library 702 ND 67 61 10 0.024 ND 5 Y Y UV Y UE 10 WD-CT
Smith Hall
SH 102 Nurse’s ND 72 55 19 0.001 ND 2 Y N N AP, NC, fridge
SH 102 resting area 916 ND 72 53 22 0.001 ND-0.7 2 Y N N
SH 106 465 ND 71 53 8 0.010 ND 0 Y N N
SH 108 alumni office 708 ND 75 48 13 0.019 ND 2 Y N N PC, window AC, PF
SH 113 (N.Chesna) 553 ND 73 53 0.018 ND 1 Y N N Window AC
ppm = parts per million AP = air purifier CPs = cleaning products FCU = fan coil unit PF = personal fan
µg/m3 = micrograms per cubic meter aqua = aquarium CT = ceiling tile MT = missing ceiling tile UV = univent
ND = non-detect AT = ajar tile DEM = dry erase materials PC = photocopier WD = water-damaged
AC = air-conditioner CD = chalk dust DO = door open
Comfort GuidelinesCarbon Dioxide: < 600 ppm = preferred Temperature: 70 - 78 °F
600 - 800 ppm = acceptable Relative Humidity: 40 - 60%> 800 ppm = indicative of ventilation problems
62
Location: Essex Agricultural and Technical School Indoor Air Results
Address: 562 Maple St, Hathorne, MA Table 1 (continued) Date: May 22, 2013
Location
CarbonDioxide(ppm)
Carbon Monoxide
(ppm)Temp(°F)
RelativeHumidity
(%)PM2.5(µg/m3)
Hg(µg/m3)
TVOCs(ppm)
Occupantsin Room
WindowsOpenable
Ventilation
RemarksIntake ExhaustSH 113 (S.Mcwillerson) 715 ND 73 53 0.018 ND 1 Y N N Plants, AP, portable AC
SH 113 Main Room 539 ND 72 53 0 Y Y Y Fridge, shredder, microwave, water dispenser on carpet
SH 201 1645 ND 74 52 18 0.021 ND 7 Y Y Window AC (off) carpet, DEM
SH 202 1327 ND 74 45 15 0.043 ND 1 Y N N Window AC on, PF, DEM
SH 204 1404 ND 75 55 16 0.022 ND 24 Y Y Window AC (off), DEM, carpet
SH 207 1326 ND 75 50 10 0.032 ND 1 Y N N Window AC off
SH 208 669 ND 73 40 11 0.024 ND 2 Y N DEM, window AC on, computers,
SH 209 1541 ND 74 51 20 0.034 ND 4 Y N N DEM, window AC on
SH 210 2013 ND 75 55 16 0.013 1.3 9 Y Y blocked Y blocked Window AC off, DEM
SH 211 1334 ND 75 50 14 0.031 ND 3 Y N N Window AC off
ppm = parts per million AP = air purifier CPs = cleaning products FCU = fan coil unit PF = personal fan
µg/m3 = micrograms per cubic meter aqua = aquarium CT = ceiling tile MT = missing ceiling tile UV = univent
ND = non-detect AT = ajar tile DEM = dry erase materials PC = photocopier WD = water-damaged
AC = air-conditioner CD = chalk dust DO = door open
Comfort GuidelinesCarbon Dioxide: < 600 ppm = preferred Temperature: 70 - 78 °F
600 - 800 ppm = acceptable Relative Humidity: 40 - 60%> 800 ppm = indicative of ventilation problems
63
Location: Essex Agricultural and Technical School Indoor Air Results
Address: 562 Maple St, Hathorne, MA Table 1 (continued) Date: May 22, 2013
Location
CarbonDioxide(ppm)
Carbon Monoxide
(ppm)Temp(°F)
RelativeHumidity
(%)PM2.5(µg/m3)
Hg(µg/m3)
TVOCs(ppm)
Occupantsin Room
WindowsOpenable
Ventilation
RemarksIntake Exhaust
SH 213 1271 ND 73 53 17 0.031 ND 6 Y N N Window AC on
SH 219 907 ND 73 49 16 0.019 ND 3 Y Y Window AC, fridge, microwave, WD-CT,
SH facility manager’s office 733 ND 75 48 10 0.019 ND 0 N Y Y Fridge, aqua, DO
SH hallway first floor 627 ND 71 54 13 0.013 ND 0 N N N
SH IT director’s office 782 ND 75 42 7 0.002 ND 0 Y N N DO
SH Norkiewicz office 647 ND 75 48 11 0.019 ND 1 Y N Y Window AC, DO
SH SB01 1338 ND 72 60 15 0.007 ND-0.6 9 Y Y Y DEM
SH SB02 guidance 998 ND 71 57 14 0.009 ND 3 Y Y Y Water cooler on carpet
SH SB03 1164 ND 73 55 17 0.007 ND 2 N Y Y
SH SB04 799 ND 70 54 12 0.010 ND 2 Y Y Y Odor, DEM
ppm = parts per million AP = air purifier CPs = cleaning products FCU = fan coil unit PF = personal fan
µg/m3 = micrograms per cubic meter aqua = aquarium CT = ceiling tile MT = missing ceiling tile UV = univent
ND = non-detect AT = ajar tile DEM = dry erase materials PC = photocopier WD = water-damaged
AC = air-conditioner CD = chalk dust DO = door open
Comfort GuidelinesCarbon Dioxide: < 600 ppm = preferred Temperature: 70 - 78 °F
600 - 800 ppm = acceptable Relative Humidity: 40 - 60%> 800 ppm = indicative of ventilation problems
64
Location: Essex Agricultural and Technical School Indoor Air Results
Address: 562 Maple St, Hathorne, MA Table 1 (continued) Date: May 22, 2013
Location
CarbonDioxide(ppm)
Carbon Monoxide
(ppm)Temp(°F)
RelativeHumidity
(%)PM2.5(µg/m3)
Hg(µg/m3)
TVOCs(ppm)
Occupantsin Room
WindowsOpenable
Ventilation
RemarksIntake Exhaust
SH SB05 1000 ND 71 56 15 0.004 ND 0 N Y Y DO
SH SB06 1095 ND 73 53 17 0.011 ND 2 Y Y Y Fridge, microwave
SH SB08 644 ND 72 53 13 0.011 ND 1 Y N N DEM, DO
SH SB13 585 ND 72 52 16 0.012 ND 0 Y N N PF, microwave, fridge
Outbuildings and Barns
Greenhouse 33 400 ND 62 75 23 0.023 ND 0 Y N N Walls have openings to outside, plants and potting materials
Greenhouse 34 391 ND 63 76 27 0.025 ND 0 Y N N Walls have openings to outside, plants and potting materials
Red Barn 461 ND 69 63 25 0.022 1.8 0 N N N Equipment
Sheep Barn 403 ND 69 63 25 0.021 ND 0 Y N N DO
ppm = parts per million AP = air purifier CPs = cleaning products FCU = fan coil unit PF = personal fan
µg/m3 = micrograms per cubic meter aqua = aquarium CT = ceiling tile MT = missing ceiling tile UV = univent
ND = non-detect AT = ajar tile DEM = dry erase materials PC = photocopier WD = water-damaged
AC = air-conditioner CD = chalk dust DO = door open
Comfort GuidelinesCarbon Dioxide: < 600 ppm = preferred Temperature: 70 - 78 °F
600 - 800 ppm = acceptable Relative Humidity: 40 - 60%> 800 ppm = indicative of ventilation problems
65
APPENDICES
66
Appendix A: Carbon Dioxide and its Use in Evaluating Adequacy of
Ventilation in Buildings
67
Carbon Dioxide and its Use in Evaluating Adequacy of Ventilation in Buildings
The Bureau of Environmental Health’s (BEH) Indoor Air Quality (IAQ) Program
examines indoor air quality conditions that may have an effect on building occupants. The status
of the ventilation system, potential moisture problems/microbial growth and identification of
respiratory irritants are examined in detail, which are described in the attached report. In order to
examine the function of the ventilation system, measurements for carbon dioxide, temperature
and relative humidity are taken. Carbon dioxide measurements are commonly used to assess the
adequacy of ventilation within an indoor environment.
Carbon dioxide is an odorless, colorless gas. It is found naturally in the environment and
is produced in the respiration process of living beings. Another source of carbon dioxide is the
burning of fossil fuels. Carbon dioxide concentration in the atmosphere is approximately 250-
600 ppm (Beard, 1982; NIOSH, 1987).
Carbon dioxide measurements within an occupied building are a standard method used to
gauge the adequacy of ventilation systems. Carbon dioxide is used in this process for a number
of reasons. Any occupied building will have normally occurring environmental pollutants in its
interior. Human beings produce waste heat, moisture and carbon dioxide as by-products of the
respiration process. Equipment, plants, cleaning products or supplies normally found in any
building can produce gases, vapors, fumes or dusts when in use. If a building has an adequately
operating mechanical ventilation system, these normally occurring environmental pollutants will
be diluted and removed from the interior of the building. The introduction of fresh air both
increases the comfort of the occupants and serves to dilute normally occurring environmental
pollutants.
68
An operating exhaust ventilation system physically removes air from a room and thereby
removes environmental pollutants. The operation of supply in conjunction with the exhaust
ventilation system creates airflow through a room, which increases the comfort of the occupants.
If all or part of the ventilation system becomes non-functional, a build up of normally occurring
environmental pollutants may occur, resulting in an increase in the discomfort of occupants.
The MDPH approach to resolving indoor air quality problems in schools and public
buildings is generally two-fold: 1) improving ventilation to dilute and remove environmental
pollutants and 2) reducing or eliminating exposure opportunities from materials that may be
adversely affecting indoor air quality. In the case of an odor complaint of unknown origin, it is
common for BEH staff to receive several descriptions from building occupants. A description of
odor is subjective, based on the individual’s life experiences and perception. Rather than test for
a potential series of thousands of chemicals to identify the unknown material, carbon dioxide is
used to judge the adequacy of airflow as it both dilutes and removes indoor air environmental
pollutants.
As previously mentioned, carbon dioxide is used as a diagnostic tool to evaluate air
exchange by building ventilation systems. The presence of increased levels of carbon dioxide in
indoor air of buildings is attributed to occupancy. As individuals breathe, carbon dioxide is
exhaled. The greater the number of occupants, the greater the amount of carbon dioxide
produced. Carbon dioxide concentration build up in indoor environments is attributed to
inefficient or non-functioning ventilation systems. The Occupational Safety and Health
Administration (OSHA) standard for carbon dioxide is 5,000 parts per million parts of air (ppm).
Workers may be exposed to this level for 40 hours/week, based on a time-weighted average
(OSHA, 1997).
69
Carbon dioxide can be a hazard within enclosed areas with no air supply. These types of
enclosed areas are known as confined spaces. Manholes, mines and sewer systems are examples
of confined spaces. An ordinary building is not considered a confined space. Carbon dioxide air
exposure limits for employees and the general public have been established by a number of
governmental health and industrial safety groups. Each of these standards of air concentrations
is expressed in parts per million (ppm). Table 1 is a listing of carbon dioxide air concentrations
and related health effects and standards.
The MDPH uses a guideline of 800 ppm for publicly occupied buildings (Burge et al.,
1990; Gold, 1992; Norback, 1990; OSHA, 1994; Redlich, 1997; Rosenstock, 1996; SMACNA,
1998). A guideline of 600 ppm or less is preferred in schools due to the fact that the majority of
occupants are young and considered to be a more sensitive population in the evaluation of
environmental health status. Several sources indicate that indoor air problems are significantly
reduced at 600 ppm or less of carbon dioxide (ACGIH, 1998; Bright et al., 1992; Hill, 1992;
NIOSH, 1987). Inadequate ventilation and/or elevated temperatures are major causes of
complaints such as respiratory, eye, nose and throat irritation, lethargy and headaches.
Air levels for carbon dioxide that indicate that indoor air quality may be a problem have
been established by the American Society of Heating, Refrigerating and Air-conditioning
Engineers (ASHRAE). Above 1,000 ppm of carbon dioxide, ASHRAE recommends adjustment
of the building’s ventilation system (ASHRAE, 1989). In 2001, ASHRAE modified their
standard to indicate that no more than 700 ppm above the outdoor air concentration; however
800 ppm is the level where further investigation will occur.
Carbon dioxide itself has no acute (short-term) health effects associated with low level
exposure (below 5,000 ppm). The main effect of carbon dioxide involves its ability to displace
70

oxygen for the air in a confined space. As oxygen is inhaled, carbon dioxide levels build up in
the confined space, with a decrease in oxygen content in the available air. This displacement of
oxygen makes carbon dioxide a simple asphyxiant. At carbon dioxide levels of 30,000 ppm,
severe headaches, diffuse sweating, and labored breathing have been reported. No chronic
health effects are reported at air levels below 5,000 ppm.
Air testing is one method used to determine whether carbon dioxide levels exceed the
comfort levels recommended. If carbon dioxide levels are over 800-1,000 ppm, the MDPH
recommends adjustment of the building's ventilation system. The MDPH recommends that
corrective measures be taken at levels above 800 ppm of carbon dioxide in office buildings or
schools. (Please note that carbon dioxide levels measured below 800 ppm may not decrease
indoor air quality complaints). Sources of environmental pollutants indoors can often induce
symptoms in exposed individuals regardless of the adequacy of the ventilation system. As an
example, an idling bus outside a building may have minimal effect on carbon dioxide levels, but
can be a source of carbon monoxide, particulates and odors via the ventilation system.
Therefore, the MDPH strategy of adequate ventilation coupled with pollutant source
reduction/removal serves to improve indoor air quality in a building. Please note that each table
included in the IAQ assessment lists BEH comfort levels for carbon dioxide levels at the bottom
(i.e. carbon dioxide levels between 600 ppm to 800 ppm are acceptable and <600 ppm is
preferable). While carbon dioxide levels are important, focusing on these air measurements in
isolation to all other recommendations is a misinterpretation of the recommendations made in
these assessments.
71
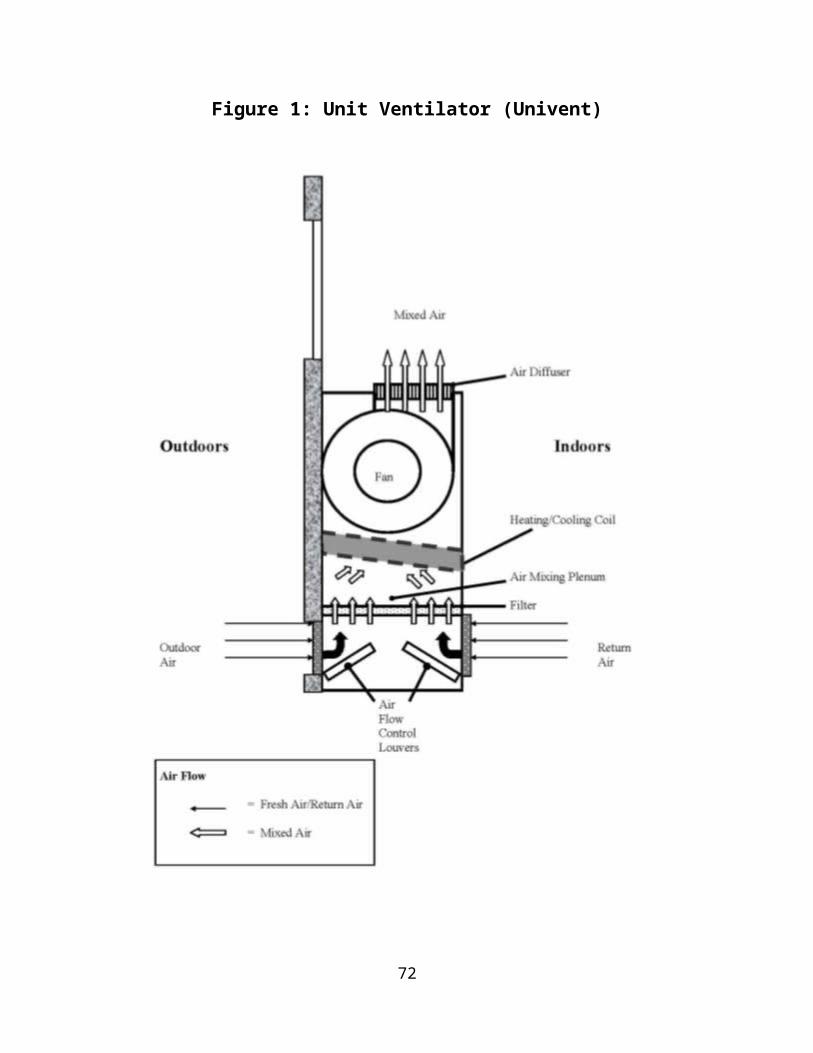
Table 1: Carbon Dioxide Air Level Standards
Carbon DioxideLevel
Health Effects Standards or Use of Concentration Reference
250-600 ppm None Concentrations in ambient air Beard, R.R., 1982NIOSH, 1987
600 ppm None Few indoor air complaints, used as reference for air exchange for protection of children
ACGIH, 1998; Bright et al., 1992; Hill, 1992; NIOSH 1987
800 ppm None Used as an indicator of ventilation adequacy in schools and public buildings, used as reference for air exchange for protection of children
Mendler, 2003Bell, A. A., 2000; NCOSP, 1998;SMACNA, 1998; EA, 1997;Redlich, 1997; Rosenstock, 1996; OSHA, 1994; Gold, 1992;Burge et al., 1990; Norback, 1990 ;IDPH, Unknown
1000 ppm None Used as an indicator of ventilation inadequacy concerning removal of odors from the interior of building.
ASHRAE, 1989
950-1300 ppm* None Used as an indicator of ventilation inadequacy concerning removal of odors from the interior of building.
ASHRAE, 1999
700 ppm (over background)
None Used as an indicator of ventilation inadequacy concerning removal of odors from the interior of building.
ASHRAE, 2001
5000 ppm No acute (short term) or chronic (long-term) health effects
Permissible Exposure Limit/Threshold Limit Value
ACGIH, 1999OSHA, 1997
30,000 ppm Severe headaches, diffuse sweating, and labored breathing
Short-term Exposure Limit ACGIH, 1999ACGIH. 1986
* outdoor carbon dioxide measurement +700 ppm
72
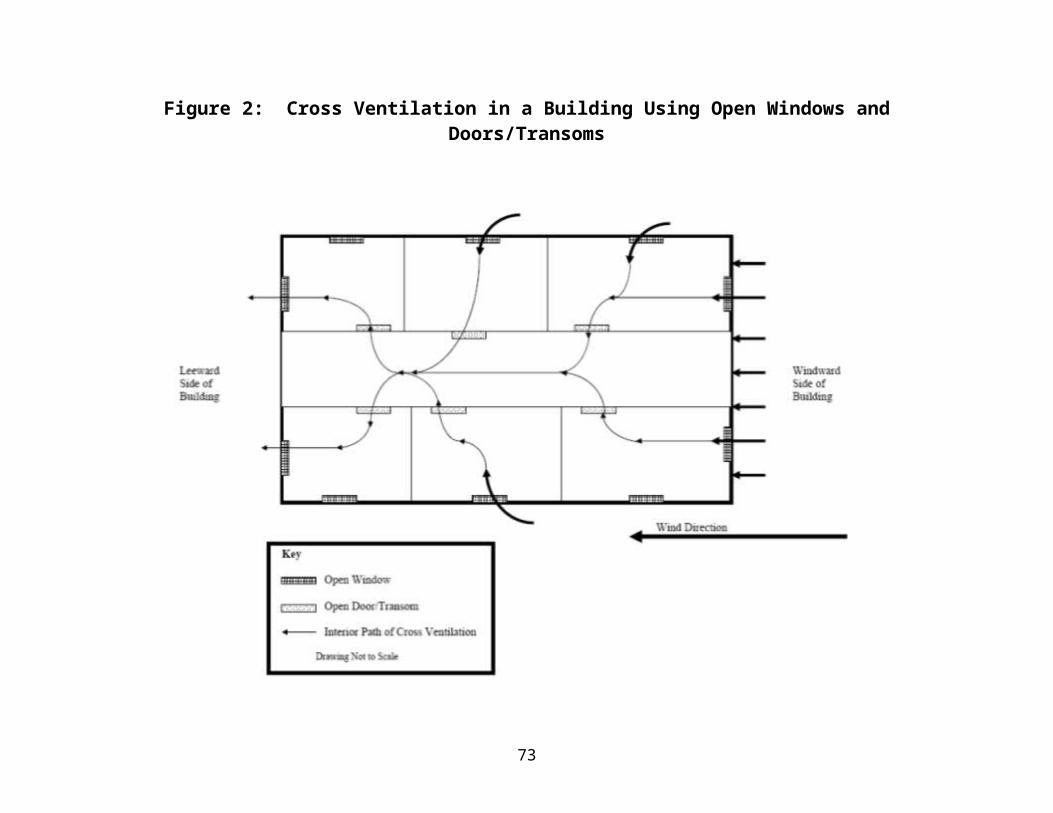
References
ACGIH. 1986. Documentation of the Threshold Limit Values. American Conference of Governmental Industrial Hygienists. Cincinnati, OH.
ACGIH. 1998. Industrial Ventilation A Manual of Recommended Practice. 23rd Edition. American Conference of Governmental Industrial Hygienists. Cincinnati, OH.
ACGIH. 1999. Guide to Occupational Exposures-1999. American Conference of Governmental Industrial Hygienists, Cincinnati, OH.
ASHRAE. 1989. Ventilation for Acceptable Indoor Air Quality. American Society of Heating, Refrigeration and Air Conditioning Engineers. ANSI/ASHRAE 62-1989.
ASHRAE. 1999. Ventilation for Acceptable Indoor Air Quality. American Society of Heating, Refrigeration and Air Conditioning Engineers. ANSI/ASHRAE 62-1999.
ASHRAE. 2001. Ventilation for Acceptable Indoor Air Quality. American Society of Heating, Refrigeration and Air Conditioning Engineers. ANSI/ASHRAE 62-2001.
Beard, R.R. 1982. Chapter Fifty-two, Inorganic Compounds of Oxygen, Nitrogen, and Carbon. Patty’s Industrial Hygiene and Toxicology, Vol. IIc. 3rd ed. Clayton, G. D. & Clayton, F. E., eds. John Wiley & Sons, New York, NY.
Bright, P.; Mader, M.; Carpenter, D.; and Hermon-Cruz, I.Z. 1992. Guideline for Indoor Air Surveys. Brooks Air Force Base, TX. Armstrong Laboratory, Occupational and Environmental Health Directorate. NTIS AL-TR-1992-0016.
Burge, H. and Hoyer, M. 1990. Focus On … Indoor Air Quality. Appl. Occup. Environ. Hyg. 5(2):88.
EA. 1997. Indoor Air Quality. Environment Australia, Department of the Environment, Sport and Territories, Canberra, Australia. www.environment.gov.au/soe/1996/publications/technical/pubs/12indora.pdf
Gold, D. 1992. Indoor Air Pollution. Clinics in Chest Medicine. 13(2):224-225.
Hill, B.; Craft, B.; and Burkart, J. 1992. Carbon Dioxide, Particulates and Subjective Human Responses in Office Buildings without Histories of Indoor Air Quality Problems. Appl. Occup. Environ. Hyg. 7(2): 101-111.
IDPH. Unknown. Illinois Department of Public Health Guidelines for Indoor Air Quality. Illinois Department of Public Health, Springfield, Il. http://www.idph.state.il.us/envhealth/factsheets/indoorairqualityguide_fs.htm
Mendler, S. and Odell, W. 2003. Indoor Air Quality for the EPA. ArchitectureWeek. April 16, 2003. http://www.architectureweek.com/2003/0416/environment_1-2.html
NCOSP. 1998. Workplace Requirements for Safety & Health, Indoor Air Quality 3.3.3. NC Office of State Personnel, Raleigh, NC. www.osp. state .nc.us/emprsk/safety/handbook/5-9.pdf
73

NIOSH. 1987. Guidance for Indoor Air Quality Investigations. Cincinnati, OH. National Institute for Occupational Safety and Health, Hazards Evaluations and Technical Assistance Branch, Division of Surveillance, Hazard Evaluation and Field Studies.
Norback, D.; Torgen, M.; and Edling, C. 1990. Volatile Organic Compounds, Respirable Dust, and Personal Factors Related to Prevalence and Incidence of Sick Building Syndrome in Primary Schools. British Journal of Industrial Medicine. 47:740.
OSHA. 1994. Occupational Safety and Health Administration. Indoor Air Quality (Proposed Regulation), Federal Register 59:15968-16039, (1994) Appendix A.
OSHA. 1997. Limits for Air Contaminants. Occupational Safety and Health Administration. Code of Federal Regulations. 29 C.F.R 1910.1000 Table Z-1-A.
Redlich, C.; Sparer, J.; and Cullen, M. 1997. Sick-building Syndrome. Lancet. 349:1016.
Rosenstock, L. 1996. NIOSH Testimony to the U.S. Department of Labor on Air Quality, Appl. Occup. Environ. Hyg. 11(12):1368.
SMACNA. 1998. Indoor Air Quality: A Systems Approach. 3rd ed. Sheet Metal and Air Conditioning Contractors’ National Association, Inc, Chantilly, VA. National Association, Inc.
74

Appendix B: Mercury Action Levels
75
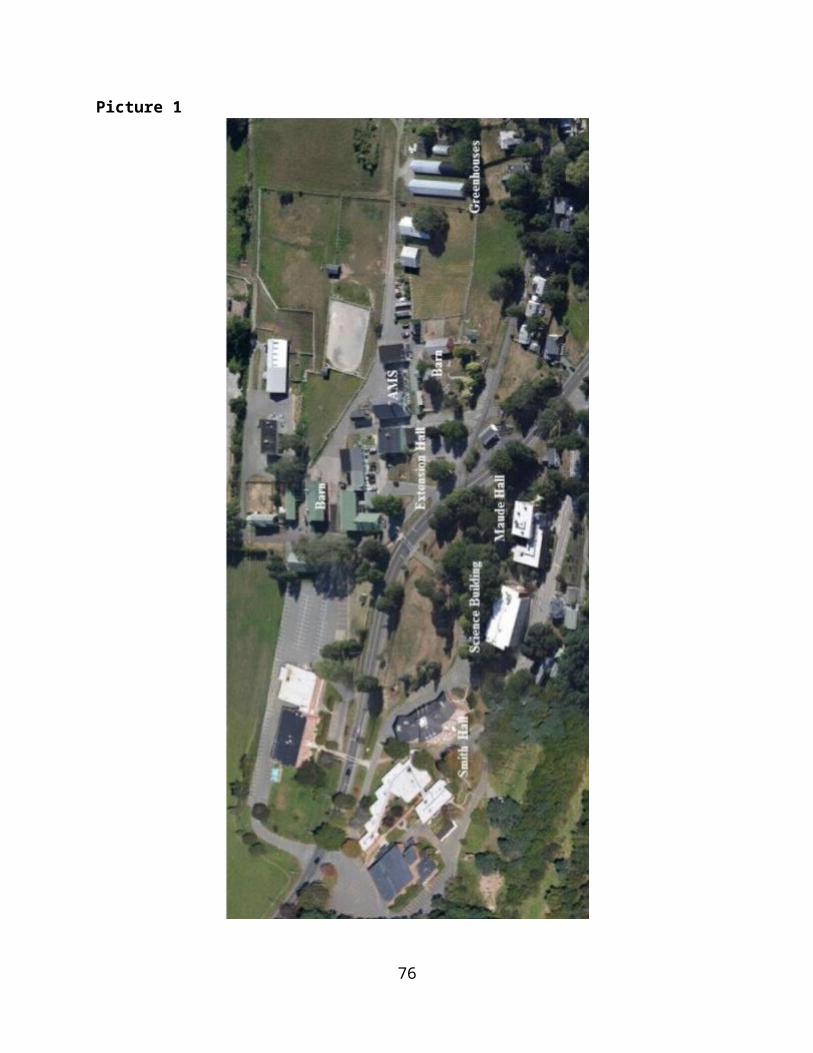
Source: http://www.atsdr.cdc.gov/emergency_response/Action_Levels_for_Elemental_Mercury_Spills_2012.pdf
76
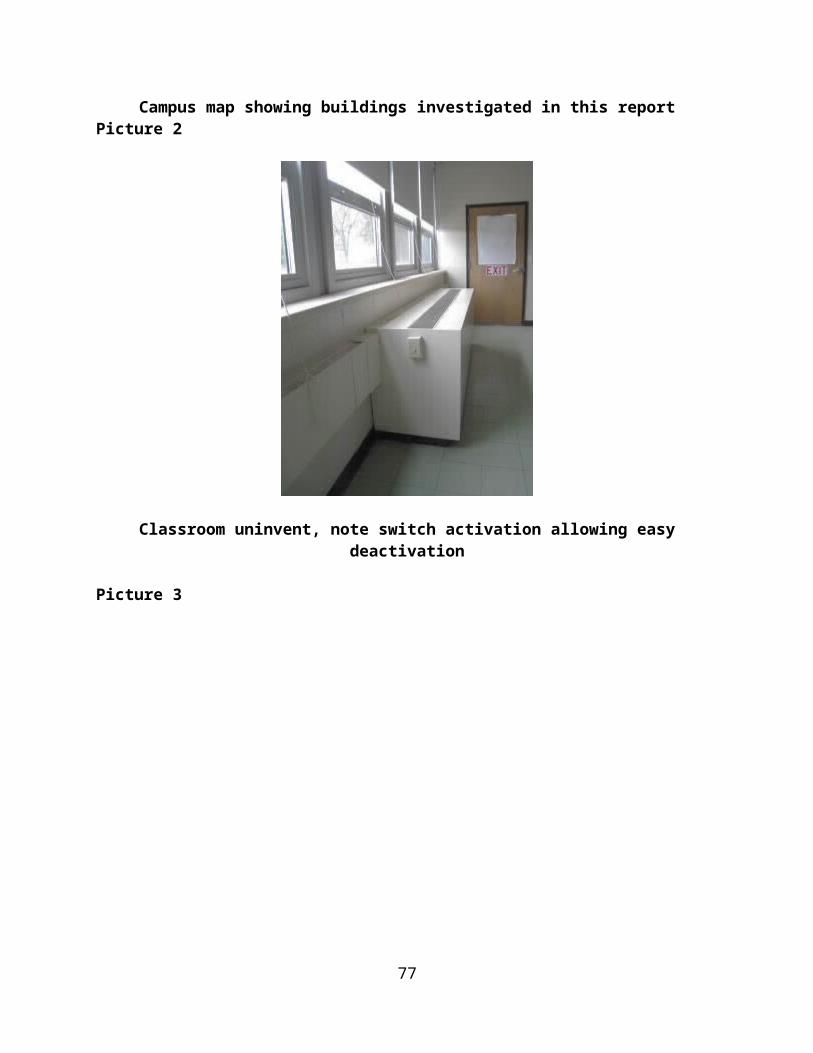
Source: http://www.atsdr.cdc.gov/emergency_response/Action_Levels_for_Elemental_Mercury_Spills_2012.pdf
77
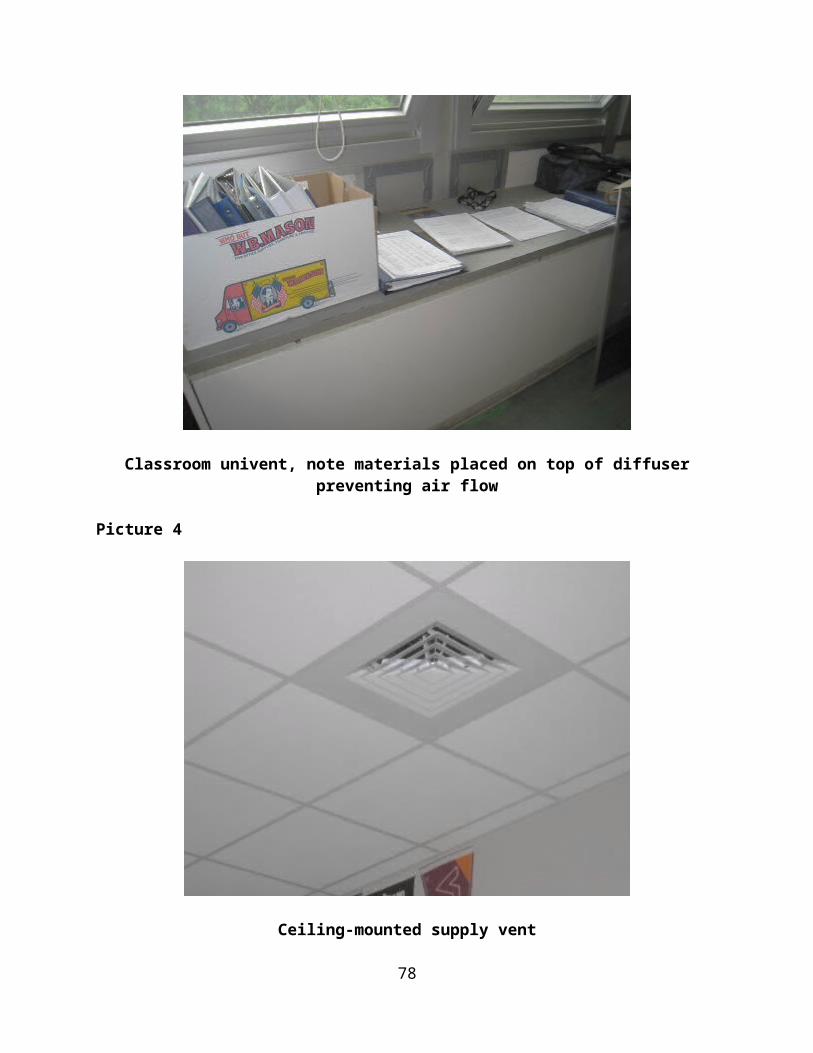
Appendix C: East Street Field Health Consultation Report
78
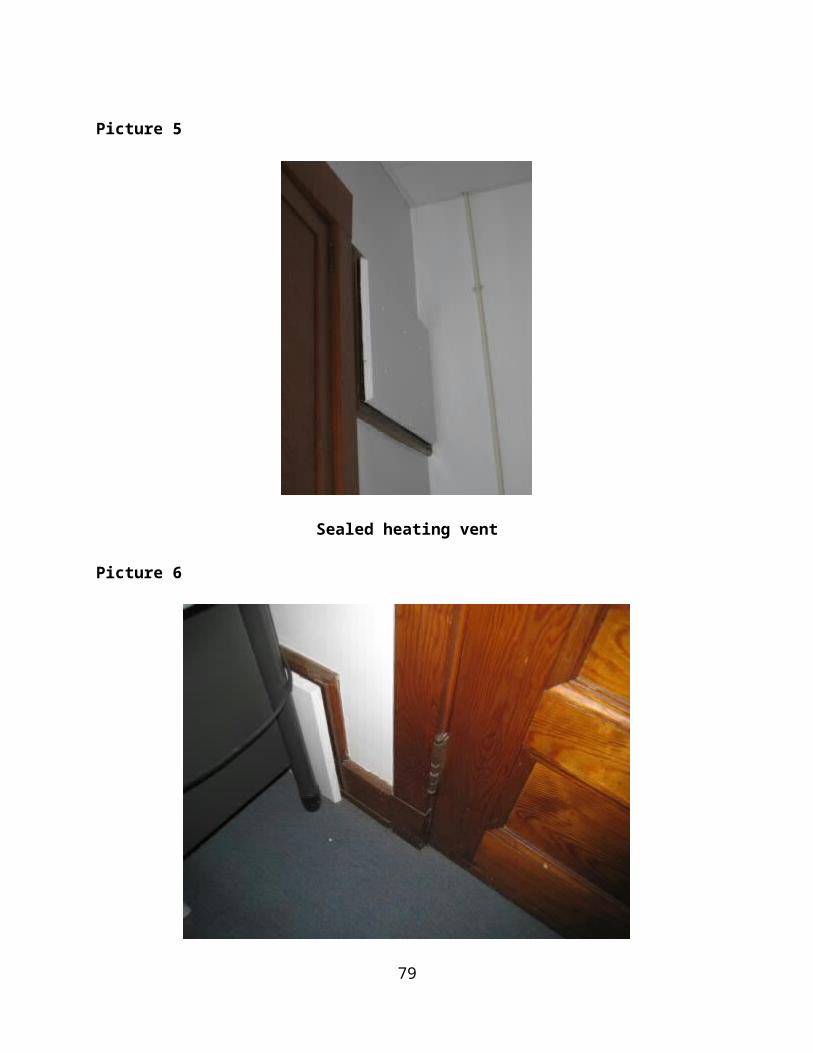
HEALTH CONSULTATION:Evaluation of Monitoring Data for
East Street Landfill,Middleton, Essex County, Massachusetts
November 2014
79
MassachusettsDepartment OfPublic Health
Bureau ofEnvironmental
Health,Community Assessment
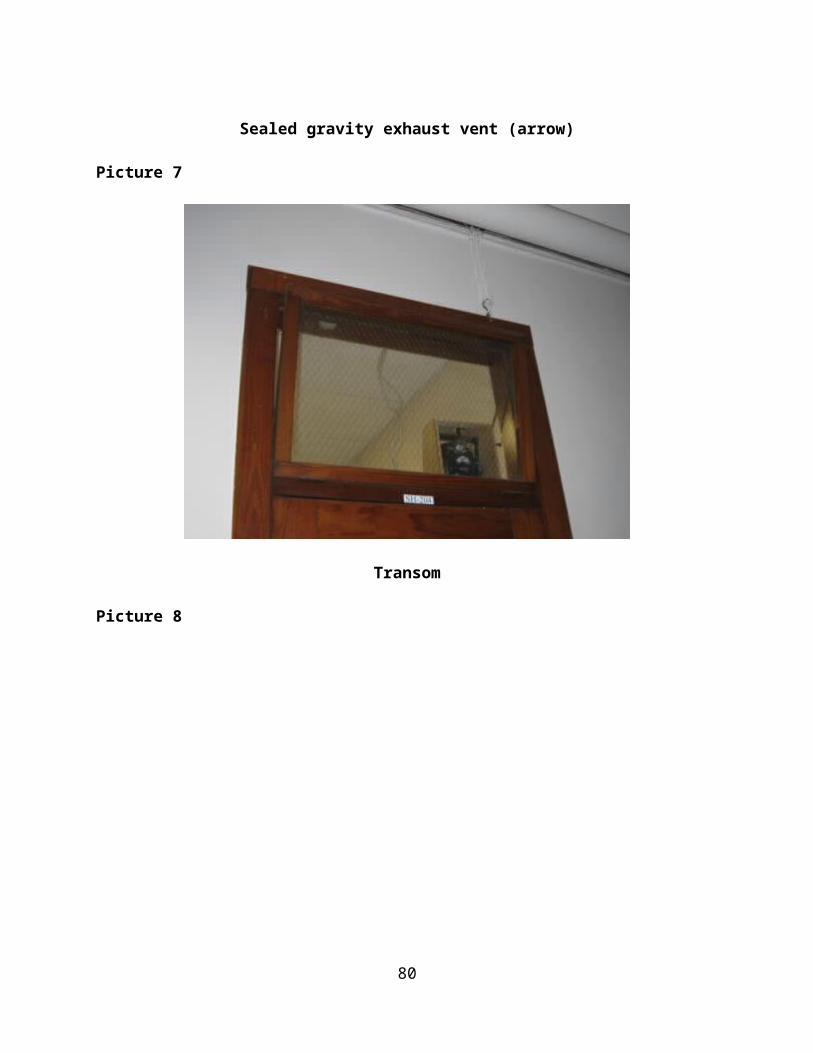
I. BACKGROUND AND STATEMENT OF ISSUES
In response to a request by several concerned parents, the Massachusetts Department of
Public Health (MDPH), Bureau of Environmental Health (BEH), evaluated the potential
for health impacts associated with the use of the East Street recreational fields (ESF),
located adjacent to the closed East Street landfill in Middleton. Community concerns
about the occurrence of vocal tics and chronic hiccups among local high school students
using the recreation fields prompted this request.
In response, MDPH/ BEH2 reviewed available environmental data for East Street Field.
MDPH/BEH also conducted a site visit at the field with the director of the local Health
Department and the director of the Department of Public Works for the town of
Middleton, MA.
The Town of Middleton owns and operates the 131 East Street property, which includes
the closed landfill and a multi-use recreational field. The capped landfill, 17 acres in size,
reaches an elevation of 97 feet at its highest point. Along its western side, the landfill is
bordered by a multi-use recreational field (which reportedly had been historically used
for farming and has no history of waste disposal), a parking lot, and residential
properties. A storm water retention pond and a fire pond abut the landfill’s northern side
while wooded wetlands and grassland surround its southern and eastern sides (Figure 1).
The closed landfill is maintained and accessible, with a gravel road leading to the top and
a maintenance road encircling the landfill perimeter.
In 2001, the Massachusetts Department of Environmental Protection (MassDEP) issued a
closure certification for the landfill site which indicated the site was “closed”, meaning
that the facility was deactivated in compliance with the approved facility final closure
plan and applicable closure requirements. In 2008, to prepare for a reconstruction of
ESF, a new detention pond to capture precipitation and runoff was constructed on the
southwestern corner of the site. A circuit of swales directs surface water on the landfill’s
surface to drainage pipes. Surface water flows from drainage pipes into the retention and
2 This work was supported in part by funds from a cooperative agreement with the Agency for Toxic Substances and Disease Registry (ATSDR), U.S. Department of Health and Human Services. This document has not been reviewed and cleared by ATSDR.
80
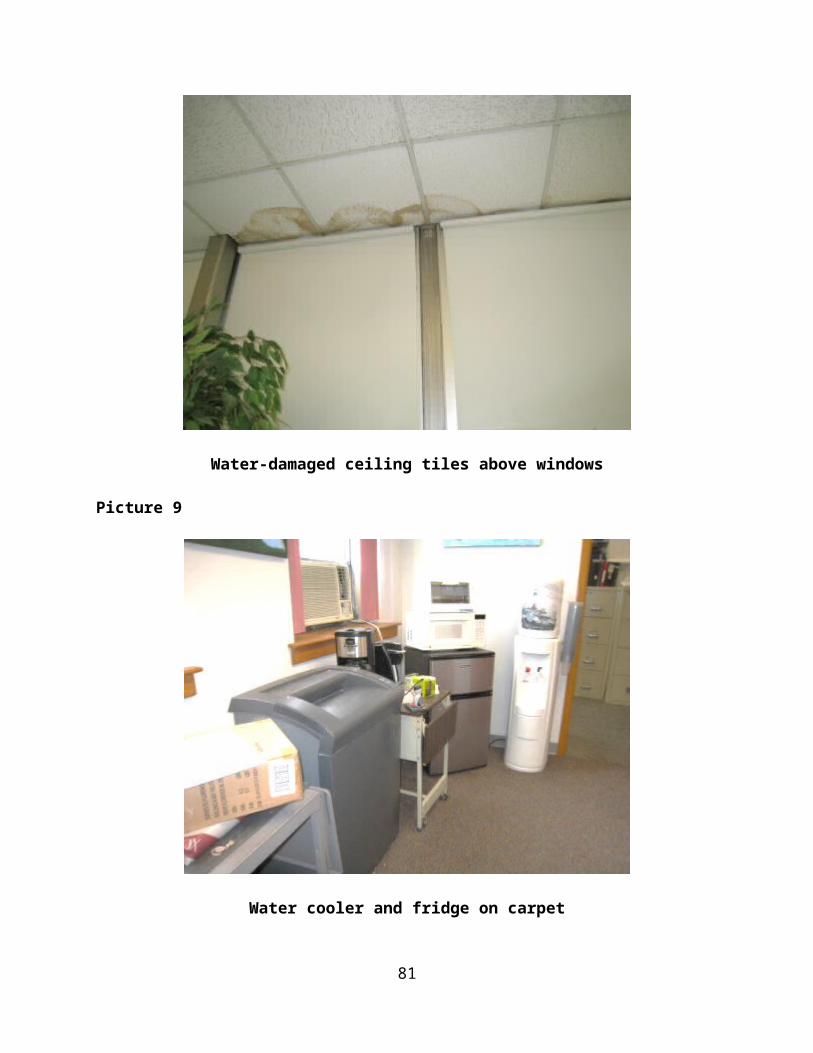
detention ponds on the northwestern and southwestern corners of the landfill respectively.
The surface water collection system is reportedly effective in preventing runoff from
reaching the recreational fields and adjacent properties (personal communication with
Bob Labossiere; Director, Middleton Department of Public Works; May 6, 2013). To
construct the recreational fields, off-site soil was brought in.
In addition to the thick vegetation, the forested wetlands that border these surface water
bodies minimize opportunities for visitors to access them.
The landfill’s impermeable cap prevents water from entering the area containing waste.
Maintaining low moisture content within the landfill diminishes microorganisms’
capability to produce large volumes of subsurface gas. However, the impermeable cap
may create an opportunity for horizontal migration of subsurface gases to surrounding
areas. Three landfill gas monitoring probes lie along the eastern side of the soccer field
within the recreational field. CDM, an environmental consulting company, collects
subsurface soil gas samples semi-annually from the three landfill gas probes lining the
soccer field. These samples allow CDM to determine if landfill gas is migrating laterally
and to prevent any explosive hazards related to methane production.
Two baseball diamonds and a soccer field located on a 4.5-acre parcel of land west of the
landfill comprise the multi-use recreational field referred to as East Street Field.
Approximately 250 feet from the base of the landfill, a steep upward slope along the
eastern side of the soccer field separates this field from the maintenance road encircling
the landfill’s base.
The town of Middleton’s Department of Public Works maintains the field, irrigating it
with town water dispensed from a fire truck, as there are no facilities or water sources
located at the field (personal communication with Bob Labossiere; Director, Middleton
Department of Public Works; May 6th, 2013). Local youth and adult sports leagues,
along with high school sports teams, began using the fields in 2005 (personal
communication with Derek Fullerton; Middleton Health Director; April 9, 2013). Local
women’s high school soccer teams from North Shore Technical School and Essex
Agricultural School started using the fields for practice in 2010 and 2012, respectively.
81
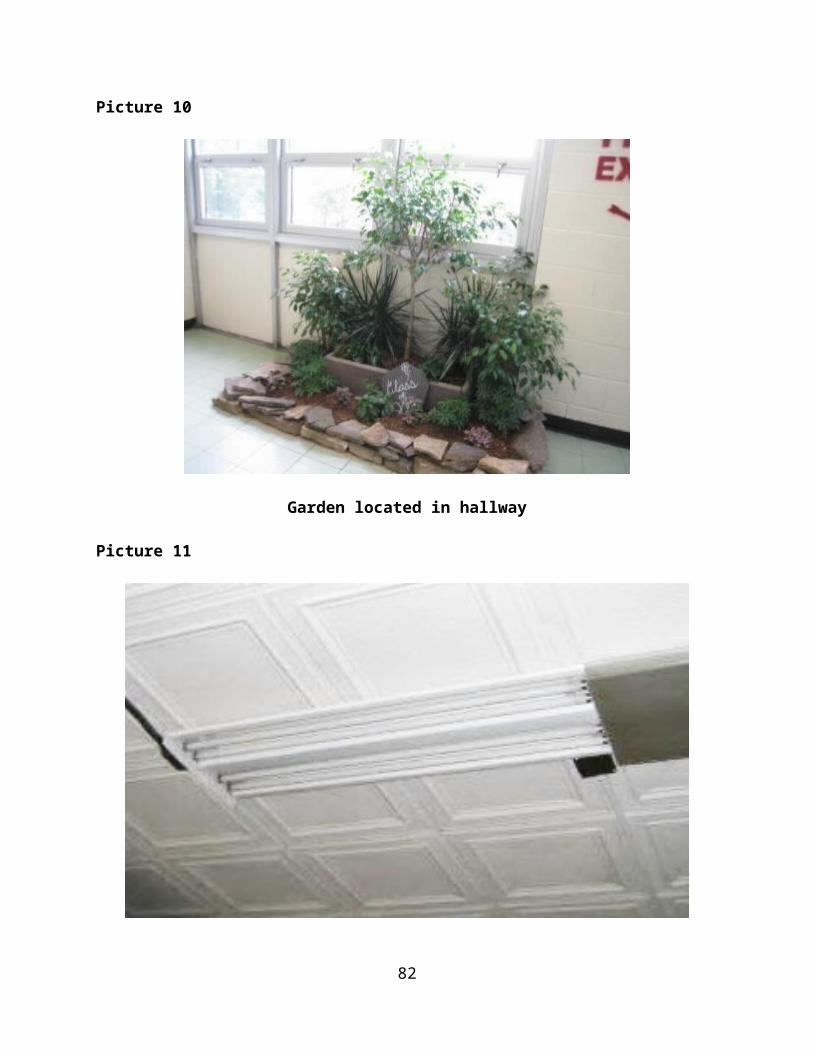
II. ENVIRONMENTAL SAMPLING DATA
MDPH evaluated available environmental sampling data for surface water and soil gas.
Surface water samples were collected from the following locations (see Figure 1): the
retention pond along the northern border of the landfill (SW-1), Nichol’s Brook (SW-2)
south of the landfill, and a portion of wetland referred to as Wolcott’s Island (SW-3).
Samples were analyzed for dissolved metals, volatile organic compounds (VOCs), semi-
volatile organic compounds, and other field parameters. Soil gas probes are also located
along the side of the soccer field and are monitored for potential offsite migration of
landfill soil gas. These data were also reviewed.
Although groundwater data for the area were available, there is no exposure opportunity
to groundwater from use of the ESF, and hence, these data were not evaluated.
MDPH also evaluated information about pesticide applications conducted at the fields to
address specific concerns about possible exposure to pesticides.
III. METHODS OF EVALUATING MONITORING DATA
MDPH performed a screening evaluation of available data from May 2010 through
November 2012, a period of 2.5 years. The screening process allows the health assessor
to identify substances requiring further evaluation to determine if they pose a threat to
human health. MDPH compares measured concentrations of substances detected in
environmental media to established screening or comparison values published by the U.S.
Agency for Toxic Substances and Disease Registry (ATSDR).
The ATSDR comparison values (CVs) are specific concentrations of chemicals in
environmental media (i.e., air, soil, or water) that are used by health assessors to identify
environmental contaminants that require further evaluation. Comparison values are
developed based on health guidelines and assumed exposure situations that represent
conservative estimates of human exposure. Comparison values are set well below levels
that are known or anticipated to result in adverse health effects. Contamination levels
detected in environmental media that are less than a comparison value are not likely to
pose a health concern. Concentrations detected in environmental media above a
82
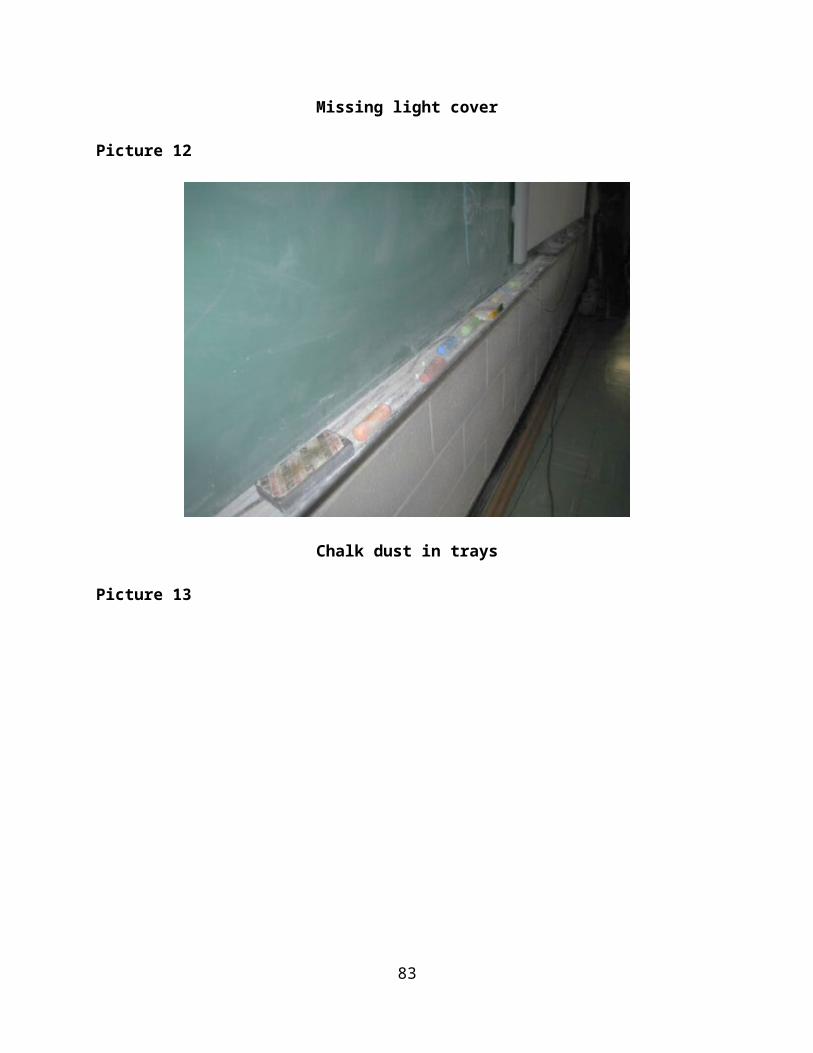
comparison value do not necessarily indicate that a health threat is present, but rather
indicate the need for further evaluation by assessing opportunities for exposures or
possible health effects.
Because no CVs exist for surface water, CVs for drinking water were used as an initial
screen in this health consultation. If an ATSDR comparison value was not available for
a specific contaminant, surface water results were compared to Regional Screening
Levels developed by the United States Environmental Protection Agency (EPA) Region 3
(USEPA 2013a; ATSDR 2013) or to USEPA Health Advisories for constituents in
drinking water.
Use of drinking water guidelines is a conservative approach because exposure
opportunities to constituents in drinking water would be expected to be much higher than
to constituents in surface water at this site.
In addition, surface water results were compared to Massachusetts Maximum
Contaminant Levels (MCLs) for municipal drinking water supplies. The Massachusetts
MCLs are standards to regulate contaminants in public drinking water supplies. MCLs
apply to drinking water provided by public water systems, and hence are a conservative
(protective) standard to use for comparison with surface water sampling results. Several
constituents are not regulated by an MCL as they do not pose health concerns in general;
for these, MDPH compared constituent concentrations to a Massachusetts Secondary
Contaminant Level (MSCL) or a MassDEP Office of Research and Standards Guideline
(ORSG) for drinking water. SMCLs are derived to address aesthetic properties of
drinking water quality, such as taste, odor, or color.
For subsurface soil gas, MDPH compared the concentrations to the Lower Explosive
Limit (LEL) and concentrations listed in ATSDR’s landfill gas primer for soil gas
monitoring (ATSDR 2006).
No sampling data were available for pesticides used at the fields. However, MDPH/BEH
contacted local officials to evaluate whether and what pesticides had been used in order
to evaluate potential exposure opportunities to individuals using the ESF.
83
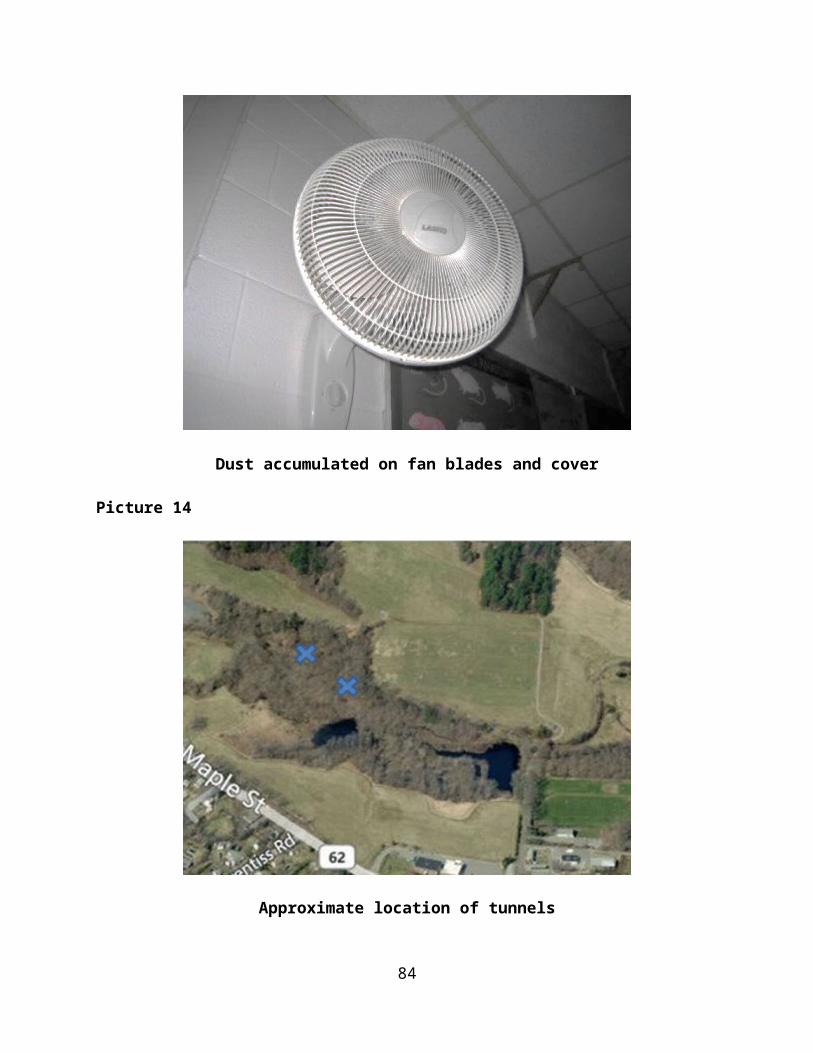
IV. RESULTS
Surface Water
A total of 12 constituents were detected at least once in a surface water sample (Table 1).
Of these, chloride and sulfate concentrations were less than the secondary MCLs that are
based on aesthetic issues, and hence are not considered of health concern. Detections of
six other constituents (acetone, barium, cadmium, copper, iron, and nitrate-nitrogen) were
below any available health-based comparison value for drinking water. Cyanide (0.007
ppm) was slightly above the CV of 0.006 ppm but well below the drinking water standard
for public water supplies of 0.2 ppm. Arsenic was detected at a concentration of 0.006
ppm, less than the drinking water standard for public water supplies of 0.01 ppm but
above ATSDR’s comparison values based on arsenic’s potential to pose a risk of cancer.
Finally, manganese was detected at a concentration of 2.24 ppm, which was above the
EPA health advisory for this metal in drinking water of 0.3 ppm. Although some of these
constituents exceeded health-based comparison values, these screening values were
derived assuming daily exposure through drinking 2 liters of water a day for a lifetime.
All the surface waters sampled are difficult to access (based on our site visit), and it is
highly unlikely that anyone using the ESF would actually have opportunities to be
exposed to constituents in these surface waters. Thus, given the very infrequent
opportunities for direct contact with these surface waters and the low number of
constituents that exceeded a health-based standard for drinking water supplies (i.e., daily
consumption over a lifetime), we would not expect health effects to result based on
evaluating potential exposure opportunities to constituents in surface water at ESF.
Landfill Gas
MDPH reviewed the results of landfill gas monitoring for five sampling events: May and
November 2010, November 2011, and April and November 2012. There were no
detections of VOCs, methane, or hydrogen sulfide, all of which are associated with
landfill gases.
84
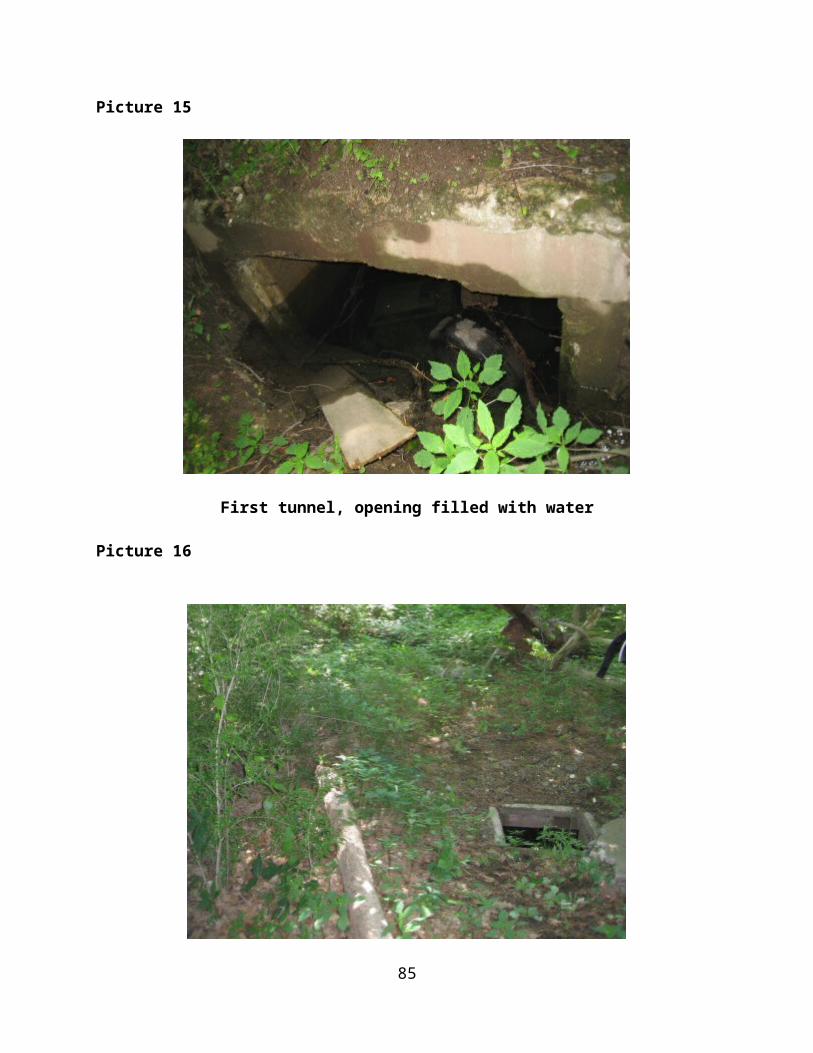
Pesticide Use
MDPH evaluated available information about pesticide applications conducted at the
fields to address specific concerns about this issue. The Northeast Mosquito Control
District, an organization operating under the State Reclamation and Mosquito Control
Board, treated ESF in August and September 2012 and September 2013 in response to
threats related to Eastern Equine Encephalitis (EEE) and West Nile Virus (WNV), two
mosquito-borne viruses that can cause serious illness.
Pesticide applications were made at the ESF on August 22 and September 7, 2012, and
on September 18, 2013. All applications were reportedly made after 8:15 PM or after
activities on the field that day ceased. Applications were conducted using a truck
mounted sprayer using an ultra-low volume method, meaning that the concentration of
the active ingredients was low relative to the large area that the application covered.
DUET and Suspend SC pesticides are targeted to kill adult mosquitoes. Based upon
information reviewed, DUET was applied to the air at ESF in August and September of
2012 and in the parking lot area during the September 2013 application. Suspend SC was
applied to brush and woodland (habitats where mosquitoes may reside) areas lining ESF
and the landfill as a barrier control for mosquitoes in September 2013.
These pesticides have active ingredients (e.g., sumithrin) that belong to a class of
compounds called pyrethroids, synthetic versions of pyrethrins which are produced by the
chrysanthemum flower. These products are commonly used around the U.S. to control
mosquitoes and break down quickly in the environment. Two other active ingredients
(piperonyl butoxide and 1,2-propanediol) are added to the product to increase the ability
of the pyrethroid compounds to kill mosquitoes. Studies to date do not suggest that these
products, as applied, will result in any measureable long-term effects. Given the time of
application (after activities at the field ceased for the day), low concentrations of the
active ingredients applied, and rapid breakdown of the product in the environment, we
would not expect adverse health effects from these applications.
85
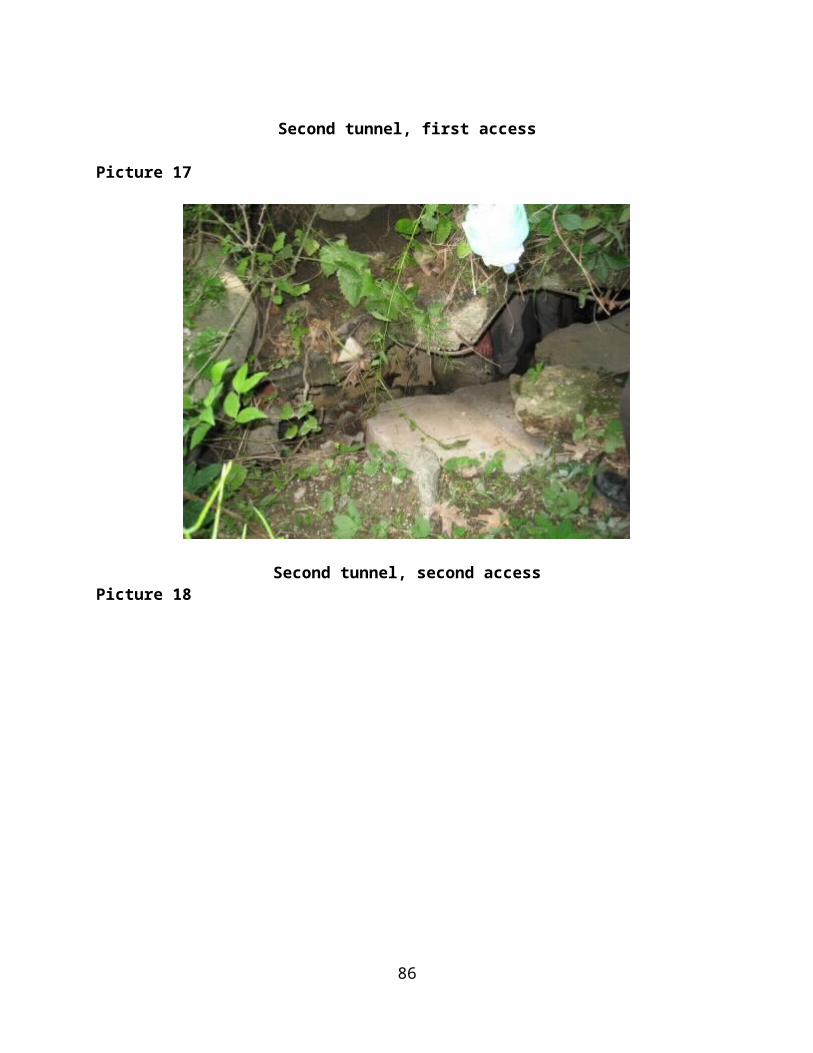
V. DISCUSSION
MDPH/BEH evaluated environmental data available for the East Street Fields. Results of
surface water sampling revealed that exposure opportunities to constituents detected in
surface water are unlikely to result in health effects, particularly given the low potential
for actual contact with surface waters that are difficult to access due to dense vegetation
and location. Subsurface gas samples also did not reveal any detections of landfill-
related constituents, indicating that gas generated by the closed landfill is not reaching the
nearby ESF. Finally, three pesticide applications conducted in August and September
2012 and September 2013 to address threats related to EEE or WNV were conducted
during evening hours when the field was not in use, were of products that break down
quickly in the environment, and involved active ingredients that are not likely to pose
long-term health concerns. Thus, review of available data for the East Street Fields does
not suggest health impacts from potential chemical contaminants in the environment of
the fields.
VI. CONCLUSION
MDPH/BEH does not recommend any further environmental sampling efforts beyond
those already conducted as part of the long-term landfill closure monitoring.
86
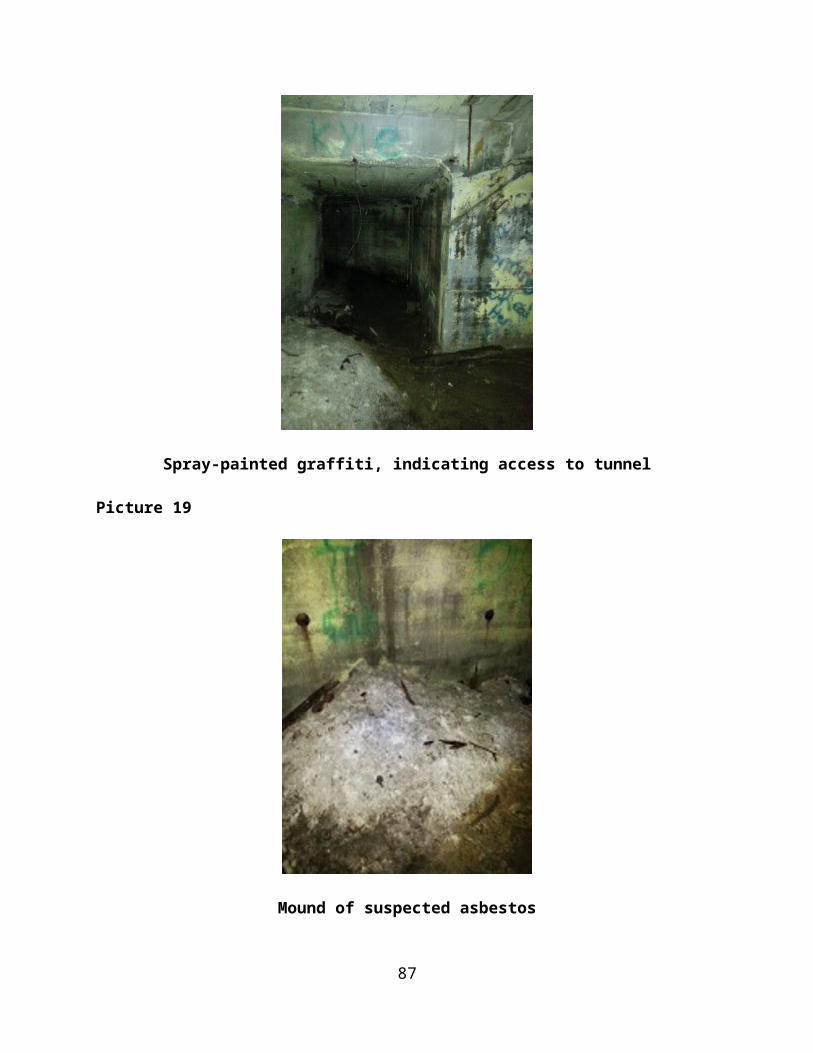
VII. REFERENCES
Agency for Toxic Substance and Disease Registry (ATSDR). 2005. Public Health Assessment Manual. Atlanta: U.S. Department of Health and Human Services. January 2005.
Agency for Toxic Substances and Disease Registry (ASTDR). Landfill Gas Primer. 2006. An Overview for Environmental Health Professionals. [Online] [Accessed in April 2013]. Available from: http://www.atsdr.cdc.gov/HAC/landfill/html/ch2.html.
Agency for Toxic Substances and Disease Registry (ATSDR). 2013. Drinking Water Comparison Values from ATSDR’s Sequoia CV Database. March 2013.
Bayer Environmental Science. 2012. Product Label: Suspend SC. January 11.
Bayer Environmental Science. 2012. Product Material Safety and Data Sheet: Suspend SC Insecticide. June 6.
CDM-Smith. 2010. Rubchinuk Landfill Monitoring Report. August.
CDM-Smith. 2011. Rubchinuk Landfill Monitoring Report. February.
CDM-Smith. 2011. Rubchinuk Landfill Monitoring Report. March.
CDM-Smith. 2011. Rubchinuk Landfill Monitoring Report. June.
CDM-Smith. 2012. Rubchinuk Landfill Monitoring Report. January.
CDM-Smith. 2012. Rubchinuk Landfill Monitoring Report. July.
CDM-Smith. 2013. Rubchinuk Landfill Monitoring Report. January.
Clarke Mosquito Control Products, Inc. 2007. Product Label: DUET Dual- Action Adulticide. April 2007.
Clarke Mosquito Control Products, Inc. 2008. Product Material Safety Data Sheet. June 6, 2008.
Massachusetts Department of Environmental Protection (MassDEP). 2012. Standards and Guidelines for Contaminants in Massachusetts Drinking Waters. Accessed May 2013. Available at: http://www.mass.gov/dep/water/dwstand.pdf
Massachusetts Department of Public Health, Epidemiology Program. (2011). Public Health Fact Sheet: Eastern Equine Encephalitis. Boston, MA : Retrieved from http://www.mass.gov/eohhs/gov/departments/dph/programs/id/epidemiology/providers/public-health-cdc-arbovirus-info.html. Last updated March 2011.
87

Massachusetts Department of Public Health, Epidemiology Program. (2011). Public Health Fact Sheet: West Nile Virus. Boston, MA : Retrieved from http://www.mass.gov/eohhs/gov/departments/dph/programs/id/epidemiology/providers/public-health-cdc-arbovirus-info.html . Last updated March 2011.
Middleton Department of Public Works. 2013. Personal communication with Bob Labossiere (Middleton DPW). May 6th, 2013.
Middleton Health Department. 2013. Personal communication from Derek Fullerton (Middleton BOH). April 9, 2013.
Middleton Health Department. 2013. Personal communication from Derek Fullerton (Middleton BOH). October 1, 2013.
Massachusetts Department of Agricultural Resources (MDAR). 1998. State of Massachusetts Generic Environmental Impact Report on Mosquito Control Generic Environmental Impact Report(GEIR). Available from: http://www.mass.gov/eea/docs/agr/mosquitos/geir-docs/geir-intro-history-and-practice.pdf
National Pesticide Information Center (NPIC). 2000. Piperonyl Butoxide: Technical Fact Sheet. Available at: http://npic.orst.edu/factsheets/pbogen.pdf. Last updated November 2000.
National Pesticide Information Center (NPIC). 2010. Deltamethrin: Technical Fact Sheet. Available at: http://npic.orst.edu/factsheets/DeltaGen.pdf. Last updated February 2010.
National Pesticide Information Center (NPIC). 2011. D- Phenothrin: Technical Fact Sheet. Available at: http://npic.orst.edu/factsheets/dphentech.pdf. Last updated September 2011.
US EPA. 2012. 2012 Edition of the Drinking Water Standards and Health Advisories. Accessed November 8, 2012 . Available at http://water.epa.gov/action/advisories/drinking/upload/dwstandards2012.pdf. Last updated Spring 2012.
US EPA. 2013a. Human Health Risk Assessment: Regional Screening Levels. Available at: http://www.epa.gov/reg3hwmd/risk/human/index.htm. Last updated May. US EPA. 2013b. Drinking Water Contaminants. Accessed August 20, 2013. Available at http://water.epa.gov/drink/contaminants/index.cfm#List. Last updated June 03, 2013.
US EPA Office of Pesticide Programs. 2003. Prallethrin: Human Health Risk Assessment for the Public Health use of Mosquito Adulticides Containing Prallethrin. Available at http://www.epa.gov/pesticides/chem_search/hhbp/R086823.pdf. Last updated November 21, 2003.
US EPA Office of Pesticide Programs. 2006. Reregistration Eligibility Decision for Propylene Glycol and Dipropylene Glycol. Available at
88
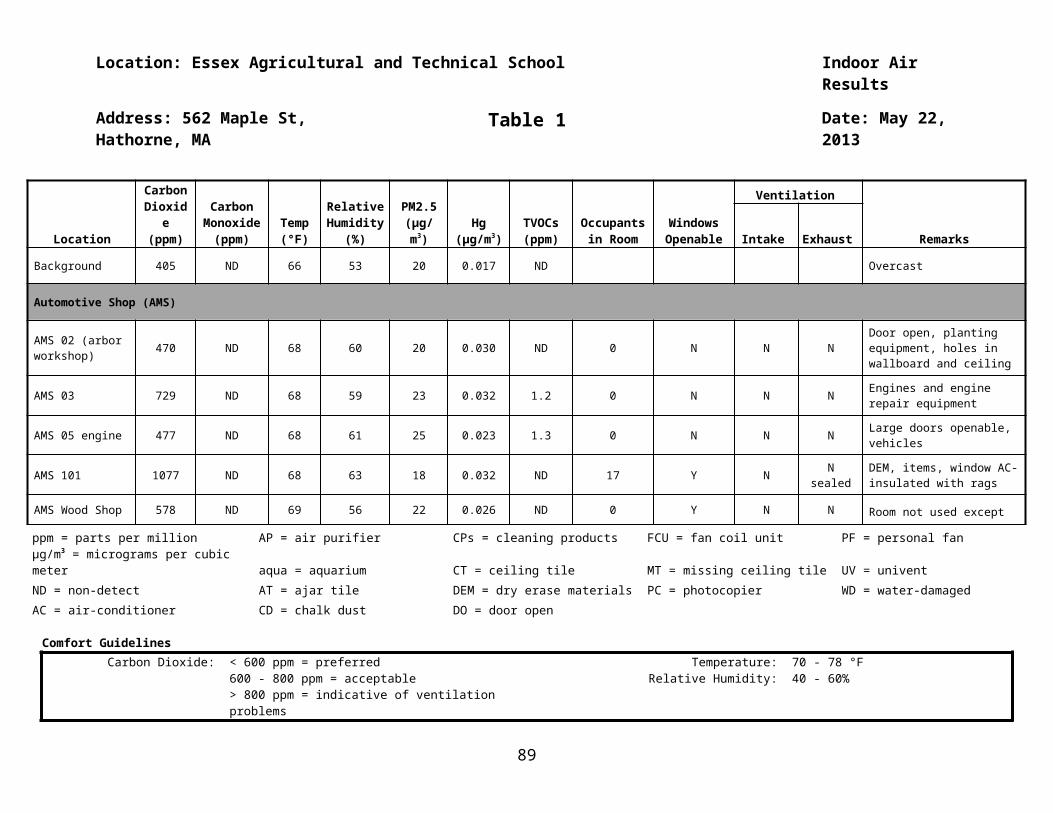
http://www.epa.gov/oppsrrd1/REDs/propylene_glycol_red.pdf. Last updated September 2006.
US EPA Office of Pesticide Programs. 2008. Reregistration Eligibility Decision for d-Phenothrin. Available at http://www.epa.gov/oppsrrd1/REDs/sumithrin_(d-phenothrin)_red.pdf. Last updated September 2008.
US EPA Office of Pesticide Programs. 2010. Piperonyl Butoxide Summary Document: Registration Review. Available at http://www.epa.gov/oppsrrd1/registration_review/piperonyl_butoxide. Last Updated 2010.
US EPA Office of Pesticide Programs. 2010. Deltamethrin: Human Health Assessment Scoping Document in Support of Registration Review. Available at http://www.epa.gov/oppfead1/endanger/litstatus/effects/redleg-frog/2013/deltamethrin/appendix-j.pdf. Last updated February 2010.
World Health Organization (WHO). 2004. WHO Specifications and Evaluations for Public Health Pesticides: Prallethrin. Available from: http://www.who.int/whopes/quality/en/prallethrin_spec_eval_Nov_2004.pdf. Last updated November 2004.
89
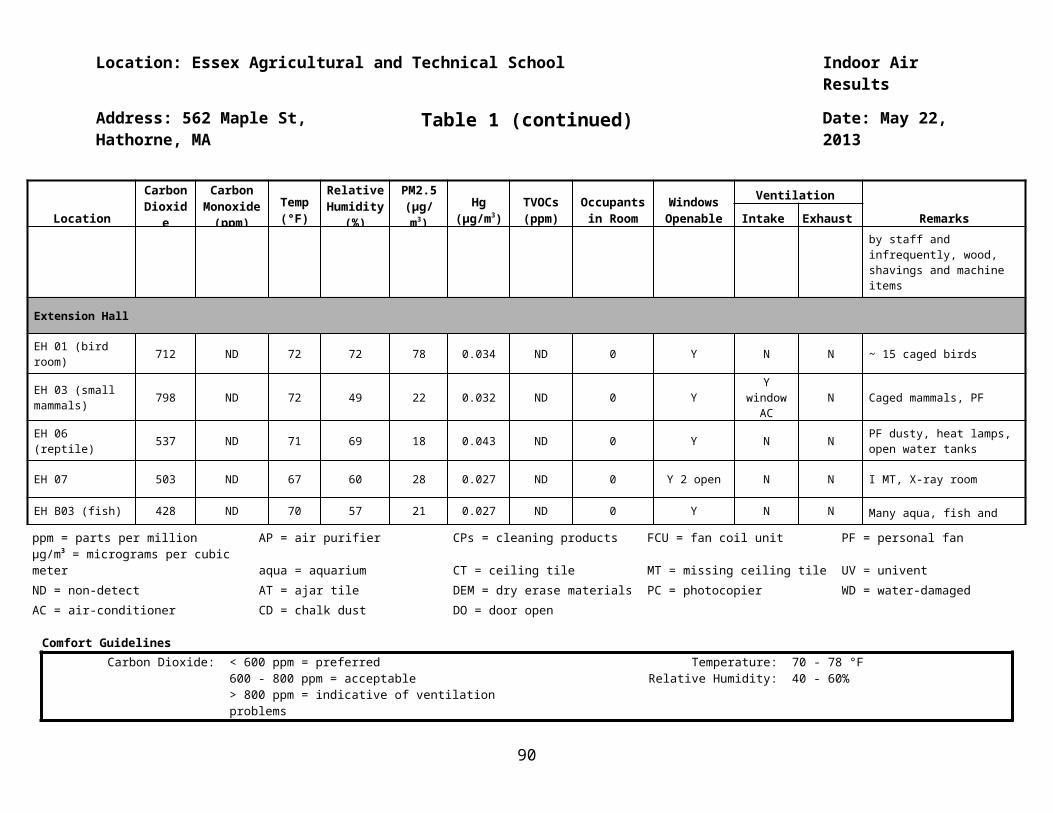
FIGURES AND TABLES
90
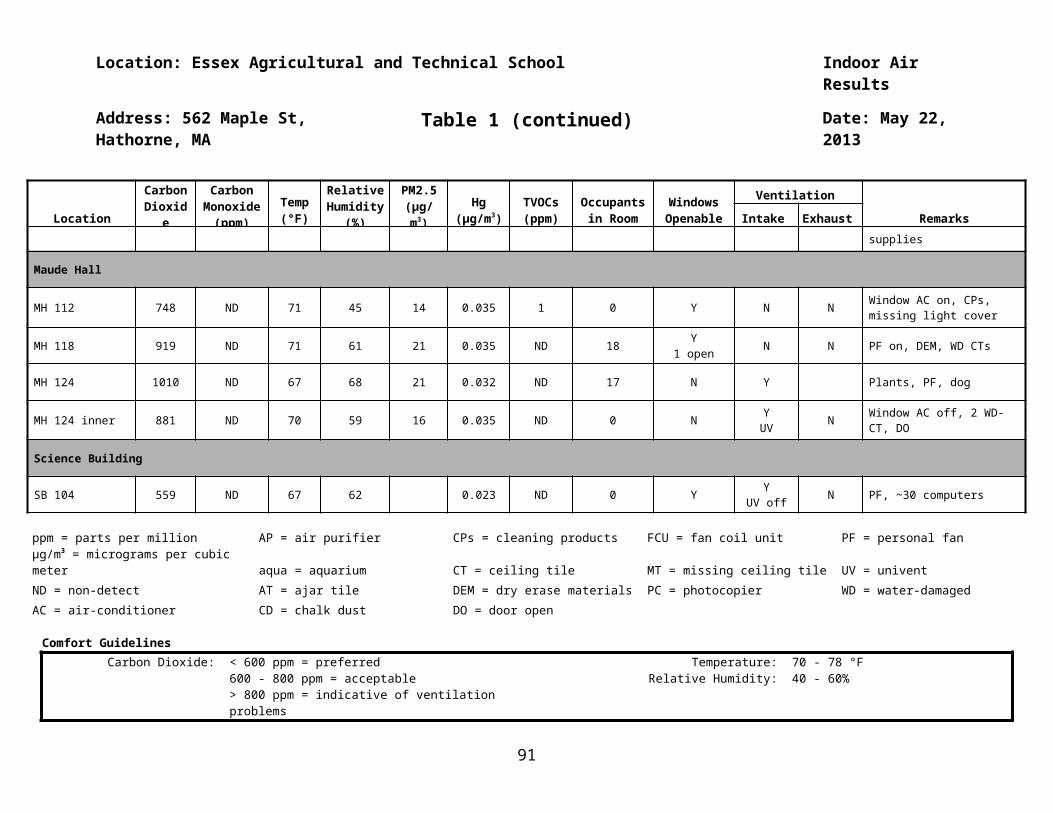
FIGURE 1
91
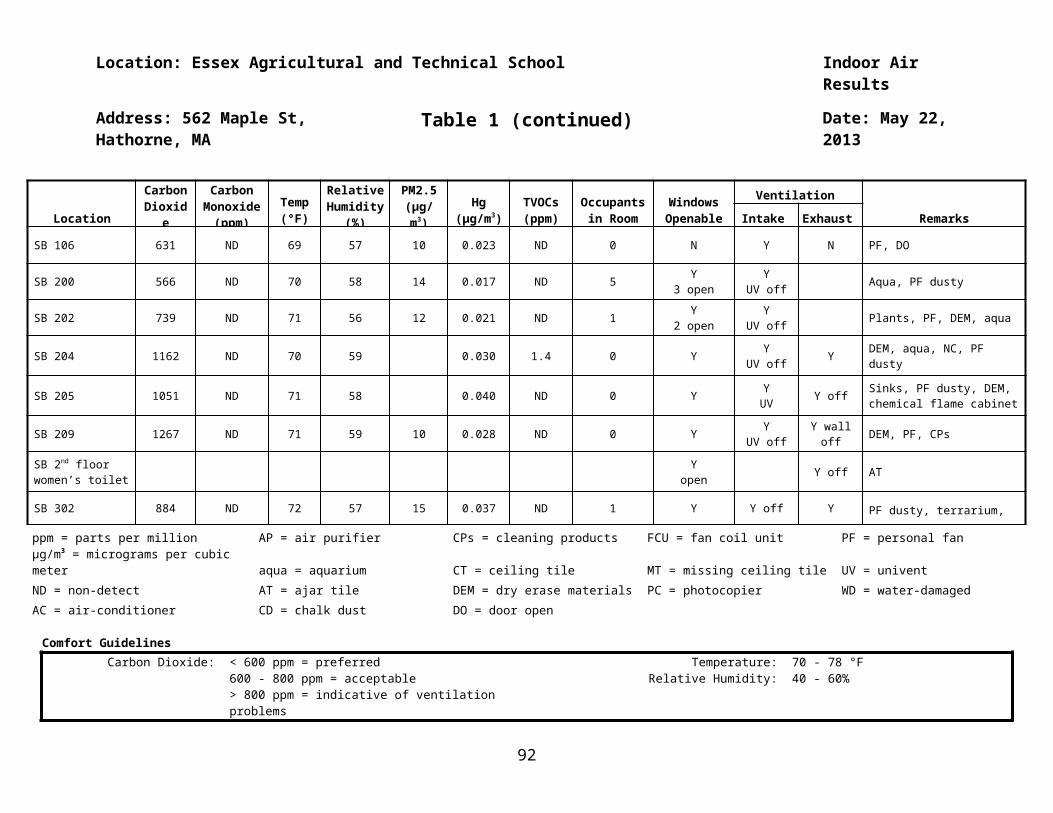
92
Figure 1:
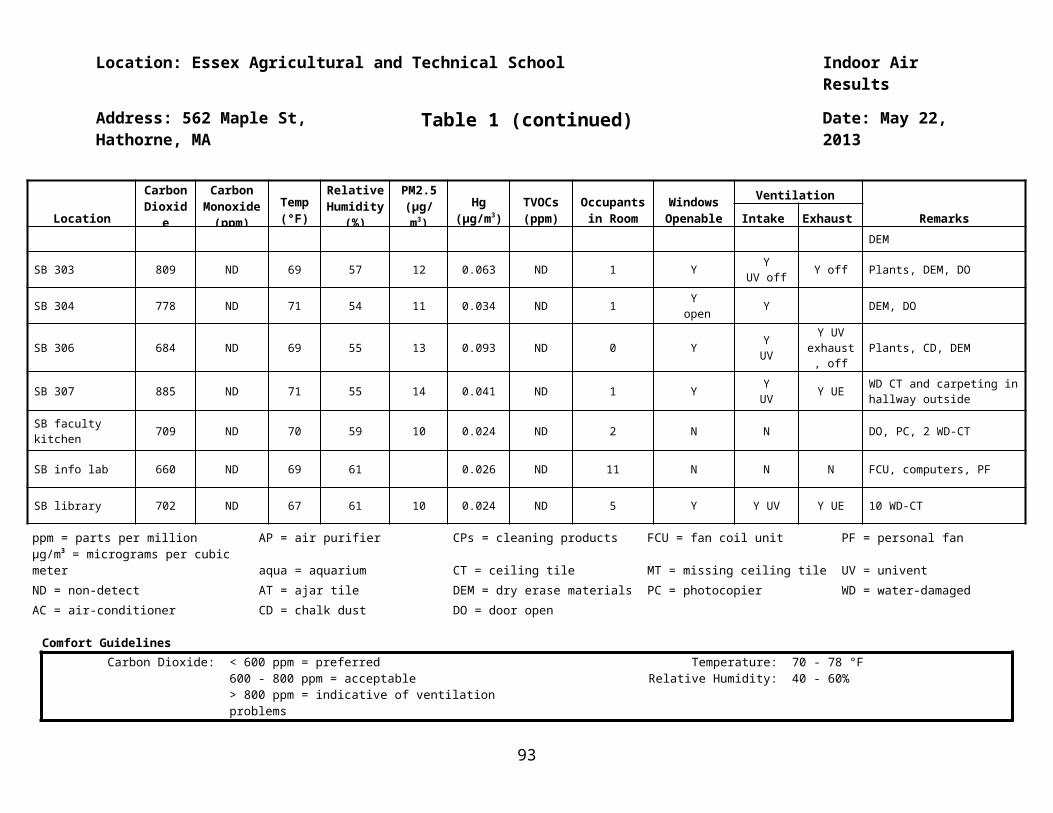
TABLE 1
93
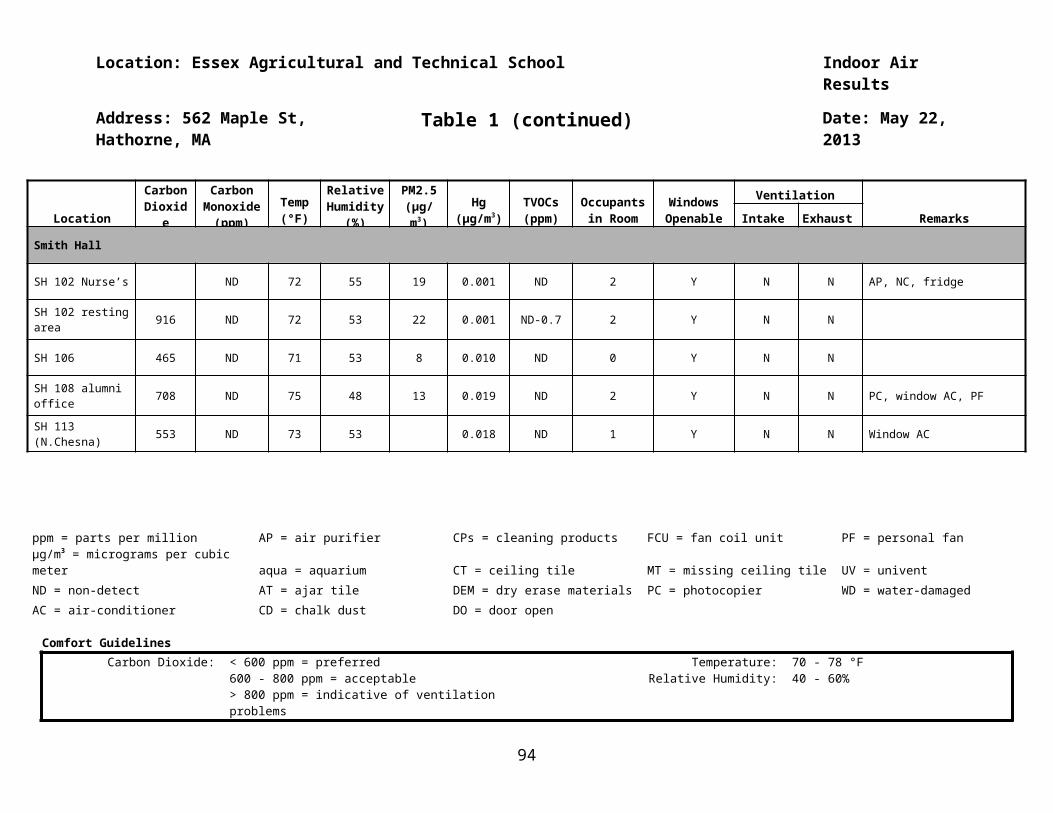
Table 1: East Street Field and Landfill, Middleton, MADetected Constituents in Surface Water (mg/L or ppm)
Compound Maximum Detected Concentration Comparison Value MCL
Acetone 0.0076 Intermediate Child EMEG = 20 MassDEP ORSG = 6.3
Arsenic 0.006 CREG = 2.30E-5 MMCL = 0.01Chronic Child EMEG = 0.003
Barium 0.044 Chronic Child EMEG = 2 MMCL = 2
Cadmium 0.0007Chronic Child EMEG = 0.001
MMCL = 0.005EPA HA = 0.005
Chloride 230 No Comparison Value Massachusetts Secondary MCL = 250Copper 0.002 Intermediate Child EMEG = 0.1 MMCL = 1.3Cyanide 0.007 Child RMEG = 0.006 MMCL = 0.2
Iron 6.5 EPA RSL Ingestion Screening Level = 11 Massachusetts Secondary MCL = 0.3
Manganese 2.24Child RMEG = 0.5
Massachusetts Secondary MCL = 0.05EPA HA = 0.3
Nitrate-Nitrogen 0.37 Child RMEG = 16 EPA MCL = 10Sodium 100 No Comparison Value MassDEP ORSG = 20
Sulfate 27 No Comparison Value Massachusetts Secondary MCL = 250
ATSDR CREG = Cancer Risk Evaluation Guide EPA MCL = Maximum Contaminant LevelEPA RSL = Regional Screening LevelATSDR EMEG = Environmental Media Evaluation Guide
ATSDR RMEG = Reference Dose Media Evaluation GuideEPA HA = Environmental Protection Agency Health Advisory Level
MassDEP ORSG = Massachusetts Department of Environmental Protection Office of Research and Standards GuidelinesMMCL = Massachusetts Maximum Contaminant Level
References for Table 1:Agency for Toxic Substances and Disease Registry (ATSDR). 2013. Drinking Water Comparison Values from ATSDR’s Sequoia CV Database. March 2013.
CDM-Smith. 2010. Rubchinuk Landfill Monitoring Report. August.
CDM-Smith. 2011. Rubchinuk Landfill Monitoring Report. February.
CDM-Smith. 2011. Rubchinuk Landfill Monitoring Report. March.
CDM-Smith. 2011. Rubchinuk Landfill Monitoring Report. June.
94
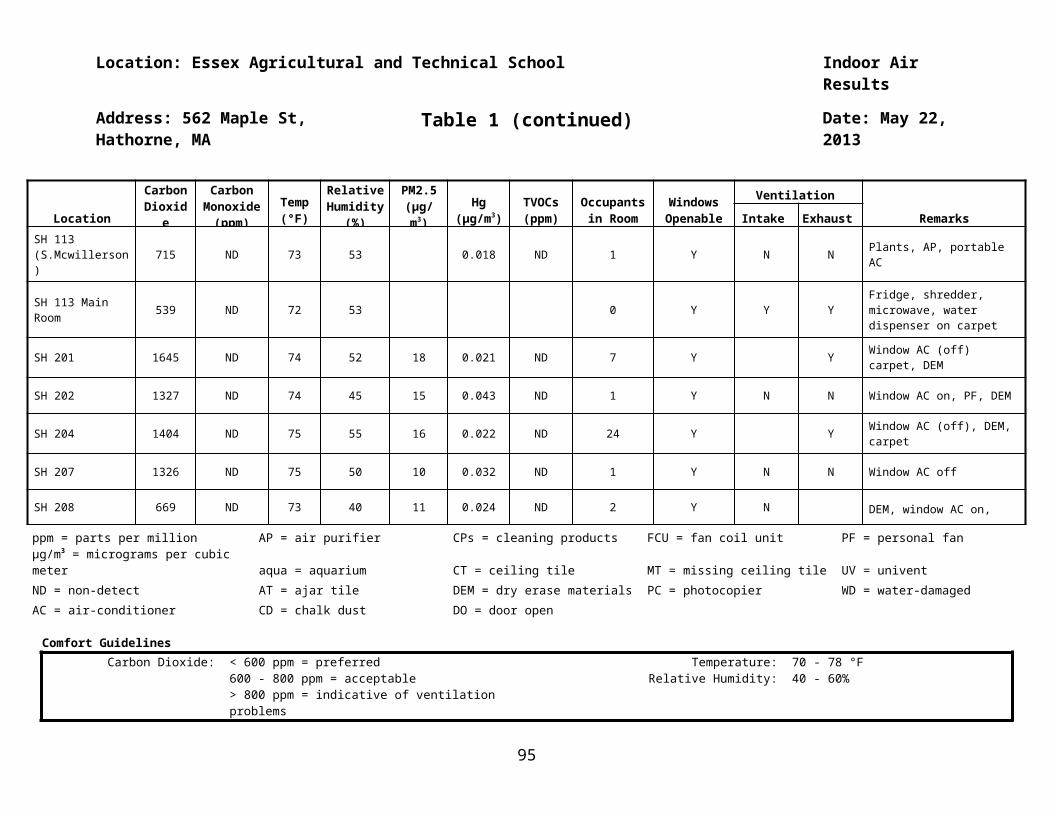
CDM-Smith. 2012. Rubchinuk Landfill Monitoring Report. July.
95
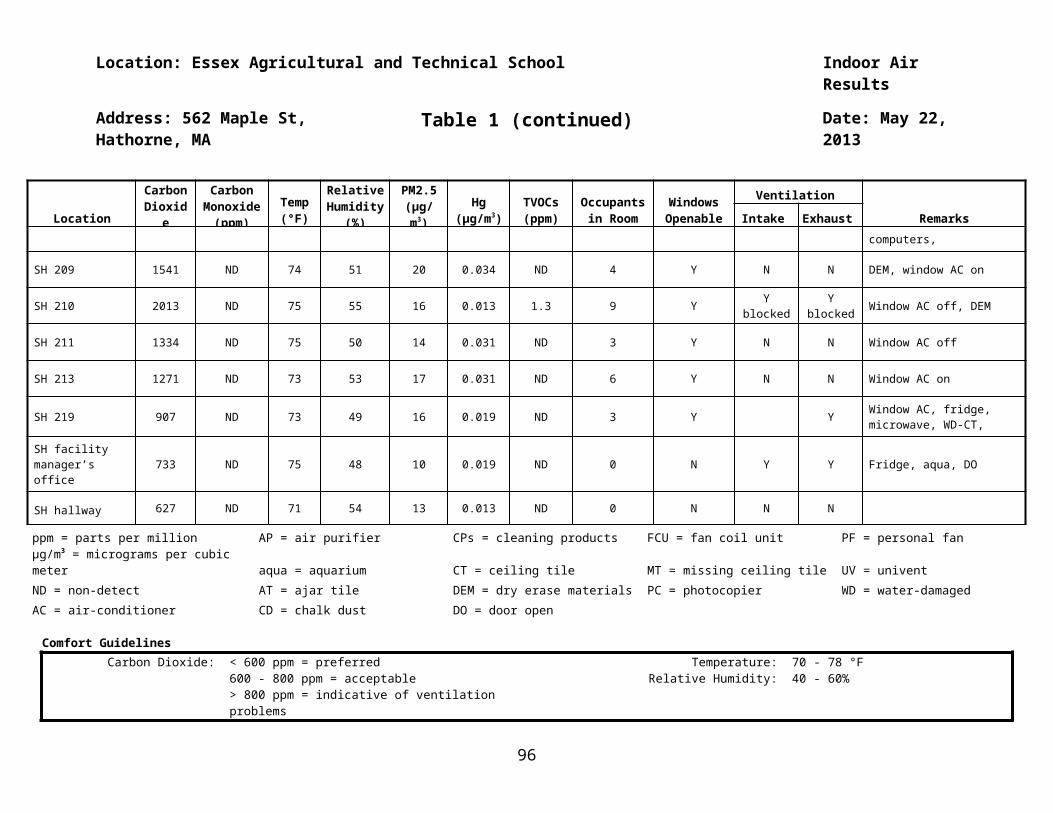
References continued
CDM-Smith. 2013. Rubchinuk Landfill Monitoring Report. January.
Environmental Protection Agency (EPA). 2012. 2012 Edition of the Drinking Water Standards and Health Advisories. Accessed November 8, 2012. Available at http://water.epa.gov/action/advisories/drinking/upload/dwstandards2012.pdf. Last updated Spring 2012.
Environmental Protection Agency (EPA). 2013a. Drinking Water Contaminants. Accessed August 20, 2013. Available at http://water.epa.gov/drink/contaminants/index.cfm#List. Last updated June 03, 2013.
Environmental Protection Agency(EPA). 2013b. Regional Screening Level Summary Table. Available at http://www.epa.gov/region9/superfund/prg/. Last updated May 2013.
Massachusetts Department of Environmental Protection (MassDEP). 2012. Standards and Guidelines for Contaminants in Massachusetts Drinking Waters. Accessed May 2013. Available at: http://www.mass.gov/dep/water/dwstand.pdf. Last updated Spring 2012.
96
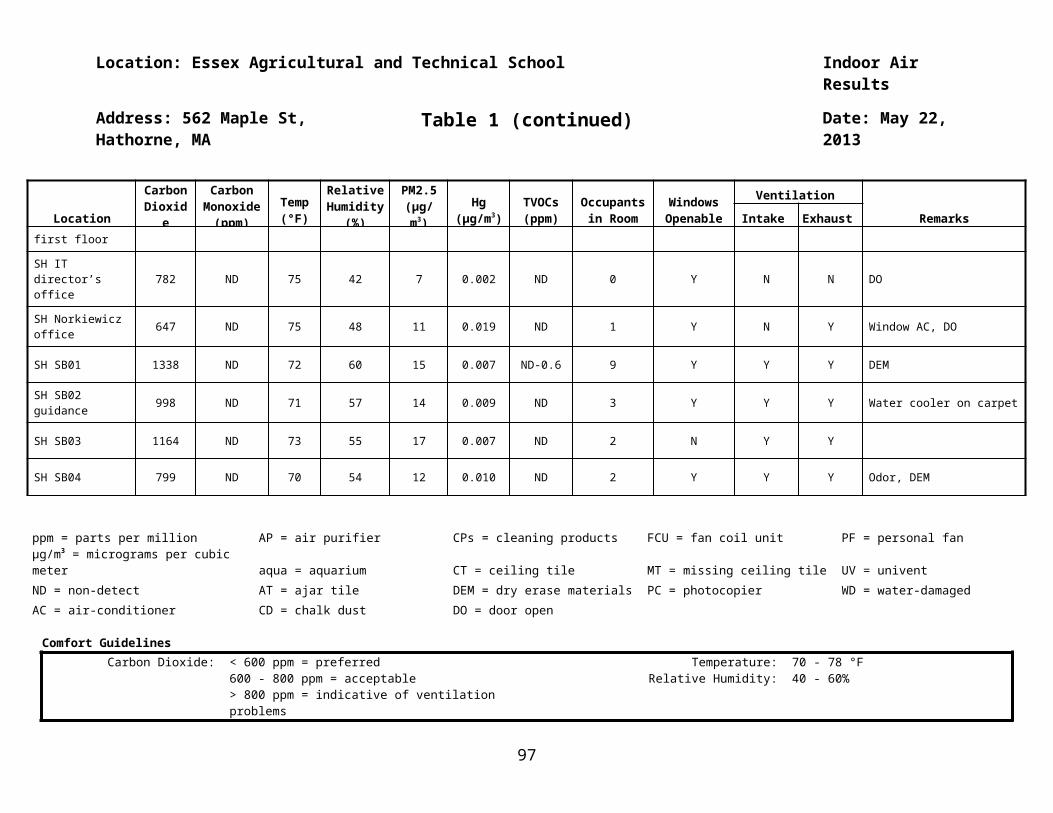
Appendix D: Letter and Consent Form Mailed to Physicians
97
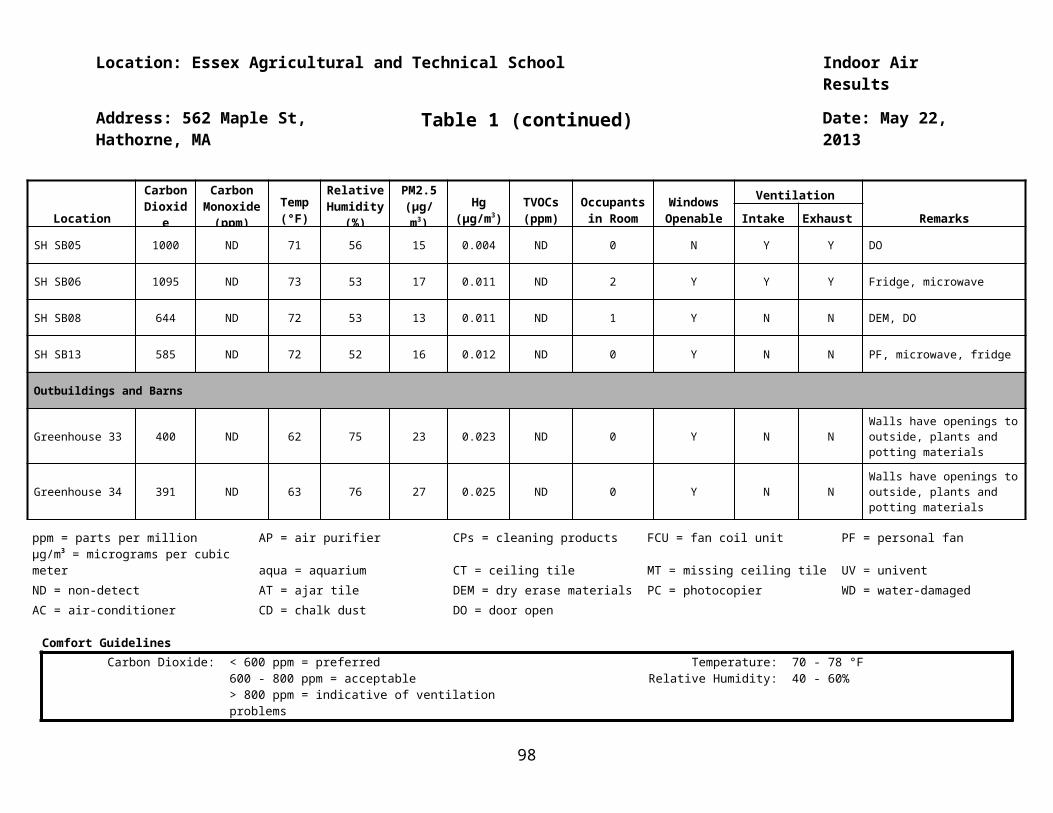
98
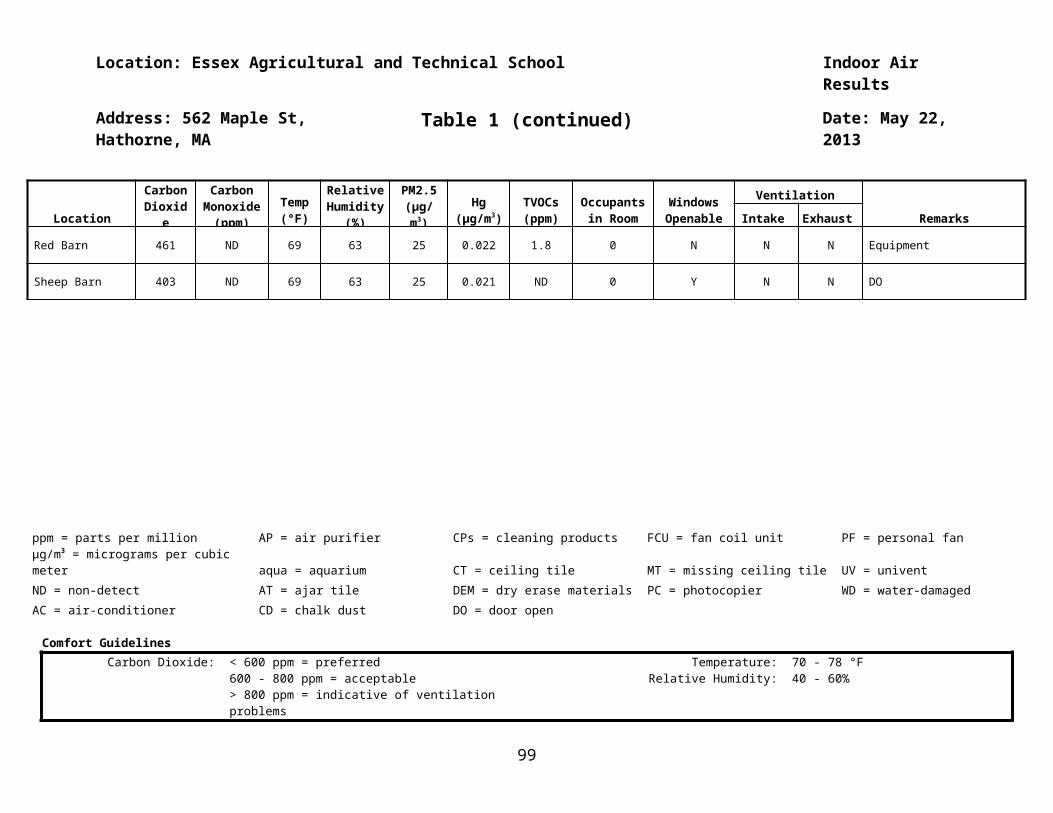
99

100
101