Embed Size (px)
Citation preview

>> Employed by a non-US affiliate of MLPF&S and is not registered/qualified as a research analyst under the FINRA rules. Refer to "Other Important Disclosures" for information on certain BofA Merrill Lynch entities that take responsibility for this report in particular jurisdictions. BofA Merrill Lynch does and seeks to do business with companies covered in its research reports. As a result, investors should be aware that the firm may have a conflict of interest that could affect the objectivity of this report. Investors should consider this report as only a single factor in making their investment decision. Refer to important disclosures on page 10 to 12. Analyst Certification on page 8. Price Objective Basis/Risk on page 8. 11539953
Indra
Very weak Q2: too early to call the bottom
Reiterate Rating: UNDERPERFORM | PO: 8.50 EUR | Price: 10.74 EUR Equity | 31 July 2015
Results worse than feared A messy set of results was always likely given the amount of provisions, but the underlying trends look worse than anticipated on most levels – particularly a net debt to EBITDA of nearly 6x (before expected restructuring costs) – looks a concern. Q2 declined -2% like for like vs. +5% growth in Q1 (excluding the impact of a big headwind to the elections business). Adj. EBIT stepped into a -4% loss (per mgmt. this was between 1-2% before one-offs). Bookings offered a glimmer of optimism - +8% and +18% in the higher margin solutions area. However despite this, there was no guidance for H2, and management flagged on the call that LATAM macro was a concern while Spain (a bright-spot from a revenue standpoint in H1 at +7%) may see a slowdown ahead of the December elections. All in all we lower revenues by 1-2%, our FCF loss moves to -€263m (lowered by €135m) for 2015 and 11/5% for 2015/16. Our cuts to profits are large – see pages 3-4 for details.
The debt is looking large After two quarters of negative c. €80m FCF, net debt has risen to €825m. This is before restructuring cash cost of over €100m (BofAML estimate). We now expect Indra to be at 7x EBITDA leverage by year-end. Even if liquidity looks to be underpinned by current financing arrangements (Indra has a total of €1.4bn of available debt), this looks worryingly high.
Revisit later on and lower down – Underperform We can see the attraction of the Indra bull case – which revolves around mgmt’s LT guidance for €200m of FCF (which would see the stock on a c. 10% unlevered FCF yield). However, this seems some way off right now, and with challenges if anything mounting (LATAM macro, risk of a pause due to Spanish elections) we believe the shares are ahead of fundamentals and - at 0.84x EV/sales - don’t allow enough for significant execution risk of a turnaround. With Q3 likely to be another quarter to test investors’ patience, Feb 2016 is the first realistic chance of a positive catalyst. Meanwhile, given a strong run YTD we think the stock risks de-rating – we reiterate Underperform rating and lower PO to €8.5 (from €9.0), based on 6.6% 2017E FCF (unchanged methodology). Estimates (Dec) (EUR) 2013A 2014A 2015E 2016E 2017E EPS (Adjusted Diluted) 0.82 0.76 0.08 0.54 0.70 EPS Change (YoY) -15.0% -7.6% -88.9% 543.1% 29.2% Dividend / Share 0.34 0 0 0 0
Valuation (Dec) 2013A 2014A 2015E 2016E 2017E P/E 13.1x 14.1x 127x 19.8x 15.3x Dividend Yield 3.17% 0% 0% 0% 0% EV / EBITDA* 8.70x 9.03x 18.5x 9.91x 8.57x Free Cash Flow Yield* 5.33% 4.27% -11.1% 4.73% 6.80% * For full definitions of iQmethod SM measures, see page 9.
Key Changes
(EUR) Previous Current Price Obj. 9.00 8.50
2015E EPS 0.31 0.08
2016E EPS 0.65 0.54
2017E EPS 0.78 0.70 John P King, CFA >> Research Analyst MLI (UK) +44 20 7996 7265 [email protected] Sean Johnstone, CFA Specialist Sales MLI (UK) +44 20 7996 0157 [email protected] Stock Data
Price 10.74 EUR
Price Objective 8.50 EUR
Date Established 30-Jul-2015
Investment Opinion C-3-8
52-Week Range 7.46 EUR-11.95 EUR
Mrkt Val / Shares Out (mn) 1,760 EUR / 163.9
Average Daily Value (mn) 21.12 USD
Free Float 65.0%
BofAML Ticker / Exchange ISMAF / SQC
Bloomberg / Reuters IDR SM / IDR.MC
ROE (2015E) 1.8%
Net Dbt to Eqty (Dec2014A) 69.5%
Un
auth
ori
zed
red
istr
ibu
tio
n o
f th
is r
epo
rt is
pro
hib
ited
.T
his
rep
ort
is in
ten
ded
fo
r m
lore
nte
o@
ind
ra.e
s.

2 Indra | 31 July 2015
iQprofile SM
Indra
Company Sector
Support Services Company Description
Indra is an IT services and industry solutions company
with revenues of c. €3bn. It has expertise in air traffic
control and defence technology. 2014E revenues will
be c. 35% Spain (15% Spanish public sector), 32%
Latin America, 21% Europe/USA and 13% Asia and
the Middle East.
Investment Rationale
Indra could benefit significantly from a macro
recovery in Spain, as margins are a long way below
historic levels. However, cash generation continues to
lag P&L earnings, as working capital has been weak.
With long run trailing FCF generation of less than
EUR60m on average the stock looks overvalued and
prices in a recovery while a lot more needs to be
done.
Stock Data
Price to Book Value 2.4x
Key Income Statement Data (Dec) 2013A 2014A 2015E 2016E 2017E (EUR Millions) Sales 2,914 2,938 2,847 2,917 3,025 EBITDA Adjusted 278 268 130 244 282 Depreciation & Amortization (51.9) (64.2) (65.5) (70.4) (76.8) EBIT Adjusted 226 204 65.0 174 206 Net Interest & Other Income (64.0) (54.3) (46.2) (46.7) (40.0) Tax Expense / Benefit (30.0) 6.60 109 (20.9) (35.2) Net Income (Adjusted) 138 138 15.3 98.7 128 Average Fully Diluted Shares Outstanding 168 181 181 181 182
Key Cash Flow Statement Data Net Income (Reported) 116 (91.9) (370) 70.6 119 Depreciation & Amortization 51.9 64.2 65.5 70.4 76.8 Change in Working Capital (34.7) 16.7 (51.4) 6.16 8.00 Deferred Taxation Charge 0 0 0 0 0 Other CFO 19.2 151 200 (3.45) (17.6) Cash Flow from Operations 152 140 (156) 144 186 Capital Expenditure (56.2) (56.7) (60.3) (51.5) (53.5) (Acquisition) / Disposal of Investments (14.1) (12.9) 7.88 8.07 8.41 Other CFI 4.40 4.90 0 0 0 Cash Flow from Investing (65.9) (64.7) (52.4) (43.4) (45.0) Share Issue / (Repurchase) (2.50) (6.90) 0 0 0 Cost of Dividends Paid (56.0) (55.8) 0 0 0 Increase (decrease) debt 282 (29.0) 300 0 0 Other CFF (13.0) (54.0) (46.2) (46.7) (40.0) Cash Flow from Financing 211 (146) 254 (46.7) (40.0) Total Cash Flow (CFO + CFI + CFF) 297 (70.6) 45.4 53.6 101
FX and other changes to cash (3.93) 1.38 (0.03) 0 0
Change in Cash 293 (69.2) 45.3 53.6 101 Change in Net Debt (10.8) 40.2 255 (53.6) (101) Net Debt 623 663 917 864 763 Key Balance Sheet Data Property, Plant & Equipment 144 127 127 120 112 Goodwill 606 583 583 583 583 Other Intangibles 286 290 285 273 258 Other Non-Current Assets 255 206 198 190 181 Trade Receivables 2,060 1,841 1,934 1,926 1,960 Cash & Equivalents 363 294 339 393 494 Other Current Assets 152 140 140 140 140 Total Assets 3,865 3,481 3,607 3,625 3,728 Long-Term Debt 790 826 1,126 1,126 1,126 Other Non-Current Liabilities 247 86.1 86.1 86.1 86.1 Short-Term Debt 196 131 131 131 131
Other Current Liabilities 1,497 1,485 1,527 1,525 1,566
Total Liabilities 2,730 2,528 2,869 2,867 2,909 Total Equity 1,135 954 737 758 819 Total Equity & Liabilities 3,865 3,481 3,607 3,625 3,728 Business Performance* Return On Capital Employed 11.1% 11.6% 3.46% 8.89% 10.2%
Return On Equity 12.5% 13.3% 1.84% 13.4% 16.4%
Operating Margin 6.80% -1.45% -15.3% 4.59% 6.27% Free Cash Flow (MM) 95.9 83.1 (216) 92.3 133 Quality of Earnings* Cash Realization Ratio 1.10x 1.01x -10.2x 1.46x 1.46x
Asset Replacement Ratio 1.08x 0.88x 0.92x 0.73x 0.70x
Tax Rate 20.5% 6.80% 22.7% 22.9% 22.9% Net Debt/Equity 54.9% 69.5% 124% 114% 93.2% Interest Cover 3.53x 3.76x 1.41x 3.72x 5.13x * For full definitions of iQmethod SM measures, see page 9.

Indra | 31 July 2015 3
Our estimates
Table 1: Results vs. our estimates & consensus
Q215 ∆ (%) Actual BofAML Cons Actual vs. BofAML Actual vs. Cons
Total Revenue 707 721 719 -2.0% -1.7% % growth - reported -5.5% -3.5% -3.9% -197 bps -160 bps Adjusted Operating Profit -€ 28 € 34 € 2 -183.2% -1444.3% % margins -4.0% 4.7% 0.3% -870 bps -429 bps Adjusted EPS -€ 0.23 € 0.09 € 0.12 -371.5% -287.8% FCF -€ 86 -€ 284 -69.8% Source: BofA Merrill Lynch Global Research estimates, Company compiled consensus
Table 2: Changes to our estimates
2015E 2016E 2017E New estimates
Revenue € 2,847 € 2,917 € 3,025 % yoy growth -3.1% 2.5% 3.7%
EBITDA 130 244 282 Adjusted operating profit 65 174 206
% margin 2.3% 6.0% 6.8%
Reported operating profit -435 134 190 % margin -15.3% 4.6% 6.3%
Adjusted EPS € 0.12 € 0.58 € 0.74
% yoy growth -84.7% 396.0% 27.5%
FCF to equity -€ 263 € 46 € 93
∆ (%)
Revenue -1.1% -1.5% -1.6% % yoy growth -11 bps -4 bps -1 bps
EBITDA -30.9% -8.9% -8.2% Adjusted operating profit -46.9% -11.5% -10.5%
% margin -197 bps -68 bps -68 bps
Reported operating profit 15.2% -14.5% -11.3% % margin -217 bps -70 bps -69 bps
Adjusted EPS -66.2% -15.3% -9.3%
% yoy growth -301 bps 2984 bps 85 bps
FCF to equity 105.6% -10.7% -5.2% Source: BofA Merrill Lynch Global Research estimates

4 Indra | 31 July 2015
Table 3: Our estimates vs. consensus
2015 ∆ (%) 2016 ∆ (%) BofAML Cons. BofAML vs Cons BofAML Cons. BofAML vs Cons
Revenue € 2,847 € 2,966 -4.0% € 2,917 € 3,035 -3.9% % yoy growth -3.1% 1.0% -406 bps 2.5% 2.3% 15 bps Adjusted Operating Profit € 65 € 142 -54.2% € 174 € 216 -19.6% Margin 2.3% 4.8% -250 bps 6.0% 7.1% -117 bps Adjusted diluted EPS € 0.12 € 0.44 -73.3% € 0.58 € 0.75 -23.3% FCF to equity -€ 263 € 6 -4497.8% € 46 € 107 -57.3% Net debt € 917 € 723 26.9% € 864 € 661 30.8% Source: BofA Merrill Lynch Global Research estimates, Bloomberg consensus
Indra | 31 July 2015 5
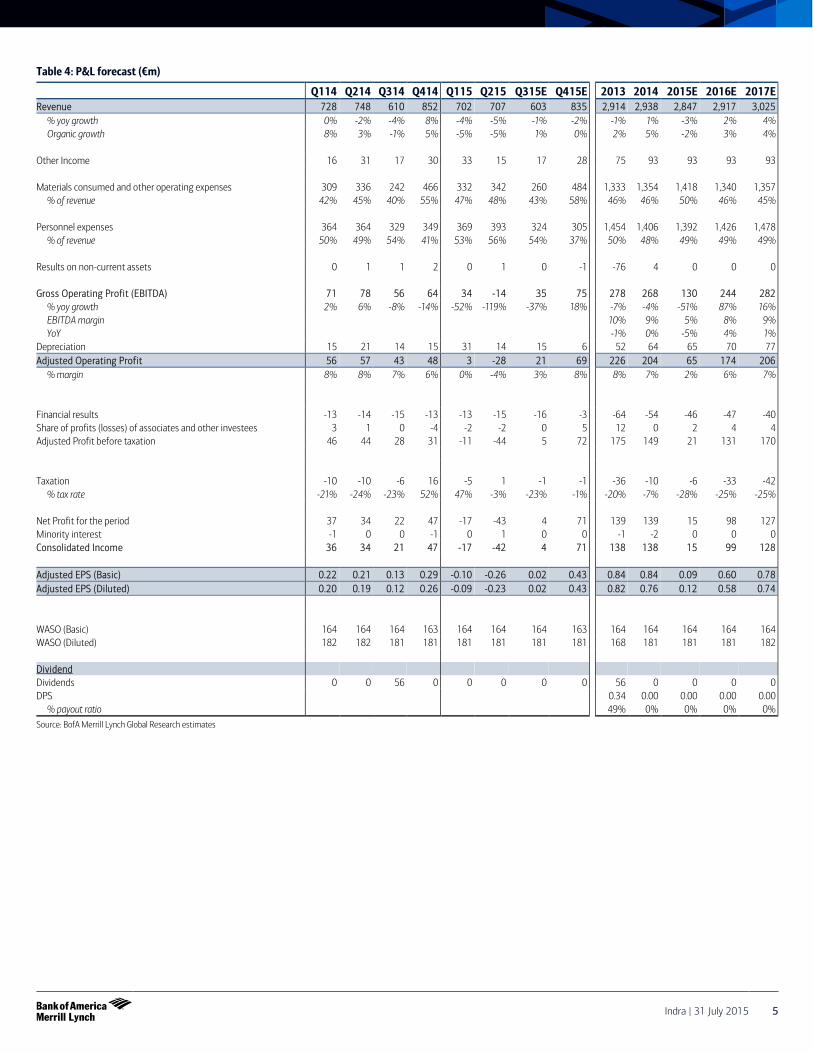
Table 4: P&L forecast (€m)
Q114 Q214 Q314 Q414 Q115 Q215 Q315E Q415E 2013 2014 2015E 2016E 2017E Revenue 728 748 610 852 702 707 603 835 2,914 2,938 2,847 2,917 3,025
% yoy growth 0% -2% -4% 8% -4% -5% -1% -2% -1% 1% -3% 2% 4% Organic growth 8% 3% -1% 5% -5% -5% 1% 0% 2% 5% -2% 3% 4%
Other Income 16 31 17 30 33 15 17 28 75 93 93 93 93 Materials consumed and other operating expenses 309 336 242 466 332 342 260 484 1,333 1,354 1,418 1,340 1,357
% of revenue 42% 45% 40% 55% 47% 48% 43% 58% 46% 46% 50% 46% 45% Personnel expenses 364 364 329 349 369 393 324 305 1,454 1,406 1,392 1,426 1,478
% of revenue 50% 49% 54% 41% 53% 56% 54% 37% 50% 48% 49% 49% 49% Results on non-current assets 0 1 1 2 0 1 0 -1 -76 4 0 0 0 Gross Operating Profit (EBITDA) 71 78 56 64 34 -14 35 75 278 268 130 244 282
% yoy growth 2% 6% -8% -14% -52% -119% -37% 18% -7% -4% -51% 87% 16% EBITDA margin 10% 9% 5% 8% 9% YoY -1% 0% -5% 4% 1%
Depreciation 15 21 14 15 31 14 15 6 52 64 65 70 77 Adjusted Operating Profit 56 57 43 48 3 -28 21 69 226 204 65 174 206
% margin 8% 8% 7% 6% 0% -4% 3% 8% 8% 7% 2% 6% 7%
Financial results -13 -14 -15 -13 -13 -15 -16 -3 -64 -54 -46 -47 -40 Share of profits (losses) of associates and other investees 3 1 0 -4 -2 -2 0 5 12 0 2 4 4 Adjusted Profit before taxation 46 44 28 31 -11 -44 5 72 175 149 21 131 170 Taxation -10 -10 -6 16 -5 1 -1 -1 -36 -10 -6 -33 -42
% tax rate -21% -24% -23% 52% 47% -3% -23% -1% -20% -7% -28% -25% -25% Net Profit for the period 37 34 22 47 -17 -43 4 71 139 139 15 98 127 Minority interest -1 0 0 -1 0 1 0 0 -1 -2 0 0 0 Consolidated Income 36 34 21 47 -17 -42 4 71 138 138 15 99 128 Adjusted EPS (Basic) 0.22 0.21 0.13 0.29 -0.10 -0.26 0.02 0.43 0.84 0.84 0.09 0.60 0.78 Adjusted EPS (Diluted) 0.20 0.19 0.12 0.26 -0.09 -0.23 0.02 0.43 0.82 0.76 0.12 0.58 0.74 WASO (Basic) 164 164 164 163 164 164 164 163 164 164 164 164 164 WASO (Diluted) 182 182 181 181 181 181 181 181 168 181 181 181 182 Dividend Dividends 0 0 56 0 0 0 0 0 56 0 0 0 0 DPS 0.34 0.00 0.00 0.00 0.00
% payout ratio 49% 0% 0% 0% 0% Source: BofA Merrill Lynch Global Research estimates

6 Indra | 31 July 2015
Table 5: Cash flow forecast (€m)
Q114 Q214 Q314 Q414 Q115 Q215 Q315E Q415E 2013 2014 2015E 2016E 2017E Profit before taxes 41 37 24 -199 -16 -430 -95 62 147 -97 -479 91 154
Depreciation 15 21 13 16 31 14 15 6 52 64 65 70 77 Provisions, capital grants and others -7 -10 -4 220 -25 382 0 6 -10 200 363 15 0 Results on non-current assets 0 0 0 0 0 0 0 0 0 0 0 0 0 Share of profit / (losses) of associates and other investees 0 0 -1 4 2 -2 0 0 -1 3 0 0 0 Share options expenses 0 0 0 0 0 0 0 0 0 0 0 0 0 Net financial result 9 13 15 13 13 15 16 3 60 50 46 47 40 Dividends received 0 0 0 0 0 0 0 0 1 0 0 0 0
Operating cash-flow prior to changes in working capital 58 61 48 53 5 -22 -64 77 250 220 -5 223 270 Receivables, net 39 -35 23 -72 -34 -5 0 39 35 -45 0 0 0 Inventories, net -17 19 -13 58 10 7 0 -16 1 47 0 0 0 Payables, net 28 -54 -23 64 -11 -30 0 41 -70 15 0 0 0
Change in working capital 49 -70 -12 50 -36 -28 -18 30 -35 17 -51 6 8 Other operating changes -65 36 -9 -7 -26 -7 -5 -22 -28 -44 -60 -70 -66 Income taxes paid -4 -22 -11 -16 -8 -10 22 -44 -35 -53 -40 -16 -26
Cash-flow from operating activities 39 5 16 80 -65 -67 -66 42 152 140 -156 144 186
Property, plant and equipment, net -5 -4 -3 -3 -2 -4 -4 -23 -10 -15 -32 -29 -30 Intangible, net -4 -16 -10 -12 -7 -6 -6 -9 -46 -42 -28 -23 -24 Investments, net -5 -7 -4 3 0 0 0 8 -14 -13 8 8 8 Interest received 2 1 1 1 1 1 0 -2 4 5 0 0 0 Other cash flows from investment activities 0 0 0 0 0 0 0 0 0 0 0 0 0
Net cash-flow provided/(used) by investing activities -13 -25 -16 -11 -9 -9 -9 -26 -66 -65 -52 -43 -45 Shareholders contribution 0 0 0 0 0 0 0 0 0 0 0 0 0 Changes in treasury stock -1 -4 -5 3 0 -1 0 1 -3 -7 0 0 0 Dividends of subsidiaries paid to minority interests 0 0 0 0 0 0 0 0 0 0 0 0 0 Dividends of the parent company 0 0 -56 0 0 0 0 0 -56 -56 0 0 0 Short term financial investment variation 0 0 0 1 1 0 0 -1 -2 2 0 0 0 Increases (repayment) in capital grants 1 1 1 2 1 4 0 -5 3 5 0 0 0 Increase (decrease) in borrowings -22 -22 48 -49 42 104 0 154 319 -44 300 0 0 Interest paid -11 -12 -7 -16 -8 -13 -16 -9 -52 -46 -46 -47 -40 Cash-flow provided/(used) by financing activities -33 -37 -17 -59 35 94 -16 140 211 -146 254 -47 -40
Cash and cash equivalents at the beginning of the period 363 357 300 283 294 259 275 184 70 363 294 339 393 Exchange gain (loss) on cash and cash equivalents 0 0 0 0 2 -1 0 -1 -4 1 0 0 0 Net (decrease)/increase in cash and cash equivalents -7 -57 -17 10 -38 18 -92 156 297 -71 45 54 101 Cash and cash equivalents at the end of the period 357 300 283 294 259 275 184 339 363 294 339 393 494 FCF to the Enterprise 30 -14 3 65 -74 -77 -75 18 96 83 -208 100 141 FCF to equity (Indra calc) 20 -25 -3 51 -80 -86 -92 -7 52 42 -263 46 93 Source: BofA Merrill Lynch Global Research estimates

Indra | 31 July 2015 7
Table 6: Balance sheet forecast (€m)
Q114 Q214 Q314 Q414 Q115 Q215 Q315E Q415E 2013 2014 2015E 2016E 2017E Non-current Assets
Property, plant and equipment 139 133 130 127 124 127 119 127 144 127 127 120 112 Intangible assets 284 294 297 290 291 284 286 285 286 290 285 273 258 Investments in associates and other investments 88 92 91 90 85 90 93 82 80 90 82 74 65 Goodwill 609 614 613 583 581 481 481 583 606 583 583 583 583 Deferred tax assets 186 211 209 116 128 146 146 116 175 116 116 116 116
Total non-current assets 1,305 1,343 1,340 1,206 1,209 1,127 1,125 1,193 1,290 1,206 1,193 1,166 1,134 Current assets
Assets held for sale 8 8 8 8 7 0 0 8 8 8 8 8 8 Operating current assets 1,998 1,989 1,985 1,841 1,829 1,639 1,663 1,934 2,060 1,841 1,934 1,926 1,960 Other current assets 127 121 128 132 127 141 141 132 143 132 132 132 132 Short term financial investment 0 0 0 0 0 0 0 0 0 0 0 0 0 Cash and cash equivalents 357 300 284 294 259 275 184 339 363 294 339 393 494
Total current assets 2,489 2,418 2,405 2,275 2,222 2,055 1,988 2,414 2,574 2,275 2,414 2,459 2,594 Total assets 3,795 3,761 3,745 3,481 3,431 3,182 3,113 3,607 3,865 3,481 3,607 3,625 3,728 Non-current liabilities
Provisions for liabilities and charges 97 102 77 40 41 85 85 40 99 40 40 40 40 Long term borrowings 812 801 825 826 831 929 929 1,126 790 826 1,126 1,126 1,126 Other financial liabilities 3 3 7 9 21 14 14 9 4 9 9 9 9 Deferred tax liabilities 109 123 122 2 0 5 5 2 104 2 2 2 2 Other non-current liabilities 37 35 35 35 32 31 31 35 40 35 35 35 35
Total non-current liabilities 1,059 1,064 1,066 912 925 1,064 1,064 1,212 1,037 912 1,212 1,212 1,212 Current liabilities
Current borrowings 152 151 184 131 169 171 171 131 196 131 131 131 131 Operating current liabilities 1,179 1,099 1,084 1,193 1,146 1,134 1,140 1,235 1,191 1,193 1,235 1,233 1,274 Other current liabilities 247 314 268 292 279 305 305 292 306 292 292 292 292
Total current liabilities 1,578 1,565 1,537 1,616 1,593 1,610 1,616 1,658 1,693 1,616 1,658 1,655 1,697 Total liabilities 2,637 2,629 2,603 2,528 2,518 2,675 2,680 2,869 2,730 2,528 2,869 2,867 2,909 Equity
Share Capital and Reserves 1,148 1,126 1,136 943 901 498 423 727 1,125 943 727 747 809 Treasury stock -2 -5 -5 -2 -2 -3 -3 -2 -1 -2 -2 -2 -2
Equity attributable to the owners of the parent 1,146 1,121 1,131 941 899 495 420 725 1,124 941 725 746 807 Minority interest 12 12 12 13 14 13 13 12 11 13 12 12 12
Total shareholders’ equity 1,157 1,132 1,143 954 913 508 433 737 1,135 954 737 758 819 Total Equity and Liabilities 3,795 3,761 3,745 3,481 3,431 3,182 3,113 3,607 3,865 3,481 3,607 3,625 3,728 Source: BofA Merrill Lynch Global Research estimates

8 Indra | 31 July 2015
Price objective basis & risk Indra (ISMAF) Our price objective for Indra is €8.5, based on a 2017 FCF yield of 6.6%, inline with peers growing at similar rates. Downside risks to our price objective are: (1) that the nascent recovery in the Spanish economy stalls, (2) that Indra is not successful in growing its solutions business in international markets, and (3) that demand in its defensive divisions slows. Upside risks are if: (1) Indra is faster at expanding overseas, and (2) produces better cash conversion than our estimates. Analyst Certification I, John P King, CFA, hereby certify that the views expressed in this research report accurately reflect my personal views about the subject securities and issuers. I also certify that no part of my compensation was, is, or will be, directly or indirectly, related to the specific recommendations or view expressed in this research report. EMEA - Technology Coverage Cluster
Investment rating Company BofA Merrill Lynch ticker Bloomberg symbol Analyst
BUY Amadeus AMADF AMS SM John P King, CFA ARM Holdings PLC ARMHF ARM LN Kai Korschelt ARM Holdings PLC ARMH ARMH US Kai Korschelt ASML Holding N.V. ASMLF ASML NA Kai Korschelt ASML Holding N.V. ASML ASML US Kai Korschelt Dassault Systemes DASTF DSY FP John P King, CFA Dassault Systemes DASTY DASTY US John P King, CFA Ericsson ERIXF ERICB SS Kai Korschelt Ericsson ERIC ERIC US Kai Korschelt Ingenico S.A. INGIF ING FP Adithya Metuku, CFA Just Eat plc XLWAF JE/ LN John P King, CFA Nokia NOKBF NOK1V FH Kai Korschelt Nokia NOK NOK US Kai Korschelt SAP AG SAPGF SAP GR John P King, CFA SAP AG SAP SAP US John P King, CFA Windeln.de XWKTF WDL GR John P King, CFA Wirecard AG WRCDF WDI GY Adithya Metuku, CFA Worldline XLDSF WLN FP John P King, CFA NEUTRAL Capgemini CAPMF CAP FP John P King, CFA Dialog Semiconductor plc DLGNF DLG GR Adithya Metuku, CFA Gemalto N.V. GTOFF GTO NA Adithya Metuku, CFA Rocket Internet XIFKF RKET GR John P King, CFA STMicroelectronics NV STMEF STM FP Adithya Metuku, CFA STMicroelectronics NV STM STM US Adithya Metuku, CFA UNDERPERFORM Atos AEXAF ATO FP John P King, CFA Imagination Technologies Group PLC IGNMF IMG LN Adithya Metuku, CFA Indra ISMAF IDR SM John P King, CFA Infineon Technologies AG IFNNF IFX GR Adithya Metuku, CFA Infineon Technologies AG IFNNY IFNNY US Adithya Metuku, CFA Sage SGGEF SGE LN John P King, CFA RSTR Alcatel-Lucent ALALF ALU FP Kai Korschelt Alcatel-Lucent ALU ALU US Kai Korschelt

Indra | 31 July 2015 9
iQmethod SM Measures Definitions Business Performance Numerator Denominator
Return On Capital Employed NOPAT = (EBIT + Interest Income) * (1 - Tax Rate) + Goodwill Amortization Total Assets – Current Liabilities + ST Debt + Accumulated Goodwill Amortization
Return On Equity Net Income Shareholders’ Equity Operating Margin Operating Profit Sales Earnings Growth Expected 5-Year CAGR From Latest Actual N/A Free Cash Flow Cash Flow From Operations – Total Capex N/A Quality of Earnings Cash Realization Ratio Cash Flow From Operations Net Income Asset Replacement Ratio Capex Depreciation Tax Rate Tax Charge Pre-Tax Income Net Debt-To-Equity Ratio Net Debt = Total Debt, Less Cash & Equivalents Total Equity Interest Cover EBIT Interest Expense Valuation Toolkit Price / Earnings Ratio Current Share Price Diluted Earnings Per Share (Basis As Specified) Price / Book Value Current Share Price Shareholders’ Equity / Current Basic Shares Dividend Yield Annualised Declared Cash Dividend Current Share Price Free Cash Flow Yield Cash Flow From Operations – Total Capex Market Cap. = Current Share Price * Current Basic Shares
Enterprise Value / Sales EV = Current Share Price * Current Shares + Minority Equity + Net Debt + Other LT Liabilities
Sales
EV / EBITDA Enterprise Value Basic EBIT + Depreciation + Amortization
iQmethod SMis the set of BofA Merrill Lynch standard measures that serve to maintain global consistency under three broad headings: Business Performance, Quality of Earnings, and validations. The key features of iQmethod are: A consistently structured, detailed, and transparent methodology. Guidelines to maximize the effectiveness of the comparative valuation process, and to identify some common pitfalls.
iQdatabase ® is our real-time global research database that is sourced directly from our equity analysts’ earnings models and includes forecasted as well as historical data for income statements, balance sheets, and cash flow statements for companies covered by BofA Merrill Lynch.
iQprofile SM, iQmethod SM are service marks of Merrill Lynch & Co., Inc.iQdatabase ®is a registered service mark of Merrill Lynch & Co., Inc.

10 Indra | 31 July 2015
Disclosures Important Disclosures ISMAF Price Chart
0
3
6
9
12
15
1-Jan-13 1-Jan-14 1-Jan-15
B: Buy, N: Neutral, U: Underperform, PO: Price Objective, NA: No longer valid, NR:No RatingISMAF
15-Jul USriraman
PO:EUR7.50
6-Jan PO:EUR9.50
1-Mar PO:EUR9.00
10-Dec BKing
PO:EUR156-Jan
PO:EUR16
30-Jul PO:EUR15
9-Oct PO:EUR14
31-Oct NPO:EUR10
12-Dec PO:EUR9.20
12-Jan UPO:EUR7.10
2-Mar PO:EUR7.00
14-Jul PO:EUR9.00
Review Restricted No Coverage
The Investment Opinion System is contained at the end of the report under the heading "Fundamental Equity Opinion Key". Dark grey shading indicates the security is restricted with the opinion suspended. Medium grey shading indicates the security is under review with the opinion withdrawn. Light grey shading indicates the security is not covered. Chart is current as of June 30, 2015 or such later date as indicated.
Investment Rating Distribution: Services Group (as of 30 Jun 2015) Coverage Universe Count Percent Inv. Banking Relationships* Count Percent Buy 5 45.45% Buy 4 80.00% Neutral 2 18.18% Neutral 2 100.00% Sell 4 36.36% Sell 4 100.00% Investment Rating Distribution: Global Group (as of 30 Jun 2015) Coverage Universe Count Percent Inv. Banking Relationships* Count Percent Buy 1724 52.07% Buy 1312 76.10% Neutral 768 23.20% Neutral 561 73.05% Sell 819 24.74% Sell 517 63.13% * Companies that were investment banking clients of BofA Merrill Lynch or one of its affiliates within the past 12 months. For purposes of this distribution, a stock rated Underperform is included as a Sell.
FUNDAMENTAL EQUITY OPINION KEY: Opinions include a Volatility Risk Rating, an Investment Rating and an Income Rating. VOLATILITY RISK RATINGS, indicators of potential price fluctuation, are: A - Low, B - Medium and C - High. INVESTMENT RATINGS reflect the analyst’s assessment of a stock’s: (i) absolute total return potential and (ii) attractiveness for investment relative to other stocks within its Coverage Cluster (defined below). There are three investment ratings: 1 - Buy stocks are expected to have a total return of at least 10% and are the most attractive stocks in the coverage cluster; 2 - Neutral stocks are expected to remain flat or increase in value and are less attractive than Buy rated stocks and 3 - Underperform stocks are the least attractive stocks in a coverage cluster. Analysts assign investment ratings considering, among other things, the 0-12 month total return expectation for a stock and the firm’s guidelines for ratings dispersions (shown in the table below). The current price objective for a stock should be referenced to better understand the total return expectation at any given time. The price objective reflects the analyst’s view of the potential price appreciation (depreciation). Investment rating Total return expectation (within 12-month period of date of initial rating) Ratings dispersion guidelines for coverage cluster*
Buy ≥ 10% ≤ 70% Neutral ≥ 0% ≤ 30%
Underperform N/A ≥ 20% * Ratings dispersions may vary from time to time where BofA Merrill Lynch Research believes it better reflects the investment prospects of stocks in a Coverage Cluster.
INCOME RATINGS, indicators of potential cash dividends, are: 7 - same/higher (dividend considered to be secure), 8 - same/lower (dividend not considered to be secure) and 9 - pays no cash dividend. Coverage Cluster is comprised of stocks covered by a single analyst or two or more analysts sharing a common industry, sector, region or other classification(s). A stock’s coverage cluster is included in the most recent BofA Merrill Lynch Comment referencing the stock. Price charts for the securities referenced in this research report are available at http://pricecharts.baml.com, or call 1-800-MERRILL to have them mailed. MLPF&S or an affiliate has received compensation from the company for non-investment banking services or products within the past 12 months: Indra. The company is or was, within the last 12 months, a non-securities business client of MLPF&S and/or one or more of its affiliates: Indra. In the US, retail sales and/or distribution of this report may be made only in states where these securities are exempt from registration or have been qualified for sale: Indra. BofA Merrill Lynch Research personnel (including the analyst(s) responsible for this report) receive compensation based upon, among other factors, the overall profitability of Bank of America Corporation, including profits derived from investment banking revenues.

Indra | 31 July 2015 11
Other Important Disclosures Officers of MLPF&S or one or more of its affiliates (other than research analysts) may have a financial interest in securities of the issuer(s) or in related investments. From time to time research analysts conduct site visits of covered companies. BofA Merrill Lynch policies prohibit research analysts from accepting payment or reimbursement for travel expenses from the company for such visits. BofA Merrill Lynch Global Research policies relating to conflicts of interest are described at http://www.ml.com/media/43347.pdf. "BofA Merrill Lynch" includes Merrill Lynch, Pierce, Fenner & Smith Incorporated ("MLPF&S") and its affiliates. Investors should contact their BofA Merrill Lynch representative or Merrill Lynch Global Wealth Management financial advisor if they have questions concerning this report. "BofA Merrill Lynch" and "Merrill Lynch" are each global brands for BofA Merrill Lynch Global Research. Information relating to Non-US affiliates of BofA Merrill Lynch and Distribution of Affiliate Research Reports: MLPF&S distributes, or may in the future distribute, research reports of the following non-US affiliates in the US (short name: legal name): Merrill Lynch (France): Merrill Lynch Capital Markets (France) SAS; Merrill Lynch (Frankfurt): Merrill Lynch International Bank Ltd., Frankfurt Branch; Merrill Lynch (South Africa): Merrill Lynch South Africa (Pty) Ltd.; Merrill Lynch (Milan): Merrill Lynch International Bank Limited; MLI (UK): Merrill Lynch International; Merrill Lynch (Australia): Merrill Lynch Equities (Australia) Limited; Merrill Lynch (Hong Kong): Merrill Lynch (Asia Pacific) Limited; Merrill Lynch (Singapore): Merrill Lynch (Singapore) Pte Ltd.; Merrill Lynch (Canada): Merrill Lynch Canada Inc; Merrill Lynch (Mexico): Merrill Lynch Mexico, SA de CV, Casa de Bolsa; Merrill Lynch (Argentina): Merrill Lynch Argentina SA; Merrill Lynch (Japan): Merrill Lynch Japan Securities Co., Ltd.; Merrill Lynch (Seoul): Merrill Lynch International Incorporated (Seoul Branch); Merrill Lynch (Taiwan): Merrill Lynch Securities (Taiwan) Ltd.; DSP Merrill Lynch (India): DSP Merrill Lynch Limited; PT Merrill Lynch (Indonesia): PT Merrill Lynch Indonesia; Merrill Lynch (Israel): Merrill Lynch Israel Limited; Merrill Lynch (Russia): OOO Merrill Lynch Securities, Moscow; Merrill Lynch (Turkey I.B.): Merrill Lynch Yatirim Bank A.S.; Merrill Lynch (Turkey Broker): Merrill Lynch Menkul Değerler A.Ş.; Merrill Lynch (Dubai): Merrill Lynch International, Dubai Branch; MLPF&S (Zurich rep. office): MLPF&S Incorporated Zurich representative office; Merrill Lynch (Spain): Merrill Lynch Capital Markets Espana, S.A.S.V.; Merrill Lynch (Brazil): Bank of America Merrill Lynch Banco Multiplo S.A.; Merrill Lynch KSA Company, Merrill Lynch Kingdom of Saudi Arabia Company. This research report has been approved for publication and is distributed in the United Kingdom to professional clients and eligible counterparties (as each is defined in the rules of the Financial Conduct Authority and the Prudential Regulation Authority) by Merrill Lynch International and Bank of America Merrill Lynch International Limited, which are authorized by the Prudential Regulation Authority and regulated by the Financial Conduct Authority and the Prudential Regulation Authority, and is distributed in the United Kingdom to retail clients (as defined in the rules of the Financial Conduct Authority and the Prudential Regulation Authority) by Merrill Lynch International Bank Limited, London Branch, which is authorised by the Central Bank of Ireland and subject to limited regulation by the Financial Conduct Authority and Prudential Regulation Authority - details about the extent of our regulation by the Financial Conduct Authority and Prudential Regulation Authority are available from us on request; has been considered and distributed in Japan by Merrill Lynch Japan Securities Co., Ltd., a registered securities dealer under the Financial Instruments and Exchange Act in Japan; is distributed in Hong Kong by Merrill Lynch (Asia Pacific) Limited, which is regulated by the Hong Kong SFC and the Hong Kong Monetary Authority is issued and distributed in Taiwan by Merrill Lynch Securities (Taiwan) Ltd.; is issued and distributed in India by DSP Merrill Lynch Limited; and is issued and distributed in Singapore to institutional investors and/or accredited investors (each as defined under the Financial Advisers Regulations) by Merrill Lynch International Bank Limited (Merchant Bank) and Merrill Lynch (Singapore) Pte Ltd. (Company Registration No.’s F 06872E and 198602883D respectively). Merrill Lynch International Bank Limited (Merchant Bank) and Merrill Lynch (Singapore) Pte Ltd. are regulated by the Monetary Authority of Singapore. Bank of America N.A., Australian Branch (ARBN 064 874 531), AFS License 412901 (BANA Australia) and Merrill Lynch Equities (Australia) Limited (ABN 65 006 276 795), AFS License 235132 (MLEA) distributes this report in Australia only to 'Wholesale' clients as defined by s.761G of the Corporations Act 2001. With the exception of BANA Australia, neither MLEA nor any of its affiliates involved in preparing this research report is an Authorised Deposit-Taking Institution under the Banking Act 1959 nor regulated by the Australian Prudential Regulation Authority. No approval is required for publication or distribution of this report in Brazil and its local distribution is made by Bank of America Merrill Lynch Banco Múltiplo S.A. in accordance with applicable regulations. Merrill Lynch (Dubai) is authorized and regulated by the Dubai Financial Services Authority (DFSA). Research reports prepared and issued by Merrill Lynch (Dubai) are prepared and issued in accordance with the requirements of the DFSA conduct of business rules. Merrill Lynch (Frankfurt) distributes this report in Germany. Merrill Lynch (Frankfurt) is regulated by BaFin. This research report has been prepared and issued by MLPF&S and/or one or more of its non-US affiliates. MLPF&S is the distributor of this research report in the US and accepts full responsibility for research reports of its non-US affiliates distributed to MLPF&S clients in the US. Any US person receiving this research report and wishing to effect any transaction in any security discussed in the report should do so through MLPF&S and not such foreign affiliates. Hong Kong recipients of this research report should contact Merrill Lynch (Asia Pacific) Limited in respect of any matters relating to dealing in securities or provision of specific advice on securities. Singapore recipients of this research report should contact Merrill Lynch International Bank Limited (Merchant Bank) and/or Merrill Lynch (Singapore) Pte Ltd in respect of any matters arising from, or in connection with, this research report. General Investment Related Disclosures: Taiwan Readers: Neither the information nor any opinion expressed herein constitutes an offer or a solicitation of an offer to transact in any securities or other financial instrument. No part of this report may be used or reproduced or quoted in any manner whatsoever in Taiwan by the press or any other person without the express written consent of BofA Merrill Lynch. This research report provides general information only. Neither the information nor any opinion expressed constitutes an offer or an invitation to make an offer, to buy or sell any securities or other financial instrument or any derivative related to such securities or instruments (e.g., options, futures, warrants, and contracts for differences). This report is not intended to provide personal investment advice and it does not take into account the specific investment objectives, financial situation and the particular needs of any specific person. Investors should seek financial advice regarding the appropriateness of investing in financial instruments and implementing investment strategies discussed or recommended in this report and should understand that statements regarding future prospects may not be realized. Any decision to purchase or subscribe for securities in any offering must be based solely on existing public information on such security or the information in the prospectus or other offering document issued in connection with such offering, and not on this report. Securities and other financial instruments discussed in this report, or recommended, offered or sold by Merrill Lynch, are not insured by the Federal Deposit Insurance Corporation and are not deposits or other obligations of any insured depository institution (including, Bank of America, N.A.). Investments in general and, derivatives, in particular, involve numerous risks, including, among others, market risk, counterparty default risk and liquidity risk. No security, financial instrument or derivative is suitable for all investors. In some cases, securities and other financial instruments may be difficult to value or sell and reliable information about the value or risks related to the security or financial instrument may be difficult to obtain. Investors should note that income from such securities and other financial instruments, if any, may fluctuate and that price or value of such securities and instruments may rise or fall and, in some cases, investors may lose their entire principal investment. Past performance is not necessarily a guide to future performance. Levels and basis for taxation may change. This report may contain a short-term trading idea or recommendation, which highlights a specific near-term catalyst or event impacting the company or the market that is anticipated to have a short-term price impact on the equity securities of the company. Short-term trading ideas and recommendations are different from and do not affect a stock's fundamental equity rating, which reflects both a longer term total return expectation and attractiveness for investment relative to other stocks within its Coverage Cluster. Short-term trading ideas and recommendations may be more or less positive than a stock's fundamental equity rating. BofA Merrill Lynch is aware that the implementation of the ideas expressed in this report may depend upon an investor's ability to "short" securities or other financial instruments and that such action may be limited by regulations prohibiting or restricting "shortselling" in many jurisdictions. Investors are urged to seek advice regarding the applicability of such regulations prior to executing any short idea contained in this report. Foreign currency rates of exchange may adversely affect the value, price or income of any security or financial instrument mentioned in this report. Investors in such securities and instruments, including ADRs, effectively assume currency risk. UK Readers: The protections provided by the U.K. regulatory regime, including the Financial Services Scheme, do not apply in general to business coordinated by BofA Merrill Lynch entities located outside of the United Kingdom. BofA Merrill Lynch Global Research policies relating to conflicts of interest are described at http://www.ml.com/media/43347.pdf. Officers of MLPF&S or one or more of its affiliates (other than research analysts) may have a financial interest in securities of the issuer(s) or in related investments. MLPF&S or one of its affiliates is a regular issuer of traded financial instruments linked to securities that may have been recommended in this report. MLPF&S or one of its affiliates may, at any time, hold a trading position (long or short) in the securities and financial instruments discussed in this report. BofA Merrill Lynch, through business units other than BofA Merrill Lynch Global Research, may have issued and may in the future issue trading ideas or recommendations that are inconsistent with, and reach different conclusions from, the information presented in this report. Such ideas or recommendations reflect the different time frames, assumptions, views and analytical methods of the persons who prepared them, and BofA Merrill Lynch is under no obligation to ensure that such other trading ideas or recommendations are brought to the attention of any recipient of this report.

12 Indra | 31 July 2015
In the event that the recipient received this report pursuant to a contract between the recipient and MLPF&S for the provision of research services for a separate fee, and in connection therewith MLPF&S may be deemed to be acting as an investment adviser, such status relates, if at all, solely to the person with whom MLPF&S has contracted directly and does not extend beyond the delivery of this report (unless otherwise agreed specifically in writing by MLPF&S). MLPF&S is and continues to act solely as a broker-dealer in connection with the execution of any transactions, including transactions in any securities mentioned in this report. Copyright and General Information regarding Research Reports: Copyright 2015 Merrill Lynch, Pierce, Fenner & Smith Incorporated. All rights reserved. iQmethod, iQmethod 2.0, iQprofile, iQtoolkit, iQworks are service marks of Bank of America Corporation. iQanalytics®, iQcustom®, iQdatabase® are registered service marks of Bank of America Corporation. This research report is prepared for the use of BofA Merrill Lynch clients and may not be redistributed, retransmitted or disclosed, in whole or in part, or in any form or manner, without the express written consent of BofA Merrill Lynch. BofA Merrill Lynch Global Research reports are distributed simultaneously to internal and client websites and other portals by BofA Merrill Lynch and are not publicly-available materials. Any unauthorized use or disclosure is prohibited. Receipt and review of this research report constitutes your agreement not to redistribute, retransmit, or disclose to others the contents, opinions, conclusion, or information contained in this report (including any investment recommendations, estimates or price targets) without first obtaining expressed permission from an authorized officer of BofA Merrill Lynch. Materials prepared by BofA Merrill Lynch Global Research personnel are based on public information. Facts and views presented in this material have not been reviewed by, and may not reflect information known to, professionals in other business areas of BofA Merrill Lynch, including investment banking personnel. BofA Merrill Lynch has established information barriers between BofA Merrill Lynch Global Research and certain business groups. As a result, BofA Merrill Lynch does not disclose certain client relationships with, or compensation received from, such companies in research reports. To the extent this report discusses any legal proceeding or issues, it has not been prepared as nor is it intended to express any legal conclusion, opinion or advice. Investors should consult their own legal advisers as to issues of law relating to the subject matter of this report. BofA Merrill Lynch Global Research personnel’s knowledge of legal proceedings in which any BofA Merrill Lynch entity and/or its directors, officers and employees may be plaintiffs, defendants, co-defendants or co-plaintiffs with or involving companies mentioned in this report is based on public information. Facts and views presented in this material that relate to any such proceedings have not been reviewed by, discussed with, and may not reflect information known to, professionals in other business areas of BofA Merrill Lynch in connection with the legal proceedings or matters relevant to such proceedings. This report has been prepared independently of any issuer of securities mentioned herein and not in connection with any proposed offering of securities or as agent of any issuer of any securities. None of MLPF&S, any of its affiliates or their research analysts has any authority whatsoever to make any representation or warranty on behalf of the issuer(s). BofA Merrill Lynch Global Research policy prohibits research personnel from disclosing a recommendation, investment rating, or investment thesis for review by an issuer prior to the publication of a research report containing such rating, recommendation or investment thesis. Any information relating to the tax status of financial instruments discussed herein is not intended to provide tax advice or to be used by anyone to provide tax advice. Investors are urged to seek tax advice based on their particular circumstances from an independent tax professional. The information herein (other than disclosure information relating to BofA Merrill Lynch and its affiliates) was obtained from various sources and we do not guarantee its accuracy. This report may contain links to third-party websites. BofA Merrill Lynch is not responsible for the content of any third-party website or any linked content contained in a third-party website. Content contained on such third-party websites is not part of this report and is not incorporated by reference into this report. The inclusion of a link in this report does not imply any endorsement by or any affiliation with BofA Merrill Lynch. Access to any third-party website is at your own risk, and you should always review the terms and privacy policies at third-party websites before submitting any personal information to them. BofA Merrill Lynch is not responsible for such terms and privacy policies and expressly disclaims any liability for them. Subject to the quiet period applicable under laws of the various jurisdictions in which we distribute research reports and other legal and BofA Merrill Lynch policy-related restrictions on the publication of research reports, fundamental equity reports are produced on a regular basis as necessary to keep the investment recommendation current. Certain outstanding reports may contain discussions and/or investment opinions relating to securities, financial instruments and/or issuers that are no longer current. Always refer to the most recent research report relating to a company or issuer prior to making an investment decision. In some cases, a company or issuer may be classified as Restricted or may be Under Review or Extended Review. In each case, investors should consider any investment opinion relating to such company or issuer (or its security and/or financial instruments) to be suspended or withdrawn and should not rely on the analyses and investment opinion(s) pertaining to such issuer (or its securities and/or financial instruments) nor should the analyses or opinion(s) be considered a solicitation of any kind. Sales persons and financial advisors affiliated with MLPF&S or any of its affiliates may not solicit purchases of securities or financial instruments that are Restricted or Under Review and may only solicit securities under Extended Review in accordance with firm policies. Neither BofA Merrill Lynch nor any officer or employee of BofA Merrill Lynch accepts any liability whatsoever for any direct, indirect or consequential damages or losses arising from any use of this report or its contents.