Embed Size (px)
Citation preview

1
Application eHandbook
INDUCTIVELY COUPLED PLASMA OPTICAL EMISSION SPECTROSCOPY (ICP-OES)
2
AGILENT TECHNOLOGIES
ICP-OES Application eHandbook > Search entire document
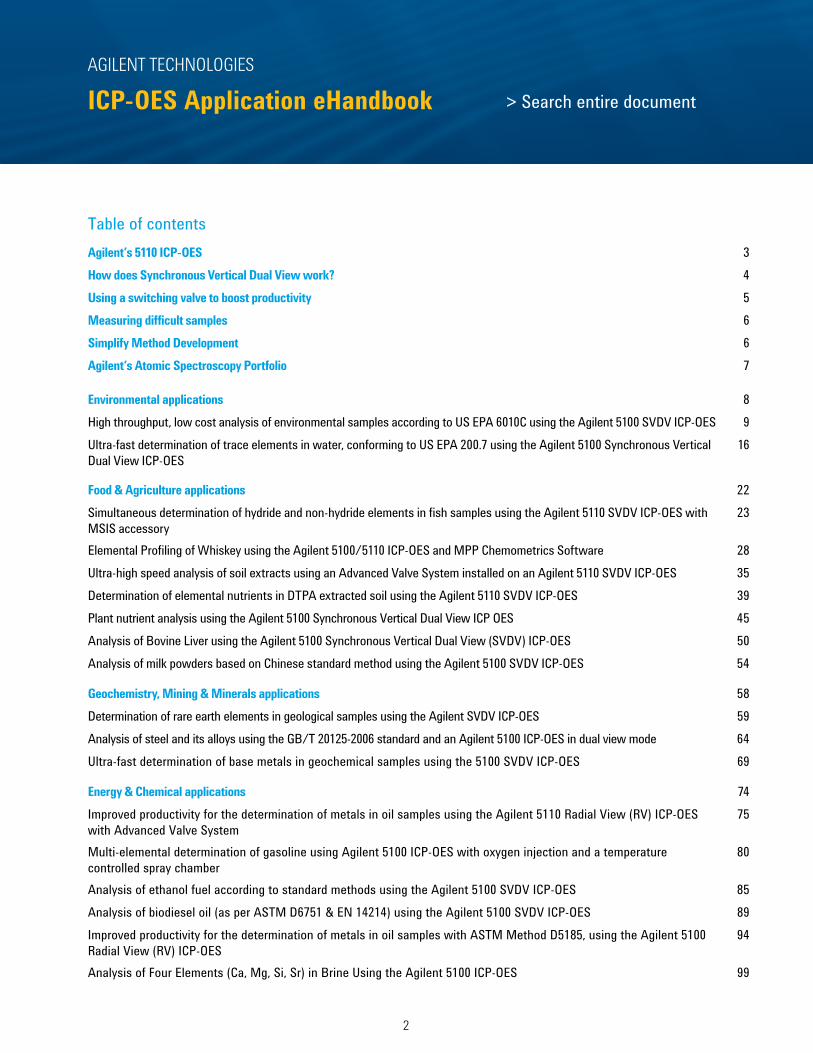
Table of contentsAgilent’s 5110 ICP-OES 3How does Synchronous Vertical Dual View work? 4Using a switching valve to boost productivity 5Measuring difficult samples 6Simplify Method Development 6Agilent’s Atomic Spectroscopy Portfolio 7
Environmental applications 8High throughput, low cost analysis of environmental samples according to US EPA 6010C using the Agilent 5100 SVDV ICP-OES 9Ultra-fast determination of trace elements in water, conforming to US EPA 200.7 using the Agilent 5100 Synchronous Vertical Dual View ICP-OES
16
Food & Agriculture applications 22Simultaneous determination of hydride and non-hydride elements in fish samples using the Agilent 5110 SVDV ICP-OES with MSIS accessory
23
Elemental Profiling of Whiskey using the Agilent 5100/5110 ICP-OES and MPP Chemometrics Software 28Ultra-high speed analysis of soil extracts using an Advanced Valve System installed on an Agilent 5110 SVDV ICP-OES 35Determination of elemental nutrients in DTPA extracted soil using the Agilent 5110 SVDV ICP-OES 39Plant nutrient analysis using the Agilent 5100 Synchronous Vertical Dual View ICP OES 45Analysis of Bovine Liver using the Agilent 5100 Synchronous Vertical Dual View (SVDV) ICP-OES 50Analysis of milk powders based on Chinese standard method using the Agilent 5100 SVDV ICP-OES 54
Geochemistry, Mining & Minerals applications 58Determination of rare earth elements in geological samples using the Agilent SVDV ICP-OES 59Analysis of steel and its alloys using the GB/T 20125-2006 standard and an Agilent 5100 ICP-OES in dual view mode 64Ultra-fast determination of base metals in geochemical samples using the 5100 SVDV ICP-OES 69
Energy & Chemical applications 74Improved productivity for the determination of metals in oil samples using the Agilent 5110 Radial View (RV) ICP-OES with Advanced Valve System
75
Multi-elemental determination of gasoline using Agilent 5100 ICP-OES with oxygen injection and a temperature controlled spray chamber
80
Analysis of ethanol fuel according to standard methods using the Agilent 5100 SVDV ICP-OES 85Analysis of biodiesel oil (as per ASTM D6751 & EN 14214) using the Agilent 5100 SVDV ICP-OES 89Improved productivity for the determination of metals in oil samples with ASTM Method D5185, using the Agilent 5100 Radial View (RV) ICP-OES
94
Analysis of Four Elements (Ca, Mg, Si, Sr) in Brine Using the Agilent 5100 ICP-OES 99

3
AGILENT TECHNOLOGIES
ICP-OES Application eHandbook
www.agilent.com/chem/5110icpoes
Agilent’s 5110 ICP-OES
The unique design of the 5110 introduces the concept of Synchronous Vertical Dual View measurements for the first time. Most commercially available ICP-OES instruments can take measurements using either radial or axial viewing of the plasma. The choice of view depends on the element being quantified and the matrix of the sample. ‘Dual-view’ ICP instruments can take measurements in both axial and radial view. Most require you to set up a series of sequential measurements, selecting which elements are measured in axial mode, and which are measured in radial mode. Some systems also use two slits to measure low and high wavelengths in each mode, resulting in up to four sequential measurements on each sample, making sample throughput slow.
Instead of taking measurements using an axial view of the plasma and then another measurement of the radial view, the 5110’s design needs only a single measurement per sample. To achieve this, the instrument uses an Agilent-designed Dichroic Spectral Combiner (DSC). This optical component allows both the axial and radial views of the plasma to be captured in one reading. Light from the axial view is reflected by one side of the DSC onto the detector and light from the radial view is transmitted through the DSC and reflected onto the detector (refer to the illustration, opposite). This delivers accurate results in the quickest possible time1.
Agilent’s 5110 Synchronous Vertical Dual View (SVDV) ICP-OES combines both speed and analytical performance, without compromising on either.
Other aspects of the design of the 5110 offer further advantages, including:
Maximise productivity• Reduce your cost-per-analysis and double your
productivity by using the optional Advanced Valve System (AVS) 6/7 switching valve.
• Ability to measure all wavelengths in one measurement, for higher precision without delays.
• Quicker start up, with the zero gas consumption VistaChip II detector that shortens warm-up time.
Great performance• Accurate and sensitive analysis of tough samples
with a vertical torch, including high matrix samples through to volatile organic solvents.
• Reduced sample uptake, stabilization times, and rinse delays using the optional Advanced Valve System that features controlled bubble injection to achieve highest analytical precision.
• Long term analytical stability due to a solid-state RF system that delivers a robust plasma.
Less gas• A 50% saving in gas used per sample (compared to
other ICPs) due to the faster analysis times
Ease of use• The intutive software and plug-and-play hardware
makes analysis easy, even for inexperienced operators.
> Return to Table of Contents> Search entire document

4
AGILENT TECHNOLOGIES
ICP-OES Application eHandbook
How does Synchronous Vertical Dual View work?
1. The analysis speed and gas consumption figures are compared to competitive systems, based on published application data. Refer to Agilent application note 5991-4821EN (Ultra-fast determination of trace elements in water, conforming to US EPA 200.7)
Axial light
Vertical torch and plasma
Dichroic Spectral Combiner (DSC)
Radial light
To detector
Dramatically reduce your argon consumption1 The 5110 ICP-OES has the lowest argon consumption per sample of any ICP-OES instrument.
20 L
5110
VDV
27 L
Com
petit
or’s
inst
rum
ents
> 40 L51
10 S
VDV
The 5110 SVDV ICP-OES needs only a single measurement per sample. The Dichroic Spectral Combiner (DSC) allows both the axial and radial views of the plasma to be captured in one reading. The result is that the 5110 can measure samples 55% faster than other ICP-OES instruments can achieve, with a resulting 50% gas saving.
> Return to Table of Contents> Search entire document

5
AGILENT TECHNOLOGIES
ICP-OES Application eHandbook
www.agilent.com/chem/5110icpoes
Using a Switching Valve to Boost Productivity
The AVS 6/7 is an optional accessory for the 5110 ICP-OES instrument. It features a unique 2 position, 6 or 7 port switching valve (the 7th port is for internal standardization) and a high speed positive displacement pump to rapidly fill the sample loop. Controlled argon bubble injection reduces uptake delay and virtually eliminates rinse times to facilitate high throughput sample analysis. The AVS can DOUBLE your sample throughput and reduce argon consumption by over 50%.
How does it work?
1. The AVS in Stand-by mode
2. Sample loading, approximately 5 s
3. Stabilization (approx 3 s) and bubble injection
4. Analytical measurement
5. The AVS returns to Stand-by mode.
> Return to Table of Contents> Search entire document

6
AGILENT TECHNOLOGIES
ICP-OES Application eHandbook
Measuring Difficult SamplesSamples with high levels of dissolved solids e.g. geological samples or those containing organic solvents are often difficult to measure via ICP-OES. The 5110 instrument uses several design concepts to reduce the problems associated with such samples, including:
• A vertically-oriented plasma torch, which delivers uncompromised, robust measurements on tough samples with up to 25% TDS. High sample throughout can be achieved with less cleaning, less downtime and less replacement torches.
• A solid state RF system, which creates a reliable, robust and maintenance-free plasma for even the toughest samples.
• A range of optimized torches and sample introduction kits, designed for organic solvents, high salt/matrix samples, and samples containing hydrofluoric acid (HF).
This graph shows the percentage readback on a range of elements in a 25% NaCl solution. Readback stability for all elements over 4 hours was < 1.3% RSD, without internal standardization. This excellent stability is due to the vertical torch and the robust solid state RF system in the 5110 instrument.
Simplify Method Development Creating a new ICP method can be a daunting task – which emission line to choose? Which plasma view to use? How to overcome matrix effects? How to achieve the precision you need?
The 5110 has been designed to make method setup easy. It includes:
• Synchronous Dual View mode, which eliminates the need to select the correct plasma mode in which to run each element. Just choose your elements and wavelengths, and the instrument does the rest in a single measurement.
• Easy-to-use, application-specific software applets that automatically load a pre-set method so you can start analysis immediately without method development or alignment, and with minimal training.
• Software algorithms such as Fitted background correction and FACT spectral deconvolution deliver accurate, reliable results, even with difficult matrices.
• IntelliQuant mode, in which an additional full wavelength scan is taken during the analysis. This allows rapid qualitative identification and semi-quantification of all analytes so you can rapidly screen a sample. Knowing the identity of elements in the sample also simplifies method development. Wavelengths used for analysis can be retrospectively changed to address over-range results and spectral interferences.
• MultiCal mode, that allows you to monitor two or more wavelengths for each element, giving you confidence in the accuracy of your results and extending your measurement range.
60
AI 396.152 As 188.980 Ba 455.403 Cd 214.439 Co 238.892
80
100
120
0:00 0:30 1:00 1:30 2:00 2:30 3:00 3:30 4:00
% R
eadb
ack
Time (h:mm)
Cr 267.716Mn 257.610 Mo 202.032 Ni 231.604 Pb 220.353 Se 196.026 Sr 407.771
Cu 327.395Zn 213.857
0
20
40
Agilent 5110 ICP-OES4 hour stability in 25% NaCI
> Return to Table of Contents> Search entire document

7
AGILENT TECHNOLOGIES
ICP-OES Application eHandbook
www.agilent.com/chem/5110icpoes
Atomic absorption spectroscopy (AA)
Microwave plasma atomic emission spectroscopy (MP-AES)
Inductively coupled plasma optical emission spectroscopy (ICP-OES)
Inductively coupled plasma mass spectrometry (ICP-MS and ICP-QQQ)
• Low system cost• Low to moderate productivity• ppt for GFAAS. High ppb to %
for FAAS• Approximately 3% total
dissolved solids for FAAS and up to 30% for Graphite Furnace
• Moderate to high productivity• Medium ppb to %• Low running cost• Approximately 3% total
dissolved solids
• Highest productivity (<30 s per sample) with AVS 6/7
• Low ppb to %• Up to 30% total dissolved
solids
• High productivity (<60 s per sample) with ISIS 3
• Low ppq to %• Up to 25% total dissolved
solids with optional ultra high matrix introduction (UHMI)
Agilent’s Atomic absorption range includes both flame and graphite furnace models. The low-cost flame AA features unique fast sequential capability, simplicity of operation, and very good sensitivity, while the GFAAS models feature high sensitivity and accurate Zeeman background correction for your toughest samples.
The Agilent MP-AES saves you money because it runs on air. MP-AES delivers accurate and reliable performance.
Agilent’s ICP-OES are the world’s most productive ICP-OES. Utilizing a vertical plasma for axial and radial emissions, it delivers excellent sensitivity and high matrix capability.
Agilent’s ICP-MS range includes both a instrument suitable for routine analysis as well as a high performance model with superior detection limits, wider dynamic range and high matrix tolerance.
Our Agilent ICP-QQQ with MS/MS mode provides ultimate accuracy for advanced applications.
Agilent’s Atomic Spectroscopy PortfolioAgilent leads the way in atomic spectroscopy innovation. Our comprehensive and trusted portfolio offers you the most diverse application coverage for AA, ICP-OES and ICP-MS, while our unique MP-AES and ICP-QQQ technologies offer new possibilities for your lab.
> Return to Table of Contents> Search entire document

8
AGILENT TECHNOLOGIES
Environmental Applications
Environmental ApplicationsTo meet increasingly tough regulatory and budgetary challenges, environmental laboratories must deliver accurate results faster, more reliably, and more cost-effectively than ever before.
Here’s how Agilent’s 5110 ICP-OES instrument addresses the specific needs of Environmental Labs.
Analysis requirement 5110 offers:
High sample throughput Measurement of a sample in less than 30 seconds, with synchronous vertical dual view measurement and the optional fully integrated AVS 6/7 switching valve installed. This is 55% faster than conventional dual view ICP-OES instruments.
Low analysis costs Fast sample analysis reduces gas consumption by up to 50% and low power consumption and low exhaust extraction requirements reduce your energy consumption costs.
Excellent sensitivity Measurement of elements from low ppb to % level concentrations.
Ability to handle high matrix samples
A vertical torch that offers reliable analysis of samples with up to 30% total dissolved solids means less cleaning, less downtime and less replacement torches. The plug-and-play torch design ensures reproducible, optimised torch insertion.
Ease of use for multiple/infrequent operators
Inuitive software, Click-and-Go methods and automatic algorithms to perform background and interference corrections make measuring samples easy. Agilent’s IntelliQuant function gives approximate concentrations of up to 70 elements in a sample from a fast single scan.
> Return to Table of Contents> Search entire document
9
AGILENT TECHNOLOGIES
Environmental Applications
www.agilent.com/chem/5110icpoes
Introduction
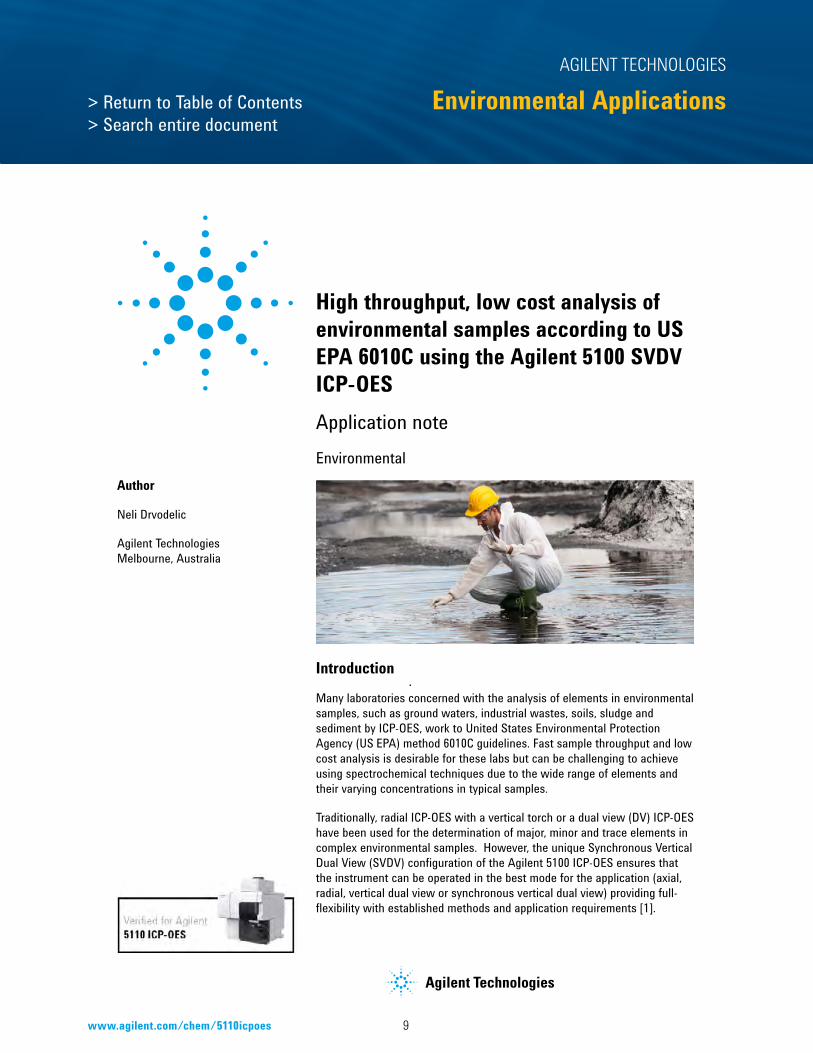
Many laboratories concerned with the analysis of elements in environmental samples, such as ground waters, industrial wastes, soils, sludge and sediment by ICP-OES, work to United States Environmental Protection Agency (US EPA) method 6010C guidelines. Fast sample throughput and low cost analysis is desirable for these labs but can be challenging to achieve using spectrochemical techniques due to the wide range of elements and their varying concentrations in typical samples.
Traditionally, radial ICP-OES with a vertical torch or a dual view (DV) ICP-OES have been used for the determination of major, minor and trace elements in complex environmental samples. However, the unique Synchronous Vertical Dual View (SVDV) configuration of the Agilent 5100 ICP-OES ensures that the instrument can be operated in the best mode for the application (axial, radial, vertical dual view or synchronous vertical dual view) providing full-flexibility with established methods and application requirements [1].
High throughput, low cost analysis of environmental samples according to US EPA 6010C using the Agilent 5100 SVDV ICP-OESApplication note
Author
Neli Drvodelic
Agilent Technologies Melbourne, Australia
Environmental
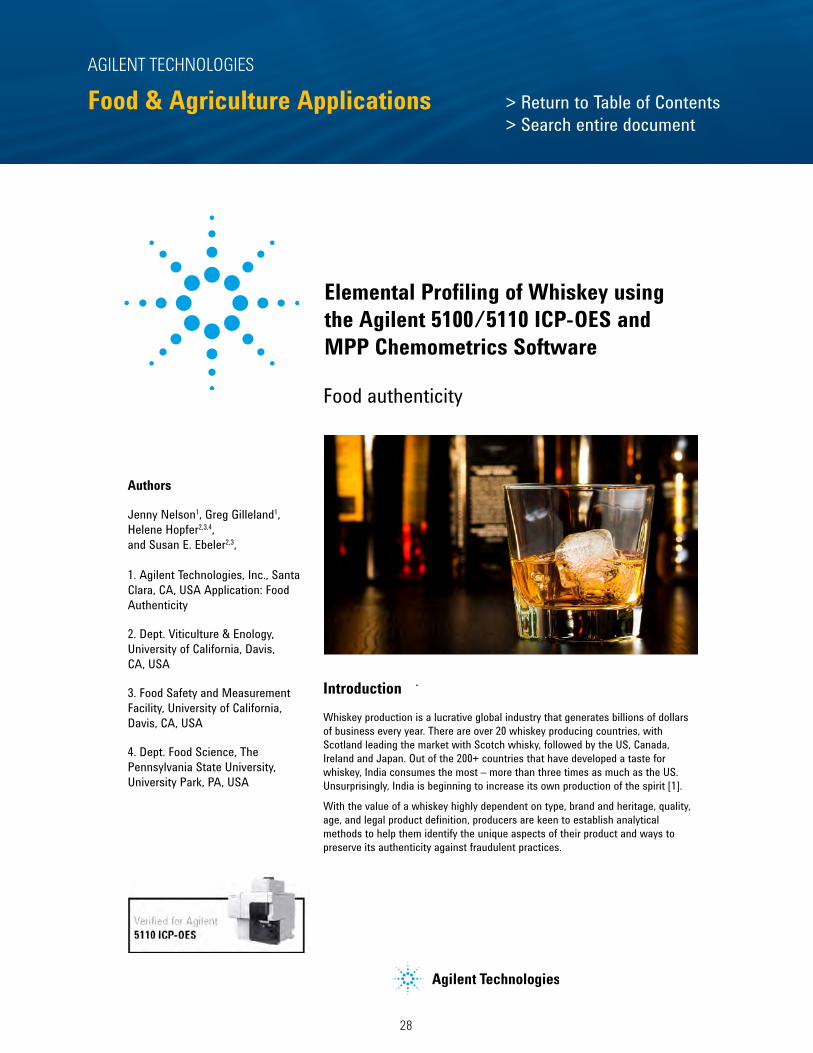
IntroductionWhiskey production is a lucrative global industry that generates billions of dollars of business every year. There are over 20 whiskey producing countries, with Scotland leading the market with Scotch whisky, followed by the US, Canada, Ireland and Japan. Out of the 200+ countries that have developed a taste for whiskey, India consumes the most – more than three times as much as the US. Unsurprisingly, India is beginning to increase its own production of the spirit [1].
With the value of a whiskey highly dependent on type, brand and heritage, quality, age, and legal product definition, producers are keen to establish analytical methods to help them identify the unique aspects of their product and ways to preserve its authenticity against fraudulent practices.
Elemental Profiling of Whiskey using the Agilent 5100/5110 ICP-OES and MPP Chemometrics Software
Authors
Jenny Nelson1, Greg Gilleland1, Helene Hopfer2,3,4,and Susan E. Ebeler2,3,
1. Agilent Technologies, Inc., Santa Clara, CA, USA Application: Food Authenticity
2. Dept. Viticulture & Enology, University of California, Davis, CA, USA
3. Food Safety and Measurement Facility, University of California, Davis, CA, USA
4. Dept. Food Science, The Pennsylvania State University, University Park, PA, USA
Food authenticity
> Return to Table of Contents> Search entire document
10
AGILENT TECHNOLOGIES
Environmental Applications
2
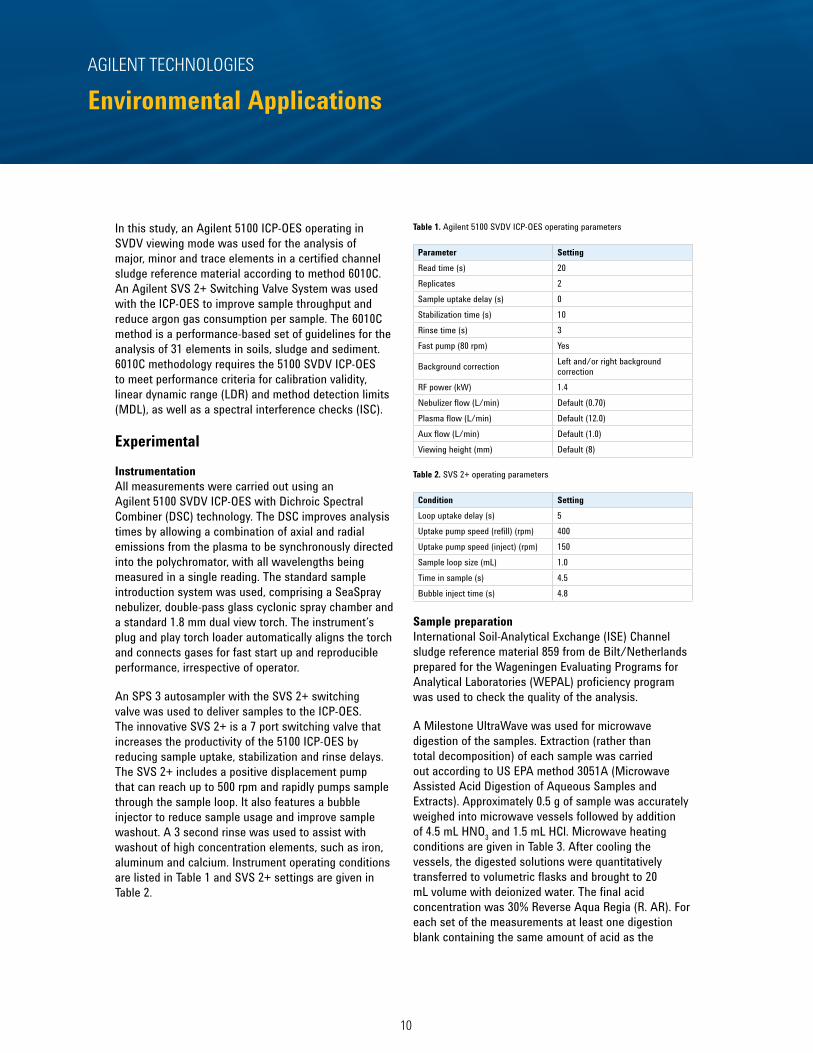
In this study, an Agilent 5100 ICP-OES operating in SVDV viewing mode was used for the analysis of major, minor and trace elements in a certified channel sludge reference material according to method 6010C. An Agilent SVS 2+ Switching Valve System was used with the ICP-OES to improve sample throughput and reduce argon gas consumption per sample. The 6010C method is a performance-based set of guidelines for the analysis of 31 elements in soils, sludge and sediment. 6010C methodology requires the 5100 SVDV ICP-OES to meet performance criteria for calibration validity, linear dynamic range (LDR) and method detection limits (MDL), as well as a spectral interference checks (ISC).
Experimental
InstrumentationAll measurements were carried out using an Agilent 5100 SVDV ICP-OES with Dichroic Spectral Combiner (DSC) technology. The DSC improves analysis times by allowing a combination of axial and radial emissions from the plasma to be synchronously directed into the polychromator, with all wavelengths being measured in a single reading. The standard sample introduction system was used, comprising a SeaSpray nebulizer, double-pass glass cyclonic spray chamber and a standard 1.8 mm dual view torch. The instrument’s plug and play torch loader automatically aligns the torch and connects gases for fast start up and reproducible performance, irrespective of operator.
An SPS 3 autosampler with the SVS 2+ switching valve was used to deliver samples to the ICP-OES. The innovative SVS 2+ is a 7 port switching valve that increases the productivity of the 5100 ICP-OES by reducing sample uptake, stabilization and rinse delays. The SVS 2+ includes a positive displacement pump that can reach up to 500 rpm and rapidly pumps sample through the sample loop. It also features a bubble injector to reduce sample usage and improve sample washout. A 3 second rinse was used to assist with washout of high concentration elements, such as iron, aluminum and calcium. Instrument operating conditions are listed in Table 1 and SVS 2+ settings are given in Table 2.
Table 1. Agilent 5100 SVDV ICP-OES operating parameters
Parameter SettingRead time (s) 20 Replicates 2Sample uptake delay (s) 0 Stabilization time (s) 10Rinse time (s) 3Fast pump (80 rpm) Yes
Background correction Left and/or right background correction
RF power (kW) 1.4 Nebulizer flow (L/min) Default (0.70)Plasma flow (L/min) Default (12.0)Aux flow (L/min) Default (1.0) Viewing height (mm) Default (8)
Table 2. SVS 2+ operating parameters
Condition SettingLoop uptake delay (s) 5 Uptake pump speed (refill) (rpm) 400Uptake pump speed (inject) (rpm) 150Sample loop size (mL) 1.0Time in sample (s) 4.5Bubble inject time (s) 4.8
Sample preparationInternational Soil-Analytical Exchange (ISE) Channel sludge reference material 859 from de Bilt/Netherlands prepared for the Wageningen Evaluating Programs for Analytical Laboratories (WEPAL) proficiency program was used to check the quality of the analysis.
A Milestone UltraWave was used for microwave digestion of the samples. Extraction (rather than total decomposition) of each sample was carried out according to US EPA method 3051A (Microwave Assisted Acid Digestion of Aqueous Samples and Extracts). Approximately 0.5 g of sample was accurately weighed into microwave vessels followed by addition of 4.5 mL HNO3 and 1.5 mL HCl. Microwave heating conditions are given in Table 3. After cooling the vessels, the digested solutions were quantitatively transferred to volumetric flasks and brought to 20 mL volume with deionized water. The final acid concentration was 30% Reverse Aqua Regia (R. AR). For each set of the measurements at least one digestion blank containing the same amount of acid as the
11
AGILENT TECHNOLOGIES
Environmental Applications
www.agilent.com/chem/5110icpoes
3
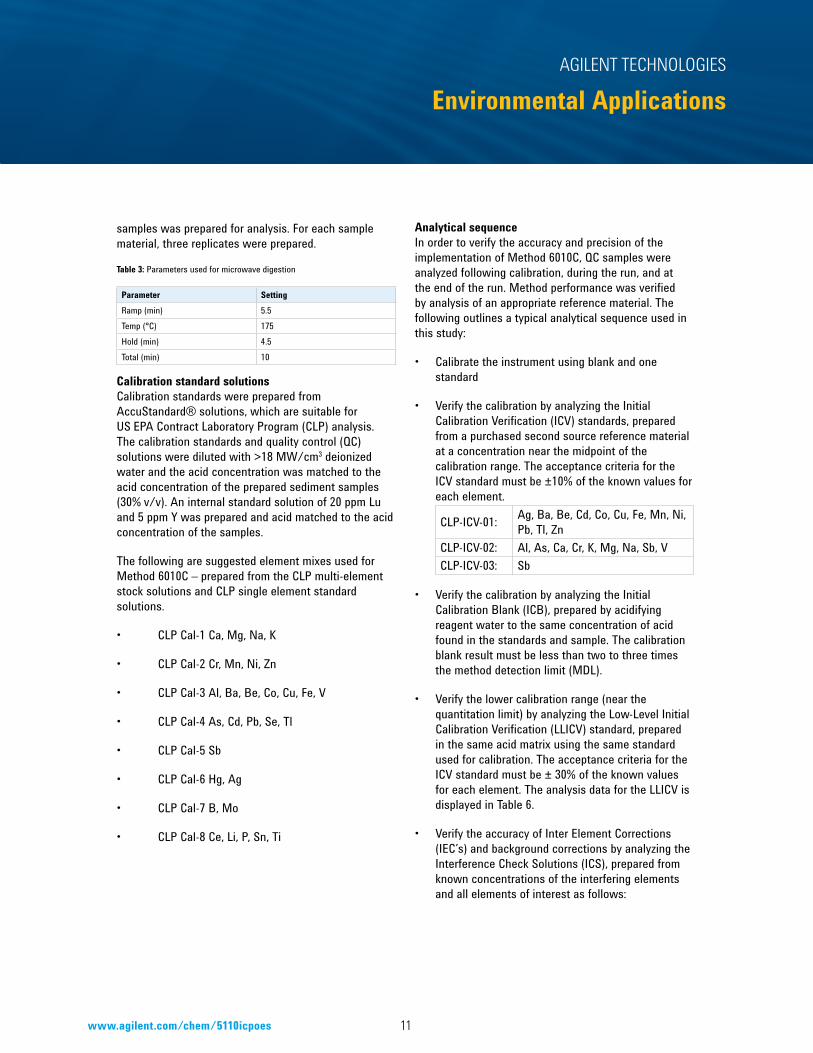
samples was prepared for analysis. For each sample material, three replicates were prepared.
Table 3: Parameters used for microwave digestion
Parameter SettingRamp (min) 5.5Temp (°C) 175 Hold (min) 4.5 Total (min) 10
Calibration standard solutionsCalibration standards were prepared from AccuStandard® solutions, which are suitable for US EPA Contract Laboratory Program (CLP) analysis. The calibration standards and quality control (QC) solutions were diluted with >18 MW/cm3 deionized water and the acid concentration was matched to the acid concentration of the prepared sediment samples (30% v/v). An internal standard solution of 20 ppm Lu and 5 ppm Y was prepared and acid matched to the acid concentration of the samples.
The following are suggested element mixes used for Method 6010C – prepared from the CLP multi-element stock solutions and CLP single element standard solutions.
• CLP Cal-1 Ca, Mg, Na, K
• CLP Cal-2 Cr, Mn, Ni, Zn
• CLP Cal-3 Al, Ba, Be, Co, Cu, Fe, V
• CLP Cal-4 As, Cd, Pb, Se, Tl
• CLP Cal-5 Sb
• CLP Cal-6 Hg, Ag
• CLP Cal-7 B, Mo
• CLP Cal-8 Ce, Li, P, Sn, Ti
Analytical sequenceIn order to verify the accuracy and precision of the implementation of Method 6010C, QC samples were analyzed following calibration, during the run, and at the end of the run. Method performance was verified by analysis of an appropriate reference material. The following outlines a typical analytical sequence used in this study:
• Calibrate the instrument using blank and one standard
• Verify the calibration by analyzing the Initial Calibration Verification (ICV) standards, prepared from a purchased second source reference material at a concentration near the midpoint of the calibration range. The acceptance criteria for the ICV standard must be ±10% of the known values for each element.
CLP-ICV-01: Ag, Ba, Be, Cd, Co, Cu, Fe, Mn, Ni, Pb, Tl, Zn
CLP-ICV-02: Al, As, Ca, Cr, K, Mg, Na, Sb, VCLP-ICV-03: Sb
• Verify the calibration by analyzing the Initial Calibration Blank (ICB), prepared by acidifying reagent water to the same concentration of acid found in the standards and sample. The calibration blank result must be less than two to three times the method detection limit (MDL).
• Verify the lower calibration range (near the quantitation limit) by analyzing the Low-Level Initial Calibration Verification (LLICV) standard, prepared in the same acid matrix using the same standard used for calibration. The acceptance criteria for the ICV standard must be ± 30% of the known values for each element. The analysis data for the LLICV is displayed in Table 6.
• Verify the accuracy of Inter Element Corrections (IEC’s) and background corrections by analyzing the Interference Check Solutions (ICS), prepared from known concentrations of the interfering elements and all elements of interest as follows:

12
AGILENT TECHNOLOGIES
Environmental Applications
4
3 determinations over 3 separate days. Very low MDLs were obtained for all wavelengths.
Linear Dynamic Range (LDR)Method 6010C requires that upper limit of the ICP linear range be established for each wavelength. The upper limit is considered to have been exceeded when the measured concentration is more than 10% below the true value. For this experiment, standards at the upper limits of the calibration range were prepared, analyzed and quantified against the calibration curves (minimum of three standard concentrations across the range). The results of the LDR are given in Table 4 and the calculated values were within ±10% of the true value.
The results in Table 4 show excellent upper concentration limit results for Na and K and for other elements, such as Fe, Mg, Ca, and Al. A LDR up to 10,000 mg/L in solution for Fe is required for the analysis of tough samples such as sludges, sediment or soils. K 766 shows excellent linearity up to 1000 ppm, as shown in Figure 1.
Figure 1. The calibration curve for K 766.491 nm in SVSD mode shows a wide linear range.
The LDR displayed by the 5100 ICP-OES permits the analysis of elements over a wide concentration range, without the need to dilute the samples frequently. This allows analysts to carry out single point calibration, thereby simplifying operation and improving productivity.
ICS A: containing interfering elements Al, Ca, and Mg at 250 mg/L and Fe at 100 mg/L.
ICS AB:
containing the same interfering elements plus all analyte elements of interest (Ag, As, Ba, Be, Cd, Co, Cr, Cu, Mn, Ni, Pb, Sb, Se, Tl, V and Zn). The measured value for the ICSAB must be within 20% of the true value.
• Verify the calibration after every 10 samples with the Continuing Calibration Verification (CCV) standard, prepared in the same acid matrix using the same standard used for calibration, at the concentration near the midpoint of the calibration curve.
CLP-CCV-01: Ag, Ba, Ca, Co, Cr, Cu, Fe, K, Mg, Mn, Na, Ni, V, Zn
CLP-CCV-02: As, Cd, Pb, TlCLP-CCV-03: Mo, BCLP-CCV-04: P, Ti, Ce, Li, Sn, Sr
• Verify the calibration after every 10 samples with the Continuing Calibration Blank (CCB), prepared by acidifying reagent water to the same concentration of acid found in the standards and sample. The calibration blank result must be less than two to three times the MDL.
Performance characteristicsThe initial performance parameters for 31 elements were determined as specified in US EPA Method 6010C using the wavelengths listed in Table 4.
Method Detection Limits The MDL of each element was determined per the procedure specified method 6010C and was expressed as the minimum concentration of an analyte that can be measured. Solutions spiked with each analyte at a concentration of two to three times the Instrument Detection Limit (IDL) were analyzed ten times and the standard deviation of each analyte concentration was multiplied by 3. The procedure was repeated three times to ensure a better estimate of the MDL was obtained. The results shown in Table 4 are an average of

13
AGILENT TECHNOLOGIES
Environmental Applications
www.agilent.com/chem/5110icpoes
5
Table 4. MDLs (µg/L) in solution for target elements and upper concentration limits (mg/L) acquired per EPA Method 6010C guidelines.
Element and wavelength
LDR (mg/L)
MDL(µg/L)
Ag 328.068 50 0.48Al 308.215 2000 3.6As 188.980 50 4.6B 249.678 200 0.81Ba 233.527 50 0.18Be 313.042 5.0 0.04Ca 318.127 1000 5.9Cd 214.439 25 0.35Ce 446.021 100 2.3Co 228.615 250 0.54Cr 205.560 100 0.47Cu 324.754 100 0.42Fe 273.358 10000 53Hg 184.887 250 1.4K 766.491 1000 21Li 610.365 50 0.31
Mg 279.078 1000 3.5Mn 257.610 50 0.08Mo 202.032 50 0.48Na 588.995 1000 50Ni 231.476 100 3.7P 213.618 500 6.3Pb 220.353 200 3.1Sb 206.834 200 4.0Se 196.026 25 5.1Sn 189.925 100 3.8Sr 421.552 2.5 0.05Ti 334.188 25 0.14Tl 190.794 100 4.4V 292.401 100 0.73Zn 213.857 20 0.22
Results and Discussion
Sample analysis Sediment reference material WEPAL-ISE 859 was analyzed using the Agilent 5100 SVDV ICP-OES. While the samples and standards were matrix matched, an internal standard was also used to improve accuracy. Internal Standards Lu 261.541 and Lu 547.668 were used to correct for the lines selected by the DSC to be measured axially and Y 488.368 was used to correct for the elements measured radially by the DSC, in particular Na and K.
The results for the analysis of the CRM are given in Table 5. Excellent recoveries were obtained from an average of 3 determinations repeated over 3 days.Fast Automated Curve Fitting (FACT) was used to correct for a Ca interference on Li 610.365.Table 5. Recovery of elements present in CRM WEPAL-ISE 859 Channel sludge using the 5100 SVDV ICP-OES. All analytes were determined in a single analytical run.
Element and wavelength
Certified (mg/kg)
Measured (mg/kg) SD %Recovery
Ag 328.068 (4.68)Inf 4.70 0.154 101Al 308.215 28000 27572 0.287 101As 188.980 38.0 40.0 0.624 107B 249.678 (29.3 )Inf 29.6 0.045 102Ba 233.527 (466)Inf 473 0.027 102Be 313.042 (1.59)Ind 1.58 0.025 99Ca 318.127 31000 31442 1.87 102Cd 214.439 6.29 5.91 0.031 96Ce 446.021 (38.9)Inf 37.4 0.350 97Co 228.615 13.4 13.6 0.099 100Cr 205.560 124 129 0.078 104Cu 324.754 127 129 0.079 101Fe 273.358 37300 38068 7.51 102Hg 184.887 1.86 1.81 0.250 97K 766.491 4560 4502 5.67 99Li 610.365 (32.2 )Inf 34.5 1.44 107
Mg 279.078 6980 7129 0.574 102Mn 257.610 847 830.6 0.020 98Mo 202.032 (1.91)Ind 1.85 0.154 97Na 588.995 432 436 37.61 101Ni 231.476 59.3 60.5 103 102P 213.618 3810 3727 102.70 98Pb 220.353 192 176 3.680 92Sb 206.834 (2.18 )Inf 2.05 0.033 94Se 196.026 (1.59)Ind 1.59 0.130 100Sn 189.925 (21.2)Inf 19.6 0.366 92Sr 421.552 (131)Inf 134 2.67 103Ti 334.188 (339)Ind 358 20.54 106Tl 190.794 (1.19)Inf 1.21 0.061 101V 292.401 (50.8)Ind 50.9 0.816 100Zn 213.857 816 800 10.6 98
Inf Informative value based on less than 8 results of coefficient of variation higher than 50%.
Ind Indicative value based on at least 8 and less than 16 results or a coefficient of variation between 25% and 50%.

14
AGILENT TECHNOLOGIES
Environmental Applications
6
The excellent recoveries demonstrate the capability of the 5100 SVDV to measure elements across a wide concentration range in a single measurement of the sample. Using the DSC, elements present at high concentrations, such as Na and K are measured radially, while elements at trace levels, such as Hg, As and Se are measured axially.
Low Level of Quantitation Verification (LLQC) StandardA single calibration standard and blank were used to establish the calibration curve and Low Level Check Standards (LLICV and LLCCV) were used to verify the calibration curve. The acceptance criteria for the LLQC standard must be within ± 30%. The analysis data for the LLICV is displayed in Table 6. The recoveries obtained in this study were all within the required limits.
Table 6. Analysis data for the LLICV standard
Element and wavelength
Measured (mg/L) %Recovery
Ag 328.068 0.020 98Al 308.215 0.020 100As 188.980 0.019 96B 249.678 0.018 92Ba 233.527 0.020 100Be 313.042 0.020 98Ca 318.127 0.194 97Cd 214.439 0.019 96Ce 446.021 0.023 116Co 228.615 0.019 95Cr 205.560 0.020 99Cu 324.754 0.019 93Fe 273.358 0.218 109Hg 194.164 0.021 107K 766.491 0.182 91Li 610.365 0.019 96
Mg 279.078 0.019 96Mn 257.610 0.021 107Mo 202.032 0.017 85Na 588.995 0.225 112Ni 231.476 0.023 117P 213.618 0.022 108Pb 220.353 0.021 103Sb 206.834 0.020 99Se 196.026 0.020 99Sn 189.925 0.021 104Sr 421.552 0.022 108Ti 334.188 0.020 101Tl 190.794 0.020 99V 292.401 0.020 98Zn 213.857 0.020 99
Interference Check Solutions (ICS)Channel sludge can contain high concentrations of unknown elements which can cause significant spectral overlaps that need to be identified. The ICP Expert v7 software automatically calculates IEC factors based on the analysis of analyte and interference solutions. These correction factors are then automatically applied to each sample analysis. Two check solutions were analyzed, ICSA and ICSAB. The measured values for the standards (Table 7) are all within the required ± 20% of the true concentration limit.
Table 7. Analysis data for the ICSA and ICSAB standards
Element and wavelength
ICSA (mg/L)
ICSAB (mg/L)
Actual (mg/L) %Recovery
Ag 328.068 <MDL 2.05 2.00 103Al 308.215 244 247 250 99As 188.980 <MDL 0.995 1.00 99Ba 233.527 <MDL 0.548 0.50 110Be 313.042 <MDL 0.516 0.50 103Ca 318.127 261 264 250.00 105Cd 214.439 <MDL 1.01 1.00 101Co 228.615 <MDL 0.481 0.50 96Cr 205.560 <MDL 0.526 0.50 105Cu 324.754 <MDL 0.544 0.50 109Fe 273.358 100 102 100 102Mg 279.078 260 263 250 105Mn 257.610 <MDL 0.536 0.50 107Ni 231.476 <MDL 0.972 1.00 97Pb 220.353 <MDL 0.474 0.50 95Sb 206.834 <MDL 6.19 6.00 103Se 196.026 <MDL 0.547 0.50 109Tl 190.794 <MDL 0.951 1.00 95V 292.401 <MDL 0.496 0.50 99Zn 213.857 <MDL 0.970 1.00 97
Long term stabilityLong term stability was determined by analyzing a Standard Reference Material every 10 samples for eight hours. The 5100 SVDV ICP-OES showed excellent stability over the eight hour run with recoveries for all elements within 10% of the true value. RSD values of less than 1.5% were achieved for all elements over the duration of the run, except for slightly higher RSDs of 2.3% and 2.0% for Hg and Sb respectively. Figure 2 shows that conditions remain stable for all elements during the eight hour sequence.

15
AGILENT TECHNOLOGIES
Environmental Applications
www.agilent.com/chem/5110icpoes7
Figure 2. Stability for EPA 6010C elements using an 5100 ICP-OES with SVS 2+ valve.
The solid-state RF (SSRF) system operating at 27 MHz and the vertical torch position of the 5100 leads to excellent plasma robustness and long term stability, especially for challenging sludge samples. The plug and play vertical torch that ensures reproducible torch alignment and Mass Flow Controller control of all plasma gases also contributes to instrument stability over long periods of operation. Long term stability means re-runs of samples and costly QC can be reduced, leading to increased productivity.
Fast sample throughput and low argon consumptionAn analysis sequence that adheres to US EPA protocols can be time-consuming as there are a large number of QC solutions that must be analyzed. In this study, the use of DSC technology with the SVS 2+ dramatically reduced the sample-to-sample analysis time to 60 seconds. This equates to 60 samples per hour or 480 samples over an 8 hour day. The total argon consumption for the method was 19 L per sample.
High-throughput laboratories typically measure more than 30 elements per sample and analyze hundreds, even thousands, of samples every day. Running the 5100 SVDV ICP-OES using the SVS 2+ with SPS 3 autosampler reduced the typical sample-to-sample measurement time by 73 seconds compared to the same analysis performed on a 5100 VDV without the SVS 2+ [2].
The rapid sample throughput capabilities of the Agilent 5100 ICP-OES are due to the optimized positioning of the sample introduction system to minimize sample delivery time, the fast Vista Chip 2 detector which reads all wavelengths in a single measurement, and the SVS 2+ Switching Valve System.
Conclusions
Agilent’s 5100 SVDV ICP-OES with a vertical torch provides the robustness and analytical performance required for the determination of tough environmental samples in accordance with US EPA method 6010C. The unique configuration of the 5100 SVDV with synchronous dual view significantly improves sample-to-sample analysis times compared to conventional DV ICP-OES. This produces rapid sample throughput and reduced argon consumption. The SVS 2+ Switching Valve System further improves sample throughput by as much as 73 s compared to conventional sample introduction. Both rinse time and sample analysis time are reduced without any compromise in performance.
In addition to excellent MDLs, spike recoveries, linearity, and excellent long-term stability, a sample to sample analysis time of just 60 seconds per sample was achieved. This enables more samples to be measured each day and reduces argon consumption to just 19 L per sample.
The 5100 SVDV ICP-OES fitted with the innovative SVS 2+ is a cost-effective and highly productive system suitable for labs running a wide range of environmental-type samples such as soils, sediments and sludges.
References
1. Benefits of a vertically oriented torch— fast, accurate results, even for your toughest samples, Agilent publication, (2014), 5991-4854EN.
2. Increase productivity for environmental sample analysis using the SVS 2+ Switching Valve System for Agilent 5100 SVDV ICP-OES. Agilent publication, (2014), 5991-5990EN.

16
AGILENT TECHNOLOGIES
Environmental Applications
Introduction
Water quality has a direct impact on the health of all ecosystems, therefore environmental monitoring of water, wastewater and solid wastes for pollutants is an important activity and one that is often subject to strict legislation. ICP-OES is a well established technique that is used as a workhorse in many environmental labs where US Environmental Protection Agency (EPA) methods are run, especially the 200.7 regulation—Determination of Metals and Trace Elements in Water, Solids and Biosolids by ICP-AES. With many hundreds of samples per day to process, many environmental laboratories are constantly looking to improve productivity and reduce operating costs, while maintaining instrument robustness, ease-of-use and analytical performance.
To meet these demands, Agilent has developed the 5100 Synchronous Vertical Dual View (SVDV) ICP-OES, which improves sample throughput by taking a single reading of the vertical plasma for all wavelengths. This leads to faster analysis times and reduced argon consumption. In fact, the 5100 SVDV fitted with next generation of valve technology to optimize the
Ultra-fast determination of trace elements in water, conforming to US EPA 200.7 using the Agilent 5100 Synchronous Vertical Dual View ICP-OESApplication note
Authors
John Cauduro, Andrew Ryan
Agilent Technologies Melbourne, Australia
Environmental
IntroductionWhiskey production is a lucrative global industry that generates billions of dollars of business every year. There are over 20 whiskey producing countries, with Scotland leading the market with Scotch whisky, followed by the US, Canada, Ireland and Japan. Out of the 200+ countries that have developed a taste for whiskey, India consumes the most – more than three times as much as the US. Unsurprisingly, India is beginning to increase its own production of the spirit [1].
With the value of a whiskey highly dependent on type, brand and heritage, quality, age, and legal product definition, producers are keen to establish analytical methods to help them identify the unique aspects of their product and ways to preserve its authenticity against fraudulent practices.
Elemental Profiling of Whiskey using the Agilent 5100/5110 ICP-OES and MPP Chemometrics Software
Authors
Jenny Nelson1, Greg Gilleland1, Helene Hopfer2,3,4,and Susan E. Ebeler2,3,
1. Agilent Technologies, Inc., Santa Clara, CA, USA Application: Food Authenticity
2. Dept. Viticulture & Enology, University of California, Davis, CA, USA
3. Food Safety and Measurement Facility, University of California, Davis, CA, USA
4. Dept. Food Science, The Pennsylvania State University, University Park, PA, USA
Food authenticity
> Return to Table of Contents> Search entire document

17
AGILENT TECHNOLOGIES
Environmental Applications
www.agilent.com/chem/5110icpoes
delivery of the sample to the instrument is up to 55% faster than conventional Dual View (DV) instruments fitted with a valve system. This is due to conventional DV requiring multiple readings (in some cases up to 4 readings) to cover both axial and radial plasma views. Furthermore, the 5100 SVDV uses up to 50% less argon for a comparative EPA 200.7 compliant analysis and, with shorter run times, reduces wear on the sample introduction system (SIS) and torch.
The innovative SVS 2+ Switching Valve System is a 7 port switching valve that is simpler to setup and operate compared to its predecessor and more than doubles the productivity of the 5100 ICP-OES by reducing sample uptake, stabilization times, and rinse delays. The SVS 2+, which can be used with the SPS 3 autosampler, includes a positive displacement pump that rapidly pumps sample through the sample loop and features a bubble injector to help with sample washout.
Agilent has introduced unique Dichroic Spectral Combiner (DSC) technology with the 5100 SVDV ICP-OES so that Easily Ionized Elements (EIE) such as sodium and potassium can be measured radially while other elements are measured axially, allowing % level and ppb level elements to be determined at the same time, in the same reading. The DSC achieves this by combining axial and radial light measurements from the vertical plasma, over the entire wavelength range, in a single measurement that is read by the high speed VistaChip II CCD detector.
The vertical torch position of the 5100 leads to excellent plasma robustness and long term stability, especially for challenging sludge and trade wastes samples that can be run using the 200.7 method. The outcome is a reduced number of reruns of samples and quality control (QC) solutions, resulting in even higher sample throughput.
To keep the operation of the 5100 as simple as possible, the instrument includes a plug-and-play torch that automatically aligns the torch and connects all gases for fast start up while ensuring reproducible loading of the torch from operator-to-operator and lab-to-lab. In addition, software applets that include pre-set method templates e.g. compliant with US EPA 200.7
requirements, can be developed using the ICP Expert software to ensure fast startup with minimal user training.
This note describes the use of the Agilent 5100 SVDV ICP-OES for the ultra-fast determination of trace elements in water CRMs following US EPA method 200.7 guidelines.
Instrumentation
All measurements were performed using an Agilent 5100 SVDV ICP-OES with Dichroic Spectral Combiner (DSC) technology that runs axial and radial view analysis of a vertically orientated plasma at the same time. The sample introduction system consisted of a Seaspray nebulizer, single-pass glass cyclonic spray chamber, white-white pump tubing and a standard 1.8 mm injector torch. The instrument uses a solid-state RF (SSRF) system operating at 27 MHz to deliver a robust plasma capable of excellent long term analytical stability. An SPS 3 autosampler with the SVS 2+ switching valve was used to deliver samples to the instrument. The SPS 3 was setup with a 1.0 mm ID probe. The instrument operating conditions used are listed in Table 1 and SVS 2+ settings are given in Table 2.
Tables 1 and 2 list the operating conditions used for the ICP-OES and the SVS 2+ during this analysis.
Table 1. Agilent 5100 SVDV ICP-OES operating parameters
Parameter Setting
Read time (s) 20
Replicates 2
Sample uptake delay (s) 0
Stabilization time (s) 10
Rinse time (s) 0
Pump Speed (rpm) 12
Fast pump (rpm) Off
RF power (kW) 1.50
Aux flow (L/min) 1.0
Plasma flow (L/min) 12.0
Nebulizer flow (L/min) 0.7
Viewing height (mm) 5
Background Correction Off-Peak
2

18
AGILENT TECHNOLOGIES
Environmental Applications
Table 2. SVS 2+ Switching Valve System settings
Parameter Setting
Sample loop size (mL) 1.0
Loop uptake delay (s) 7.0
Uptake pump speed (rpm) - refill 355
Uptake pump speed (rpm) – move 355
Uptake pump speed (rpm) – inject 100
Time in sample (s) 6.6
Bubble inject time (s) 6.8
Sample and standard preparation
Standards were prepared from single element standards and diluted with 1% HNO3. To validate the method, the following trace metals in drinking water (TMDW) Certified Reference Materials (CRM) were analyzed: TMDW-A, and TMDW-B (High Purity Standards, Charleston, South Carolina, USA).
Interference correction
Environmental samples can contain a wide range of elements at varying concentrations. Inter Element Corrections (IEC) have been established as the preferred correction technique for these spectral interferences in labs running US EPA methods. However, Agilent’s powerful spectral deconvolution Fast Automated Curve-fitting Technique (FACT) can also be used where accepted by local regulators. In this study, IEC factors were setup using the ICP Expert v7 software. Once the factors have been determined, they can be stored in a template and reused in subsequent analyses.
Results and discussion
Linear dynamic range analysis (LDR) The Vista Chip II detector used in the 5100 ICP-OES has the fastest processing speed (1 MHz) of any charge coupled device (CCD) detector used in ICP-OES and provides a full 8 orders of linear dynamic range by reducing the likelihood of pixel saturation and signal over-ranging. The SVDV configuration with its synchronous measurement of axial and radial signals also aids the upper concentration limit for each analyte beyond which results cannot be reported without dilution of the sample. The results in Table 3 show
the excellent upper concentration limit results for Na and K, which are selected by the DSC to be measured from the radial light, and for the elements which are selected by the DSC to be measured from the axial light, in particular Mg, Ca, and Al. The maximum error for each calibration standard within the linear range cannot exceed 10%.
Table 3. Upper concentration limits for the 5100 SVDV ICP-OES. All measurements were determined in a single analytical run
Element LDR (ppm)Ag 328.068 50Al 308.215 200As 188.980 50B 249.772 200Ba 493.409 25Be 313.042 5Ca 315.887 100Cd 226.502 50Ce 413.765 100Co 228.616 100Cr 205.552 50Cu 324.754 100Fe 259.940 50K 766.491 200Li 670.784 20Mg 279.079 500Mn 257.610 10Mo 203.846 100Na 589.592 500Ni 231.604 50P 214.914 500Pb 220.353 200Sb 206.834 200Se 196.026 50Si 251.611 200Sn 189.925 100Sr 421.552 2.5Ti 334.941 25V 292.401 100Zn 213.857 10Tl 190.794 100
3

19
AGILENT TECHNOLOGIES
Environmental Applications
www.agilent.com/chem/5110icpoes
Method detection limits (MDL) The method detection limits (MDL) of each element were determined according to the procedure in EPA Method 200.7 revision 5 (40 CFR, part 136 Appendix B, Section 9.2.1). A standard solution containing analytes at a concentration of 3–5 times the Instrument Detection Limit was measured on three non-consecutive days. Excellent detection limits were obtained for the elements selected by the DSC to be measured in the axial view e.g. As, Pb, and Se. In the same measurement, detection limits for K and Na were equivalent to those from a typical radial measurement.
Table 4. Method detection limits acquired per EPA Method 200.7 guidelines. All MDLs were determined in a single analytical run.
Element MDL (µg/L)Al 308.215 2.8Sb 206.834 3.4As 188.980 3.7Ba 493.409 0.1Be 313.042 0.04B 249.772 0.9Cd 226.502 0.2Ca 315.887 4.7Ce 413.765 3.7Cr 205.552 0.5Co 228.616 0.6Cu 324.754 0.5Fe 259.940 0.5Pb 220.353 1.9Li 670.784 0.1Mg 279.079 4.6Mn 257.610 0.1Mo 203.846 1.2Ni 231.604 0.9P 214.914 8.2K 766.491 21.6Se 196.026 3.2Si 251.611 1.4Ag 328.068 0.4Na 589.592 10.1Sr 421.552 0.1Ti 334.941 0.1Tl 190.794 3.6Sn 189.925 2.5V 292.401 0.4Zn 213.857 0.3
CRM recoveriesTo test the accuracy of the analytical method, two TMDW CRMs were analyzed. The average of 7 analyses of TMDW-A and TMDW-B are shown in Table 5, showing excellent recoveries for all elements, demonstrating the capability of the 5100 SVDV ICP-OES to analyze trace elements in the axial view, while at the same time measuring Na and K at high levels in radial view.
Sample throughputTo analyze the full suite of elements on a conventional DV instrument would require a measurement in the axial view and one in the radial view, whereas it has been demonstrated that this can all be done in one measurement using the 5100 SVDV ICP-OES.
Running the 5100 SVDV method with the SPS 3 and SVS 2+, it was possible to analyze a sample every 58 seconds which equates to an argon consumption of less than 21 L/sample using the operating parameters outlined in Table 1. This allows more samples to be run every day, and also reduces the cost of argon per sample. This equates to a reduction in argon usage of around 50%, compared to a conventional DV system where 2, 3, or even 4 readings of the sample are required to analyze the entire suite of elements.
4

20
AGILENT TECHNOLOGIES
Environmental Applications
Long term stability was determined by running a Instrument Performance Check sample every 10 samples, as specified in the US EPA 200.7 method. The 5100’s plug-and-play vertical torch with Mass Flow Controller control of all plasma gases ensures reproducible torch alignment that contributes to instrument stability over long periods of operation. This is demonstrated in Figure 1, which shows that excellent long term stability was achieved over 12 hours, with all elements having recoveries within ±10% and a %RSD of less than 1.3% over the duration of the worksheet run. Long term stability means that costly quality control (QC) failures and reruns can be minimized.
Figure 1. Long term stability over a 12 hour analysis5
Table 5. Recovery of elements in two trace metals in drinking water CRMs using the 5100 SVDV ICP-OES. All analytes were determined in a single analytical run.
CRM-TMDW-A CRM-TMDW-BElement/ wavelength (nm)
Certified (µg/L)
Measured (µg/L) SD Recovery
(%)Certified (µg/L)
Measured (µg/L) SD Recovery
(%)
Al 308.215 125 131.0 15.7 105 125 125.2 4.8 100Sb 206.834 55 55.7 1.7 101 55 55.3 3.5 100As 188.980 55 58.0 2.3 105 10 10.4 2.7 104Ba 493.409 500 493.9 6.8 99 500 483.3 7.9 97Be 313.042 15 15.0 0.4 100 15 14.9 0.5 100B 249.772 150 152.4 0.8 102 150 151.5 1.3 101Cd 226.502 10 10.0 0.4 100 10 9.9 0.5 99Ca 315.887 31000 31573 423 102 31000 31411 334 101Cr 205.552 20 20.2 0.3 101 20 19.8 0.6 99Co 228.616 25 23.9 0.5 96 25 23.4 0.4 94Cu 324.754 20 18.8 0.1 94 20 19.1 0.3 96Fe 259.940 90 98.0 6.4 109 90 95.1 1.9 106Pb 220.353 20 20.4 1.0 102 20 19.8 0.6 99Li 670.784 15 13.5 0.3 90 15 14.8 0.3 99Mg 279.079 8000 8175 54.8 102 8000 8015 62.3 100Mn 257.610 40 39.5 1.1 99 40 38.4 1.3 96Mo 203.846 110 110.5 1.4 100 110 109.6 0.8 100Ni 231.604 60 64.5 3.6 108 60 59.9 1.3 100K 766.491 2500 2563 19.6 103 2500 2561 35.0 102Se 196.026 11 11.3 1.3 103 11 11.4 1.8 103Ag 328.068 2 1.9 0.2 94 2 1.8 0.2 91Na 589.592 2300 2412 24.9 105 22000 22678 272 103Sr 421.552 300 308.1 5.1 103 300 305.5 4.0 102Tl 190.794 10 10.2 2.0 102 10 9.5 2.2 95V 292.401 35 34.7 0.4 99 35 34.5 0.6 99Zn 213.857 75 78.8 0.4 105 75 77.6 0.6 103
Long term stability

21
AGILENT TECHNOLOGIES
Environmental Applications
www.agilent.com/chem/5110icpoes
www.agilent.com/chemAgilent shall not be liable for errors contained herein or for incidental or consequential
damages in connection with the furnishing, performance or use of this material.
Information, descriptions, and specifications in this publication are subject to change without notice.
© Agilent Technologies, Inc. 2014Published July 1, 2014
Publication number: 5991-4821EN
Conclusions
The Agilent 5100 Synchronous Vertical Dual View (SVDV) ICP-OES, combined with an SPS 3 autosampler and the SVS 2+ switching valve is an ideal instrument to meet the productivity demands of environmental labs working to EPA methodology such as 200.7. The instrumentation achieves an excellent sample-to-sample cycle time of 58 seconds. This enables more samples to be measured each day and reduces argon consumption per sample by 50% per sample.
The 5100 SVDV is up to 55% faster than conventional DV instruments because of the unique ability of the Dichroic Spectral Combiner (DSC) to select and measure axial and radial views of the plasma in one reading rather than the multiple readings required by previous generation DV instruments.
Excellent method detection limits in the µg/L (ppb) range were obtained for all elements in a single run. Good recovery results for 26 elements in two TMDW CRMs were achieved, together with stability better than 1.3% for all elements during a 12 hour period.
The study has shown that the 5100 SVDV ICP-OES delivers accurate results in the quickest possible time.

22
AGILENT TECHNOLOGIES
Speciality chemicalsAGILENT TECHNOLOGIES
Food & Agriculture Applications
Food & Agriculture ApplicationsAccurately quantifying trace metals is not only vital to food safety but can also identify fraudulent mislabeling of a food’s origin, as the metal content can be used to determine provenance.
Quantifying major and minor elements in soils, crops and fertilizers is an important diagnostic agronomy tool.
Here's how Agilent's 5110 ICP-OES instrument addresses the specific needs of agronomy and food labs:
Analysis requirement 5110 offers:
Ease of use for multiple/infrequent operators
Inuitive software, Click-and-Go methods and automatic algorithms to perform background and interference corrections make measuring samples easy. Agilent’s IntelliQuant function gives approximate concentrations of up to 70 elements in a sample from a fast single scan.
High sample throughput Measurement of a sample in less than 30 seconds, with synchronous vertical dual view measurement and the optional fully integrated AVS 6/7 switching valve installed. This is 55% faster than conventional dual view ICP-OES instruments.
Low analysis costs Fast sample analysis reduces gas consumption by up to 50% and low power consumption and low exhaust extraction requirements reduce your energy consumption costs.
Reliable analysis results A cooled cone interface that reduces interferences and a solid state RF system that powers the plasma, delivering long term analytical stability.
Ability to handle high matrix samples
A vertical torch that offers reliable analysis of samples with up to 30% total dissolved solids means less cleaning, less downtime and less replacement torches. The plug-and-play torch design ensures reproducible, optimised torch insertion.
> Return to Table of Contents> Search entire document

23
AGILENT TECHNOLOGIES
Speciality chemicals
www.agilent.com/chem/5110icpoes
AGILENT TECHNOLOGIES
Food & Agriculture Applications
www.agilent.com/chem/5110icpoes
IntroductionTesting of food products for a wide range of elements including nutrients, micronutrients and toxic elements is a widely performed analysis to ensure the quality control of these products.
ICP-OES, with a vapor generation accessory, is often used for the determination of hydride forming elements in foods, resulting in higher performance and lower detection limits than with conventional nebulization. However, analysis of a combination of hydride and non-hydride elements can be time consuming and complex. Elements such as Cd, Cr, Cu, Ni, Fe, Pb and Zn are measured in one analysis using a conventional sample introduction system. Then, hydride forming elements such as As, Se, Hg and Sn are measured in a separate analysis with a
Simultaneous determination of hydride and non-hydride elements in fish samples using the Agilent 5110 SVDV ICP-OES with MSIS accessory
Author
Neli Drvodelic
Agilent Technologies Melbourne, Australia
Application noteFood safety
> Return to Table of Contents> Search entire document

24
AGILENT TECHNOLOGIES
Speciality chemicalsAGILENT TECHNOLOGIES
Food & Agriculture Applications
2
vapor generation accessory installed. For laboratories that routinely analyze both hydride and non-hydride forming elements in samples there is a significant time penalty in switching between the two sample introduction systems.
Agilent’s Multimode Sample Introduction System (MSIS) is a flexible sample introduction system for the determination of hydride and non-hydride elements by ICP-OES. It can be operated in three modes: conventional nebulization mode, vapor generation mode or dual mode. In dual mode both hydride and non-hydride elements can be measured at the same time, eliminating complicated, time consuming sample introduction changeovers without sacrificing sensitivity to reduce instrument downtime.
The Agilent 5110 Synchronous Vertical Dual View (SVDV) ICP-OES is ideal for food testing laboratories, providing accurate results, speed and reduced operating costs. The robust vertically oriented torch, increases matrix handling capabilities, compared to most dual view ICP-OES systems that use a horizontal torch. This means uncompromised measurements with less cleaning, maintenance as well as an extended torch lifetime. The 5110 SVDV ICP-OES features Dichroic Spectral Combiner (DSC) technology that captures the axial and radial views of the plasma in a single read to aid in method development, shorten analysis time and reduce argon gas consumption. This makes the 5110 SVDV ICP-OES an ideal choice for food testing labs that require high throughput and excellent analytical performance without compromise.
To demonstrate the capabilities of the Agilent 5110 SVDV ICP-OES instrument, combined with the MSIS accessory, a range of hydride and non-hydride elements in a fish tissue certified reference material (CRM) were quantified in a single analytical run.
Experimental
InstrumentationAll measurements were performed on an Agilent 5110 Synchronous Vertical Dual View (SVDV) ICP-OES equipped with the Multi-Mode Sample Introduction System (MSIS) accessory and an SPS 4 autosampler. The MSIS was operated in dual mode, with the sample introduction system consisting of a SeaSpray nebulizer and 1.8 mm i.d. injector torch.
Experimental conditions were optimized for the determination of As, Se, Hg, Sn and standard nebulized elements. Instrument and method parameters used are listed in Table 1.
Table 1. Agilent 5110 SVDV ICP-OES instrument operating conditions
Parameter Setting
Read time (s) 20Replicates 3Sample uptake delay (s) 30Stabilization time (s) 25Rinse time (s) 50Pump speed (rpm) 25 (5 channel pump)Fast pump OffRF power (kW) 1.4Plasma flow (L/min) 12Nebulizer flow (L/min) 0.65Auxiliary Flow (L/min) 1Nebulized sample tubing White-whiteHydride sample tubing Black-blackHydride reductant tubing Black-blackBackground Correction Fitted
Sample preparationThe DORM-4 Fish Tissue Certified Reference Material (CRM), from the National Research Council Canada, Ottawa, Ontario, Canada, was used to validate the accuracy and precision of the method. Approximately 0.2 g of the CRM was weighed into a microwave vessel followed by the addition of 2.5 mL HNO3 (69%) and 1 mL H2O2 (>30% w/v). The CRM was digested using a Milestone UltraWAVE Single Reaction Chamber (SRC) microwave digestion system according to the heating conditions given in Table 2. The system serves as both a microwave cavity and reaction vessel, that delivers high temperature capabilities. Sealing of the vials was not required as the Single Reaction Chamber was pressurized using a nitrogen gas pressure of 45 bar, ensuring complete digestion. After microwave digestion, the digested solution was transferred into a 50 mL flask, acidified with 1.25 mL HCl (32%) and diluted to 50 mL with 18.2 MΩ deionized water. This solution was left to sit for at least 30 minutes before analysis. The final acid concentration was 5% HNO3 and 2.5% HCl. In all cases, a corresponding reagent blank was also prepared according to the specified microwave digestion procedure.Table 2. Parameters for Milestone UltraWAVE microwave digestion system
Parameter SettingRamp up time (min) 10Temperature (°C) 200Hold time (min) 10Ramp down time (min) 10Total time (min) 30

25
AGILENT TECHNOLOGIES
Speciality chemicals
www.agilent.com/chem/5110icpoes
AGILENT TECHNOLOGIES
Food & Agriculture Applications
www.agilent.com/chem/5110icpoes
3
nebulized sample and gaseous hydride were carried by argon gas into the plasma.
An additional solution line was added to the MSIS setup for the pre-reduction solution. Mixing of this solution and the sample occurred through a long piece of FEP sample capillary tubing made into a coil to aid with mixing, shown in red in Figure 1, prior to the MSIS spray chamber.
Figure 1. MSIS setup for dual mode, with an in-line pre-reduction mixing solution.
Results and discussion
CRM RecoveriesAll hydride and non-hydride elements in the fish tissue CRM were measured in a single measurement using the MSIS in dual mode. The CRM was measured three times during the analytical sequence and the mean concentration, standard deviation and recovery were calculated for each analyte. Values shown in Table 3 reflect a 250 times dilution of the sample.
The recovery results for hydride forming elements such As, Se and Hg and standard nebulized elements in the fish CRM were within ±10% of the certified value.
Sn and Pb were present in concentrations close to the MDL, so the CRM sample was spiked for those elements to give concentrations of 1 µg/L and 20 µg/L respectively. Table 4 shows the spike recoveries for Sn and Pb in the fish tissue CRM with all measured recoveries within ±10% of the expected values.
The outstanding recovery results demonstrate the ability of the MSIS accessory to measure challenging elements such as As, Se, Hg and Sn by vapor generation in the presence of elements measured using standard nebulization, and achieve excellent recoveries across a wide concentration range. This eliminates the need to swap between different sample introduction systems for the analysis of hydride and non-hydride forming elements, making multi-elemental analysis of food samples quick and simple.
The sample was spiked to validate the method for Sn and Pb, as those elements were present in concentrations close to the MDL. Samples were spiked at concentrations of 1 µg/L for Sn and 20 µg/L for Pb using a 1000 µg/L standard solution.
Calibration standards and reagentsA series of multi-element working standards at 5, 20, 50 and 100 µg/L were prepared from 1000 mg/L single element stock solutions (Merck, UK). Standards were treated in the same manner as the samples, with the addition of the pre-reduction solution (described below). Working standards were prepared in 5% HNO3 and 2.5% HCI.
A mixture of 2% L-Cysteine and 4% Tartaric was used as a pre-reduction solution, added in-line, as shown in Figure 1. To prepare the pre-reduction solution 20 mL of a 10% L-Cysteine solution (in 2% HCl) was added to 4 g Tartaric acid and made up to 100 mL with deionized water.
Sodium borohydride (NaBH4) was used as the reducing agent to generate the gaseous metal hydride. The reductant solution contained 1.5% NaBH4 (w/v) in 0.5% NaOH (w/v), where NaBH4 acted as the reductant and NaOH was used as a stabilizer.
Hydride generation processIn this study the hydride generation process was carried out in two steps: acidification and hydride generation.
The efficiency of the hydride generation reaction depends on the oxidation state of the analyte, where lower oxidation states give more efficient hydride generation. HCl was used to acidify samples and reduce the oxidation state of hydride-forming analytes (as outlined in the sample preparation procedure).
The acidification step was followed by the mixing of the sample with the reductant solution (the NaBH4 and NaOH solution described above). The reaction of NaBH4 with acid produces hydrogen, which forms hydrates with the low oxidation state analytes (for example arsine AsH3 and selenite SeH3).
The hydride generation step was completed with an in-line mixing of a pre-reduction solution containing L-Cysteine and Tartaric acid with the sample. This increased the efficiency of the hydride generation process, increased sensitivity for hydride elements and improved the linearity for conventional nebulized elements, in particular Cu.
The setup of the MSIS used in this application is shown in Figure 1. Dual mode operation required a five channel peristaltic pump for the pre-reduction solution, sample (via conventional nebulization and hydride generation), reductant and waste. All tubing was left unblocked so both the

26
AGILENT TECHNOLOGIES
Speciality chemicalsAGILENT TECHNOLOGIES
Food & Agriculture Applications
4
Table 3. Recoveries for hydride and non-hydride forming elements in DORM-4 Fish Tissue CRM
Element and wavelength (nm)
Certified value
(mg/kg)
Measured result (mg/kg)
Average recovery (%)
As 188.980 6.87±0.44 6.88±0.38 100As 193.696 6.87±0.44 6.84±0.38 100Hg 184.887 0.41±0.036 0.392±0.012 95Hg 194.164 0.41±0.04 0.380±0.007 92Se 196.026 3.45±0.40 3.31±0.22 96Sn 189.925 0.06±0.02 <LOQ -Cd 214.439 0.30±0.02 0.286±0.01 96Cr 267.716 1.87±0.16 1.98±0.08 106Cu 327.395 15.7±0.46 15.0±0.37 96Fe 238.204 343±20 333±17 97Mn 257.610 3.17±0.26 3.07±0.15 97Pb 220.353 0.40±0.062 <LOQ -Ni 231.604 1.34±0.14 1.40±0.08 104Zn 213.857 52.2±3.2 48.9±1.1 94
Table 4. Spike recovery results for Sn and Pb in the DORM-4 Fish Tissue CRM.
Element and wavelength (nm)
Spike conc.
(µg/L)
Sample conc.
(µg/L)
Measured spike conc.
(µg/L)
SD (µg/L)
Spike recovery
(%)
Sn 189.925 1.0 0.50 1.48 0.021 98Pb 220.353 20 0.40 21.6 0.068 106
Method Detection Limits (MDL)Three sigma Method Detection Limits (MDL) were calculated from ten replicate readings of the blank solution using a 20 second read time. The MDLs achieved for this method were more than sufficient for the simultaneous determination of hydride and non-hydride elements, and could be further improved by adjusting the chemistry for each individual element.
The MDL was measured three times over 3 non-consecutive days with results shown in Table 5. Excellent MDLs were obtained for all wavelengths.
The results demonstrate the high sensitivity of the 5110 ICP-OES with MSIS accessory for measuring hydride forming elements such as As, Se, Hg and Sn at low levels when measuring non-hydride forming elements at the same time.
Table 5. Agilent 5110 ICP-OES SVDV ICP-OES Method Detection Limits for hydride and non-hydride elements using the MSIS in dual mode
Element and wavelength (nm)
MDL (µg/L)
As 193.696 0.17As 188.980 0.14Hg 194.164 0.01Hg 184.887 0.08Se 196.026 0.42Sn 189.925 0.10Cd 214.439 0.09Cr 267.716 0.29Cu 327.395 0.34Fe 238.204 0.24Mn 257.610 0.03Ni 231.604 0.97Pb 220.834 0.98Zn 213.857 0.26
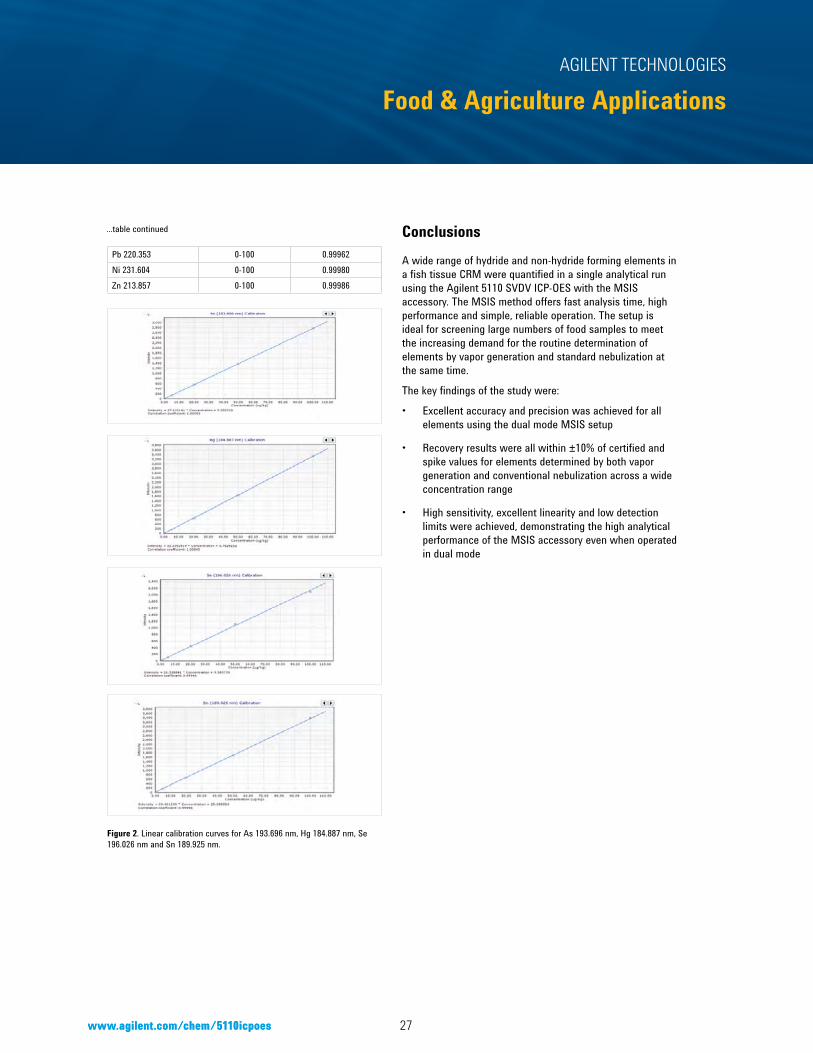
Linear dynamic rangeCalibration curves for all elements were linear with a correlation coefficient greater than 0.999 and less than 10% calibration error on each calibration point. Table 6 summarizes the calibration standard concentration range for all elements, and the achieved correlation coefficients. Figure 2 displays the calibration curves for As, Hg, Se and Sn. These demonstrate the ability of the 5110 ICP-OES, with MSIS accessory, to achieve excellent linearity across a wide calibration range for both hydride and non-hydride elements.Table 6. Calibration range and correlation coefficient achieved for hydride and non-hydride elements using the MSIS in dual mode.
Element and wavelength(nm)
Standard conc. range (µg/L)
Linear correlation coefficient
(r)
As 188.980 0-100 0.99978
As 193.696 0-100 1.00000Hg 184.887 0-100 1.00000Hg 194.164 0-100 0.99994Se 196.026 0-100 0.99946Sn 189.925 0-100 0.99998Cd 214.439 0-100 0.99994Cr 267.716 0-100 0.99987Cu 327.395 0-100 0.99969Fe 238.204 0-100 0.99988Mn 257.610 0-100 0.99984
table continues...
27
AGILENT TECHNOLOGIES
Speciality chemicals
www.agilent.com/chem/5110icpoes
AGILENT TECHNOLOGIES
Food & Agriculture Applications
www.agilent.com/chem/5110icpoes
5
Pb 220.353 0-100 0.99962Ni 231.604 0-100 0.99980Zn 213.857 0-100 0.99986
Figure 2. Linear calibration curves for As 193.696 nm, Hg 184.887 nm, Se 196.026 nm and Sn 189.925 nm.
ConclusionsA wide range of hydride and non-hydride forming elements in a fish tissue CRM were quantified in a single analytical run using the Agilent 5110 SVDV ICP-OES with the MSIS accessory. The MSIS method offers fast analysis time, high performance and simple, reliable operation. The setup is ideal for screening large numbers of food samples to meet the increasing demand for the routine determination of elements by vapor generation and standard nebulization at the same time.
The key findings of the study were:
• Excellent accuracy and precision was achieved for all elements using the dual mode MSIS setup
• Recovery results were all within ±10% of certified and spike values for elements determined by both vapor generation and conventional nebulization across a wide concentration range
• High sensitivity, excellent linearity and low detection limits were achieved, demonstrating the high analytical performance of the MSIS accessory even when operated in dual mode
...table continued
28
AGILENT TECHNOLOGIES
Speciality chemicalsAGILENT TECHNOLOGIES
Food & Agriculture Applications
IntroductionWhiskey production is a lucrative global industry that generates billions of dollars of business every year. There are over 20 whiskey producing countries, with Scotland leading the market with Scotch whisky, followed by the US, Canada, Ireland and Japan. Out of the 200+ countries that have developed a taste for whiskey, India consumes the most – more than three times as much as the US. Unsurprisingly, India is beginning to increase its own production of the spirit [1].
With the value of a whiskey highly dependent on type, brand and heritage, quality, age, and legal product definition, producers are keen to establish analytical methods to help them identify the unique aspects of their product and ways to preserve its authenticity against fraudulent practices.
Elemental Profiling of Whiskey using the Agilent 5100/5110 ICP-OES and MPP Chemometrics Software
Authors
Jenny Nelson1, Greg Gilleland1, Helene Hopfer2,3,4,and Susan E. Ebeler2,3,
1. Agilent Technologies, Inc., Santa Clara, CA, USA Application: Food Authenticity
2. Dept. Viticulture & Enology, University of California, Davis, CA, USA
3. Food Safety and Measurement Facility, University of California, Davis, CA, USA
4. Dept. Food Science, The Pennsylvania State University, University Park, PA, USA
Food authenticity
> Return to Table of Contents> Search entire document

29
AGILENT TECHNOLOGIES
Speciality chemicals
www.agilent.com/chem/5110icpoes
AGILENT TECHNOLOGIES
Food & Agriculture Applications
www.agilent.com/chem/5110icpoes
2
Elemental profiling of wines and spirits using an atomic spectroscopy analytical technique is widely used to discriminate between different foods and beverages, as the elements present in the product will vary depending on geography, raw materials, production methods, storage etc.
Due to its high sensitivity and wide multi-element coverage, ICP-MS has been used successfully to profile the elemental composition of other alcoholic beverages such as wine [2] and to differentiate wines due to geographical origin as well as processing site [3, 4]. Microwave Plasma-Atomic Emission Spectroscopy (MP-AES) has also been used to profile wine using a few target elements [5].
In this study, the suitability of the Agilent 5100 Synchronous Vertical Dual View (SVDV) ICP-OES to profile six different whiskey types was investigated. Agilent’s Mass Profiler Professional (MPP) software was also utilized to analyze the results. MPP enables the user to display the data in different ways, making it easier to compare and interpret the results. Data provided by Agilent’s 5100/5110 ICP-OES series instruments is suitable for use with MPP. This application is also applicable to Agilent’s 5110 ICP-OES.
Experimental
InstrumentationAll measurements were carried out using the Agilent 5100 SVDV ICP-OES equipped with a Dichroic Spectral Combiner (DSC). The DSC allows both axial and radial view emissions from the plasma to be measured at the same time, in a single reading, over the entire wavelength range. The 5100 ICP-OES uses a vertically orientated torch and a solid-state RF (SSRF) system operating at 27 MHz to deliver a plasma with the stability and robustness necessary for the analysis of organic samples. To maintain full user flexibility, the 5100 SVDV ICP-OES can also be operated in Vertical Dual View (VDV) mode, dedicated Radial View (RV) and dedicated Axial View (AV). The latter mode was selected in this study as only trace level elements were of interest.
The Agilent 5100 SVDV ICP-OES was fitted with a standard sample introduction system comprising a glass concentric nebulizer, 1.8 mm torch injector and a glass, single-pass cyclonic spray chamber. Sample delivery was via an Agilent SPS 3 autosampler. Instrument operating conditions are listed in Table 1.
Table 1. Agilent 5100 ICP-OES operating parameters
Parameter Setting
RF power (kW) 1.20Aux gas flow (L/min) 1.00Plasma flow (L/min) 12.0Nebulizer flow (L/min) 0.70Ar/O2 addition nonePump speed (rpm) 12Uptake delay (s) 25 (Fast pump ON)Rinse time (s) 30 (Fast pump ON)Stabilization time (s) 15Read time (s) 20Number of replicates 3Viewing mode AxialSample pump tubing Black/BlackWaste pump tubing Blue/BlueBackground correction Fitted
Samples and standardsDetails of the sixty-nine commercial whiskey products used in this study are listed in Table 2, including 16 Bourbons, 8 Irish, 9 Japanese, 1 Rye, 33 Scotch and 2 Tennessee. All samples were prepared in triplicate, diluted 20-fold in 1% (v/v) nitric acid and 0.5% (v/v) hydrochloric acid to decrease the ethanol level to 2%.
Multi-element calibration standards (SPEX CertiPrep, Metuchen, NJ, USA) were used to prepare six-point calibration curves for all elements listed in Table 3 between 0 and 1000 µg/L. All standards were matrix-matched (1% HNO3, 0.5% HCl, 2% ethanol, all (v/v)) to account for the sample dilution and matrix interferences. Each element was analyzed in triplicate.

30
AGILENT TECHNOLOGIES
Speciality chemicalsAGILENT TECHNOLOGIES
Food & Agriculture Applications
3
Results and discussion
Calibration linearityAll elements showed excellent linearity of their calibration curves with correlation coefficients between 0.999 and 1.000. Representative calibration curves are presented in Figure 1. The plots for Cu, Mg and Zn show excellent linearity across the calibrated range, with correlation coefficients of 0.99999, 0.99995 and 1.00000, respectively.
Figure 1. Calibration curves for Cu, Mg and Zn using ICP-OES
Table 2. The 69 whiskey samples, including code, age (if known), and proof. Products from the same distillery are indicated. Regions indicated in brackets in the Distillery column of the table for the 33 Scotch whiskies.
Code1 Age2 Proof Distillery Code1 Age2 Proof Distillery Code1 Age Proof Distillery3 Code1 Age Proof Distillery3
B1 7 107 D1 R1 12 80 D16 S1 10 86 D17 (A) S19 12 86 D28 (C)B2 8 80 D1 I1 N.A. 80 D9 S2 10 92 D18 (B) S20 12 86 D29 (D)B3 N.A. 90 D2 I2 N.A. 80 D10 S3 12 80 D19 (C) S21 10 80 D30 (D)B4 N.A. 100 D2 I3 N.A. 80 D11 S4 18 86 D19 (C) S22 12 80 D31 (A)B5 10 90 D2 I4 8 80 D12 S5 27 116 D19 (C) S23 18 86 D31 (A)B6 N.A. 86.6 D2 I5 N.A. 80 D12 S6 12 92.6 D20 (B) S24 10 80 D32 (A)B7 N.A. 100 D3 I6 12 115 D13 S7 12 86 D21 (B) S25 16 80 D32 (A)B8 12 86 D1 I7 15 92 D13 S8 N.A. 88 D22 (D) S26 16 86 D33 (B)B9 N.A. 101 D4 I8 12 92 D13 S9 10 80 D23 (D) S27 10 80 D34 (B)B10 N.A. 90 D5 J1 12 86 D14 S10 10 80 D23 (D) S28 15 86 D34 (B)B11 9 100 D1 J2 12 86 D14 S11 12 80 D24(E) S29 12 80 D35 (E)B12 N.A. 114 D4 J3 N.A. 96 D15 S12 15 92 D24 (E) S30 12 80 D36 (D)B13 N.A. 90.2 D6 J4 N.A. 110 D15 S13 12 80 D25 (E) S31 16 80 D37 (A)B14 N.A. 90.4 D7 J5 10 90 D16 S14 10 80 D26 (E) S32 15 92 D38 (F)B15 12 90 D2 J6 12 90 D16 S15 15 92 D26 (E) S33 10 86 D30 (D)B16 N.A. 113 D8 J7 N.A. 80 D16 S16 21 86 D26 (E) T1 N.A. 90 D39
J8 17 86 D16 S17 12 80 D27 (E) T2 N.A. 80 D40 J9 12 80 D16 S18 15 80 D27 (E)
1Whiskeys are coded by type: B (Bourbon), I (Irish), J (Japanese), R (Rye), S (Scotch), T (Tennessee). 2N.A =Not available. 3Scotch regions: A (Island); B (Islay); C (Lowland); D (Highland); E (Speyside); F (Campbeltown).

31
AGILENT TECHNOLOGIES
Speciality chemicals
www.agilent.com/chem/5110icpoes
AGILENT TECHNOLOGIES
Food & Agriculture Applications
www.agilent.com/chem/5110icpoes
4
Method detection limits (MDLs) MDLs were calculated as 3 times the standard deviation of ten replicate measurements of the calibration blank using the 5100 operating in axial view mode.
The MDLs and minimum/maximum range analyzed for each element are shown in Table 3.
Table 3. Method detection limits (MDL) and Min-Max concentration (µg/L) for the 69 whiskey samples tested.
Element & wavelength
(nm)
MDL (µg/L)
Min-Max (µg/L)
Element & wavelength
(nm)
MDL (µg/L)
Min-Max (µg/L)
Ag 328.068 0.17 <MDL Mn 257.610 0.04 0.74 - 203.0Al 396.152 0.55 <DL - 1066 Mo 202.032 1.81 < MDLAs 193.696 5.37 < MDL Na 588.995 2.29 440.09 - 25625B 249.772 0.23 17.63 - 501.5 Ni 231.604 2.02 <DL - 0.00Ba 455.403 0.11 1.13 - 159 Pb 220.353 1.96 <DL - 0.00Be 313.042 0.04 < MDL Rb 421.552 0.03 1.45 - 57.62Ca 396.847 0.03 246.54 - 9292 Se 196.026 8.86 < MDLCd 214.439 0.14 19.54 - 19.54 Si 251.611 2.09 189.02 - 19253Co 238.892 0.99 < MDL Sr 407.771 0.02 1.85 - 56.98Cr 267.716 0.26 3.63 - 49.21 Ti 336.122 1.31 <MDL
Cu 327.395 0.23 20.58 - 2448 Tl 190.794 3.49 <MDL
Fe 238.204 0.20 3.61 - 753.9 V 292.401 0.46 <MDL
K 766.491 4.02 3524 - 47154 Zn 213.857 0.22 6.94 - 820.4Mg 279.553 0.02 12.58 - 5016
QC spike recoveriesA Quality Control (QC) sample was prepared by spiking 3 whiskey samples (S27, J4 and S2), each in triplicate, with the 5 µg/L calibration standard. To check the validity of the
method throughout the analytical cycle, a CCB and CCV (200 ppb) sample was analyzed every 10 samples. All mean recoveries were within ± 10% of the expected CCV value. The results are given in Table 4.
Table 4. Mean spike recoveries of 5 µg/L spiked QC sample in whiskey samples (n=3).
Element & wavelength
(nm)
Spike (µg/L)
Mean recovery + 1σ (%)
(n=3)
Recovery range (%)
Element & wavelength
(nm)
Spike (µg/L)
Mean recovery + 1σ (%)
(n=3)
Recovery range (%)
Al 396.152 5 101 ± 1 100-103 Mo 202.032 5 100 ± 2 98-101As 193.696 5 108 ± 2 106-109 Na 588.995 5 105 ± 10 98-112B 249.772 5 99 ± 2 98-101 Ni 231.604 5 99 ± 1 98-100Ba 455.403 5 100 ± 1 99-102 Pb 220.353 5 98 ± 2 96-100Be 313.042 5 108 ± 1 107-110 Rb 421.552 5 101 ± 1 100-102
Ca 396.847 5 97 ± 5 93-102 Se 196.026 5 105 ± 0 105-105
Cd 214.439 5 99 ± 1 98-100 Si 251.611 5 95 ± 5 90-101Co 238.892 5 98 ± 1 97-99 Sr 407.771 5 100 ± 1 99-101Cr 267.716 5 98 ± 1 97-100 Ti 336.122 5 100 ± 1 99-101Cu 327.395 5 100 ± 2 99-103 Tl 190.794 5 92 ± 9 99-101Fe 238.204 5 99 ± 1 97-100 V 292.401 5 101 ± 1 100-102Mg 279.553 5 98 ± 6 91-104 Zn 213.857 5 98 ± 1 97-99Mn 257.610 5 105 ± 0 105-105

32
AGILENT TECHNOLOGIES
Speciality chemicalsAGILENT TECHNOLOGIES
Food & Agriculture Applications
5
Data analysis using Mass Profiler ProfessionalAll of the 69 whiskeys were analyzed and the exploratory data analysis was completed using Agilent’s Mass Profiler Professional (MPP) software. The resultant box-whisker plots based on the full data set are given in Figure 2.
Slight differences in each plot can be noted. This suggests that the element profiles of whiskeys can be used to distinguish samples based on the age, type, and region of the sample. If more elements are analyzed in the future, greater separation between the samples would be apparent.
Figure 2. Agilent MPP box-whisker plots using the Agilent 5100 ICP-OES data and organizing by (a) age, (b) type and (c) region (Scotch whiskies).

33
AGILENT TECHNOLOGIES
Speciality chemicals
www.agilent.com/chem/5110icpoes
AGILENT TECHNOLOGIES
Food & Agriculture Applications
www.agilent.com/chem/5110icpoes
6
Table 5. Averaged data set for the elemental content of the different whiskey types using the Agilent 5100 ICP-OES
Element & wavelength (nm)
Bourbon (n=16) (µg/L).
Irish (n=8) (µg/L).
Japanese (n=9) (µg/L).
Scotch (n=33) (µg/L).
Tennessee (n=2) (µg/L).
Al 396.152 61.65 53.59 77.83 167.4 63.03
B 249.772 119.8 82.85 117.1 145.5 123.4
Ba 455.403 12.60 11.19 3.13 10.88 9.26
Ca 396.847 1213 1040 1055 2085 1320
Cd 214.439 <MDL <MDL <MDL 19.54 <MDL
Cr 267.716 <MDL 7.83 <MDL 21.42 <MDL
Cu 327.395 225.06 62.32 793.1 610.9 44.85
Fe 238.204 65.36 63.97 235.9 181.7 61.14
K 766.491 1707 8291 20508 18687 16170
Mg 279.553 530.97 271.92 926.32 1104.40 322.64
Mn 257.610 51.76 20.92 42.21 51.74 22.68
Na 588.995 6048 9305 13245 9532 8233
Rb 421.552 9.43 4.45 6.79 12.27 5.61
Si 251.611 932.2 816.6 6512 1404 1094
Sr 407.771 9.52 4.53 6.99 12.28 5.66
Zn 213.857 175.2 89.49 137.2 44.34 296.0
Many whiskey producers use copper stills for distillation, especially of premium-branded spirits. Producers that use stainless steel stills will add a copper mesh lining or column. The reason Cu is so important in the distillary process is its positive effect on the aroma (and quality) of the whiskey by preventing the formation of potentially-odorous sulfur compounds [6]. The data in Table 5 shows some variation in the average Cu value in the different types of whiskeys. This is most likely the result of different processing equipment rather than raw materials [7].
Principal Component AnalysisUsing MPP, all significantly different elements (P value < 0.05) were used in a Principal Component Analysis (PCA) to test whether different whiskey types could be separated based on their elemental profiles. Using the concentration data (Table 5) for the significantly different elements (Al, Ba, Ca, Cu, Fe, K, Mg, Mn, Na, Rb, Si, Sr and Zn), a graphical representation of the sample similarities and dissimilarities was obtained, as shown in Figure 3. Within the first two principal components (PC1 and PC2) over 57% of the total variance was explained, with 43.38% in the first dimension and an additional 13.68% in the second dimension. Although there is overlap between the whiskey samples, separations can also be seen. Looking at the overlaid loading plot with the elements, it becomes apparent which elements drive the
separation between the different types in the first and second dimension.
Along PC 1, the most discriminating elements were Ba, Na, Mg, Sr, Rb. Along the second dimension, PC 2, the Bourbon whiskeys were mostly separated from Irish whiskies, with the other whiskey samples in between. The separation is mainly driven by higher concentrations of Na, Al versus K, Mg and Mn. All the other elements are within ±1 of the origin of the y-axis.
Figure 3. PCA plot showing the separation of different whiskeys by their elemental composition: the PCA score plot and PCA loading plot are overlaid to show the contribution of each element to the separation along PC 1 (43.38%) and PC 2 (13.68%). Each of the 5 different types (averaged), are coded by their type (Green…Tennessee; Blue…Irish; Red…Bourbon; Gray…Scotch; Brown…Japanese).
34
AGILENT TECHNOLOGIES
Speciality chemicalsAGILENT TECHNOLOGIES
Food & Agriculture Applications
www.agilent.com/chemAgilent shall not be liable for errors contained herein or for
incidental or consequential damages in connection with the furnishing, performance or use of this material.
Information, descriptions, and specifications in this publication are subject to change without notice.
© Agilent Technologies, Inc. 2017Published February 27, 2017
Publication number: 5991-7858EN
ConclusionsThe Agilent 5100/5110 ICP-OES combined with a powerful data analysis package such as Agilent’s Mass Profiler Professional (MPP) is a viable tool for elemental profiling of whiskey. Elemental differences are mainly due to processing equipment and raw materials, such as water. The method showed there is sufficient spread in the data from the analysis of the 69 whiskeys, with differences in several elements to distinguish between 5 types of whiskey.
Cooperation and collaboration with the industry is needed to determine the direction of future research in product differentiation and authentication using elemental fingerprinting techniques.
References1. https://www.whiskyinvestdirect.com/about-whisky/world-whiskies
2. Heymann, H.; Robinson, A. L.; Buscema, F.; Stoumen, M. E.; King, E. S.; Hopfer, H.; Boulton, R. B.; Ebeler, S. E. Effect of Region on the Volatile Composition and Sensory Profiles of Malbec and Cabernet Sauvignon Wines. In Advances in Wine Research; Ebeler, S. E., Ed.; American Chemical Society: Washington, DC, USA, 2015; pp. 109–122.
3. Hopfer, H.; Gilleland, G.; Ebeler, S.E.; Nelson, J. Elemental Profiles of Whisk(e)y Allow Differentiation by Type and Region. Beverages, 2017, 3, 8.
4. Hopfer, H.; Nelson, J.; Collins, T. S.; Heymann, H.; Ebeler, S. E. The combined impact of vineyard origin and processing winery on the elemental profile of red wines. Food Chem. 2015, 172, 486–496.
5. Nelson, J.; Hopfer, H.; Gilleland, G.; Cuthbertson, D.; Boulton, R. B.; Ebeler, S. E. Elemental Profiling of Malbec Wines under Controlled Conditions Using Microwave Plasma-Atomic Emission Spectroscopy. Am. J. Enol. Vitic. 2015, 66, 373–378.
6. Harrison, B.; Fagnen, O.; Jack, F.; Brosnan, J. The Ipact of Copper in Different Parts of Malt Whisky Pot Stills on New Make Spirit Composition and Aroma. J. Ind. Microbiol. Biotechnol. 2011, 117, 106–112.
7. Ibanez, J. G.; Carreon-Alvarez, A.; Barcena-Soto, M.; Casillas, N. Metals in alcoholic beverages: A review of sources, effects, concentrations, removal, speciation, and analysis. J. Food Compos. Anal. 2008, 21, 672–683.

35
AGILENT TECHNOLOGIES
Speciality chemicals
www.agilent.com/chem/5110icpoes
AGILENT TECHNOLOGIES
Food & Agriculture Applications
www.agilent.com/chem/5110icpoes
Introduction
Laboratories are constantly looking to improve productivity and reduce operating costs by increasing sample throughput and minimizing overheads. Agricultural labs typically deal with high quantities of samples, however, higher analysis speeds normally create some sort of analytical compromise, such as reduced precision.
The Agilent 5110 ICP-OES, combined with the fully integrated Advanced Valve System (AVS) [1], does not compromise speed or precision. It is designed to deliver faster, cost effective and simpler sample analysis and is ideal for high throughput labs.
Ultra-high speed analysis of soil extracts using an Advanced Valve System installed on an Agilent 5110 SVDV ICP-OESApplication note
Authors
John Cauduro Agilent Technologies, Melbourne, Australia
Food safety and agriculture
> Return to Table of Contents> Search entire document

36
AGILENT TECHNOLOGIES
Speciality chemicalsAGILENT TECHNOLOGIES
Food & Agriculture Applications
2
The AVS combined with the 5110’s Synchronous Vertical Dual View (SVDV) capability and Vista chip II detector covering all wavelengths in a single reading, allows the analysis of samples at ultra-high speeds, without compromising performance. This high speed sample throughput equates to a low cost-per-analysis, as shorter analysis times per sample results in less argon usage.
The Agilent Advanced Valve System (AVS 6/7) provides:
• Ease-of-use: the AVS is easy to setup and use as it is fully integrated within the ICP-OES hardware and controlled through the ICP Expert software. The ICP Expert software incorporates an AVS parameter calculator to assist with setup and method development. The AVS is designed for simple assembly and disassembly, facilitating simple routine maintenance, maximizing instrument up time.
• Uncompromising performance: Controlled bubble injection reduces sample uptake, stabilization times, and rinse delays to deliver the highest analytical precision.
• Speed: The robust high speed positive displacement pump also decreases uptake time, ensuring the sample loop can be filled quickly and effectively. A pre-emptive rinse means the autosampler probe moves while the loop is still filling. This starts autosampler probe rinse and valve rinse before the sample is even injected and decreases the total run time.
This application note describes the ultra-high speed analysis of micronutrients Cu, Fe, Mn, Zn, Co, Ni and heavy metals Cd and Pb in a DTPA extracted soil sample using the Agilent 5110 Synchronous Vertical Dual View (SVDV) ICP-OES fitted with an integrated Advanced Valve System (AVS 6) six port switching valve, based on another 5110 ICP-OES DTPA application method [2].
ExperimentalInstrumentationAll measurements were performed using an Agilent 5110 SVDV ICP-OES fitted with an AVS 6 port valve and configured with an SPS 4 autosampler. The sample introduction system consisted of a SeaSpray nebulizer, double-pass cyclonic spray chamber and a 1.8 mm i.d injector torch. Tables 1 and 2 list the operating conditions used for the ICP-OES and the AVS 6 (Figure 1).
Figure 1. The Agilent Advanced Valve System (AVS) six port valve
Table 1. Agilent 5110 SVDV ICP-OES instrument and method parameters
Parameter Setting
Replicates 1Pump speed 25 rpmRead time 1 sRinse time 0 sRF power 1.20 kWStabilization time 2 sViewing mode SVDVViewing height 8 mmNebulizer flow 0.70 L/minPlasma flow 12.0 L/minAux flow 1.0 L/minSPS 4 autosampler rinse pump control speed Fast

37
AGILENT TECHNOLOGIES
Speciality chemicals
www.agilent.com/chem/5110icpoes
AGILENT TECHNOLOGIES
Food & Agriculture Applications
www.agilent.com/chem/5110icpoes
3
Table 2. Agilent AVS 6 settings
Parameter Setting
Loop volume 0.25 mLPump rate: Valve uptake 40 mL/minPump rate: Inject 28 mL/minValve uptake delay 2.6 sBubble injection time 2.6 sPreemptive rinse time 1.0 s
Sample preparationThe procedure used to prepare the soil samples for analysis is typical for DTPA extraction and is described in a previous study [2].
Results and discussion
Stability The stability of the Agilent 5110 SVDV ICP-OES with integrated AVS 6 and SPS 4 autosampler was evaluated by analyzing a DTPA soil extract solution 120 times. Good precision was obtained, with all elements achieving < 3.4 %RSD over the duration of the run (Table 3 and Figure 2).
Table 3. Precision data for the repeated (n=120) measurement of 8 elements in a soil extract
Results Cd 214.439 nm
Co 228.615 nm
Cu 324.754 nm
Fe 234.350 nm
Mn 293.305 nm
Ni 231.604 nm
Pb 220.353 nm
Zn 213.857 nm
Mean (mg/L) 0.021 0.135 1.29 18.6 1.42 0.175 0.811 0.254
%RSD 3.06 2.35 2.27 1.70 2.03 3.36 3.06 1.94
Figure 2. Stability plot from the repeated (n=120) measurement of 8 elements in a DTPA soil extract using a 5110 SVDV ICP-OES with AVS 6

38
AGILENT TECHNOLOGIES
Speciality chemicalsAGILENT TECHNOLOGIES
Food & Agriculture Applications
www.agilent.com/chemAgilent shall not be liable for errors contained herein or for incidental or consequential
damages in connection with the furnishing, performance or use of this material.
Information, descriptions, and specifications in this publication are subject to change without notice.
© Agilent Technologies, Inc. 2016Published May 1st 2016
Publication number: 5991-6853EN
Sample time and argon usageThe 5110 with AVS 6 analyzed 120 samples and 6 standards in under 25 minutes. This equates to an average sample-to-sample run time of 11.7 seconds and an Ar consumption of only 3.4 L. Since only 1 mL of sample was used, the need for multiple extractions was avoided. This is ideal for hydroscopic soil samples, which supply very little extract. Furthermore, such efficient analysis of complex matrices extends the life of consumable items, further reducing operating costs.
Conclusions
Agilent’s 5110 SVDV ICP-OES with its vertical torch not only provides the robustness required for the determination of DTPA extracted soil samples over long sampling periods but delivers exceptionally fast analysis times, without any compromise in analytical performance.
When fitted with a fully integrated AVS and the use of an SPS 4 autosampler the 5110 was able to achieve:
• Very fast analysis times with an average of 11.7 seconds per sample.
• Excellent precision with < 3.4 % RSD for all elements over the duration of a 120 sample analytical run.
• Very low Ar consumption of < 3.4 L/sample.
By significantly improving sample analysis times, the 5110 SVDV ICP-OES fitted with AVS and SPS 4 autosampler cuts the cost-per-analysis which is an important consideration of high throughput labs.
References
1. AVS technical overview, Agilent publication, 2016, 5991-6863EN
2. Elizabeth Kulikov, Determination of elemental nutrients in DTPA extracted soil using the Agilent 5110 SVDV ICP-OES, Agilent publication, 2016, 55991-6854EN

39
AGILENT TECHNOLOGIES
Speciality chemicals
www.agilent.com/chem/5110icpoes
AGILENT TECHNOLOGIES
Food & Agriculture Applications
www.agilent.com/chem/5110icpoes
Introduction
The elemental content of soils can impact plant development and crop yields as well as the safety of plant-based produce. Consequently, soil testing of micronutrients is commonly conducted to assess soil fertility, while heavy metals are analyzed to identify any potential toxicity issues.
Depending on the elements of interest in soils, different extraction methods and analytical techniques are employed. Soil extracting solutions containing chelating agents such as diethylenetriaminepentaacetic acid (DTPA) are often used for the extraction of micronutrients.
Determination of elemental nutrients in DTPA extracted soil using the Agilent 5110 SVDV ICP-OES
Application note
Authors
Elizabeth Kulikov, Agilent Technologies, Australia
Food safety and Agriculture
> Return to Table of Contents> Search entire document

40
AGILENT TECHNOLOGIES
Speciality chemicalsAGILENT TECHNOLOGIES
Food & Agriculture Applications
2
The extracted solutions are commonly analyzed by Inductively Coupled Plasma Optical Emission Spectroscopy (ICP-OES) because the technique provides low cost of analysis and the wide concentration ranges required for soil testing, making it ideal for high throughput agricultural labs.
Radial View (RV) ICP-OES instruments are typically used for the analysis of agricultural samples due to the robustness of the vertical torch. However, sensitivity is compromised leading to higher detection limits. In contrast, the Agilent 5110 Synchronous Vertical Dual View (SVDV) ICP-OES features an axially-viewed, vertically-oriented plasma. This is ideal for complex agricultural samples such as soils, as SVDV ICP-OES provides much lower detection limits than RV ICP-OES.
The Agilent 5110 SVDV ICP-OES provides:
• Stability: the 5110’s solid state radio frequency (SSRF) system operates at 27 MHz, providing a robust and stable plasma capable of handling a wide range of samples, including complex matrices such as DTPA. The SSRF adjusts to rapid changes in the plasma, even when the sample uptake speed is increased via fast pumping to 80 rpm. This allows the same plasma gas flow rate to be used, regardless of sample type, accelerating method development by simplifying analytical parameter settings.
• Simplicity: the intuitive Agilent ICP Expert software has a familiar worksheet interface for easy method development.
• Speed and performance: SVDV with Dichroic Spectral Combiner (DSC) technology captures the axial and radial viewings of the plasma in one reading. The Vista Chip II CCD detector measures all wavelengths in a single reading, providing higher precision, shorter analysis time and less argon consumption per sample. Overall, the 5110 ICP-OES delivers fast warm-up, high throughput, high sensitivity, and the largest dynamic range.
• Reliability: the 5110 ICP-OES features a vertical plug-and-play torch allowing measurement of the most challenging matrices. The quick and simple torch loader mechanism automatically aligns the torch and connects gases for fast startup and reproducible, consistent performance, irrespective of the operator.
• Flexibility: for high throughput applications, a fully integrated Advanced Valve System (AVS 6/7) six or seven port switching valve can be easily added into the 5110 ICP-OES.[1]
This application note describes the determination of micronutrients Cu, Fe, Mn, Zn, Co, Ni and heavy metals Cd and Pb in a DTPA extracted soil sample using the Agilent 5110 ICP-OES. For comparison purposes of sample analysis time and argon gas consumption, results were also obtained using the 5110 ICP-OES fitted with the integrated Advanced Valve System (AVS 6) six port switching valve.
Experimental
InstrumentationAll measurements were performed using an Agilent 5110 SVDV ICP-OES configured with an SPS 4 autosampler. The sample introduction system consisted of a SeaSpray nebulizer, double-pass cyclonic spray chamber and a 1.8 mm i.d injector torch. Instrument method parameters and analyte settings are listed in Table 1.

41
AGILENT TECHNOLOGIES
Speciality chemicals
www.agilent.com/chem/5110icpoes
AGILENT TECHNOLOGIES
Food & Agriculture Applications
www.agilent.com/chem/5110icpoes
3
Table 1. Agilent 5110 SVDV ICP-OES instrument and method parameters
Parameter Setting
Element Cu Fe Mn Zn Cd Co Ni Pb
Wavelength (nm) 324.754 234.350 293.305 213.857 214.439 228.615 231.604 220.353
Nebulizer SeaSpray
Nebulizer flow rate 0.7 L/min
Spray chamber Double-pass cyclonic
Pump speed 12 rpm
Sample pump tubing White-white
Waste pump tubing Blue-blue
RF power 1.20 kW
Plasma flow 12 L/min
Aux flow 1.0 L/min
Torch Demountable DV 1.8 mm i.d injector
Viewing height 8 mm
Read time 5 s
Number of replicates 3
Sample uptake delay 15 s
Rinse time 5 s
Stabilization time 15 s
Background correction Fitted
SamplesSoil samples were supplied dried and ground.
Sample preparation and calibrationDTPA extraction solution: the extraction solution comprised 0.005 M diethylenetriaminepentaacetic acid (DTPA), 0.01 M calcium chloride dihydrate (CaCl2.2H2O) and 0.1 M triethanolamine (TEA). 1.97 g of DTPA, 1.47 g CaCl2.2H2O and 14.92 g TEA were dissolved separately in deionized water and then combined. The pH was adjusted to 7.3 using concentrated HCl and the volume made up to 1 L with distilled water.
Sample extraction: 10 g of soil was weighed and 20 mL of DTPA extraction solution added. After shaking for 120 minutes, the sample was filtered through with 110 mm diameter filter paper.
Multi-element calibration standards: 0.01, 0.05, 0.1, 0.5 and 1.0 µg/mL of Cd; 0.05, 0.25, 0.5, 2.5 and 5 µg/mL of Co and Ni; 0.1, 0.5, 1.0, 5.0 and 10.0 µg/mL of Cu, Zn and Pb; 0.5, 2.5, 5.0, 25.0 and 50.0 µg/mL of Mn; 1.0, 5.0, 10.0, 50.0 and 100.0 µg/mL of Fe. All calibration blanks and standards were prepared in the DTPA extraction solution.
Spiked sample: 25 mL of the highest multi-element calibration standard was made up with 25 mL of the extracted soil sample.

42
AGILENT TECHNOLOGIES
Speciality chemicalsAGILENT TECHNOLOGIES
Food & Agriculture Applications
4
Working concentration range Linear calibrations were obtained for all elements. Calibration coefficients were greater than 0.999 (Table 2), with less than 10% calibration error for each point. Figure 1 shows a calibration curve for Mn 293.305 nm up to 50 mg/kg with a correlation coefficient greater than 0.999 and less than 3% calibration error on each calibration point (Table 3).
Table 2. Wavelength and working calibration concentration range
Element and wavelength (nm)
Concentration range (mg/kg)
Concentration coefficient
Cu 324.754 0.1-10 0.999
Fe 234.350 1-100 0.999
Mn 293.305 0.5-50 0.999
Zn 213.857 0.1-10 0.999
Cd 214.439 0.01-1 0.999
Co 228.615 0.05-5 0.999
Ni 231.604 0.05-5 0.999
Pb 220.353 0.1-10 0.999
Figure 1. The calibration curve for Mn 293.305 nm shows excellent linearity across the calibrated range, with a correlation coefficient of 0.99975.
Table 3. Calibration error (%) for each calibration point for Mn 293.305 nm.
Standards Concentration (mg/kg) Calibration error (%)
Blank 0.0 0.00
Standard 1 0.5 1.98
Standard 2 2.5 0.92
Standard 3 5.0 0.05
Standard 4 25.0 1.88
Standard 5 50.0 2.74
Results and discussion
Method Detection LimitsThe Method Detection Limits (MDLs) shown in Table 4 are based on three sigma of ten replicate measurements of the blank DTPA extraction solution, based on a sample weight of 10 g during the analytical run. The results are an average of 6 determinations, performed on two separate instruments. The MDL of each element was found to be less than 0.025 mg/kg.
Table 4. Agilent 5110 SVDV ICP-OES MDLs based on a sampling weight of 10 g for the DTPA extraction
Element Wavelength (nm)
MDL (mg/kg)
Cu 324.754 0.003
Fe 234.350 0.012
Mn 293.305 0.005
Zn 213.857 0.002
Cd 214.439 0.002
Co 228.615 0.005
Ni 231.604 0.008
Pb 220.353 0.025
Spike recoveriesAll elements were determined in the soil extract. The spike recoveries shown are the average of the results obtained from two analytical runs on two instruments i.e. n=4 of the spiked sample (Table 5). All spike recoveries were within ±10% of the expected values.
Table 5. Spike recoveries for all elements in the DTPA extracted soil sample obtained using an Agilent 5110 SVDV ICP-OES
Element and wavelength (nm)
DTPA extracted
soil sample (mg/kg)
Spiked conc. (mg/kg)
Measured spike conc.
(mg/kg)
Recovery (%)
Cu 324.754 0.93 5 4.76 95
Fe 234.350 12.62 50 46.27 93
Mn 293.305 0.76 25 23.5 94
Zn 213.857 0.12 5 4.77 96
Cd 214.439 0.002 0.5 0.47 94
Co 228.615 0.07 2.5 2.37 96
Ni 231.604 0.06 2.5 2.37 95
Pb 220.353 0.55 5 4.76 95

43
AGILENT TECHNOLOGIES
Speciality chemicals
www.agilent.com/chem/5110icpoes
AGILENT TECHNOLOGIES
Food & Agriculture Applications
www.agilent.com/chem/5110icpoes
5
Table 7. Spike recoveries for all elements in the DTPA extracted soil sample obtained using the Agilent 5110 SVDV ICP-OES with AVS 6
Element and wavelength (nm)
Spiked concentration
(mg/kg)
Measured spike concentration
(mg/kg)
Recovery (%)
Cu 324.754 5 4.89 98
Fe 234.350 50 47.71 95
Mn 293.305 25 23.88 96
Zn 213.857 5 4.89 98
Cd 214.439 0.5 0.49 97
Co 228.615 2.5 2.43 97
Ni 231.604 2.5 2.41 96
Pb 220.353 5 4.86 97
Table 8. Comparison of analysis time and argon consumption per sample
5110 without AVS 6 5110 with AVS 6
Analysis time (s) 59 30
Sample-to-sample Ar consumption (L/sample) 17.1 8.7
Conclusions
Agilent’s 5110 SVDV ICP-OES with vertical torch and 27MHz SSRF system provides the robustness required for analysis of nutrients and heavy metals in DTPA extracted soil samples.
The 5110 ICP-OES combines the robust qualities of a vertically-oriented plasma with the sensitivity benefits of an axially-viewed plasma to obtain good linearity over a wide concentration range and excellent method detection limits. The method was validated with spike recoveries obtained within ±10% of target values, demonstrating the accuracy of the developed method.
Running the same method on a 5110 ICP-OES fitted with an Agilent AVS 6 switching valve system led to a significant reduction in sample analysis time and cut argon consumption by almost 50%.
Advanced Valve System: Comparison of resultsThe Agilent Advanced Valve System (AVS 6) is a fully integrated switching valve system, designed for the Agilent 5110 ICP-OES to deliver simpler, faster, more cost effective sample analysis [1, 2]. To test this premise, the spike recovery test was repeated using the 5110 fitted with the AVS 6 (6 port valve). The valve settings shown in Table 6 were selected using the AVS Parameter Calculator in the ICP Expert software.
Table 6. Agilent Advanced Valve System settings
Parameter Setting
Loop volume 0.5 mL
Pump rate: Valve uptake 37.5 mL/min
Pump rate: Inject 9.9 mL/min
Valve uptake delay 4.4 s
Bubble injection time 2.2 s
Preemptive rinse time 1.7 s
Stabilization time 5 s
Rinse time 0 s
Spike recoveries for all elements in the DTPA extracted soil sample obtained using the 5110 fitted with the AVS 6 are given in Table 7. The results are the average of 3 spike replicates in a single analytical run. All results are within ±10% of the expected values, matching the performance of the results collected without a valve system.
The AVS 6 reduces sample analysis time by almost 50% (Table 8), without compromising the accuracy of the method. This boosts sample throughput and productivity, while at the same time reducing argon consumption.

44
AGILENT TECHNOLOGIES
Speciality chemicalsAGILENT TECHNOLOGIES
Food & Agriculture Applications
www.agilent.com/chemAgilent shall not be liable for errors contained herein or for incidental or consequential
damages in connection with the furnishing, performance or use of this material.
Information, descriptions, and specifications in this publication are subject to change without notice.
© Agilent Technologies, Inc. 2016Published May 1st 2016
Publication number: 5991-6854EN
References
1. AVS tech note, Agilent publication, 2016, 5991-6863EN
2. John Cauduro, Ultra-high speed analysis of soil extracts using an Advanced Valve System installed on an Agilent 5110 SVDV ICP-OES, Agilent publication, 2016, 5991-6853EN

45
AGILENT TECHNOLOGIES
Speciality chemicals
www.agilent.com/chem/5110icpoes
AGILENT TECHNOLOGIES
Food & Agriculture Applications
www.agilent.com/chem/5110icpoes
Plant nutrient analysis using theAgilent 5100 Synchronous Vertical Dual View ICP OESApplication note
Authors
Juan A. V. A. Barros1, Raquel C. Machado1, Clarice D. B. Amaral1,
Daniela Schiavo2, Ana Rita A. Nogueira3 and Joaquim A. Nóbrega1
1. Group of Applied Instrumental Analysis, Department of Chemistry, Federal University of São Carlos, São Carlos, SP, Brazil
2. Agilent Technologies, São Paulo, SP, Brazil
3. Embrapa Southeast Livestock, São Carlos, SP, Brazil
Food testing & agriculture
Introduction
The determination of the elemental composition in plants is important for development, growth and maintenance of plant tissues. Elements, such as Al, B, Ba, Ca, Cu, Fe, K, Mg, Mn, S, Sr, P, and Zn, are important for plant nutrition, being vital nutrients required for tissue development, maintenance and plant metabolism [1]. The determination of macro, micronutrients and contaminants in plant samples is important to keep up with sources of nutrients and minerals. The chemical analysis of plant materials can be applied to assist in the remediation of contaminated soils or to solve mineral malnutrition, a problem that seriously affects the human population [2, 3]. Inductively coupled plasma optical emission spectrometry (ICP-OES) is an attractive technique for this analysis because it can accommodate the wide concentration ranges typical of macro and micronutrients in plants.
IntroductionWhiskey production is a lucrative global industry that generates billions of dollars of business every year. There are over 20 whiskey producing countries, with Scotland leading the market with Scotch whisky, followed by the US, Canada, Ireland and Japan. Out of the 200+ countries that have developed a taste for whiskey, India consumes the most – more than three times as much as the US. Unsurprisingly, India is beginning to increase its own production of the spirit [1].
With the value of a whiskey highly dependent on type, brand and heritage, quality, age, and legal product definition, producers are keen to establish analytical methods to help them identify the unique aspects of their product and ways to preserve its authenticity against fraudulent practices.
Elemental Profiling of Whiskey using the Agilent 5100/5110 ICP-OES and MPP Chemometrics Software
Authors
Jenny Nelson1, Greg Gilleland1, Helene Hopfer2,3,4,and Susan E. Ebeler2,3,
1. Agilent Technologies, Inc., Santa Clara, CA, USA Application: Food Authenticity
2. Dept. Viticulture & Enology, University of California, Davis, CA, USA
3. Food Safety and Measurement Facility, University of California, Davis, CA, USA
4. Dept. Food Science, The Pennsylvania State University, University Park, PA, USA
Food authenticity
> Return to Table of Contents> Search entire document

46
AGILENT TECHNOLOGIES
Speciality chemicalsAGILENT TECHNOLOGIES
Food & Agriculture Applications
2
Agronomical laboratories typically deal with large batches of samples. Several critical elements, in wide concentration ranges, must be determined on a routine basis for such samples. The Agilent 5100 Synchronous Vertical Dual View (SVDV) ICP-OES with Dichroic Spectral Combiner (DSC) technology, has the ability to keep up with these demands, performing axial and radial measurements in a single reading, leading to faster sample throughput times. With faster sample run times, the 5100 SVDV requires less argon per sample, meaning significant savings can be made for labs involved in high throughput analysis. The Vista Chip II detector used in the 5100 ICP-OES has the fastest processing speed (1 MHz) of any charge coupled device (CCD) detector used in ICP-OES. It delivers fast warm-up, high throughput, high sensitivity, and the largest dynamic range.
This application note describes the quantitation of Al, B, Ba, Ca, Cu, Fe, K, Mg, Mn, P, S, Sr and Zn in microwave acid digested alfalfa, corn and sugarcane samples and an apple leaves certified reference material (SRM NIST 1515), using the Agilent 5100 Synchronous Vertical Dual View (SVDV) ICP-OES.
Experimental
InstrumentationAll measurements were carried out using an Agilent 5100 SVDV ICP-OES with Dichroic Spectral Combiner (DSC) technology (Agilent Technologies) which offers simultaneous axial and radial view analysis. The sample introduction system consisted of a SeaSpray nebulizer, single-pass cyclonic spraychamber and a 1.8 mm DV i.d injector torch. Method and instrument operating conditions are presented in Table 1.
Table 1. Agilent 5100 SVDV ICP-OES method and instrument operation parameters
Parameter SettingRead time (s) 20 Replicates 3Sample uptake delay (s) 15 Stabilization time (s) 15Pump speed (rpm) 12Sample tubing White/WhiteWaste tubing Blue/BlueBackground correction FittedRF power (kW) 1.5 Aux flow (L/min) 1.0 Plasma flow (L/min) 12.0 Neb Flow (L/min) 0.60 Nebulizer SeaSpray®
Viewing height (mm) 8Spray chamber Single-pass cyclonic
Standard and sample preparationAll glassware was decontaminated by immersion in 10% v/v HNO3 for at least 24 h and then rinsed with distilled-deionized water (resistivity > 18.2 MΩ cm), obtained from a Milli-Q® Water System (Millipore, Billerica, MA, USA). All solutions and blanks were prepared with ultrapure water and nitric acid obtained from a sub-boiling distillation apparatus (Milestone). Working standards were prepared from 1000 ppm single element stock solutions of Al, B, Ba, Ca, Cu, Fe, K, Mg, Mn, P, S, Sr and Zn at concentrations of 0, 1, 5, 10, 20, 40, 60 and 100 ppm (Qhemis, São Paulo, SP, Brazil).
Embrapa Southeast Livestock (São Carlos, SP, Brazil) provided samples of corn roots, corn and alfalfa leaves. The two alfalfa samples were grown in soils previously fertilized with agricultural gypsum. Leaves of sugarcane were provided by the Sugar Cane Technology Center (Piracicaba, SP, Brazil). A Certified Reference Material (CRM) (SRM 1515, apple leaves) was obtained from the National Institute of Standards and Technology (NIST, Gaithersburg, MD, USA). All samples were microwave digested in triplicate. Approximately 200 mg of samples was digested with 8 mL of HNO3 50% (v/v). Post digestion, distilled-deionized water and 2 mL H202 30% (v/v) was added to make up the final volume to 50 mL.
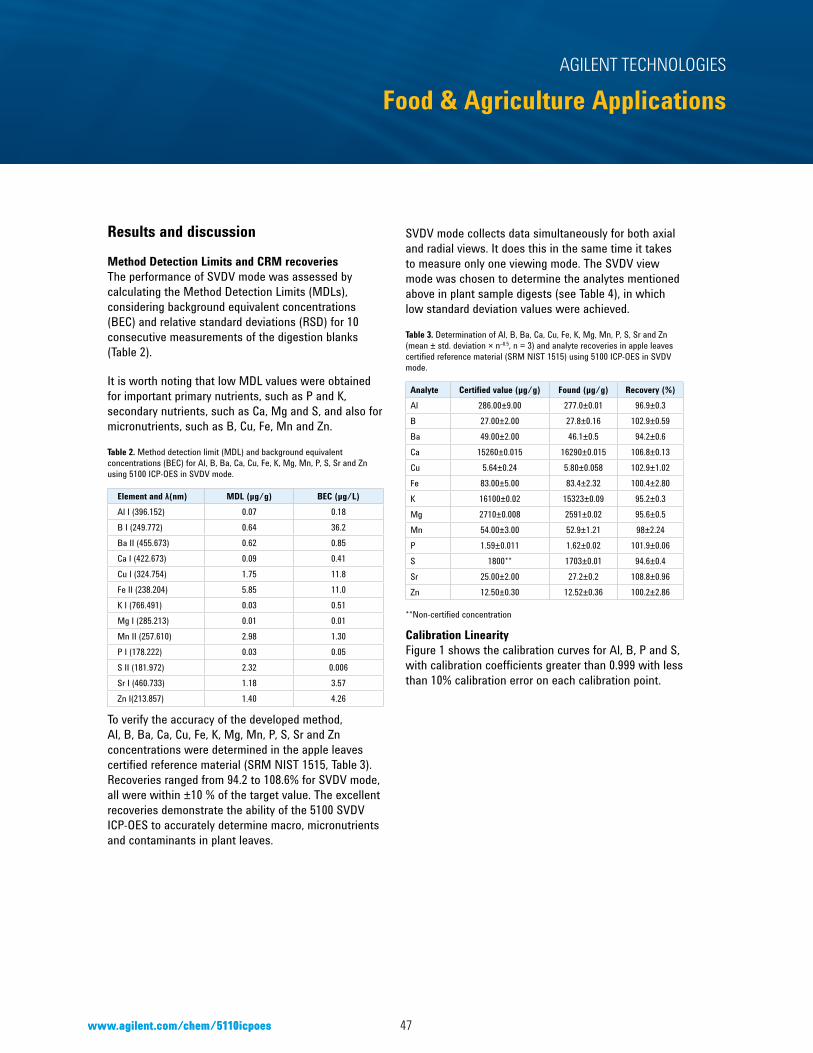
47
AGILENT TECHNOLOGIES
Speciality chemicals
www.agilent.com/chem/5110icpoes
AGILENT TECHNOLOGIES
Food & Agriculture Applications
www.agilent.com/chem/5110icpoes
3
Results and discussion
Method Detection Limits and CRM recoveriesThe performance of SVDV mode was assessed by calculating the Method Detection Limits (MDLs), considering background equivalent concentrations (BEC) and relative standard deviations (RSD) for 10 consecutive measurements of the digestion blanks (Table 2).
It is worth noting that low MDL values were obtained for important primary nutrients, such as P and K, secondary nutrients, such as Ca, Mg and S, and also for micronutrients, such as B, Cu, Fe, Mn and Zn.
Table 2. Method detection limit (MDL) and background equivalent concentrations (BEC) for Al, B, Ba, Ca, Cu, Fe, K, Mg, Mn, P, S, Sr and Zn using 5100 ICP-OES in SVDV mode.
Element and λ(nm) MDL (µg/g) BEC (µg/L)Al I (396.152) 0.07 0.18B I (249.772) 0.64 36.2Ba II (455.673) 0.62 0.85Ca I (422.673) 0.09 0.41Cu I (324.754) 1.75 11.8Fe II (238.204) 5.85 11.0K I (766.491) 0.03 0.51Mg I (285.213) 0.01 0.01Mn II (257.610) 2.98 1.30P I (178.222) 0.03 0.05S II (181.972) 2.32 0.006Sr I (460.733) 1.18 3.57Zn I(213.857) 1.40 4.26
To verify the accuracy of the developed method, Al, B, Ba, Ca, Cu, Fe, K, Mg, Mn, P, S, Sr and Zn concentrations were determined in the apple leaves certified reference material (SRM NIST 1515, Table 3). Recoveries ranged from 94.2 to 108.6% for SVDV mode, all were within ±10 % of the target value. The excellent recoveries demonstrate the ability of the 5100 SVDV ICP-OES to accurately determine macro, micronutrients and contaminants in plant leaves.
SVDV mode collects data simultaneously for both axial and radial views. It does this in the same time it takes to measure only one viewing mode. The SVDV view mode was chosen to determine the analytes mentioned above in plant sample digests (see Table 4), in which low standard deviation values were achieved.
Table 3. Determination of Al, B, Ba, Ca, Cu, Fe, K, Mg, Mn, P, S, Sr and Zn (mean ± std. deviation × n–0.5, n = 3) and analyte recoveries in apple leaves certified reference material (SRM NIST 1515) using 5100 ICP-OES in SVDV mode.
Analyte Certified value (µg/g) Found (µg/g) Recovery (%)Al 286.00±9.00 277.0±0.01 96.9±0.3B 27.00±2.00 27.8±0.16 102.9±0.59Ba 49.00±2.00 46.1±0.5 94.2±0.6Ca 15260±0.015 16290±0.015 106.8±0.13Cu 5.64±0.24 5.80±0.058 102.9±1.02Fe 83.00±5.00 83.4±2.32 100.4±2.80K 16100±0.02 15323±0.09 95.2±0.3Mg 2710±0.008 2591±0.02 95.6±0.5Mn 54.00±3.00 52.9±1.21 98±2.24P 1.59±0.011 1.62±0.02 101.9±0.06S 1800** 1703±0.01 94.6±0.4Sr 25.00±2.00 27.2±0.2 108.8±0.96Zn 12.50±0.30 12.52±0.36 100.2±2.86
**Non-certified concentration
Calibration LinearityFigure 1 shows the calibration curves for Al, B, P and S, with calibration coefficients greater than 0.999 with less than 10% calibration error on each calibration point.

48
AGILENT TECHNOLOGIES
Speciality chemicalsAGILENT TECHNOLOGIES
Food & Agriculture Applications
4
Table 4. Determination of Al, B, Ba, Ca, Cu, Fe, K, Mg, Mn, P, S, Sr and Zn (mean ± standard deviation, n = 3) in plant samples by ICP OES with SVDV mode.
Determined concentrations (µg/g)Sample Al B Ba Ca Cu Fe KSugarcane leaves 230.0±41.9 4.54±0.10 31.7±0.10 5009±103 5.27±0.1 163.2±8.76 11821±8.60
Corn leaves 10.2±0.10 33.1±0.20 0.17±0.004 3313±188 2.91±0.1 49.93±1.22 25828±652.2Corn roots 10.1±0.60 14.05±0.50 0.25±0.01 4525±108 2.70±0.1 527.3±55.5 30708±348.5Alfalfa leaves (1) 292.0±30.2 27.52±0.31 58.9±0.70 13252±41.21 7.28±0.14 190.5±20.0 25948±192.7Alfalfa leaves (2) 1154±3.39 33.61±0.31 31.9±0.20 10926±151.5 7.07±0.02 516.2±3.18 28466±223.4
Determined concentrations (µg/g)Mg Mn P S Sr Zn
Sugarcane leaves 2844±6.57 69.76±3.80 1482±28.7 1617±3.46 31.87±0.43 19.04±0.26
Corn leaves 1313±46.7 30.75±0.90 4056±95.1 1228±57.2 4.43±0.04 12.37±0.45Corn roots 2023±28.0 17.06±1.33 3984±76.5 2150±56.0 0.81±0.06 17.12±1.76Alfalfa leaves (1) 1661±4.27 20.28±0.33 3941±81.1 4188±43.4 248.3±2.30 21.80±0.14Alfalfa leaves (2) 2368±30.8 34.45±0.23 3290±16.0 3544±39.6 67.39±0.92 17.99±0.19
Figure 1. Calibrations obtained for Al, B, P and S using the 5100 SVDV ICP-OES.

49
AGILENT TECHNOLOGIES
Speciality chemicals
www.agilent.com/chem/5110icpoes
AGILENT TECHNOLOGIES
Food & Agriculture Applications
www.agilent.com/chem/5110icpoes
5
Conclusions
This application note demonstrates the performance and suitability of the Agilent 5100 Synchronous Vertical Dual View (SVDV) ICP-OES for plant nutrient analysis. With its unique configuration and Vista Chip II detector, all wavelengths could be read in a single measurement over a wide concentration range. The 5100 SVDV ICP-OES produced good linearity and excellent method detection limits were obtained for both macro-nutrients, P, K, Ca, Mg and S, and micronutrients, B, Cu, Fe, Mn and Zn. The recoveries obtained for the certified reference material were within ±10% of the target value, demonstrating the accuracy of the developed method for SVDV mode. With successful analyte determinations in sample digests, using SVDV mode, low standard deviations values were obtained.
The Agilent 5100 SVDV ICP-OES offers suitable performance and flexibility to support the high throughput demands of agronomical labs. Measurements in SVDV mode take less time and use less argon gas per sample, due to the simultaneous data acquisition of both axial and radial views.
Acknowledgments
The authors are grateful to Conselho Nacional de Desenvolvimento Científico e Tecnológico (CNPq), Coordenação de Aperfeiçoamento de Pessoal de Nível Superior (CAPES – Grant 15/2104) and São Paulo Research Foundation (FAPESP – 2013/26672-5) for fellowships and financial support. We also would like to thank the support from Agilent Technologies.
References
[1] R. D. Munson, Principles of plant analysis, in: Yash P. Karla (Editor), Reference methods for plant analysis, CRC Press-Taylor & Francis Group, Florida, 1998, pp. 1-24.
[2] F.C. Bressy, G.B. Brito, I.S. Barbosa, L.S.G. Teixeira, M.G.A. Korn, Determination of trace element concentrations in tomato samples at different stages of maturation by ICP OES and ICP-MS following microwave-assisted digestion, Microchemical Journal, 2013, 109, 145-149.
[3] A. A. Momen, G. A. Zachariadis, A. N. Anthemidis, J. A. Stratis, Use of fractional factorial design for optimization of digestion procedures followed by multi-element determination of essential and non-essential elements in nuts using ICPOES technique, Talanta, 2007, 71, 443-451.
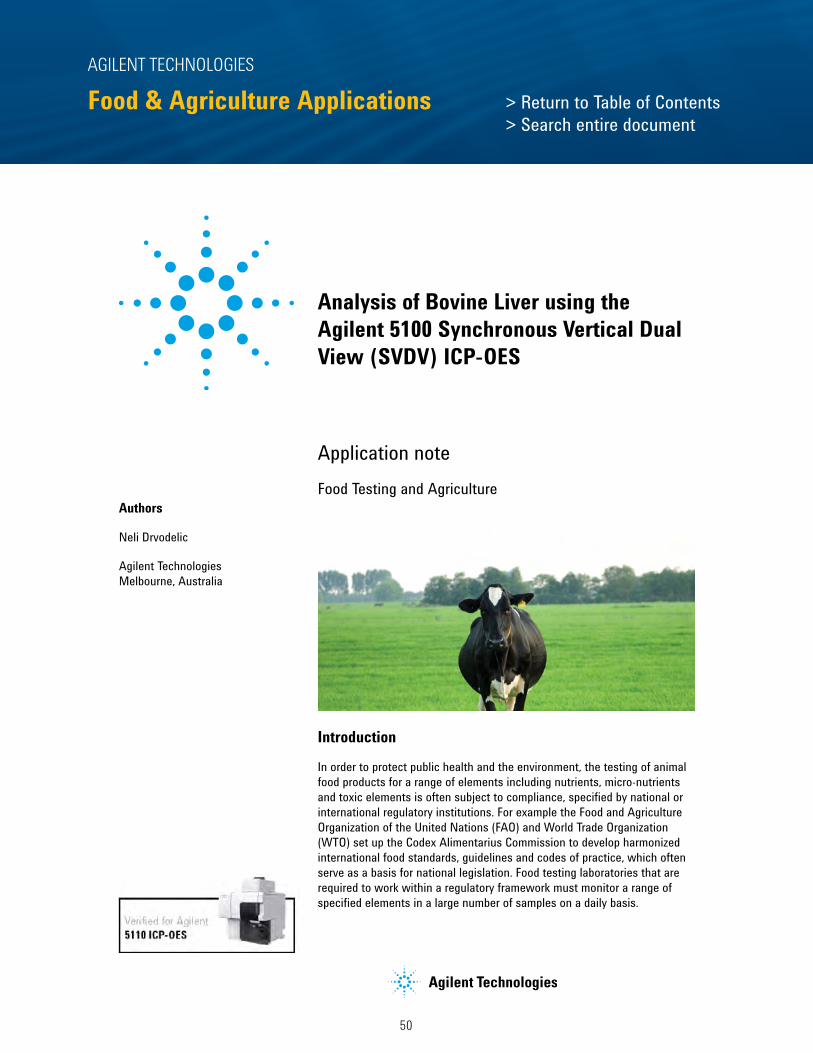
50
AGILENT TECHNOLOGIES
Speciality chemicalsAGILENT TECHNOLOGIES
Food & Agriculture Applications
Introduction
In order to protect public health and the environment, the testing of animal food products for a range of elements including nutrients, micro-nutrients and toxic elements is often subject to compliance, specified by national or international regulatory institutions. For example the Food and Agriculture Organization of the United Nations (FAO) and World Trade Organization (WTO) set up the Codex Alimentarius Commission to develop harmonized international food standards, guidelines and codes of practice, which often serve as a basis for national legislation. Food testing laboratories that are required to work within a regulatory framework must monitor a range of specified elements in a large number of samples on a daily basis.
Analysis of Bovine Liver using the Agilent 5100 Synchronous Vertical Dual View (SVDV) ICP-OES
Application note
Authors
Neli Drvodelic
Agilent Technologies Melbourne, Australia
Food Testing and Agriculture
IntroductionWhiskey production is a lucrative global industry that generates billions of dollars of business every year. There are over 20 whiskey producing countries, with Scotland leading the market with Scotch whisky, followed by the US, Canada, Ireland and Japan. Out of the 200+ countries that have developed a taste for whiskey, India consumes the most – more than three times as much as the US. Unsurprisingly, India is beginning to increase its own production of the spirit [1].
With the value of a whiskey highly dependent on type, brand and heritage, quality, age, and legal product definition, producers are keen to establish analytical methods to help them identify the unique aspects of their product and ways to preserve its authenticity against fraudulent practices.
Elemental Profiling of Whiskey using the Agilent 5100/5110 ICP-OES and MPP Chemometrics Software
Authors
Jenny Nelson1, Greg Gilleland1, Helene Hopfer2,3,4,and Susan E. Ebeler2,3,
1. Agilent Technologies, Inc., Santa Clara, CA, USA Application: Food Authenticity
2. Dept. Viticulture & Enology, University of California, Davis, CA, USA
3. Food Safety and Measurement Facility, University of California, Davis, CA, USA
4. Dept. Food Science, The Pennsylvania State University, University Park, PA, USA
Food authenticity
> Return to Table of Contents> Search entire document

51
AGILENT TECHNOLOGIES
Speciality chemicals
www.agilent.com/chem/5110icpoes
AGILENT TECHNOLOGIES
Food & Agriculture Applications
www.agilent.com/chem/5110icpoes
ICP-OES instrumentation is already commonly used in many food testing labs due to its reliability and ease-of-use, but the Agilent 5100 Synchronous Vertical Dual View (SVDV) ICP-OES takes the technique to a new level of operation and performance, particularly in terms of robustness, speed and reduced running costs.
Where most traditional dual view ICP-OES systems use a horizontal torch, the 5100 uses a more robust vertical torch orientation. This extends the torch lifetime, and also increases the matrix handling capability of the system. Uniquely, the 5100’s Dichroic Spectral Combiner (DSC) technology combines axial and radial light from the vertical plasma, over the entire wavelength range, in a single reading. This ensures that speed is no longer compromised due to the need to measure radial and axial views sequentially. Sample throughput is also aided with the high speed VistaChip II CCD detector. With faster sample run times, the 5100 requires significantly less argon gas per sample, which can lead to significant savings for labs involved in high throughput analysis.
The Agilent 5100 uses ICP Expert software with software applets that include pre-set method templates for quick and easy method development. Method development is further simplified with the DSC technology which eliminates the need for the user to select the correct plasma viewing mode for each element. The operator is simply required to choose which elements and wavelengths are required, and the instrument performs the analysis in a single, synchronous measurement. For example, the nutrient elements such as sodium and potassium, that can be present in the sample at percent levels will be viewed radially while other elements, present at ppm or ppb levels, such as copper or zinc, will be viewed axially in the same reading to enable analysis of all elements over a wide concentration range. Only one reading of the sample is required, instead of the 2, 3 or even 4 readings that are required on conventional dual view instruments.
The 5100 includes a plug-and-play torch system that automatically aligns the torch and connects all gases for fast start up while ensuring reproducible loading of the torch from operator to operator. Minimizing instrument
2
to instrument variability within the sample introduction system (SIS) is important for labs that operate several instruments across multiple sites. These ease-of-use features of the 5100 reduce operator training time and greatly simplify method development and instrument operation.
This note describes the use of the Agilent 5100 SVDV ICP-OES for the trace elemental analysis of a bovine liver standard reference material (SRM).
Instrumentation
All measurements were performed using an Agilent 5100 SVDV ICP-OES with unique Dichroic Spectral Combiner (DSC) technology and vertical plasma that enables axial and radial view analysis at the same time. The sample introduction system consisted of a SeaSpray nebulizer, double-pass glass cyclonic spray chamber and a standard 5100 Dual View torch (demountable, quartz, 1.8 mm injector). The instrument uses a solid-state RF (SSRF) system operating at 27 MHz to deliver a robust plasma capable of excellent long term analytical stability.
The instrument operating conditions used are listed in Table 1 and the wavelengths and calibration parameters selected for the analysis are given in Table 2.
Table 1. The Agilent 5100 SVDV ICP-OES operating parameters used.
Parameters Settings
Read time (s) 10
Replicates 3
Sample uptake delay (s) 20Stabilization time (s) 10
Rinse time (s) 30
Fast pump (rpm) 80
RF power (kW) 1.20
Aux flow (L/min) 1.0
Plasma flow (L/min) 12.0
Nebulizer flow (L/min) 0.7
Viewing height (mm) 6

52
AGILENT TECHNOLOGIES
Speciality chemicalsAGILENT TECHNOLOGIES
Food & Agriculture Applications
Experimental
Standard and sample preparation
To validate the method, the National Institute of Standards and Technology (NIST) Standard Reference Material (SRM) 1577 Bovine Liver was prepared for analysis. The SRM was digested using a Milestone Ethos microwave digestion system, with approximately 0.5 g of samples being accurately weighed into the digestion vessel. This was followed by the addition of 7 mL of concentrated HNO3 and 1 mL of 30% H2O2. Samples were digested using the pre-loaded digestion methods, allowed to cool, then made up to 50 mL with DI water. The final acid concentration was approximately 12% v/v HNO3.
A series of standards (1, 5, 10, 100, 250, 500 ppm) were prepared from multi-element standards in 1% HNO3 and a multi-element spike of the bovine liver digest was prepared at 100 ppb.
Table 2. The wavelengths and calibration parameters selected for the analysis.
Element Wavelength (nm)
Background Correction
Calibration Fit
Correlation Coefficient
K 766.491 Fitted Linear 0.99966
Na 589.592 Fitted Linear 0.99978
Fe 238.204 Fitted Linear 0.99999Cu 327.395 Fitted Linear 1.00000
Zn 213.857 Fitted Linear 1.00000
Mn 257.610 Fitted Linear 0.99998
Se 196.026 Fitted Linear 1.00000
Pb 220.353 Fitted Linear 0.99999
Cd 228.802 Fitted Linear 1.00000
As 188.980 Fitted Linear 1.00000
Ca 396.847 Fitted Linear 0.99997
Co 238.892 Fitted Linear 0.99999
Mg 279.078 Fitted Linear 0.99968
Mo 202.032 Fitted Linear 1.00000
Ag 328.068 Fitted Linear 1.00000
TI 190.794 Fitted Linear 1.00000
3
Results and discussion
The linear dynamic range (LDR) for Na and K on the 5100 SVDV ICP-OES shows good linearity (Figures 1 and 2). Both elements can be calibrated up to 500 ppm with a correlation coefficient greater than 0.999 and less that 10% calibration error on each calibration point. This highlights the excellent LDR for Na and K in a single reading using the 5100 SVDV ICP-OES. On a conventional Dual View instrument, multiple readings of the sample would be required to achieve a comparable LDR.
Figure 1. Calibration curve for K 766 line using the 5100 SVDV ICP-OES.
Figure 2. Calibration curve for Na 589 line using the 5100 SVDV ICP-OES.

53
AGILENT TECHNOLOGIES
Speciality chemicals
www.agilent.com/chem/5110icpoes
AGILENT TECHNOLOGIES
Food & Agriculture Applications
www.agilent.com/chem/5110icpoes
All elements were determined in the Bovine Liver SRM digest using a single reading for major and trace elements. The results obtained with the 5100 SVDV ICP-OES for the certified values in the SRM are shown in Table 3, and Table 4 shows the results for the reference values in the SRM for those elements where certified values are not available. Good agreement with the certified and reference values was obtained, with the majority of results within 5% of the certified concentration.The Method Detection Limits (MDL) were based on three sigma of ten replicate measurements of the blank solution.Table 3. Results for NIST Bovine Liver 1577 SRM.
ElementMDL(mg/kg)
Measured values(mg/kg)
SDCertified value(mg/kg)
SD Recovery(%)
K 766 7.80 9832 5.2 9700 0.06 101
Na 589 9.08 2410 2.9 2430 0.013 99
Fe 238 0.17 258 1.9 270 20 96
Cu 327 0.16 203 1.1 193 10 105
Zn 213 0.33 131 0.56 130 10 101
Mn 257 0.008 9.8 0.01 10.3 1.0 96
Cd 228 0.13 0.26 0.02 0.27 0.04 96
Table 4. Results for NIST Bovine Liver 1577 SRM. Certified values are not available for the elements listed.
ElementMDL(mg/kg)
Measured values(mg/kg)
SDReference value(mg/kg)
Recovery(%)
Ca 396 6.0 126 0.16 123 103
Mg 279 0.83 603 2.4 605 100
Mo 202 0.18 3.4 0.05 3.2 106
Sr 407 0.01 0.142 0.002 0.140 102
For some elements present at trace levels, the levels in the SRM were below the limit of quantification. To further validate the method for these elements, the bovine liver digest was spiked with a multi-element standard at 100 ppb and the results are shown in Table 5. Excellent spike recoveries were achieved, with all elements showing 99% to 110% recovery.
Table 5. Results for Bovine Liver matrix spiked with 100 ppb multi-element standard.
Element MDL(ppb)
Spike recovered values (ppb)
SDSpike added(ppb)
Spike recovery (%)
Pb 220 4.8 109 0.003 100 109
Se 196 8.5 103 0.001 100 103
Co 238 2.0 110 0.002 100 110
Ag 328 2.1 107 0.001 100 107
As 188 12 99 0.004 100 99
Tl 190 7.7 103 0.001 100 103
ConclusionsThe Agilent 5100 SVDV ICP-OES with DSC combines the sensitivity benefits of an axial plasma with the robust qualities of a radial plasma into a single platform so that all wavelengths can be detected in one measurement. This leads to greater precision, faster analysis times and reduced argon gas usage. In this study, the 5100 SVDV ICP-OES was used to analyze a microwave-digested sample of a bovine liver SRM for a range of elements. An excellent linear dynamic range was demonstrated for Na and K, up to 500 ppm and good agreement with the certified and reference values was obtained.The 5100 is ideally suited to meet the needs of food testing labs that require a high throughput, sensitive, multi-element technique, with a large linear dynamic range. Day-to-day operation and method development are simplified with a new, intuitive software interface and hardware features such as the plug-and-play torch that lead to excellent method repeatability between operators and from instrument to instrument.
www.agilent.comAgilent shall not be liable for errors contained herein or for incidental
or consequential damages in connection with the furnishing, performance or use of this material.
Information, descriptions, and specifications in this publication are subject to change without notice.
© Agilent Technologies, Inc. 2014Published July 8, 2014
Publication number: 5991-4868EN

54
AGILENT TECHNOLOGIES
Speciality chemicalsAGILENT TECHNOLOGIES
Food & Agriculture Applications
Introduction
The elemental composition of milk is a good indicator of environmental contamination. It is also a significant pathway for toxic metal intake as well as a source of essential nutrients for humans [1]. As such, standard methods and guidelines are being developed to monitor the elemental content of milk and milk-based products. For example, China’s National Food Safety Standard, GB 5413.21—2010, covers the determination of calcium, iron, zinc, sodium, potassium, magnesium, copper and manganese in foods for infants and young children, raw milk and dairy products.
Analysis of milk powders based on Chinese standard method using the Agilent 5100 SVDV ICP-OES
Application note
Authors
Neli Drvodelic
Agilent Technologies Melbourne, Australia
Food Testing
IntroductionWhiskey production is a lucrative global industry that generates billions of dollars of business every year. There are over 20 whiskey producing countries, with Scotland leading the market with Scotch whisky, followed by the US, Canada, Ireland and Japan. Out of the 200+ countries that have developed a taste for whiskey, India consumes the most – more than three times as much as the US. Unsurprisingly, India is beginning to increase its own production of the spirit [1].
With the value of a whiskey highly dependent on type, brand and heritage, quality, age, and legal product definition, producers are keen to establish analytical methods to help them identify the unique aspects of their product and ways to preserve its authenticity against fraudulent practices.
Elemental Profiling of Whiskey using the Agilent 5100/5110 ICP-OES and MPP Chemometrics Software
Authors
Jenny Nelson1, Greg Gilleland1, Helene Hopfer2,3,4,and Susan E. Ebeler2,3,
1. Agilent Technologies, Inc., Santa Clara, CA, USA Application: Food Authenticity
2. Dept. Viticulture & Enology, University of California, Davis, CA, USA
3. Food Safety and Measurement Facility, University of California, Davis, CA, USA
4. Dept. Food Science, The Pennsylvania State University, University Park, PA, USA
Food authenticity
> Return to Table of Contents> Search entire document

55
AGILENT TECHNOLOGIES
Speciality chemicals
www.agilent.com/chem/5110icpoes
AGILENT TECHNOLOGIES
Food & Agriculture Applications
www.agilent.com/chem/5110icpoes
Many of the major nutrients in milk powder such as Na, K and Ca are present at elevated levels. Some toxic elements must be determined at low levels, which means instrument sensitivity is of paramount importance. This drives the analysis towards an axial ICP-OES instrument in order to reach the low quantitation limits required for the toxic elements, but strategies to measure the higher levels of major nutrient elements must also be considered. Previous work [2, 3] has shown that the addition of caesium (Cs) as an internal standard and ionization suppressant to the standards and samples was beneficial in measuring the higher levels of elements such as Na and K. An alternative strategy to cover this large measurement range, is to measure the trace elements axially, and the nutrient elements radially using a Dual View (DV) ICP-OES instrument. However, conventional DV instruments take two or more sequential measurements of the sample for a complete analysis of all elements.
In this work, the Agilent 5100 Synchronous Vertical Dual View (SVDV) ICP-OES with unique Dichroic Spectral Combiner (DSC) technology was used to measure both axial and radial light in one reading, enabling major elements such as Na and K to be measured radially while trace elements are measured axially [4]. This extends the upper measurement range, and reduces interferences for nutrient elements like Na and K, and at the same time, enables trace elements like Zn, Cu and Mn to be determined, with no time penalty, low argon consumption per sample, accurate and precise data and an exceptional linear dynamic range (LDR).
The experimental work was carried out in accordance with China’s GB 5413.21—2010 standard method and the accuracy and validity of the method was assessed by analyzing National Institute of Standards and Technology (NIST) 8435 Whole Milk Powder Standard Reference Material (SRM).
2
Instrumentation
All measurements were performed using an Agilent 5100 SVDV ICP-OES with DSC that runs axial and radial view analysis at the same time. If greater flexibility of operation is required, the 5100 SVDV ICP-OES can be run in four different modes: synchronous vertical dual view, vertical dual view, radial and axial. All 5100 configurations feature a vertical torch and 27 MHz free running solid state RF generator, allowing the user to measure the most challenging samples, including high matrix food samples, with less cleaning, less downtime and fewer replacement torches.
The sample introduction system consisted of a Seaspray nebulizer, double-pass glass cyclonic spray chamber and a standard 1.8 mm torch. An SPS 3 autosampler was used to deliver samples to the instrument. Yttrium was used as an internal standard and added online via a tee piece.
The instrument operating conditions used are listed in Table 1.
Table 1. The Agilent 5100 SVDV ICP-OES operating parameters used.
Parameters Settings
Read time (s) 10
Replicates 3
Sample uptake delay (s) 20Stabilization time (s) 15
Rinse time (s) 30
Pump Speed (rpm) 15
Fast pump (rpm) 80
RF power (kW) 1.3
Aux flow (L/min) 1.0
Plasma flow (L/min) 12
Nebulizer flow (L/min) 0.7
Viewing height (mm) 6
Sample pump tubing White-white
Internal standard tubing Orange-green
Internal Standard Y 371.029 for all elements

56
AGILENT TECHNOLOGIES
Speciality chemicalsAGILENT TECHNOLOGIES
Food & Agriculture Applications
Experimental
Standard and sample preparation
NIST SRM 8435 Whole Milk Powder was used as the sample during this study. Concentrated HNO3 (7 mL) and 30% H2O2 (1 mL) were added to approximately 1.0 g of the milk powder SRM and digested in a laboratory microwave. Although the GB 5413.21—2010 method outlines an ashing/digestion sample preparation procedure, microwave digestion is also acceptable. Once dissolved, the solutions were allowed to cool and made up to volume in a 25 mL volumetric flask. The final acid concentration was approximately 20% v/v HNO3 and the final dilution was 1:25.
Multi-element calibration standards were prepared from single stock solutions per the GB method. Standard working solutions of different concentrations for the different elements were prepared per the concentrations listed in Table 2. The calibration range for Na, K, Mg, and Ca was extended , which highlights the large LDR of the 5100 with SVDV. The GB method permits the manual dilution of samples outside the calibration range, but this wasn’t required with the excellent linear dynamic range of the 5100 SVDV ICP-OES.
3
Results and discussion
The Method Detection Limits (MDL) were based on three sigma of ten replicate measurements of the blank solution during the analytical run. As can be seen in Table 3, the MDLs obtained on the 5100 SVDV ICP-OES are below those specified in the GB method.
Table 3. Method detection limits acquired per GB 5413.21—2010 guidelines. All MDLs were determined in a single analytical run.
Element MDL (mg/kg)
MDL (mg/100g)
GB Specified DL (mg/100g)
K 766.491 1.74 0.17 0.7
Ca 315.887 0.10 0.01 0.7
P 213.618 0.17 0.02 N/A
Na 589.592 0.08 0.01 1.6
S 181.972 1.11 0.11 N/A
Mg 279.078 0.08 0.01 0.2
Zn 202.548 0.006 0.0006 0.002
Sr 421.552 0.0005 0.00005 N/A
Fe 259.940 0.01 0.001 0.003
Cu 327.395 0.01 0.001 0.002
Mo 204.598 0.03 0.003 NA
Mn 257.610 0.003 0.0003 0.005
Table 2. Composition and concentration of mixed standard concentration solution, μg/mL
Calibration Standards
Fe Mn Cu Mo Sr Mg Zn P S Ca K Na
Concentration (µg/mL)
1 0.05 0.05 0.05 0.05 0.05 1 1 1 1 10 10 1
2 0.5 0.5 0.5 0.5 0.5 5 5 10 10 50 50 10
3 1 1 1 1 1 10 10 100 100 100 100 20
4 5 5 5 5 5 25 25 200 200 250 250 50
5 50 50 500 500 500 500 100
6 750 750 150
7 200

57
AGILENT TECHNOLOGIES
Speciality chemicals
www.agilent.com/chem/5110icpoes
AGILENT TECHNOLOGIES
Food & Agriculture Applications
www.agilent.com/chem/5110icpoes
The recoveries for the elements determined in the milk powder SRM were in the range of 92% to 107% highlighting the accuracy of the method. The results in Table 4 also demonstrate the wide dynamic range capability of the 5100 SVDV ICP-OES, as elements were determined at the ppb to % level in a single reading.
Although the Chinese GB method currently covers the determination of eight elements (Ca, Fe, Zn, Na, K, Mg, Cu and Mn), results for P, S, Sr and Mo in the SRM have been reported as they may be important for milk powder analysis in other countries or regions.
Table 4. Analysis of NIST Milk Powder 8435 SRM using the 5100 SVDV ICP-OES.
Element Certified value (mg/kg)
Measured values(mg/kg)
Recovery (%)
Major nutrients
K 766.491 13630 13070 96
Ca 315.887 9220 9750 106
P 213.618 7800 7160 92
Na 589.592 3560 3530 99
S 181.792 2650 2650 100
Minor and trace nutrients
Mg 279.078 814 749 92
Zn 202.548 28.0 28.9 103
Sr 421.552 4.35 4.37 101
Fe 259.940 1.8 1.9 107
Cu 327.395 0.46 0.46 100
Mo 204.598 0.29 0.27 92
Mn 257.610 0.17 0.18 103
Conclusions
The Agilent 5100 SVDV ICP-OES with DSC technology allows measurement of both axial and radial readings in a single, fast, cost effective measurement. Trace toxic and major nutrient elements were measured in a single measurement in a milk powder SRM, with no ionisation buffers. Excellent recoveries were achieved for all elements determined in the SRM using SVDV mode demonstrating the accuracy of the method over a large dynamic range. This work shows that the Agilent 5100 SVDV ICP-OES is suited to Chinese method GB 5413.21 for the analysis of milk powders.
References
1. P. D. Kluckner, D. F. Brown, R. Sylvestre, “Analysis of milk by plasma emission spectrometry”. ICP Information Newsletter, 1981, 7, 83
2. A. J. Ryan, Direct analysis of milk powder on the Liberty Series II ICP-AES with the axially-viewed plasma. ICP Instruments At Work, 1997 , ICP-21
3. A. Tame and D. Hoobin , Direct Analysis of Milk Powder by Axially-Viewed Simultaneous ICP-OES, Agilent application note, 2010, ICPES-26
4. Technical overview, Synchronous Vertical Dual View (SVDV) for superior speed and performance, Agilent publication, 2014, 5991-4853EN
www.agilent.comAgilent shall not be liable for errors contained herein or for incidental
or consequential damages in connection with the furnishing, performance or use of this material.
Information, descriptions, and specifications in this publication are subject to change without notice.
© Agilent Technologies, Inc. 2014Published July 4, 2014
Publication number: 5991-4900EN

58
AGILENT TECHNOLOGIES
Geochemistry, Mining & Metals Applications
Geochemistry, Mining & Metals ApplicationsTo meet increasingly tough regulatory and budgetary challenges, laboratories measuring geochemical, mining and finished metal samples must deliver accurate results faster, more reliably, and more cost-effectively than ever before.
Here’s how Agilent’s 5110 ICP-OES instrument addresses the specific needs of these inhouse or contract labs:
Analysis requirement 5110 offers:
High sample throughput Measurement of a sample in less than 30 seconds, with synchronous vertical dual view measurement and the AVS switching valve installed. This is 55% faster than conventional dual view ICP-OES instruments.
Fast results Fast delivery of results so that decisions can be made quickly.
Low cost per analysis Fast sample analysis reduces gas consumption by up to 50%. Low power consumption and low exhaust extraction requirements also reduces your energy consumption costs.
Reliability The rugged design of the 5110 and Agilent’s global support network minimizes instrument downtime.
Ability to handle high matrix samples
A vertical torch that offers reliable analysis of samples with up to 30% total dissolved solids with less cleaning, less downtime and less replacement torches.
Ease of use for multiple/infrequent operators
Inuitive software, Click-and-Go methods and automatic algorithms to perform background and interference corrections make measuring samples easy. Agilent’s IntelliQuant function gives approximate concentrations of up to 70 elements in a sample from a fast single scan. A Plug-and-Play torch design ensures consistent placement and automated instrument health checks and self-diagnostics reduce instrument downtime.
> Return to Table of Contents> Search entire document
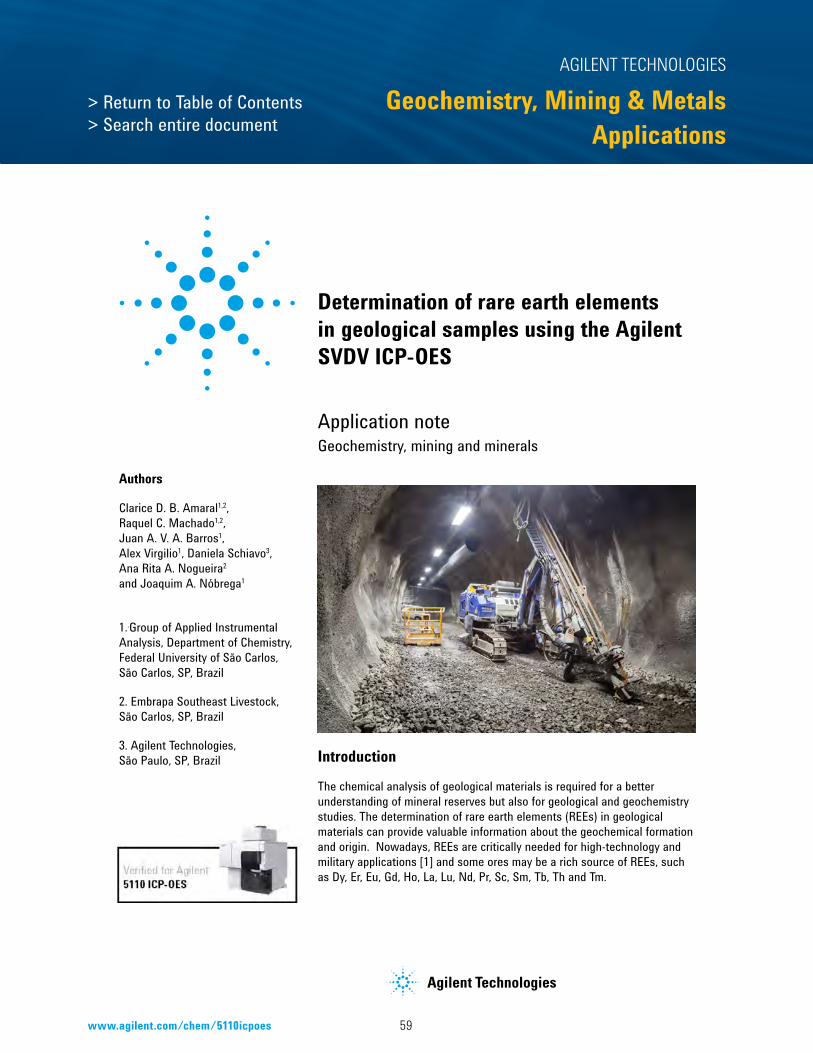
59
AGILENT TECHNOLOGIES
Geochemistry, Mining & Metals Applications
www.agilent.com/chem/5110icpoes
Introduction
The chemical analysis of geological materials is required for a better understanding of mineral reserves but also for geological and geochemistry studies. The determination of rare earth elements (REEs) in geological materials can provide valuable information about the geochemical formation and origin. Nowadays, REEs are critically needed for high-technology and military applications [1] and some ores may be a rich source of REEs, such as Dy, Er, Eu, Gd, Ho, La, Lu, Nd, Pr, Sc, Sm, Tb, Th and Tm.
Determination of rare earth elements in geological samples using the Agilent SVDV ICP-OES
Application note
Authors
Clarice D. B. Amaral1,2,Raquel C. Machado1,2,Juan A. V. A. Barros1,Alex Virgilio1, Daniela Schiavo3,Ana Rita A. Nogueira2
and Joaquim A. Nóbrega1
1..Group of Applied Instrumental Analysis, Department of Chemistry, Federal University of São Carlos, São Carlos, SP, Brazil
2. Embrapa Southeast Livestock, São Carlos, SP, Brazil
3. Agilent Technologies,São Paulo, SP, Brazil
Geochemistry, mining and minerals
> Return to Table of Contents> Search entire document

60
AGILENT TECHNOLOGIES
Geochemistry, Mining & Metals Applications
2
Among the spectrometric techniques available, instrumental neutron activation analysis (INAA) and inductively coupled plasma mass spectrometry (ICP-MS) are commonly applied for REEs determination in mineral samples, due to multi-element capability, high sensitivity and low detection limits. However, those techniques are costly and suffer from interferences caused by long irradiation times and spectral overlaps, respectively.
X-ray fluorescence (XRF) gives the possibility of direct solid analysis, but it presents high detection limits not suitable for samples with low concentrations of REEs [2]. In this context, inductively coupled plasma optical emission spectrometry (ICP-OES) has been reported as a good alternative for REEs determination due to multi-element capacity, wide linear dynamic range and operational simplicity [2,3]. Moreover, in some cases it is important to have a sample profile to check for possible interfering elements on other target analytes when applying other instrumental methods, for example, compared to the magnitude of interferences caused by double-charged species, such as 150Sm2+ and 150Nd2+, on 75As+ determination by ICP-MS [4], ICP-OES offers greater flexibility for choosing emission wavelengths and viewing position without interferences.
In this study the Agilent 5100 Synchronous Vertical Dual View (SVDV) ICP-OES (this application is also applicable to the 5110 SVDV ICP-OES) was used for the determination of REEs (Dy, Er, Eu, Gd, Ho, La, Lu, Nd, Pr, Sc, Sm, Tb, Th and Tm) in geological samples. The 5100 and 5110 instruments allow for synchronous measurement capturing the axial and radial views of the plasma in one read, for SVDV viewing mode. Synchronous Vertical Dual View (SVDV) mode allows time saving for data acquisition which consequently reduces argon consumption per sample.
ExperimentalInstrumentationAll measurements were performed using an Agilent 5100 SVDV ICP-OES with Dichroic Spectral Combiner (DSC) technology. The unique DSC component selects and combines the axial and radial light from the vertically-oriented plasma, with all wavelengths measured in a single reading. The VistaChip II CCD detector has the largest dynamic range. Full wavelength
range is available for analysis, meaning the best wavelength, free of spectral interferences can be used. The sample introduction system consisted of a SeaSpray nebulizer, single-pass spray chamber and 1.8 mm ID injector torch. Instrument operating conditions are presented in Table 1.
Table 1. Operating parameters used for the Agilent 5100 SVDV ICP-OES.
Instrument parameter Setting
Read time (s) 20Replicates 3Sample uptake delay (s) 15Fast Pump (80 rpm) YesStabilization time (s) 15Pump Speed (rpm) 12Sample tubing white-whiteWaste tubing blue-blueRF power (kW) 1.5Aux flow rate (L/min) 1.0Plasma flow rate (L/min) 12.0Nebulizer flow rate (L/min) 0.60Viewing modes Radial and SVDVViewing height (mm) 8Background correction Auto
Reagents and standard solutionsAll glassware was decontaminated by immersion in 10% v/v HNO3 for at least 24 h and rinsed with distilled-deionized water (resistivity > 18.2 ΩM cm), obtained from a Milli-Q® Water System (Millipore, Bedford, MA, USA). All calibration standards and blanks were prepared with ultrapure water and nitric acid obtained using a sub-boiling distillation apparatus (Milestone). A multi-element calibration standard (Agilent Technologies, USA) of 10 mg/L Dy, Er, Eu, Gd, Ho, La, Lu, Nd, Pr, Sc, Sm, Tb, Th and Tm was used to prepare working standards in the 0.05 – 5 mg/L concentration range.
Samples and sample preparationGeological samples were obtained from a commercial mining company. These consisted of two samples (Sample 1 and Sample 2) with unknown concentrations of REEs. Approximately 100 mg of each sample were weighed directly into the Teflon-PFA digestion vessels followed by the addition of 9.0 mL of Aqua Regia. Following the addition of Aqua Regia, the samples were

61
AGILENT TECHNOLOGIES
Geochemistry, Mining & Metals Applications
www.agilent.com/chem/5110icpoes
3
left at room temperature overnight before digestion of the samples was carried out in a closed vessel microwave, cavity Ethos 1 Microwave oven (Milestone, Sorisole, Italy), according to the heating program presented in Table 2. After digestion, samples were transferred to 50 mL polypropylene flasks and made to a total of 50.0 mL with distilled-deionized water, resulting in 0.2% TDS. The accuracy of the proposed procedure was verified by addition and recovery of Sample 2 spiked at 2.5 mg/L with a multi-element calibration standard. This procedure was performed in triplicate.
Table 2. Microwave-assisted acid digestion heating program for REEs deter-mination in geological samples.
Step Applied power (W) Time (min) Temperature (ºC)
1 500 10 1202 1000 20 2203 1000 5 220
Results and discussion
Method detection limitsFor determination of rare earth elements in geological samples, external calibration was employed. Method Detection Limits (MDLs) were obtained considering background equivalent concentrations (BEC) and relative standard deviations (RSD) for 10 measurements of the digested blank samples.
MDLs are shown in Table 3. Three wavelengths were selected for each element for all measurements, and the optimal wavelength for each element in SVDV and radial viewing modes are displayed. Low MDL values were reached and, in general, lower MDLs were obtained using the SVDV viewing mode. Traditional REEs are measured radially with a vertical plasma, due to the heavy matrix nature of geological samples. SVDV mode allows for wavelengths to be read axially from the vertically-oriented plasma, ideal for geological samples as it provides much lower MDLs than radial view.
Table 3. BEC and MDL values obtained for SVDV and radial viewing modes.
Radial SVDV
Element & wavelength
(nm)
BEC(mg/L)
MDL(mg/kg)
Element & wavelength
(nm)
BEC(mg/L)
MDL(mg/kg)
Dy 353.171 0.009 1.1 Dy 340.780 0.0007 0.6Er 349.910 0.004 1.1 Er 369.265 0.00008 0.1Eu 397.197 0.0004 0.09 Eu 397.197 0.003 2.6Gd 336.224 0.003 0.6 Gd 335.048 0.001 0.5Ho 341.644 0.008 0.9 Ho 339.895 0.0009 0.8La 379.477 0.001 0.2 La 408.671 0.0007 0.5Lu 307.760 0.003 0.7 Lu 307.760 0.0005 0.4Nd 406.108 0.04 2.8 Nd 401.224 0.002 1.0Pr 422.532 0.009 1.8 Pr 422.532 0.00008 0.02Sc 363.074 0.0005 0.2 Sc 335.372 0.00005 0.05Sm 360.949 0.008 2.7 Sm 360.949 0.002 1.3Tb 367.636 0.01 1.7 Tb 350.914 0.0006 0.7Th 283.730 0.02 3.7 Th 283.730 0.003 1.6Tm 342.508 0.003 0.9 Tm 346.220 0.00008 0.08
Spike recoveriesSpike recoveries were performed to check the accuracy of the proposed method. Results presented in Table 4 show good accuracy was obtained in both radial and SVDV viewing modes. La, Nd and Pr were present at high concentrations in both samples, thus a 4-fold additional dilution was necessary. Recoveries ranged from 90.1 to 107% for both viewing modes.
Calibration linearityExcellent linearity was achieved with calibration coefficients greater than 0.9990 obtained for all analytes, with less than 5% error for each calibration point for both radial and SVDV measurements. Figures 1 and 2 display the calibration curve for Lu 307.760 nm in radial and SVDV modes, respectively.
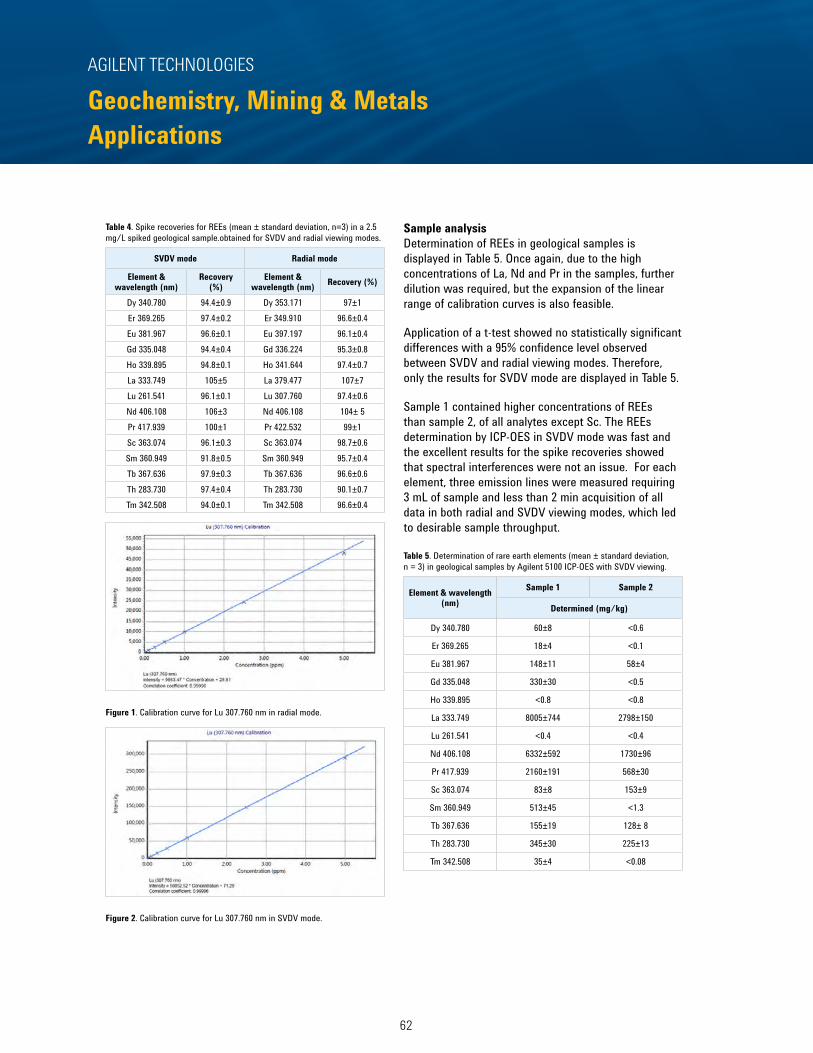
62
AGILENT TECHNOLOGIES
Geochemistry, Mining & Metals Applications
4
Table 4. Spike recoveries for REEs (mean ± standard deviation, n=3) in a 2.5 mg/L spiked geological sample.obtained for SVDV and radial viewing modes.
SVDV mode Radial mode
Element &wavelength (nm)
Recovery (%)
Element &wavelength (nm) Recovery (%)
Dy 340.780 94.4±0.9 Dy 353.171 97±1Er 369.265 97.4±0.2 Er 349.910 96.6±0.4Eu 381.967 96.6±0.1 Eu 397.197 96.1±0.4Gd 335.048 94.4±0.4 Gd 336.224 95.3±0.8Ho 339.895 94.8±0.1 Ho 341.644 97.4±0.7La 333.749 105±5 La 379.477 107±7Lu 261.541 96.1±0.1 Lu 307.760 97.4±0.6Nd 406.108 106±3 Nd 406.108 104± 5Pr 417.939 100±1 Pr 422.532 99±1Sc 363.074 96.1±0.3 Sc 363.074 98.7±0.6Sm 360.949 91.8±0.5 Sm 360.949 95.7±0.4Tb 367.636 97.9±0.3 Tb 367.636 96.6±0.6Th 283.730 97.4±0.4 Th 283.730 90.1±0.7Tm 342.508 94.0±0.1 Tm 342.508 96.6±0.4
Figure 1. Calibration curve for Lu 307.760 nm in radial mode.
Figure 2. Calibration curve for Lu 307.760 nm in SVDV mode.
Sample analysisDetermination of REEs in geological samples is displayed in Table 5. Once again, due to the high concentrations of La, Nd and Pr in the samples, further dilution was required, but the expansion of the linear range of calibration curves is also feasible.
Application of a t-test showed no statistically significant differences with a 95% confidence level observed between SVDV and radial viewing modes. Therefore, only the results for SVDV mode are displayed in Table 5.
Sample 1 contained higher concentrations of REEs than sample 2, of all analytes except Sc. The REEs determination by ICP-OES in SVDV mode was fast and the excellent results for the spike recoveries showed that spectral interferences were not an issue. For each element, three emission lines were measured requiring 3 mL of sample and less than 2 min acquisition of all data in both radial and SVDV viewing modes, which led to desirable sample throughput.
Table 5. Determination of rare earth elements (mean ± standard deviation, n = 3) in geological samples by Agilent 5100 ICP-OES with SVDV viewing.
Element & wavelength (nm)
Sample 1 Sample 2
Determined (mg/kg)
Dy 340.780 60±8 <0.6
Er 369.265 18±4 <0.1
Eu 381.967 148±11 58±4
Gd 335.048 330±30 <0.5
Ho 339.895 <0.8 <0.8
La 333.749 8005±744 2798±150
Lu 261.541 <0.4 <0.4
Nd 406.108 6332±592 1730±96
Pr 417.939 2160±191 568±30
Sc 363.074 83±8 153±9
Sm 360.949 513±45 <1.3
Tb 367.636 155±19 128± 8
Th 283.730 345±30 225±13
Tm 342.508 35±4 <0.08

63
AGILENT TECHNOLOGIES
Geochemistry, Mining & Metals Applications
www.agilent.com/chem/5110icpoes
5
Conclusions
In this study, the Agilent 5100 SVDV ICP-OES proved well suited to the determination of REEs in geological samples.
The instrument’s multi-element capabilities and expansive wavelength selection ensured the spectral interferences associated with complex geological samples were not an issue.
Axial readings of the vertical-oriented plasma in SVDV meant, that in most cases, lower MDLs for REEs in geological samples could be achieved in SVDV mode than in radial.
The high sample throughput, accuracy and precision of the proposed procedure indicates that the Agilent 5100 or 5110 SVDV ICP-OES, running in SVDV viewing mode are a simple and cost effective alternative for REE determination in geological samples.
Acknowledgments
The authors are grateful to grants 2013/26672-5 and 2014/18393-1 of São Paulo Research Foundation (FAPESP) for the scholarships provided to R.C.M. and A.V., Conselho Nacional de Desenvolvimento Científico e Tecnológico (CNPq), and Coordenação de Aperfeiçoamento de Pessoal de Nível Superior (CAPES – 15/2104) for fellowships and financial support.
We also would like to thank Agilent Technologies for their support.
References
1. S. Al-Thyabat, P. Zhang, In-line extraction of REE from dehydrate (DH) and hemiDihydrate (HDH) wet processes, Hydrometallurgy 2015, 153, 30-37
2. B. Zawisza, K. Pytlakowska, B. Feist, M. Polowniak, A. Kita, R. Sitko, Determination of rare earth elements by spectroscopic techniques: a review, J. Anal. At. Spectrom., 2011, 26, 2373-2390.
3. M.S. Navarro, H.H.G.J. Ulbrich, S. Andrade, V.A. Janasi, Adaptation of ICP-OES routine determination techniques for the analysisof rare earth elements by chromatographic separation in geologic materials: tests with reference materials and granitic rocks, J. Alloy Compd., 2002, 344, 40–45
4. B.P. Jackson, A. Liba, J. Nelson, Advantages of reaction cell ICP-MS on doubly charged interferences for arsenic and selenium analysis in foods. J. Anal. At. Spectrom. 2015, 5, 1179-1183.

64
AGILENT TECHNOLOGIES
Geochemistry, Mining & Metals Applications
Analysis of steel and its alloys using the GB/T 20125-2006 standard and an Agilent 5100 ICP-OES in dual view modeApplication note
Authors
John Cauduro
Agilent Technologies Melbourne, Australia
Metals analysis and production
Introduction
Steel manufacturers conduct quality control testing for a range of metals and trace elements to ensure the grade and performance of their final product. The Standardization Administration of China uses their GB/T 20125-2006 standard “Low-alloy steel – Determination of multi-element contents – Inductively coupled plasma atomic emission spectrometric method” to control the quality of manufactured steel products.
Different grades of steel have different specifications for elemental content, with most steel and stainless steel grades required to have less than 0.05 % by weight of Sulfur and 0.04 % by weight of Phosphorus. With the Inductively Coupled Plasma Optical Emission Spectroscopy (ICP-OES) technique easily able to measure elements at this concentration within a sample, laboratories are looking beyond whether an instrument can ‘do the job’ to whether a specific instrument can improve their sample throughput, lower their costs, simplify sample preparation and instrument operation, and deliver reliable results throughout the analysis of a large batch of samples.
IntroductionWhiskey production is a lucrative global industry that generates billions of dollars of business every year. There are over 20 whiskey producing countries, with Scotland leading the market with Scotch whisky, followed by the US, Canada, Ireland and Japan. Out of the 200+ countries that have developed a taste for whiskey, India consumes the most – more than three times as much as the US. Unsurprisingly, India is beginning to increase its own production of the spirit [1].
With the value of a whiskey highly dependent on type, brand and heritage, quality, age, and legal product definition, producers are keen to establish analytical methods to help them identify the unique aspects of their product and ways to preserve its authenticity against fraudulent practices.
Elemental Profiling of Whiskey using the Agilent 5100/5110 ICP-OES and MPP Chemometrics Software
Authors
Jenny Nelson1, Greg Gilleland1, Helene Hopfer2,3,4,and Susan E. Ebeler2,3,
1. Agilent Technologies, Inc., Santa Clara, CA, USA Application: Food Authenticity
2. Dept. Viticulture & Enology, University of California, Davis, CA, USA
3. Food Safety and Measurement Facility, University of California, Davis, CA, USA
4. Dept. Food Science, The Pennsylvania State University, University Park, PA, USA
Food authenticity
> Return to Table of Contents> Search entire document

65
AGILENT TECHNOLOGIES
Geochemistry, Mining & Metals Applications
www.agilent.com/chem/5110icpoes
2
This application note demonstrates the performance and benefits of Agilent’s 5100 Vertical Dual View (VDV) ICP-OES instrument in the analysis of steel samples, using the GB/T 20125-2006 method. The instrument offers many advantages for this application, which involves the rapid analysis of a large number of challenging steel samples.
Experimental
InstrumentationAgilent’s 5100 Vertical Dual View (VDV) ICP-OES was used for this analysis and has a range of features that deliver high sample throughput and reproducible, accurate results for challenging steel samples.
The instrument uses the Vista Chip II detector with a 1 MHz processing speed, the fastest of any charge coupled device (CCD) detector used in ICP-OES. This delivers high throughput, high sensitivity, and the largest dynamic range.
The instrument’s Vertical Dual View (VDV) configuration allows measurements to be performed in axial and radial modes. The analyst can achieve sensitivity for elements in low concentrations such as phosphorus and sulfur by measuring them in axial view as well as measuring percent concentrations of nickel and chromium, without having to dilute the sample, by using radial view. Refer to Table 2 to determine which plasma view was used for each element.
Agilent’s 5100 VDV ICP-OES features a vertical torch, capable of handling the toughest matrices. Over the years, a vertical torch has been accepted as a standard configuration for running challenging matrices as it requires less cleaning and fewer replacements [1]. The combination of the vertical torch and a robust solid state radio frequency (SSRF) system operating at 27 MHz, provides a reliable, robust plasma, delivering excellent long term stability for challenging samples. This means accurate results even at the end of a whole day of measuring steel sample digests. The plug-and-play torch loader automatically aligns the vertical torch and connects the gases for fast start up, ensuring reproducible results, even with multiple operators.
For the analysis, the RF power was increased to 1.5 kW and the nebulizer flow rate was set to 0.55 L/min to improve the detection limits for difficult elements such as S and P in the elevated Fe matrix. The plasma flow was left at a low setting of 12 L/min and did not need to be increased to handle the higher RF power and complex matrix. Instrument operating conditions are listed in Table 1.
For this application, the 5100 VDV ICP-OES was fitted with a sample introduction system comprising a OneNeb nebulizer, double-pass glass cyclonic spray chamber and a 5100 Dual View torch (demountable, quartz, 1.8 mm injector). An SPS 4 autosampler was used to deliver sample to the instrument.
Table 1. Instrument operating parameters.
Parameter Setting Torch Demountable Dual View torch (1.8 mm ID
injector) Nebulizer OneNebSpray chamber Double-pass glass cyclonic Read time (s) 20 for axial, 5 for radialReplicates 3 Sample uptake delay (s) 15 Stabilization time (s) 10 Rinse time (s) 50 Fast pump (80 rpm) Yes Nebulizer gas flow (L/min) 0.55 RF power (kW) 1.5Plasma gas flow (L/min) 12.0 Aux gas flow (L/min) 1.0
Sample preparationTwo CRMs, GH–135 6934 and GSBH 40031-93 (China National Analysis Center for Iron and Steel), were analyzed to verify the method, with the certified concentrations of elements in the CRMs shown in Table 3.
The sample was prepared by digesting 0.5 g of the CRM in a combination of nitric, hydrochloric, and perchloric acids on a hot plate, as described in the GB/T 20125-2006 method. The digest was made up in a 100 mL volumetric flask using 18 M Ω de-ionised water, giving a TDS of approximately 0.5 %.

66
AGILENT TECHNOLOGIES
Geochemistry, Mining & Metals Applications
3
Standard preparation Multi-element calibration standards were prepared from Agilent single element stock solutions. Blanks and standards were all matrix matched with a 5000 mg/kg Fe sample, which was made using the same digestion method as the samples, using a 6N high purity iron wire.
Correction techniquesInter Element Correction (IEC) was required for S due to the presence of Mn, Mo and Ti interferences, and for As due to the presence of Cr interference. To simplify the analysis, the calibration standards were used as IEC analyte standards. Single element interferent standards were prepared in the same Fe matrix used in the calibration standards. IEC factors were simply setup using the ICP Expert 7 software and once the factors were determined, they were stored in a template and reused in subsequent analyses. No internal standard correction was required.
A combination of Fitted Background Correction (FBC) and off-peak background correction techniques [2] were used to correct for any spectral interferences. The FBC technique simplifies method development and ensures fast, accurate background correction by eliminating the need to determine off-peak background correction points for each element. Table 2 lists which method was used for each element.
Table 2. The background correction method and plasma view used for each element.
Element & wavelength (nm)
Background correction used
Plasma view
Al 396.152 Fitted Radial
As 193.696 Off-Peak Right AxialCo 228.615 Fitted AxialCr 267.716 Fitted RadialCu 327.395 Fitted AxialMn 257.610 Fitted RadialMo 202.032 Fitted RadialNi 231.604 Fitted RadialP 178.222 Off-Peak Left AxialS 181.972 Fitted AxialSi 251.611 Fitted AxialTi 334.941 Fitted RadialV 309.310 Fitted Axial
Results and discussion
Calibration linearityLinear calibrations were obtained with a correlation coefficient greater than 0.99999 for all wavelengths over a wide concentration range. This high degree of linearity means the wide range of concentrations expected in steel samples can be determined without the need to perform additional dilutions. This improves sample throughput and removes potential dilution errors and sample contamination.
Figures 1–3 show typical calibration curves for Cr, Ni and P for this application.
Standards Conc (ppm)
% Error
Blank 0 N/AStandard 1 10 0.44Standard 2 100 0.60Standard 3 1000 2.82
Figure 1. Calibration curve and standard concentrations – Cr 267.716 nm line.

67
AGILENT TECHNOLOGIES
Geochemistry, Mining & Metals Applications
www.agilent.com/chem/5110icpoes
4
Standards Conc(ppm)
% Error
Blank 0 N/AStandard 1 20 0.08Standard 2 200 2.32Standard 3 2000 1.08
Figure 2. Calibration curve and standard concentrations – Ni 231.604 nm line.
Standards Conc (ppm)
% Error
Blank 0 N/AStandard 1 0.1 5.06Standard 2 1.0 0.06Standard 3 10.0 0.14
Figure 3. Calibration curve and standard concentrations – P 178.222 nm line.
Method Detection Limits and CRM recoveriesFor this application, MDLs were determined by analyzing the 5000 mg/kg Fe matrix blank solution 10 times. The MDL was calculated as 3 times the SD of the 10 measurements of the matrix blank. This analysis was performed on 3 independent runs.
The CRMs (GH – 135 6934 and GSBH 40031-93) were analyzed in duplicate, with the results averaged over 3 separate analyzes. The results shown in Table 3 display excellent recoveries within ±10% of the certified value, demonstrating the accuracy of the instrument when analyzing samples with difficult matrices.
Long term stability test The long term stability and precision of the method was tested by continuously analyzing a steel sample for 8 hours. The results (Figure 4 and Table 4) show the measurement precision for all elements over 8 hours was < 1.5% RSD. This demonstrates that the 5100 will reliably deliver accurate measurements over many hours of measuring challenging samples like the steel digests.
Figure 4. Long term stability plot of a steel sample, analyzed continuously over 8 hours.
68
AGILENT TECHNOLOGIES
Geochemistry, Mining & Metals Applications
5
Table 3. MDLs in the solid sample and recoveries for 13 elements in two CRMs. MDLs were determined in a 5000 mg/kg Fe matrix.
CRM GH – 135 6934 CRM GSBH 40031-93 MDL
(mg/kg)Measured(mg/kg)
SD(mg/kg)
Certified conc.(mg/kg)
Recovery (%)
Measured(mg/kg)
SD(mg/kg)
Certified conc.
(mg/kg)
Recovery(%)
Al 396.152 3.8 30761 465 31500 97.7 183.5 1.7 170 107.9As 193.696 2.0 38.9 1.7 NA 66.7 1.5 66 101.0Co 228.615 1.4 71.1 0.9 NA 57.0 0.5 58 98.4Cr 267.716 1.7 143030 1955 139400 102.6 370.1 3.1 350 105.7Cu 327.395 0.23 216.3 3.7 NA 328.6 2.8 340 96.7Mn 257.610 0.43 4719 65 4500 104.9 5940 46 5500 108.0Mo 202.032 2.2 18526 232 18400 100.7 57.7 2.4 59 97.8Ni 231.604 5.2 366424 4984 358500 102.2 270.0 2.7 260 103.9P 178.222 2.6 40.6 1.6 40 101.5 167.6 2.1 170 98.6S 181.972 3.4 39.7 10.9 37 107.3 170.3 2.8 170 100.2Si 251.611 1.6 4391 36 4520 97.1 2342 15 2280 102.7Ti 334.941 0.60 25809 310 24490 105.4 2.3 0.2 NA V 309.310 0.81 1007.4 7.9 NA 4.4 0.2 NA
Table 4. Long term stability data (%RSD) of a steel sample.
Elements Al 396.152
As 193.696
Co 228.615
Cr 267.716
Cu 327.395
Mn 257.610
Mo 202.032
Ni 231.604
P 178.222
S 181.972
Si 251.611
Ti 334.941
V 309.310
%RSD 0.88 1.47 0.76 0.93 0.71 1.04 1.05 0.88 1.24 1.35 0.79 0.92 0.88
Conclusion
Agilent’s 5100 VDV ICP-OES with a vertical torch operating in dual view mode was used to measure two steel certified reference materials, using the GB/T 20125-2006 standard “Low-alloy steel – Determination of multi-element contents – Inductively coupled plasma atomic emission spectrometric method”.
Despite the difficult samples, the dual viewing capability of the instrument, combined with the GB/T method, delivered accurate results, with recoveries within ±10% of the certified value.
The vertical torch and robust SSRF system of the instrument delivered long term measurement stability, with the measured %RSD for all elements over 8 hours being less than 1.5%.
The wide linear dynamic range of the instrument makes it ideal for the routine analysis of steel samples in a busy laboratory as it reduces the need for sample dilutions, which add to sample preparation time and introduce the risk of errors.
The software supplied with the instrument includes a selection of background correction techniques. This allowed accurate results to be achieved by correcting for any spectral interferences present in the difficult sample matrix.
The Agilent 5100 VDV ICP-OES was able to quickly, accurately and reliably measure the steel digest samples, despite the challenging matrix and wide range of analyte concentrations.
References
1. Benefits of a vertically oriented torch— fast, accurate results, even for your toughest samples, Agilent publication, (2014), 5991-4854EN
2. Fitted Background Correction (FBC) – fast, accurate and fully automated background correction, Agilent publication (2014), 5991-4836EN

69
AGILENT TECHNOLOGIES
Geochemistry, Mining & Metals Applications
www.agilent.com/chem/5110icpoes
Introduction
Traditionally, geological samples are analyzed using flame atomic absorption (FAAS) and/or radial ICP-OES with a vertical torch.
Achieving high sample throughput at a low cost per analysis for geochemical samples can be challenging when using these techniques. The samples often have a wide range of element concentrations, requiring multiple dilutions, particularly when using FAAS. The samples also have high levels of total dissolved solids (TDS), which requires frequent cleaning of the sample introduction system.
In this application note, the Agilent 5100 Synchronous Vertical Dual View (SVDV) ICP-OES was used to analyze geochemical samples containing up to 2.5% TDS. As well as demonstrating the accuracy and flexibility of the instrument, the sample measurement rate and argon consumption per sample were determined.
Ultra-fast determination of base metals in geochemical samples using the 5100 SVDV ICP-OES
Application note
Authors
John Cauduro Agilent Technologies, Mulgrave, Australia
Geochemistry, metals, mining
IntroductionWhiskey production is a lucrative global industry that generates billions of dollars of business every year. There are over 20 whiskey producing countries, with Scotland leading the market with Scotch whisky, followed by the US, Canada, Ireland and Japan. Out of the 200+ countries that have developed a taste for whiskey, India consumes the most – more than three times as much as the US. Unsurprisingly, India is beginning to increase its own production of the spirit [1].
With the value of a whiskey highly dependent on type, brand and heritage, quality, age, and legal product definition, producers are keen to establish analytical methods to help them identify the unique aspects of their product and ways to preserve its authenticity against fraudulent practices.
Elemental Profiling of Whiskey using the Agilent 5100/5110 ICP-OES and MPP Chemometrics Software
Authors
Jenny Nelson1, Greg Gilleland1, Helene Hopfer2,3,4,and Susan E. Ebeler2,3,
1. Agilent Technologies, Inc., Santa Clara, CA, USA Application: Food Authenticity
2. Dept. Viticulture & Enology, University of California, Davis, CA, USA
3. Food Safety and Measurement Facility, University of California, Davis, CA, USA
4. Dept. Food Science, The Pennsylvania State University, University Park, PA, USA
Food authenticity
> Return to Table of Contents> Search entire document

70
AGILENT TECHNOLOGIES
Geochemistry, Mining & Metals Applications
2
ExperimentalInstrumentationThe 5100 SVDV ICP-OES can be operated in synchronous vertical dual view (SVDV), vertical dual view (VDV), radial or axial modes for full flexibility with established methods and application requirements [1]. In this study, the 5100 ICP-OES was operated in SVDV mode and was coupled to an Agilent SVS 2+ Switching Valve System to maximize sample throughput and minimize argon gas consumption per sample.
SVDV mode allows the UV wavelengths from the vertically-oriented plasma to be read axially. This is ideal for the analysis of heavy matrix samples such as geochemical samples as it provides much lower method detection limits (MDLs) than the radial view mode often used for geochemical samples.
The standard sample introduction system supplied with the 5100 ICP-OES was used for this study. This comprised a SeaSpray nebulizer, double-pass glass cyclonic spray chamber and a standard 5100 Dual View torch (demountable, quartz, 1.8 mm injector). The instrument’s plug and play torch loader automatically aligned the torch and connected gases, allowing fast start up and reproducible performance, irrespective of the operator. Instrument operating conditions used are listed in Table 1.
Table 1. Agilent 5100 SVDV ICP-OES operating parameters
Parameter SettingTorch Standard DV torch (1.8 mm ID injector)Nebulizer Standard Seaspray
Spray chamber Standard double-pass glass cyclonic spray chamber
Read Time (s) 5 Replicates 3Sample uptake delay (s) 0 Stabilization time (s) 10 Rinse time (s) 3 Fast pump (80 rpm) YesBackground correction Left and/or right background correctionRF power (kW) 1.4 Nebulizer flow (L/min) Default: 0.70 Plasma flow (L/min) Default: 12.0 Aux flow (L/min) Default: 1.0 Viewing height (mm) Default: 8
The innovative SVS 2+ is a 7 port switching valve that more than doubles the productivity of the 5100 ICP-OES by reducing sample uptake, stabilization times, and rinse delays. The SVS 2+ includes a positive displacement pump that can achieve up to 500 rpm and rapidly pumps sample through the sample loop. It also features a bubble injector to help with sample washout.
SVS 2+ operating parameters are given in Table 2.
Table 2. SVS 2+ operating parameters
Parameter SettingLoop uptake delay (s) 4.5 Uptake pump speed (refill) (rpm) 375 Uptake pump speed (inject) (rpm) 130 Sample loop size (mL) 0.5 Time in sample (s) 3.5 Bubble inject time (s) 4.3
Standard and sample preparationA geochem base metal Certified Reference Material (CRM) OREAS 45e (ORE Research & Exploration P/L, Victoria, Australia) was used to validate the method.
The sample preparation procedure consisted of an Aqua Regia (AR) digestion on a hot plate. 1.0 g sample in 12 mL AR was refluxed at 60 °C for 0.5 hours and then at 110 °C for 2.0 hours. The solution was made to a total volume of 40 mL with Milli-Q water, resulting in a 30% AR final acid concentration, which is equivalent to 2.5% TDS.
All calibration standards solutions were prepared in 30% AR.
An internal standard solution of 20 ppm Lu and 200 ppm Rb was delivered using orange/green tubing which was connected to the white-white sample tubing via a T-connector (port 7 on the SVS 2+). Lu is rarely present in geochemical samples making it ideal as an internal standard. The Lu 261.541 nm wavelength was used used to correct the UV wavelengths.
The Rb 780.026 nm wavelength is suitable for K correction as it is a group 1 element with similar properties.

71
AGILENT TECHNOLOGIES
Geochemistry, Mining & Metals Applications
www.agilent.com/chem/5110icpoes
3
Inter-element correction (IEC) factors were setup using the ICP Expert v7 software to correct for spectral interferences. Once the factors were determined, they were stored in a template and reused in subsequent analyses.
Results and discussion
Method Detection Limits and CRM recoveriesThe Method Detection Limits (MDLs) are based on a 1 g to 40 mL sample dilution ratio. The results shown in Table 3 are an average of 3 determinations over 3 separate days. The axially viewed, vertical torch in the 5100 is able to achieve much lower MDLs for geochemical samples compared to a radially viewed plasma.
Excellent recoveries were obtained when the CRM OREAS 45e was analyzed using the 5100 ICP-OES. Table 4 lists the average of 3 determinations over 3 separate days. Elements without a certified value were determined with a spike recovery test. The spike recoveries for all elements were within ±10% (Table 5). Spike recoveries were determined using an average of 3 replicate results.
Table 5. Spike recovery test for additional elements not certified in CRM OREAS 45e.
Element Ag Cd Mo Ti ZrWavelength (nm) 328.068 214.439 202.032 334.188 343.823Spike amount (mg/L) 0.25 4 5 20 0.5
Spike recovery % 104.3 90.9 97.8 107.0 108.9
Table 3. MDLs (mg/kg) for target elements
Element Ag Al As Ba Ca Cd Co Cr Cu Fe KWavelength (nm) 328.068 236.705 188.980 233.527 370.602 214.439 228.615 266.602 222.778 273.358 766.491MDL (mg/kg) 0.025 0.81 0.37 0.013 0.17 0.011 0.048 0.109 0.21 3.5 8.0Element Mg Mn Mo Na Ni P Pb S Ti Zn ZrWavelength (nm) 277.983 294.921 202.032 588.995 230.299 213.618 220.353 181.972 334.188 334.502 343.823MDL (mg/kg) 0.48 0.021 0.072 1.9 0.057 0.34 0.23 2.7 0.03 0.9 0.015
Table 4. Recoveries for base metals in CRM OREAS 45e
Elements Al As Ba Ca Co Cr Cu Fe K Wavelength (nm) 236.706 188.981 233.528 370.603 228.616 266.603 222.779 273.359 766.492Certified (mg/kg) 33200 11.4 139 320 52 849 709 226500 530Measured (mg/kg) 33395 11.8 138 306 48 880 717 245789 487SD (mg/kg) 2329 0.6 2 6 1 17 27 4139 20
% Recovery 100.6 103.5 99.6 95.5 91.7 103.6 101.1 108.5 91.9
Elements Mg Mn Na Ni P Pb S Zn
Wavelength (nm) 277.984 294.922 588.996 230.3 213.619 220.354 181.973 334.503
Certified (mg/kg) 950 400 270 357 290 14.3 440 30.6 Measured (mg/kg) 974 398 244 341 301 12.9 426 29.0 SD (mg/kg) 37 10 5 15 10 0.4 16 1.6 % Recovery 102.5 99.4 90.4 95.6 103.8 90.1 96.9 94.9
72
AGILENT TECHNOLOGIES
Geochemistry, Mining & Metals Applications
4
Calibration linearityThe Vista Chip II detector used in the 5100 ICP-OES has the fastest processing speed (1 MHz) of any charge coupled device (CCD) detector used in ICP-OES and provides a full 8 orders of linear dynamic range by reducing the likelihood of pixel saturation and signal over-ranging.
All calibration curves showed excellent linearity, with correlation coefficients greater than 0.999. Figure 1 shows the calibration curve for Fe, with each calibration point having less than 0.5% readback error. This demonstrates the ability of the 5100’s 27 MHz solid state RF (SSRF) system to achieve linearity for all wavelengths over a wide concentration range (up to 10,000 mg/L in solution for Fe). This capability allows analysts to carry out single point calibration, simplifying operation.
Standards Concentration (ppm) % ErrorBlank 0 N/AStandard 1 100 0.05Standard 2 400 0.08Standard 3 2000 0.39Standard 4 10000 0.47
Figure 1. Calibration curve for Fe 273.358 nm line
Long Term Stability (LTS)The 27 MHz SSRF in the 5100 is able to deliver a robust plasma capable of excellent long term analytical stability, even with tough samples.
To evaluate the long term stability of the method, an ore sample was run over an 8 hour period. Results were normalized to 100 per the first sample and are shown in Figure 2. The long term %RSD were all below 2.1%. Cd was spiked in the sample as the concentration was originally less than the MDL.
Figure 2. Long term stability over 8 hours.
Fast sample throughput and low argon consumptionThe sample throughput of the 5100 ICP-OES is enhanced by:
• SVDV mode, which measures all wavelengths at once
• the SVS 2+, which reduces sample uptake, stabilization times, and rinse delays
• the fast Vista Chip 2 detector, that reads all wavelengths in a single measurement,
• and the design of the sample introduction system, with its short tubing lengths. This reduces sample uptake time and stabilization time
These factors delivered a sample analysis time of 40 seconds during this study. This equates to 90 samples per hour or 720 samples over an 8 hour day. The total Ar consumption was only 14 L/sample.
When running the 5100 SVDV without the SVS 2+, the additional rinse (45 sec) and uptake times (12 sec) increased the sample time to 96 seconds. When running in Dual View mode the analysis time was 113 seconds.
The times between the different operating modes of the same instrument are shown in Table 6.

73
AGILENT TECHNOLOGIES
Geochemistry, Mining & Metals Applications
www.agilent.com/chem/5110icpoes
5
Table 6. Comparison of operating modes: synchronous vertical dual view (SVDV) and vertical dual view (VDV)
SVDV + SVS 2+
SVDV VDV + SVS 2+ VDV
Sample to Sample time (sec) 40 96 57 113
Conclusions
Agilent’s 5100 SVDV ICP-OES with a vertical torch provides the robust analytical performance required for the analysis of tough geochemical samples while achieving rapid sample throughput and low Ar gas consumption.
The geochemical base metal reference material OREAS 45e was prepared using an Aqua Regia digestion. It was then successfully analyzed using the 5100 ICP-OES in SVDV mode.
In addition to excellent MDLs, spike recoveries, and linearity, sample throughput of 40 seconds per sample was achieved using the SVS 2+ switching valve, without any compromise in performance. This enabled the measurement of 90 samples per hour and reduced argon consumption to just 14 L/sample.
Reference
1. Benefits of a vertically oriented torch— fast, accurate results, even for your toughest samples, Agilent publication, (2014), 5991-4854EN

74
AGILENT TECHNOLOGIES
Energy & Chemicals Applications
Energy & Chemicals ApplicationsIn the chemical or energy industries, trace elements may be present in samples as contaminants or performance additives. Accurately determining the concentration of these trace elements is critical to understanding the quality and performance of the product, and for maximizing efficiency and cost-effectiveness in their manufacture.
Here’s how Agilent’s 5110 ICP-OES instrument addresses the specific needs of these industries:
Analysis requirement 5110 offers:
Ability to handle high matrix samples
A vertical torch that offers reliable analysis of samples with up to 30% total dissolved solids with less cleaning, less downtime and less replacement torches.
Excellent sensitivity Measurement of elements from low ppb to % level concentrations.
Reliable analysis results A cooled cone interface that reduces interferences and a solid state RF system that powers the plasma, delivering long term analytical stability.
Multiple operators Inuitive software, Click-and-Go methods and automatic algorithms to perform background and interference corrections make measuring samples easy. Agilent’s IntelliQuant function gives approximate concentrations of up to 70 elements in a sample from a fast single scan. A Plug-and-Play torch design ensures consistent placement and automated instrument health checks and self-diagnostics reduce instrument downtime.
> Return to Table of Contents> Search entire document
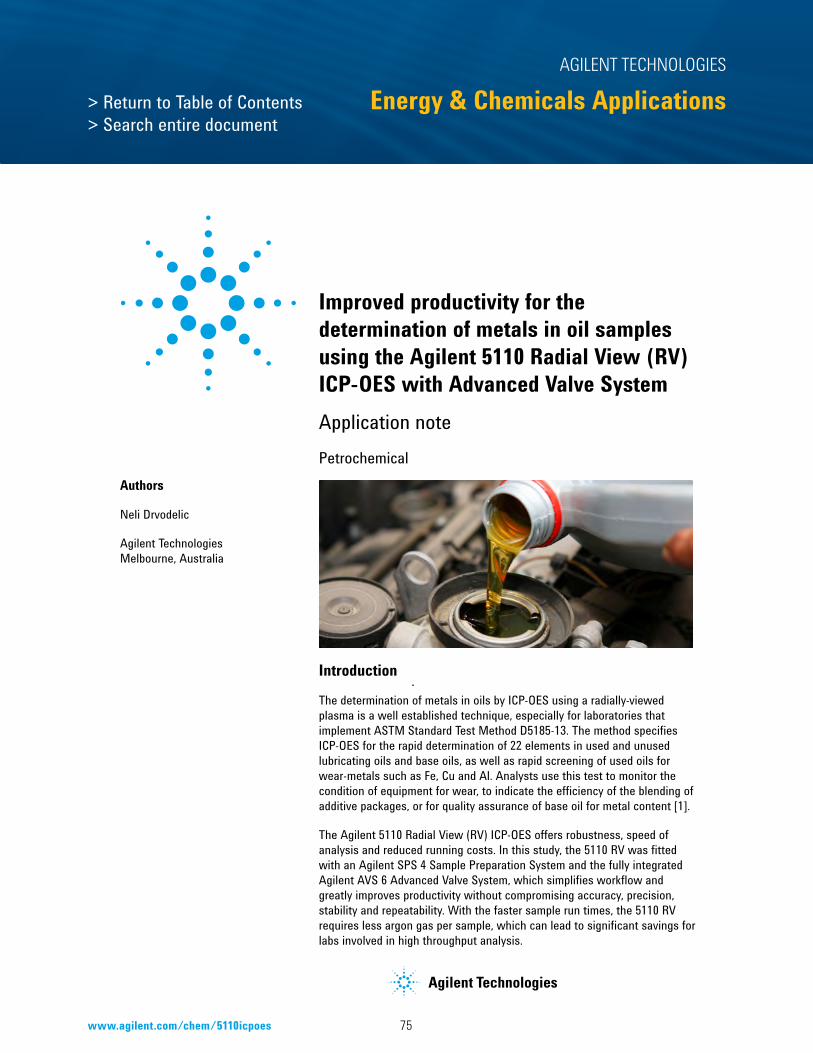
75www.agilent.com/chem/5110icpoes
AGILENT TECHNOLOGIES
Energy & Chemicals Applications
Introduction
The determination of metals in oils by ICP-OES using a radially-viewed plasma is a well established technique, especially for laboratories that implement ASTM Standard Test Method D5185-13. The method specifies ICP-OES for the rapid determination of 22 elements in used and unused lubricating oils and base oils, as well as rapid screening of used oils for wear-metals such as Fe, Cu and Al. Analysts use this test to monitor the condition of equipment for wear, to indicate the efficiency of the blending of additive packages, or for quality assurance of base oil for metal content [1].
The Agilent 5110 Radial View (RV) ICP-OES offers robustness, speed of analysis and reduced running costs. In this study, the 5110 RV was fitted with an Agilent SPS 4 Sample Preparation System and the fully integrated Agilent AVS 6 Advanced Valve System, which simplifies workflow and greatly improves productivity without compromising accuracy, precision, stability and repeatability. With the faster sample run times, the 5110 RV requires less argon gas per sample, which can lead to significant savings for labs involved in high throughput analysis.
Improved productivity for the determination of metals in oil samples using the Agilent 5110 Radial View (RV) ICP-OES with Advanced Valve SystemApplication note
Authors
Neli Drvodelic
Agilent Technologies Melbourne, Australia
Petrochemical
> Return to Table of Contents> Search entire document
76
AGILENT TECHNOLOGIES
Energy & Chemicals Applications
2
Experimental
InstrumentationThe Agilent 5110 RV ICP-OES was used for this analysis. The dedicated radial view (RV) configuration is ideal for the analysis of organic samples. The plug-and-play torch mechanism automatically aligns the vertical torch and connects all gases for fast start up while ensuring reproducible loading of the torch, independent of the operator. Mass flow controllers on the three gas lines into the torch as well as thermostatted optics facilitate long term stability of the emission signal as seen in the long term stability plot in Figure 2.
To run challenging samples, the RF system must be able to rapidly adjust to changes in the plasma conditions. The free running solid state radio frequency (SSRF) generator in the 5110 RV ICP-OES meets these challenges and can handle a wide range of organic samples, from volatile organics such as methanol or gasoline, to semi volatile organics such as kerosene. The benefit of this is that plasma conditions similar to those used for aqueous solutions can be used for organics without the need for high plasma gas flows. In addition, for the analysis of wear metals in kerosene based solvents, like A-Solv, there is no need for Ar/O2 addition to the auxiliary gas flow or the use of a temperature controlled spray chamber.
An Agilent SPS 4 Sample Preparation System was used for automatic sample delivery in combination with a 6 port Advanced Valve System (AVS 6) [2]. The fully integrated AVS 6 utilizes a high speed pump to minimize uptake, and controlled bubble injection to aid with stabilization and washout, offering high throughput and excellent analytical performance for organic sample analysis.
The AVS 6 uses a positive displacement pump, requiring little maintenance in comparison to vacuum based pumps. Setup is easy, designed for simple assembly and disassembly, and is robust enough to handle tough samples, making it ideal for oil analysis.
The sample introduction system chosen for this analysis was the semi-volatile organics kit comprising of a glass concentric nebulizer, a 1.4 mm id RV torch, solvent resistant tubing, and a double-pass glass cyclonic spray chamber.
Instrument operating conditions are listed in Tables 1a and 1b.
Fitted background correction was used for all wavelengths, simplifying the method development by eliminating the need to determine off-peak background correction points for each element.
Table 1a. Agilent 5110 RV ICP-OES and 6 port Advanced Valve System (AVS 6) operating parameters
Parameter Setting Read time (s) 2 Replicates 2 Sample uptake delay (s) 4.5 Stabilization time (s) 6 Rinse time (s) 2 (fast pump: Off) Pump speed (rpm) 12 RF power (kW) 1.30 Aux flow (L/min) 1.0Plasma flow (L/min) 12.0 Nebulizer flow (L/min) 0.65 AVS 6 settingsLoop volume (mL) 0.25 Pump rate: Valve uptake (mL/min) 36.0 Pump rate: Inject (mL/min) 10.0Bubble injection time (s) 2.5 Pre-emptive rinse time (s) 1.5
Table 1b. Agilent 5110 RV ICP-OES method parameters
Parameters Settings Ar/O2 addition Not requiredNebulizer Glass concentric Spray chamber Double Pass Cyclonic Torch Organic 1.4 mm id Sample pump tubing White-white SolvaFlex Waste pump tubing Grey-grey SolventFlex SPS 4 rinse solution Agilent A-Solv ICP solvent Background correction Fitted
The wavelengths selected for the analysis are given in Table 2. Wavelengths were selected according to the recommendations of ASTM D5185. Method Detection Limits (MDLs) are also given in Table 2. They are based on three sigma of ten replicate measurements of the blank solution during the analytical run and multiplied by ten (the sample dilution factor) to give the MDL in the original sample.

77www.agilent.com/chem/5110icpoes
AGILENT TECHNOLOGIES
Energy & Chemicals Applications
3
Table 2. Wavelengths used in the analysis. Method Detection Limits (MDLs) in the original sample are also shown.
Element and line MDL (mg/kg) Element and line MDL (mg/kg) Ag 328.068 0.020 Mn 257.610 0.0035Al 396.152 0.13 Mo 202.032 0.089B 249.772 0.032 Ni 231.604 0.269Ba 233.527 0.029 Na 588.995 0.456Ca 422.673 0.068 P 213.618 0.479Cd 226.502 0.021 Pb 220.353 0.601Cr 267.716 0.042 Si 288.158 0.115Cu 324.754 0.032 Sn 189.925 1.40Fe 259.940 0.049 Ti 334.188 0.023K 766.491 0.83 V 311.837 0.022Mg 285.213 0.049 Zn 213.857 0.028
Standard and sample preparationWorking standards of 0, 5, 10, 50 and 100 ppm were prepared from an Agilent A-21+K standard. This contains 22 elements (Ag, Al, B, Ba, Ca, Cd, Cr, Cu, Fe, K, Mg, Mn, Mo, Na, Ni, P, Pb, Si, Sn, Ti, V and Zn) at 500 ppm in oil. High concentration standards for Ba and Zn (200 ppm) and Ca, Cu, Fe and Mg (250 ppm) were prepared from 5000 ppm Single Element Standards in Hydrocarbon oil. These standards were matrix-matched for a constant viscosity using Base mineral oil (75 cSt) and diluted with Agilent A-Solv ICP solvent to give a total oil concentration of 10% (w/w) in each solution.
Used engine oil samples were diluted 1:10 (w/w) with A-Solv ICP solvent for the analysis. The samples were spiked with different concentrations of A-21+K to test the recoveries of wear metal elements and additive elements. Low concentration spikes were made at 25 ppm for all elements being determined. High concentration spikes, at 50 ppm for P and Zn, and 130 ppm for Ca were made. As with the standards, the samples were matrix-matched with the Base mineral oil to give a total oil concentration of 10% (w/w) in each solution.
Results and discussion
Linear calibrations were obtained with correlation coefficients greater than 0.999 for all wavelengths. This demonstrates the capability of the 5110 ICP-OES to detect low range (mg/kg) concentrations of elements in oil and at the same time monitor high concentrations of wear metals and additives with very high accuracy and precision. Figure 1 shows a calibration curve for Ca 422.673 up to 250 ppm with a correlation coefficient greater than 0.9999 and less than 3% calibration error on each calibration point. Because of the excellent linearity of the calibration curve, concentrations above the calibration range could be accurately measured, highlighting the achieved linear dynamic range (LDR) of the 5110 RV ICP-OES. The expansive LDR also allows the number of calibration standards to be reduced, which means more time can be spent running samples, and less time will be spent on calibration.
Figure 1. The calibration curve for Ca 422.673 nm up to 250 ppm shows excellent linearity across the calibrated range, with a correlation coefficient of 0.0.99995.
All elements were determined in the oil samples in a single run. The spike recoveries obtained with the 5110 RV ICP-OES fitted with the AVS 6 are shown in Table 3. All values are within 10% of the expected values. Analysis time per sample was 22 seconds which includes a 2 second rinse between samples and a two replicate reading per sample. Total Ar consumption was only 7 L per sample.
Spike recoveries were also measured using the 5110 RV ICP-OES without the AVS 6 and similar recoveries were obtained. However, the analysis time was found to be 52 seconds, compared to just 22 seconds using the AVS 6. With the time saved using the AVS 6 you can more than double sample throughput and halve the argon consumption.

78
AGILENT TECHNOLOGIES
Energy & Chemicals Applications
4
Table 3. Agilent 5110 ICP-OES spike recoveries for all elements in used engine oil. The 5110 was equipped with an SPS 4 autosampler and the integrated AVS 6.
Element and Line
Measured Engine Oil
(mg/L)
Spike Amount (mg/L)
Measured Spike
(mg/L)
Spike Recovery
(%)
Element and Line
Measured Engine Oil
(mg/L)
Spike Amount mg/L
Measured Spike
(mg/L)
Spike Recovery
(%)Ag 328.068 0.004 24.95 24.23 97% Mn 257.610 0.023 24.95 24.40 98%Al 396.152 0.279 24.95 24.48 97% Mo 202.032 4.977 24.95 30.91 104%B 249.772 3.65 24.95 28.94 101% Ni 231.604 <MDL 24.95 26.48 106%Ba 233.527 0.041 24.95 24.73 99% Na 588.995 0.874 24.95 24.71 96%Ca 422.673 78.67 133.06 215.84 103% P 213.618 36.21 49.23 86.96 103%Cd 226.502 0.032 24.95 24.71 99% Pb 220.353 0.019 24.95 26.65 107%Cr 267.716 0.026 24.95 24.72 99% Si 288.158 0.235 24.95 25.77 102%Cu 324.754 0.147 24.95 24.20 96% Sn 189.925 0.126 24.95 26.16 104%Fe 259.940 0.413 24.95 26.02 103% Ti 334.188 0.006 24.95 26.16 105%K 766.491 0.054 24.95 23.97 96% V 311.837 0.001 24.95 24.47 98%Mg 285.213 0.364 24.95 24.96 99% Zn 213.857 41.22 49.23 88.41 96%
Figure 2. Stability plot over 6 hours for all elements in a used oil sample using the 5110 RV ICP-OES with an AVS 6.

79www.agilent.com/chem/5110icpoes
AGILENT TECHNOLOGIES
Energy & Chemicals Applications
www.agilent.com/chemAgilent shall not be liable for errors contained herein or for incidental or consequential
damages in connection with the furnishing, performance or use of this material.
Information, descriptions, and specifications in this publication are subject to change without notice.
© Agilent Technologies, Inc. 2016Published May 1st, 2016
Publication number: 5991-6849EN
Long term stability of the 5110 RV ICP-OES was evaluated by setting up a complete analytical sequence with 2 seconds rinse time between each sample and measuring a used engine oil sample every 5 samples over a 6 hour period. Over the entire run 1000 samples were analyzed without recalibration. The stability plot for all elements is displayed in Figure 2.
Precision ranged between 1.1 and 2.7 %RSD, with less than 10% deviation in concentration from the initial reading which demonstrates the robust sample handling capability of the vertically-oriented plasma in the 5110 RV ICP-OES, and the excellent precision of the instrument when using the Advanced Valve System (AVS 6).
Conclusions
The Agilent 5110 RV ICP-OES is the ideal instrument for determining metals in oil samples as per the ASTM D5185 method that is widely used by laboratories involved in the direct analysis of lubricating oils for wear metals and additives. The 5110 RV offers a number of advantages compared to other radial view ICP-OES:
• Sample analysis cycle time of 22 seconds per sample and total gas consumption of 7 L Ar per sample, when fitted with the Advanced Valve System (AVS 6), without compromising accuracy, precision or stability
• Sample analysis cycle time of 52 seconds per sample using the 5110 RV ICP-OES without the AVS 6
• Excellent long term stability with <3% RSD over 6 hours using the AVS 6
• A vertical plasma and robust 27 MHz SSRF system delivers matrix handling capability and robustness
• Simplified day-to-day operation and method development due to an intuitive software interface and fully integrated valving system
• Hardware features such as the plug-and-play torch lead to excellent method repeatability between operators and from instrument to instrument
• Improved productivity by reducing sample uptake, stabilization and washout time with the AVS 6 without compromising on performance.
Reference
1. ASTM D5185-13, Standard Test Method for Multielement Determination of Used and Unused Lubricating Oils and Base Oils by Inductively Coupled Plasma Atomic Emission Spectrometry (ICP-AES)
2. Reduce costs and boost productivity with the AVS 6 or 7 port switching valve system. Agilent publication no. 5991-6863EN.
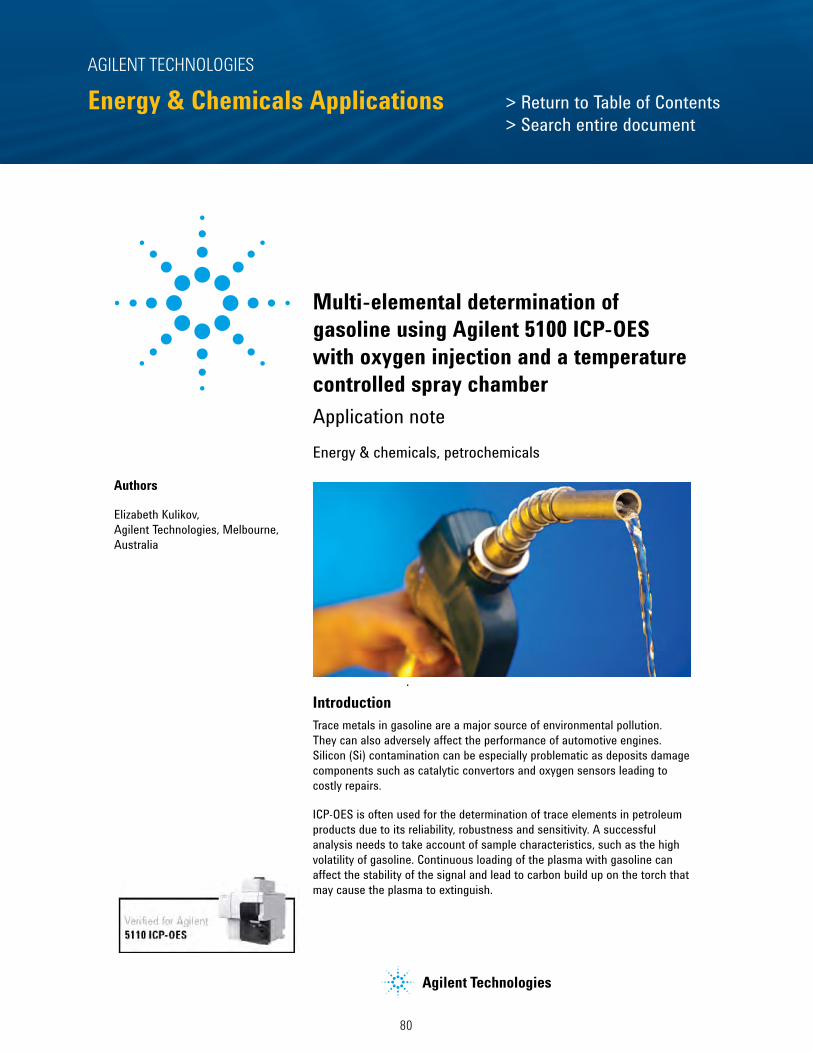
80
AGILENT TECHNOLOGIES
Energy & Chemicals Applications
Multi-elemental determination of gasoline using Agilent 5100 ICP-OES with oxygen injection and a temperature controlled spray chamberApplication note
Authors
Elizabeth Kulikov, Agilent Technologies, Melbourne, Australia
Energy & chemicals, petrochemicals
Introduction
IntroductionTrace metals in gasoline are a major source of environmental pollution. They can also adversely affect the performance of automotive engines. Silicon (Si) contamination can be especially problematic as deposits damage components such as catalytic convertors and oxygen sensors leading to costly repairs.
ICP-OES is often used for the determination of trace elements in petroleum products due to its reliability, robustness and sensitivity. A successful analysis needs to take account of sample characteristics, such as the high volatility of gasoline. Continuous loading of the plasma with gasoline can affect the stability of the signal and lead to carbon build up on the torch that may cause the plasma to extinguish.
IntroductionWhiskey production is a lucrative global industry that generates billions of dollars of business every year. There are over 20 whiskey producing countries, with Scotland leading the market with Scotch whisky, followed by the US, Canada, Ireland and Japan. Out of the 200+ countries that have developed a taste for whiskey, India consumes the most – more than three times as much as the US. Unsurprisingly, India is beginning to increase its own production of the spirit [1].
With the value of a whiskey highly dependent on type, brand and heritage, quality, age, and legal product definition, producers are keen to establish analytical methods to help them identify the unique aspects of their product and ways to preserve its authenticity against fraudulent practices.
Elemental Profiling of Whiskey using the Agilent 5100/5110 ICP-OES and MPP Chemometrics Software
Authors
Jenny Nelson1, Greg Gilleland1, Helene Hopfer2,3,4,and Susan E. Ebeler2,3,
1. Agilent Technologies, Inc., Santa Clara, CA, USA Application: Food Authenticity
2. Dept. Viticulture & Enology, University of California, Davis, CA, USA
3. Food Safety and Measurement Facility, University of California, Davis, CA, USA
4. Dept. Food Science, The Pennsylvania State University, University Park, PA, USA
Food authenticity
> Return to Table of Contents> Search entire document

81www.agilent.com/chem/5110icpoes
AGILENT TECHNOLOGIES
Energy & Chemicals Applications
2
In this study, the Agilent 5100 Synchronous Vertical Dual View (SVDV) ICP-OES was used for the analysis of 21 elements in gasoline, including Si. Oxygen was added to the auxiliary argon gas flow to reduce carbon build up on the torch, maintain a stable plasma and reduce carbon emission from the organic solvent. A programmable temperature spray chamber, set to -10 °C, was used to reduce vapor loading on the plasma, ensuring a more stable plasma.
Analysis of volatile organic samplesThe 5100 SVDV ICP-OES is highly suited to the analysis of volatile organic samples. It uses a solid state radio frequency (SSRF) system operating at 27 MHz to provide a robust and stable plasma capable of handling a wide range of organic samples, including volatile organics like gasoline. The SSRF has the ability to adjust to rapid changes in the plasma, even when increasing sample uptake speed by fast pumping to 80 rpm. This means that plasma conditions similar to those used for aqueous solutions can be used for organics, without the need for high plasma gas flows.
The sample handling capability of the 5100’s vertically-oriented plasma delivers the robustness required for the routine measurement of challenging volatile samples, and ensures maximum plasma stability. The torch is automatically aligned using the simple torch loader and no further adjustments or optical alignments are required. The mechanism also connects all gases for fast startup and reproducible performance.
Depending on established methods and application requirements, the 5100 SVDV ICP-OES can be operated in synchronous vertical dual view (SVDV), vertical dual view (VDV), radial (RV) or axial (AV) modes. As gasoline is traditionally measured radially for better sample handling with a vertical torch, the 5100 was operated in RV mode.
Carbon species present in organic solvents can interfere with some elements. A more accurate measurement of the analyte signal is possible using Agilent’s Fast Automated Curve-fitting Technique (FACT) to model the complex background structure due to C-emissions and correct for any spectral interferences [1].
Experimental
InstrumentationThe Agilent 5100 SVDV ICP-OES with temperature controlled spray chamber and oxygen injection was used for the determination of 21 elements in gasoline. The instrument was fitted with the volatile organics sample introduction system consisting of a glass concentric nebulizer, 0.8 mm i.d. RV torch, solvent resistant tubing, and an IsoMist temperature controlled spray chamber. The spray chamber was operated at the minimum temperature of -10 °C. An Agilent SPS 4 autosampler was also used.
The 5100 SVDV ICP-OES is equipped with a three port gas module. This allows an Ar/O2 gas mix to be routed automatically through the auxiliary gas line to prevent carbon build up on the torch, reduce carbon band emissions and sustain the plasma during analysis. The addition of the Ar/O2 gas mix is fully controlled by the ICP Expert software.
Instrument and method parameters used are listed in Table 1a and b.
Table 1a. Agilent 5100 ICP-OES operating parameters
Parameter SettingRead time (s) 15 Replicates 3Sample uptake delay (s) 30 (fast pumping ON)Stabilization time (s) 10 Rinse time (s) 45 Pump speed (rpm) 10 RF power (W) 1500 Aux flow (L/min) 1.0 Plasma flow (L/min) 12.0 Nebulizer flow (L/min) 0.50 Viewing mode RadialViewing Height (mm) 8 Ar/O2 addition YesAr/O2 (%) 15Background correction Fitted and FACT

82
AGILENT TECHNOLOGIES
Energy & Chemicals Applications
3
Table 1b. Agilent 5100 ICP-OES sample introduction setup
Parameter SettingNebulizer Glass SeaSpray Spray chamber IsoMist temperature controlled
spray chamber Torch Volatile organics torch with 0.8 mm
ID injector Sample tubing Black/Black Solva FlexWaste tubing Grey/grey Solva FlexIsoMist temperature (°C) -10
Standards, sample and sample preparationThe method of standard additions (MSA) was used for the analysis to give better accuracy in determining standard and sample concentrations. Complex samples, like gasoline, are difficult to matrix match and must be measured by MSA to minimize physical and chemical differences between samples and standards.
Calibration standards were prepared at 0.5 and 1 ppm by spiking aliquots of gasoline with Agilent A21 oil standard (100 ppm in 75 cSt hydrocarbon oil). Agilent base mineral oil (75 cSt mineral oil) was used to match the viscosity of the standards. The solution was then diluted 1 in 10 using Agilent A-SOLV ICP solvent to give a total oil concentration of 10 % (w/w).
Premium Unleaded Petrol (PULP) 98 Ron was used as the sample. Approx. 2.5 g of the gasoline was diluted 1 in 10 (w/w) in Agilent A-SOLV ICP solvent. The solution was matrix matched using Agilent base mineral oil to give a total oil conc. of 10% (w/w).
To test the recoveries of all 21 elements in gasoline, the samples diluted in Agilent ICP solvent were spiked with low (approx. 0.5 ppm) and high (approx. 1 ppm) concentrations of Agilent A21 oil standard.
Background correctionIn this analysis, Fast Automated Curve-fitting Technique (FACT) correction was applied to P and Pb to minimize spectral interferences from carbon species present in the organic solvent and to improve detection limits. Table 2 displays the Method Detection Limits (MDLs) for P and Pb obtained using Fitted and FACT background correction. The results show that FACT background correction led to lower DLs.
Table 2. Method Detection Limits determined using Fitted and FACT background correction techniques
Element and wavelength (nm)
Fitted MDL (ppm)
FACT MDL (ppm)
P 213.618 0.386 0.065Pb 261.417 1.363 0.119
Results and discussionCalibration linearityLinear calibrations were obtained for all analytes. Calibration coefficients were greater than 0.999 and the calibration error for each point was less than 10% for all wavelengths. Figure 1 shows the calibration curve for Si 288.158 nm. Table 3 displays the calibration error for each calibration point for 288.158 nm.
Figure 1. Calibration curve for Si 288.158 nm shows excellent linearity across the calibrated range, with a correlation coefficient of 0.99997.
Table 3. Calibration error (%) for each calibration point for Si 288.158 nm Standard Calibration error (%)Reagent blank 0.00Addition 1- 0.5ppm 0.91Addition 2- 1ppm 0.48
MDLs shown in Table 4 are based on three sigma of ten replicate measurements of the blank solution. The replicate measurements were multiplied by 10 to account for the 1 in 10 dilution of the original gasoline sample.

83www.agilent.com/chem/5110icpoes
AGILENT TECHNOLOGIES
Energy & Chemicals Applications
4
Table 4. Method Detection Limits for 21 elements in the original gasoline sample
Element & wavelength (nm)
MDL (ppm)
Element & wavelength (nm)
MDL (ppm)
Ag 328.068 0.020 Mo 281.615 0.058Al 308.215 0.163 Na 589.592 0.067B 249.772 0.026 Ni 221.648 0.202Ba 493.408 0.001 P 213.618 0.065Ca 396.847 0.008 Pb 261.417 0.144Cd 226.502 0.018 Si 288.158 0.110Cr 205.560 0.058 Sn 283.998 0.241Cu 327.395 0.031 Ti 336.122 0.030Fe 238.204 0.020 V 311.070 0.014Mg 285.213 0.021 Zn 213.857 0.024Mn 257.610 0.004
Table 5. Low and high level spike recoveries for all elements in gasoline
0.5 ppm spike 1.04 ppm spikeElement & wavelength
(nm)Gasoline sample
(ppm)Measured conc.
(ppm)Recovery
(%)Measured conc.
(ppm)Recovery
(%)Ag 328.068 <MDL 0.51 103 1.07 103Al 308.215 <MDL 0.51 103 1.07 103B 249.772 <MDL 0.53 105 1.09 105Ba 493.408 <MDL 0.52 103 1.08 104Ca 396.847 <MDL 0.52 104 1.07 103Cd 226.502 <MDL 0.50 100 1.04 100Cr 205.560 <MDL 0.50 100 1.06 102Cu 327.395 <MDL 0.52 104 1.07 103
Fe 238.204 <MDL 0.51 103 1.06 102Mg 285.213 <MDL 0.52 104 1.08 104Mn 257.610 <MDL 0.51 103 1.07 103Mo 281.615 <MDL 0.51 101 1.06 102Na 589.592 <MDL 0.54 108 1.09 105Ni 221.648 <MDL 0.51 103 1.05 101P 213.618 <MDL 0.49 98 1.02 99Pb 261.417 <MDL 0.53 106 1.08 104Si 288.158 0.0117 0.54 108 1.11 107Sn 283.998 <MDL 0.50 99 1.03 100Ti 336.122 <MDL 0.52 103 1.07 103V 311.070 <MDL 0.51 102 1.06 102Zn 213.857 <MDL 0.50 100 1.03 99
Spike recoveriesAccuracy was checked by spiking a gasoline sample with two different concentration levels (0.5 and 1.04 ppm). For all analytes, spike recoveries ranged from 98 to 108% (Table 5). The excellent recoveries demonstrate the ability of the 5100 ICP-OES to accurately determine all elements at the required levels in gasoline.
Only Si (0.0117 mg/kg) was detected in the diluted sample with all other elements being below the detection limit for the method.

84
AGILENT TECHNOLOGIES
Energy & Chemicals Applications
5
Long-term stabilityLong term stability (LTS) of the 5100 ICP-OES was measured by continuously analyzing a 1 ppm A21 spiked gasoline sample over an 8 hour period. Over 600 samples were analyzed throughout the entire run, without the need to re-calibrate. The resulting plot for all elements, displayed in Figure 2, shows excellent stability over 8 hours, with recoveries of all elements within ±10% of target values. Precision (%RSD) was <3% for all spiked elements, as shown in Table 6. These results demonstrate that the combination of the vertical torch and 27 Mhz SSRF system in the 5100 ICP-OES is robust enough to sustain the plasma throughout the 8 hr period of continuous analysis of the spiked gasoline sample. The excellent long term stability achieved is also attributed to the oxygen injected into the auxiliary argon gas flow and the use of the temperature controlled spray chamber to maintain a highly stable plasma.
Figure 2. Normalized concentration of 21 elements in spiked gasoline sample
Table 6. LTS results: %RSDs of spiked elements at 1 ppm over 8 hours
Element & wavelength (nm)
%RSD Element & wavelength (nm)
%RSD
Ag 328.068 0.57 Mo 281.615 1.42Al 308.215 0.81 Na 589.592 1.57B 249.772 0.51 Ni 221.648 1.83Ba 493.408 0.52 P 213.618 2.60Ca 396.847 0.26 Pb 261.417 1.54Cd 226.502 1.71 Si 288.158 0.72Cr 205.560 1.46 Sn 283.998 2.67Cu 327.395 0.49 Ti 336.122 0.64Fe 238.204 1.21 V 311.070 0.89Mg 285.213 0.45 Zn 213.857 1.44Mn 257.610 1.03
Conclusions
Agilent’s 5100 SVDV ICP-OES, operating in radial view mode with a vertical torch and 27 MHz SSRF system, provides the stability and robustness required for analysis of volatile organic samples, such as gasoline. With the addition of oxygen and the use of a temperature controlled spray chamber, the 5100 ICP-OES method delivered:
• Excellent method detection limits at sub-ppm levels for all 21 elements
• Excellent spike recoveries in gasoline at 0.5 ppm and 1 ppm level
• Excellent long term stability of 1 ppm spikes in gasoline with <3 %RSD drift over 8 hours.
References
Real-time spectral correction of complex samples using FACT spectral deconvolution software, Agilent publication 5991-4854EN, (2014)

85www.agilent.com/chem/5110icpoes
AGILENT TECHNOLOGIES
Energy & Chemicals Applications
Analysis of ethanol fuel according to standard methods using the Agilent 5100 SVDV ICP-OES
Application note
Authors
Alex Virgilio1, Clarice D. B. Amaral1, Daniela Schiavo2, Joaquim A. Nóbrega1
1. Group of Applied Instrumental Analysis, Department of Chemistry, Federal University of São Carlos, São Carlos, SP, Brazil
2. Agilent Technologies, São Paulo, SP, Brazil
Energy & chemicals, biofuels
Introduction
Fossil fuels have been the main source of energy in industrial applications and transportation for decades. However, depleting reserves, environmental concerns and economic issues have led to the development of renewable, cheaper and cleaner alternatives. Bio-ethanol is one of those alternatives and is derived by fermenting the sugar and starch components of plant by-products.
Different purities of bio-ethanol are used as fuel sources. Hydrated ethanol fuel has not had treatment to remove moisture and contains between 93-96% ethanol. It is often used in flexible (flex-fuel) or dual fuel engines. Anhydrous ethanol has been treated to remove moisture and has a purity of at least 99%. It is blended at up to 25% v/v with gasoline.
High purity fuel can be contaminated with elemental impurities during production, stockpiling and transportation, so accurate quantitation of metal content is important. According to ASTM D4806 specification [1] and the Brazilian National Agency of Petroleum, Natural Gas and Biofuels
IntroductionWhiskey production is a lucrative global industry that generates billions of dollars of business every year. There are over 20 whiskey producing countries, with Scotland leading the market with Scotch whisky, followed by the US, Canada, Ireland and Japan. Out of the 200+ countries that have developed a taste for whiskey, India consumes the most – more than three times as much as the US. Unsurprisingly, India is beginning to increase its own production of the spirit [1].
With the value of a whiskey highly dependent on type, brand and heritage, quality, age, and legal product definition, producers are keen to establish analytical methods to help them identify the unique aspects of their product and ways to preserve its authenticity against fraudulent practices.
Elemental Profiling of Whiskey using the Agilent 5100/5110 ICP-OES and MPP Chemometrics Software
Authors
Jenny Nelson1, Greg Gilleland1, Helene Hopfer2,3,4,and Susan E. Ebeler2,3,
1. Agilent Technologies, Inc., Santa Clara, CA, USA Application: Food Authenticity
2. Dept. Viticulture & Enology, University of California, Davis, CA, USA
3. Food Safety and Measurement Facility, University of California, Davis, CA, USA
4. Dept. Food Science, The Pennsylvania State University, University Park, PA, USA
Food authenticity
> Return to Table of Contents> Search entire document

86
AGILENT TECHNOLOGIES
Energy & Chemicals Applications
2
(ANP) Resolution number 19/2015 [2], the presence of Cu, Fe, Na and S in ethanol must be controlled. Limit concentrations for Cu are 0.1 and 0.07 mg/kg (ASTM and ANP respectively), 5 mg/kg Fe (ANP), 2 mg/kg Na (ANP), and 30 mg/kg S (ASTM).
In this study, the accuracy, precision and long term stability performance of the Agilent 5100 Synchronous Vertical Dual View (SVDV) ICP-OES was evaluated for the determination of Cu, Fe, Na and S in ethanol fuel samples according to ASTM D4806 and ANP Resolution 19/2015 methods.
Experimental
InstrumentationAll measurements were carried out using an Agilent 5100 SVDV ICP-OES, which is equipped with a Dichroic Spectral Combiner (DSC). The 5100 SVDV uses the DSC to facilitate both axial and radial view emissions from the plasma to be measured at the same time, in a single reading, over the entire wavelength range. This increases the linear working range, improves sample throughput and ensures that the amount of argon consumed per sample is lower than conventional simultaneous DV ICP-OES systems. The 5100 ICP-OES uses a vertically orientated torch and a solid-state radio frequency (SSRF) system operating at 27 MHz to deliver a plasma with the stability and robustness necessary for the analysis of organic samples. Data acquisition times are the same for the 5100 operating in SVDV or axial view mode.
The 5100 was fitted with a standard sample introduction system comprising a glass concentric nebulizer and a glass single-pass cyclonic spray chamber. Although this configuration is typically used for the analysis of aqueous solutions, it is also suited to the analysis of diluted organic samples. A standard dual view torch (1.8 mm ID injector) was used. Black/Black Solva Flex tubing was used for the sample, and Grey/Grey Solva Flex tubing was used for the waste.
The 5100 SVDV ICP-OES features a three port gas module allowing an Ar/O2 gas mix to be routed automatically through the auxiliary gas line. The addition of oxygen to the plasma is sometimes necessary during
the analysis of organic samples to eliminate carbon build up in the torch. Oxygen wasn’t added in this work and no carbon deposition was observed. Instrument operating conditions are listed in Table 1.
Table 1. Agilent 5100 SVDV ICP-OES operating parameters
Parameter SettingRF applied power (kW) 1.50Auxiliary gas flow rate (L/min) 1.0Plasma gas flow rate (L/min) 12Nebulizer gas flow rate (L/min) 0.60Ar/O2 addition Not requiredViewing height (mm) 8Pump speed (rpm) 12Stabilization time (s) 15Read time (s) 20Replicates 3Viewing mode SVDVBackground correction FittedElements and emission wavelengths (nm)
Cu – 324.754; 327.395Fe – 238.204; 259.940Na – 588.995; 589.592S – 180.669; 181.972
Standards and sample preparationMulti-element calibration standards containing 0, 0.01, 0.05, 0.1, 0.5, 1.0, 5.0 and 10.0 mg/L Cu, 0, 0.1, 0.5, 1.0, 5.0, 10.0, 20.0 and 40.0 mg/L Fe and Na, and 0, 1.0, 5.0, 10.0, 20.0, 50.0, 75.0 and 100.0 mg/L S were prepared in 10% v/v ethanol by dilution with 1% v/v HNO3. Hydrated ethanol fuel samples were prepared by simple 10-fold dilution with 1% v/v HNO3.
In order to check accuracy and precision as stated in the ASTM and ANP methods, ethanol fuel samples were spiked at half of the target concentration and at the target concentration. Spikes were added at 0.03 and 0.07 mg/kg Cu, 2.5 and 5.0 mg/kg Fe, 1.0 and 2.0 mg/kg Na, and 15 and 30 mg/kg S. Long-term stability (150 min) was evaluated using a solution containing 0.5 mg/L Cu, 5 mg/L Fe and 20 mg/L S in 10% v/v ethanol.

87www.agilent.com/chem/5110icpoes
AGILENT TECHNOLOGIES
Energy & Chemicals Applications
3
Method detection limits (MDLs) were calculated from background equivalent concentrations (BEC) and signal-to-background ratios (SBR) of ten replicate measurements of the 10% v/v ethanol blank solution using the 5100 in SVDV mode. The linear calibration range, sensitivity (slope of the calibration curves) and MDLs for Cu, Fe, Na and S are shown in Table 2. For all emission lines, the MDLs (considering the 10-fold dilution) were below the limits specified in ASTM D4806 and ANP Resolution 19/2015.
Calibration linearityThe calibration curves for Na and S (Figure 1) show excellent linearity across the calibrated range, with correlation coefficients of 1.00000 and 0.99997 respectively.
Results and discussionTable 2. Linear calibration range, sensitivity and method detection limits (MDL) for Cu, Fe, Na and S in ethanol fuel using the 5100 SVDV ICP-OES according to ASTM D4806 and ANP Resolution no. 19.
Element Wavelength (nm) Calibration range(mg/L)
Sensitivity(counts per sec./ppm)
MDL(mg/kg)
ASTM limits*(mg/kg)
ANP limits** (mg/kg)
Cu 324.754 0 – 10.0 45615 0.02 0.1 0.07327.395 0 – 10.0 45105 0.003 0.1 0.07
Fe 238.204 0 – 40.0 32350 0.003 - 5.0259.940 0 – 40.0 12247 0.006 - 5.0
Na 588.995 0 – 40.0 16071 0.27 - 2.0589.592 0 – 40.0 8097 0.06 - 2.0
S 180.669 0 – 100.0 83 1.7 30.0 -181.972 0 – 100.0 139 12.7 30.0 -
* The maximum concentration allowed by ASTM D4806 **The maximum concentration allowed by ANP Resolution no. 19.
Figure 1. Calibration curve for Na (upper) and S (lower) by using the 5100 SVDV ICP OES
Long-term stabilityThe long term stability of the Agilent 5100 SVDV ICP-OES was evaluated by analyzing a solution containing 0.5 mg/L Cu, 5 mg/L Fe and 20 mg/L S in 10% v/v ethanol over 150 min. Good stability was achieved for Cu, Fe and S, with recoveries within ±10% over the sequence. No changes in plasma stability were observed during this study.

88
AGILENT TECHNOLOGIES
Energy & Chemicals Applications
www.agilent.comAgilent shall not be liable for errors contained herein or for incidental or consequential
damages in connection with the furnishing, performance or use of this material.
Information, descriptions, and specifications in this publication are subject to change without notice.
© Agilent Technologies, Inc. 2015Published September 25, 2015
Publication number: 5991-6198EN
reading. This enables fast simultaneous data acquisition and ensures that the amount of argon consumed per sample is low and no more than single-view ICP-OES.
References1. American Society for Testing and Materials – ASTM D4806 – Standard Specification for Denatured Fuel Ethanol for Blending with Gasolines for Use as Automotive Spark-Ignition Engine Fuel. 2015.
2. Brazilian National Agency of Petroleum, Natural Gas and Biofuels, Resolution ANP Resolution number 19, D.O.U. April 16, 2015.
Spike recoveriesTable 3. Mean spike recoveries for Cu, Fe, Na and S in three ethanol fuel samples.
Spiked level 1 Spiked level 2Element Wavelength
(nm)Spike conc.
(mg/kg)Measured (mg/kg)
Recovery(%)
Spike conc.(mg/kg)
Measured (mg/kg)
Recovery(%)
Cu 324.754 0.030 0.027 ± 0.001 90 0.070 0.069 ± 0.001 99327.395 0.030 0.032 ± 0.001 107 0.070 0.070 ± 0.001 100
Fe 238.204 2.50 2.54 ± 0.02 102 5.0 5.4 ± 0.1 108259.940 2.50 2.58 ± 0.02 103 5.0 5.3 ± 0.1 106
Na 588.995 1.00 0.88 ± 0.02 88 2.00 1.98 ± 0.03 99589.592 1.00 1.01 ± 0.02 101 2.00 2.05 ± 0.03 103
S 180.669 15.0 15.7 ± 0.2 105 30.0 31.7 ± 0.2 106181.972 15.0 15.9 ± 0.2 106 30.0 31.0 ± 0.2 103
For all analytes, spike recoveries ranged from 88 to 108 % with precision (relative standard deviation) better than 3.3 % (n = 3) in SVDV mode (Table 3). Similar results (not shown) were obtained in axial-view mode. The recoveries demonstrate the ability of the 5100 SVDV ICP-OES to accurately determine Cu, Fe, Na and S at the required levels in the ethanol fuel samples.
Only S (0.37-1.65 mg/kg) and Na (0.11-0.17 mg/kg) were detected in the diluted samples.
ConclusionsThe method detection limits demonstrated that the Agilent 5100 SVDV ICP-OES meets industry requirements for the analysis of Cu, Fe, Na and S in hydrated ethanol fuel after a simple 10-fold dilution with HNO3 , as specified in both ASTM D4806 and ANP resolution no. 19. Excellent accuracy was achieved, as illustrated by the spike recovery results, which were within expected limits. Precision was better than 3.3 % RSD and stability remained within ±10% of expected value over the 2.5 hours of analysis.
The 5100 operating in Synchronous Vertical Dual View (SVDV) mode combines the robustness of a vertically-oriented torch and plasma with the sensitivity of axial view ICP-OES. Advanced DSC technology allows both the axial and radial views of the plasma to be captured in one

89www.agilent.com/chem/5110icpoes
AGILENT TECHNOLOGIES
Energy & Chemicals Applications
Introduction
The use of renewable fuels based on alkyl esters derived from “bio” sources such as vegetable or animal-derived oils has increased steadily since the 1990s. Biodiesel is rated using a “B” rating scale. B100 refers to 100% pure biodiesel and B20 represents 20% biodiesel blended with 80% petro-diesel. Typically, blended fuel with a B20 or below rating can be used in diesel-powered equipment, including automotive engines, with no, or minimal modifi cation. Metal contaminants in biofuels are carefully controlled as part of the quality assurance testing of the fi nal product and biofuel producers are required to adhere to various specifi cations including the maximum levels of Na & K, Ca & Mg, S and P content in fuels. Regulated levels specifi ed in US ASTM standard D6751 (for the biodiesel component of a blended fuel) and European Union EN standard 14214 (for B100 or blended biofuels) are given in Table 1.
The determination of metals in biodiesel by ICP-OES with either a radially- or axially-viewed plasma is a well-established and regularly-used technique within the industry.
Analysis of biodiesel oil (as per ASTM D6751 & EN 14214) using the Agilent 5100 SVDV ICP-OES
Application note
Author
Neli Drvodelic
Agilent TechnologiesMelbourne, Australia
Petrochemical
IntroductionWhiskey production is a lucrative global industry that generates billions of dollars of business every year. There are over 20 whiskey producing countries, with Scotland leading the market with Scotch whisky, followed by the US, Canada, Ireland and Japan. Out of the 200+ countries that have developed a taste for whiskey, India consumes the most – more than three times as much as the US. Unsurprisingly, India is beginning to increase its own production of the spirit [1].
With the value of a whiskey highly dependent on type, brand and heritage, quality, age, and legal product definition, producers are keen to establish analytical methods to help them identify the unique aspects of their product and ways to preserve its authenticity against fraudulent practices.
Elemental Profiling of Whiskey using the Agilent 5100/5110 ICP-OES and MPP Chemometrics Software
Authors
Jenny Nelson1, Greg Gilleland1, Helene Hopfer2,3,4,and Susan E. Ebeler2,3,
1. Agilent Technologies, Inc., Santa Clara, CA, USA Application: Food Authenticity
2. Dept. Viticulture & Enology, University of California, Davis, CA, USA
3. Food Safety and Measurement Facility, University of California, Davis, CA, USA
4. Dept. Food Science, The Pennsylvania State University, University Park, PA, USA
Food authenticity
> Return to Table of Contents> Search entire document

90
AGILENT TECHNOLOGIES
Energy & Chemicals Applications
2
This application note examines the use of the Agilent 5100 Synchronous Vertical Dual View (SVDV) ICP-OES for biodiesel analysis.
With the Agilent 5100 Synchronous Vertical Dual View (SVDV) ICP-OES, the operator has the fl exibility to select the plasma view (radial or axial), based on the elements they need to measure and the detection limits they need to achieve.
The 5100 SVDV ICP-OES also offers a high level of plasma robustness, delivering long term analytical stability. Its fast sample analysis reduces argon gas consumption and associated running costs, and the instrument achieves excellent overall analytical performance.
Table 1. US and EU specifi cations for elemental contaminants in biodiesel.
Metal ASTM D6751mg/kg
EN 14214 – 2012mg/kg
Group I metals: Na & K 5 (combined) 5 (combined)Group II metals: Ca & Mg 5 (combined) 5 (combined)
Phosphorus 10 4Sulfur 15 10
Experimental
InstrumentationThe Agilent 5100 SVDV ICP-OES was equipped with a glass concentric nebulizer and the Agilent organics kit that comprises a torch with a 1.4 mm i.d. injector, solvent resistant tubing, and a double pass cyclonic spray chamber. The instrument uses a solid-state RF (SSRF) system operating at 27 MHz to deliver a stable, robust plasma with excellent long term analytical stability, even for the analysis of organic samples. As the RF system is able to rapidly adjust to changes in plasma conditions, the 5100 SVDV ICP-OES can easily analyze a wide range of organic samples, from volatile organics such as methanol and gasoline to semi-volatiles like kerosene and other solvents, using low gas fl ow plasma conditions similar to those used to analyze aqueous solutions. All measurements were performed with axial plasma viewing. An Agilent SPS 3 Sample Preparation System was used for automatic sample delivery.
The 5100 SVDV ICP-OES features a three port gas module allowing an Ar/O2 gas mix to be routed automatically through the auxiliary gas line. The addition of oxygen to the plasma is sometimes necessary to eliminate carbon build up in the torch. However, when using kerosene as the primary solvent, oxygen addition wasn’t necessary because of the vertically-oriented plasma.
Fast Automated Curve-Fitting Technique (FACT) When analyzing samples diluted in an organic solvent, spectral interferences originating from carbon are known to interfere with certain elements. In this analysis of biodiesel, FACT correction was applied to the K and Na lines to improve detection limits. Traditional off-peak background correction cannot effectively determine the background signal under the analyte peak with adequate accuracy or precision. Agilent’s patented FACT background correction simplifi es method development by eliminating the need to manually determine correction points for all elements. A more accurate measurement of the analyte signal is possible using FACT to model the complex background structure due to C-emissions. FACT models are easily created, based on the spectrum of a blank and analyte. For the determination of a low level of Na in a biodiesel matrix dissolved in a kerosene-based solvent, FACT can lower the quantitation limit by an order of magnitude, with no increase in analysis time. The MDLs for Na and K, using fi rst FACT background correction and then Fitted background correction are given in Table 3, showing the lower quantitation possible with FACT background correction.
Method and instrument operating conditions used are listed in Table 2. Wavelengths and calibration parameters selected for the analysis are given in Table 3.

91www.agilent.com/chem/5110icpoes
AGILENT TECHNOLOGIES
Energy & Chemicals Applications
3
Table 2. Agilent 5100 SVDV ICP-OES method and instrument operating parameters.
Parameters Setting Ar/O2 addition Not required Sample tubes Black/black Solva Flex Drain tubes Blue/blue Solva Flex SPS 3 rinse Kerosene Background correction Fitted and FACT Read time (s) 10 Replicates 3 Sample uptake delay (s) 20 Stabilization time (s) 10 Rinse time (s) 20 (fast pumping: On) Pump speed (rpm) 10 RF power (kW) 1.40 Aux fl ow (L/min) 1.0 Plasma fl ow (L/min) 12.0 Nebulizer fl ow (L/min) 0.55
Standard and sample preparation
Working standards were prepared at 0.5 ppm, 1 ppm and 2 ppm from a Conostan Custom Blend Multi-element biodiesel standard, containing 20 ppm of Ca, Mg, Na, K and P (Conostan Division, Conoco Specialty Products Inc., Ponca City, OK, USA). Solutions were shaken before measurement to ensure proper mixing of P in solutions.
The standard blank was prepared by diluting the Metal Biodiesel Blank with the diluent 1:10.
The sulfur standards were prepared separately from a single element standard containing 20 ppm sulfur (Conostan). Kerosene (D60 Recosol) was used as the diluent. All solutions were viscosity-matched on a weight-to-weight basis using a Conostan Biodiesel Blank to give a total oil concentration of 10 % (w/w) in each solution. The B100 biodiesel sample was obtained from a local biodiesel distributor. To measure the recovery of the elements at the 0.5 ppm level, the B100 sample (0.75 g) was spiked with 0.25 g biodiesel standards (20 ppm) and diluted 1:10 with kerosene (10 g). The B100 sample was prepared the same way, but using a biodiesel blank instead of the biodiesel standard.
Results and discussion
The Method Detection Limits (MDLs) given in Table 3 are based on three sigma of ten replicate measurements of the standard blank solution during the analytical run. The results show that the method has the sensitivity required to exceed the US and EU specifi cations for the determination of Ca, K, Mg, Na, P and S in biodiesel.
Table 3. Agilent 5100 ICP-OES wavelengths and calibration parameters used throughout the analysis. Method Detection Limits (MDLs) are also shown. All results are shown in solutions.
Elements λ (nm) Background correction used
Calibration range (mg/kg)
Correlation coeffi cient
MDL (ppm)
Ca 422.673 Fitted 0-2 0.99995 0.004 K 766.491 FACT 0-2 0.99996 0.008 K 766.491 Fitted 0-2 0.99935 0.048Mg 279.553 Fitted 0-2 0.99994 0.0004 Na 588.995 FACT 0-2 0.99991 0.002 Na 588.995 Fitted 0-2 0.99996 0.048P 213.618 Fitted 0-2 0.99986 0.013 S 181.972 Fitted 0-2 0.99967 0.031
Calibration linearityFigures 1 and 2 show calibration curves for Na and P, and Table 3 summarizes the calibration standard concentration range and correlation coeffi cients for all 6 elements. Correlation coeffi cients were greater than 0.999 with less than 10% calibration error on each calibration point.

92
AGILENT TECHNOLOGIES
Energy & Chemicals Applications
4
Figure 1. Calibration curve for Na 588.995 nm line, using FACT background correction, shows excellent linearity across the calibrated range, with a correlation coeffi cient of 0.99991.
Figure 2. Calibration curve for P 213.618 nm line, using FBC background correction, shows excellent linearity across the calibrated range, with a correlation coeffi cient of 0.99986.
Standards Concentration (ppm) % Error Blank 0 N/A Standard 1 0.51 3.75 Standard 2 1.03 1.56 Standard 3 2.14 0.57
Standards Concentration (ppm) % Error Blank 0 N/A Standard 1 0.51 5.47Standard 2 1.03 0.19 Standard 3 2.14 0.26

93www.agilent.com/chem/5110icpoes
AGILENT TECHNOLOGIES
Energy & Chemicals Applications
5
Spike recoveriesThe spike concentration of each of the 6 elements of interest in the B100 sample was approximately 0.5 ppm and all recoveries were within ±5% of the target value (Table 4). The excellent recoveries demonstrate the ability of the ICP-OES to accurately determine Ca, K, Mg, Na, P and S at the required levels in the biodiesel fuel samples. The measured values for Ca, K, Mg, Na, P and S in the B100 sample were all below the regulated limits specifi ed in ASTM D6751 and EN 14214 standards.
Table 4. Measured values and spike recoveries (0.5 ppm) for 6 elements in B100 biodiesel sample, all results measured are in solutions.
Elements λ (nm) B100 Sample(ppm)
Spiked Solution(ppm)
Spike% Recovery
Ca 422.673 0.005 0.52 105 K 766.491 <MDL 0.49 97 Mg 279.553 <MDL 0.50 100 Na 588.995 0.005 0.49 97 P 213.618 0.39 0.90 102S 181.972 0.26 0.79 103
Rapid sample throughput and low argon consumptionThe 5100 SVDV ICP-OES achieved a sample-to-sample cycle time of 80 seconds, equivalent to 45 samples per hour, using only 27 litres of argon per sample. This was possible with use of an Agilent SPS 3 autosampler, combined with the fast Vista Chip 2 detector in the 5100 SVDV ICP-OES that reads all wavelengths in a single measurement.
Conclusions
Agilent’s 5100 SVDV ICP-OES with a vertical torch operating in axial-view mode meets the challenges of routine biodiesel analysis with excellent method detection limits and spike recoveries for all selected wavelengths.
The vertical-orientation of the torch meant the addition of oxygen to the gas mix was not required.
The method is highly cost-effective with sample throughput of 80 seconds per sample and low argon consumption of 27 L/sample.
The availability of FACT background correction on the 5100 SVDV ICP-OES allows correction for any spectral interferences that cannot otherwise be resolved. This can lower the method detection limits in biodiesel samples, with this study demonstrating almost an order of magnitude difference in MDLs for both Na and K when FACT background correction was applied.
The B100 biodiesel sample analyzed in this study met the requirements of both the EU and ASTM standards.

94
AGILENT TECHNOLOGIES
Energy & Chemicals Applications
Introduction
The determination of metals in oils by ICP-OES using a radially-viewed plasma is a well established technique, especially for laboratories that implement ASTM Standard Test Method D5185-13. The method specifi es ICP-OES for the rapid determination of 22 elements in used and unused lubricating oils and base oils, as well as rapid screening of used oils for wear-metals such as Fe, Cu and Al. Analysts use this test to monitor the condition of equipment for wear, to indicate the effi ciency of the blending of additive packages, or for quality assurance of base oil for metal content.[1]
The Agilent 5100 Radial View (RV) ICP-OES takes the analysis to a new level of performance, particularly in terms of robustness, speed of analysis and reduced running costs. In this study, the 5100 RV was fi tted with an Agilent SPS 3 Sample Preparation System and an Agilent SVS 2+ Switching Valve System which greatly improves productivity by reducing sample uptake, stabilization and washout times without compromising accuracy, precision, long-term stability and repeatability/reproducibility. With the faster sample run times, the 5100 RV requires less argon gas per sample, which can lead to signifi cant savings for labs involved in high throughput analysis.
Improved productivity for the determination of metals in oil samples with ASTM Method D5185, using the Agilent 5100 Radial View (RV) ICP-OESApplication note
Authors
Neli Drvodelic
Agilent TechnologiesMelbourne, Australia
Petrochemical
IntroductionWhiskey production is a lucrative global industry that generates billions of dollars of business every year. There are over 20 whiskey producing countries, with Scotland leading the market with Scotch whisky, followed by the US, Canada, Ireland and Japan. Out of the 200+ countries that have developed a taste for whiskey, India consumes the most – more than three times as much as the US. Unsurprisingly, India is beginning to increase its own production of the spirit [1].
With the value of a whiskey highly dependent on type, brand and heritage, quality, age, and legal product definition, producers are keen to establish analytical methods to help them identify the unique aspects of their product and ways to preserve its authenticity against fraudulent practices.
Elemental Profiling of Whiskey using the Agilent 5100/5110 ICP-OES and MPP Chemometrics Software
Authors
Jenny Nelson1, Greg Gilleland1, Helene Hopfer2,3,4,and Susan E. Ebeler2,3,
1. Agilent Technologies, Inc., Santa Clara, CA, USA Application: Food Authenticity
2. Dept. Viticulture & Enology, University of California, Davis, CA, USA
3. Food Safety and Measurement Facility, University of California, Davis, CA, USA
4. Dept. Food Science, The Pennsylvania State University, University Park, PA, USA
Food authenticity
> Return to Table of Contents> Search entire document

95www.agilent.com/chem/5110icpoes
AGILENT TECHNOLOGIES
Energy & Chemicals Applications
2
Experimental
InstrumentationThe Agilent 5100 RV ICP-OES was used for this analysis. The dedicated radial view (RV) confi guration is ideally suited to the analysis of organic samples. The plug-and-play torch mechanism automatically aligns the vertical torch and connects all gases for fast start up while ensuring reproducible loading of the torch, independent of the operator. Mass fl ow controllers on the three gas lines into the torch as well as thermostatted optics facilitate long term stability of the emission signal as seen in the long term stability plot in Figure 2.
To run challenging samples, the RF system must be able to rapidly adjust to changes in the plasma conditions. The free running solid state radio frequency (SSRF) generator in the 5100 RV ICP-OES meets these challenges and can handle a wide range of organic samples, from volatile organics such as methanol or gasoline, to semi volatile organics such as kerosene. The benefi t of this is that plasma conditions similar to those used for aqueous solutions can be used for organics without the need for high plasma gas fl ows. An Agilent SPS 3 Sample Preparation System was used for automatic sample delivery in combination with the SVS 2+ Switching Valve System.
The sample introduction system chosen for this analysis was the semi-volatile organics kit comprising of a glass concentric nebulizer, a 1.4 mm id RV torch, solvent resistant tubing, and a double-pass glass cyclonic spray chamber.
Instrument operating conditions are listed in Tables 1a and 1b and the wavelengths selected for the analysis are given in Table 2. Wavelengths were selected according to the recommendations of ASTM D5185. Multiple wavelengths were selected for several elements to demonstrate the performance of the 5100 ICP-OES across the range of wavelengths that are typically used in the analysis. Method Detection Limits (MDLs) are also given in Table 2. They are based on three sigma of ten replicate measurements of the blank solution during the analytical run.
Fitted background correction was used for all wavelengths, simplifying the method development by eliminating the need to determine off-peak background correction points for each element.
Table 1a. Agilent 5100 RV ICP-OES and SVS 2+ Switching Valve System operating parameters
Parameter Setting Read time (s) 2 Replicates 3 Sample uptake delay (s) 0 Stabilization time (s) 10 Rinse time (s) 3 (fast pump: On) Pump speed (rpm) 10 RF power (kW) 1.30 Aux fl ow (L/min) 1.0Plasma fl ow (L/min) 12.0 Nebulizer fl ow (L/min) 0.65 SVS 2+ Switching Valve System operating parametersLoop uptake delay (s) 5 Uptake pump speed (Refi ll) (rpm) 350 Uptake pump speed (Inject) (rpm) 150 Sample loop size (mL) 0.5 Time in sample (s) 4Bubble inject time (s) 4.8
Table 1b. Agilent 5100 RV ICP-OES method parameters
Parameters Settings Nebulizer Glass concentric Spray chamber Double Pass Cyclonic Torch Organic 1.4 mm id Sample tubes White/white SolvaFlex Drain tubes Grey/grey SolventFlex SPS 3 rinse solution Kerosene Background correction Fitted
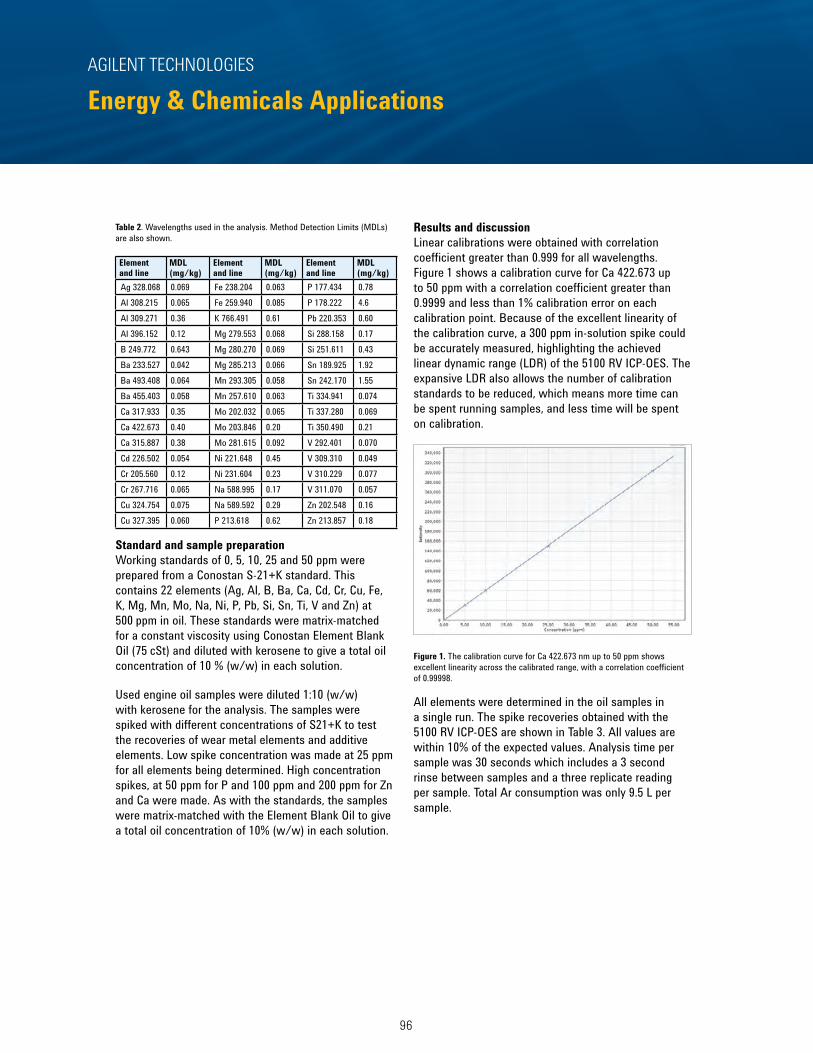
96
AGILENT TECHNOLOGIES
Energy & Chemicals Applications
3
Table 2. Wavelengths used in the analysis. Method Detection Limits (MDLs) are also shown.
Element and line
MDL (mg/kg)
Element and line
MDL (mg/kg)
Element and line
MDL (mg/kg)
Ag 328.068 0.069 Fe 238.204 0.063 P 177.434 0.78Al 308.215 0.065 Fe 259.940 0.085 P 178.222 4.6Al 309.271 0.36 K 766.491 0.61 Pb 220.353 0.60Al 396.152 0.12 Mg 279.553 0.068 Si 288.158 0.17B 249.772 0.643 Mg 280.270 0.069 Si 251.611 0.43Ba 233.527 0.042 Mg 285.213 0.066 Sn 189.925 1.92Ba 493.408 0.064 Mn 293.305 0.058 Sn 242.170 1.55Ba 455.403 0.058 Mn 257.610 0.063 Ti 334.941 0.074Ca 317.933 0.35 Mo 202.032 0.065 Ti 337.280 0.069Ca 422.673 0.40 Mo 203.846 0.20 Ti 350.490 0.21Ca 315.887 0.38 Mo 281.615 0.092 V 292.401 0.070Cd 226.502 0.054 Ni 221.648 0.45 V 309.310 0.049Cr 205.560 0.12 Ni 231.604 0.23 V 310.229 0.077Cr 267.716 0.065 Na 588.995 0.17 V 311.070 0.057Cu 324.754 0.075 Na 589.592 0.29 Zn 202.548 0.16Cu 327.395 0.060 P 213.618 0.62 Zn 213.857 0.18
Standard and sample preparationWorking standards of 0, 5, 10, 25 and 50 ppm were prepared from a Conostan S-21+K standard. This contains 22 elements (Ag, Al, B, Ba, Ca, Cd, Cr, Cu, Fe, K, Mg, Mn, Mo, Na, Ni, P, Pb, Si, Sn, Ti, V and Zn) at 500 ppm in oil. These standards were matrix-matched for a constant viscosity using Conostan Element Blank Oil (75 cSt) and diluted with kerosene to give a total oil concentration of 10 % (w/w) in each solution.
Used engine oil samples were diluted 1:10 (w/w) with kerosene for the analysis. The samples were spiked with different concentrations of S21+K to test the recoveries of wear metal elements and additive elements. Low spike concentration was made at 25 ppm for all elements being determined. High concentration spikes, at 50 ppm for P and 100 ppm and 200 ppm for Zn and Ca were made. As with the standards, the samples were matrix-matched with the Element Blank Oil to give a total oil concentration of 10% (w/w) in each solution.
Results and discussionLinear calibrations were obtained with correlation coeffi cient greater than 0.999 for all wavelengths. Figure 1 shows a calibration curve for Ca 422.673 up to 50 ppm with a correlation coeffi cient greater than 0.9999 and less than 1% calibration error on each calibration point. Because of the excellent linearity of the calibration curve, a 300 ppm in-solution spike could be accurately measured, highlighting the achieved linear dynamic range (LDR) of the 5100 RV ICP-OES. The expansive LDR also allows the number of calibration standards to be reduced, which means more time can be spent running samples, and less time will be spent on calibration.
Figure 1. The calibration curve for Ca 422.673 nm up to 50 ppm shows excellent linearity across the calibrated range, with a correlation coeffi cient of 0.99998.
All elements were determined in the oil samples in a single run. The spike recoveries obtained with the 5100 RV ICP-OES are shown in Table 3. All values are within 10% of the expected values. Analysis time per sample was 30 seconds which includes a 3 second rinse between samples and a three replicate reading per sample. Total Ar consumption was only 9.5 L per sample.

97www.agilent.com/chem/5110icpoes
AGILENT TECHNOLOGIES
Energy & Chemicals Applications
4
Table 3. Agilent 5100 ICP-OES spike recoveries for all elements in used engine oil. * <MDL = less than method detection limit
Element and line
Unspiked Sample (ppm)
Spiked Level (ppm)
Recovery (%)
Element and line
Unspiked Sample (ppm)
Spiked Level (ppm)
Recovery (%)
Element and line
Unspiked Sample (ppm)
Spiked Level (ppm)
Recovery (%)
Ag 328.068 <MDL* 25 96 Fe
238.204 0.45 25 98 P 177.434 39 50 96
Al 308.215 0.19 25 93 Fe
259.940 0.44 25 96 P 178.222 39 50 97
Al 309.271 0.13 25 95 K
766.491 0.019 25 92 Pb 220.353 0.015 25 101
Al 396.152 0.32 25 95 Mg
279.553 0.42 25 95 Si 288.158 0.30 24 95
B 249.772 5.43 25 103 Mg
280.270 0.41 25 98 Si 251.611 0.29 24 95
Ba 233.527 0.026 25 105 Mg
285.213 0.39 25 95 Sn 189.925 <MDL* 26 104
Ba 493.408 0.021 25 93 Mn
293.305 0.026 25 100 Sn 242.170 <MDL* 24 95
Ba 455.403 0.023 25 93 Mn
257.610 0.025 25 95 Ti 334.941 0.001 24 95
Ca 317.933 106 200 104 Mo
202.032 5.76 25 100 Ti 337.280 0.003 24 95
Ca 422.673 95 200 95 Mo
203.846 5.71 25 98 Ti 350.490 0.20 24 96
Ca 315.887 106 200 105 Mo
281.615 5.64 25 97 V 292.401 <MDL* 25 98
Cd 226.502 0.038 25 102 Ni
221.648 <MDL* 25 102 V 309.310 0.008 24 96
Cr 205.560 0.014 25 99 Ni
231.604 <MDL* 25 99 V 310.229 <MDL* 25 99
Cr 267.716 0.033 25 99 Na
588.995 1.24 25 92 V 311.070 <MDL* 24 97
Cu 324.754 0.130 25 93 Na
589.592 1.06 25 91 Zn 202.548 46.1 100 98
Cu 327.395 0.127 25 93 P
213.618 39 50 99 Zn 213.857 44.8 100 97
Long term stability of the 5100 RV ICP-OES was evaluated by setting up a complete analytical sequence with 3 seconds rinse time between each sample and measuring a 5 ppm S21 + K solution every 10 samples over a 4 hour period. Over the entire run 500 samples were analyzed without recalibration. The stability plot for all elements is displayed in Figure 2.
Stability ranged between 0.5 to 2.0 %RSD, with less than 4% deviation in concentration from the initial reading which demonstrates the robust sample handling capability of the vertically-oriented plasma in the 5100 RV ICP-OES, even when analyzing challenging organic samples.

98
AGILENT TECHNOLOGIES
Energy & Chemicals Applications
5
Figure 2. Stability plot over 4 hours for all elements in a used oil sample using the 5100 RV ICP-OES
• Simplifi ed day-to-day operation and method development due to an intuitive software interface
• Hardware features such as the plug-and-play torch lead to excellent method repeatability between operators and from instrument to instrument.
Reference1. ASTM D5185-13, Standard Test Method for Multielement Determination of Used and Unused Lubricating Oils and Base Oils by Inductively Coupled Plasma Atomic Emission Spectrometry (ICP-AES)
ConclusionsThe Agilent 5100 RV ICP-OES is the ideal instrument for determining metals in oil samples as per the ASTM D5185 method that is widely used by laboratories involved in the direct analysis of lubricating oils for wear metals and additives. The 5100 RV offers a number of advantages compared to other radial view ICP-OES:
• Sample analysis cycle time of 30 seconds per sample and total gas consumption of 9.5 L Ar per sample, using the SVS 2+ switching valve, without compromising accuracy, precision or stability
• Excellent long term stability with <2% RSD over 4 hours
• A vertical plasma and robust 27 MHz SSRF system delivers matrix handling capability and robustness

99www.agilent.com/chem/5110icpoes
AGILENT TECHNOLOGIES
Energy & Chemicals Applications
IntroductionThe chloralkali process is an industrial process for the electrolysis of NaCl used to produce chlorine and sodium hydroxide (caustic soda), which are commodity chemicals required by industry.
The most common chloralkali process involves the electrolysis of aqueous sodium chloride (a brine) in a membrane cell. The sodium chloride solution being used must have a high degree of purity and if it contains any other metal ions, these will also pass through the membrane and so contaminate the sodium hydroxide solution.
Thus, prior to the chlorakali process, sodium chloride needs to be treated by an ion exchange system. The ion exchange system is used to further reduce the calcium, magnesium and strontium concentrations in the brine stream to the levels required to operate and sustain good overall performance of a chloralkali membrane cell electrolyser. The ion exchange system consists of three columns with associated
Analysis of Four Elements (Ca, Mg, Si, Sr) in Brine Using the Agilent 5100 ICP-OES
Authors
Mario Nerva, Nicola Cuboni Theolab S.p.A.C.so Europa 600/A10088 Volpiano (TO) ITALY
Application noteSpeciality chemicals
> Return to Table of Contents> Search entire document

100
AGILENT TECHNOLOGIES
Energy & Chemicals Applications
2
piping, valves and instruments. The calcium content of brine passing through the ion exchange system is lowered from 3 to 5 ppm to less than 20 ppb. During normal operation, brine flows through two columns which operate in series (one primary column and one secondary column). Alkaline brine enters the top of the column and flows downward through the resin bed. As the brine contacts the resin, the calcium, magnesium and strontium ions in solution are “exchanged” for sodium ions in the resin. The resin bed becomes “exhausted” where there is too few sodium ions left to exchange with the calcium, magnesium and strontium ions, resulting in the “break-through” of calcium ions in concentrations exceeding 20 ppb in the exiting brine. Lab analysis of the brine downstream of the primary column every 8 hours is used to determine when break-through has occurred indicating the need to regenerate the primary column. Calcium, magnesium, strontium should be monitored for break-through.
In this study, the Agilent 5100 ICP-OES was used for the analysis of 4 impurities elements (Ca, Mg, Si, Sr) in sodium chloride brine sampled at differents steps of purification process in order to evaluate purification efficiency:
1. At the input to the first purification tower (sample type A)
2. At the input to the last purification tower (sample type B)
3. The output of the last purification tower (sample type C).
Samples were collected on three different days, resulting in three samples of each sample type e.g. A1, A2 and A3, where A1 was collected on Day 1 at the input to the first purification tower, through to C3, which was collected on Day 3 from the output of the last purification tower.
The 5100 VDV ICP-OES is highly suited to the analysis of brines. It uses a vertically orientated torch and a solid state radiofrequency (SSRF) system operating at 27 MHz to provide a robust plasma capable of handling high dissolved solids solution and delivering long term analytical stability with less cleaning and less replacement torches.
In this study, the accuracy and robustness of the Agilent 5100 ICP-OES were evaluated for the determination of Ca, Mg, Sr and Si in brine.
Experimental
InstrumentationAll measurements were performed using an Agilent 5100 ICP-OES. The sample introduction system consisted of a Seaspray glass concentric nebulizer, double-pass cyclonic spray chamber and a 1.8 mm i.d. injector torch.
All measurements were performed in axial plasma viewing mode. An Agilent SPS 3 Sample Preparation System was used for automatic sample delivery. The instrument operating conditions are summarized in Table 1 and the wavelengths selected for the analysis are given in Table 2.Table 1. Agilent 5100 VDV ICP-OES method and instrument operating parameters
Parameter Setting
RF Power (kW) 1.35Aux Flow (L/min) 1.1Plasma Flow (L/min) 13.5Nebulizer Flow (L/min) 0.7Pump speed (rpm) 10Sample pump tubes White/WhiteDrain pump tubes Blue/BlueBackground correction FittedRead time (s) 10Replicates 3Sample uptake delay (s) 30 (fast pumping: On)Stabilization time (s) 15Rinse time (s) 40 (fast pumping: On)Autosampler Rinse Solution 2% HCl
Table 2. Wavelengths selected for the analysis
Element Wavelengths
Ca 396.847 nmMg 279.553 nmSr 407.771 nm
Si 288.158 nm
Standard and sample preparationAll brine (30% NaCl) samples were diluted 2x with pure water.
As no pure enough sodium chloride is available to prepare matrix matched standards, the method of standard additions (MSA) was used for the analysis to give the best accuracy in determining sample concentrations.
Typical concentrations of the 4 elements in the three types of samples prior to dilution are shown in Table 3.
Standard additions were prepared by spiking 1:2 diluted brines with different volumes of a stock solution. Spiked concentrations are shown in Table 4.
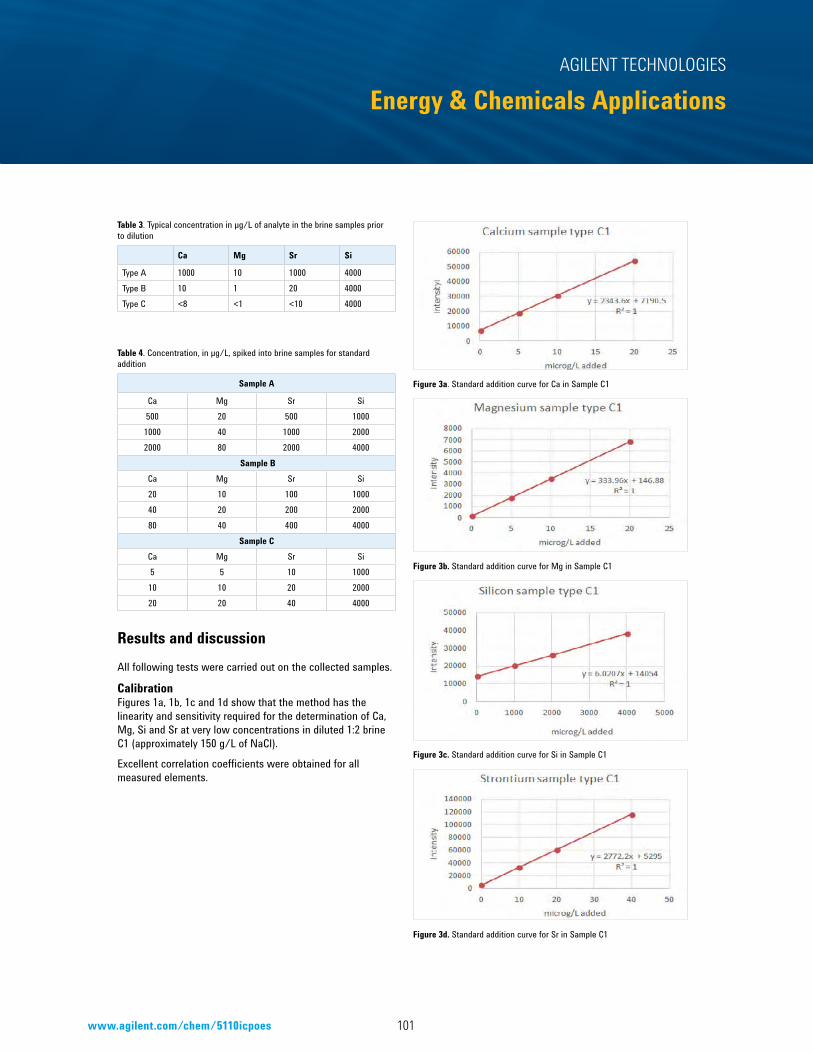
101www.agilent.com/chem/5110icpoes
AGILENT TECHNOLOGIES
Energy & Chemicals Applications
3
Figure 3a. Standard addition curve for Ca in Sample C1
Figure 3b. Standard addition curve for Mg in Sample C1
Figure 3c. Standard addition curve for Si in Sample C1
Figure 3d. Standard addition curve for Sr in Sample C1
Table 3. Typical concentration in µg/L of analyte in the brine samples prior to dilution
Ca Mg Sr Si
Type A 1000 10 1000 4000Type B 10 1 20 4000Type C <8 <1 <10 4000
Table 4. Concentration, in µg/L, spiked into brine samples for standard addition
Sample A
Ca Mg Sr Si500 20 500 10001000 40 1000 20002000 80 2000 4000
Sample BCa Mg Sr Si20 10 100 100040 20 200 200080 40 400 4000
Sample CCa Mg Sr Si5 5 10 100010 10 20 200020 20 40 4000
Results and discussionAll following tests were carried out on the collected samples.
CalibrationFigures 1a, 1b, 1c and 1d show that the method has the linearity and sensitivity required for the determination of Ca, Mg, Si and Sr at very low concentrations in diluted 1:2 brine C1 (approximately 150 g/L of NaCl).
Excellent correlation coefficients were obtained for all measured elements.

102
AGILENT TECHNOLOGIES
Energy & Chemicals Applications
4
Purification efficiencyAs the samples (A, B, C) were taken at different steps of the ion exchange purification process, they could be used to determine the purification efficiency for Ca, Mg and Sr. Table 5 shows the efficiency achieved on the first day of sampling (samples A1, B1 & C1).Table 5. Measured concentration of Samples A1, B1 and C1
Elements Input to the first purification
tower (sample A1) µg/L
Input to the third purification tower (sample B1) µg/L
Output to the third purification tower (sample C1) µg/L
Ca 1100 6.2 6.14Mg 4.76 0.92 0.88Sr 821.5 17.9 3.82Si 4938 4759 4669
RepeatibilityIn order to check repeatability and stability of the 5100 ICP-OES, sample C2 (diluted as described in Sample Preparation) was spiked with 10 µg/L of Ca and Mg, and 5 µg/L of Sr and then measured approximately 50 times, over a one and a half hour period
Excellent repeatability was obtained for all elements analyzed over this period, with less than 6% RSD as shown in table 6.Table 6. Repeatibilty results of spiked elements in diluted sample C2
Ca Mg Sr Si
Spiked sample C2 (µg/L) 13.53 10.78 9.95 3171
Standard Deviation 0.69 0.13 0.039 19.07%RSD 5.10 1.21 0.39 0.60
Spike recoveriesIn order to check the accuracy of the method, sample C3 (diluted as described in Sample Preparation) was spiked with 10 µg/L of Ca and Mg, 20 µg/L of Sr and 2000 µg/L of Si. Table 7 shows the measured concentrations and recovery results of the four elements in the diluted brine sample C3. The recovery results for Ca, Mg, Sr, Si in diluted brine sample C3 using this method were within ±2% of the spike concentration values. These excellent recoveries demonstrate the ability of the 5100 ICP-OES to accurately determine Ca, Mg, Si and Sr at the levels required in brines.
Instrument efficiencyDuring the sample analysis, the time taken to analyze each sample and the volume of argon consumed were determined. The sample measurement time was 115 seconds per sample. The argon consumption was 36 L per sample.
ConclusionsAgilent’s 5100 ICP-OES was able to perform the routine analysis of brine samples with excellent sensitivity, accuracy and robustness. Only a 2 fold dilution of the samples was required without the need for an argon humidifier.
The method, which uses a vertical torch, operating in axial-viewing mode, is highly productive and cost-effective.
The method of standard additions gave excellent results, overcame the issues of finding pure NaCl for matrix matching, and eliminated the need for an internal standard.
Table 7. Measured values and spike recoveries for 4 elements in diluted sample C3
Sample type C
Elements Spiked Conc.µg/L in diluted sample
C3
Measured Conc of Diluted Sample C3
µg/L
Measured Conc of Spiked diluted Sample C3
µg/L (average of 5 measurements)
Calculated Conc of undiluted Sample C3
µg/L
Spike % Recovery
Ca 10 3.74 13.84 7.47 101.0Mg 10 1.72 11.80 3.43 100.9Sr 20 1.35 21.51 2.70 100.8Si 2000 3359 5380 6718 101.1
www.agilent.com/chemAgilent shall not be liable for errors contained herein or for
incidental or consequential damages in connection with the furnishing, performance or use of this material.
Information, descriptions, and specifications in this publication are subject to change without notice.
© Agilent Technologies, Inc. 2017Published May 15, 2017
Publication number: 5991-7914EN
ReferencesBenefits of a vertically oriented torch— fast, accurate results, even for your toughest samples, Agilent publication, (2016), 5991-4854EN.
For more information
Learn more: www.agilent.com/chem/5110icpoes
Buy online: www.agilent.com/chem/store
U.S. and Canada 1-800-227-9770 [email protected]
Europe [email protected]
Asia Pacific [email protected]
This information is subject to change without notice.
© Agilent Technologies, Inc. 2017 May 26, 20175991-8147EN
> Return to Table of Contents> Search entire document
AGILENT TECHNOLOGIES
ICP-OES Application eHandbook> Return to Table of Contents> Search entire document