Embed Size (px)
Citation preview
INDUSTRI DAN ENERGI
Bandung Dalam Angka Tahun 2005 190
Pembangunan industri adalah salah satu upaya untuk meningkatkan nilai
tambah suatu barang, menyediakan barang dan jasa yang bermutu dengan harga
yang bersaing di pasar dalam dan luar negeri, meningkatkan ekspor dan
menghemat devisa. Untuk itu perlu pendayagunaan dengan sebaik-baiknya
sumber daya manusia, sumber alam, energi, teknologi dan sumber dana.
Beberapa hal yang berkaitan dengan industri, energi, dan air minum akan
dibahas dalam bab ini. Dalam pengolahan jenis industri, Badan Pusat Statistik
membuat empat jenis industri yang didasarkan pada jumlah tenaga kerja. Industri
Besar adalah perusahaan industri yang mempunyai pekerja 100 orang atau lebih,
Industri Sedang mempunyai pekerja 20 orang sampai 99 orang pekerja, Industri
Kecil mempunyai tenaga kerja antara 5 sampai 19 orang dan Industri Kerajinan
Rumahtangga mempunyai pekerja kurang dari 5 orang. Klasifikasi industri yang
terdapat di Kota Bandung, hasil survei industri tahunan menurut KLUI adalah
sebagai berikut :
151 Pengolahan dan pengawetan daging, ikan, buah-buahan, sayuran,
minyak, dan lemak
152 Industri susu dan makanan dari susu
153 Industri penggilingan pad-padian, tepung dan makanan ternak
154 Industri makanan lainnya
171 Industri pemintalan, pertenunan, pengolahan akhir tekstil
172 Industri barang jadi tekstil dan permadani
173 Industri perajutan
181 Industri pakaian jadi dari tekstil, kecuali barang jadi berbulu
191 Industri kulit dan barang dari kulit (termasuk kulit buatan)
192 Industri alas kaki
202 Industri barang-barang dari kayu dan barang-barang anyaman dari rotan,
bambu dan sejenisnya
210 Industri kertas, barang dari kertas dan sejenisnya
INDUSTRI DAN ENERGI
Bandung Dalam Angka Tahun 2005 191
Industrial development held to increase commodity advantage, to supply
good materials and services with competitive price to local and international
market, to increase export volume and economize on the foreign exchange. Thus,
efficient use of the human resources, natural resource, energy, technology and
source of income is needed.
This chapter examines issues about industry, energy and drink water.
Statistics Indonesia made four categories to divide industries by their kind based
on their labor force. Large manufacturing establishments are those who have
employees of 100 persons or more, medium manufacturing industries are those
who have 20 up to 99employees, small manufacturing industries are those who
have 5 up to 9 employees and home industries whose employees less than 5
persons. Industry classification taken from yearly survey of Bandung City
according to KLUI are:
151 Meat, fish, fruits, vegetables, oil and fat processing and preserving
Industry
152 Milk and food made from milk industry
153 Rice plant, flavor, and fodder milling industry
154 Other food industry
171 Spinninge, weaving and textile finishing industry
172 Textile Industry and carpets
173 Knitting Industry
181 Textile clothes industry not including wool clothes
191 Leather Industry and goods from leather
(including imitation leather)
192 Footwear Industry
202 Goods made from wood industry, rattan plaiting, bamboo and any goods
of a kind
210 Paper industry and goods made from paper
INDUSTRI DAN ENERGI
Bandung Dalam Angka Tahun 2005 192
221 Industri Penerbitan
232 Industri pengilangan minyak bumi, pengolahan gas bumi dan industri
barang-barang dari hasil pengilangan gas bumi
241 Industri bahan kimia industri
242 Industri barang-barang kimia lainnya
243 Industri serat buatan
251 Industri karet dan barang dari karet
252 Industri barang dari plastic
261 Industri gelas dan barang dari gelas
264 Industri semen, kapur, dan gips serta barang-barang dari semen
281 Industri barang-barang logam siap pasang untuk bangunan, pembuatan
tangki dan generator uap
289 Industri barang logam lainnya dan kegiatan jasa pembuatan barang-
barang dari logam
291 Industri mesin-mesin umum
292 Industri mesin-mesin untuk keperluan khusus
293 Industri peralatan rumah tangga yang tidak diklasifikasikan di tempat lain
300 Industri mesin dan peralatan kantor, akuntansi dan pengolahan data
311 Industri motor listrik, generator dan transformator
313 Industri kabel listrik dan telepon
314 Industri akumulator listrik dan batu baterai
321 Industri tabung dan katup elektronik serta komponen elektronik lainnya
322 Industri alat transmisi komunikasi
331 Industri peralatan kedokteran dan peralatan untuk mengukur, memeriksa,
menguji dan bagian lainnya, kecuali alat-alat optic
342 Industri karoseri kendaraan bermotor roda enpat atau lebih
343 Industri perlengkapan dan komponen kendaraan bermotor roda empat
atau lebih
INDUSTRI DAN ENERGI
Bandung Dalam Angka Tahun 2005 193
221 Publishing industry
232 Oil refinery, natural gas processing and goods made from oil refinery
industry
241 Chemical material industry
242 Other chemical goods industry
243 Imitation fiber industry
251 Rubber and goods made from rubber industry
252 Goods made from plastic industry
261 Glass and goods made from glass industry
264 Cement, plaster and gyps industry and goods made from cement and
plaster
281 Metal goods industry, tank making and steam generator
289 Other metal goods industry and metal goods making services
291 General machines industry
292 Specific purposes machines industry
293 Household furnishings industry which are not classified in other
categories
300 Machines, stationeries, accounting and data processing industry
311 Electric motor, generator and transformator industry
313 Electric and phone wires industry
314 Electric accumulator and dry cell industry
321 Tube, electronic valve and other electronic components industry
322 Communication transmission tools industry
331 Medical equipments industry and other equipments to diagnose not
including optical goods
342 Four or more wheels vehicle rebuilding industry
343 Four or more wheels vehicle components industry
INDUSTRI DAN ENERGI
Bandung Dalam Angka Tahun 2005 194
353 Industri pesawat terbang dan perlengkapannya serta perbaikan pesawat
terbang
359 Industri alat angkut lainnya
361 Industri furniture
369 Industri pengolahan lainnya
Tenaga listrik sangat diperlukan untuk menunjang kegiatan ekonomi
serta kesejahteraan masyarakat, baik di daerah perkotaan maupun di daerah
pedesaan. Sehubungan dengan itu diharapkan dengan pembangunan prasarana
dan sarana tenaga listrik serta efisiensi pengelolaannya dapat diperoleh tenaga
listrik dengan jumlah yang cukup dan mutu yang dapat diandalkan.
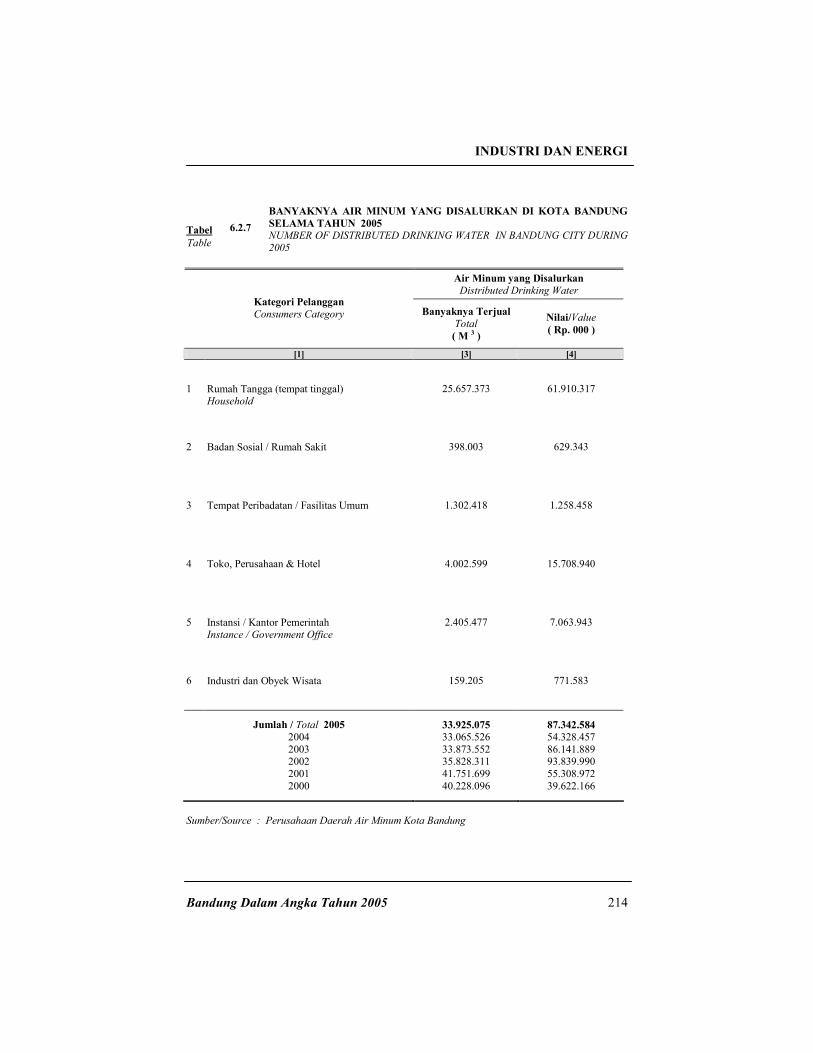
Banyaknya air minum yang disalurkan ke pelanggan oleh PDAM sampai
akhir tahun 2005 adalah 33.925.075 M3 yang terdiri atas 6 kategori yaitu Rumah
Tempat Tinggal 25.657.373 M3 atau lebih 75,63 persen, sedangkan sisanya terdiri
dari Hotel/Obyek Pariwisata, Badan-badan Sosial dan Rumah Sakit, Tempat
Peribadatan, Umum, Perusahaan-perusahaan, Instansi Pemerintah dan lain-lain.
Banyaknya air yang disalurkan pada tahun 2005 adalah 33.925.075 M3 dengan
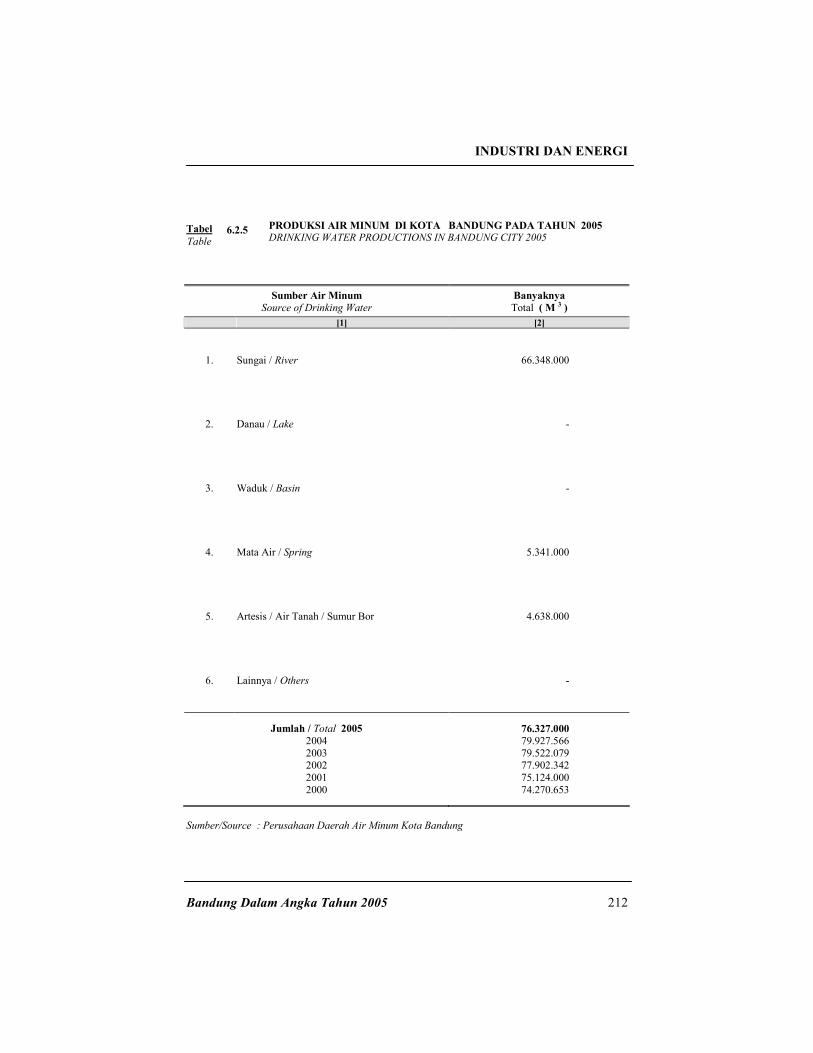
nilai RP 87.342.584.000, - ‘ produksi air minum yang berasal dari air sungai
adalah 66.348.000 M3, yang bersumber dari air artesis sebesar 4.638.000 M
3, dan
dari mata air sebesar 5.341.000 M3.
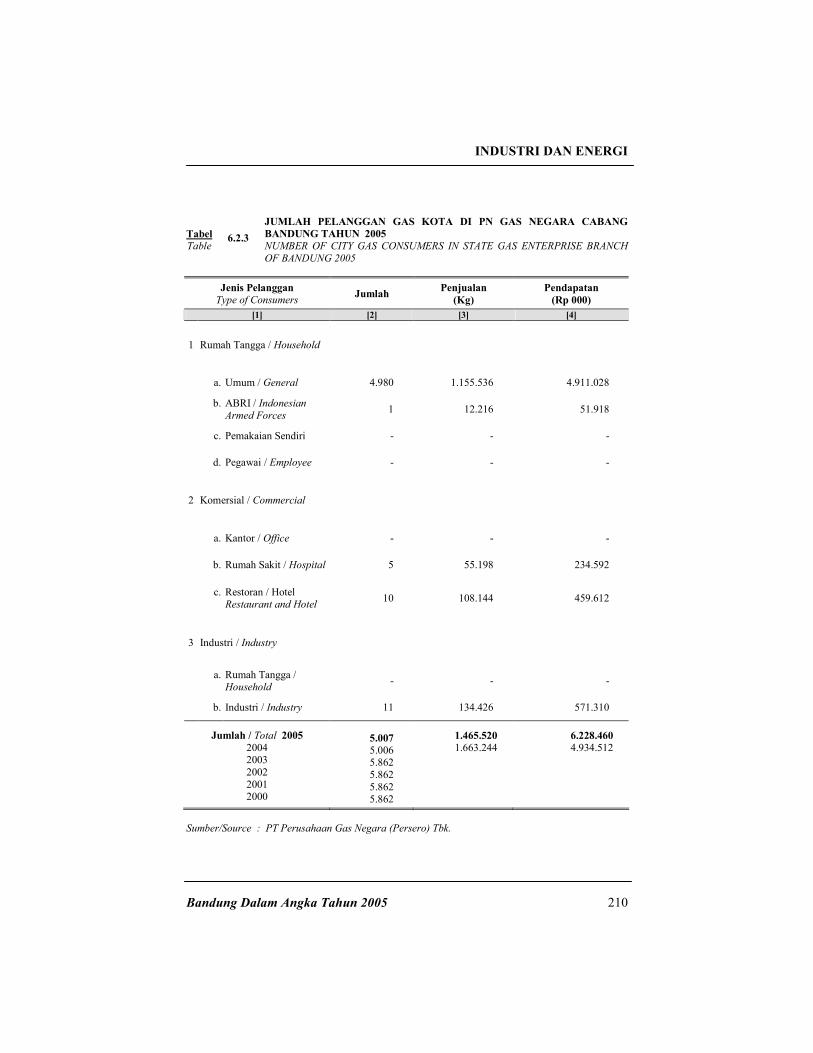
Sedangkan penjualan gas yang dilakukan oleh Perum Gas Negara Cabang
Bandung tahun 2004 dan 2005 terjadi kenaikan. Jumlah pelanggan gas LPG pada
tahun 2005 sebanyak 5.007 pelanggan. Pelanggan dari produk ini antara lain
rumahtangga yang merupakan pemakai terbesar yaitu hampir 99,5 persen dan
industri 0,22 persen. Sisanya tersebar pada keperluan perkantoran/pegawai,
perusahaan dan untuk keperluan komersial.
INDUSTRI DAN ENERGI
Bandung Dalam Angka Tahun 2005 195
353 Airplane industry and its reparation
359 Other transportation industry
361 Furniture
369 Other processing industry
Electricity is needed to support economic activity and social prosperity,
in the urban and the rural region. In the connection to that issue, expected that
development of electricity facilities and processing efficiency can obtain sufficient
and guaranteed electricity.
The number of drinking water supplied by Municipal Waterworks
(PDAM) until the ends of 2005 are 33.925.075 M3 that involved 6 categories,
residences 25.657.373 M3 or over to 75,63 percents. Whereas the reminder is
Hotel / Object of Tourism, Social Agency and Hospital, House of Worship, Public
Place, enterprises, Government Instance and others. Number of distributed water
in 2005 is 33.925.075 M3 which value RP 87.342.584.000, -. Drinking water
production, from the river is 66.348.000 M3, artesian 4.638.000 M3 and spring
5.341.000 M3.
Whereas sold gas by State Gas Enterprise Bandung Branch between 2004
and 2005 increase. Total consumers of LPG in 2005 are 5.007 consumers.
Households as the Consumers of this product are a largest consumption with
almost 99,5 percents and industry 0,22 percents. The reminders are spread to the
office complex/official necessity, enterprise and commercial necessity.
INDUSTRI DAN ENERGI
Bandung Dalam Angka Tahun 2005 196
Tabel
Table
6.1.1
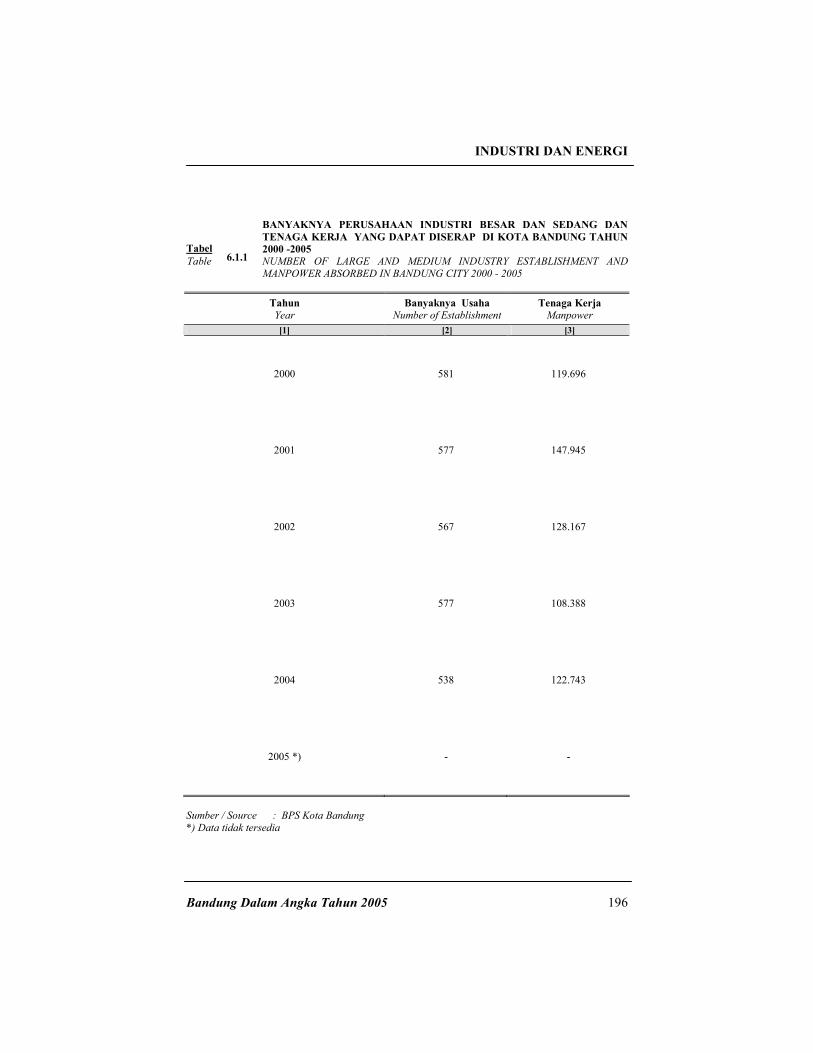
BANYAKNYA PERUSAHAAN INDUSTRI BESAR DAN SEDANG DAN
TENAGA KERJA YANG DAPAT DISERAP DI KOTA BANDUNG TAHUN
2000 -2005
NUMBER OF LARGE AND MEDIUM INDUSTRY ESTABLISHMENT AND
MANPOWER ABSORBED IN BANDUNG CITY 2000 - 2005
Tahun
Year Banyaknya Usaha
Number of Establishment Tenaga Kerja
Manpower
[1] [2] [3]
2000 581 119.696
2001 577 147.945
2002 567 128.167
2003 577 108.388
2004 538 122.743
2005 *) - -
Sumber / Source : BPS Kota Bandung
*) Data tidak tersedia
INDUSTRI DAN ENERGI
Bandung Dalam Angka Tahun 2005 197
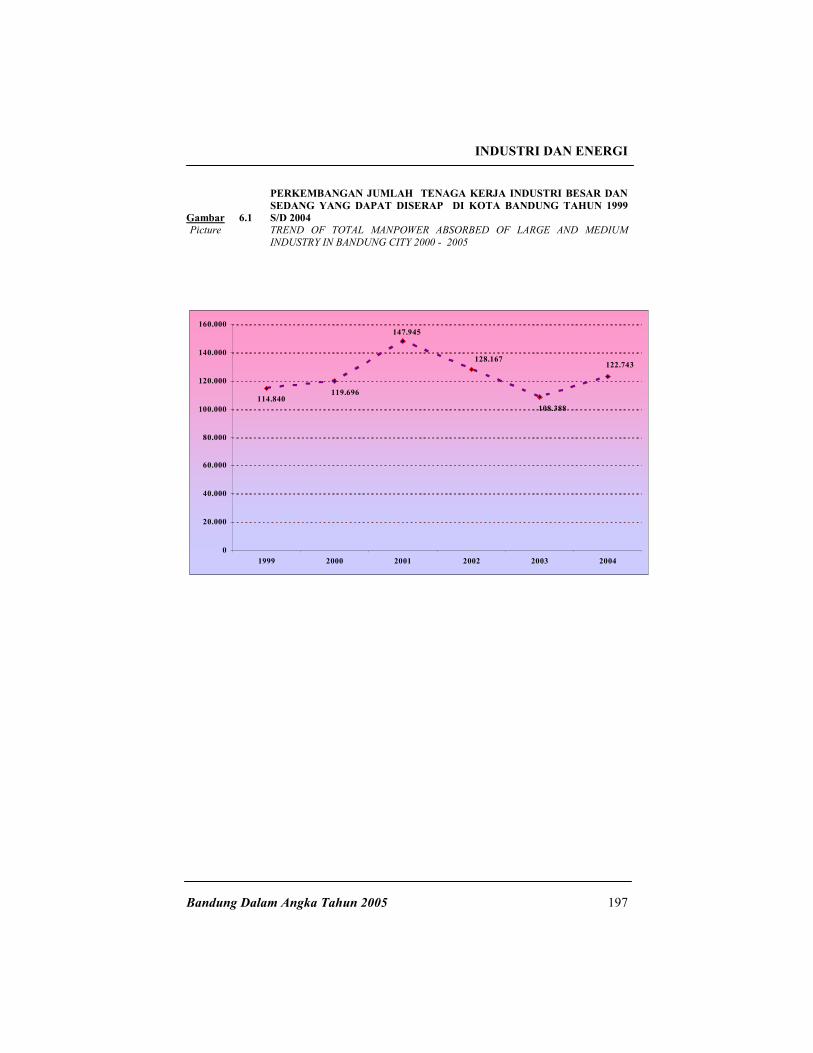
122.743
108.388
128.167
147.945
119.696114.840
0
20.000
40.000
60.000
80.000
100.000
120.000
140.000
160.000
1999 2000 2001 2002 2003 2004
Gambar
PERKEMBANGAN JUMLAH TENAGA KERJA INDUSTRI BESAR DAN
SEDANG YANG DAPAT DISERAP DI KOTA BANDUNG TAHUN 1999
S/D 2004
Picture
6.1
TREND OF TOTAL MANPOWER ABSORBED OF LARGE AND MEDIUM
INDUSTRY IN BANDUNG CITY 2000 - 2005
INDUSTRI DAN ENERGI
Bandung Dalam Angka Tahun 2005 198
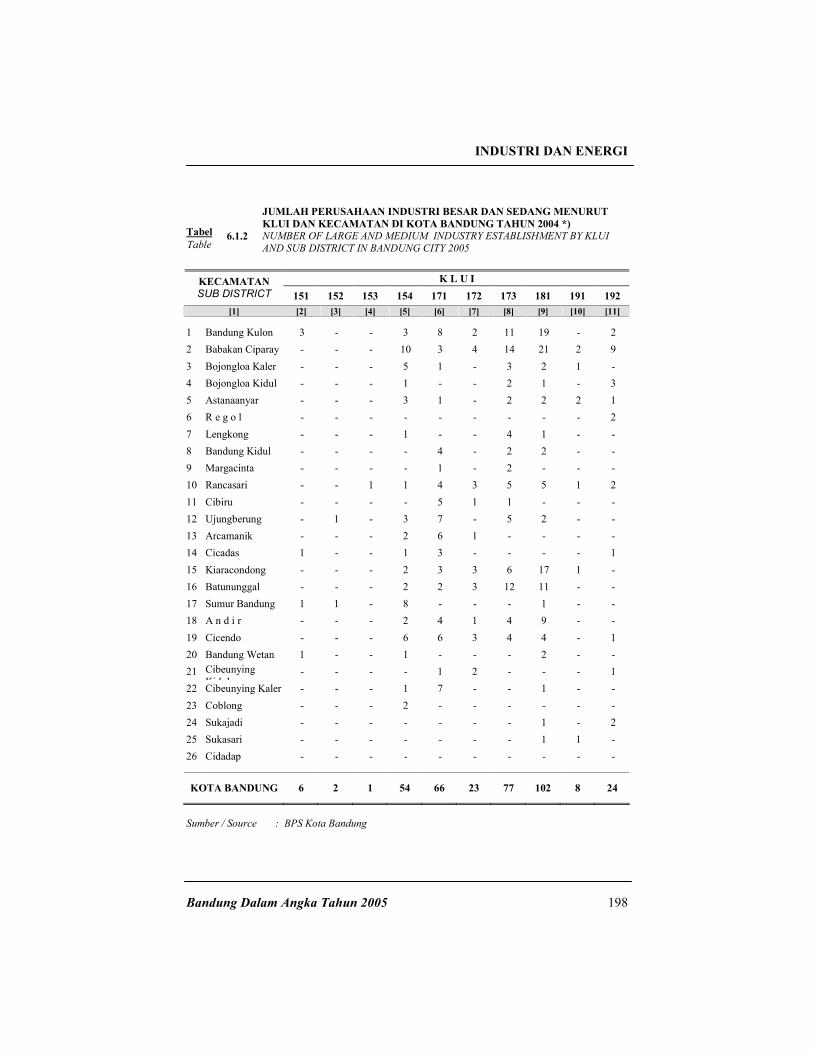
Tabel
Table
6.1.2
JUMLAH PERUSAHAAN INDUSTRI BESAR DAN SEDANG MENURUT
KLUI DAN KECAMATAN DI KOTA BANDUNG TAHUN 2004 *)
NUMBER OF LARGE AND MEDIUM INDUSTRY ESTABLISHMENT BY KLUI
AND SUB DISTRICT IN BANDUNG CITY 2005
K L U I KECAMATAN
SUB DISTRICT 151 152 153 154 171 172 173 181 191 192
[1] [2] [3] [4] [5] [6] [7] [8] [9] [10] [11]
1 Bandung Kulon 3 - - 3 8 2 11 19 - 2
2 Babakan Ciparay - - - 10 3 4 14 21 2 9
3 Bojongloa Kaler - - - 5 1 - 3 2 1 -
4 Bojongloa Kidul - - - 1 - - 2 1 - 3
5 Astanaanyar - - - 3 1 - 2 2 2 1
6 R e g o l - - - - - - - - - 2
7 Lengkong - - - 1 - - 4 1 - -
8 Bandung Kidul - - - - 4 - 2 2 - -
9 Margacinta - - - - 1 - 2 - - -
10 Rancasari - - 1 1 4 3 5 5 1 2
11 Cibiru - - - - 5 1 1 - - -
12 Ujungberung - 1 - 3 7 - 5 2 - -
13 Arcamanik - - - 2 6 1 - - - -
14 Cicadas 1 - - 1 3 - - - - 1
15 Kiaracondong - - - 2 3 3 6 17 1 -
16 Batununggal - - - 2 2 3 12 11 - -
17 Sumur Bandung 1 1 - 8 - - - 1 - -
18 A n d i r - - - 2 4 1 4 9 - -
19 Cicendo - - - 6 6 3 4 4 - 1
20 Bandung Wetan 1 - - 1 - - - 2 - -
21 Cibeunying
Kidul - - - - 1 2 - - - 1
22 Cibeunying Kaler - - - 1 7 - - 1 - -
23 Coblong - - - 2 - - - - - -
24 Sukajadi - - - - - - - 1 - 2
25 Sukasari - - - - - - - 1 1 -
26 Cidadap - - - - - - - - - -
KOTA BANDUNG 6 2 1 54 66 23 77 102 8 24
Sumber / Source : BPS Kota Bandung
INDUSTRI DAN ENERGI
Bandung Dalam Angka Tahun 2005 199
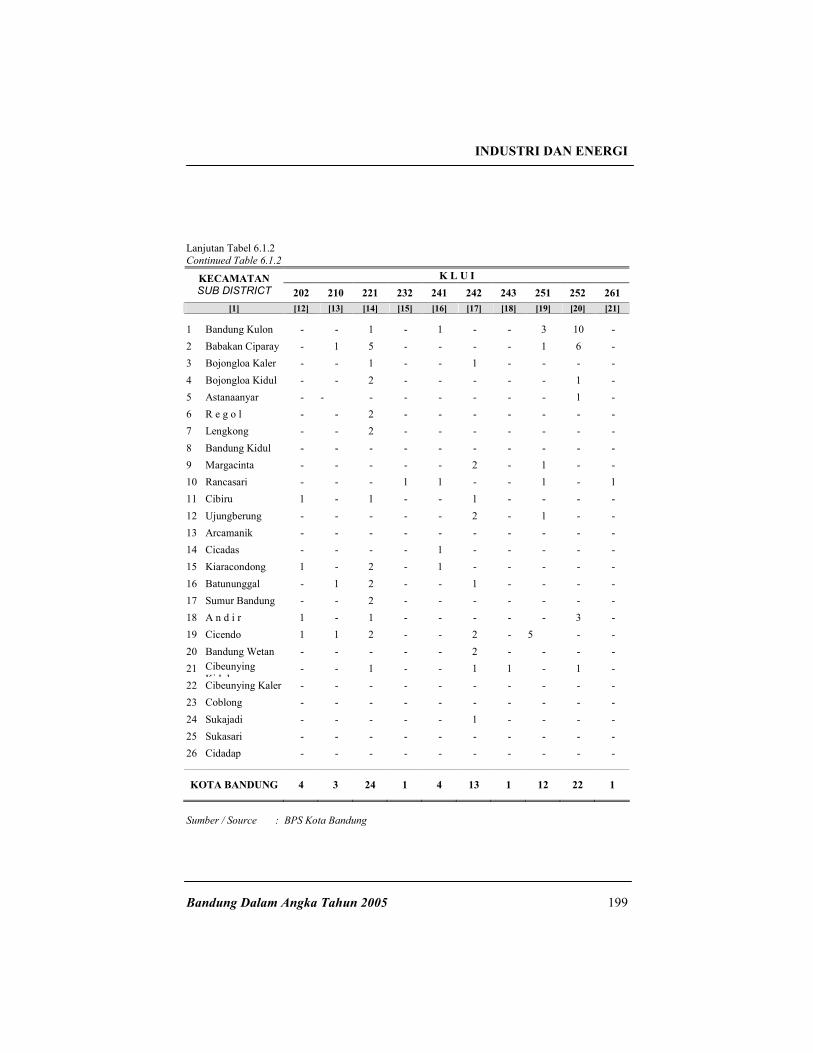
Lanjutan Tabel 6.1.2
Continued Table 6.1.2
K L U I KECAMATAN
SUB DISTRICT 202 210 221 232 241 242 243 251 252 261
[1] [12] [13] [14] [15] [16] [17] [18] [19] [20] [21]
1 Bandung Kulon - - 1 - 1 - - 3 10 -
2 Babakan Ciparay - 1 5 - - - - 1 6 -
3 Bojongloa Kaler - - 1 - - 1 - - - -
4 Bojongloa Kidul - - 2 - - - - - 1 -
5 Astanaanyar - - - - - - - - 1 -
6 R e g o l - - 2 - - - - - - -
7 Lengkong - - 2 - - - - - - -
8 Bandung Kidul - - - - - - - - - -
9 Margacinta - - - - - 2 - 1 - -
10 Rancasari - - - 1 1 - - 1 - 1
11 Cibiru 1 - 1 - - 1 - - - -
12 Ujungberung - - - - - 2 - 1 - -
13 Arcamanik - - - - - - - - - -
14 Cicadas - - - - 1 - - - - -
15 Kiaracondong 1 - 2 - 1 - - - - -
16 Batununggal - 1 2 - - 1 - - - -
17 Sumur Bandung - - 2 - - - - - - -
18 A n d i r 1 - 1 - - - - - 3 -
19 Cicendo 1 1 2 - - 2 - 5 - -
20 Bandung Wetan - - - - - 2 - - - -
21 Cibeunying
Kidul - - 1 - - 1 1 - 1 -
22 Cibeunying Kaler - - - - - - - - - -
23 Coblong - - - - - - - - - -
24 Sukajadi - - - - - 1 - - - -
25 Sukasari - - - - - - - - - -
26 Cidadap - - - - - - - - - -
KOTA BANDUNG 4 3 24 1 4 13 1 12 22 1
Sumber / Source : BPS Kota Bandung
INDUSTRI DAN ENERGI
Bandung Dalam Angka Tahun 2005 200
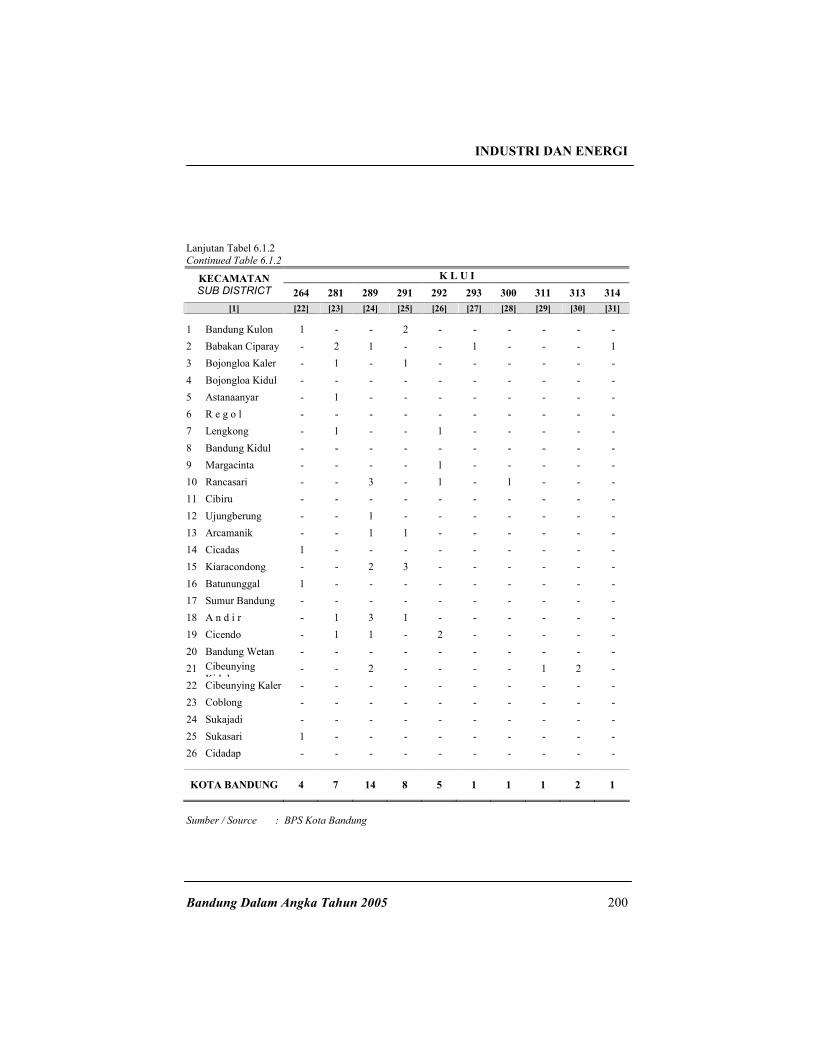
Lanjutan Tabel 6.1.2
Continued Table 6.1.2
K L U I KECAMATAN
SUB DISTRICT 264 281 289 291 292 293 300 311 313 314
[1] [22] [23] [24] [25] [26] [27] [28] [29] [30] [31]
1 Bandung Kulon 1 - - 2 - - - - - -
2 Babakan Ciparay - 2 1 - - 1 - - - 1
3 Bojongloa Kaler - 1 - 1 - - - - - -
4 Bojongloa Kidul - - - - - - - - - -
5 Astanaanyar - 1 - - - - - - - -
6 R e g o l - - - - - - - - - -
7 Lengkong - 1 - - 1 - - - - -
8 Bandung Kidul - - - - - - - - - -
9 Margacinta - - - - 1 - - - - -
10 Rancasari - - 3 - 1 - 1 - - -
11 Cibiru - - - - - - - - - -
12 Ujungberung - - 1 - - - - - - -
13 Arcamanik - - 1 1 - - - - - -
14 Cicadas 1 - - - - - - - - -
15 Kiaracondong - - 2 3 - - - - - -
16 Batununggal 1 - - - - - - - - -
17 Sumur Bandung - - - - - - - - - -
18 A n d i r - 1 3 1 - - - - - -
19 Cicendo - 1 1 - 2 - - - - -
20 Bandung Wetan - - - - - - - - - -
21 Cibeunying
Kidul - - 2 - - - - 1 2 -
22 Cibeunying Kaler - - - - - - - - - -
23 Coblong - - - - - - - - - -
24 Sukajadi - - - - - - - - - -
25 Sukasari 1 - - - - - - - - -
26 Cidadap - - - - - - - - - -
KOTA BANDUNG 4 7 14 8 5 1 1 1 2 1
Sumber / Source : BPS Kota Bandung
INDUSTRI DAN ENERGI
Bandung Dalam Angka Tahun 2005 201
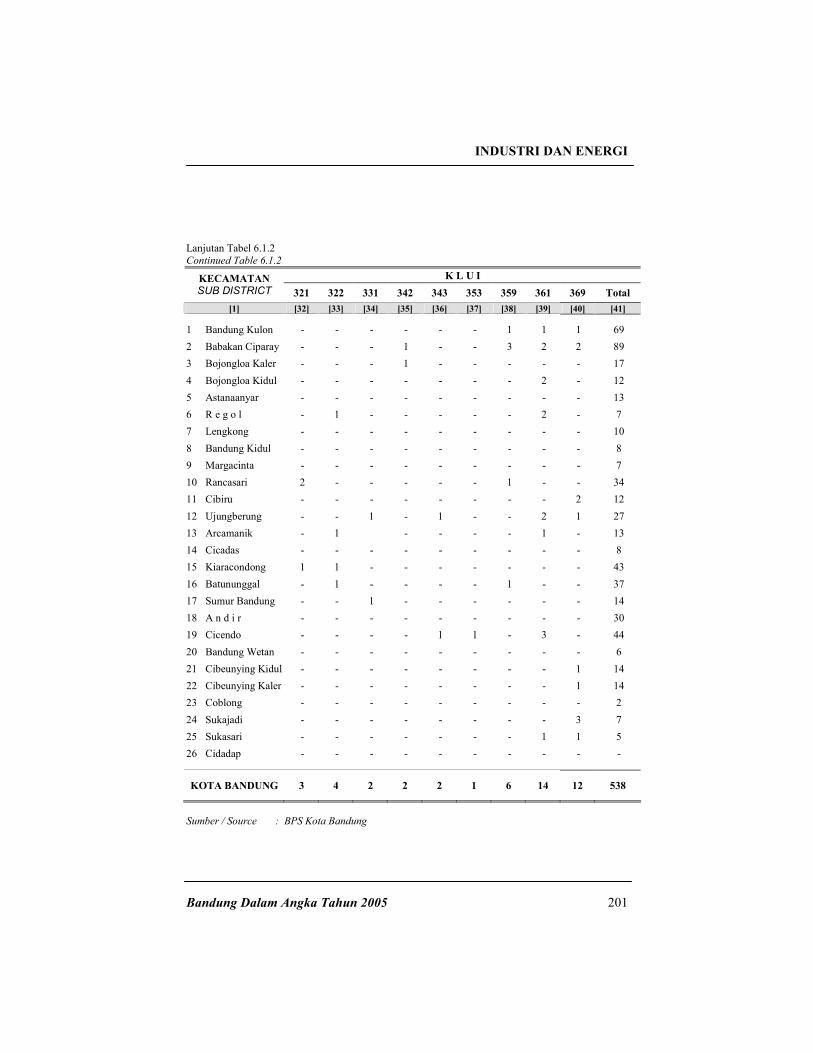
Lanjutan Tabel 6.1.2
Continued Table 6.1.2
K L U I KECAMATAN
SUB DISTRICT 321 322 331 342 343 353 359 361 369 Total
[1] [32] [33] [34] [35] [36] [37] [38] [39] [40] [41]
1 Bandung Kulon - - - - - - 1 1 1 69
2 Babakan Ciparay - - - 1 - - 3 2 2 89
3 Bojongloa Kaler - - - 1 - - - - - 17
4 Bojongloa Kidul - - - - - - - 2 - 12
5 Astanaanyar - - - - - - - - - 13
6 R e g o l - 1 - - - - - 2 - 7
7 Lengkong - - - - - - - - - 10
8 Bandung Kidul - - - - - - - - - 8
9 Margacinta - - - - - - - - - 7
10 Rancasari 2 - - - - - 1 - - 34
11 Cibiru - - - - - - - - 2 12
12 Ujungberung - - 1 - 1 - - 2 1 27
13 Arcamanik - 1 - - - - 1 - 13
14 Cicadas - - - - - - - - - 8
15 Kiaracondong 1 1 - - - - - - - 43
16 Batununggal - 1 - - - - 1 - - 37
17 Sumur Bandung - - 1 - - - - - - 14
18 A n d i r - - - - - - - - - 30
19 Cicendo - - - - 1 1 - 3 - 44
20 Bandung Wetan - - - - - - - - - 6
21 Cibeunying Kidul - - - - - - - - 1 14
22 Cibeunying Kaler - - - - - - - - 1 14
23 Coblong - - - - - - - - - 2
24 Sukajadi - - - - - - - - 3 7
25 Sukasari - - - - - - - 1 1 5
26 Cidadap - - - - - - - - - -
KOTA BANDUNG 3 4 2 2 2 1 6 14 12 538
Sumber / Source : BPS Kota Bandung
INDUSTRI DAN ENERGI
Bandung Dalam Angka Tahun 2005 202
Tabel
Table
6.1.3
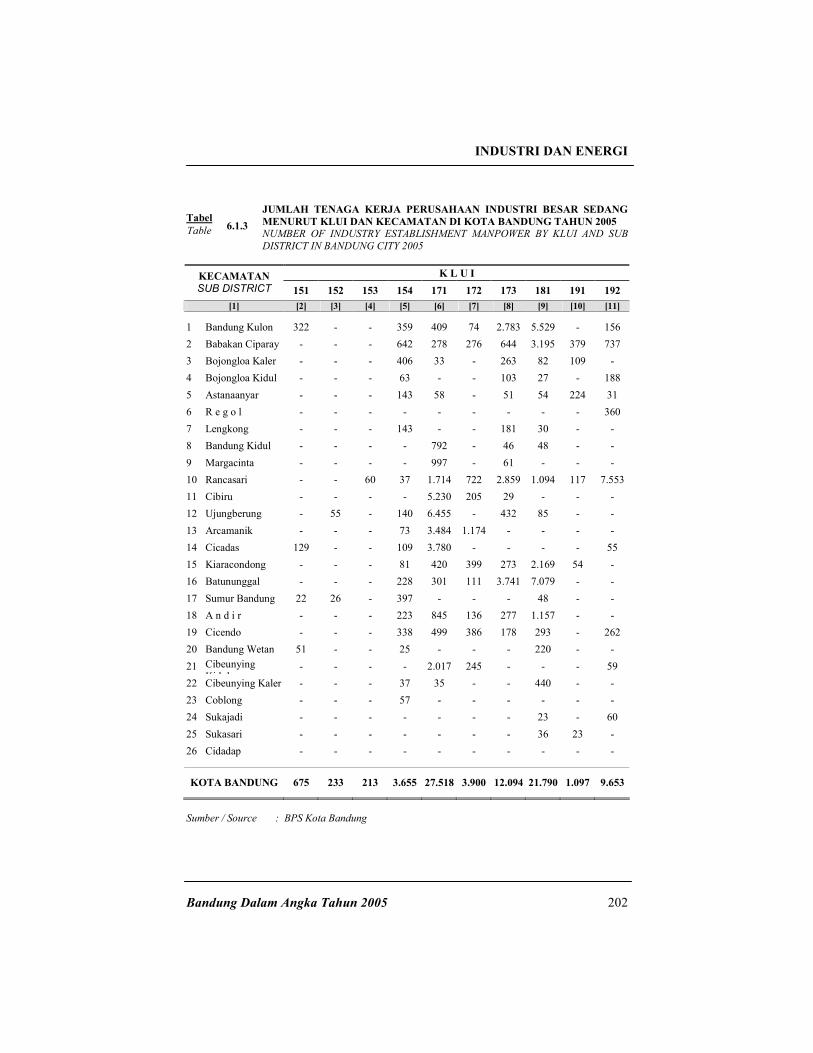
JUMLAH TENAGA KERJA PERUSAHAAN INDUSTRI BESAR SEDANG
MENURUT KLUI DAN KECAMATAN DI KOTA BANDUNG TAHUN 2005
NUMBER OF INDUSTRY ESTABLISHMENT MANPOWER BY KLUI AND SUB
DISTRICT IN BANDUNG CITY 2005
K L U I KECAMATAN
SUB DISTRICT 151 152 153 154 171 172 173 181 191 192
[1] [2] [3] [4] [5] [6] [7] [8] [9] [10] [11]
1 Bandung Kulon 322 - - 359 409 74 2.783 5.529 - 156
2 Babakan Ciparay - - - 642 278 276 644 3.195 379 737
3 Bojongloa Kaler - - - 406 33 - 263 82 109 -
4 Bojongloa Kidul - - - 63 - - 103 27 - 188
5 Astanaanyar - - - 143 58 - 51 54 224 31
6 R e g o l - - - - - - - - - 360
7 Lengkong - - - 143 - - 181 30 - -
8 Bandung Kidul - - - - 792 - 46 48 - -
9 Margacinta - - - - 997 - 61 - - -
10 Rancasari - - 60 37 1.714 722 2.859 1.094 117 7.553
11 Cibiru - - - - 5.230 205 29 - - -
12 Ujungberung - 55 - 140 6.455 - 432 85 - -
13 Arcamanik - - - 73 3.484 1.174 - - - -
14 Cicadas 129 - - 109 3.780 - - - - 55
15 Kiaracondong - - - 81 420 399 273 2.169 54 -
16 Batununggal - - - 228 301 111 3.741 7.079 - -
17 Sumur Bandung 22 26 - 397 - - - 48 - -
18 A n d i r - - - 223 845 136 277 1.157 - -
19 Cicendo - - - 338 499 386 178 293 - 262
20 Bandung Wetan 51 - - 25 - - - 220 - -
21 Cibeunying Kidul
- - - - 2.017 245 - - - 59
22 Cibeunying Kaler - - - 37 35 - - 440 - -
23 Coblong - - - 57 - - - - - -
24 Sukajadi - - - - - - - 23 - 60
25 Sukasari - - - - - - - 36 23 -
26 Cidadap - - - - - - - - - -
KOTA BANDUNG 675 233 213 3.655 27.518 3.900 12.094 21.790 1.097 9.653
Sumber / Source : BPS Kota Bandung

INDUSTRI DAN ENERGI
Bandung Dalam Angka Tahun 2005 203
Lanjutan Tabel 6.1.3
Continued Table 6.13
K L U I KECAMATAN
SUB DISTRICT 202 210 221 232 241 242 243 251 252 261
[1] [12] [13] [14] [15] [16] [17] [18] [19] [20] [21]
1 Bandung Kulon - - 93 - 59 - - 294 318 -
2 Babakan Ciparay - 60 157 - - - - 40 594 -
3 Bojongloa Kaler - - 35 - - 105 - - - -
4 Bojongloa Kidul - - 93 - - - - - 30 -
5 Astanaanyar - - - - - - - - 32 -
6 R e g o l - - 178 - - - - - - -
7 Lengkong - - 62 - - - - - - -
8 Bandung Kidul - - - - - - - - - -
9 Margacinta - - - - - 227 - 68 - -
10 Rancasari - - - 21 22 - - 468 - 83
11 Cibiru 579 - 51 - - 142 - - - -
12 Ujungberung - - - - - 329 - 85 - -
13 Arcamanik - - - - - - - - - -
14 Cicadas - - - - 74 - - - - -
15 Kiaracondong 52 - 374 - 51 - - - - -
16 Batununggal - 193 92 - - 77 - - - -
17 Sumur Bandung - - 189 - - - - - - -
18 A n d i r 22 - 37 - - - - - 430 -
19 Cicendo 36 33 51 - - 546 - 1.827 - -
20 Bandung Wetan - - - - - 45 - - - -
21 Cibeunying
Kidul - - 21 - - 36 484 - 136 -
22 Cibeunying Kaler - - - - - - - - - -
23 Coblong - - - - - - - - - -
24 Sukajadi - - - - - 699 - - - -
25 Sukasari - - - - - - - - - -
26 Cidadap - - - - - - - - - -
KOTA BANDUNG 891 496 1.654 253 447 2.448 727 3.033 1.792 344
Sumber / Source : BPS Kota Bandung
INDUSTRI DAN ENERGI
Bandung Dalam Angka Tahun 2005 204
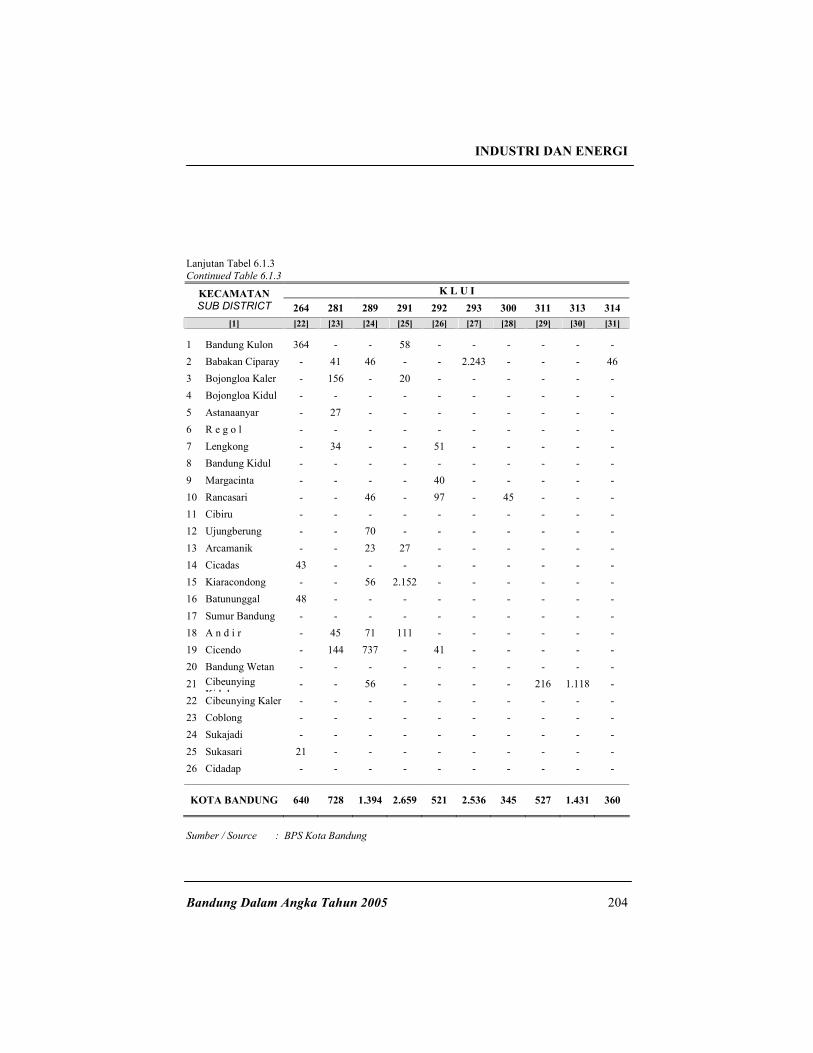
Lanjutan Tabel 6.1.3
Continued Table 6.1.3
K L U I KECAMATAN
SUB DISTRICT 264 281 289 291 292 293 300 311 313 314
[1] [22] [23] [24] [25] [26] [27] [28] [29] [30] [31]
1 Bandung Kulon 364 - - 58 - - - - - -
2 Babakan Ciparay - 41 46 - - 2.243 - - - 46
3 Bojongloa Kaler - 156 - 20 - - - - - -
4 Bojongloa Kidul - - - - - - - - - -
5 Astanaanyar - 27 - - - - - - - -
6 R e g o l - - - - - - - - - -
7 Lengkong - 34 - - 51 - - - - -
8 Bandung Kidul - - - - - - - - - -
9 Margacinta - - - - 40 - - - - -
10 Rancasari - - 46 - 97 - 45 - - -
11 Cibiru - - - - - - - - - -
12 Ujungberung - - 70 - - - - - - -
13 Arcamanik - - 23 27 - - - - - -
14 Cicadas 43 - - - - - - - - -
15 Kiaracondong - - 56 2.152 - - - - - -
16 Batununggal 48 - - - - - - - - -
17 Sumur Bandung - - - - - - - - - -
18 A n d i r - 45 71 111 - - - - - -
19 Cicendo - 144 737 - 41 - - - - -
20 Bandung Wetan - - - - - - - - - -
21 Cibeunying Kidul
- - 56 - - - - 216 1.118 -
22 Cibeunying Kaler - - - - - - - - - -
23 Coblong - - - - - - - - - -
24 Sukajadi - - - - - - - - - -
25 Sukasari 21 - - - - - - - - -
26 Cidadap - - - - - - - - - -
KOTA BANDUNG 640 728 1.394 2.659 521 2.536 345 527 1.431 360
Sumber / Source : BPS Kota Bandung
INDUSTRI DAN ENERGI
Bandung Dalam Angka Tahun 2005 205
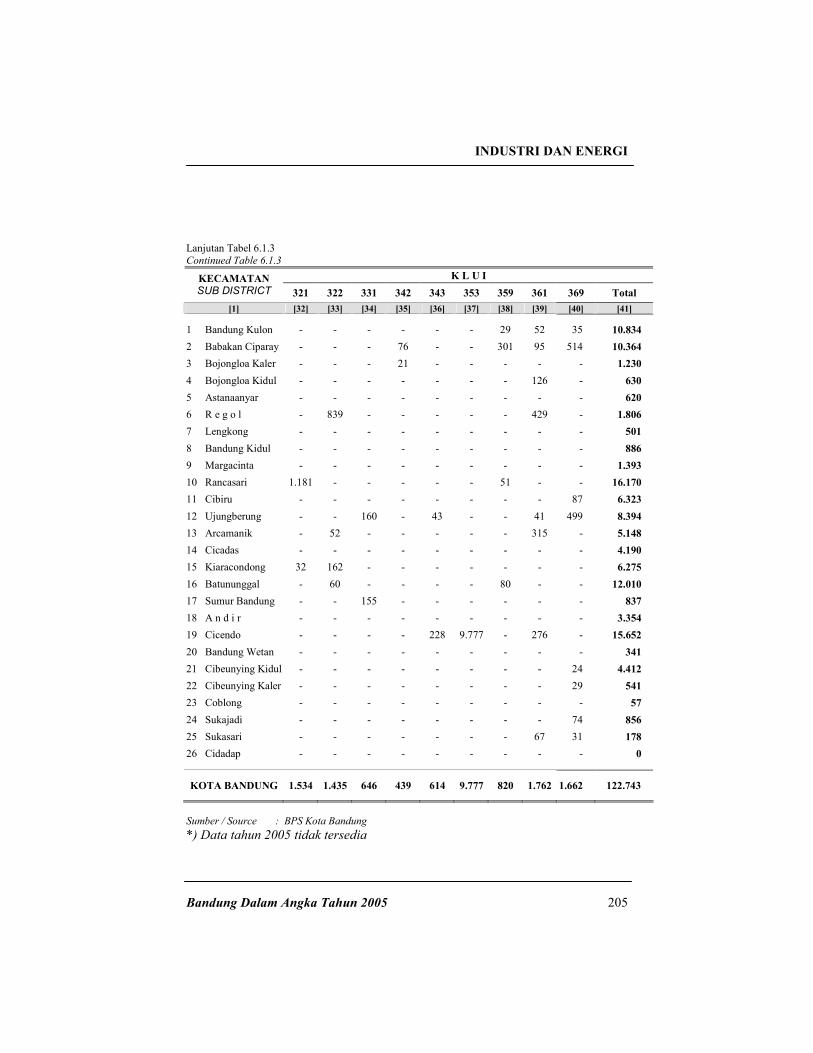
Lanjutan Tabel 6.1.3
Continued Table 6.1.3
K L U I KECAMATAN
SUB DISTRICT 321 322 331 342 343 353 359 361 369 Total
[1] [32] [33] [34] [35] [36] [37] [38] [39] [40] [41]
1 Bandung Kulon - - - - - - 29 52 35 10.834
2 Babakan Ciparay - - - 76 - - 301 95 514 10.364
3 Bojongloa Kaler - - - 21 - - - - - 1.230
4 Bojongloa Kidul - - - - - - - 126 - 630
5 Astanaanyar - - - - - - - - - 620
6 R e g o l - 839 - - - - - 429 - 1.806
7 Lengkong - - - - - - - - - 501
8 Bandung Kidul - - - - - - - - - 886
9 Margacinta - - - - - - - - - 1.393
10 Rancasari 1.181 - - - - - 51 - - 16.170
11 Cibiru - - - - - - - - 87 6.323
12 Ujungberung - - 160 - 43 - - 41 499 8.394
13 Arcamanik - 52 - - - - - 315 - 5.148
14 Cicadas - - - - - - - - - 4.190
15 Kiaracondong 32 162 - - - - - - - 6.275
16 Batununggal - 60 - - - - 80 - - 12.010
17 Sumur Bandung - - 155 - - - - - - 837
18 A n d i r - - - - - - - - - 3.354
19 Cicendo - - - - 228 9.777 - 276 - 15.652
20 Bandung Wetan - - - - - - - - - 341
21 Cibeunying Kidul - - - - - - - - 24 4.412
22 Cibeunying Kaler - - - - - - - - 29 541
23 Coblong - - - - - - - - - 57
24 Sukajadi - - - - - - - - 74 856
25 Sukasari - - - - - - - 67 31 178
26 Cidadap - - - - - - - - - 0
KOTA BANDUNG 1.534 1.435 646 439 614 9.777 820 1.762 1.662 122.743
Sumber / Source : BPS Kota Bandung
*) Data tahun 2005 tidak tersedia
INDUSTRI DAN ENERGI
Bandung Dalam Angka Tahun 2005 206
Tabel
Table
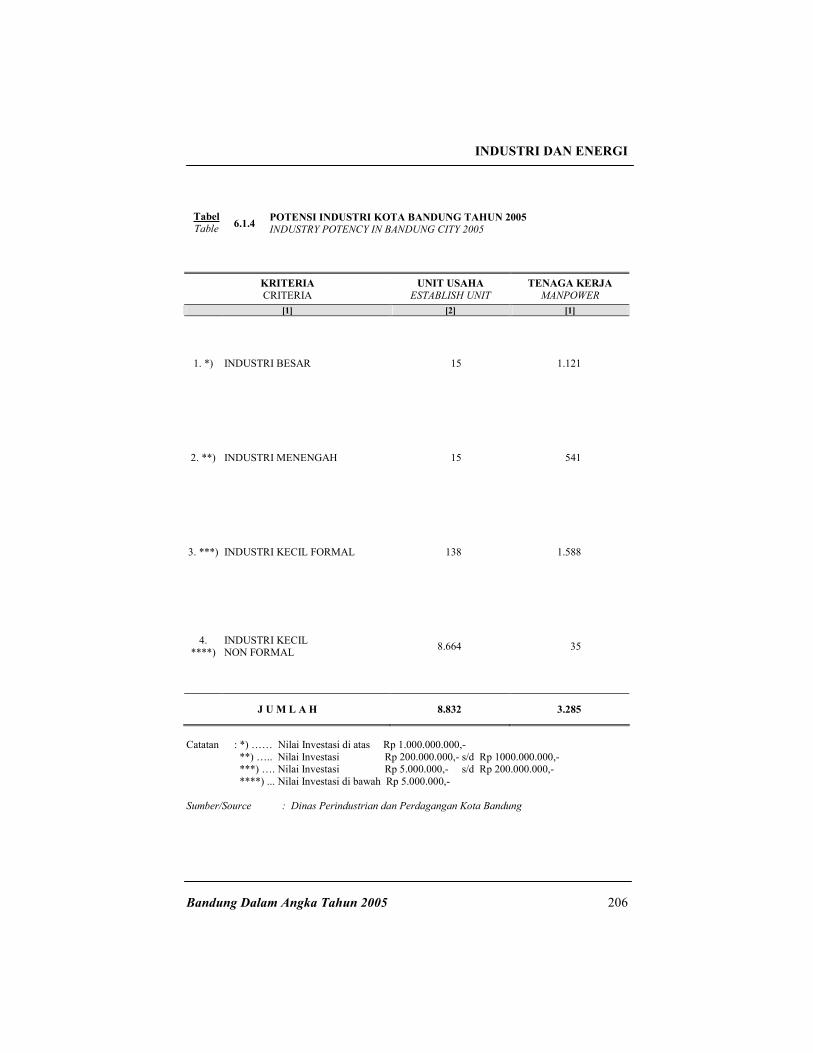
6.1.4 POTENSI INDUSTRI KOTA BANDUNG TAHUN 2005
INDUSTRY POTENCY IN BANDUNG CITY 2005
KRITERIA
CRITERIA UNIT USAHA
ESTABLISH UNIT TENAGA KERJA
MANPOWER
[1] [2] [1]
1. *) INDUSTRI BESAR 15 1.121
2. **) INDUSTRI MENENGAH 15 541
3. ***) INDUSTRI KECIL FORMAL 138 1.588
4. ****)
INDUSTRI KECIL NON FORMAL
8.664 35
J U M L A H 8.832 3.285
Catatan : *) …… Nilai Investasi di atas Rp 1.000.000.000,-
**) ….. Nilai Investasi Rp 200.000.000,- s/d Rp 1000.000.000,- ***) …. Nilai Investasi Rp 5.000.000,- s/d Rp 200.000.000,-
****) ... Nilai Investasi di bawah Rp 5.000.000,-
Sumber/Source : Dinas Perindustrian dan Perdagangan Kota Bandung
INDUSTRI DAN ENERGI
Bandung Dalam Angka Tahun 2005 207
Tabel
Table
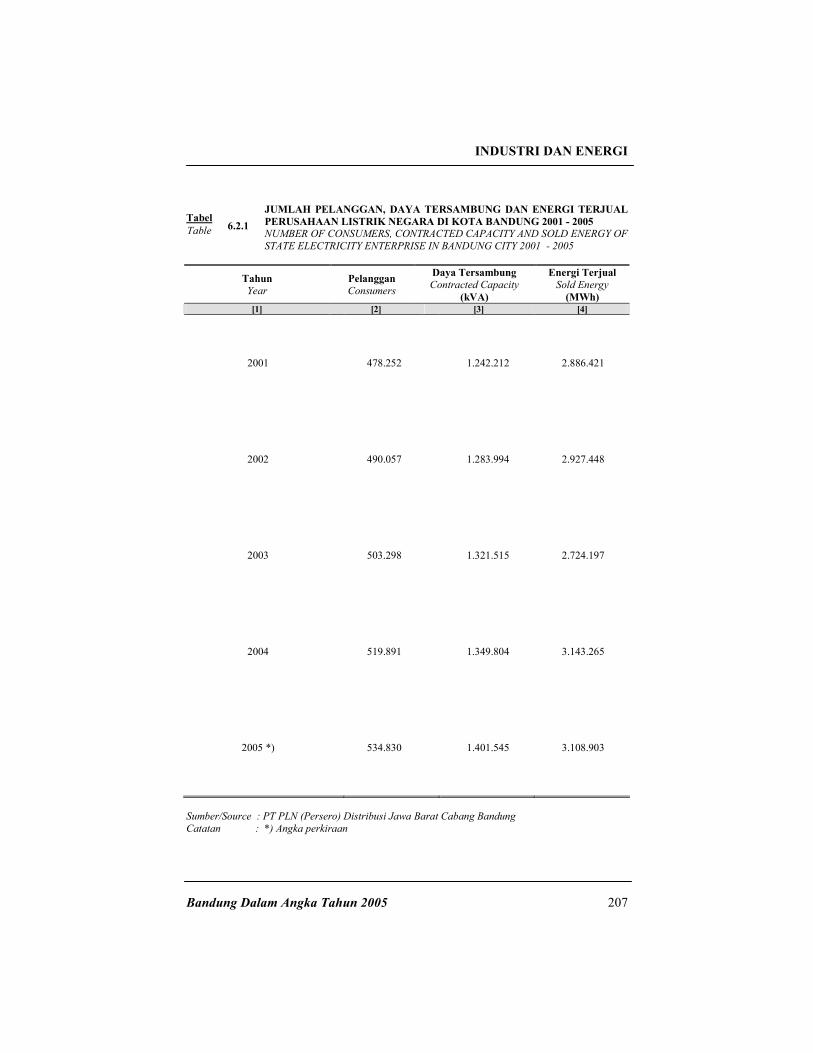
6.2.1
JUMLAH PELANGGAN, DAYA TERSAMBUNG DAN ENERGI TERJUAL
PERUSAHAAN LISTRIK NEGARA DI KOTA BANDUNG 2001 - 2005
NUMBER OF CONSUMERS, CONTRACTED CAPACITY AND SOLD ENERGY OF
STATE ELECTRICITY ENTERPRISE IN BANDUNG CITY 2001 - 2005
Tahun
Year Pelanggan
Consumers
Daya Tersambung
Contracted Capacity
(kVA)
Energi Terjual
Sold Energy
(MWh) [1] [2] [3] [4]
2001 478.252 1.242.212 2.886.421
2002 490.057 1.283.994 2.927.448
2003 503.298 1.321.515 2.724.197
2004 519.891 1.349.804 3.143.265
2005 *) 534.830 1.401.545 3.108.903
Sumber/Source : PT PLN (Persero) Distribusi Jawa Barat Cabang Bandung
Catatan : *) Angka perkiraan
INDUSTRI DAN ENERGI
Bandung Dalam Angka Tahun 2005 208
Tabel
Table
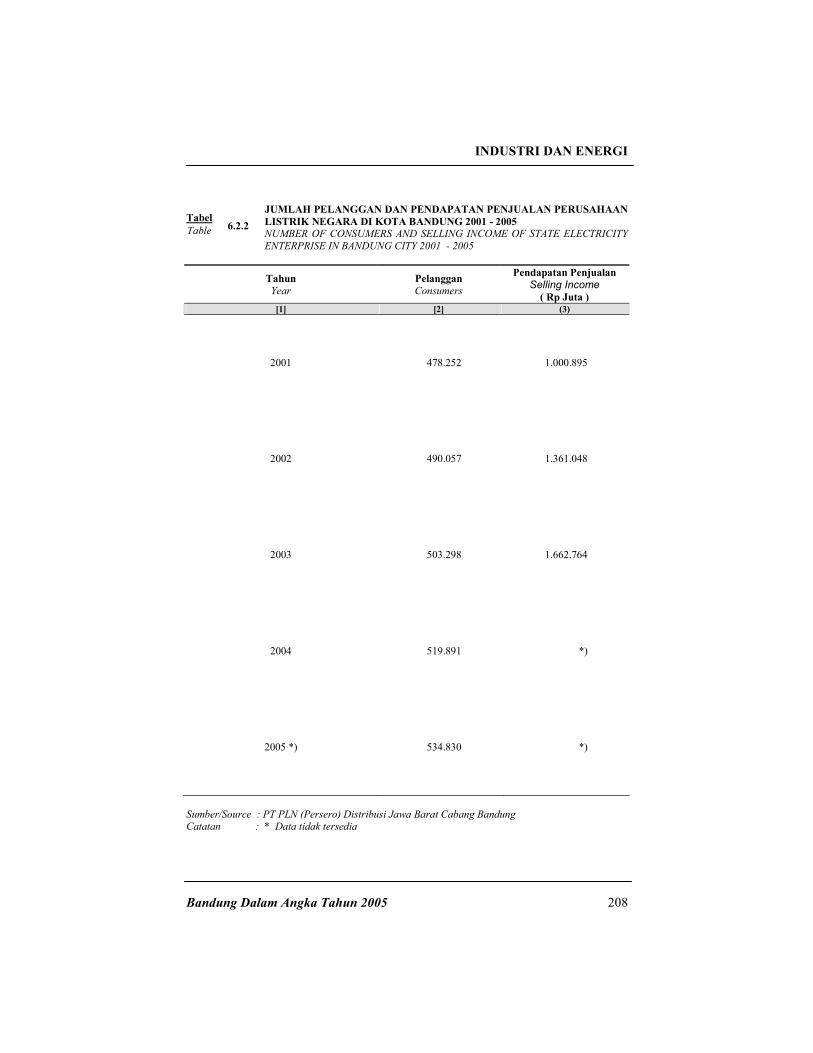
6.2.2
JUMLAH PELANGGAN DAN PENDAPATAN PENJUALAN PERUSAHAAN
LISTRIK NEGARA DI KOTA BANDUNG 2001 - 2005
NUMBER OF CONSUMERS AND SELLING INCOME OF STATE ELECTRICITY
ENTERPRISE IN BANDUNG CITY 2001 - 2005
Tahun
Year Pelanggan
Consumers
Pendapatan Penjualan
Selling Income ( Rp Juta )
[1] [2] (3)
2001 478.252 1.000.895
2002 490.057 1.361.048
2003 503.298 1.662.764
2004 519.891 *)
2005 *) 534.830 *)
Sumber/Source : PT PLN (Persero) Distribusi Jawa Barat Cabang Bandung Catatan : * Data tidak tersedia
INDUSTRI DAN ENERGI
Bandung Dalam Angka Tahun 2005 209
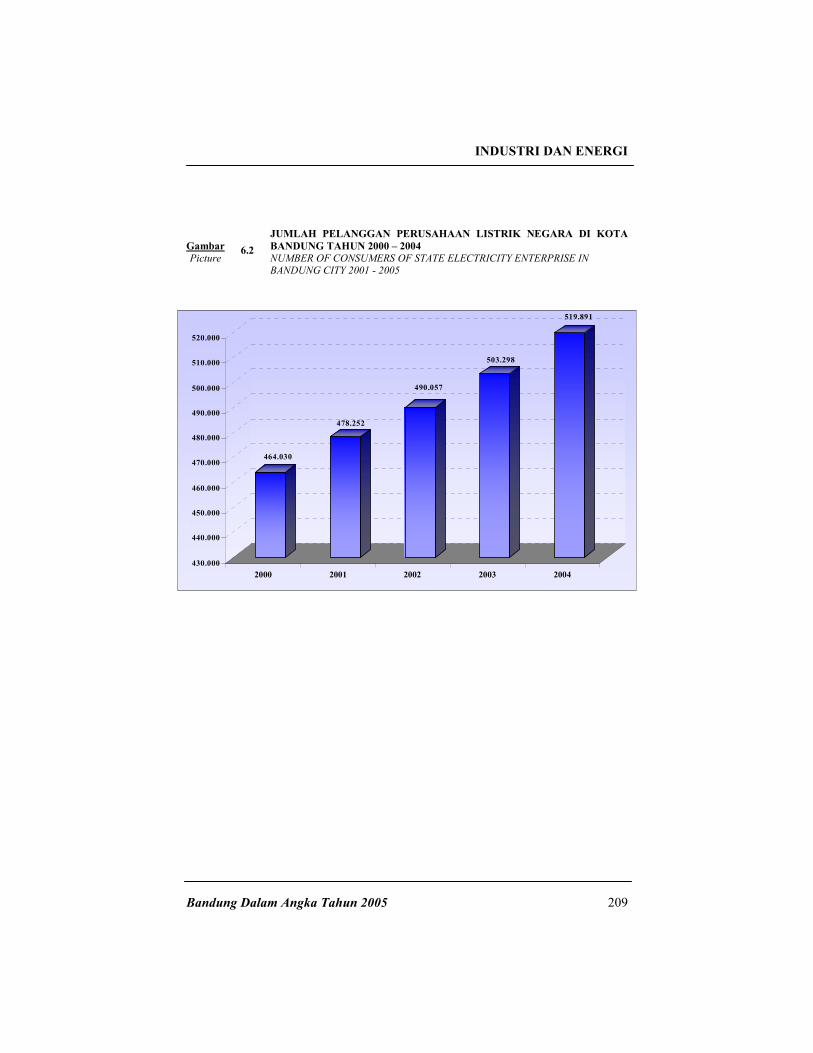
464.030
478.252
490.057
503.298
519.891
430.000
440.000
450.000
460.000
470.000
480.000
490.000
500.000
510.000
520.000
2000 2001 2002 2003 2004
Gambar
JUMLAH PELANGGAN PERUSAHAAN LISTRIK NEGARA DI KOTA
BANDUNG TAHUN 2000 – 2004
Picture
6.2 NUMBER OF CONSUMERS OF STATE ELECTRICITY ENTERPRISE IN BANDUNG CITY 2001 - 2005
INDUSTRI DAN ENERGI
Bandung Dalam Angka Tahun 2005 210
Tabel
JUMLAH PELANGGAN GAS KOTA DI PN GAS NEGARA CABANG
BANDUNG TAHUN 2005
Table
6.2.3 NUMBER OF CITY GAS CONSUMERS IN STATE GAS ENTERPRISE BRANCH
OF BANDUNG 2005
Jenis Pelanggan
Type of Consumers Jumlah
Penjualan
(Kg)
Pendapatan
(Rp 000)
[1] [2] [3] [4]
1 Rumah Tangga / Household
a. Umum / General 4.980 1.155.536 4.911.028
b.
ABRI / Indonesian
Armed Forces 1 12.216 51.918
c. Pemakaian Sendiri - - -
d. Pegawai / Employee - - -
2 Komersial / Commercial
a. Kantor / Office - - -
b. Rumah Sakit / Hospital 5 55.198 234.592
c. Restoran / Hotel Restaurant and Hotel
10 108.144 459.612
3 Industri / Industry
a. Rumah Tangga / Household
- - -
b. Industri / Industry 11 134.426 571.310
Jumlah / Total 2005
2004 2003
2002
2001 2000
5.007
5.006 5.862
5.862
5.862 5.862
1.465.520
1.663.244
6.228.460
4.934.512
Sumber/Source : PT Perusahaan Gas Negara (Persero) Tbk.
INDUSTRI DAN ENERGI
Bandung Dalam Angka Tahun 2005 211
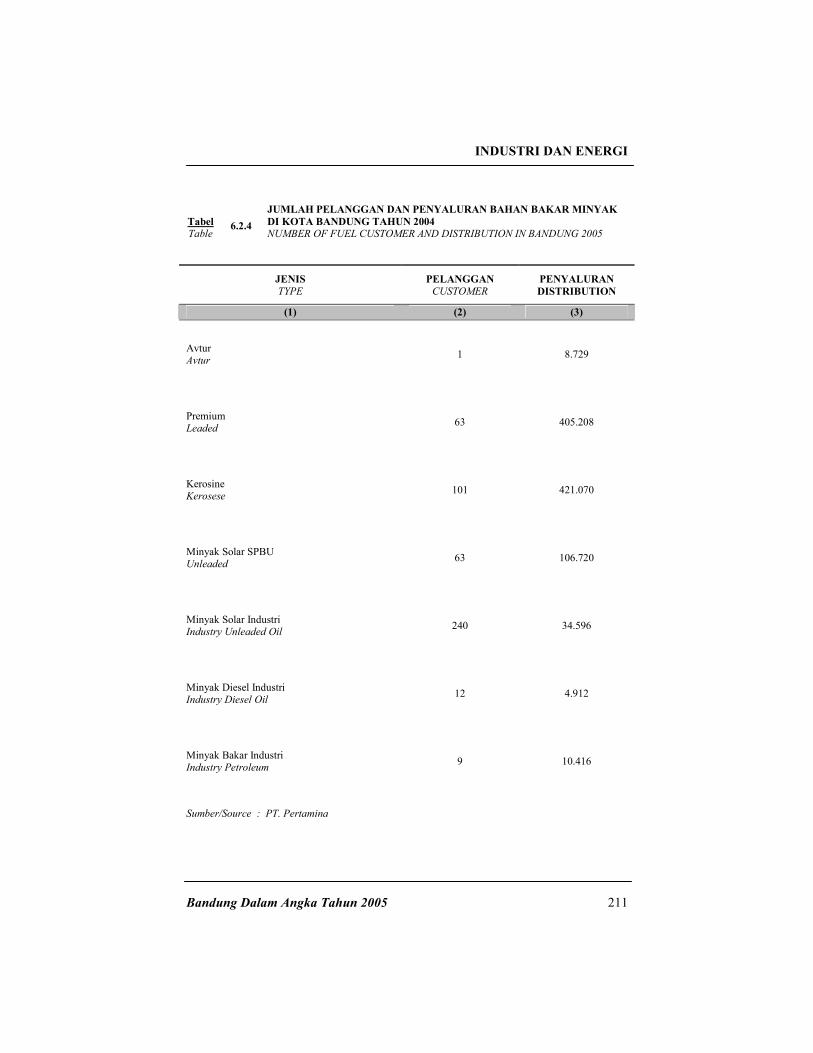
Tabel
JUMLAH PELANGGAN DAN PENYALURAN BAHAN BAKAR MINYAK
DI KOTA BANDUNG TAHUN 2004
Table
6.2.4 NUMBER OF FUEL CUSTOMER AND DISTRIBUTION IN BANDUNG 2005
JENIS
TYPE PELANGGAN
CUSTOMER PENYALURAN
DISTRIBUTION
(1) (2) (3)
Avtur Avtur
1 8.729
Premium Leaded
63 405.208
Kerosine Kerosese
101 421.070
Minyak Solar SPBU Unleaded
63 106.720
Minyak Solar Industri Industry Unleaded Oil
240 34.596
Minyak Diesel Industri Industry Diesel Oil
12 4.912
Minyak Bakar Industri Industry Petroleum
9 10.416
Sumber/Source : PT. Pertamina
INDUSTRI DAN ENERGI
Bandung Dalam Angka Tahun 2005 212
Tabel
Table
6.2.5 PRODUKSI AIR MINUM DI KOTA BANDUNG PADA TAHUN 2005
DRINKING WATER PRODUCTIONS IN BANDUNG CITY 2005
Sumber Air Minum
Source of Drinking Water Banyaknya
Total ( M 3 )
[1] [2]
1. Sungai / River 66.348.000
2. Danau / Lake -
3. Waduk / Basin -
4. Mata Air / Spring 5.341.000
5. Artesis / Air Tanah / Sumur Bor 4.638.000
6. Lainnya / Others -
Jumlah / Total 2005
2004
2003 2002
2001
2000
76.327.000
79.927.566
79.522.079 77.902.342
75.124.000
74.270.653
Sumber/Source : Perusahaan Daerah Air Minum Kota Bandung
INDUSTRI DAN ENERGI
Bandung Dalam Angka Tahun 2005 213
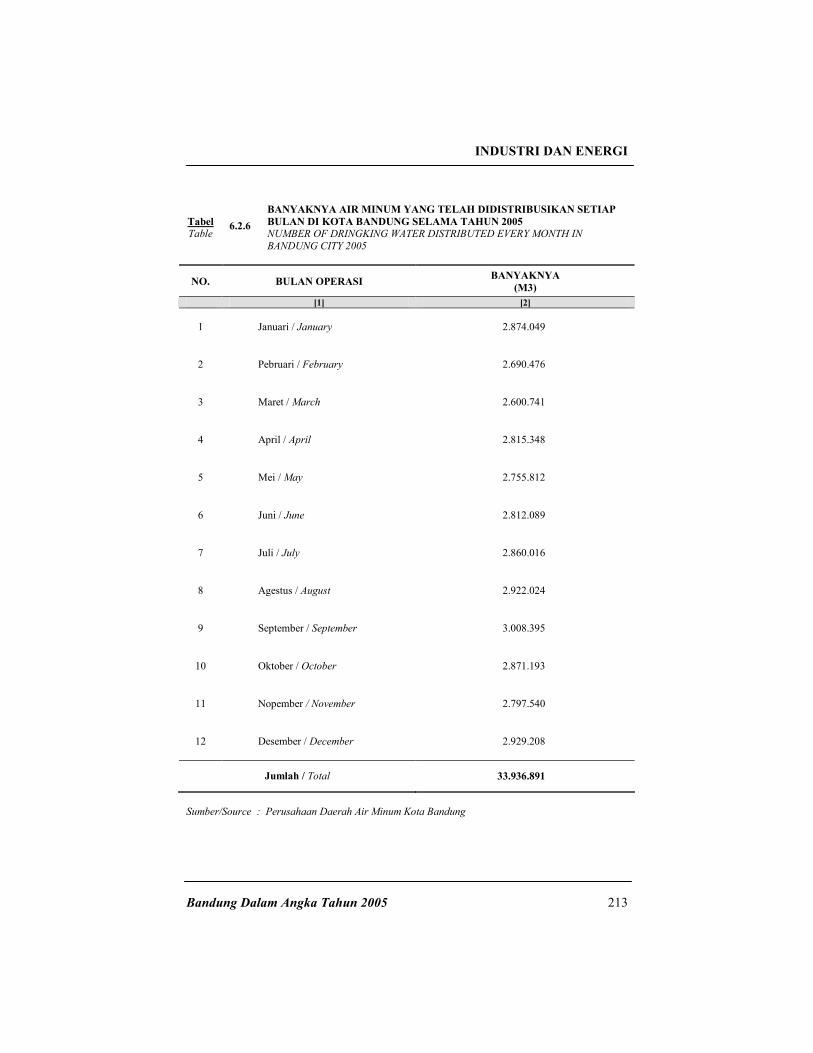
Tabel
BANYAKNYA AIR MINUM YANG TELAH DIDISTRIBUSIKAN SETIAP
BULAN DI KOTA BANDUNG SELAMA TAHUN 2005
Table
6.2.6 NUMBER OF DRINGKING WATER DISTRIBUTED EVERY MONTH IN
BANDUNG CITY 2005
NO. BULAN OPERASI BANYAKNYA
(M3)
[1] [2]
1 Januari / January 2.874.049
2 Pebruari / February 2.690.476
3 Maret / March 2.600.741
4 April / April 2.815.348
5 Mei / May 2.755.812
6 Juni / June 2.812.089
7 Juli / July 2.860.016
8 Agestus / August 2.922.024
9 September / September 3.008.395
10 Oktober / October 2.871.193
11 Nopember / November 2.797.540
12 Desember / December 2.929.208
Jumlah / Total 33.936.891
Sumber/Source : Perusahaan Daerah Air Minum Kota Bandung
INDUSTRI DAN ENERGI
Bandung Dalam Angka Tahun 2005 214
Tabel
Table
6.2.7
BANYAKNYA AIR MINUM YANG DISALURKAN DI KOTA BANDUNG
SELAMA TAHUN 2005
NUMBER OF DISTRIBUTED DRINKING WATER IN BANDUNG CITY DURING
2005
Air Minum yang Disalurkan
Distributed Drinking Water Kategori Pelanggan
Consumers Category Banyaknya Terjual
Total
( M 3 )
Nilai/Value
( Rp. 000 )
[1] [3] [4]
1
Rumah Tangga (tempat tinggal) Household
25.657.373 61.910.317
2
Badan Sosial / Rumah Sakit
398.003 629.343
3
Tempat Peribadatan / Fasilitas Umum
1.302.418 1.258.458
4 Toko, Perusahaan & Hotel
4.002.599 15.708.940
5
Instansi / Kantor Pemerintah Instance / Government Office
2.405.477 7.063.943
6
Industri dan Obyek Wisata
159.205 771.583
Jumlah / Total 2005
2004
2003 2002
2001
2000
33.925.075
33.065.526
33.873.552 35.828.311
41.751.699
40.228.096
87.342.584
54.328.457
86.141.889 93.839.990
55.308.972
39.622.166
Sumber/Source : Perusahaan Daerah Air Minum Kota Bandung
INDUSTRI DAN ENERGI
Bandung Dalam Angka Tahun 2005 215
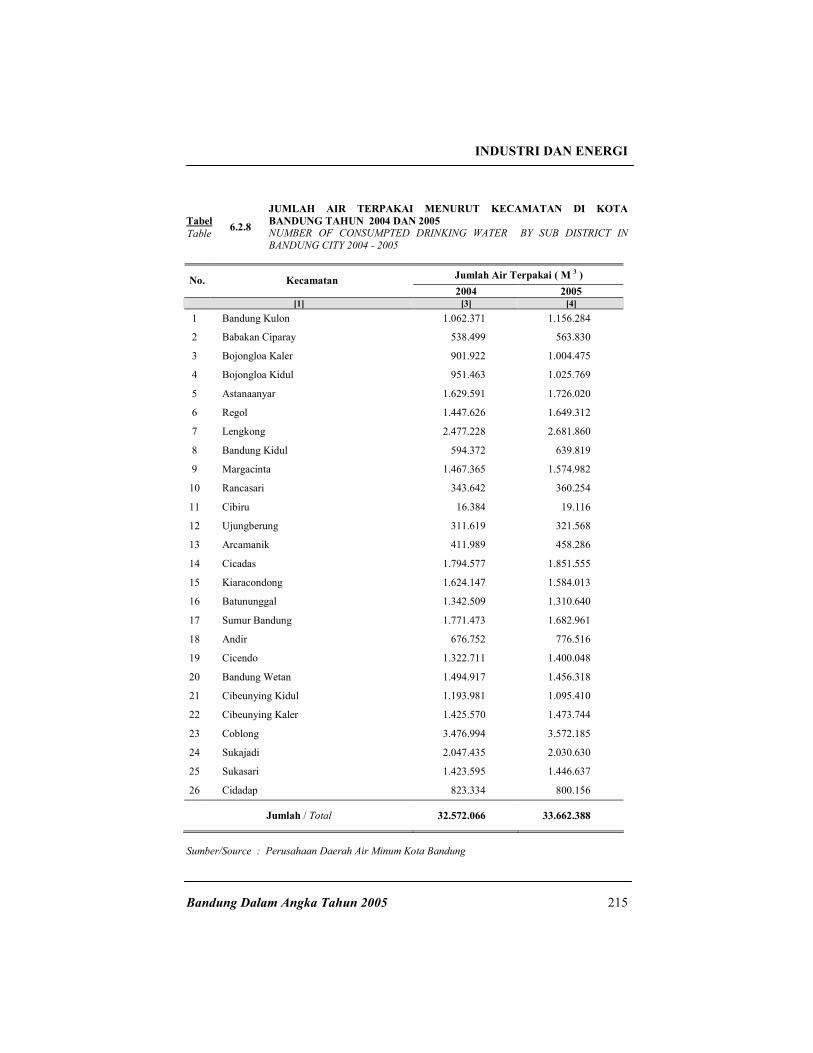
Tabel
Table 6.2.8
JUMLAH AIR TERPAKAI MENURUT KECAMATAN DI KOTA
BANDUNG TAHUN 2004 DAN 2005
NUMBER OF CONSUMPTED DRINKING WATER BY SUB DISTRICT IN
BANDUNG CITY 2004 - 2005
Jumlah Air Terpakai ( M 3 ) No. Kecamatan
2004 2005 [1] [3] [4]
1 Bandung Kulon 1.062.371 1.156.284
2 Babakan Ciparay 538.499 563.830
3 Bojongloa Kaler 901.922 1.004.475
4 Bojongloa Kidul 951.463 1.025.769
5 Astanaanyar 1.629.591 1.726.020
6 Regol 1.447.626 1.649.312
7 Lengkong 2.477.228 2.681.860
8 Bandung Kidul 594.372 639.819
9 Margacinta 1.467.365 1.574.982
10 Rancasari 343.642 360.254
11 Cibiru 16.384 19.116
12 Ujungberung 311.619 321.568
13 Arcamanik 411.989 458.286
14 Cicadas 1.794.577 1.851.555
15 Kiaracondong 1.624.147 1.584.013
16 Batununggal 1.342.509 1.310.640
17 Sumur Bandung 1.771.473 1.682.961
18 Andir 676.752 776.516
19 Cicendo 1.322.711 1.400.048
20 Bandung Wetan 1.494.917 1.456.318
21 Cibeunying Kidul 1.193.981 1.095.410
22 Cibeunying Kaler 1.425.570 1.473.744
23 Coblong 3.476.994 3.572.185
24 Sukajadi 2.047.435 2.030.630
25 Sukasari 1.423.595 1.446.637
26 Cidadap 823.334 800.156
Jumlah / Total 32.572.066 33.662.388
Sumber/Source : Perusahaan Daerah Air Minum Kota Bandung