Embed Size (px)
Citation preview

Kws
MDLa
Bb
3c
1d
U
a
ARRA
KCTDKF
1
rc(a2anCfu
(
h0
Industrial Crops and Products 76 (2015) 128–140
Contents lists available at ScienceDirect
Industrial Crops and Products
journa l homepage: www.e lsev ier .com/ locate / indcrop
inetic study of the thermal decomposition of cellulose nanocrystalsith different polymorphs, cellulose I and II, extracted from different
ources and using different types of acids
ariana Alves Henrique a, Wilson Pires Flauzino Neto a, Hudson Alves Silvério a,ouglas Ferreira Martins a, Leandro Vinícius Alves Gurgel b, Hernane da Silva Barud c,uís Carlos de Morais d, Daniel Pasquini a,∗
Instituto de Química, Universidade Federal de Uberlândia, Campus Santa Mônica, Av. João Naves de Ávila, 2121, 38400-902 Uberlândia, Minas Gerais,razilDepartamento de Química, Instituto de Ciências Exatas e Biológicas, Universidade Federal de Ouro Preto, Campus Universitário Morro do Cruzeiro,5450-000 Ouro Preto, Minas Gerais, BrazilInstituto de Química de Araraquara, Universidade Estadual Paulista Júlio de Mesquita, Campus de Araraquara, Rua Professor Francisco Degni, 55,4800-900 Araraquara, São Paulo, BrazilInstituto de Ciências Exatas, Naturais e Educac ão, Universidade Federal do Triângulo Mineiro, Av. Dr. Randolfo Borges, 1400, Univerdecidade, 38064-200beraba, Minas Gerais, Brazil
r t i c l e i n f o
rticle history:eceived 2 February 2015eceived in revised form 5 June 2015ccepted 20 June 2015
eywords:
a b s t r a c t
Cellulose nanocrystals (CNs) were extracted from different sources by acid hydrolysis using H2SO4 andHCl. The thermal decomposition of resulting CNs was studied by thermogravimetric analysis (TGA). Thekinetic parameters were determined using the Flynn–Wall–Ozawa (FWO) and Kissinger methods. CNswere also characterized by X-ray diffraction (XRD), Atomic Force Microscopy (AFM), elemental analysis(EA), Zeta Potential (ZP) and degree of polymerization (DP). The results of the XRD analysis showed
ellulose nanocrystalshermal decompositionecomposition kineticsissingerlynn–Wall–Ozawa
different profiles, making it possible to differentiate cellulose I from cellulose II. The results obtained bythe FWO method showed that cellulose II CNs had an increased activation energy (Ea) with conversion(˛), while in CNs of cellulose I the Ea remained constant or decreased slightly. This difference between Ea
values for the thermal decomposition of CNs was mainly attributed to different crystalline arrangementsof cellulose I and cellulose II, and to the type of acid employed.
. Introduction
There is a growing interest in developing novel polymer mate-ials derived from renewable resources such as cellulose. In thisontext, recent studies have shown that cellulose nanocrystalsCNs) could be used to prepare a wide range of composite materi-ls with improved properties (Eichhorn et al., 2010; Siqueira et al.,010). As a direct result, they have attracted immense interests a novel nanostructured material during recent years. CNs areanoparticles of high crystallinity derived from cellulosic fibres.
Ns are very high-value materials, since they can change the per-ormance of existing products as well as function as a raw materialsed to create new, unique and improved products. Their unique
∗ Corresponding author. Fax: +55 34 3239 4208.E-mail addresses: [email protected], [email protected]
D. Pasquini).
ttp://dx.doi.org/10.1016/j.indcrop.2015.06.048926-6690/© 2015 Elsevier B.V. All rights reserved.
© 2015 Elsevier B.V. All rights reserved.
combination of amazing physicochemical properties and envi-ronmental benefits allow CNs to offer a wide range of potentialapplications.
At the present moment, the main application of CNs is as a rein-forcing agent in the nanocomposite research field. Other researchfields with potential applications are packaging, paints, coatings,special papers, cosmetics, pharmaceuticals, biomedical materials,textiles, the automotive industry, aerospace, building materials,and the electronics and electrical industry, among others. In addi-tion, CNs come from renewable natural sources that are veryplentiful and inexpensive, and it is not necessary to synthesizethem. Their nanometric dimensions allow the production of com-posite films with excellent visible light transmittance, and CNs canbe easily chemically modified since their molecular structure has
reactive side surface hydroxyl groups which facilitate the graftingof chemical moieties in order to achieve different surface properties(Samir et al., 2005; Li et al., 2009; Liu et al., 2010; Lahiji et al., 2010;Moon et al., 2011; Peng et al., 2011; Flauzino Neto et al., 2013).
rops a
euADrrttioe(eotco2
2t(mamwdadwwlsrarf
dtacFttvCfCi
2
2
plpMitpB
M.A. Henrique et al. / Industrial C
Currently, CNs are obtained by different methods, includingnzymatic hydrolysis, acid hydrolysis and hydrolysis assisted byltrasound, among others (Filson et al., 2009; Filson and Dawson-ndoh, 2009). However, the most used method is acid hydrolysis.uring the reaction, the more accessible amorphous regions are
apidly attacked in comparison with the crystalline regions thatemain intact after the process (Habibi et al., 2010). With regardo extraction by acid hydrolysis, the temperature, reaction time,ype of acid, concentration of acid and the acid-to-solid ratio are allmportant parameters since they affect the morphology and physic-chemical properties of CNs (Silva and D’Almeida, 2009; Habibit al., 2010; Peng et al., 2011; Teixeira et al., 2011). The aspect ratioL/D) of the CNs is a crucial parameter that has a significant influ-nce on the ability of the nanoparticles to enhance the propertiesf a polymer matrix when they are incorporated into it. Therefore,he conditions for acid hydrolysis must be carefully considered andontrolled in order to obtain a material with the desired morphol-gy and properties (Roman and Winter, 2004; Martínez-Sanz et al.,011).
Since thermoplastic processing temperatures often exceed00 ◦C, the thermal stability of these nanocrystals is a key fac-or determining their use as effective reinforcement materialsRoman and Winter, 2004). Jeong et al. (2010) obtained CNs from
icrocrystalline cellulose (MCC) by acid hydrolysis using sulphuricnd hydrochloric acids as catalysts. They also studied the ther-al decomposition behavior of CNs and the activation energy (Ea)as evaluated by Broido’s method. Roman and Winter (2004) pro-
uced CNs from bacterial cellulose by acid hydrolysis using sulfuriccid as a catalyst under different hydrolysis conditions. They alsoetermined the thermal decomposition behavior of CNs and Ea
as also evaluated by Broido’s method. The problem involvedith determining Ea using the Broido’s method is that the calcu-
ation is made using a single thermogravimetric (TG) curve at apecific heating rate, which makes it susceptible to errors fromeproducibility of the TG curve. Therefore, a more precise methods Flynn–Wall–Ozawa (FWO) generally produces better and moreeliable results because it uses various TG curves obtained at dif-erent heating rates to determine Ea.
The aim of this study was to extract cellulose nanocrystals fromifferent sources using two types of acid (H2SO4 and HCl) in ordero obtain CNs with different morphologies and properties. Then,
study of the thermal decomposition of these different CNs wasarried out to assess their thermal decomposition properties. Thelynn–Wall–Ozawa (FWO) and Kissinger methods were employedo determine the activation energy and pre-exponential factor forhermal decomposition of the extracted CNs. These studies will pro-ide enough data to evaluate critically the possibility of applyingNs into polymer matrices in the preparation of nanocomposites,
or example. Furthermore, this study will also demonstrate whichNs are most suitable for application in polymer processing requir-
ng high melting temperatures without degradation of the CNs.
. Experimental
.1. Materials
The raw materials used in this study were the cellulose fromurified mango seeds (PMS), bleached Kraft pulp (KP) from Euca-
yptus urograndis, and cellophane (CELL) obtained by the industrialrocess. The mango seeds were supplied by Ebba. (Araguari,inas Gerais, Brazil). The species used was Ubá mango (Mangifera
ndica L.). The eucalyptus Kraft pulp sheets were supplied byhe Suzano company (Limeira, São Paulo, Brazil) and the cello-hane sheets were supplied by the Coopercel company (São Paulo,razil). Sulphuric acid (98.0 wt.%), hydrochloric acid (37 wt.%),
nd Products 76 (2015) 128–140 129
sodium hydroxide, and potassium hydroxide were purchased fromVetec (Brazil). Sodium chlorite (NaClO2, technical grade, 80%)and cellulose membrane (cat. no. D9402) were purchased fromSigma–Aldrich. Glacial acetic acid was purchased from Synth(Brazil) and cupric ethylenediamine was purchased from Cromo-line (Brazil).
2.2. Extraction of cellulose nanocrystals (CNs)
2.2.1. CNs from mango seeds (MS)Initially, the mango seeds (MS) were ground in a mill and subse-
quently sifted to pass through an 18-mesh sieve. Then, the MS weretreated four times with a 2% (w/w) aqueous sodium hydroxide solu-tion for 4 h at 100 ◦C under mechanical stirring. The alkali-treatedMS were filtered off and washed with an excess of distilled wateruntil the alkali was completely removed (pH 7). The alkali-treatedMS were then dried at 40 ◦C for 24 h in an oven with forced aircirculation. After this treatment, the fibres were bleached with asolution made up of equal parts (1:1/v:v) of a solution composed ofacetate buffer (27 g of NaOH and 75 mL of glacial acetic acid, dilutedto 1 L in distilled water) and aqueous sodium chlorite (1.7 wt.%NaClO2 in water). The bleaching treatment was performed twiceat 80 ◦C for 6 h. The bleached fibres were filtered off and washedwith an excess of distilled water until the wash water was pH 7,and subsequently dried at 40 ◦C for 24 h in an oven with forced aircirculation (de Rodriguez et al., 2006). The fibre content through-out these chemical treatments was about 4–6 % (w/w). The resultingmaterial obtained after these treatments was referred to as purifiedmango seeds (PMS).
After the preparation and purification treatments, the PMSwas submitted to a nanocrystal extraction procedure through acidhydrolysis. The extraction of CNs from PMS was performed usingtwo types of acids, H2SO4 and HCl, respectively. The extractionof CNs from PMS with sulphuric acid was performed at 40 ◦C for10 min using a solid-to-liquid ratio of 1:20 (w:v) with 11.12 mol L−1
H2SO4 solution under vigorous and constant magnetic stirring. Theextraction of CNs from PMS using hydrochloric acid was carriedout at 40 ◦C for 225 min using a solid-to-liquid ratio of 1:20 (w:v)with 11.97 mol L−1 HCl solution. Immediately at the end of acidhydrolysis, the suspension of CNs was diluted ten-fold with colddistilled water to stop the hydrolysis reaction and centrifuged for10 min at 7500 rpm on a refrigerated centrifuge (Model 5804R fromthe Eppendorf company) to remove excess acid. The CNs from PMSwere then dialyzed against water using a cellulose membrane toremove acid residues, inorganics and soluble sugars until pH 7 wasreached (∼4 days). Subsequently, the suspension of CNs from thedialysis process was sonicated for 10 min and stored in a refriger-ator at 4 ◦C prior to the analyses. Some drops of chloroform wereadded to the CN suspension as an inhibitor to avert the growth ofmicroorganisms.
2.2.2. CNs from Kraft pulp (KP)The extraction of CNs from Kraft pulp (KP) with H2SO4 was per-
formed at 45 ◦C for 50 min using a solid-to-liquid ratio of 1:20 (w:v)with 9.17 mol L−1 H2SO4 solution. The extraction of CNs from KPwith HCl was carried out at 45 ◦C for 75 min using a solid-to-liquidratio of 1:25 (w:v) with 11.97 mol L−1 HCl solution. At the end ofthe hydrolysis the reaction was stopped and the suspension of CNsextracted using H2SO4 or HCl was purified using the proceduredescribed in Section 2.2.1.
2.2.3. CNs from cellophane (CELL)
The extraction of CNs from cellophane (CELL) with H2SO4 wasperformed at 45 ◦C for 10 min using a solid-to-liquid ratio of 1:25(w:v) with 11.12 mol L−1 H2SO4 solution. The extraction of CNsfrom CELL with HCl was carried out at 45 ◦C for 30 min using a solid-
1 rops a
tesp
2
IcH
2
mmfm
2
cstp
D
wo(
iscd
[
wtto
2
oa(Afo(a
C
C
woIa
30 M.A. Henrique et al. / Industrial C
o-liquid ratio of 1:25 (w:v) with 11.97 mol L−1 HCl solution. At thend of the hydrolysis, the reaction was stopped and the suspen-ion of CNs extracted using H2SO4 or HCl was purified using therocedure described in Section 2.2.1.
.3. Elemental analysis
Elemental analysis was performed on a CHNS-EA1110/O CEnstruments elemental analyser in order to estimate the sulphurontent (SC) in the different CNs prepared after hydrolysis using2SO4 or HCl.
.4. Zeta-potential (ZP)
Potential charges on the surface of the different CNs wereeasured on a Malverne 3000 Zetasizer NanoZS (Malverne Instru-ents, UK). The CNs suspensions (0.05 wt.%), previously sonicated
or 5 min, were prepared in deionized water and analyzed to deter-ine the zeta-potential of the CNs suspensions.
.5. Degree of polymerization (DP)
The degree of polymerization (DP) of each CNs preparation wasalculated according to TAPPI T 230 OS-76 and SCAN – C 15:62tandards. The degree of polymerization (DP) was calculated fromhe value of intrinsic viscosity [�] using the relationship (Eq. (1))roposed by Inmergut, Shurtz and Mark (SCAN-C15: 62, 1962).
P0.905 = 0.75 [�] (1)
here the values of 0.905 and 0.75 are constants characteristicf the polymer-solvent system and [�] is the intrinsic viscositymL g−1).
The intrinsic viscosities [�] of the CNs were obtained by measur-ng the flow of solvent and solutions in an Ostwald viscometer. Theolvent used was a mixture of a solution of bis(ethylenediamine)opper(II) hydroxide and water. The intrinsic viscosities [�] wereetermined from Eq. (2).
�] =
√[2nsp − ln(nrel)
]C
(2)
here nrel is the relative viscosity given by the ratio of the flowime of the solution of CNs and the flow time of the solvent, nsp ishe specific viscosity given by (nrel − 1), and C is the concentrationf the solution of CNs in g mL−1.
.6. X-ray diffraction (XRD)
The X-ray diffractograms of the different CNs prepared werebtained on a Shimadzu LabX XRD-6000 diffractometer operatingt a voltage of 40 kV with a current of 30 mA and Cu K� radiation1.5406 Å) at 25 ◦C with 2� from 5 to 40◦ and a scan rate of 1◦ min−1.ll samples of CNs were dried at 50 ◦C for 12 h in an oven with
orced air circulation prior to analysis. The crystallinity index (CrI)f the CNs was determined by the Segal method (Segal et al., 1959)cellulose I) or the Revol method (Revol et al., 1987) (cellulose II),s shown in Eqs. (3) and (4), respectively.
rI =(I200 − Iam
I200
)× 100 (3)
rI =(I110 − I15
I110
)× 100 (4)
here I200 and I110 are the maximum intensities (in arbitrary units)f the 200 and 110 lattice diffractions, respectively, and Iam and
15 are the intensities of diffractions in the same units at 2� = 18◦
nd 15◦, respectively. I200 and I110 represent both crystalline and
nd Products 76 (2015) 128–140
amorphous regions, while Iam and I15 represent only the amor-phous portion. The Miller indexes employed in these equations arein agreement with French (2014).
2.7. Atomic force microscopy (AFM)
AFM measurements were performed on a Shimadzu SPM-9600to evaluate the morphology of the different CNs prepared. A dropof a diluted aqueous CNs suspension (about 5 × 10⁻⁵ g mL−1) wasput on a freshly cleaved mica surface and air-dried. AFM imageswere obtained at 25 ◦C in a dynamic mode with a scan rate of1 Hz using Si tips with a curvature radius of less than 10 nm anda spring constant of 42 N m−1. The dimensions of the CNs weredetermined using VectorScan software (software for Shimadzu’sSPM-9600). To eliminate the effect of tip radius on width measure-ments, the heights of the CNs measured, which were not subject topeak broadening artefacts, were assumed to be cylindrical in shape(Beck-Candanedo et al., 2005). About a hundred CNs were ran-domly selected to determine the average length, width and aspectratio. For each individual cellulose nanocrystal, one measurementof length and two measurements of diameter were performed tocalculate the aspect ratio.
2.8. Thermogravimetric analysis (TGA)
Samples of CNs ranging from 5 to 7 mg previously dried in aforced air oven at 50 ◦C for 4 h were weighed on an aluminium pan.The thermogravimetric analysis was carried out on a ShimadzuDTG-60H Differential Thermal Gravimetric Analyser under nitro-gen atmosphere at a flow rate of 30 mL min−1 from 25 to 600 ◦C.The analysis was carried out at four different heating rates (5, 10,20 and 40 ◦C min−1). The results obtained were used to calculatethe kinetics parameters for thermal decomposition of the differentCNs prepared.
2.8.1. Theoretical approachThe rate of a reaction of thermal decomposition of a solid can be
described by Eq. (5).
d˛
dt= k (T) f (˛) (5)
where t is reaction time, k(T) is a constant depending on the tem-perature (T), and f(�) is a function describing how the rate constantof a reaction changes with the extent of reaction or conversion (�).Conversion � at a time t is defined by Eq. (6).
= w0 − wtw0 − wf
(6)
where w0 and wf are the initial sample weight and final sampleweight (mg), and wt (mg) is the weight at a time t.
The dependence of the reaction rate constant with temperaturecan generally be described by the Arrhenius equation. Thus, thereaction rate for the decomposition of a solid can be described asEq. (7).
d˛
dt= Ae
(EaRT
)f (˛) (7)
where A is the pre-exponential factor, Ea is the activation energy ofArrhenius, and R is the ideal gas constant.
The rate expression described by Eq. (7) can be converted intoa non-isothermal rate expression, Eq. (8), relating the reaction rateas a function of temperature at a constant heating rate (Ramajo-Escalera et al., 2006; Flynn, 1983).
d˛
dT= A
ˇe(EaRT
)f (˛) (8)
where is the heating rate.

M.A. Henrique et al. / Industrial Crops and Products 76 (2015) 128–140 131
Kraft p
f∫
ca
l
g
h
eoF(Fl
2
(mkei
l
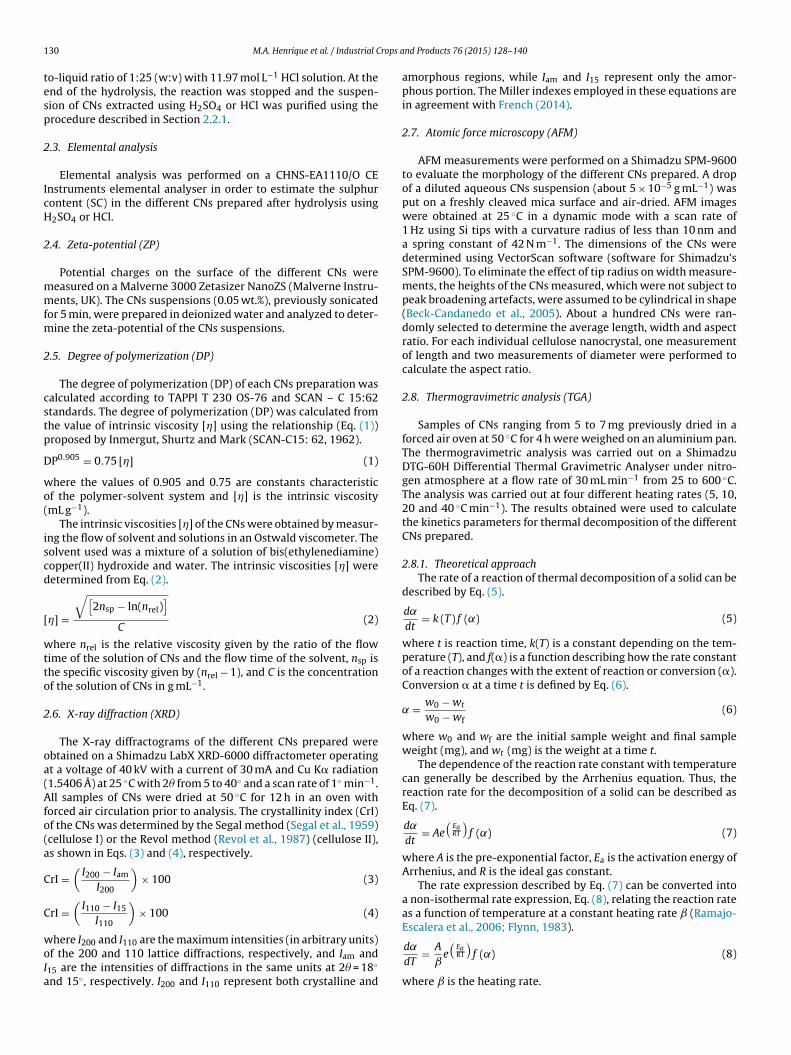
Fig. 1. CNs suspensions; (A) Cellophane – H2SO4; (B) Mango seed – H2SO4; (C)
Integrating Eq. (8) by separation of variables gives Eq. (9) asollows (Balogun et al., 2014; Flynn, 1983).
x
0
d˛
f (˛)= g (˛) = A
ˇ
∫ T
T0
exp(
− EaRT
)dT (9)
If T0 is below the temperature where the decomposition rateannot be measured, the lower boundary of the integral form dis-ppears.
If X =(− Ea
RT
), Eq. (9) can be rearranged to give Eq. (10), as fol-
ows.
(˛) =(
AEaˇR
){− expX
X+
∫ ∞
0
(expX
X
)dX
}=
(AEaˇR
)p(X)(10)
where p(X) is the temperature integral. This integral does notave an exact analytical solution (Balogun et al., 2014; Flynn, 1983).
Numerous kinetic methods have been derived from Eq. (8). Gen-rally, these can be classified into integral methods, such as thosef Ozawa (Ozawa, 1965) and Flynn and Wall (Flynn and Wall, 1966;lynn, 1983), and differential methods such as those of FriedmanFriedman, 1964) and Kissinger (Kissinger, 1957). The methods oflynn–Wall–Ozawa (FWO) and Kissinger were used for the calcu-ation of kinetic parameters in the present study.
.8.2. Method of Flynn–Wall–Ozawa (FWO)The FWO method is based on an integral isoconversional method
Flynn and Wall, 1966; Ozawa, 1965) and is one of the remarkableodel-free methods generally used for the determination of the
inetic parameters (Ozawa, 1965). The FWO method uses Doyle’s
mpirical approximation (Doyle, 1965) of the temperature integraln Eq. (10) as described by Eq. (11).og p (X) ∼= −2.315 + 0.4567X (11)
ulp – H2SO4; (D) Cellophane – HCl; (E) Mango seed – HCl; (F) Kraft pulp – HCl.
After applying the logarithm on Eq. (10) and then inserting intoEq. (11) gives the FWO expression shown in Eq. (12).
log = log(
AEg(˛)R
)− 2.315 − 0.4567
(EaRT
)(12)
Hence, the estimated activation energy of Arrhenius (Ea) can becalculated as described by Eq. (13).
Ea = −(
R
0.4567
)�logˇ
�(
1⁄T) (13)
where (K min−1) is the heating rate, Ea (kJ mol−1) is the esti-mated activation energy of Arrhenius, R is the ideal gas constant(8.314 J K−1 mol−1), and T (K) is the absolute temperature at conver-sion (�). A plot of log against 1/T for each conversion (�) shouldresult in a straight line. The least-squares method was adopted tofit each straight line and obtain the slope, �(log ˇ)/�(1/T).
2.8.3. Kinetic method of KissingerThe Kissinger method is based on a differential isoconversional
method and is also used to obtain kinetic parameters such as theactivation energy of Arrhenius, Ea, and the reaction order, n. Assum-ing f(�) = (1 − ˛)n, as described in Eq. (14).
d˛
dT=
(A
ˇ
)e(
− EaRT
)(1 − ˛)n (14)
where n is the reaction order.In the Kissinger method the activation energy is derived from
the temperature (Tm) at which the maximum reaction rate (DTGpeak) occurs and the reaction order from the shape of the weightloss-time curve (Kissinger, 1957; Jiang et al., 2010). The activationenergy, Ea, is determined by plotting ln (�/Tm
2) against 1/Tm, where

132 M.A. Henrique et al. / Industrial Crops and Products 76 (2015) 128–140
F Ns from KP using H2SO4 and HCl; (C) CNs from PMS using H2SO4 and HCl; (D) CNs fromC
to
n
wbd
S
wp
v
3
ttbahctsw(
Table 1Values of sulphur content (SC), zeta potential (ZP), degree of polymerization (DP)and crystallinity index (CrI) for the different samples of CNs extracted.
Sample/type of acid SC (%) DP ZP (mV) CrI (%)
CELL – – – 61CELL-HCl 0.93 72 −18.8 67CELL-H2SO4 3.49 78 −29.2 68PMS – – – 66PMS-HCl 0.93 138 −16.4 74PMS-H2SO4 3.37 78 −24.4 82KP – – – 82
ig. 2. X-ray diffractograms obtained for (A) raw cellulosic starting materials; (B) CELL using H2SO4 and HCl.
he slope, �[ln(�/Tm2)]/�(1/Tm), is equal to −Ea/R. The reaction
rder, n, is calculated using Eq. (15).
= 1.26S12 (15)
here S, the shape index, is defined by Eq. (16). The value of S cane determined from the time derivative of the DTG curve (seconderivative of the weight loss-time curve) (Eq. (16)).
= |
(d2˛dt2
)1(
d2˛dt2
)2
| (16)
here 1 and 2 refer to the values of the derivatives at the inflectionoints, i.e., where d3˛/dt3 = 0.
The pre-exponential factor, A, can be calculated by inserting thealues of n and Ea in Eq. (14) and solving it.
. Results and discussion
When hydrochloric acid was used to extract CNs, nanocrys-als with limited dispersion in water solution were obtained, sincehese particles tend to aggregate through extensive hydrogenonding (Filson et al., 2009). On the other hand, when sulphuriccid was used to extract CNs, reactions between the sulphate andydroxyl groups occur which allow the formation of negativelyharged sulphate esters. The presence of the negative charges on
he cellulose nanocrystals’ surfaces generates electrostatic repul-ion between nanoparticles that facilitates their dispersion inater, thus leading to the formation of stable aqueous dispersionsLima and Borsali, 2004; Beck-Candanedo et al., 2005; Peng et al.,
KP-HCl 0.98 102 −17.0 71KP-H2SO4 3.14 107 −30.3 79
2011). This behaviour results in interesting and important opticalproperties (de Mesquita, 2012). Fig. 1 shows the difference betweenthe suspensions obtained by acid hydrolysis using H2SO4 and HCl.Interestingly, immediately after the sonication process, all suspen-sions were found to be homogeneous and well dispersed. However,as time passed, depending on the presence or absence of surfacegroups in the nanocrystals’ surface, these aggregated together inthe case of nanocrystals extracted using HCl.
Table 1 shows the sulphur content, zeta potential, degree ofpolymerization and crystallinity index for the different samplesof CNs extracted using H2SO4 and HCl. As shown in Table 1 CNsextracted using H2SO4 presented a greater amount of sulphur intheir composition, which can be related to the presence of sulphate
groups on their surface. The presence of sulphate groups resulted ina negative net charge on the cellulose nanocrystals extracted withsulphuric acid, as evidenced by the zeta potential. These results
M.A. Henrique et al. / Industrial Crops and Products 76 (2015) 128–140 133
Fig. 3. AFM images of CNs extracted with HCl; (A) CELL; (B) PMS; (C) KP.
d with
cere
3
cu
mcfi2dc1
biuso
tuto
Fig. 4. AFM images of CNs extracte
onfirm the incorporation of sulphate groups on the CNs afterxtraction with H2SO4 and that the acid hydrolysis conditions usedesulted in homogeneous and stable aqueous suspensions due tolectrostatic repulsion.
.1. X-ray diffraction (XRD)
The X-ray diffraction patterns for the different samples andonditions of acid hydrolysis are shown in Fig. 2 as well as thenhydrolyzed starting materials.
In the XRD patterns it is possible to notice that the unhydrolyzedaterials have a predominance of crystalline domains typical of
ellulose I in the case of Kraft pulp and mango seeds, which is veri-ed by the presence of peaks at 2� = 15◦ (plane 1–1 0), 22.5◦ (plane
0 0) and 34◦ (plane 0 0 4), while cellophane exhibited crystallineomains typical of regenerated cellulose, or cellulose type II, whichan be seen by the peaks at 2� = 12◦ (plane 1–1 0) and 20◦ (plane
1 0) (French, 2014).XRD diffractograms of the nanocrystals extracted from KP using
oth acids and nanocrystals from PMS extracted with HCl exhib-ted profiles of cellulose I, while nanocrystals extracted from CELLsing both acids and nanocrystals extracted from PMS using H2SO4howed profiles of cellulose II. Table 1 shows the crystallinity indexf each sample calculated using Eqs. (3) and (4).
As can be seen in Table 1, a decrease was observed in the crys-
allinity index (CrI) of CNs obtained from KP in relation to thenhydrolyzed starting material. This behavior can be attributedo partial dissolution of the sample during the acid hydrolysisf cellulose (Jayme and Lang, 1963). All other CNs samples (PMSH2SO4; (A) CELL; (B) PMS; (C) KP.
and CELL) exhibited CrI values greater than those of the start-ing materials, which is attributed to the removal of amorphousregions from the cellulose (de Mesquita, 2012). Through diffrac-tograms it was observed that acid hydrolysis may induce CNs toeither retain the initial profile of the sample or transform intoanother cellulose polymorph. Whether a conversion occurs or notdepends on various conditions such as acid concentration, hydrol-ysis time, and the temperature ratio between the acid and thestarting material, among others (Sèbe et al., 2012). Cellulose II canbe obtained from cellulose I by treatment with aqueous sodiumhydroxide (mercerization) or by dissolution of cellulose and subse-quent precipitation/regeneration in different solvents (O’sullivan,1997), including concentrated sulphuric acid. The large differ-ence between cellulose I and II arises from the hydrogen bondingbetween the cellulose chains, where cellulose II has an antiparal-lel orientation between the chains due to changes in its hydrogenbond system. This has a direct influence on the structure of the crys-tal lattice in the cellulose, as demonstrated by X-ray diffraction (deSouza, 2009).
3.2. Atomic force microscopy (AFM)
Fig. 3 shows AFM images of the various sources of CNs extractedby acid hydrolysis using HCl. The AFM images showed that CNsextracted from KP and PMS appeared to be cylindrical in shape,
while the CNs extracted from CELL showed a spherical shape. Thevast majority of CNs extracted by acid hydrolysis result in crystalswith cylindrical shapes (Beck-Candanedo et al., 2005). However,the conditions under which high concentrations of acid were used
134 M.A. Henrique et al. / Industrial Crops and Products 76 (2015) 128–140
Fig. 5. TG curves for cellulose nanocrystals (CNs) extracted from different samples (CELL, PMS and KP) using H2SO4 and HCl.
Table 2Thermal decomposition temperatures, Ti , Tf , Tm, and Tonset for different CNs prepared using HCl and H2SO4 obtained at a heating rate of 10 ◦C min−1.
Type of CN Type of acid Ti (K) Tf (K) Tm (K) Tonset (K) Ti (◦C) Tf (◦C) Tm (◦C) Tonset (◦C)
PMS HCl 515.9 631.7 581.6 537.1 242.7 358.6 308.4 263.9H2SO4 479.3 527.4 560.4 504.3 206.2 254.3 287.2 231.2
PK HCl 558.4 639.3 602.8 566.8 285.3 366.2 329.6 293.6
irCaai5e
H2SO4 494.7 647.2 585.4
CELL HCl 519.8 649.1 596.9
H2SO4 473.5 544.8 492.8
n this hydrolysis combined with high temperature and time mayesult in CNs with a spherical shape (Wang and Sain, 2007). ThoseNs extracted from CELL using HCl resulted in crystals with an aver-ge length of 40.90 ± 11.63 nm, average diameter of 3.85 ± 1.23 nm
nd aspect ratio of 11.57 ± 4.87 nm. CNs extracted from PMS exhib-ted an average length of 153 ± 48.76 nm, an average diameter of.09 ± 3.09 nm and an average aspect ratio of 39.97 ± 26.50 nm. CNsxtracted from KP showed an average length of 155.91 ± 43.64 nm,535.0 221.5 374.1 312.2 261.9477.3 246.7 376.0 323.8 204.1490.9 200.3 271.7 219.6 217.8
an average diameter of 4.71 ± 1.50 nm and an average aspect ratioof 36.69 ± 16.02 nm.
Fig. 4 shows AFM images of the CNs obtained by hydrolysisusing H2SO4. The CNs extracted from CELL using H2SO4 showed
an average length of 123.89 ± 24.98 nm, an average diameter of4.61 ± 1.73 nm and an average aspect ratio of 31.25 ± 14.93 nm. CNsextracted from PMS showed an average length of 123 ± 22.14 nm,an average diameter of 4.59 ± 2.19 nm and an average aspect ratio
M.A
. H
enrique et
al. /
Industrial Crops
and Products
76 (2015)
128–140
135
Table 3Pre-exponential factor and activation energy for all the cellulose nanocrystals calculated by the FWO method.
CELL-HCl CELL-H2SO4 PMS-HCl PMS-H2SO4 KP-HCl KP-H2SO4
Conversion (˛) Ea (kJ mol−1) Conversion (˛) Ea (kJ mol−1) Conversion (˛) Ea (kJ mol−1) Conversion (˛) Ea (kJ mol−1) Conversion (˛) Ea (kJ mol−1) Conversion (˛) Ea (kJ mol−1)
0.18 178.03 0.18 55.44 0.18 301.94 0.18 186.47 0.17 187.85 0.2 156.340.2 180.89 0.2 57.43 0.2 306.73 0.2 192.05 0.19 176.32 0.22 152.580.22 187.21 0.22 59.30 0.22 307.02 0.22 251.67 0.21 165.98 0.24 154.940.24 198.01 0.24 60.55 0.24 308.01 0.24 258.24 0.23 157.89 0.26 155.740.26 205.28 0.26 60.87 0.26 308.81 0.26 343.11 0.25 151.13 0.28 158.520.28 216.90 0.28 61.81 0.28 311.43 0.28 395.62 0.27 147.11 0.3 162.730.3 227.55 0.3 61.98 0.3 311.87 0.3 410.50 0.29 142.35 0.32 166.110.32 243.55 0.32 62.99 0.32 312.51 0.32 410.55 0.31 139.22 0.34 170.530.34 244.57 0.34 63.63 0.34 313.30 0.34 417.25 0.33 136.70 0.36 171.100.36 298.78 0.36 65.61 0.36 313.95 0.36 423.51 0.35 135.66 0.38 174.080.38 352.33 0.38 67.85 0.38 314.63 0.38 425.70 0.37 133.63 0.4 175.100.4 382.83 0.4 72.01 0.4 315.30 0.4 433.71 0.39 131.63 0.42 177.950.42 379.93 0.42 78.41 0.42 317.02 0.42 443.60 0.41 131.01 0.44 179.610.44 373.15 0.44 93.32 0.44 317.39 0.44 453.46 0.43 130.10 0.46 182.840.46 375.75 0.46 111.44 0.46 318.63 0.46 460.29 0.45 128.47 0.48 184.300.48 373.34 0.48 145.92 0.48 319.24 0.48 484.68 0.47 127.33 0.5 188.870.5 366.64 0.5 192.30 0.5 320.79 0.5 511.61 0.49 126.62 0.52 191.720.52 379.59 0.52 260.12 0.52 324.95 0.52 524.41 0.51 125.32 0.54 192.570.54 376.71 0.54 333.31 0.54 582.20 0.53 125.88 0.56 194.150.56 396.69 0.56 339.03 0.56 778.84 0.55 124.92 0.58 209.900.58 411.74 0.58 350.97 0.57 124.18 0.6 220.140.6 428.12 0.59 125.47 0.62 239.61
0.61 125.37 0.64 269.850.63 127.690.65 128.62

136 M.A. Henrique et al. / Industrial Crops and Products 76 (2015) 128–140
Fig. 6. Plots of log versus 1000/T for different samples of CNs (CELL, PMS and KP) obtained using H2SO4 and HCl at different conversions (˛).
ola
straosf
botncdo2a(
f 34.07 ± 18.60 nm. CNs extracted from KP showed an averageength of 189.41 ± 57.74 nm, an average diameter of 5.46 ± 1.99 nmnd an average aspect ratio of 41.18 ± 22.49 nm.
The CNs that showed profiles typical of cellulose type II pre-ented an average length and width substantially smaller thanhose comprised of cellulose type I. This same behaviour waseported by Sèbe and collaborators (Sèbe et al., 2012). Addition-lly, as can be seen in Table 1, the CNs samples with the profilef cellulose I have higher DP values when compared with the CNsamples with the profile of cellulose II. This corroborates the resultsor the lengths of the CNs determined by AFM.
To determine the exact dimensions of CNs is a complicated taskecause of the specific limitations of the different analytical meth-ds adopted. In the case of AFM, tip/sample broadening representshe main limitation, resulting in an overestimation of celluloseanocrystal dimensions. Since the CNs are assumed to be cylindri-al in shape, the height of the CNs was taken to be equivalent to theiameter, to compensate for image widening due to the convolutionf the tip and the particle (Beck-Candanedo et al., 2005; Kvien et al.,
005; Flauzino Neto et al., 2013). However, tip-broadening effectslso cause errors in length measurements, but this is unavoidableBeck-Candanedo et al., 2005).3.3. Thermogravimetric analysis (TGA)
The thermal decomposition for all cellulose nanocrystals fol-lowed a similar behaviour observed for the thermal decompositionof celluloses reported in the literature (Poletto et al., 2011; Gurgelet al., 2012). TG curves for all cellulose nanocrystals obtained inthis study are shown in Fig. 5. It can be noticed that for all CNs, theprofiles of weight loss essentially exhibited three main decompo-sition events. The first main decomposition event, which occurredat temperatures below 100 ◦C, was related to the evaporation ofadsorbed and bound water and/or compounds of low molecu-lar weight adsorbed on the nanocrystals’ surface and represented∼10% of the total weight loss on average of the samples. For allcellulose nanocrystals, the initial weight loss was followed by aplateau that prolonged to the start of the second main decomposi-tion event. The second main decomposition event correspondedto cellulose degradation, which consisted of several concurrentprocesses such as depolymerization, dehydration and decompo-sition of glycosidic units (Roman and Winter, 2004). The third
main decomposition event was attributed to the oxidation andbreakdown of charred residues to form gaseous products of lowmolecular weight (Roman and Winter, 2004; Teixeira et al., 2010).
M.A. Henrique et al. / Industrial Crops and Products 76 (2015) 128–140 137
Fig. 7. Plots for activation energy (Ea) versus conversion rate (˛) for thermal decomposition of different CNs extracted using H2SO4 and HCl.
Table 4Pre-exponential factor (A), activation energy (Ea) and reaction order (n) calculated by the Kissinger method.
CELL-HCl CELL-H2SO4
(K min-1) S n Ea (kJ mol-1) ln A (K min-1) S n Ea (kJ mol-1) ln A
5 0.971 1.242 134.66 8.444 5 0.68 1.039 145.13 24.47610 0.667 1.029 10 0.329 0.72320 1.19 1.375 20 1.923 1.74740 0.774 1.109 40 1.263 1.416
PMS-HCl PMS-H2SO4
(K min-1) S n Ea (kJ mol-1) ln A ˇ(K min-1) S n Ea (kJ mol-1) ln A
5 0.974 1.243 202.42 19.363 5 1.208 1.385 275.8 53.10910 1.045 1.288 10 1.2 1.3820 0.882 1.184 20 1 1.2640 0.875 1.179 40 1.583 1.585
KP-HCl KP-H2SO4
(K min-1) S n Ea (kJ mol-1) ln A (K min-1) S n Ea (kJ mol-1) ln A
5 0.492 0.884 102.23 9.693 5 0.855 1.165 140.67 19.02
TbKuefg(s
10 0.511 0.901
20 0.519 0.908
40 0.681 1.04
he onset temperature, Tonset, which is related to the thermal sta-ility of a sample, was lower for cellulose nanocrystals (PMS andP) extracted using H2SO4 in comparison with those extractedsing HCl, with exception for cellulose nanocrystals from CELL thatxhibited the opposite behavior. A low thermal stability is expected
or cellulose nanocrystals containing sulphate groups, since theseroups may increase the rate of cellulose dehydration reactionsRoman and Winter, 2004). This occurs because the incorporation ofulphate groups onto the cellulose surface after acid hydrolysis has10 0.7 1.05420 1.506 1.54740 0.915 1.205
a catalytic effect on its thermal degradation. Another effect that hasbeen reported is the replacement of cellulose hydroxyl groups bysulphate groups, which leads to a decrease in the activation energy(Teixeira et al., 2010).
As can be seen from Table 2, the initial decomposition tempera-
ture, Ti, onset decomposition temperature, Tonset, and temperaturewhere the decomposition rate reaches its maximum, Tm, weresmaller for CNs prepared using H2SO4 than those prepared usingHCl. These results indicate that CNs prepared using H2SO4 are less
138 M.A. Henrique et al. / Industrial Crops and Products 76 (2015) 128–140
g the
rTaioJ
3
ddauf1aia(
mtd
dtae
Fig. 8. - Plots of ln (�/Tm2) against 1000/Tm usin
esistant to thermal degradation than those prepared using HCl.hese findings indicates that CNs prepared using HCl are moreppropriated to be used as reinforcement for polymers compos-tes since they resist to thermal decomposition until temperaturesf approximately 240 ◦C. Similar conclusions were also found by
eong and collaborators (Jeong et al., 2010).
.3.1. Kinetics resultsIn order to obtain the kinetics parameters for the thermal
ecomposition of cellulose nanocrystals, the conversion (�) wasetermined according to method described in the theoreticalpproach (Section 2.8.1). The FWO and Kissinger methods weresed to calculate the activation energy (Ea), the pre-exponential
actor (A) and reaction order (n). Fig. 6 shows plots of log versus000/T using FWO method for various values of conversion (�) forll CNs prepared. In all cases, the lines have become nearly parallel,ndicating approximate activation energies in different conversionsnd thus implying the possibility of a simple reaction mechanismYao et al., 2008).
The values of activation energy (Ea) calculated using FWOethod for all CNs prepared are shown in Table 3. Fig. 7 shows
he plots of the activation energy (Ea) against conversion (�) forifferent samples of CNs extracted using H2SO4 and HCl.
In order to discuss the values of Ea involved in the thermal
ecomposition of CNs extracted from different sources is necessaryo consider the type of cellulose polymorph, DP, CrI, and type of cat-lyst (H2SO4 or HCl) used to hydrolyse cellulose samples. The CNsxtracted from different sources showed different polymorphs ofKissinger method for all cellulose nanocrystals.
cellulose. CNs from KP extracted using both acids (H2SO4 and HCl)and PMS extracted using HCl showed profiles of cellulose I, whileCNs from PMS extracted using H2SO4 and CELL extracted using bothacids showed profiles of cellulose II. Morgado and Frollini (2011)studied the thermal decomposition kinetics of untreated linterscellulose (cellulose I) and mercerized linters cellulose (cellulose II).They observed that the value of Ea for thermal decomposition ofthe former was 158 kJ/mol, while Ea for the latter was 187 kJ/mol.This means that more energy is required in the thermal decompo-sition of cellulose II in comparison with cellulose I. This differencemay be related to the different orientation of cellulose chains andpattern of hydrogen bonding in cellulose I and II. While cellulose Ichains are orientated in parallel and the CH2OH groups of adja-cent chains have the same conformation, the cellulose II chains areorientated in antiparallel, with CH2OH groups occupying differ-ent positions. Because of these differences, the hydrogen bonds incellulose II are stronger than those in cellulose I, which result in ahigher thermal stability of cellulose II in comparison with celluloseI (Morgado and Frollini, 2011). However, it was verified that for CNssamples, the type of acid had a greater influence than type of cel-lulose polymorph on Ea for thermal decomposition. Those samplesextracted using H2SO4 showed lower initial Ea than those extractedusing HCl, since the introduction of sulphate groups decreased thethermal stability of CNs. It is well known that the mechanism of
cellulose decomposition firstly involves dehydration reactions toform anhydrocellulose through either inter- or intra-ring dehy-dration (Morgado and Frollini, 2011; Scheirs et al., 2001; Romanand Winter, 2004). The introduction of sulphate groups, which are
rops a
wptW
eavdtocdHoCthtvdvsotAhdsvDe
KpKdten(ppfoCtH
matd
chpe
4
udl
M.A. Henrique et al. / Industrial C
ell-known dehydration catalysts, facilitates the thermal decom-osition of CNs, justifying the initial lower Ea values observed forhe samples obtained using H2SO4 as the catalyst (Roman and
inter, 2004).Analyzing Ea values involved in the thermal decomposition of
ach CN produced from CELL, PMS, and KP using H2SO4 and HCls the catalysts, it is possible to note that for CNs from CELL thealues of DP and CrI are quite similar (Table 1). Therefore, the greatifference between Ea values for these CNs can be attributed tohe presence of sulphate groups, which catalyze the dehydrationf CNs lowering the value of Ea until conversions closer to 0.40. Inonversions higher than 0.40, these CNs seem to follow differentecomposition mechanisms as Ea value increases sharply for CELL-2SO4 in comparison with CELL-HCl. For CNs from PMS, the valuesf DP and CrI are different. PMS-HCl has higher DP and smallerrI than PMS-H2SO4. The values of Ea for PMS-H2SO4 are smallerhan PMS-HCl until conversions closer to 0.22. After conversionsigher than 0.25, the values of Ea for PMS-H2SO4 are always higherhan PMS-HCl. The influences of DP and CrI are not clear since Ea
alues involved in the thermal decomposition of these CNs are quiteifferent from values >0.25. For CNs from KP, KP-HCl has smalleralues of DP and CrI than KP-H2SO4. Apart from the influence ofulphur content for KP-H2SO4, which decreases the initial valuesf Ea, the smaller values of DP and CrI for KP-HCl seem to influencehe values of Ea, lowering them in conversions higher than 0.25.s the sulphur content, DP, CrI, and type of cellulose polymorphave influence on Ea values for thermal decomposition of CNs, it isifficult to correlate the values of Ea for different CNs from differentources. It is known that lower values of DP and CrI decrease thealue of Ea since a low CrI favors the dehydration reactions and a lowP favors the depolymerization reactions of cellulose (Bouchardt al., 1989; Bouchard et al., 1990; Gurgel et al., 2012).
Fig. 8 shows the plots of ln (ˇ/Tm2) against 1000/Tm using the
issinger method for all CNs prepared. The activation energy (Ea),re-exponential factor (A) and reaction order (n) obtained by theissinger method are shown in Table 4. Values of Ea for thermalecomposition were different for the different hydrolysis condi-ions. The Kissinger method adopts the value of average activationnergy, obtained from the slope in the straight line. This value can-ot necessarily represent the value of the global activation energyYao et al., 2008). As can be seen in Table 4, all values of Ea for CNsrepared using HCl as the catalyst were smaller than those for CNsrepared using H2SO4 as the catalyst. As the value of Ea obtained
rom Kissinger method is an average value of Ea, the abrupt increasef Ea value in conversions higher than 0.425, 0.475, and 0.50 forELL-H2SO4, PMS-H2SO4, and KP-H2SO4, respectively, contributeso increase the values of Ea for CNs obtained from samples using2SO4 as the catalyst.
The values of the reaction order (n) found by the Kissingerethod are shown in Table 4. For all samples the order of reaction
pproximately to the unit. It can be seen from these results thathe order of reaction decreased as the degree of polymerizationecreased, as reported by Calahorra (Calahorra et al., 1989).
Comparing the values of Ea obtained by the two methods, itan be seen that the Ea calculated by the FWO method is generallyigher than those calculated by the Kissinger method, which sim-ly gives the different parameters adopted by each method (Gurgelt al., 2012).
. Conclusions
Cellulose nanocrystals were obtained from different sources andnder different conditions of hydrolysis with success. By X-rayiffraction it was observed that the CNs showed different morpho-
ogical characteristics. The presence of both cellulose type I and
nd Products 76 (2015) 128–140 139
cellulose type II was noted. The CNs showed crystallinity index val-ues ranging from 67 to 82%. The CNs had mostly cylindrical shape,with the exception of CNs extracted from cellophane using HCl thatshowed a circular shape as evidenced by AFM images. The CNs hadan average length (L) ranging from 40.90 to 189.41 nm, averagediameter (D) ranging from 3.85 to 5.46 nm and average aspect ratio(L/D) from 11.57 to 41.18 nm. CNs composed of cellulose II hadlower DP values than CNs composed of cellulose I. Thermogravi-metric analysis was used to investigate the thermal decompositionof all samples of CNs obtained. The CNs extracted using H2SO4 wereless thermally stable than those extracted using HCl. The FWO andKissinger methods were used to determine the kinetic parame-ters such as activation energy, pre-exponential factor and reactionorder. The activation energy (Ea) calculated by the FWO method wasgenerally higher than that calculated by the Kissinger method. TheEa of cellulose II CNs increased with increasing conversion (˛), whilein the case of cellulose I CNs the Ea remained constant or decreasedslightly with ˛. The type of polymorph of cellulose and the acidemployed in the CN extraction affected the thermal degradationkinetics of the CNs.
Acknowledgements
Authors thank CAPES, CNPq and FAPEMIG for financial support.
References
Balogun, A.O., Lasode, O.A., McDonald, A.G., 2014. Devolatilization kinetics andpyrolytic analyses of Tectona grandis (teak). Bioresour. Technol. 156, 57–62.
Beck-Candanedo, S., Roman, M., Gray, D.G., 2005. Effect of reaction conditions onthe properties and behavior of wood cellulose nanocrystal suspensions.Biomacromolecules 6, 1048–1054.
Bouchard, J., Abatzoglou, N., Chornet, E., Overend, R.P., 1989. Characterization ofdepolymerized cellulosic residues.1. residues obtained by acid-hydrolysisprocesses. Wood Sci. Technol. 23, 343–355.
Bouchard, J., Garnier, G., Vidal, P., Chornet, E., Overend, R.P., 1990. Characterizationof depolymerized cellulosic residues. 2. residues derived from ethylene-glycolsolvolysis of cellulose. Wood Sci. Technol. 24, 159–169.
Calahorra, M.E., Cortázar, M., Eguiazábal, J.I., Guzmán, G.M., 1989.Thermogravimetric analysis of cellulose: effect of the molecular weight onthermal decomposition. J. Appl. Polym. Sci. 37, 3305–3314.
de Mesquita, J.P., 2012. Nanocristais de celulose para preparac ão debionanocompósitos com quitosana e carbonos nanoestruturados paraaplicac ões tecnológicas e ambientais. In: Ph.D. Thesis. Universidade Federal deMinas Gerais.
de Rodriguez, N.L.G., Thielemans, W., Dufresne, A., 2006. Sisal cellulose whiskersreinforced polyvinyl acetate nanocomposites. Cellulose 13, 261–270.
de Souza, E.E., 2009. Síntese e caracterizac ão de membranas de celulose regeneradaa partir da celulose extraída do bagac o de cana-de-ac úcar para produc ão decuprofane. In: M.S. Dissertation. Universidade Federal de Uberlândia.
Doyle, C.D., 1965. Series approximations to the equations of the thermogravimetricdata. Nature 207, 290–291.
Eichhorn, S.J., Dufresne, A., Aranguren, M., Marcovich, N.E., Capadona, J.R., Rowan,S.J., Weder, C., Thielemans, W., Roman, M., Renneckar, S., Gindl, W., Veigel, S.,Keckes, J., Yano, H., Abe, K., Nogi, M., Nakagaito, A., Mangala, A., Simonsen, J.,Benigth, A.S., Bismark, A., Berglund, L.A., Peijs, T., 2010. Review: currentinternational research into cellulose nanofibres and nanocomposites. J. Mater.Sci. 45, 1–33.
Filson, P.B., Dawson-Andoh, B.E., 2009. Sono-chemical preparation of cellulosenanocrystals from lignocellulose derived materials. Bioresour. Technol. 100,2259–2264.
Filson, P.B., Dawson-Andoh, B.E., Schwegler-Berry, D., 2009. Enzymatic-mediatedproduction of cellulose nanocrystals from recycled pulp. Green Chem. 11,1808–1814.
Flauzino Neto, W.P., Silvério, H.A., Dantas, N.O., Pasquini, D., 2013. Extraction andcharacterization of cellulose nanocrystals from agro-industrial residue – Soyhulls. Ind. Crops Prod. 42, 480–488.
Flynn, J.H., Wall, L.A., 1966. A quick, direct method for the determination ofactivation energy from thermogravimetric data. J. Polym. Sci. Polym. Lett. 4,323–328.
Flynn, J.H., 1983. The isoconversional method for determination of energy ofactivation at constant heating rates. J. Therm. Anal. 27, 95–102.
French, A.D., 2014. Idealized powder diffraction patterns for cellulose polymorphs.Cellulose 21, 885–896.
Friedman, H.L.J., 1964. Kinetics of thermal degradation of char-forming plasticsfrom thermogravimetry. Application to phenolic plastic. Polym. Sci. Polym.Sym. 6PC, 183–195.

1 rops a
G
H
J
J
J
K
K
L
L
L
L
M
M
M
O
O
P
reinforcing capability on synthetic polymers. Compos. Sci. Technol. 67,2521–2527.
Yao, F., Wu, Q. Lei, Y. Weihong, G. Xu, 2008. Thermal decomposition kinetics of
40 M.A. Henrique et al. / Industrial C
urgel, L.V.A., Marabezi, K., Ramos, L.A., Curvelo, A.A.S., 2012. Characterization ofdepolymerized residues from extremely low acid hydrolysis (ELA) ofsugarcane bagasse cellulose: Effects of degree of polymerization, crystallinityand crystallite size on thermal decomposition. Ind. Crops Prod. 36, 560–571.
abibi, Y., Lucia, L.A., Rojas, O.J., 2010. Cellulose nanocrystals: chemistry,self-assembly, and applications. Chem. Rev. 110, 3479–3500.
ayme, G., Lang, F., 1963. Cellulose solvents. In: Whistler, R.L. (Ed.), Methods inCarbohydrate Chemistry. Academic Press, New York, pp. 75–83.
eong, H.D., Yoon, C.R., Lee, J.H., Band, D.S., 2010. Preparation and characterizationof cellulose nano-whiskers extracted from microcrystalline cellulose by acidhydrolysis. Elastom. Compos. 45, 51–57.
iang, G., Nowakowski, D.J., Bridgwater, A.V., 2010. A systematic study of thekinetics of lignin pyrolysis. Thermochim. Acta 498, 61–66.
issinger, H.E., 1957. Reaction kinetics in differential thermal analysis. Anal. Chem.29, 1702–1706.
vien, I., Tanem, B.S., Oksman, K., 2005. Characterization of cellulose whiskers andtheir nanocomposites by atomic force and electron microscopy.Biomacromolecules 6, 3160–3165.
ahiji, R.R., Xu, X., Reifenberger, R., Raman, A., Rudie, A., Moon, R.J., 2010. Atomicforce microscopy characterization of cellulose nanocrystals. Langmuir 26,4480–4488.
i, R., Fei, J., Cai, Y., Li, Y., Feng, J., Yao, J., 2009. Cellulose whiskers extracted frommulberry: a novel biomass production. Carbohydr. Polym. 76, 94–99.
ima, M.M.S., Borsali, R., 2004. Rodlike cellulose microcrystals: structure,properties, and applications. Macromol. Rapid Commun. 25, 771–787.
iu, H., Liu, D., Yao, F., Wu, Q., 2010. Fabrication and properties of transparentpolymethylmethacrylate/cellulose nanocrystals composites. Bioresour.Technol. 101, 5685–5692.
artínez-Sanz, M., Lopez-Rubio, A., Lagaron, J.M., 2011. Optimization of thenanofabrication by acid hydrolysis of bacterial cellulose nanowhiskers.Carbohydr. Polym. 85, 228–236.
oon, R.J., Martini, A., Nairn, J., Simonsen, J., Youngblood, J., 2011. Cellulosenanomaterials review: structure, properties and nanocomposites. Chem. Soc.Ver. 40, 3941–3994.
orgado, D.L., Frollini, E., 2011. Thermal decomposition of mercerized lintercellulose and its acetates obtained from a homogeneous reaction. Polímeros21, 111–117.
’sullivan, A.C., 1997. Cellulose: the structure slowly unravels. Cellulose 4,173–207.
zawa, T., 1965. A new method of analyzing thermogravimetric data. Bull. Chem.Soc. Jpn. 38, 1881–1886.
eng, B.L., Dhar, N., Liu, H.L., Tam, K.C., 2011. Chemistry and applications ofnanocrystalline cellulose and its derivatives: a nanotechnology perspective.Can. J. Chem. Eng. 9999, 1–16.
nd Products 76 (2015) 128–140
Poletto, M., Pistor, V., Zeni, M., Zaterra, A.J., 2011. Crystalline properties anddecompositions kinetcs of cellulose fibers in wood pulp obtained by twopulping processes. Polym. Degrad. Stab. 96, 679–685.
Ramajo-Escalera, B., Espina, A., García, J.R., Sosa-Arnao, J.H., Nebra, A.S., 2006.Model-free kinetics applied to sugarcane bagasse combustion. Thermochim.Acta 448, 111–116.
Revol, J.F., Dietrich, A., Goring, D.A.J., 1987. Effect of mercerization on the crystallitesize and cristallinity index in cellulose from different sources. Can. J. Chem. 65,1724–1725.
Roman, M., Winter, W.T., 2004. Effect of Sulfate groups from sulfuric acidhydrolysis on the thermal degradation behavior of bacterial cellulose.Biomacromolecules 5, 1671–1677.
Samir, M.A.S.A., Alloin, F., Dufresne, A., 2005. Review of recent research intocellulosic whiskers, their properties and their application in nanocompositefield. Biomacromolecules 6, 612–626.
Scheirs, J., Camino, G., Tumiatti, W., 2001. Overview of water evolution during thethermal degradation of cellulose. Eur. Polym. J. 37, 933–942.
Sèbe, G., Ham-Pichavant, F., Ibarboure, E., Koffi, A.L.C., Tingaut, P., 2012.Supramolecular structure characterization of cellulose II nanowhiskersproduced by acid hydrolysis of cellulose I substrates. Biomacromolecules 13,570–578.
Segal, L., Creely, J.J., Martin Junior, A.E., Conrad, C.M., 1959. An empirical methodfor estimating the degree of crystallinity of native cellulose using the X-raydiffractometer. Text. Res. J. 29, 786–794.
Silva, D.J., D’Almeida, M.L.O., 2009. Nanocristais de celulose: cellulose whiskers. OPapel 70, 34–52.
Siqueira, G., Bras, J., Dufresne, A., 2010. Cellulosic bionanocomposites: a review ofpreparation, properties and applications. Polymers 2,728–765.
Teixeira, E.M., Bondancia, T.J., Teodoro, K.B.R., Corrêa, A.C., Marconcini, J.M.,Mattoso, L.H.C., 2011. Sugarcane bagasse whiskers: extraction andcharacterizations. Ind. Crops Prod. 33, 63–66.
Teixeira, E.M., Oliveira, C.R., Mattoso, L.H.C., Corrêa, A.C., Paladin, P.D., 2010.Nanofibras de algodêo obtidas sob diferentes condiãc es de hidrõlise ócida.Polámeros 20, 264–268.
Wang, B., Sain, M., 2007. Isolation of nanofibers from soybean source and their
natural fibers: activation energy with dynamic thermogravimetric analysis.Polym. Degrad. Stab. 93, 90–98.