Embed Size (px)
Citation preview
Industrial MeteringEnergy Concepts and Best
PracticesOr…
Who left the air compressors running all weekend? And…
Why were the air compressors running all weekend?
PresentersThomas ‘Tex’ ReitterProject Manager-Industrial ProgramsFocus on [email protected]
Tim Dantoin, Energy Advisor-Industrial ProgramsFocus on [email protected]

Webinar Logistics
• Interactive – type questions into the chat box at any time. Send to the whole group. If you need to send to an individual presenter, please send to the one not speaking at the moment to get your question answered as quickly as possible
• Make sure any pop-up blockers and screen savers are disabled
• Resources will be provided at presentation end for your reference
Agenda
• Major Concept Areas– Why Meter?– How To Meter?– What Can Metering Show You?
• Metering Basics• Ways To ‘Sell’ Your Metering Project• Tips To Get Started
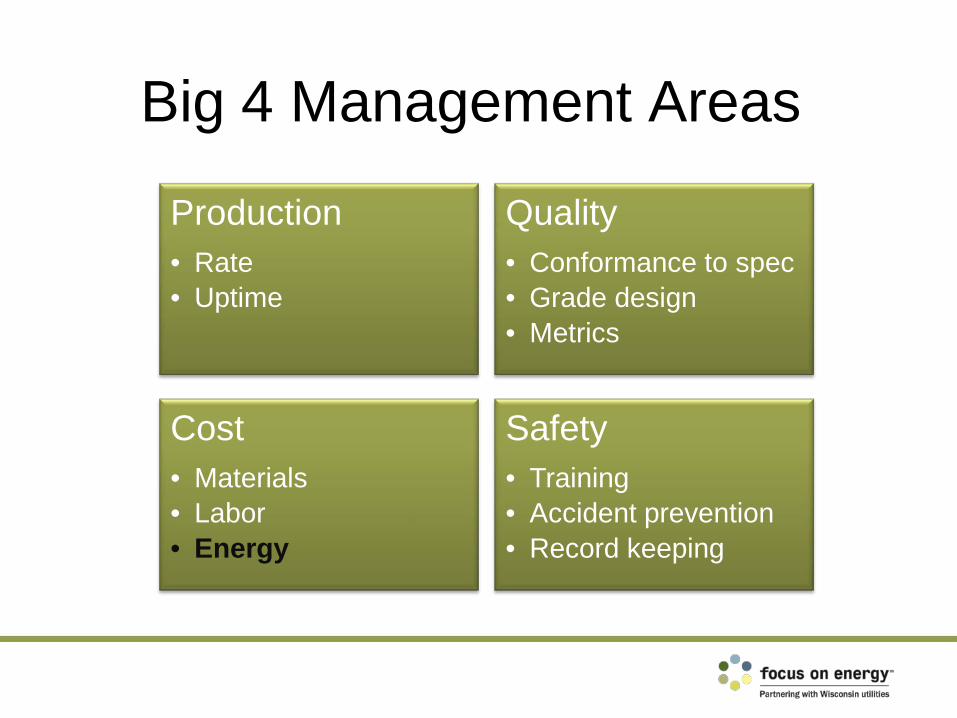
Big 4 Management Areas
Production• Rate• Uptime
Quality• Conformance to spec• Grade design• Metrics
Safety• Training• Accident prevention• Record keeping
Cost• Materials• Labor• Energy
Why Meter?• Improve demand side management
o Understand costso Reduce costso Better usage patterns
Avoid peak charges Turn off equipment when not needed
• Develop answers to these questions…o What is important to monitor?o What drives energy use?o What drives action?
How To Meter?
• Importance of metering project planning
• Simple systems• Metering project components
Metering Project Planning Importance
• Demonstrate need to be a top priority in funding race
• Choose carefully when cost is object• Paybacks – can be difficult to calculate
Good Metering Project Plan Elements
• Well-developed financial/technical arguments
• Build off existing data• Show ‘big hitters’ • Integrate with existing infrastructure• Small, focused implementation team
Simple Systems
• Slice/dice your utility billsoRead meters by
shiftoRelate data to your
operationso Legwork/brainwork
Consider these low cost ideas to start…
• See what your utility offerso Frequent updatesoWeb deliveryo Analysis toolsoCheap or free
Metering Project Components
• Energy sensor• Transmitter• Data transfer medium• Display
oDatabaseo Analysis tools
Energy Sensors
• Electrical• Natural gas• Steam• Virtual
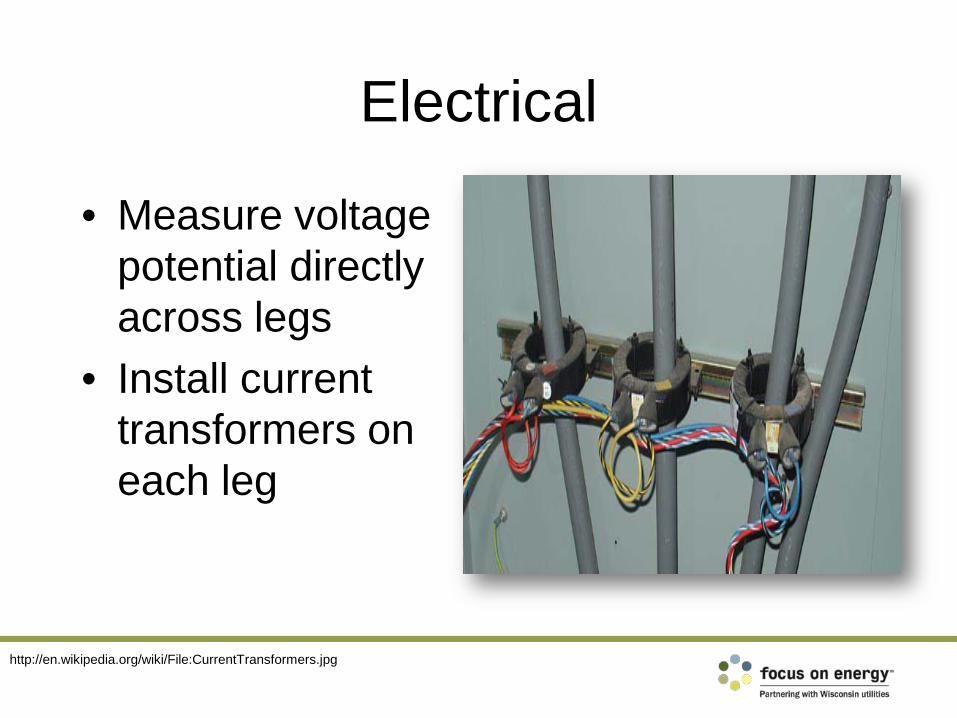
Electrical
• Measure voltage potential directly across legs
• Install current transformers on each leg
http://en.wikipedia.org/wiki/File:CurrentTransformers.jpg
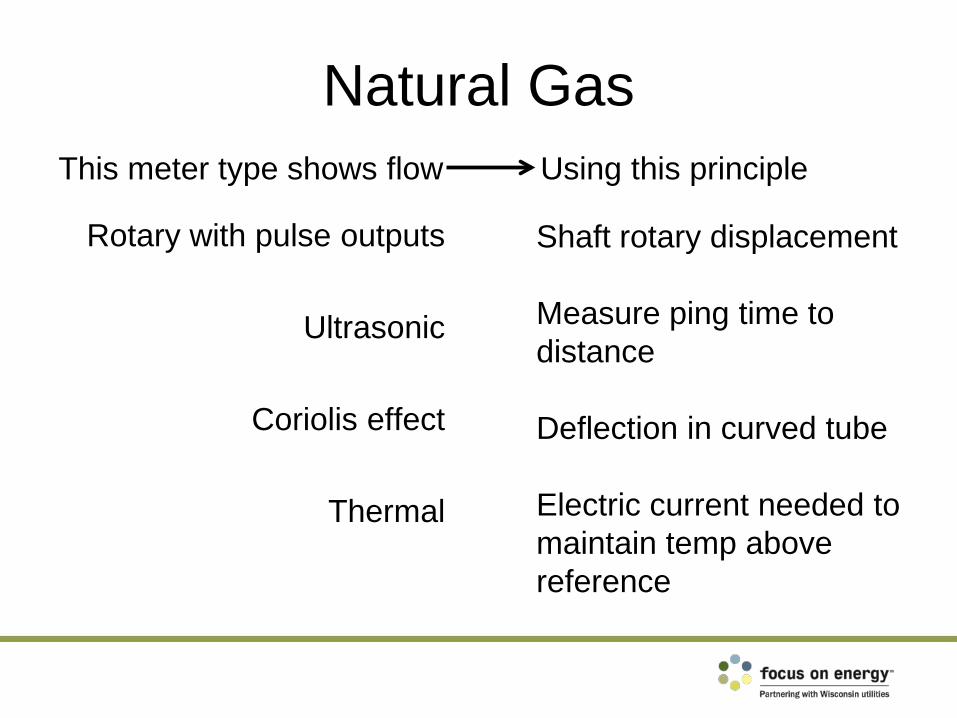
Natural Gas
Rotary with pulse outputs
Ultrasonic
Coriolis effect
Thermal
Shaft rotary displacement
Measure ping time to distance
Deflection in curved tube
Electric current needed to maintain temp above reference
This meter type shows flow Using this principle
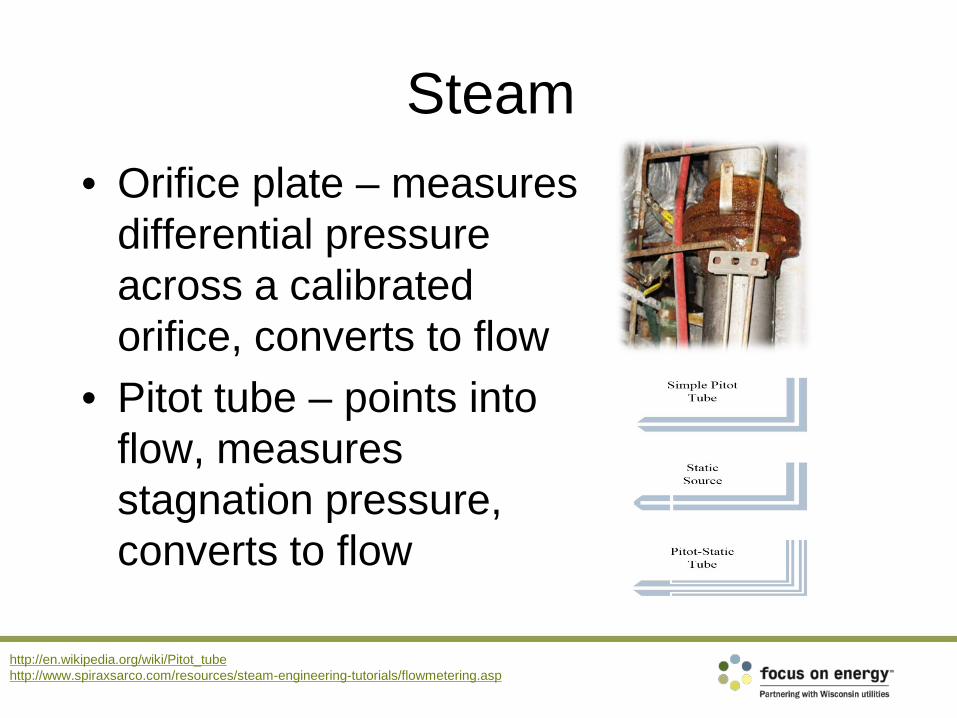
Steam• Orifice plate – measures
differential pressure across a calibrated orifice, converts to flow
• Pitot tube – points into flow, measures stagnation pressure, converts to flow
http://en.wikipedia.org/wiki/Pitot_tubehttp://www.spiraxsarco.com/resources/steam-engineering-tutorials/flowmetering.asp
Virtual Meters
• Use existing sensors, formulas to calculate energy flows
• Q=MC∆T – Find heat flow from mass flow/temperature (frequently measured in processes)
• Others – conduction, radiation, free, forced convection
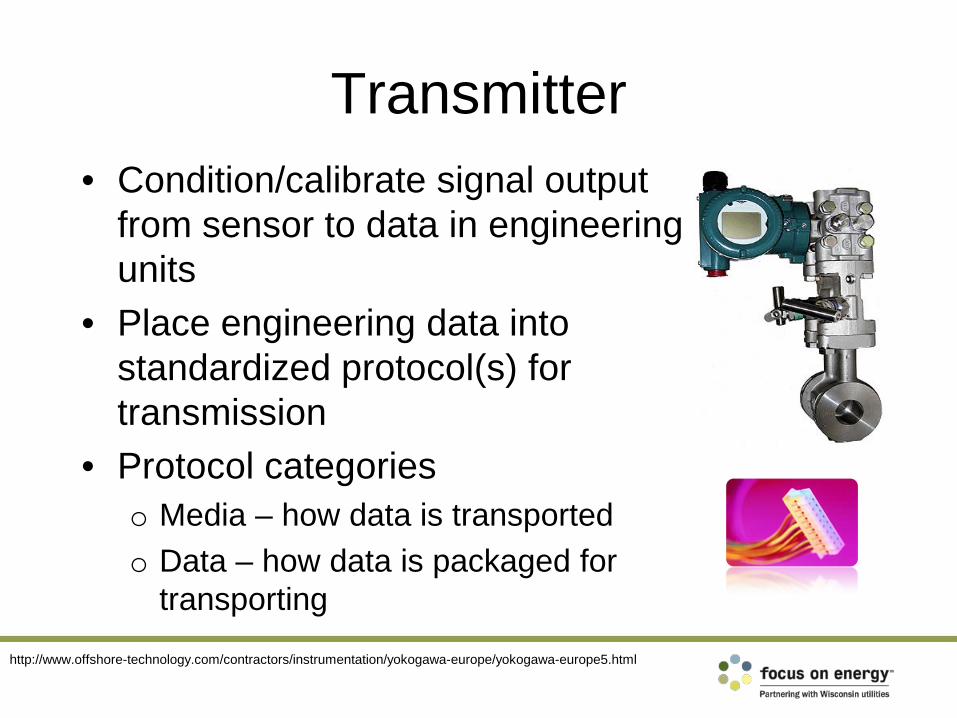
Transmitter• Condition/calibrate signal output
from sensor to data in engineering units
• Place engineering data into standardized protocol(s) for transmission
• Protocol categorieso Media – how data is transportedo Data – how data is packaged for
transporting
http://www.offshore-technology.com/contractors/instrumentation/yokogawa-europe/yokogawa-europe5.html
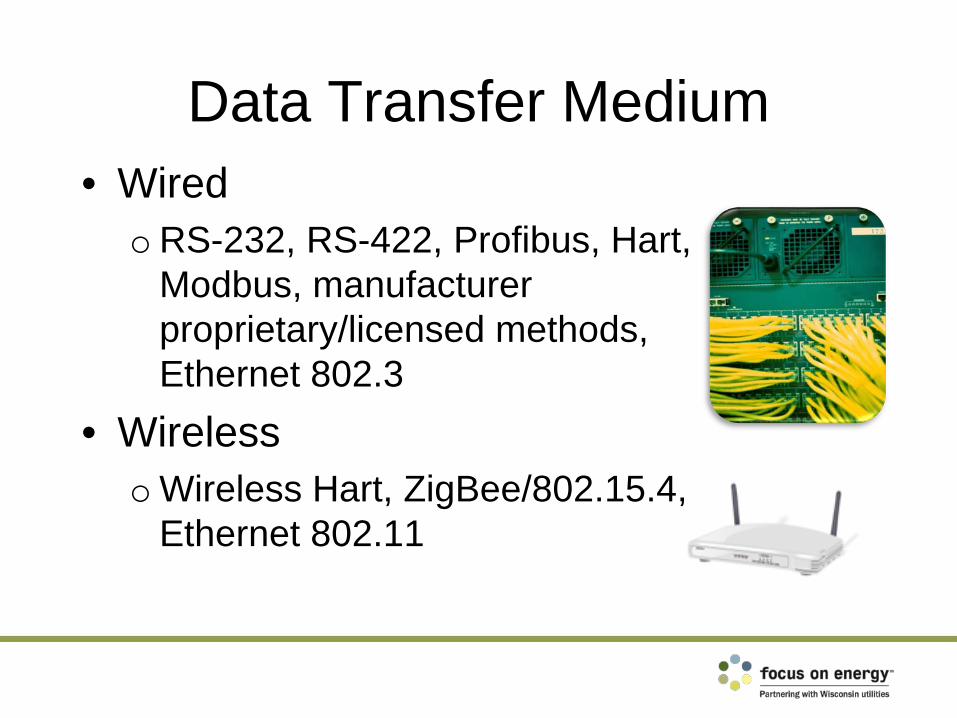
Data Transfer Medium• Wired
oRS-232, RS-422, Profibus, Hart, Modbus, manufacturer proprietary/licensed methods, Ethernet 802.3
• WirelessoWireless Hart, ZigBee/802.15.4,
Ethernet 802.11
Display
• Energy databaseoDedicated designs for just energyo Build on existing plant, enterprise systems
• Analysis/reporting toolso Trends, statistical analyses, data exportsoReporting
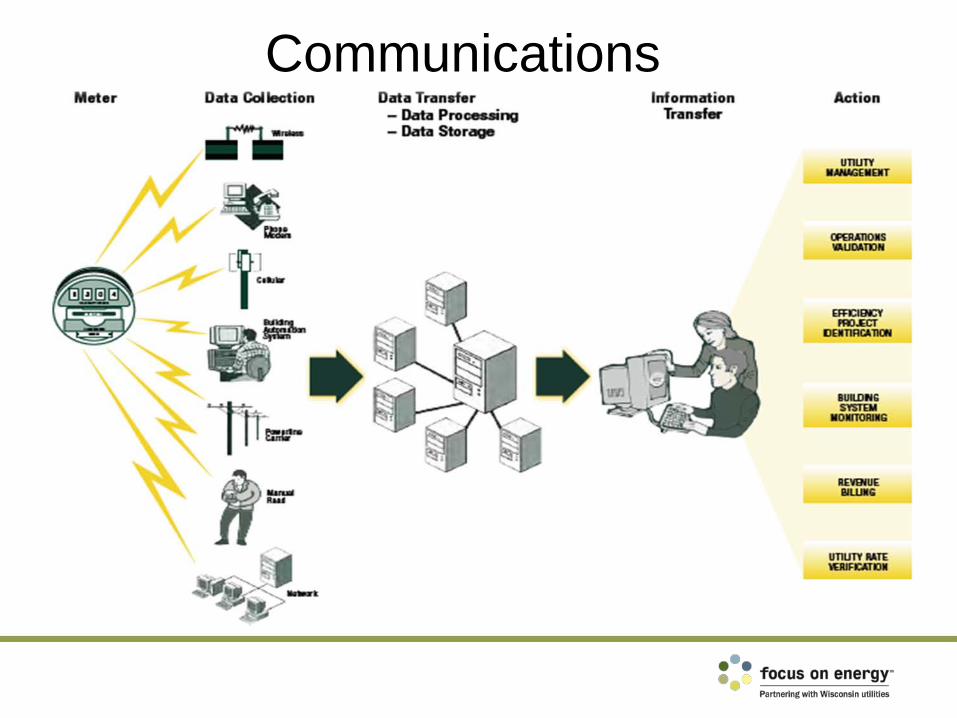
Communications
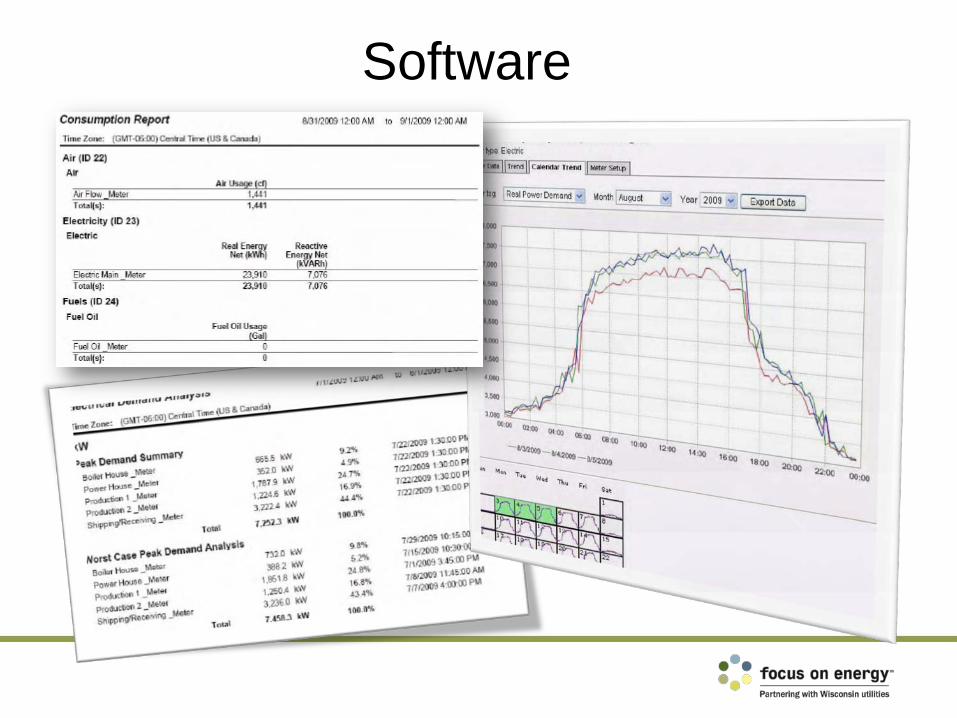
Software
What Can Metering Show You?
• Practical energy management example• Troubleshoot, optimize processes• Verification on energy projects• Department cost allocations• Weekend downtime, base load
evaluation
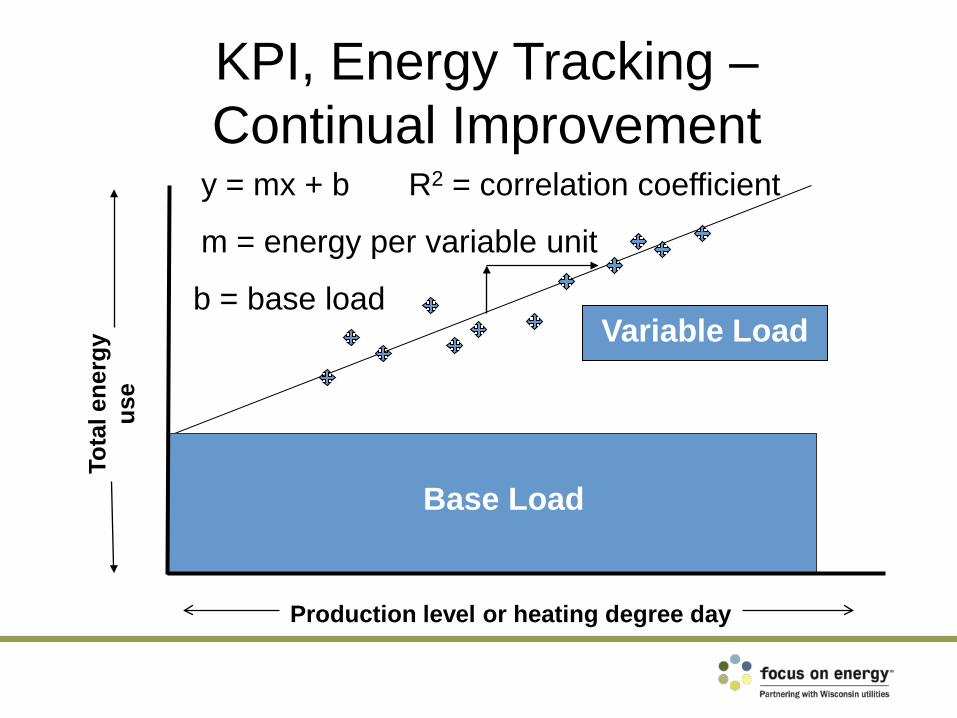
KPI, Energy Tracking –Continual Improvement
Base Load
Variable Load
Production level or heating degree day
Tota
l ene
rgy
use
y = mx + b
m = energy per variable unit
b = base load
R2 = correlation coefficient
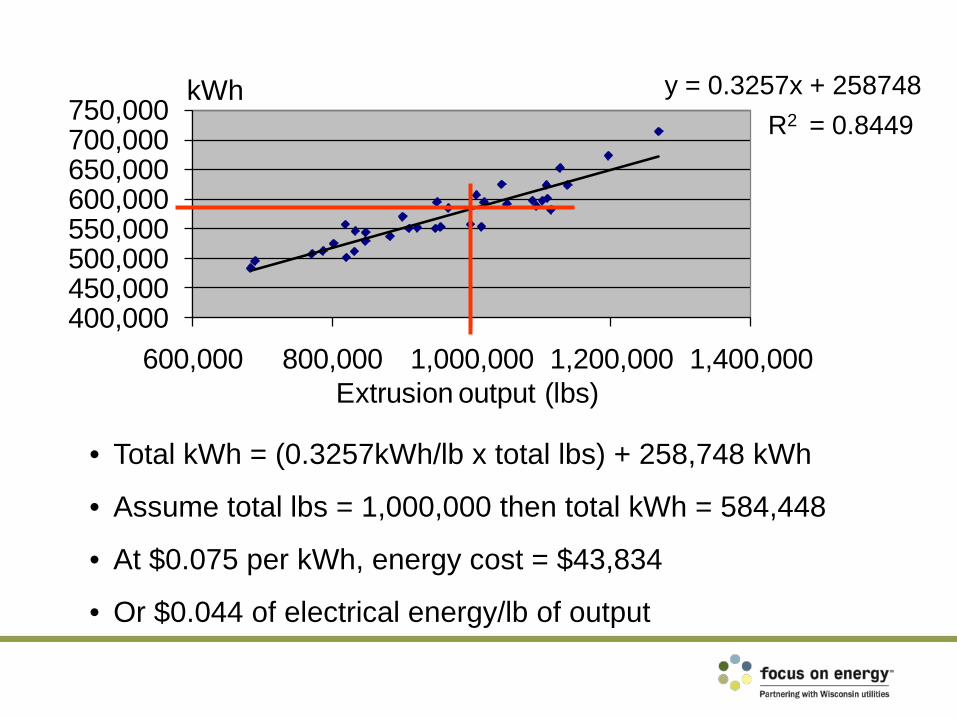
• Total kWh = (0.3257kWh/lb x total lbs) + 258,748 kWh
• Assume total lbs = 1,000,000 then total kWh = 584,448
• At $0.075 per kWh, energy cost = $43,834
• Or $0.044 of electrical energy/lb of output
y = 0.3257x + 258748R2 = 0.8449
400,000450,000500,000550,000600,000650,000700,000750,000
600,000 800,000 1,000,000 1,200,000 1,400,000
kWh
Extrusion output (lbs)
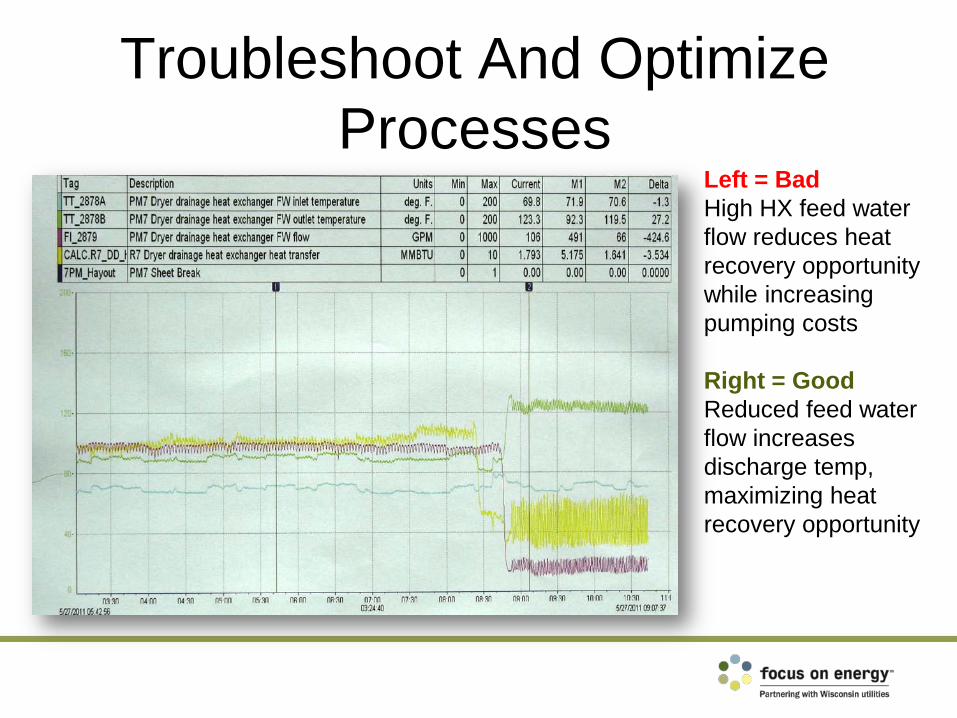
Troubleshoot And Optimize Processes
Left = BadHigh HX feed water flow reduces heat recovery opportunity while increasing pumping costs
Right = GoodReduced feed water flow increases discharge temp, maximizing heat recovery opportunity
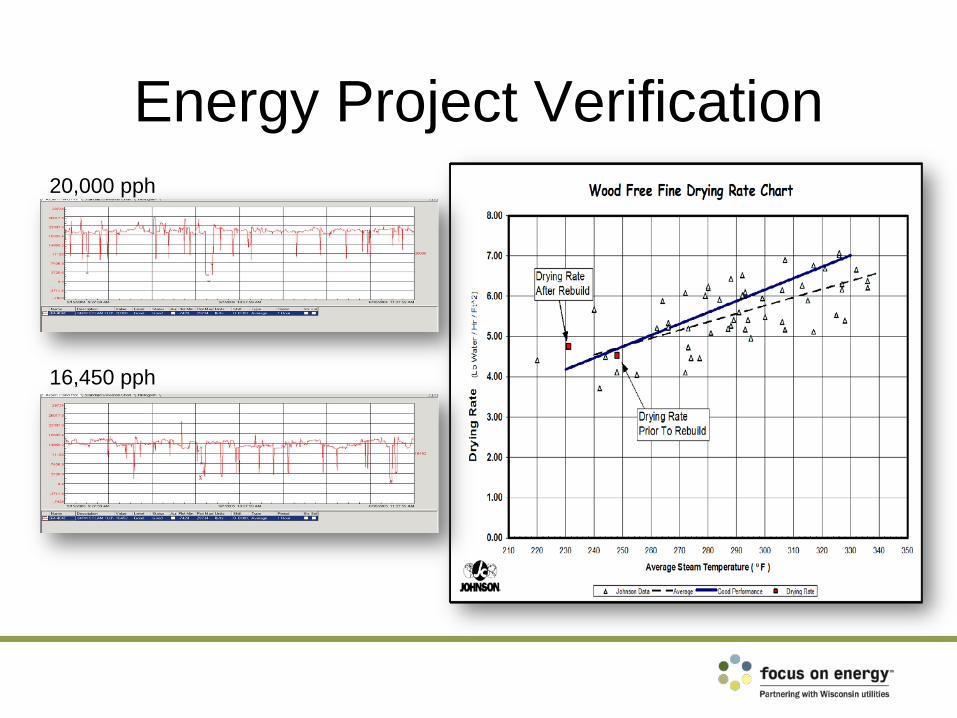
Energy Project Verification20,000 pph
16,450 pph
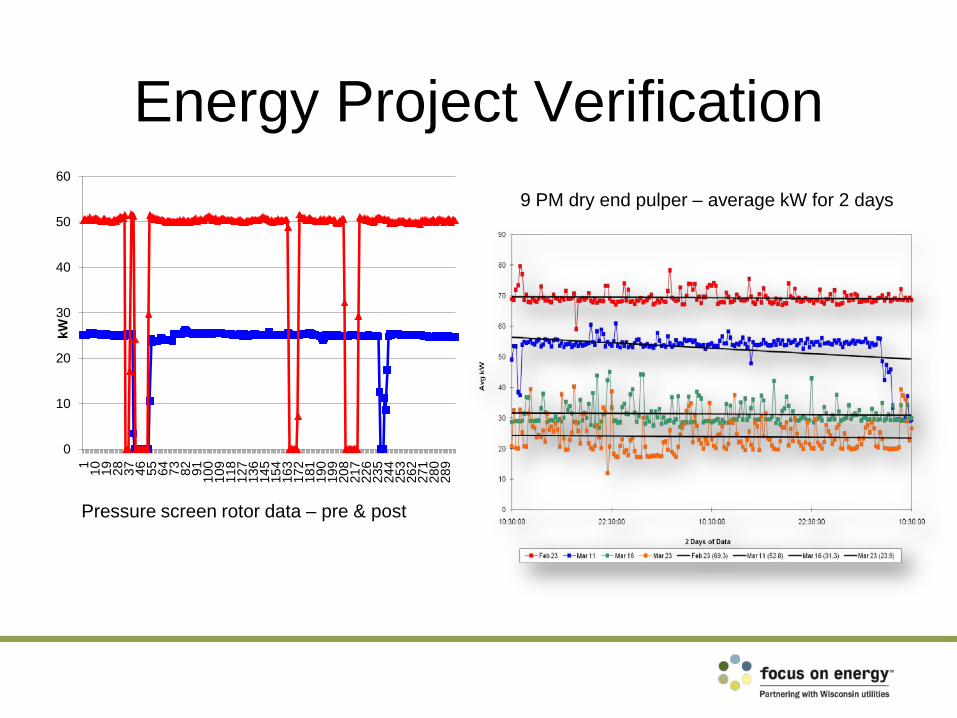
Energy Project Verification
0
10
20
30
40
50
60
1 10 19 28 37 46 55 64 73 82 91 100
109
118
127
136
145
154
163
172
181
190
199
208
217
226
235
244
253
262
271
280
289
kW
Pressure screen rotor data – pre & post
9 PM dry end pulper – average kW for 2 days
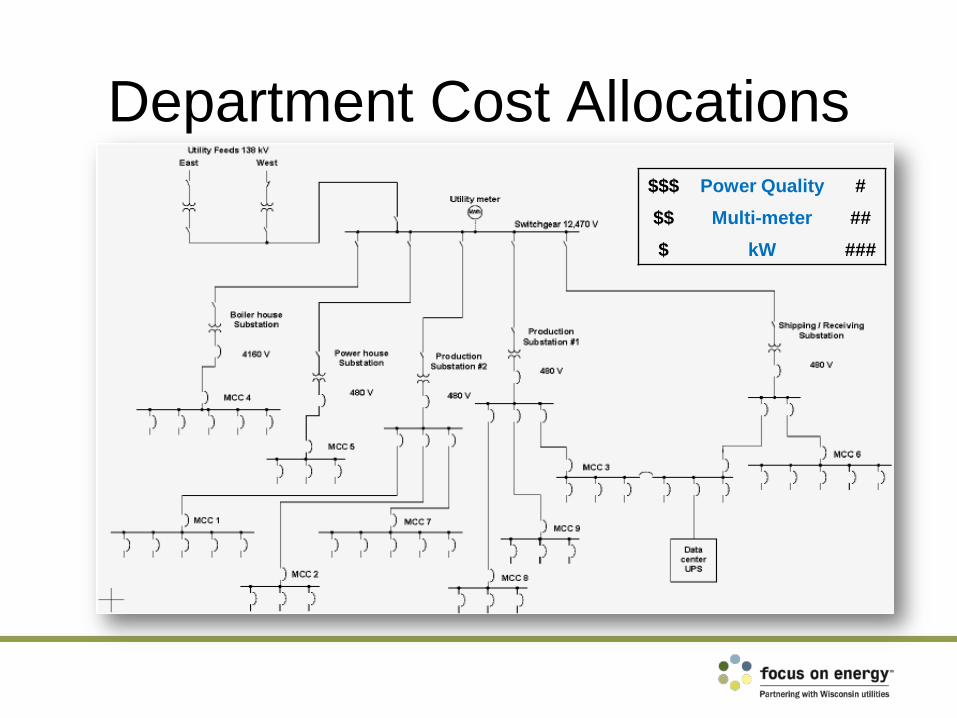
Department Cost Allocations$$$ Power Quality #$$ Multi-meter ##$ kW ###
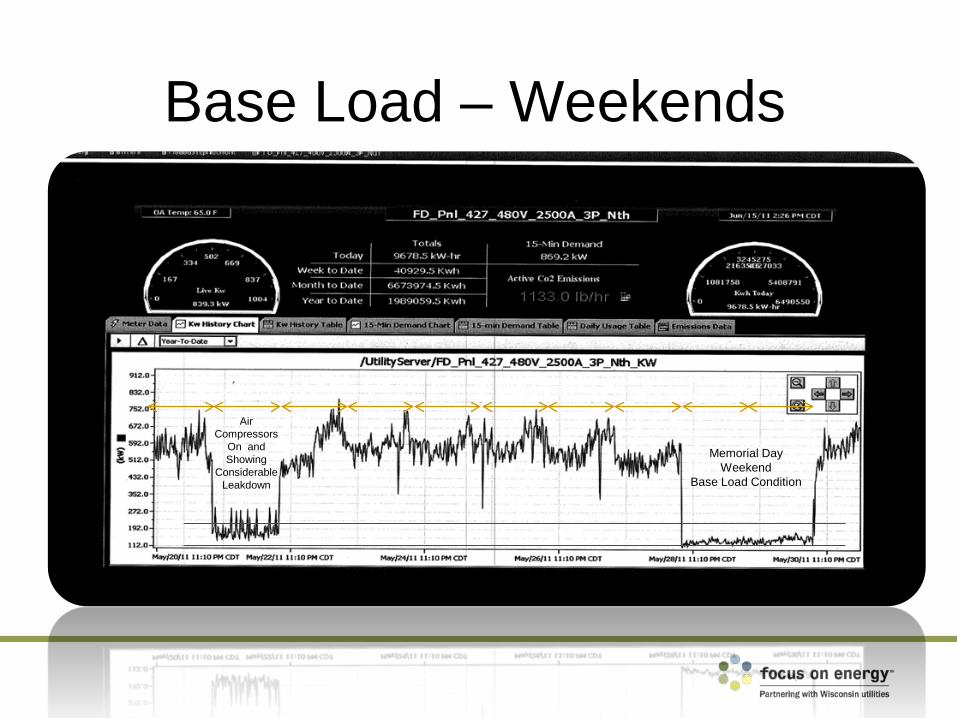
Base Load – Weekends
Memorial Day Weekend
Base Load Condition
Air Compressors
On and Showing
Considerable Leakdown
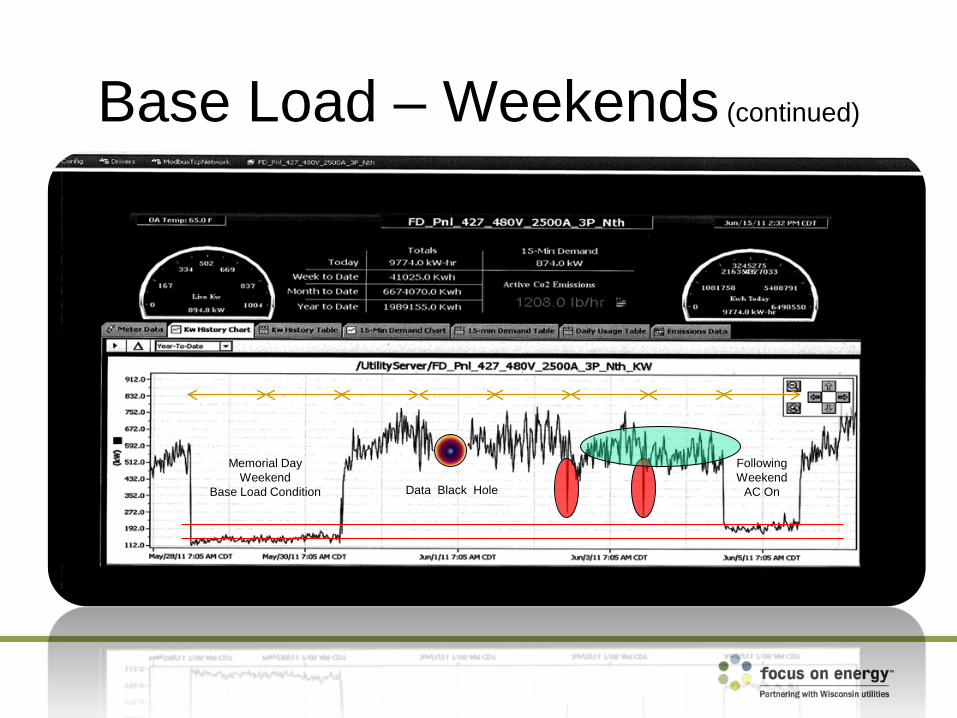
Base Load – Weekends (continued)
Memorial Day Weekend
Base Load Condition Data Black Hole
Following Weekend
AC On
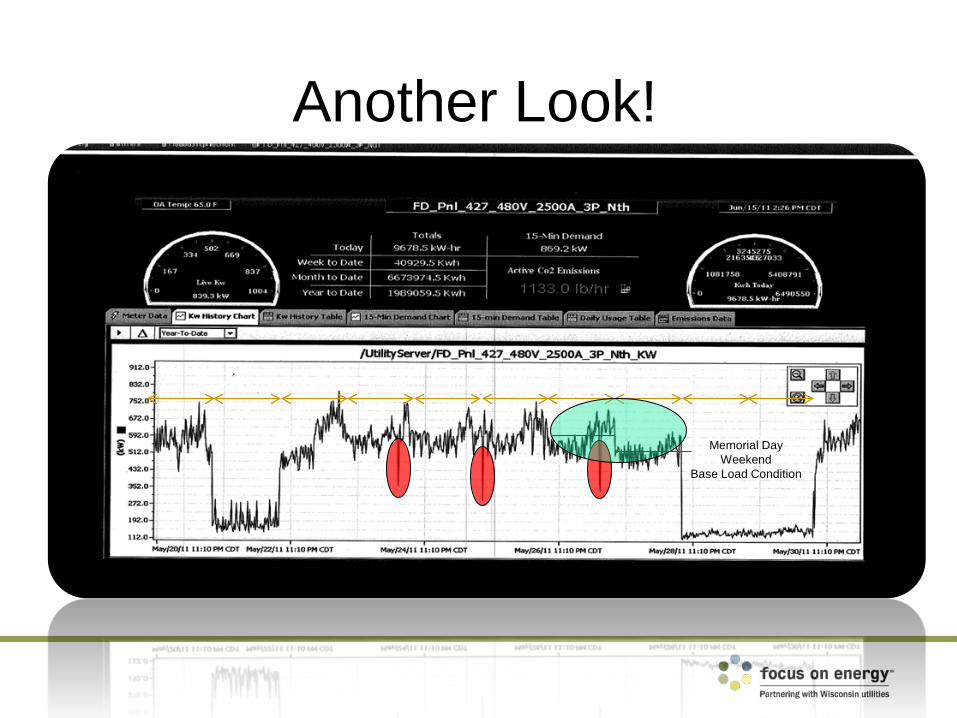
Another Look!
Memorial Day Weekend
Base Load Condition

Q & ADiscussion
http://en.wikipedia.org/wiki/File:CurrentTransformers.jpg
http://en.wikipedia.org/wiki/Pitot_tubehttp://www.spiraxsarco.com/resources/steam-engineering-tutorials/flowmetering.asp
http://www.offshore-technology.com/contractors/instrumentation/yokogawa-europe/yokogawa-europe5.html