Embed Size (px)
Citation preview
Industrial policy, Structural Change, and Pattern of Industrial
Productivity Growth in Taiwan
Tsu-tan Fu*
Department of Economics & Center for Efficiency and Productivity Research
Soochow University, Taiwan
Hsing-chun Lin
Department of Applied Economics, National Chiayi University, Taiwan
Yih-ming Lin
Department of Applied Economics, National Chiayi University, Taiwan
Wei-sing Kong
Taiwan Research Institute, Taiwan
(Taiwan KLEMS Research Team)
This paper is prepared for the third World KLEMS Conference,
Tokyo, Japan on May 19, 2014.
1
Industrial policy, Structural Change, and Pattern of
Industrial Productivity Growth in Taiwan
Tsu-Tan Fu, Hsing-Chun Lin, Yih-Ming Lin and Wen-Hsin Kong
(Taiwan KLEMS Research Team)
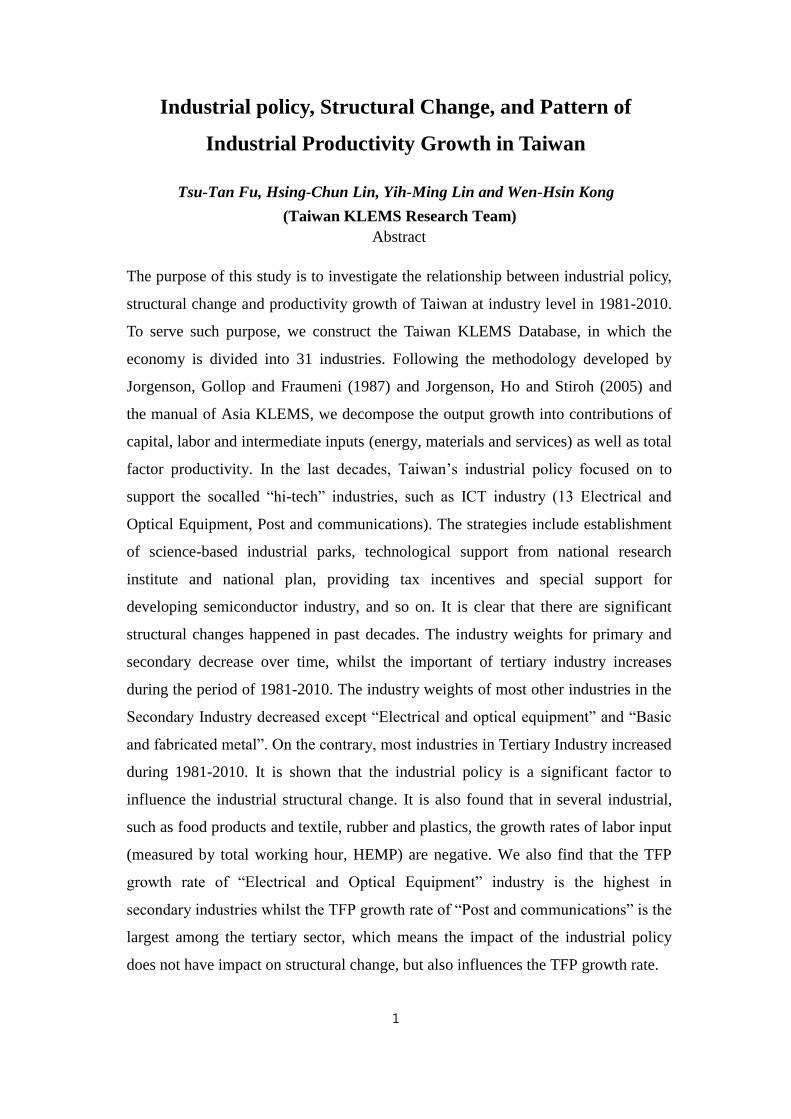
Abstract
The purpose of this study is to investigate the relationship between industrial policy,
structural change and productivity growth of Taiwan at industry level in 1981-2010.
To serve such purpose, we construct the Taiwan KLEMS Database, in which the
economy is divided into 31 industries. Following the methodology developed by
Jorgenson, Gollop and Fraumeni (1987) and Jorgenson, Ho and Stiroh (2005) and
the manual of Asia KLEMS, we decompose the output growth into contributions of
capital, labor and intermediate inputs (energy, materials and services) as well as total
factor productivity. In the last decades, Taiwan’s industrial policy focused on to
support the socalled “hi-tech” industries, such as ICT industry (13 Electrical and
Optical Equipment, Post and communications). The strategies include establishment
of science-based industrial parks, technological support from national research
institute and national plan, providing tax incentives and special support for
developing semiconductor industry, and so on. It is clear that there are significant
structural changes happened in past decades. The industry weights for primary and
secondary decrease over time, whilst the important of tertiary industry increases
during the period of 1981-2010. The industry weights of most other industries in the
Secondary Industry decreased except “Electrical and optical equipment” and “Basic
and fabricated metal”. On the contrary, most industries in Tertiary Industry increased
during 1981-2010. It is shown that the industrial policy is a significant factor to
influence the industrial structural change. It is also found that in several industrial,
such as food products and textile, rubber and plastics, the growth rates of labor input
(measured by total working hour, HEMP) are negative. We also find that the TFP
growth rate of “Electrical and Optical Equipment” industry is the highest in
secondary industries whilst the TFP growth rate of “Post and communications” is the
largest among the tertiary sector, which means the impact of the industrial policy
does not have impact on structural change, but also influences the TFP growth rate.
2
1. Introduction
The purpose of this paper is to investigate the relationship among industrial policy,
structure change and TFP growth pattern at industry level in 1981-2010. To reach this
purpose, we construct the Taiwan KLEMS Database, in which the economy is divided
into 31 industries based on the Asia KLEMS manual. Following the methodology
developed by Jorgenson, Gollop and Fraumeni (1987) and Jorgenson, Ho and Stiroh
(2005) and the manual of Asia KLEMS, we decompose the output growth into
contributions of capital, labor and intermediate inputs (energy, Materials and services)
as well as total factor productivity. We further conduct cross-period and cross-
industry comparisons on the structures of industry output growth and of the factor
contribution in Taiwan.
The empirical results show that the range of industry level growth rate varies
widely by industry and by time period. The results also show the structure of the
factor contribution share to be varied by industry. But, in general, the contribution
share from intermediate inputs dominates that from other inputs (capital and labor) for
most industries in Secondary Sectors. However, such input dominant contribution
effect differs by industry in Tertiary industries. The above mentioned results indicate
the importance of growth decomposition analysis at industry level.
We find that Capital is the main driver to value added (VA) output growth and
Intermediate input is the main driver to gross output (GO) growth. Among those
intermediates inputs, we find that the contribution share from Materials input (ConM)
outweighs those from other inputs (capital and labor) for most industries in Secondary
Sectors. We also find that the contribution share of Services input (ConS) plays
dominant role to the GO growth for most industries in Tertiary Sector. Furthermore,
our cross period comparison results indicate that the role of contribution shares of K
and II decreased over time, instead the contribution from TFP increased over time. At
last, Tertiary industries were having higher growth rate as well as higher TFP than
those secondary industries for the last 3 decades in Taiwan.
The structure of this paper is outlined as the following. We first give brief Taiwan
industrial development and related policies in section 2. In section 3, we will
introduce the methodology used with some descriptions on data and variables
employed. In section 4, the structure of Taiwanese industry based on industry weight

3
and growth rate are analyzed. Empirical cross-industry and cross-period comparisons
on the sources of output growth analyses will be conducted in Section 5. The paper
will be ended with the concluding remarks.
2. The Main Taiwan Industrial Development Strategies
Taiwan has experienced remarkable economic growth since the 1960s. In the 1960s,
the focus industries are the light industries, in which the government policy is
development of light industries for import substitution with its average high annual
GDP growth rate over 10.2%, which is called the “import substitution” stage. In the
1970’s, heavy and chemical industries grew rapidly due to the government’s export
promotion policy, which is called the “export expansion” stage. With the cheap
production costs and the availability of high quality labor force prior to the 1980s,
Taiwan’s policy of export expansion had been successfully pursued. The annual GDP
growth rates reached 9.27 on average during the period 1971 to 1980, as shown in
Figure 1.
Since 1980, Taiwan has been bumped into considerable challenges. In political
terms, Taiwan become a truly democratic society with the appearance of a powerful
opposition party, which make Taiwanese society become more diversified. In
economic arena, the appreciation of the New Taiwan dollars (NT$) which make the
exchange rate form 40NT$/US$ to 25 NT$/US$. The upward trend in the valuation of
the NT$ cause the inflation and asset bubbles. The stock market and real estate market
began to fluctuate. Furthermore, the low cost labor had gradually been exhausted. The
wages in Taiwan are gradually increasing. A number of labor intensive industries had
already lost their comparative advantage. In order to survive, manufacturers were
forced to move their production bases to Southeast Asia or to mainland China.
Economic liberalization and Internationalization
In the early 1980s, in order to solve the increasing trade disputes due to the
economic imbalance, the Taiwan government implements the policy of economic
liberalization, which including trade liberalization, the lifting of foreign exchange rate
control and the deregulation of financial sector. In 1991, the government approved 15
new private commercial banks establishment whist several new private banks were
established through the reorganization of trust companies and credit cooperatives.
4
There was a rapid increase in the number of commercial banks in Taiwan.
Furthermore, some new business of banks, such as commercial papers and short term
certificate, are permitted to engage.
On the other hand, since the labor cost and land cost gradually rise, a large amount
manufacturers which lost their competitiveness in the “traditional” manufacturing
industries moved oversea from the late 1980s. These manufacturers started to invest
in Mainland China and Southeast Asian countries, such as Vietnam, Indonesia,
Thailand, Philippines, Malaysia etc. The industries move their production oversea
includes paper and plastics, basic metals, textile products, garments, fur and leather
goods, wood and bamboo products, rubber products and other labor intensive
industries. The increase in oversea investment makes the structure change in Taiwan
economic development. The manufacturing sectors kept decreasing and the service
sectors kept increasing.
ITRI and the technical support of the NSTP
In order to maintain continued growth, the government’s industrial policy turned
toward a greater emphasis on the upgrading of the industrial technology, which makes
the capital and technology intensive industries replace the more labor intensive
industries. The Industrial Technology Research Institute (ITRI) is founded and
sponsored by Taiwanese government, which is a nonprofit R&D organization
engaging in applied research and technical services. ITRI’s main tasks are the
undertaking of industry-research technology and product R&D, along with the
diffusion of the results of their work among private manufacturers. In addition, ITRI
also provides technical supports and services for small and medium enterprises
(SMEs). With the support by the National Science and Technology Project (NSTP),
the ITRI gradually grew stronger and bigger.
The main objective of NSTP is to encourage industry to undertake R&D work. The
NSTPs promote the development of ICT industries, promote the upgrading of
traditional industries (modernization and automation), establish the basic
infrastructure for industrial development, improve efficient use of resources and solve
common problems shared by industries. ITRI and NSTPs carry out R&D work and
transfer the results to the private manufacturers, which made a significant, impressive
5
contribution to industrial upgrading. By disseminating both technology and talent,
ITRI has played a vital role in transforming Taiwan’s economy from a labor-intensive
industry to a high-tech industry. Numerous well-known, high-tech companies in
Taiwan, such as leaders in the semiconductor industry TSMC and UMC, can trace
their origins to ITRI.
The Establishment of the HSIP
Since the first oil crisis happened, the government realized that Taiwan’s industrial
development was based on a labor-intensive structure. Taiwan government understood
that it is necessary to pursue a policy of development hi-tech, high value-added
industries. In order to attract investment from foreign hi-tech manufacturers, the
government realized that government had to construct an appreciate, attractive
investment environment. Therefore, the Hsin-Chu Science-based Industrial Park
(HSIP) was founded for high-tech industries (ICT). The HSIP was established
similarly to those in Silicon Valley in California. No one can doubt the contribution of
the HSIP for Taiwan economic development. This Park had a major impact on
stimulating development of ICT industries. Firms located within the HSIP can enjoy
tax incentives and tariff exemptions and deductions, which is the main factor to attract
companies to invest within the Park. In addition, HSIP helped in the diffusion of
technology by encouraging manufacturers to recognize and reap the benefits of
congregating together. HSIP has become the main center of development of Taiwan
ICT industries. In 1997, there were 245 companies located in the Park, employing a
otal of 68410 workers. The total business revenue made by the Park is up to 13.9
billions US$, which account for 5% of total GDP.
The policy for subsidizing research and development (R&D) and sponsoring
cooperative research has helped to heighten the rapid technological progress in
high-tech industries, which grew quickly in the 1980s, and become the dominant
industry in the 1990s.
Tax incentives under the Statute of Upgrading Industries
In the mid-1980s, with the appreciation of the NT$, the labor and land cost begin to
rise gradually, which makes the labor-intensive industries loss their competitiveness.
It is necessary to accelerate the process of industrial upgrading, improve products
6
value-added, seek out competitiveness. At the end of 1980s, the “Statute of Upgrading
Industries” was passed and implemented on 1 January, 1991.The main content of the
statute is the provisions for tax incentives (tax credits, tax exemptions and tax
deferrals) to encourage manufacturers to undertake R&D work, implement
automations, and promote the development of ICT industries so as to strengthen
manufacturers competitive advantage.
Promotion of the Semiconductor industry
In 1976, 37 young engineers were dispatched to the US and to undergo training.
These young engineers not only bring technology, but also establish a Complementary
Metal Oxide on Silicon (CMOS) plant in ITRI laboratories. The government invested
in excess of NT$400 millions in the development of semiconductor industry and
signed various agreements with various foreign semiconductor manufacturers, such as
RCA for technology transfer and personal training at late 1970s. In addition, the
government also directed plans to bring together of private sector capital and transfer
technology to private companies. During the 1980s, the government directed the
establishment of United Microelectronic Corporation (UMC) and Taiwan
Semiconductor Manufacturing Company (TSMC). A number of small design
companies began to establish in HSIP. With the government’s investment in
semiconductor industry and the establishment of UMC and TSMC, not only was
production process technology being continuously improved, but various other
semiconductor related technologies were also innovated, including circuit design,
mask production, packaging and testing, and so on.
Taiwan’s economic growth slowed down in the late 1990s and become sluggish in
2000s as a result of a sequence of negative impacts such as the Asian financial crisis
in 1997, worldwide economic recession in 2000, the financial tsunami in 2008, and
the financial debt crisis in Europe in 2011. Up to date, the focus industries in Taiwan
include Information and Communications, Electronics and Optoelectronics, Material,
Chemical and Nanotechnology, Medical Device and Biomedical, Mechanical and
Systems, Green Energy and Environment.

7
Figure 1: An overview of Taiwan’s Industrial Development
3. Methodology
3.1 Growth and Productivity Accounts
We follow the growth accounting methodology provided by the Asia KLEMS
manual (2012) which was developed by Dale Jorgenson and associates as outlined in
Jorgenson, Gollop and Fraumeni (1987) and more recently in Jorgenson, Ho and
Stiroh (2005). It is assumed that industry gross output is a function of capital, labor,
intermediate inputs and technology. Following the notation of Asia KLEMS manual
(2012), the production functions are assumed to be separable in these inputs,
( ) ( , , , )j j ij j j j jY g Y f K L X T
where Y is output, K is an index of capital service flow, L is an index of labor service
flows and X is an index of intermediate inputs, which consists of the intermediate
inputs purchased from the other domestic industries and imported products.
Intermediate inputs (X) include energy (E), materials (M) and services (S) inputs in
this model. Under the assumptions of constant returns to scale and competitive
markets, the value of output is equal to the value of all inputs:
Y k L X
j j j j j j j jP Y P K P L P X
where Y
jP denotes the price of output, X
jP denotes the price of intermediate inputs,
K
jP denotes the price of capital services and L
jP denotes the price of labor services.
2000's Knowledge-Intensive Manufacturing and Service Industry
ICT Growth slow down 3.76%
1980-1990's High-Tech IndustryICT Rapid Growth 7.37%
1970's Heavy and Chemical IndustryExport Expansion 9.27%
1960's Light industryImport Substition Average GDP Growth rate 10.2%
8
The value share of each input is defined as follows:
;jt
Y
jt
jt
X
jtX
jtYP
XPv ;
jt
Y
jt
jt
L
jtL
jtYP
LPv
jt
Y
jt
jt
K
jtK
jtYP
KPv
The assumption of constant returns to scale implies 1 K
jt
L
jt
X
jt vvv .
The standard growth accounting decomposition of output growth into the
contribution of each input and TFP (denoted by YA ) can be expressed as:
Y
jtjt
L
jtjt
K
jtjt
X
jtjt ALvKvXvY lnlnlnlnln
where the contribution of each input is defined as the product of the input’s growth
rate and its two period average revenue share.
3.2 Taiwan KLEMS Database
We construct the Taiwan KLEMS Database following the Asia KLEMS manual, in
which the economy is divided into 31 industries. (the 32th sector, the
“EXTRA-TERRITORIAL ORGANIZATIONS AND BODIES” in Asia KLEMS manual,
is not available) The data resources are based on the data published by the Directorate
General of Budget, Accounting and Statistics, Taiwan (DGBAS) for the period
1981-2010. For the output data (Gross output and Value added), we utilize the
National Income Survey data (93 SNA) and convert 65 sectors into 31 sectors.
Since the capital data is still under constructing, we employ the capital stock as the
capital service in this paper. Capital stock data is also published by DGBAS. We
convert capital data (16 sectors available after 2001 and 11 sectors available before
2001) into the capital stock in format of 31 sectors. Labor data include labor
compensation and working hour data. We employed the raw survey data from
Manpower data, which is conducted in May since 1977. There are about 60,000
observations in this survey every year. Compiled manpower data with Employees’
Earnings Survey, we can obtain labor compensation and working hour data.
Intermediate Inputs (II) include energy(E), materials(M) and services(S). The data
from Intermediate Input of national income and divide all sectors into three sectors.
We use the Input-output table to get the inputs of E, M, S for each sector. Following
the methodology developed by Jorgenson, Gollop and Fraumeni (1987) and
9
Jorgenson, Ho and Stiroh (2005), we decompose the output growth into contributions
of capital, labor and intermediate inputs (energy, materials and services) as well as
total factor productivity.
4. Economic Performance of Taiwan: 1981-2010
4.1 Industry structure in Taiwan
Value added weights at industry level:
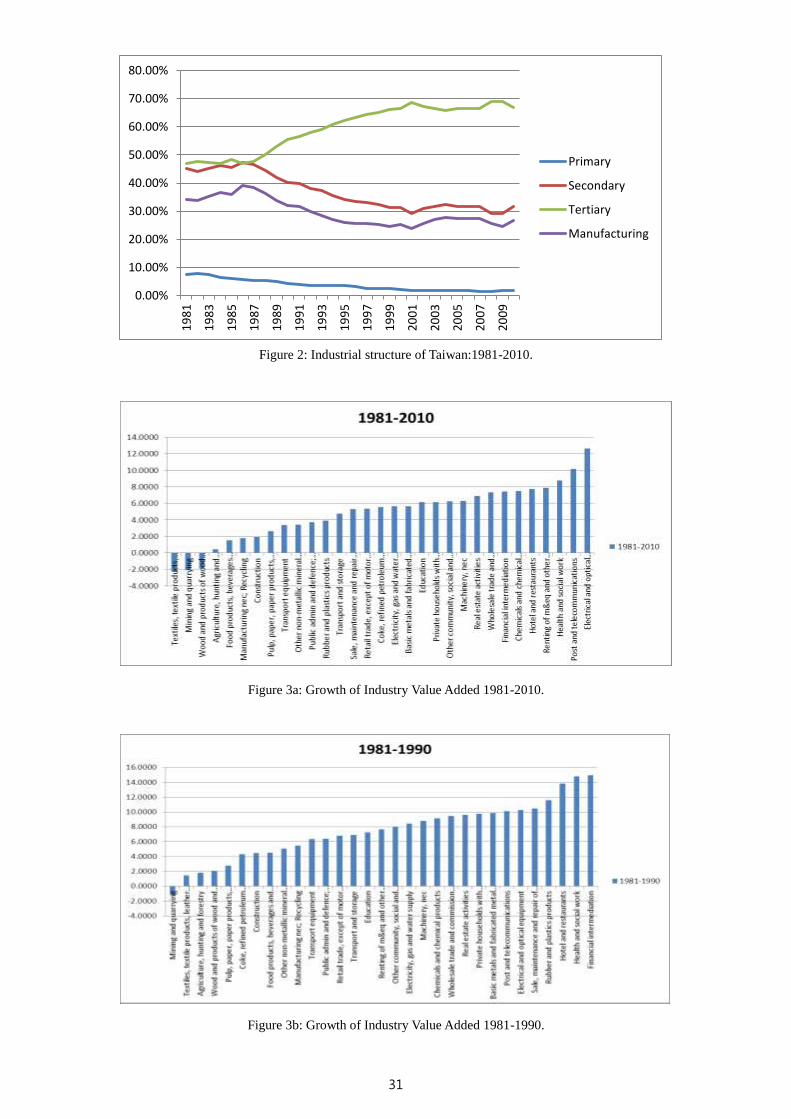
The industry weights for primary and secondary decrease over time, the important
of tertiary industry increases during the period of 1981-2010, as shown in Table 1 and
Figure 2. Table 1 also indicates that the industry weights of primary, secondary and
tertiary industries are 1.73%, 30.99% and 67.27% in 2001-2010, respectively.
As for value added weights for 31 sectors, Table 2 shows the level and some
changes in industry weight in the last 3 decades. In 1981, we find that “ 3.Food
products, beverages and tobacco”, “4.Textiles, textile products, leather..”,
“13.Electrical and optical equipment”, “17.Construction” are important industries in
the Secondary Industry, whereas “27.Public admin and defense..”, “19.Wholesale
trade and commission trade”, “20.Retail trade..” and “25.Real estate activities” are
industries with high weight in the Tertiary Industry. However, Table 2 shows that that
except “13.Electrical and optical equipment” and “11.Basic and fabricated metal”, the
industry weights of most other industries in the Secondary Industry decreased over
time. On the contrary, Table 2 also shows industry weights of most of industries in the
Tertiary Industry to be increased over time. As a result, we can find that in 2010
industries such as “13.Electrical and Optical equipment”, “11.Basic and fabricated
metal products”, and “8.Chemicals and chemical products” in the Secondary Industry,
as well as “19.Wholesale trade and commission trade”, “25.Real estate activities”,
“27.Public admin and Defense.”, “20.Retail trade..” and 24.Financial intermediation”
in the Tertiary Industry, are sectors with relatively high weight.
4.2 Industrial Value Added and Output Growth by sub-period
Value Added Growth at Industry Level

10
Table 3 presents the growth of industry value added for the last 3 decades. The
average growth rate in 1981-90 was 7.46%, but it decreased substantially in the later 2
decades. Among 31 sub-industries, we also find in Table 3 and Figure 3a that
“13.Electrical and optical equipment” and “8.Chemicals and chemical products” in
the Secondary Industry, as well as “23.Post and telecommunications”, “29.Health and
Social work”, “26.Renting of m&eq ..”, “19.Wholesale trade..”, and “Hotel and
restaurants” in Tertiary Industry, are sub-industries with annual growth rate higher
than 7%. Cross period comparisons on the annual growth rate at industry level can
also be seen in Figures 3b-3d. It is also noticed that growth rate for 31 industries
ranged from 15.76% (Industry#23) to -5.86% (industry#5) and varied by sub-period,
which implies the importance of analysis at industry level.
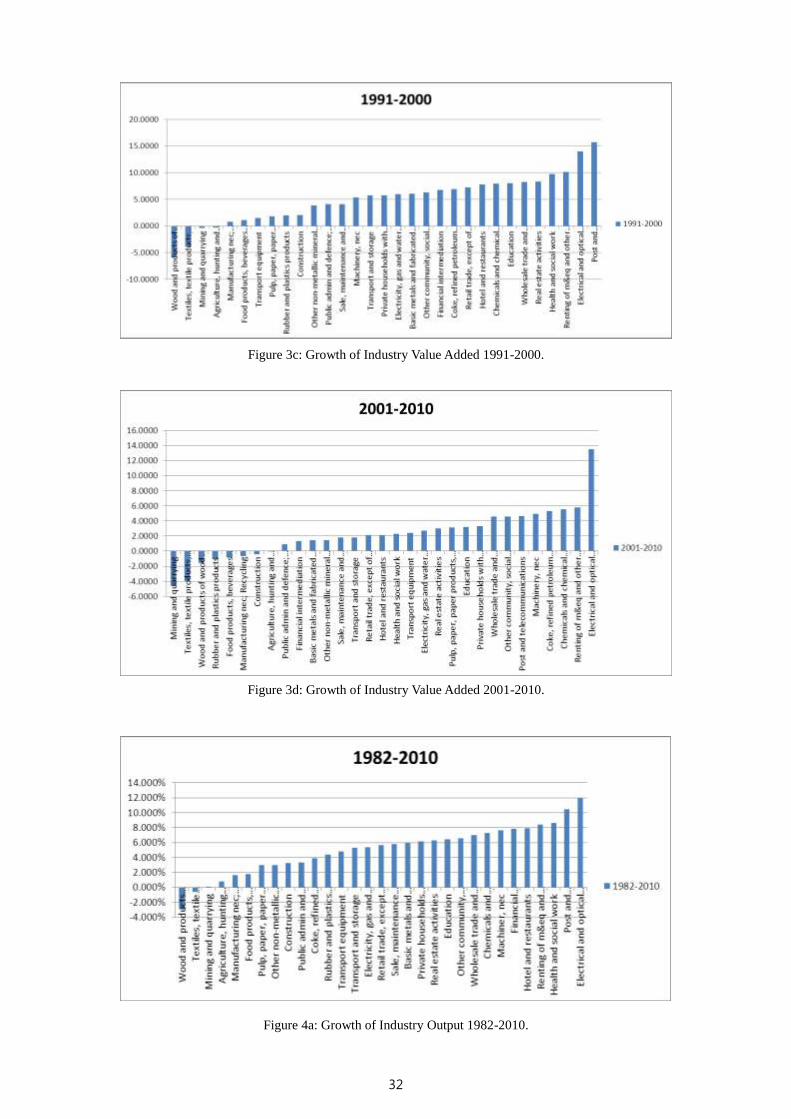
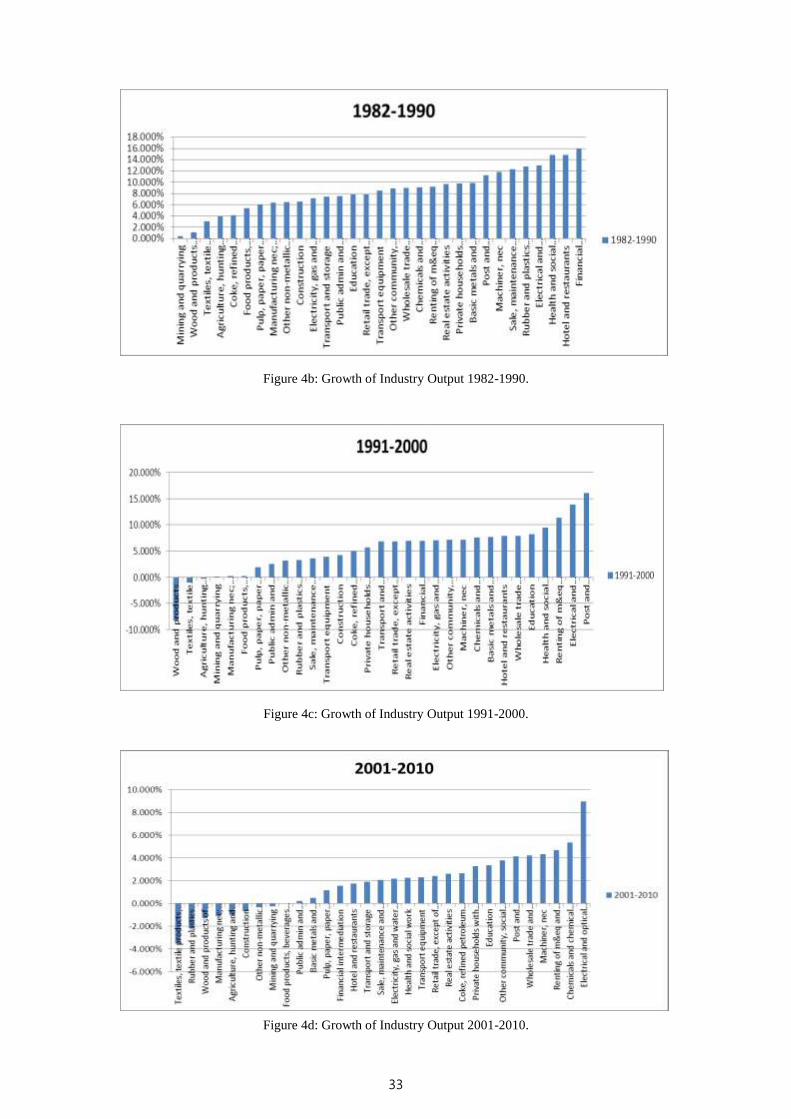
Output Growth at Industry Level
Output growth is defined to be the addition of value added and intermediate inputs.
Table 4 presents the growth of industry output for the 3 decades. Despite growth
rates in growth output are different from those in value added, however by comparing
Figures 3a and 4a, one can see that the growth rate ranks of 31 industries in gross
output (Figure 4a) and in value added (Figure 3a) are quite similar. Cross period
comparison of growth rate in industry output, Figures 3b-3d, also indicates vast
differences between industries and sub-periods.
4.3 Input growth at industry level by period
Regular inputs used for production include labor, capital and intermediate inputs
(energy, materials, and services). Table 5 shows the growth of labor input at industry
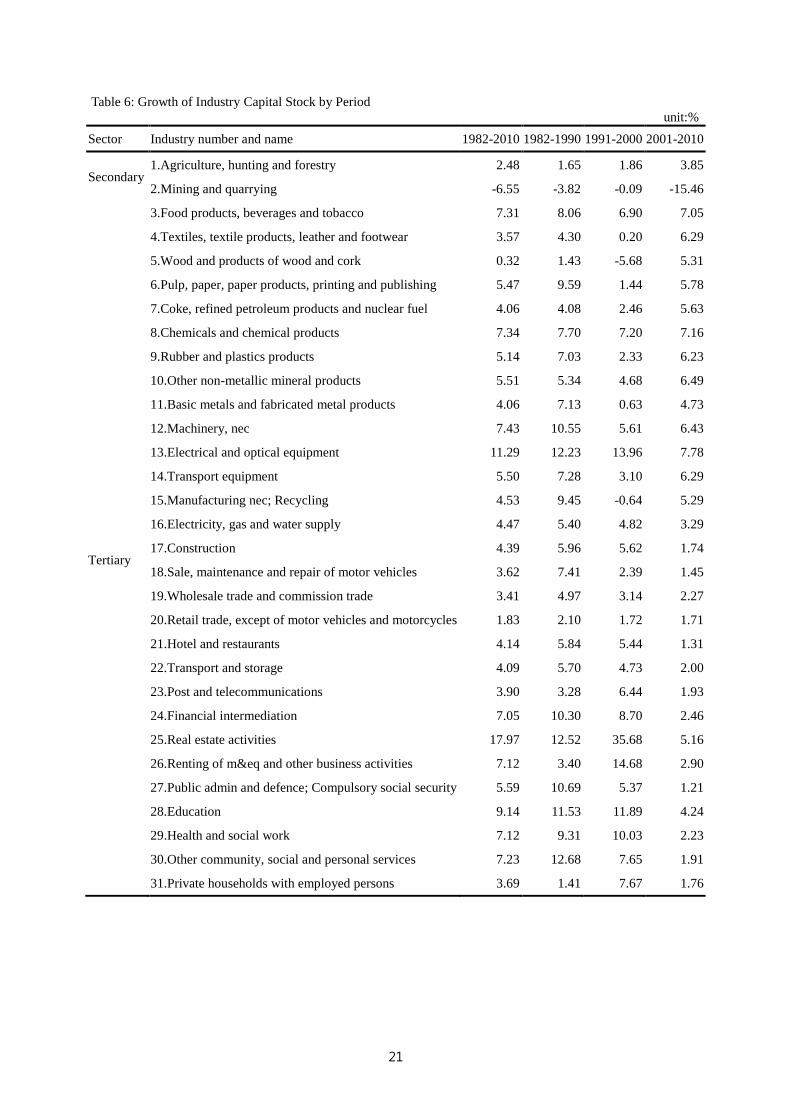
level by period whilst Table 6 shows the growth of capital stock at industry level by
period. Similar growth of other inputs can be generated from Taiwan KLEMS
database. In Figures 5a-5e, we show the growth of labor, capital, energy, materials
and service at industry level in 1981-2012. In general, we find all inputs have
positive growth for most industries in the sample period. But, we also find that growth
rates vary substantially by industry for all inputs.
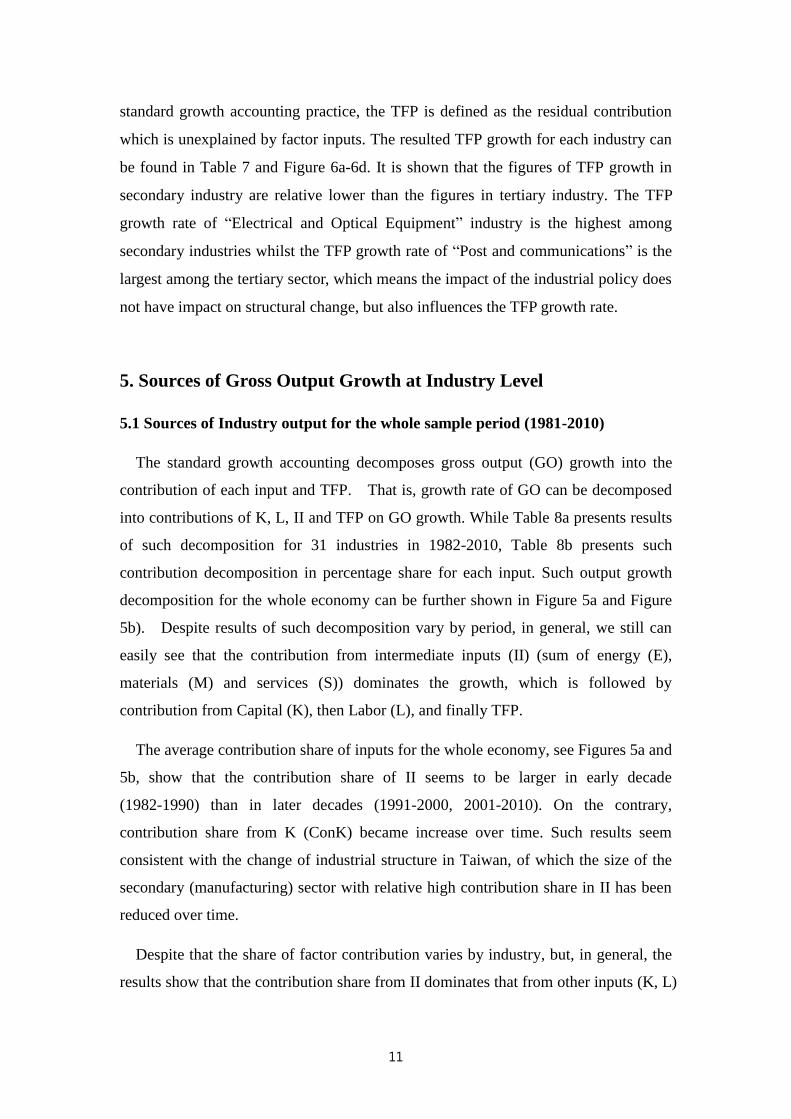
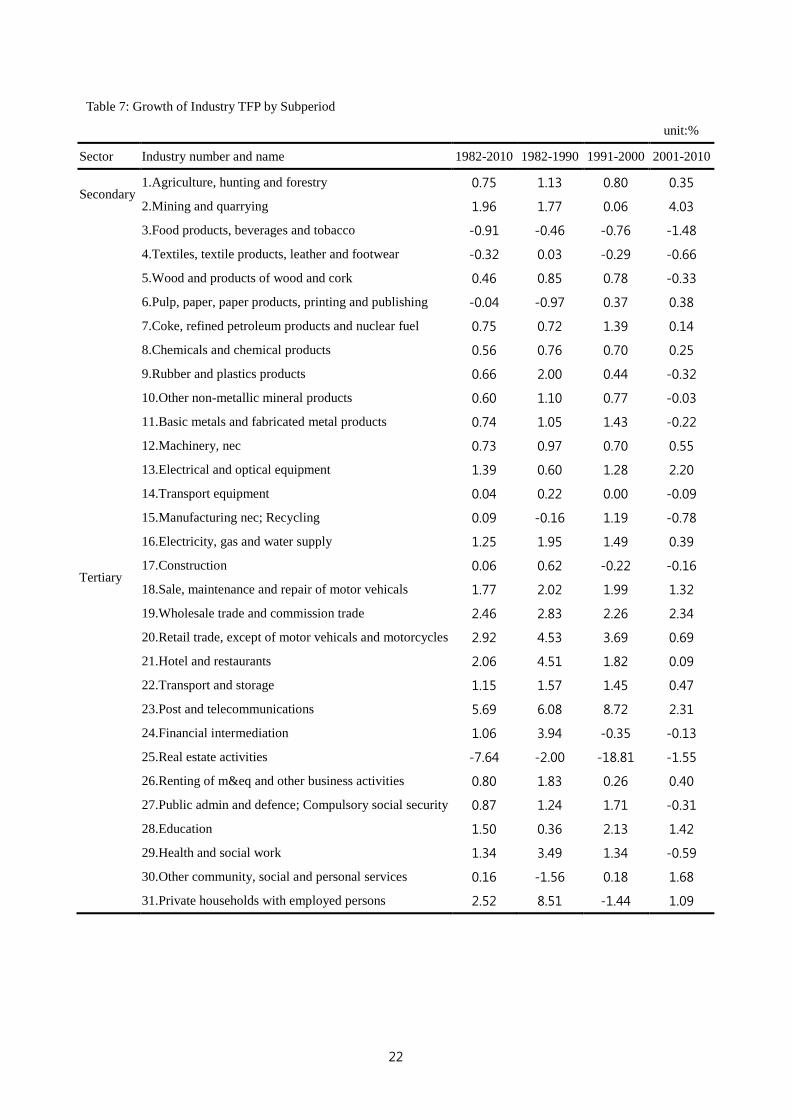
4.4 The TFP Growth at Industry level
Table 7 presents the TFP growth rate by industry in the last 3 decades. As in the
11
standard growth accounting practice, the TFP is defined as the residual contribution
which is unexplained by factor inputs. The resulted TFP growth for each industry can
be found in Table 7 and Figure 6a-6d. It is shown that the figures of TFP growth in
secondary industry are relative lower than the figures in tertiary industry. The TFP
growth rate of “Electrical and Optical Equipment” industry is the highest among
secondary industries whilst the TFP growth rate of “Post and communications” is the
largest among the tertiary sector, which means the impact of the industrial policy does
not have impact on structural change, but also influences the TFP growth rate.
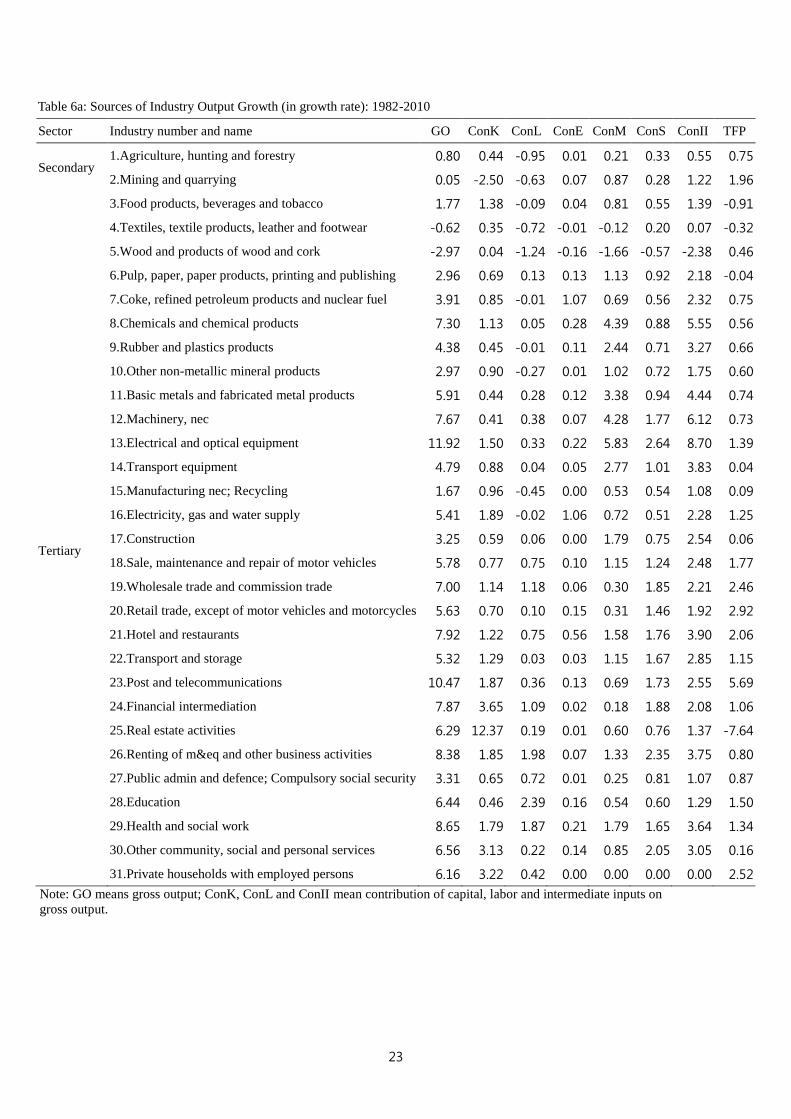
5. Sources of Gross Output Growth at Industry Level
5.1 Sources of Industry output for the whole sample period (1981-2010)
The standard growth accounting decomposes gross output (GO) growth into the
contribution of each input and TFP. That is, growth rate of GO can be decomposed
into contributions of K, L, II and TFP on GO growth. While Table 8a presents results
of such decomposition for 31 industries in 1982-2010, Table 8b presents such
contribution decomposition in percentage share for each input. Such output growth
decomposition for the whole economy can be further shown in Figure 5a and Figure
5b). Despite results of such decomposition vary by period, in general, we still can
easily see that the contribution from intermediate inputs (II) (sum of energy (E),
materials (M) and services (S)) dominates the growth, which is followed by
contribution from Capital (K), then Labor (L), and finally TFP.
The average contribution share of inputs for the whole economy, see Figures 5a and
5b, show that the contribution share of II seems to be larger in early decade
(1982-1990) than in later decades (1991-2000, 2001-2010). On the contrary,
contribution share from K (ConK) became increase over time. Such results seem
consistent with the change of industrial structure in Taiwan, of which the size of the
secondary (manufacturing) sector with relative high contribution share in II has been
reduced over time.
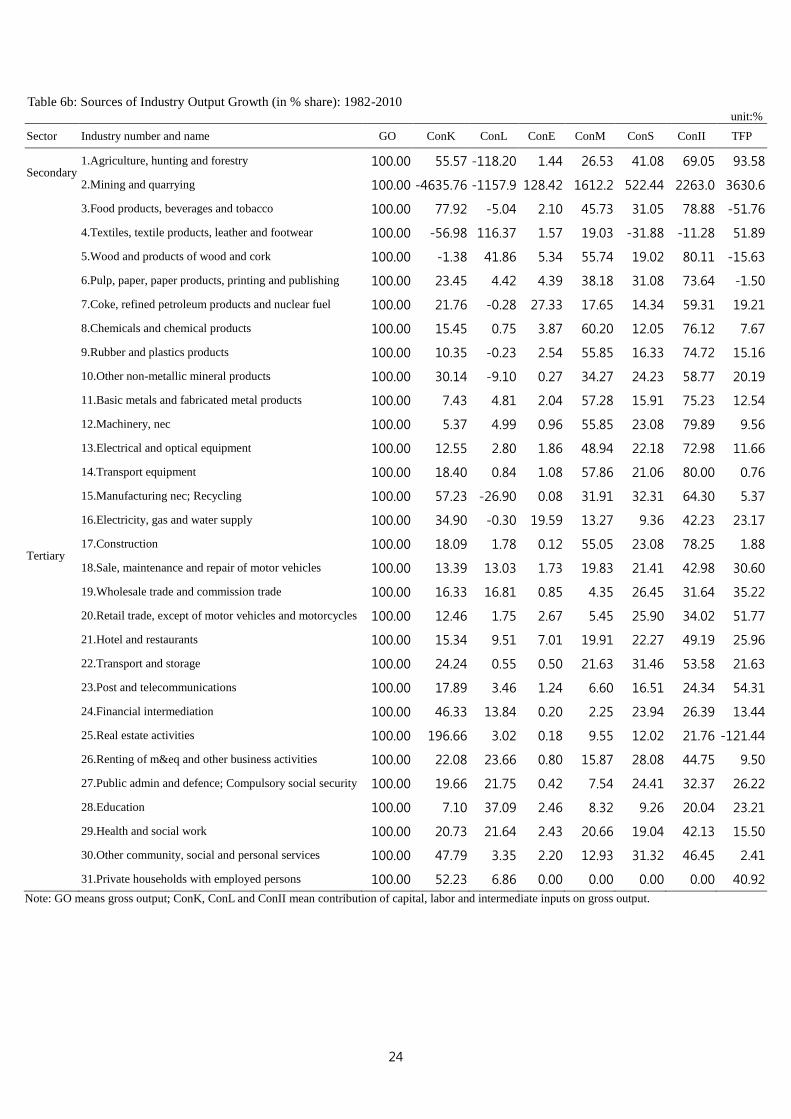
Despite that the share of factor contribution varies by industry, but, in general, the
results show that the contribution share from II dominates that from other inputs (K, L)
12
for most industries in Secondary Sectors. However, Table 6b shows that such input
dominant contribution effect may differ by industry in Tertiary sectors. For example,
among all factor contribution in “21.Hotel and restaurant” industry, II has the largest
contribution share (49%), TFP has the second largest share (18%), and K has the
lowest share (15%). In the industry “23.Post and telecommunications”, TFP share is
30%, L share is 28%, II share in only 24%, and K share is only 18%. In the case of
“28. Education” industry, L has dominant share of contribution (77%). Ranking of
contribution effect and percentage share for inputs for each industry during
1981-2010 can be seen in Figures 6a and 6b.
As for composition within intermediate inputs, Table 6b also shows that M
accounts for most contribution from II for those secondary industries. However, for
most tertiary industries, services input (S) accounts most of contribution from
intermediate inputs.
5.2 Sources of Industry output growth: Cross-period comparisons
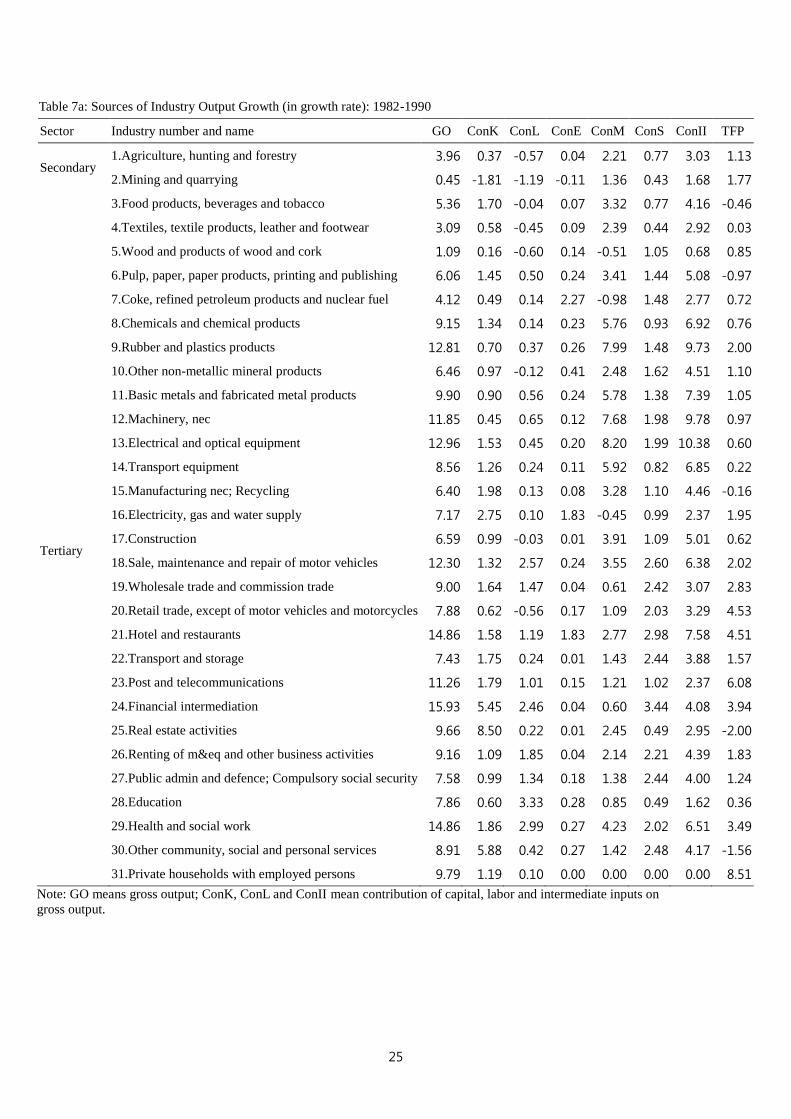
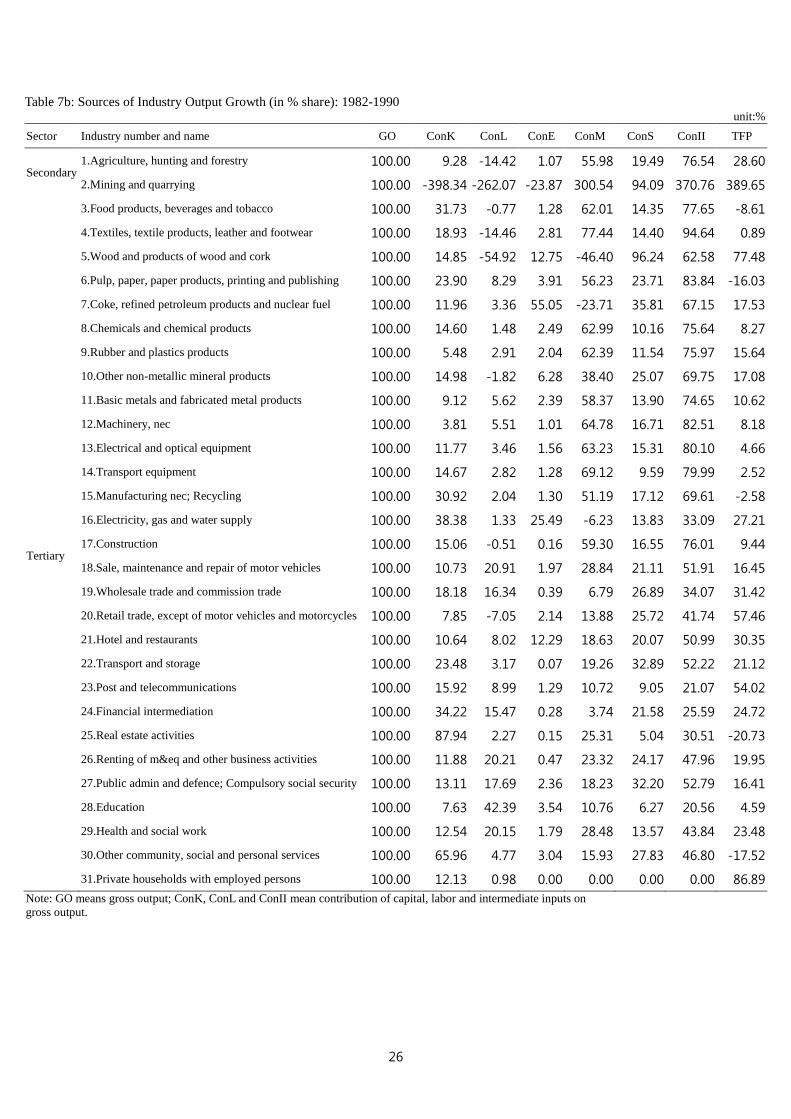
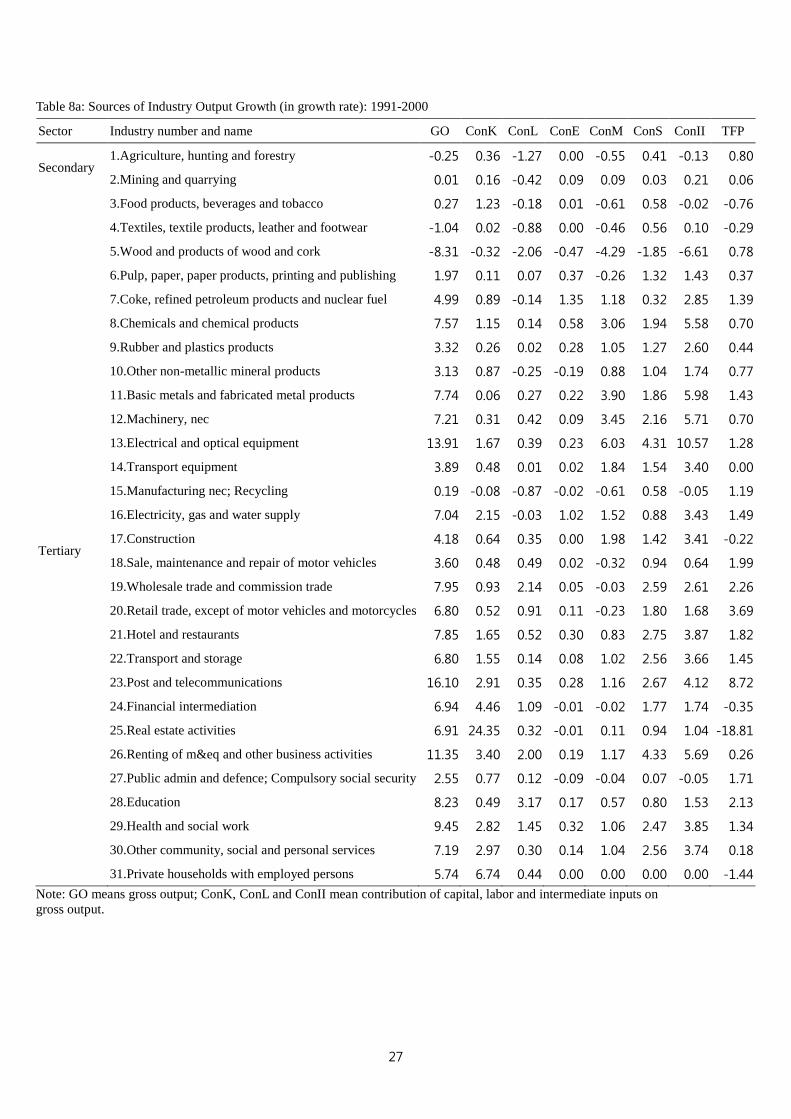
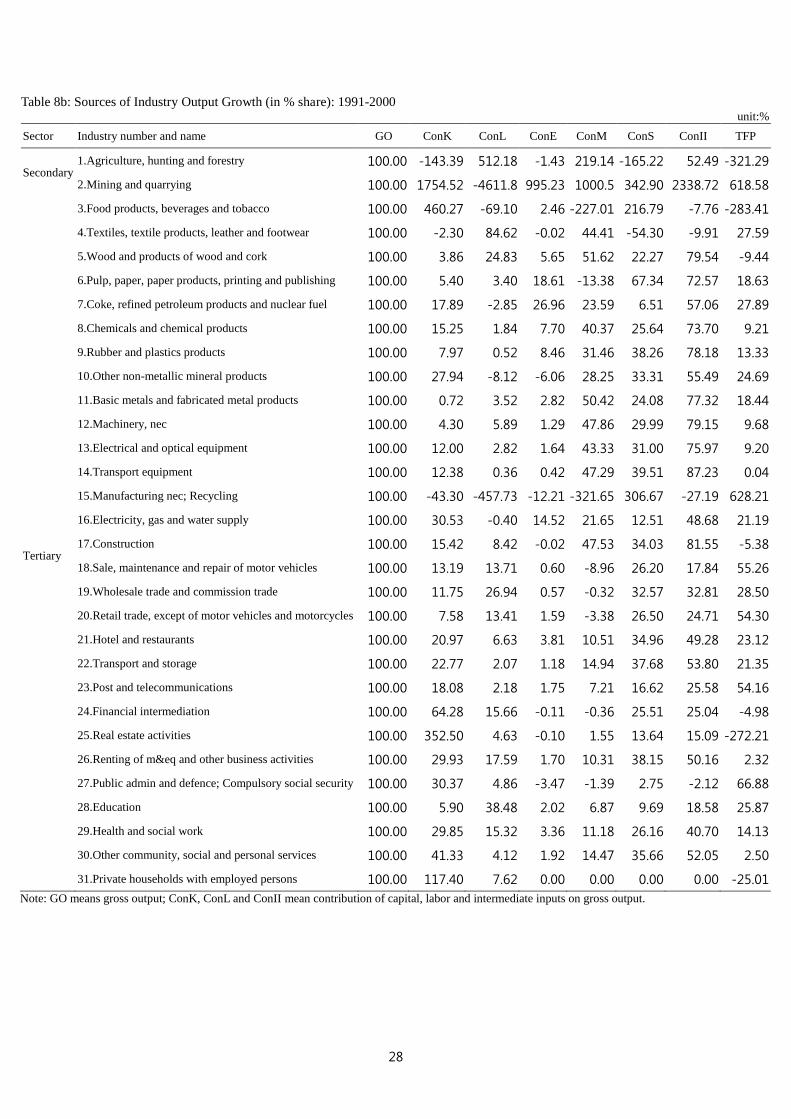
Tables 7, 8 and 9 present sources of industry output growth analyses (in growth
rate (tables a) and in % share (tables b)) for periods of 1982-1990, 1991-2000, and
2001-2010, respectively. Since there are 31 industries with different decomposition
results, thus in this section we intend to choose 3 industries to show such vast
difference in industry level in Taiwan.
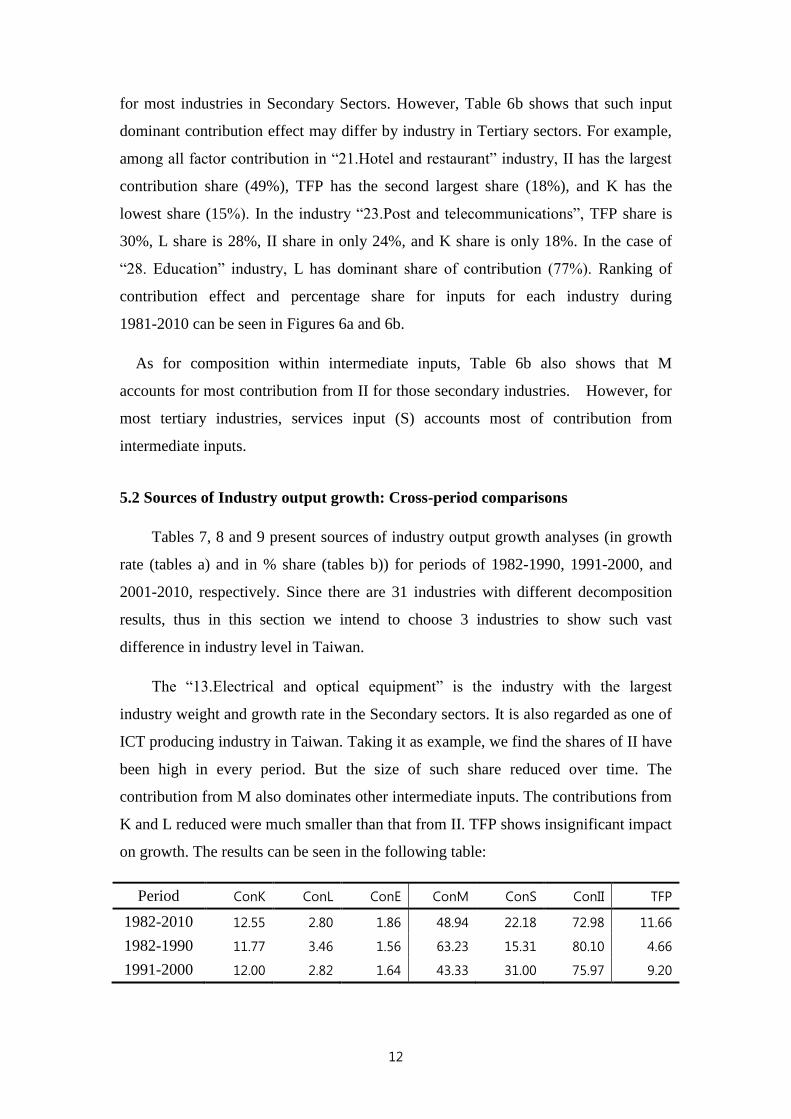
The “13.Electrical and optical equipment” is the industry with the largest
industry weight and growth rate in the Secondary sectors. It is also regarded as one of
ICT producing industry in Taiwan. Taking it as example, we find the shares of II have
been high in every period. But the size of such share reduced over time. The
contribution from M also dominates other intermediate inputs. The contributions from
K and L reduced were much smaller than that from II. TFP shows insignificant impact
on growth. The results can be seen in the following table:
Period ConK ConL ConE ConM ConS ConII TFP
1982-2010 12.55 2.80 1.86 48.94 22.18 72.98 11.66
1982-1990 11.77 3.46 1.56 63.23 15.31 80.10 4.66
1991-2000 12.00 2.82 1.64 43.33 31.00 75.97 9.20

13
2001-2010 14.41 1.92 2.59 39.07 17.45 59.11 24.56
*Sources of GO growth for the Electrical and Optical Equipment industry
The “19.Wholesale and commission trade” is the industry with the biggest
industry weight in the Tertiary sectors. We find the contribution shares of factor
inputs to be dominated by L in early decade, but by II and TFP in the later decades. It
should be noted that TFP increased over time, and became dominant driver in
2001-2010. The results discussed can be demonstrated in the following table:
Period ConK ConL ConE ConM ConS ConII TFP
1982-2010 16.33 16.81 0.85 4.35 26.45 31.64 35.22
1982-1990 18.18 16.34 0.39 6.79 26.89 34.07 31.42
1991-2000 11.75 26.94 0.57 -0.32 32.57 32.81 28.50
2001-2010 21.36 -1.25 2.26 8.43 14.13 24.82 55.06
*Sources of output growth in the “19.Wholesale and commission trade” industry
In addition, the “23.Post and communications” is the industry with the biggest
annual growth rate in the Tertiary sectors. This industry is also regarded as major ICT
using industry in Taiwan. We find that this industry had quite high contribution share
on L in 1982-1990, high share on II and TFP in 1991-2000, but very high share on K
in 2001-2010. We list such contribution shares of its factor inputs as the following:
Period ConK ConL ConE ConM ConS ConII TFP
1982-2010 17.89 3.46 1.24 6.60 16.51 24.34 54.31
1982-1990 23.48 3.17 0.07 19.26 32.89 52.22 21.12
1991-2000 18.08 2.18 1.75 7.21 16.62 25.58 54.16
2001-2010 21.98 -5.12 -0.90 -5.88 34.30 27.53 55.61
*Source of output growth in the “23.Post and communications” industry
Based upon the above discussions, we may conclude that the contribution share
of II to industry output in most Tertiary industries tends to be smaller than those
Secondary industries.
6. Concluding Remarks

14
In the last decades, Taiwan’s industrial policy focus on to help the so called “hi-tech”
industries, such as ICT industry (13 Electrical and Optical Equipment, Post and
communications). The strategies include establishment of science-based industrial
parks, technological support from national research institute and national plan,
providing tax incentives and special support for developing semiconductor industry,
and so on. It is clear that there are significant structural changes happened in the past
decades. The industry weights for primary and secondary decrease over time, whilst
the important of tertiary industry increases during the period of 1981-2010. The
industry weights of most other industries in the Secondary Industry decreased except
“Electrical and optical equipment” and “Basic and fabricated metal”. On the contrary,
most industries in Tertiary Industry increased during 1981-2010. It is shown that the
industrial policy is a significant factor to influence the industrial structural change.
The empirical results show that the output growth rate for 31 industries ranged
from 11.92% to -2.97% in 1981-2010 and varied by sub-period. The results also show
the structure of the factor contribution share to be varied by industry. But, in general,
the contribution share from intermediate inputs dominates that from other inputs
(capital and labor) for most industries in Secondary Sectors. In several industrial, such
as food products and textile, rubber and plastics, the growth rates of labor input
(measured by total working hour, HEMP) are negative. However, such input
dominant contribution effect differs by industry in Tertiary industries. This indicates
the importance of growth decomposition analysis at industry level.
We also find that the TFP growth rate of “Electrical and Optical Equipment”
industry is the highest in secondary industries whilst the TFP growth rate of “Post
and communications” is the largest among the tertiary sector, which means the
impact of the industrial policy does not have impact on structural change, but also
influences the TFP growth rate.
References
Jorgenson, D.W., F.M. Gollop and B.M. Fraumeni (1987), Productivity and US
Economic Growth, Cambridge MA: Harvard University Press.

15
Jorgenson, D.W., M. Ho and K. Stiroh. (2005) Information Technology and the
American Growth Resurgence, MIT, 2005.
Pyo, Hak, K.H. Rhee and H. Chun (2012), Asia KLEMS Growth and Productivity
Accounts, version1.0. Draft and Proposal, Part 1 Methodology. Asia KLEMS
consortium.

16
Table 1: The industry Value Added weights of Primary, secondary, Tertiary and Manufacturing by
sub-period unit:%
1981-1990 1991-2000 2001-2010 1981-2010
Primary 6.13 3.10 1.73 3.66
Secondary 44.75 34.70 30.99 36.82
Manufacturing 35.55 27.03 26.29 29.62
Tertiary 49.11 62.19 67.27 59.53

17
Table 2: Industry Value Added Weights by selected year
unit:%
Sector Industry number and name 1981 1990 2000 2010
Secondary 1.Agriculture, hunting and forestry 7.65 4.24 2.08 1.69
2.Mining and quarrying 2.16 0.68 0.52 0.48
3.Food products, beverages and tobacco 4.48 3.33 1.47 1.24
4.Textiles, textile products, leather and footwear 6.96 4.47 1.88 0.82
5.Wood and products of wood and cork 0.65 0.41 0.08 0.07
6.Pulp, paper, paper products, printing and publishing 1.57 1.29 0.73 0.63
7.Coke, refined petroleum products and nuclear fuel 1.30 1.14 1.38 1.09
8.Chemicals and chemical products 2.50 2.82 2.25 3.23
9.Rubber and plastics products 1.42 2.10 1.26 0.70
10.Other non-metallic mineral products 1.69 1.43 0.70 0.47
11.Basic metals and fabricated metal products 2.94 3.99 3.55 3.30
12.Machinery, nec 0.98 1.28 1.18 1.27
13.Electrical and optical equipment 4.31 5.46 8.37 12.08
14.Transport equipment 2.39 2.42 1.56 1.26
15.Manufacturing nec; Recycling 2.80 2.01 1.04 0.65
16.Electricity, gas and water supply 3.40 2.81 2.06 1.35
Tertiary
17.Construction 5.69 4.61 3.22 2.90
18.Sale, maintenance and repair of motor vehicles 1.16 1.44 1.33 1.23
19.Wholesale trade and commission trade 6.17 6.23 9.41 10.94
20.Retail trade, except of motor vehicles and motorcycles 5.78 5.76 6.97 6.67
21.Hotel and restaurants 0.90 1.67 2.09 2.05
22.Transport and storage 4.27 4.40 3.93 3.02
23.Post and telecommunications 1.62 1.72 2.50 1.95
24.Financial intermediation 4.22 7.77 8.58 6.51
25.Real estate activities 5.09 6.42 8.88 8.86
26.Renting of m&eq and other business activities 1.70 2.02 3.39 4.88
27.Public admin and defence; Compulsory social security 9.01 9.29 8.16 7.48
28.Education 2.74 3.06 4.22 4.74
29.Health and social work 0.75 1.60 2.63 3.09
30.Other community, social and personal services 3.22 3.51 3.87 4.55
31.Private households with employed persons 0.47 0.61 0.71 0.80

18
Table3: Growth of Industry Value Added by Period
unit:%
Sector Industry number and name 1982-1990 1991-2000 2001-2010 1982-2010
Secondary 1.Agriculture, hunting and forestry 3.36 1.35 0.85 1.80
2.Mining and quarrying -2.97 5.83 2.20 1.85
3.Food products, beverages and tobacco 6.62 0.26 1.24 2.57
4.Textiles, textile products, leather and footwear 5.02 -0.23 -5.37 -0.37
5.Wood and products of wood and cork 4.76 -7.36 1.29 -0.62
6.Pulp, paper, paper products, printing and publishing 7.77 2.72 1.54 3.88
7.Coke, refined petroleum products and nuclear fuel 8.52 10.34 0.56 6.40
8.Chemicals and chemical products 11.26 6.18 6.57 7.89
9.Rubber and plastics products 14.26 3.33 -2.89 4.58
10.Other non-metallic mineral products 8.10 1.23 -1.01 2.59
11.Basic metals and fabricated metal products 13.31 7.27 2.22 7.40
12.Machinery, nec 12.89 7.60 3.69 7.89
13.Electrical and optical equipment 12.54 12.73 6.62 10.56
14.Transport equipment 10.04 4.05 0.84 4.80
15.Manufacturing nec; Recycling 6.24 1.80 -1.65 1.99
16.Electricity, gas and water supply 7.82 5.34 -1.26 3.83
Tertiary 17.Construction 7.58 4.87 1.89 4.68
18.Sale, maintenance and repair of motor vehicles 12.40 7.64 2.13 7.21
19.Wholesale trade and commission trade 10.03 12.57 4.46 8.98
20.Retail trade, except of motor vehicles and motorcycles 9.89 10.34 2.52 7.50
21.Hotel and restaurants 16.77 10.64 2.76 9.83
22.Transport and storage 10.24 7.31 0.33 5.81
23.Post and telecommunications 10.62 12.16 0.46 7.65
24.Financial intermediation 16.70 9.44 0.19 8.50
25.Real estate activities 12.50 11.69 2.93 8.92
26.Renting of m&eq and other business activities 11.85 13.61 6.60 10.65
27.Public admin and defence; Compulsory social security 10.26 7.15 2.07 6.36
28.Education 11.15 11.66 4.11 8.90
29.Health and social work 18.35 13.41 4.55 11.89
30.Other community, social and personal services 10.87 9.43 4.57 8.20
31.Private households with employed persons 12.81 9.97 4.16 8.85

19
Table 4: Growth of Industry Gross Output by Period
unit:%
Sector Industry number and name 1982-1990 1991-2000 2001-2010 1982-2010
Secondary 1.Agriculture, hunting and forestry 3.96 -0.25 -0.99 0.80
2.Mining and quarrying 0.45 0.01 -0.26 0.05
3.Food products, beverages and tobacco 5.36 0.27 0.04 1.77
4.Textiles, textile products, leather and footwear 3.09 -1.04 -3.53 -0.62
5.Wood and products of wood and cork 1.09 -8.31 -1.29 -2.97
6.Pulp, paper, paper products, printing and publishing 6.06 1.97 1.17 2.96
7.Coke, refined petroleum products and nuclear fuel 4.12 4.99 2.64 3.91
8.Chemicals and chemical products 9.15 7.57 5.35 7.30
9.Rubber and plastics products 12.81 3.32 -2.16 4.38
10.Other non-metallic mineral products 6.46 3.13 -0.33 2.97
11.Basic metals and fabricated metal products 9.90 7.74 0.49 5.91
12.Machinery, nec 11.85 7.21 4.35 7.67
13.Electrical and optical equipment 12.96 13.91 8.98 11.92
14.Transport equipment 8.56 3.89 2.30 4.79
15.Manufacturing nec; Recycling 6.40 0.19 -1.09 1.67
16.Electricity, gas and water supply 7.17 7.04 2.19 5.41
Tertiary 17.Construction 6.59 4.18 -0.68 3.25
18.Sale, maintenance and repair of motor vehicles 12.30 3.60 2.08 5.78
19.Wholesale trade and commission trade 9.00 7.95 4.24 7.00
20.Retail trade, except of motor vehicles and motorcycles 7.88 6.80 2.44 5.63
21.Hotel and restaurants 14.86 7.85 1.75 7.92
22.Transport and storage 7.43 6.80 1.93 5.32
23.Post and telecommunications 11.26 16.10 4.15 10.47
24.Financial intermediation 15.93 6.94 1.55 7.87
25.Real estate activities 9.66 6.91 2.64 6.29
26.Renting of m&eq and other business activities 9.16 11.35 4.69 8.38
27.Public admin and defence; Compulsory social security 7.58 2.55 0.23 3.31
28.Education 7.86 8.23 3.37 6.44
29.Health and social work 14.86 9.45 2.25 8.65
30.Other community, social and personal services 8.91 7.19 3.81 6.56
31.Private households with employed persons 9.79 5.74 3.30 6.16

20
Table 5: Growth of Industry Labor Input (HEMP) by Period
unit:%
Sector Industry number and name 1982-2010 1982-1990 1991-2000 2001-2010
Secondary 1.Agriculture, hunting and forestry -3.21 -2.02 -4.18 -3.30
2.Mining and quarrying -8.38 -10.76 -6.22 -8.41
3.Food products, beverages and tobacco -0.99 -0.70 -2.05 -0.18
4.Textiles, textile products, leather and footwear -4.18 -2.37 -5.07 -4.92
5.Wood and products of wood and cork -5.34 -2.67 -9.34 -3.73
6.Pulp, paper, paper products, printing and publishing 1.07 3.60 0.30 -0.44
7.Coke, refined petroleum products and nuclear fuel 0.72 5.78 -3.52 0.40
8.Chemicals and chemical products 0.81 2.14 1.44 -1.03
9.Rubber and plastics products 0.02 2.19 0.08 -2.00
10.Other non-metallic mineral products -1.69 -0.65 -1.59 -2.73
11.Basic metals and fabricated metal products 2.28 4.58 1.74 0.75
12.Machinery, nec 2.01 3.17 1.89 1.08
13.Electrical and optical equipment 3.03 3.84 3.43 1.92
14.Transport equipment 0.45 1.91 0.11 -0.52
15.Manufacturing nec; Recycling -2.73 1.68 -5.24 -4.20
16.Electricity, gas and water supply 0.06 1.58 -0.31 -0.94
Tertiary 17.Construction 0.26 -0.25 1.54 -0.56
18.Sale, maintenance and repair of motor vehicles 1.32 5.05 0.96 -1.69
19.Wholesale trade and commission trade 3.54 5.02 5.96 -0.21
20.Retail trade, except of motor vehicles and motorcycles 0.25 -1.37 2.46 -0.49
21.Hotel and restaurants 3.32 4.73 2.25 3.14
22.Transport and storage 0.01 1.35 0.55 -1.73
23.Post and telecommunications 1.05 3.13 1.20 -0.98
24.Financial intermediation 4.20 9.47 4.25 -0.58
25.Real estate activities 5.83 9.08 7.03 1.71
26.Renting of m&eq and other business activities 6.48 5.51 5.70 8.15
27.Public admin and defence; Compulsory social security 1.43 2.76 0.23 1.43
28.Education 2.92 3.83 3.84 1.18
29.Health and social work 5.70 8.17 4.89 4.29
30.Other community, social and personal services 1.54 3.00 1.96 -0.19
31.Private households with employed persons 2.22 0.42 2.67 3.40
21
Table 6: Growth of Industry Capital Stock by Period
unit:%
Sector Industry number and name 1982-2010 1982-1990 1991-2000 2001-2010
Secondary 1.Agriculture, hunting and forestry 2.48 1.65 1.86 3.85
2.Mining and quarrying -6.55 -3.82 -0.09 -15.46
3.Food products, beverages and tobacco 7.31 8.06 6.90 7.05
4.Textiles, textile products, leather and footwear 3.57 4.30 0.20 6.29
5.Wood and products of wood and cork 0.32 1.43 -5.68 5.31
6.Pulp, paper, paper products, printing and publishing 5.47 9.59 1.44 5.78
7.Coke, refined petroleum products and nuclear fuel 4.06 4.08 2.46 5.63
8.Chemicals and chemical products 7.34 7.70 7.20 7.16
9.Rubber and plastics products 5.14 7.03 2.33 6.23
10.Other non-metallic mineral products 5.51 5.34 4.68 6.49
11.Basic metals and fabricated metal products 4.06 7.13 0.63 4.73
12.Machinery, nec 7.43 10.55 5.61 6.43
13.Electrical and optical equipment 11.29 12.23 13.96 7.78
14.Transport equipment 5.50 7.28 3.10 6.29
15.Manufacturing nec; Recycling 4.53 9.45 -0.64 5.29
16.Electricity, gas and water supply 4.47 5.40 4.82 3.29
Tertiary 17.Construction 4.39 5.96 5.62 1.74
18.Sale, maintenance and repair of motor vehicles 3.62 7.41 2.39 1.45
19.Wholesale trade and commission trade 3.41 4.97 3.14 2.27
20.Retail trade, except of motor vehicles and motorcycles 1.83 2.10 1.72 1.71
21.Hotel and restaurants 4.14 5.84 5.44 1.31
22.Transport and storage 4.09 5.70 4.73 2.00
23.Post and telecommunications 3.90 3.28 6.44 1.93
24.Financial intermediation 7.05 10.30 8.70 2.46
25.Real estate activities 17.97 12.52 35.68 5.16
26.Renting of m&eq and other business activities 7.12 3.40 14.68 2.90
27.Public admin and defence; Compulsory social security 5.59 10.69 5.37 1.21
28.Education 9.14 11.53 11.89 4.24
29.Health and social work 7.12 9.31 10.03 2.23
30.Other community, social and personal services 7.23 12.68 7.65 1.91
31.Private households with employed persons 3.69 1.41 7.67 1.76
22
Table 7: Growth of Industry TFP by Subperiod
unit:%
Sector Industry number and name 1982-2010 1982-1990 1991-2000 2001-2010
Secondary 1.Agriculture, hunting and forestry 0.75 1.13 0.80 0.35
2.Mining and quarrying 1.96 1.77 0.06 4.03
3.Food products, beverages and tobacco -0.91 -0.46 -0.76 -1.48
4.Textiles, textile products, leather and footwear -0.32 0.03 -0.29 -0.66
5.Wood and products of wood and cork 0.46 0.85 0.78 -0.33
6.Pulp, paper, paper products, printing and publishing -0.04 -0.97 0.37 0.38
7.Coke, refined petroleum products and nuclear fuel 0.75 0.72 1.39 0.14
8.Chemicals and chemical products 0.56 0.76 0.70 0.25
9.Rubber and plastics products 0.66 2.00 0.44 -0.32
10.Other non-metallic mineral products 0.60 1.10 0.77 -0.03
11.Basic metals and fabricated metal products 0.74 1.05 1.43 -0.22
12.Machinery, nec 0.73 0.97 0.70 0.55
13.Electrical and optical equipment 1.39 0.60 1.28 2.20
14.Transport equipment 0.04 0.22 0.00 -0.09
15.Manufacturing nec; Recycling 0.09 -0.16 1.19 -0.78
16.Electricity, gas and water supply 1.25 1.95 1.49 0.39
Tertiary 17.Construction 0.06 0.62 -0.22 -0.16
18.Sale, maintenance and repair of motor vehicals 1.77 2.02 1.99 1.32
19.Wholesale trade and commission trade 2.46 2.83 2.26 2.34
20.Retail trade, except of motor vehicals and motorcycles 2.92 4.53 3.69 0.69
21.Hotel and restaurants 2.06 4.51 1.82 0.09
22.Transport and storage 1.15 1.57 1.45 0.47
23.Post and telecommunications 5.69 6.08 8.72 2.31
24.Financial intermediation 1.06 3.94 -0.35 -0.13
25.Real estate activities -7.64 -2.00 -18.81 -1.55
26.Renting of m&eq and other business activities 0.80 1.83 0.26 0.40
27.Public admin and defence; Compulsory social security 0.87 1.24 1.71 -0.31
28.Education 1.50 0.36 2.13 1.42
29.Health and social work 1.34 3.49 1.34 -0.59
30.Other community, social and personal services 0.16 -1.56 0.18 1.68
31.Private households with employed persons 2.52 8.51 -1.44 1.09
23
Table 6a: Sources of Industry Output Growth (in growth rate): 1982-2010
Sector Industry number and name GO ConK ConL ConE ConM ConS ConII TFP
Secondary 1.Agriculture, hunting and forestry 0.80 0.44 -0.95 0.01 0.21 0.33 0.55 0.75
2.Mining and quarrying 0.05 -2.50 -0.63 0.07 0.87 0.28 1.22 1.96
3.Food products, beverages and tobacco 1.77 1.38 -0.09 0.04 0.81 0.55 1.39 -0.91
4.Textiles, textile products, leather and footwear -0.62 0.35 -0.72 -0.01 -0.12 0.20 0.07 -0.32
5.Wood and products of wood and cork -2.97 0.04 -1.24 -0.16 -1.66 -0.57 -2.38 0.46
6.Pulp, paper, paper products, printing and publishing 2.96 0.69 0.13 0.13 1.13 0.92 2.18 -0.04
7.Coke, refined petroleum products and nuclear fuel 3.91 0.85 -0.01 1.07 0.69 0.56 2.32 0.75
8.Chemicals and chemical products 7.30 1.13 0.05 0.28 4.39 0.88 5.55 0.56
9.Rubber and plastics products 4.38 0.45 -0.01 0.11 2.44 0.71 3.27 0.66
10.Other non-metallic mineral products 2.97 0.90 -0.27 0.01 1.02 0.72 1.75 0.60
11.Basic metals and fabricated metal products 5.91 0.44 0.28 0.12 3.38 0.94 4.44 0.74
12.Machinery, nec 7.67 0.41 0.38 0.07 4.28 1.77 6.12 0.73
13.Electrical and optical equipment 11.92 1.50 0.33 0.22 5.83 2.64 8.70 1.39
14.Transport equipment 4.79 0.88 0.04 0.05 2.77 1.01 3.83 0.04
15.Manufacturing nec; Recycling 1.67 0.96 -0.45 0.00 0.53 0.54 1.08 0.09
16.Electricity, gas and water supply 5.41 1.89 -0.02 1.06 0.72 0.51 2.28 1.25
Tertiary 17.Construction 3.25 0.59 0.06 0.00 1.79 0.75 2.54 0.06
18.Sale, maintenance and repair of motor vehicles 5.78 0.77 0.75 0.10 1.15 1.24 2.48 1.77
19.Wholesale trade and commission trade 7.00 1.14 1.18 0.06 0.30 1.85 2.21 2.46
20.Retail trade, except of motor vehicles and motorcycles 5.63 0.70 0.10 0.15 0.31 1.46 1.92 2.92
21.Hotel and restaurants 7.92 1.22 0.75 0.56 1.58 1.76 3.90 2.06
22.Transport and storage 5.32 1.29 0.03 0.03 1.15 1.67 2.85 1.15
23.Post and telecommunications 10.47 1.87 0.36 0.13 0.69 1.73 2.55 5.69
24.Financial intermediation 7.87 3.65 1.09 0.02 0.18 1.88 2.08 1.06
25.Real estate activities 6.29 12.37 0.19 0.01 0.60 0.76 1.37 -7.64
26.Renting of m&eq and other business activities 8.38 1.85 1.98 0.07 1.33 2.35 3.75 0.80
27.Public admin and defence; Compulsory social security 3.31 0.65 0.72 0.01 0.25 0.81 1.07 0.87
28.Education 6.44 0.46 2.39 0.16 0.54 0.60 1.29 1.50
29.Health and social work 8.65 1.79 1.87 0.21 1.79 1.65 3.64 1.34
30.Other community, social and personal services 6.56 3.13 0.22 0.14 0.85 2.05 3.05 0.16
31.Private households with employed persons 6.16 3.22 0.42 0.00 0.00 0.00 0.00 2.52 Note: GO means gross output; ConK, ConL and ConII mean contribution of capital, labor and intermediate inputs on
gross output.
24
Table 6b: Sources of Industry Output Growth (in % share): 1982-2010 unit:%
Sector Industry number and name GO ConK ConL ConE ConM ConS ConII TFP
Secondary 1.Agriculture, hunting and forestry 100.00 55.57 -118.20 1.44 26.53 41.08 69.05 93.58
2.Mining and quarrying 100.00 -4635.76 -1157.9 128.42 1612.2 522.44 2263.0 3630.6
3.Food products, beverages and tobacco 100.00 77.92 -5.04 2.10 45.73 31.05 78.88 -51.76
4.Textiles, textile products, leather and footwear 100.00 -56.98 116.37 1.57 19.03 -31.88 -11.28 51.89
5.Wood and products of wood and cork 100.00 -1.38 41.86 5.34 55.74 19.02 80.11 -15.63
6.Pulp, paper, paper products, printing and publishing 100.00 23.45 4.42 4.39 38.18 31.08 73.64 -1.50
7.Coke, refined petroleum products and nuclear fuel 100.00 21.76 -0.28 27.33 17.65 14.34 59.31 19.21
8.Chemicals and chemical products 100.00 15.45 0.75 3.87 60.20 12.05 76.12 7.67
9.Rubber and plastics products 100.00 10.35 -0.23 2.54 55.85 16.33 74.72 15.16
10.Other non-metallic mineral products 100.00 30.14 -9.10 0.27 34.27 24.23 58.77 20.19
11.Basic metals and fabricated metal products 100.00 7.43 4.81 2.04 57.28 15.91 75.23 12.54
12.Machinery, nec 100.00 5.37 4.99 0.96 55.85 23.08 79.89 9.56
13.Electrical and optical equipment 100.00 12.55 2.80 1.86 48.94 22.18 72.98 11.66
14.Transport equipment 100.00 18.40 0.84 1.08 57.86 21.06 80.00 0.76
15.Manufacturing nec; Recycling 100.00 57.23 -26.90 0.08 31.91 32.31 64.30 5.37
16.Electricity, gas and water supply 100.00 34.90 -0.30 19.59 13.27 9.36 42.23 23.17
Tertiary 17.Construction 100.00 18.09 1.78 0.12 55.05 23.08 78.25 1.88
18.Sale, maintenance and repair of motor vehicles 100.00 13.39 13.03 1.73 19.83 21.41 42.98 30.60
19.Wholesale trade and commission trade 100.00 16.33 16.81 0.85 4.35 26.45 31.64 35.22
20.Retail trade, except of motor vehicles and motorcycles 100.00 12.46 1.75 2.67 5.45 25.90 34.02 51.77
21.Hotel and restaurants 100.00 15.34 9.51 7.01 19.91 22.27 49.19 25.96
22.Transport and storage 100.00 24.24 0.55 0.50 21.63 31.46 53.58 21.63
23.Post and telecommunications 100.00 17.89 3.46 1.24 6.60 16.51 24.34 54.31
24.Financial intermediation 100.00 46.33 13.84 0.20 2.25 23.94 26.39 13.44
25.Real estate activities 100.00 196.66 3.02 0.18 9.55 12.02 21.76 -121.44
26.Renting of m&eq and other business activities 100.00 22.08 23.66 0.80 15.87 28.08 44.75 9.50
27.Public admin and defence; Compulsory social security 100.00 19.66 21.75 0.42 7.54 24.41 32.37 26.22
28.Education 100.00 7.10 37.09 2.46 8.32 9.26 20.04 23.21
29.Health and social work 100.00 20.73 21.64 2.43 20.66 19.04 42.13 15.50
30.Other community, social and personal services 100.00 47.79 3.35 2.20 12.93 31.32 46.45 2.41
31.Private households with employed persons 100.00 52.23 6.86 0.00 0.00 0.00 0.00 40.92 Note: GO means gross output; ConK, ConL and ConII mean contribution of capital, labor and intermediate inputs on gross output.
25
Table 7a: Sources of Industry Output Growth (in growth rate): 1982-1990
Sector Industry number and name GO ConK ConL ConE ConM ConS ConII TFP
Secondary 1.Agriculture, hunting and forestry 3.96 0.37 -0.57 0.04 2.21 0.77 3.03 1.13
2.Mining and quarrying 0.45 -1.81 -1.19 -0.11 1.36 0.43 1.68 1.77
3.Food products, beverages and tobacco 5.36 1.70 -0.04 0.07 3.32 0.77 4.16 -0.46
4.Textiles, textile products, leather and footwear 3.09 0.58 -0.45 0.09 2.39 0.44 2.92 0.03
5.Wood and products of wood and cork 1.09 0.16 -0.60 0.14 -0.51 1.05 0.68 0.85
6.Pulp, paper, paper products, printing and publishing 6.06 1.45 0.50 0.24 3.41 1.44 5.08 -0.97
7.Coke, refined petroleum products and nuclear fuel 4.12 0.49 0.14 2.27 -0.98 1.48 2.77 0.72
8.Chemicals and chemical products 9.15 1.34 0.14 0.23 5.76 0.93 6.92 0.76
9.Rubber and plastics products 12.81 0.70 0.37 0.26 7.99 1.48 9.73 2.00
10.Other non-metallic mineral products 6.46 0.97 -0.12 0.41 2.48 1.62 4.51 1.10
11.Basic metals and fabricated metal products 9.90 0.90 0.56 0.24 5.78 1.38 7.39 1.05
12.Machinery, nec 11.85 0.45 0.65 0.12 7.68 1.98 9.78 0.97
13.Electrical and optical equipment 12.96 1.53 0.45 0.20 8.20 1.99 10.38 0.60
14.Transport equipment 8.56 1.26 0.24 0.11 5.92 0.82 6.85 0.22
15.Manufacturing nec; Recycling 6.40 1.98 0.13 0.08 3.28 1.10 4.46 -0.16
16.Electricity, gas and water supply 7.17 2.75 0.10 1.83 -0.45 0.99 2.37 1.95
Tertiary 17.Construction 6.59 0.99 -0.03 0.01 3.91 1.09 5.01 0.62
18.Sale, maintenance and repair of motor vehicles 12.30 1.32 2.57 0.24 3.55 2.60 6.38 2.02
19.Wholesale trade and commission trade 9.00 1.64 1.47 0.04 0.61 2.42 3.07 2.83
20.Retail trade, except of motor vehicles and motorcycles 7.88 0.62 -0.56 0.17 1.09 2.03 3.29 4.53
21.Hotel and restaurants 14.86 1.58 1.19 1.83 2.77 2.98 7.58 4.51
22.Transport and storage 7.43 1.75 0.24 0.01 1.43 2.44 3.88 1.57
23.Post and telecommunications 11.26 1.79 1.01 0.15 1.21 1.02 2.37 6.08
24.Financial intermediation 15.93 5.45 2.46 0.04 0.60 3.44 4.08 3.94
25.Real estate activities 9.66 8.50 0.22 0.01 2.45 0.49 2.95 -2.00
26.Renting of m&eq and other business activities 9.16 1.09 1.85 0.04 2.14 2.21 4.39 1.83
27.Public admin and defence; Compulsory social security 7.58 0.99 1.34 0.18 1.38 2.44 4.00 1.24
28.Education 7.86 0.60 3.33 0.28 0.85 0.49 1.62 0.36
29.Health and social work 14.86 1.86 2.99 0.27 4.23 2.02 6.51 3.49
30.Other community, social and personal services 8.91 5.88 0.42 0.27 1.42 2.48 4.17 -1.56
31.Private households with employed persons 9.79 1.19 0.10 0.00 0.00 0.00 0.00 8.51 Note: GO means gross output; ConK, ConL and ConII mean contribution of capital, labor and intermediate inputs on
gross output.
26
Table 7b: Sources of Industry Output Growth (in % share): 1982-1990 unit:%
Sector Industry number and name GO ConK ConL ConE ConM ConS ConII TFP
Secondary 1.Agriculture, hunting and forestry 100.00 9.28 -14.42 1.07 55.98 19.49 76.54 28.60
2.Mining and quarrying 100.00 -398.34 -262.07 -23.87 300.54 94.09 370.76 389.65
3.Food products, beverages and tobacco 100.00 31.73 -0.77 1.28 62.01 14.35 77.65 -8.61
4.Textiles, textile products, leather and footwear 100.00 18.93 -14.46 2.81 77.44 14.40 94.64 0.89
5.Wood and products of wood and cork 100.00 14.85 -54.92 12.75 -46.40 96.24 62.58 77.48
6.Pulp, paper, paper products, printing and publishing 100.00 23.90 8.29 3.91 56.23 23.71 83.84 -16.03
7.Coke, refined petroleum products and nuclear fuel 100.00 11.96 3.36 55.05 -23.71 35.81 67.15 17.53
8.Chemicals and chemical products 100.00 14.60 1.48 2.49 62.99 10.16 75.64 8.27
9.Rubber and plastics products 100.00 5.48 2.91 2.04 62.39 11.54 75.97 15.64
10.Other non-metallic mineral products 100.00 14.98 -1.82 6.28 38.40 25.07 69.75 17.08
11.Basic metals and fabricated metal products 100.00 9.12 5.62 2.39 58.37 13.90 74.65 10.62
12.Machinery, nec 100.00 3.81 5.51 1.01 64.78 16.71 82.51 8.18
13.Electrical and optical equipment 100.00 11.77 3.46 1.56 63.23 15.31 80.10 4.66
14.Transport equipment 100.00 14.67 2.82 1.28 69.12 9.59 79.99 2.52
15.Manufacturing nec; Recycling 100.00 30.92 2.04 1.30 51.19 17.12 69.61 -2.58
16.Electricity, gas and water supply 100.00 38.38 1.33 25.49 -6.23 13.83 33.09 27.21
Tertiary 17.Construction 100.00 15.06 -0.51 0.16 59.30 16.55 76.01 9.44
18.Sale, maintenance and repair of motor vehicles 100.00 10.73 20.91 1.97 28.84 21.11 51.91 16.45
19.Wholesale trade and commission trade 100.00 18.18 16.34 0.39 6.79 26.89 34.07 31.42
20.Retail trade, except of motor vehicles and motorcycles 100.00 7.85 -7.05 2.14 13.88 25.72 41.74 57.46
21.Hotel and restaurants 100.00 10.64 8.02 12.29 18.63 20.07 50.99 30.35
22.Transport and storage 100.00 23.48 3.17 0.07 19.26 32.89 52.22 21.12
23.Post and telecommunications 100.00 15.92 8.99 1.29 10.72 9.05 21.07 54.02
24.Financial intermediation 100.00 34.22 15.47 0.28 3.74 21.58 25.59 24.72
25.Real estate activities 100.00 87.94 2.27 0.15 25.31 5.04 30.51 -20.73
26.Renting of m&eq and other business activities 100.00 11.88 20.21 0.47 23.32 24.17 47.96 19.95
27.Public admin and defence; Compulsory social security 100.00 13.11 17.69 2.36 18.23 32.20 52.79 16.41
28.Education 100.00 7.63 42.39 3.54 10.76 6.27 20.56 4.59
29.Health and social work 100.00 12.54 20.15 1.79 28.48 13.57 43.84 23.48
30.Other community, social and personal services 100.00 65.96 4.77 3.04 15.93 27.83 46.80 -17.52
31.Private households with employed persons 100.00 12.13 0.98 0.00 0.00 0.00 0.00 86.89 Note: GO means gross output; ConK, ConL and ConII mean contribution of capital, labor and intermediate inputs on
gross output.
27
Table 8a: Sources of Industry Output Growth (in growth rate): 1991-2000
Sector Industry number and name GO ConK ConL ConE ConM ConS ConII TFP
Secondary 1.Agriculture, hunting and forestry -0.25 0.36 -1.27 0.00 -0.55 0.41 -0.13 0.80
2.Mining and quarrying 0.01 0.16 -0.42 0.09 0.09 0.03 0.21 0.06
3.Food products, beverages and tobacco 0.27 1.23 -0.18 0.01 -0.61 0.58 -0.02 -0.76
4.Textiles, textile products, leather and footwear -1.04 0.02 -0.88 0.00 -0.46 0.56 0.10 -0.29
5.Wood and products of wood and cork -8.31 -0.32 -2.06 -0.47 -4.29 -1.85 -6.61 0.78
6.Pulp, paper, paper products, printing and publishing 1.97 0.11 0.07 0.37 -0.26 1.32 1.43 0.37
7.Coke, refined petroleum products and nuclear fuel 4.99 0.89 -0.14 1.35 1.18 0.32 2.85 1.39
8.Chemicals and chemical products 7.57 1.15 0.14 0.58 3.06 1.94 5.58 0.70
9.Rubber and plastics products 3.32 0.26 0.02 0.28 1.05 1.27 2.60 0.44
10.Other non-metallic mineral products 3.13 0.87 -0.25 -0.19 0.88 1.04 1.74 0.77
11.Basic metals and fabricated metal products 7.74 0.06 0.27 0.22 3.90 1.86 5.98 1.43
12.Machinery, nec 7.21 0.31 0.42 0.09 3.45 2.16 5.71 0.70
13.Electrical and optical equipment 13.91 1.67 0.39 0.23 6.03 4.31 10.57 1.28
14.Transport equipment 3.89 0.48 0.01 0.02 1.84 1.54 3.40 0.00
15.Manufacturing nec; Recycling 0.19 -0.08 -0.87 -0.02 -0.61 0.58 -0.05 1.19
16.Electricity, gas and water supply 7.04 2.15 -0.03 1.02 1.52 0.88 3.43 1.49
Tertiary 17.Construction 4.18 0.64 0.35 0.00 1.98 1.42 3.41 -0.22
18.Sale, maintenance and repair of motor vehicles 3.60 0.48 0.49 0.02 -0.32 0.94 0.64 1.99
19.Wholesale trade and commission trade 7.95 0.93 2.14 0.05 -0.03 2.59 2.61 2.26
20.Retail trade, except of motor vehicles and motorcycles 6.80 0.52 0.91 0.11 -0.23 1.80 1.68 3.69
21.Hotel and restaurants 7.85 1.65 0.52 0.30 0.83 2.75 3.87 1.82
22.Transport and storage 6.80 1.55 0.14 0.08 1.02 2.56 3.66 1.45
23.Post and telecommunications 16.10 2.91 0.35 0.28 1.16 2.67 4.12 8.72
24.Financial intermediation 6.94 4.46 1.09 -0.01 -0.02 1.77 1.74 -0.35
25.Real estate activities 6.91 24.35 0.32 -0.01 0.11 0.94 1.04 -18.81
26.Renting of m&eq and other business activities 11.35 3.40 2.00 0.19 1.17 4.33 5.69 0.26
27.Public admin and defence; Compulsory social security 2.55 0.77 0.12 -0.09 -0.04 0.07 -0.05 1.71
28.Education 8.23 0.49 3.17 0.17 0.57 0.80 1.53 2.13
29.Health and social work 9.45 2.82 1.45 0.32 1.06 2.47 3.85 1.34
30.Other community, social and personal services 7.19 2.97 0.30 0.14 1.04 2.56 3.74 0.18
31.Private households with employed persons 5.74 6.74 0.44 0.00 0.00 0.00 0.00 -1.44 Note: GO means gross output; ConK, ConL and ConII mean contribution of capital, labor and intermediate inputs on
gross output.
28
Table 8b: Sources of Industry Output Growth (in % share): 1991-2000 unit:%
Sector Industry number and name GO ConK ConL ConE ConM ConS ConII TFP
Secondary 1.Agriculture, hunting and forestry 100.00 -143.39 512.18 -1.43 219.14 -165.22 52.49 -321.29
2.Mining and quarrying 100.00 1754.52 -4611.8 995.23 1000.5 342.90 2338.72 618.58
3.Food products, beverages and tobacco 100.00 460.27 -69.10 2.46 -227.01 216.79 -7.76 -283.41
4.Textiles, textile products, leather and footwear 100.00 -2.30 84.62 -0.02 44.41 -54.30 -9.91 27.59
5.Wood and products of wood and cork 100.00 3.86 24.83 5.65 51.62 22.27 79.54 -9.44
6.Pulp, paper, paper products, printing and publishing 100.00 5.40 3.40 18.61 -13.38 67.34 72.57 18.63
7.Coke, refined petroleum products and nuclear fuel 100.00 17.89 -2.85 26.96 23.59 6.51 57.06 27.89
8.Chemicals and chemical products 100.00 15.25 1.84 7.70 40.37 25.64 73.70 9.21
9.Rubber and plastics products 100.00 7.97 0.52 8.46 31.46 38.26 78.18 13.33
10.Other non-metallic mineral products 100.00 27.94 -8.12 -6.06 28.25 33.31 55.49 24.69
11.Basic metals and fabricated metal products 100.00 0.72 3.52 2.82 50.42 24.08 77.32 18.44
12.Machinery, nec 100.00 4.30 5.89 1.29 47.86 29.99 79.15 9.68
13.Electrical and optical equipment 100.00 12.00 2.82 1.64 43.33 31.00 75.97 9.20
14.Transport equipment 100.00 12.38 0.36 0.42 47.29 39.51 87.23 0.04
15.Manufacturing nec; Recycling 100.00 -43.30 -457.73 -12.21 -321.65 306.67 -27.19 628.21
16.Electricity, gas and water supply 100.00 30.53 -0.40 14.52 21.65 12.51 48.68 21.19
Tertiary 17.Construction 100.00 15.42 8.42 -0.02 47.53 34.03 81.55 -5.38
18.Sale, maintenance and repair of motor vehicles 100.00 13.19 13.71 0.60 -8.96 26.20 17.84 55.26
19.Wholesale trade and commission trade 100.00 11.75 26.94 0.57 -0.32 32.57 32.81 28.50
20.Retail trade, except of motor vehicles and motorcycles 100.00 7.58 13.41 1.59 -3.38 26.50 24.71 54.30
21.Hotel and restaurants 100.00 20.97 6.63 3.81 10.51 34.96 49.28 23.12
22.Transport and storage 100.00 22.77 2.07 1.18 14.94 37.68 53.80 21.35
23.Post and telecommunications 100.00 18.08 2.18 1.75 7.21 16.62 25.58 54.16
24.Financial intermediation 100.00 64.28 15.66 -0.11 -0.36 25.51 25.04 -4.98
25.Real estate activities 100.00 352.50 4.63 -0.10 1.55 13.64 15.09 -272.21
26.Renting of m&eq and other business activities 100.00 29.93 17.59 1.70 10.31 38.15 50.16 2.32
27.Public admin and defence; Compulsory social security 100.00 30.37 4.86 -3.47 -1.39 2.75 -2.12 66.88
28.Education 100.00 5.90 38.48 2.02 6.87 9.69 18.58 25.87
29.Health and social work 100.00 29.85 15.32 3.36 11.18 26.16 40.70 14.13
30.Other community, social and personal services 100.00 41.33 4.12 1.92 14.47 35.66 52.05 2.50
31.Private households with employed persons 100.00 117.40 7.62 0.00 0.00 0.00 0.00 -25.01 Note: GO means gross output; ConK, ConL and ConII mean contribution of capital, labor and intermediate inputs on gross output.

29
Table 9a: Sources of Industry Output Growth (in growth rate): 2001-2010
Sector Industry number and name GO ConK ConL ConE ConM ConS ConII TFP
Secondary 1.Agriculture, hunting and forestry -0.99 0.60 -0.95 -0.01 -0.83 -0.15 -0.99 0.35
2.Mining and quarrying -0.26 -5.79 -0.32 0.21 1.20 0.40 1.81 4.03
3.Food products, beverages and tobacco 0.04 1.23 -0.04 0.04 -0.04 0.32 0.32 -1.48
4.Textiles, textile products, leather and footwear -3.53 0.47 -0.80 -0.11 -2.03 -0.39 -2.53 -0.66
5.Wood and products of wood and cork -1.29 0.31 -1.00 -0.12 -0.06 -0.73 -0.91 -0.33
6.Pulp, paper, paper products, printing and publishing 1.17 0.60 -0.14 -0.20 0.48 0.05 0.33 0.38
7.Coke, refined petroleum products and nuclear fuel 2.64 1.13 -0.01 -0.29 1.70 -0.03 1.39 0.14
8.Chemicals and chemical products 5.35 0.91 -0.10 0.03 4.49 -0.23 4.30 0.25
9.Rubber and plastics products -2.16 0.42 -0.38 -0.19 -1.15 -0.53 -1.87 -0.32
10.Other non-metallic mineral products -0.33 0.85 -0.42 -0.15 -0.17 -0.41 -0.73 -0.03
11.Basic metals and fabricated metal products 0.49 0.40 0.05 -0.08 0.71 -0.37 0.26 -0.22
12.Machinery, nec 4.35 0.46 0.10 0.01 2.06 1.18 3.25 0.55
13.Electrical and optical equipment 8.98 1.29 0.17 0.23 3.51 1.57 5.31 2.20
14.Transport equipment 2.30 0.95 -0.11 0.04 0.87 0.65 1.56 -0.09
15.Manufacturing nec; Recycling -1.09 1.08 -0.56 -0.05 -0.79 0.00 -0.84 -0.78
16.Electricity, gas and water supply 2.19 0.85 -0.10 0.41 0.96 -0.30 1.06 0.39
Tertiary 17.Construction -0.68 0.17 -0.15 0.00 -0.31 -0.23 -0.54 -0.16
18.Sale, maintenance and repair of motor vehicles 2.08 0.58 -0.63 0.05 0.45 0.31 0.81 1.32
19.Wholesale trade and commission trade 4.24 0.91 -0.05 0.10 0.36 0.60 1.05 2.34
20.Retail trade, except of motor vehicles and motorcycles 2.44 0.96 -0.13 0.18 0.14 0.60 0.92 0.69
21.Hotel and restaurants 1.75 0.45 0.59 -0.33 1.26 -0.31 0.61 0.09
22.Transport and storage 1.93 0.62 -0.27 -0.01 1.03 0.09 1.11 0.47
23.Post and telecommunications 4.15 0.91 -0.21 -0.04 -0.24 1.42 1.14 2.31
24.Financial intermediation 1.55 1.21 -0.15 0.01 0.00 0.60 0.62 -0.13
25.Real estate activities 2.64 3.87 0.03 0.03 -0.57 0.81 0.27 -1.55
26.Renting of m&eq and other business activities 4.69 0.98 2.08 -0.04 0.76 0.50 1.22 0.40
27.Public admin and defence; Compulsory social security 0.23 0.22 0.76 -0.03 -0.48 0.08 -0.44 -0.31
28.Education 3.37 0.43 0.76 0.04 0.23 0.49 0.76 1.42
29.Health and social work 2.25 0.70 1.28 0.05 0.32 0.49 0.86 -0.59
30.Other community, social and personal services 3.81 0.83 -0.04 0.04 0.14 1.16 1.34 1.68
31.Private households with employed persons 3.30 1.52 0.70 0.00 0.00 0.00 0.00 1.09 Note: GO means gross output; ConK, ConL and ConII mean contribution of capital, labor and intermediate inputs on
gross output.
30
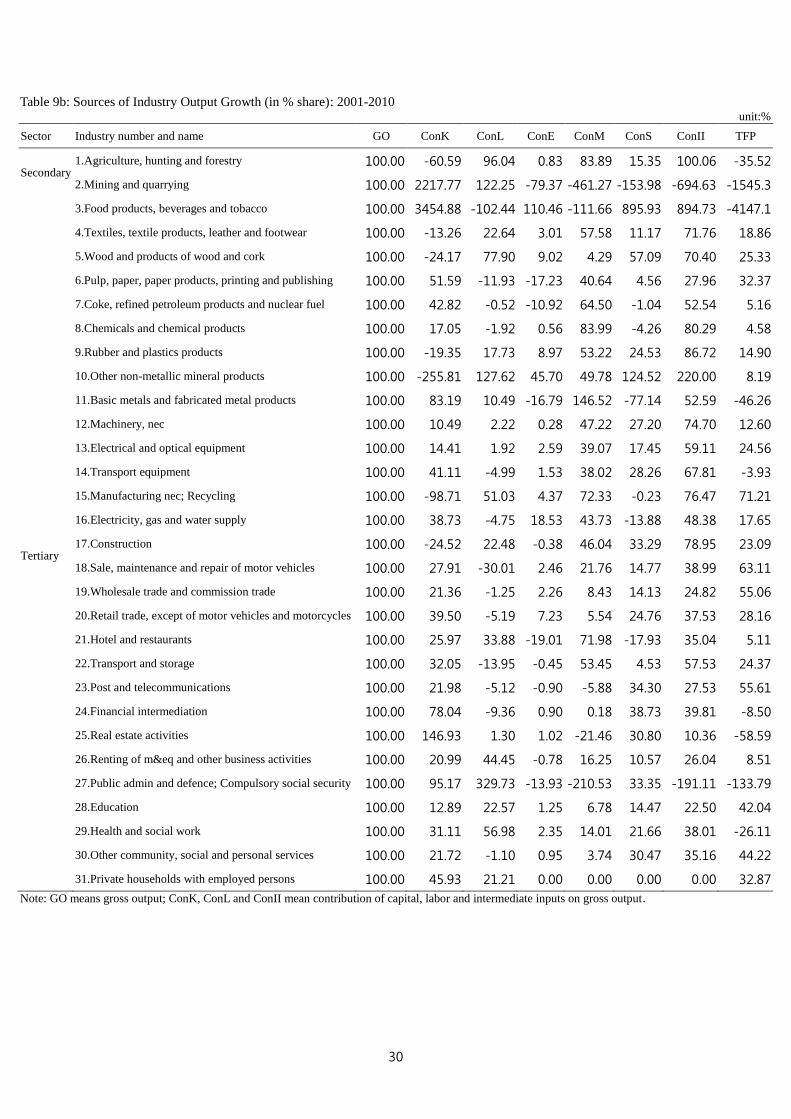
Table 9b: Sources of Industry Output Growth (in % share): 2001-2010 unit:%
Sector Industry number and name GO ConK ConL ConE ConM ConS ConII TFP
Secondary 1.Agriculture, hunting and forestry 100.00 -60.59 96.04 0.83 83.89 15.35 100.06 -35.52
2.Mining and quarrying 100.00 2217.77 122.25 -79.37 -461.27 -153.98 -694.63 -1545.3
3.Food products, beverages and tobacco 100.00 3454.88 -102.44 110.46 -111.66 895.93 894.73 -4147.1
4.Textiles, textile products, leather and footwear 100.00 -13.26 22.64 3.01 57.58 11.17 71.76 18.86
5.Wood and products of wood and cork 100.00 -24.17 77.90 9.02 4.29 57.09 70.40 25.33
6.Pulp, paper, paper products, printing and publishing 100.00 51.59 -11.93 -17.23 40.64 4.56 27.96 32.37
7.Coke, refined petroleum products and nuclear fuel 100.00 42.82 -0.52 -10.92 64.50 -1.04 52.54 5.16
8.Chemicals and chemical products 100.00 17.05 -1.92 0.56 83.99 -4.26 80.29 4.58
9.Rubber and plastics products 100.00 -19.35 17.73 8.97 53.22 24.53 86.72 14.90
10.Other non-metallic mineral products 100.00 -255.81 127.62 45.70 49.78 124.52 220.00 8.19
11.Basic metals and fabricated metal products 100.00 83.19 10.49 -16.79 146.52 -77.14 52.59 -46.26
12.Machinery, nec 100.00 10.49 2.22 0.28 47.22 27.20 74.70 12.60
13.Electrical and optical equipment 100.00 14.41 1.92 2.59 39.07 17.45 59.11 24.56
14.Transport equipment 100.00 41.11 -4.99 1.53 38.02 28.26 67.81 -3.93
15.Manufacturing nec; Recycling 100.00 -98.71 51.03 4.37 72.33 -0.23 76.47 71.21
16.Electricity, gas and water supply 100.00 38.73 -4.75 18.53 43.73 -13.88 48.38 17.65
Tertiary 17.Construction 100.00 -24.52 22.48 -0.38 46.04 33.29 78.95 23.09
18.Sale, maintenance and repair of motor vehicles 100.00 27.91 -30.01 2.46 21.76 14.77 38.99 63.11
19.Wholesale trade and commission trade 100.00 21.36 -1.25 2.26 8.43 14.13 24.82 55.06
20.Retail trade, except of motor vehicles and motorcycles 100.00 39.50 -5.19 7.23 5.54 24.76 37.53 28.16
21.Hotel and restaurants 100.00 25.97 33.88 -19.01 71.98 -17.93 35.04 5.11
22.Transport and storage 100.00 32.05 -13.95 -0.45 53.45 4.53 57.53 24.37
23.Post and telecommunications 100.00 21.98 -5.12 -0.90 -5.88 34.30 27.53 55.61
24.Financial intermediation 100.00 78.04 -9.36 0.90 0.18 38.73 39.81 -8.50
25.Real estate activities 100.00 146.93 1.30 1.02 -21.46 30.80 10.36 -58.59
26.Renting of m&eq and other business activities 100.00 20.99 44.45 -0.78 16.25 10.57 26.04 8.51
27.Public admin and defence; Compulsory social security 100.00 95.17 329.73 -13.93 -210.53 33.35 -191.11 -133.79
28.Education 100.00 12.89 22.57 1.25 6.78 14.47 22.50 42.04
29.Health and social work 100.00 31.11 56.98 2.35 14.01 21.66 38.01 -26.11
30.Other community, social and personal services 100.00 21.72 -1.10 0.95 3.74 30.47 35.16 44.22
31.Private households with employed persons 100.00 45.93 21.21 0.00 0.00 0.00 0.00 32.87 Note: GO means gross output; ConK, ConL and ConII mean contribution of capital, labor and intermediate inputs on gross output.
31
Figure 2: Industrial structure of Taiwan:1981-2010.
Figure 3a: Growth of Industry Value Added 1981-2010.
Figure 3b: Growth of Industry Value Added 1981-1990.
0.00%
10.00%
20.00%
30.00%
40.00%
50.00%
60.00%
70.00%
80.00%
19
81
19
83
19
85
19
87
19
89
19
91
19
93
19
95
19
97
19
99
20
01
20
03
20
05
20
07
20
09
Primary
Secondary
Tertiary
Manufacturing
32
Figure 3c: Growth of Industry Value Added 1991-2000.
Figure 3d: Growth of Industry Value Added 2001-2010.
Figure 4a: Growth of Industry Output 1982-2010.
33
Figure 4b: Growth of Industry Output 1982-1990.
Figure 4c: Growth of Industry Output 1991-2000.
Figure 4d: Growth of Industry Output 2001-2010.
34
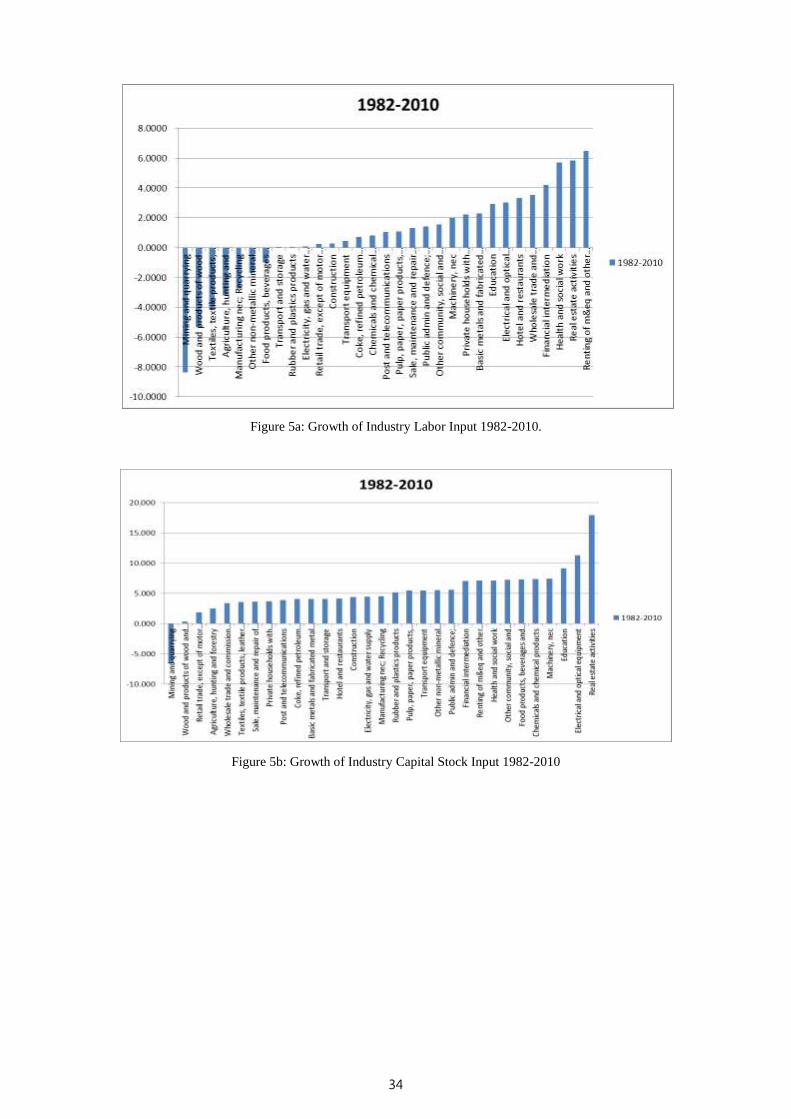
Figure 5a: Growth of Industry Labor Input 1982-2010.
Figure 5b: Growth of Industry Capital Stock Input 1982-2010

35
Figure 5c: Growth of Industry Energy Input 1982-2010.
Figure 5d: Growth of Industry Material Input 1982-2010.

36
Figure 5e: Growth of Industry Service Input 1982-2010.
Figure 6a: Growth of Industry TFP 1982-1990.

37
Figure 6b: Growth of Industry TFP 1991-2000.
Figure 6c: Growth of Industry TFP 2001-2010.

38
Figure 6d: Growth of Industry TFP 1982-2010.
Figure 7 Sources of Industry Output Growth (in growth rate): 1982-2010
-0.1
-0.05
0
0.05
0.1
0.15
0.2
1982-2010
TFP
ConS
ConM
ConE
ConL
ConK