Embed Size (px)
Citation preview

1
INDUSTRIAL POLLUTION AND ECONOMIC COMPENSATION
A STUDY OF DOWN STREAM VILLAGES IN NOYYAL RIVER, Tirupur, TAMIL NADU,
SOUTH INDIA

2
Contents
Chapter 1. Introduction...............................................................................................................5
Chapter 2. Background for awarding compensation ................................................................ 7 2.1 Industrial pollution ....................................................................................................... 7
2.2 Local communities action and legal proceedings .......................................................... 7 2.3 Court action .................................................................................................................. 8
Chapter: 3 Research Methodology ........................................................................................ 10
3.1 Source of Information ................................................................................................. 10
3.1.1 Analysis of water samples ....................................................................................... 10 3.1.2 Field Procedures .................................................................................................. 11
3.1.3 Analytical Work .................................................................................................. 11
3.2 Agricultural Sector ................................................................................................. 11
3.3 Relexive Comparison by Double Difference Method .................................................. 11 3.4 Selection of Villages ................................................................................................... 12
3.4.1 Profile of Sample Villages ....................................................................................... 14 3.5 Sampling Technique ................................................................................................... 16
3.6 Methods of Data Collection and Analysis ................................................................... 17
3.7 Implicated problems in Compensation Mechanism ..................................................... 18
Chapter 4. Formulation of compensation .............................................................................. 20 4.1 Polluter pays principle ................................................................................................ 20
4.2 Vellore tannery case ................................................................................................... 20
4.3 The principle of different class compensation for victims in Noyyal River .................. 21
Chapter 5. Description of Noyyal river and Orathapalayam reservoir ................................... 23 5.1.1 Noyyal River ....................................................................................................... 24
5.1.2 Orathapalayam Reservoir ..................................................................................... 24 5.2 Industrial pollution and loss of ecosystem services in Noyyal river ............................. 24
5.2.1 Pollution Load Generated by Tiruppur Textile Processing Units.......................... 25
5.3 Previous studies on ground water pollution in the region ............................................ 25
5.3.1 Ground Water Pollution ....................................................................................... 25 5.3.2 SURFACE WATER POLLUTION ........................................................................ 25
5.3.3 Cropping patterns of left and right main canals in Orathapalyam Reservoir.............. 25 5.3.4 Water and Soil quality standards……………………………………………………………..27
Chapter: 6 Impact of Pollution………………………………………………………………………...28
6.1. Water quality parameters in the five villages 2007 ......................................................... 28 6.1.2 Impact on Agriculture…………………………………………………………………………...29
6.1.3 Impact of pollution on agricultural productivity and area under cultivation for paddy…………32
6.1.4 Discussion………………………………………………………………………………………..36
6.2 Impact of Livestock………………………………………………………………………………..37
6.3 Impact on Employment…………………………………………………………………………….39
6.4 Problems in implementing the compensation mechanism……………………………………….. .41
3
6.4.1 Scope of damage assessed……………………………………………………………………... 41
6.4.2 Property rights over the environmental resources....................................................................... 41
6.4.3 Quantifying the benefits............................................................................................................... 42
6.4.4 Selection of the economic valuation technique............................................................................ 42
6.4.5 Limited scope of damage assessed……………………………………………………………… 43
6.5 Zero Discharge process in Tirupur................................................................................................... . 43
6.5.1 Dyers problems in paying compensation........................................................................................ 44
6.5.2 Large Dyeing Units………………………………………………………………………………. 44
6.5.3 Small Scale Dyeing Units………………………………………………………………………… 44
6.5.4 Medium Scale Dyeing Units……………………………………………………………………… 45
6.6 Regulatory Problems………………………………………………………………………………… 46
6.7 impact/Damage studies……………………………………………………………………………….46
Chapter:7 Final Evaluation………………………………………………………………………………..46
7.1 Water Pollution: Policy and Institutional failure…………………………………………………….. 46
7.2 Actions needed and Suggestions…………………………………………………………………….. 48
7.3 Dyers…………………………………………………………………………………………………. 49
7.4 References……………………………………………………………………………………………..49

4
Abstract
Tirupur is an Indian textile town which constitutes many dyeing and bleaching units situated in the
upstream. Tirupur serves as one of the major exporters of textiles. The industrial pollution have affected
not only the surface water but also the soils and ground water. This thesis studies the impacts of
industrial pollution on agriculture and livestock. It also explores the implicated problems involved in
putting an economic compensation mechanism into practise. The impact study was made on the
detailed primary data collected from an intensive study of comparing a pollution affected villages
located downstream of the Orathapalyam dam, Tamil Nadu, South India with a control village. The cost
estimates that the impact of industrial pollution on predominant crops is quite substantial in monetary
terms. This paper argues that the compensation principle might work if the assessment is done to all
affected victims. Both quantifying and non quantifying benefits should be incurred in the mechanism.
Further, mere passing of fines and creating institutional structures are not sufficient to address the
environmental problems. Policies should be implemented in their right perspective. Institutions should
be strong enough, with more autonomy and powers, to deal with problems and to monitor the RO
plants in dyeing units in Tirupur.

5
INTRODUCTION
Chapter: 1
Our world has seen essential and persistent change in the last 50 years. The increased economic growth
of the developing countries has bitterly affected the quality of the environment, which becomes a
menace to sustainable development (Nelliyat, 2007). In developing countries where environmental
regulation is fragile, the wastes from different sectors are randomly discharged in to the ecosystems.
(Appasamy and Nelliyat, 2007). The Millennium Ecosystem Assessment (2005) recently concluded that
most of the world’s ecosystems have already suffered major degradation. The most impact of pollution
is on air and water resources and associated ecosystems. Wastewater strategies are often not adequate
in many developing countries. Therefore the impact of wastewater on the receiving ecosystems is
radically high when there is accumulation of pollutants. In developing countries where formal regulation
is weak or absent informal regulation has resulted in the control of environmental externalities like
industrial pollution or forest degradation (Murty et al. 1999; World Bank, 1999). At times new model of
pollution control also emerges where market agents like producers, consumers, local communities, and
government have stimulus to work for the decline of environmental externalities (World Bank, 1999).
Noyyal River originates from the Vellingiri hills of the Coimbatore district, (Tamil Nadu, India). It passes
through Tirupur and it is stored up in the Orathapalayam Dam to be used in agriculture and drinking
purposes for the downstream villages in the Erode District. A large number of dyeing units are situated
in the upstream in and around Tirupur. They discharge their chemical and toxic effluents either directly
or indirectly in to the Noyyal River (Blomqvist, 1996). As a result all the irrigation wells along the river
and in the downstream villages have been polluted and the ecosystem has been adversely affected by
the seepage and percolation of water stored in the Orathapalayam dam. Eventually it affects the
agriculture, livestock rearing, and fisheries of the downstream farmers around the Orathapalayam dam
(Appasamy and Nelliyat, 2007). This water pollution causes serious impacts on socio-economic
prominence of the people living around the Orathapalayam dam. The local communities through the
Karur Noyyal Canal Agriculturists Association filed a PIL (Public Interest Litigation) against the polluters in

6
the Supreme Court to direct Tamil Nadu Pollution Control Board to regulate against the polluting dyeing
and bleaching units in Tirupur area (Eswaramoorthi et al, 2003). The Supreme Court based their ruling
on the Precautionary Principle and the Polluters Pay Principle to extend its statement to the dyeing units
to compensate the victims of the pollution along the Noyyal River and also to bear the cost of restoring
the environmental degradation (High Court of jurisdiction, 2006).
Even though industrial units have either constructed or connected to effluent treatment plants, the level
of treatment has not been satisfactory at most of the places. It has caused serious impact on agriculture,
livestock and fisheries. The most affected victims by this industrial pollution are six downstream villages;
these villages are situated around the Orathapalayam dam. The dam is situated downstream 20 kms
from Tirupur. But the economic value of compensation awarded to these villages was only based on
agricultural productivity. However, there is a chance that this kind of compensation based on
intervention of the Polluter Pay Principle (PPP) may also face problems if it fails to address the issues
properly if, (a) the environmental goals to be achieved by the PPP do not really address the
development-environment trade-off, that is industrial development versus environmental quality, (b) if
the mechanism outcome does not result in sufficiently compensating the victims of environmental
deterioration (Venkatachalam, 2005). The aim of the study is to focus on the impacts of water
pollution on ecosystem services (agriculture, livestock) in five downstream villages and to explore the
implicated problems involved in compensation mechanism. The main questions to be answered
include:
1. What is the impact of pollution of dyeing units on farming, and livestock rearing?
2. What problems have arisen within the compensation mechanism
The present case study has two folds. One fold portrays the socio economic prominence of the people
living in the downstream villages around the Orathapalayam dam. Another fold uncovers the problems
involved in compensation mechanism.

7
Chapter 2. Background for awarding compensation
2.1 Industrial pollution
During the post liberalization period of the Indian economy, the cotton and textile and garment
industries grew swiftly and account for a major share of Indian exports (Compendium of Textile
Statistics, 1999). The percentage of textiles in the total exports from India has increased and accounts
for 14% of the national industrial production and about 4% of GDP (Ministry of textiles, 1999). Tirupur, a
major knitwear centre in India, is holding more than 9000 small-scale units produce one-third of the
total apparel exports from India (Swaminathan and Jeyaranjan, 1995). The export earnings from Tirupur
during the year 2005-06 were about Rs.10, 250 crores (Nelliyat, 2007).
Wet processing (bleaching and dyeing) is a sub sector of the hosiery industry. There were 702 bleaching
and dyeing units in 2001. Presently there are 729 bleaching and dyeing units in Tirupur (p.c).The
majorities of the units are small in size and function as job workers1 for the hosiery industry. Out of the
729 wet processing units, 125 are located in Tirupur municipality and the remaining is extending out in
the adjacent villages. Most of the units are located on both sides of the Noyyal River which makes them
commodious to discharge the effluent in to the Noyyal River. Most of the chemicals used in the
processing are discharged as waste material which leads to high pollution load in the effluents. Water is
an inevitable contribution factor for textile processing. The quantity of water consumed by these
industries has increased to 86 Millions of Liters per Day (MLD) in 2000. Earlier the textile units suctioned
water from the Noyyal River or from their own wells. But during early 1990s the water quality in Tirupur
got degraded. The water needed for textile units was transported from surrounding villages through
tankers. This constant performance of the water market has affected the ground water availability of
the villages and ground water tables have been declined in many places. Currently the water both for
the industries and the Tirupur municipality is accessible through the Tirupur Area Development Projects’
water supply scheme to transport water from the Cauvery River (Nelliyat, 2007).
2.2 Local communities’ action and legal proceedings
The processing units in Tirupur generate around 83 Millions of Liters per Day (MLD) of effluents; these
effluents carry different chemicals used in different processing stages of the units. Due to the
continuous discharge of effluents, the agricultural lands along the Noyyal River basin have become
either partially or totally unfit for cultivation. The agriculturists felt that the industrial wastewater
coming from the dam is highly toxic and has caused a serious impact on the farming; livestock rearing.
1 Foot note (1): Doing contract jobs dyeing, knitting, stitching for textile units

8
Irrigation of agriculture with treated industrial effluents may lead to soil degradation (Appasamy, 2005).
The Karur Taluk Noyyal canal Agriculturists Association approached the Court to take action against the
dyeing units in Tirupur. By Court’s direction the Tamil Nadu Pollution Control Board directed the dyeing
units to set up the Common Effluents Treatment Plant (CETPs) (High Court of Jurdication, 2006).
The organizational strength of the Tamil Nadu Pollution Control Board was not able to remain awake
with the expansion of the textile industry in Tiruppur (Blomqvist, 1996). In spite of the final order passed
by the Court no movements were taken to execute the said order and no attempts were made to install
the necessary equipments for the treatment of effluents discharged in to the river. Consequently the
Association of agriculturists again approached the court to execute the dyeing units to clean the river
water stored at Orathapalayam dam within a specific time frame and to prevent further pollution of the
river. The Supreme Court directed the dyeing units to deposit 12.5 crores to clean up the Orathapalayam
dam. Further, the Court directed the Tamil Nadu Pollution Control Board to take necessary steps against
the dyeing units to prevent further degradation of Noyyal River basin. As the primary treatment was
barely insufficient to remove the TDS from the effluents the Tamil Nadu Pollution Control Board (TNPCB)
directed all the units in the Tirupur clusters to set up ‘Reverse Osmosis Plants’ to achieve ‘Zero Liquid
Discharge’. The Supreme Court of India based on the polluter pay’s principle stated in Noyyal River case
judgement that the dyeing units must compensate for the loss of ecology caused in the Noyyal River
(High Court of Judiciary, 2006).
2.3 Court action
The Supreme Court of India in its judgement in the Vellore Citizens Forum case held that ‘Precautionary
Principle’ and the ‘PPP’ (Polluter Pay Principle) are part of the environmental law of the Indian
Constitution. In the Vellore tannery case the court ordered the creation of a new agency, the Loss of
Ecology (Prevention and payments of Compensation) Authority for the State of Tamil Nadu to provide
compensation to those affected by pollution from tanneries. Subsequently, the court expanded the
jurisdiction of the Loss of Ecology Authority to cover all industries.
The central Government in the Ministry of Environment, and Forests, in compliance of the Supreme
Court order constituted the Loss of Ecology Authority. The loss of ecology Authority hunted the
assistance of Centre for Environmental Studies, Anna University, to evaluate the loss of ecology and
environment in the areas affected by the industries located in the Taluk of Tirupur and its vicinity as
responsible for the high Total Dissolved Solvents (TDS) content of the groundwater in the area. The
villages are classified based upon Total Dissolved Solvents (TDS) concentration in terms of electrical
conductivity in the ground water. The list of villages classified is provided in appendix 1. The entire

9
affected villages fall in the three districts of Coimbatore, Erode, and Karur (Loss of Ecology Authority for
the State of Tamil Nadu, 2004).
More than eighty villages along the Noyyal River have been affected by the effluents discharge of the
dyeing units in the upstream. The environmental impact on ground water, surface water, soil, fish and
natural ecosystem in these five villages Kathangani, Thambureddipalayam, Ganapathypalayam,
Orathapalayam, and Kodumanal are far above the ground. In these villages where ground water is the
only source of irrigation, farmers are not able to irrigate their crops. The compensation money awarded
was considered too low by the farmers and it has raised many criticisms. As a result these five villages
are chosen to investigate the impact of industrial pollution on agriculture, livestock, and to explore the
implicated problems in the compensation mechanism.

10
Chapter: 3 Research Methodology
The main steps undertaken were
1. The water samples were collected and analysis was done to substantiate the EC value.
2. Questionnaires were undertaken during a household survey.
Semi structured interviews were performed to explore the working of the compensation mechanism
One hundred respondents from 5 affected villages and twenty respondents from non-affected villages
were selected for this household survey which was conducted using pre-tested three questionnaires
during June and August 2007. Also two interviews with loss of ecology Authority, Vetenary doctors, and
Monitoring committee was conducted
3.1 Source of Information
The source of information includes written sources, interviews with key informants and field visits. The
written sources include published documents; unpublished documents produced by government
departments and also unpublished material of the farmer’s organization. The written sources were used
to obtain a background description of the region. Since one of my aims was to study the mechanism of
compensation from the point of view of the polluters and affected people both the polluters and the
affected farmers were the ideal sources of information.
3.1.1 Analysis of Water Samples
The ground water quality in wells in Kathangani, Thammureddipalayam, Ganapathypalayam,
Orathapalayam, and Kodumanal villages are analysed. As the Noyyal River has a high electrical
conductivity (EC) and high concentrations of Total Dissolved Solids (TDS) from Tirupur to the
Orathupalayam dam these two parameters were used as indicators of pollution.
11
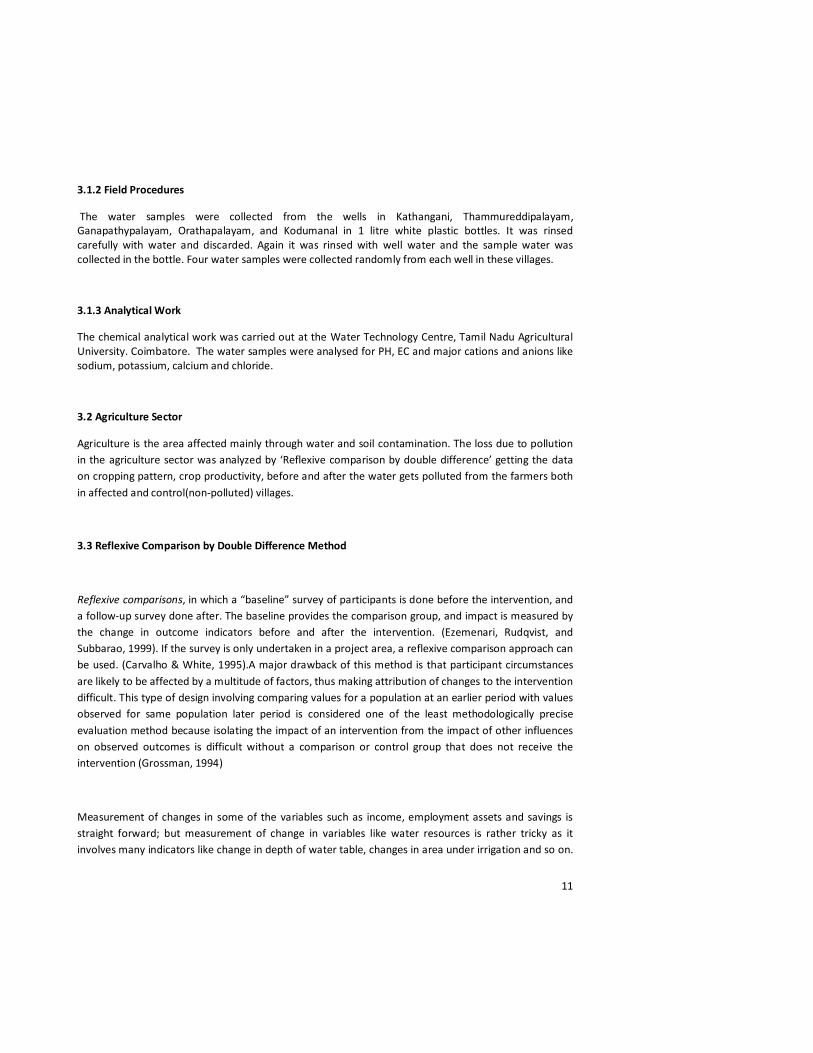
3.1.2 Field Procedures
The water samples were collected from the wells in Kathangani, Thammureddipalayam,
Ganapathypalayam, Orathapalayam, and Kodumanal in 1 litre white plastic bottles. It was rinsed
carefully with water and discarded. Again it was rinsed with well water and the sample water was
collected in the bottle. Four water samples were collected randomly from each well in these villages.
3.1.3 Analytical Work
The chemical analytical work was carried out at the Water Technology Centre, Tamil Nadu Agricultural
University. Coimbatore. The water samples were analysed for PH, EC and major cations and anions like
sodium, potassium, calcium and chloride.
3.2 Agriculture Sector
Agriculture is the area affected mainly through water and soil contamination. The loss due to pollution
in the agriculture sector was analyzed by ‘Reflexive comparison by double difference’ getting the data
on cropping pattern, crop productivity, before and after the water gets polluted from the farmers both
in affected and control(non-polluted) villages.
3.3 Reflexive Comparison by Double Difference Method
Reflexive comparisons, in which a “baseline” survey of participants is done before the intervention, and
a follow-up survey done after. The baseline provides the comparison group, and impact is measured by
the change in outcome indicators before and after the intervention. (Ezemenari, Rudqvist, and
Subbarao, 1999). If the survey is only undertaken in a project area, a reflexive comparison approach can
be used. (Carvalho & White, 1995).A major drawback of this method is that participant circumstances
are likely to be affected by a multitude of factors, thus making attribution of changes to the intervention
difficult. This type of design involving comparing values for a population at an earlier period with values
observed for same population later period is considered one of the least methodologically precise
evaluation method because isolating the impact of an intervention from the impact of other influences
on observed outcomes is difficult without a comparison or control group that does not receive the
intervention (Grossman, 1994)
Measurement of changes in some of the variables such as income, employment assets and savings is
straight forward; but measurement of change in variables like water resources is rather tricky as it
involves many indicators like change in depth of water table, changes in area under irrigation and so on.

12
An appropriate base line survey of the households would help in capturing changes better. However
such baseline data sets are often not available. This is the major weakness of the study. One way of
addressing the problem is to have a control group which is similar to participating group in all respects
except the pollution. So that the control group provides the realistic picture of the participating group.
In a reflexive comparison by double difference method where before and after scenarios are compared
for participating households and control household groups. (Ravallion, 2001).
In this field study Kathangani, Thambureddipalayam, Ganapathypalayam, Orathapalayam, and
Kodumanal are taken as treated (polluted villages) and Karaikatupudur and Arasampalayam are taken as
control (non-polluted) villages.(Fig 1). The same questionnaires were used at both groups of villages. The
questionnaires were constructed and performed to collect data about for cropping pattern before
pollution (early 90s) scenario I (S I) and after pollution (late 90s) scenario II (S II). The before and after
scenarios in the polluted village give the absolute incidence of loss in agriculture after the incidence of
pollution. These two measures are estimated and presented as scenario-I and scenario-II. The double
difference between before and after situations in both the affected and control (non-polluted) villages
[(Bi-Ai) - (Bj-Aj), where i and j represent polluted and control (non-polluted villages)] gives the net
impact of pollution. The before and after difference in the non-polluted villages is due to natural factors
which needs to be netted out.
The difference between the two scenarios for the affected villages gives the impact on agricultural
crops. The impact will provide data regarding the loss in agricultural crops. Discussions with the
monitoring committee of Orathapalayam dam and medical practitioners have helped in cross checking
the damage losses. Reflexive comparison by double difference method was done to analyze the impact
on agriculture and livestock. Impact on livestock rearing can be analyzed by getting the data from the
farmers having livestock rearing animals living in the villages around the Orathapalayam dam.
3.4 Selection of Villages
The villages Kathangani, Thambureddipalayam, Ganapathypalayam, Orathapalayam, and Kodumanal are
taken as polluted villages and Kaaraikatupudur and Arasampalayam are taken as control (non- polluted)
villages. The five villages Kathagani, Thambureddipalayam, Ganapathypalayam, Orathapalayam, and
Kodumanal are situated near the Orathapalayam reservoir. Karaikatupudur and Arasampalayam are
situated 6 to 10 kms apart from the dam and belong to Sivanmalai panchyat union, Erode District.
Farmers are selected randomly from both the affected area and non affected area. Farmers may have
the different size of land holdings, and use different sources of irrigation.

13

14
3.4.1 Profile of sample villages
Five villages were selected to represent the polluted and two villages to represent non-polluted villages.
These villages have similar socio-economic and occupational patterns. These villages are located at 21
km to the northeast of Tirupur, Tamil Nadu, and India. The villages Kathangani, Thambureddipalayam,
Ganapathypalayam, Orathapalayam, and Kodumanal are taken as polluted villages and Kaaraikatupudur
and Arasampalayam are taken as control (non- polluted) villages. The five villages Kathagani,
Thambureddipalayam, Ganapathypalayam, Orathapalayam, and Kodumanal are situated near the
Orathapalayam reservoir. Karaikatupudur and Arasampalayam are situated 6 to 10 kms apart from the
dam and belong to Sivanmalai panchyat union, Erode District.
Agriculture is the dominant sector in all these villages. It’s also observed that along with cultivation,
most of the villagers work for the nearby industries in Tirupur as laborers. Around 50% of the
populations in both the sample villages are illiterate.
The households in all these villages predominantly belong to backward caste (BC) categories. Small and
marginal farmers are majority in both the sample villages (Table: 1). Small and marginal farmers are high
in both these sample villages. The land distribution pattern among the households is presented in Table:
2.
Table: 1 Social category wise distribution of households
Category Polluted villages
No of house holds Occupation
T.Redipalayam BC 120 Cultivation and
laborer
OC 15 Cultivation and
laborer
G.palayam BC 113 Cultivation and
laborer
OC 13 Cultivation and
laborer
O.Palayam BC 120 Cultivation and
laborer
OC 31 Cultivation and
laborer
Katagani BC 130 Cultivation and
laborer
OC 28 Cultivation and
laborer

15
Kodumanal BC 190 Cultivation and
laborer
OC 21 Cultivation and
laborer
K.Katupudur BC 120 Cultivation and
laborer
OC 20 Cultivation and
laborer
Arasampalaym BC 160 Cultivation and
laborer
OC 25 Cultivation and
laborer
BC- backward class, OC- other caste
Source: Village Survey
Table: 2 Size class-wise distribution of land holdings
Category of
cultivators
No of
households
% of total
cultivators
No of
households
Area owned
by sample
cultivators
(ha)
% of total
are (ha)
Polluted
villages (5)
100
T.R.Palayam 135 100 26 37 100
Marginal
farmers(MF)
25 16 8 3 32
Small
farmers(SM)
60 44 7 8 24
Medium
farmers (Md.F)
35 30 4 8 24
Large farmers
(LF)
15 10 7 18 20
G.Palayam 113 100 14 22 100
M F 30 27 4 3 20
S F 55 49 5 8 32
Md. F 20 18 2 4 32
L F 8 08 3 7 16
O.Palayam 151 100 12 22 100
M F 28 19 4 3 22
S F 65 43 4 6 30
Md. F 38 25 2 5 30
L F 20 13 2 8 17
Katagani 158 100 21 25 100

16
M F 45 28 7 3 23
S F 60 38 8 5 27
Md. F 43 27 2 4 36
L F 10 06 4 13 14
Kodumanal 211 100 27 36 100
M F 70 33 9 5 15
S F 76 36 9 7 35
Md.F 50 24 5 8 30
L F 15 07 3 16 20
Non polluted
villages (2)
K.Katupudur 145 100 23 26 100
M F 60 41 5 3 15
S F 40 28 9 6 30
M F 35 24 4 7 35
L F 10 06 2 10 20
Arasampalayam 185 100 18 23 100
M F 55 30 5 6 26
S F 60 32 7 7 30
MD F 50 27 4 8 35
L F 20 11 2 2 09
Large farmers (LF) >5 acres, medium farmers (MD F) 3-5 acres, Small farmers 2-3 acres marginal farmers
(M F) 0-2 acres
Source: Village Survey
The land distribution among the households is presented in Table: 2. Small and marginal farmers are in
majority in both the sample villages. Around 50% of cultivators belong to marginal farmers in the
polluted villages, whereas in the case of non-polluted village the percentage is high in Small farmers
rather than in medium farmers.
3.5 Sampling Technique
Random Sampling technique is used to get first hand information about pre and post pollution
agricultural and allied economic activities of the farmers, livestock details in these villages. Agricultural
activities explore the crop productivity, crop pattern, economic status before and after pollution. One
hundred respondents were given questionnaires and interviewed by the researcher for the affected
area. Ten respondents each from non affected area are interviewed. In random sampling, a number is
given to each individual in the group under investigation and a set of random number is then used to
select the members of the sample. In this way, each individual has a known probability of being selected
the researcher can also predict with some degree of certainty that the sample is a representative of the
group as a whole.

17
3.6 Methods of Data Collection and Analysis
By primary data, it refers to a situation in which the researcher collects information directly from his
respondents. Primary data was used to collect the data of respondent through the use of questionnaire
and semi structured interview method. The following steps (A-D) were followed:
A. The questionnaires were prepared and the following information was collected from the
farmers. (Before water gets polluted (early 90s) and after water gets polluted (late 90s)
1. Cost of cultivation the farmers used different proportion of inputs based on the extent of
impact.
2. The input costs could be broadly classified into laborer cost, fertilizer (other costs). For getting
the average cost of cultivation on different crops the data are compiled for the affected farmer,
3. Current occupation for their livelihood.
B. The questionnaires were prepared for the farmers doing livestock rearing and the following
information was collected from them
1. Total number of year’s livestock rearing was done, and what are the effects on livestock
rearing due to this water pollution?
Questionnaires are also a cheap, fast and efficient method for obtaining large amount of quantifiable
data on a relatively large population. Questionnaires are open-ended as open ended questionnaires
enable the respondent to compose his own answer rather than choosing between a number of given
answers
D. The data collected will be analyzed based on descriptive statistics (converted in to percentages) While
the before and after scenarios in the polluted village gives the rational loss in agriculture, livestock
rearing, Discussion with the monitoring committee of the Orathapalayam dam helps to cross check the
damages for agricultural land and discussion with medical practitioners helps to cross check the diseases
caused in the livestock rearing.

18
3.7 Implicated problems in Compensation Mechanism
To explore the establishment and implicated problems in compensation mechanism qualitative
interviews were performed. The compensation mechanism is based on the polluters pay principle, which
claims that the polluters have to pay for the ecology loss and also for the prevention of loss of ecology.
Questionnaires in any form proved to be an unreliable method of collecting information concerning
complicated and sensitive issues regarding the payment of compensation from individual dyeing units in
Tirupur. Since the legal proceedings are still undergoing in the Court apprehension was stronger among
the dyeing units, so it is rational to assume that a questionnaire would not have been useful. Instead,
semi-structured interviews were conducted for the dyeing units and it was used as the main method of
data collection for compensation during field periods.
Large scale dyeing Units: 2 2
Medium Scale dyeing Units: 4
Small Scale dyeing Units: 3
In this study dyeing units are the polluters and for establishing the compensation mechanism the dyeing
units has to pay for the ecology loss. Therefore interviews with the dyeing units are very essential. As
the farmers are the affected victim interviews were also done with the farmers.
Total Number of Farmers: 6
Foot note2: Large dyeing unit’s category uses more than 1 crore liters of water a day for dyeing operations
Medium scale dyeing units uses about 50 lakh liters of water per day
Small scale dyeing units uses below 30 lakh liters of water per day

19
Even though dyers and the farmers are the key informant in this study interviews were also performed
with the Government officers in the Loss of Ecology and also with the pollution control board.
Pollution Control Board (Chennai)-1
Loss of Ecology Authority- 2
Monitoring Committee-1
Most government officers normally didn’t split their own views and choose to be a strict official position.
Semi-structured interview was performed for the compensation mechanism. It was a research interview
in the form of a conversation that is transcribed to texts and will be interpreted. Texts were created and
interpreted through the collective information from the interviews (Kvale, 1997). After the field study I
organized and structured the information based on the aim of my study.

20
Chapter 4. Formulation of compensation
4.1 Polluter pays principle
The first major orientation to the PPP appeared 1972 in the OECD Guiding Principles Concerning
International Economic Aspects of Environmental Policies (henceforth called OECD Guiding Principles).
The judiciary in India recognizes the Polluter Pays Principle as is seen from the judgment delivered by
the Supreme Court of India in Bichhri case writ petition no 657 of 1995. In this case the units
manufacturing Oleum and H-acids without obtaining the requisite permissions were held liable for
causing the pollution to the wells, soil and the aquifers and were directed to defray the costs for
remedial measures. The Court ruled that "Once the activity carried on is hazardous or inherently
dangerous, the person carrying on such activity is liable to make good the loss caused to any other
person by his activity irrespective of the fact whether he took reasonable care while carrying on his
activity. The rule is premised upon the very nature of the activity carried on".
Therefore the polluting industries are "absolutely liable to compensate for the harm caused by them to
villagers in the affected area, to the soil and to the underground water and hence, they are bound to
take all necessary measures to remove sludge and other pollutants lying in the affected areas". The
"PPP"(Polluter Pays Principle) as interpreted by the Court means that the absolute liability for harm to
the environment extends not only to compensate the victims of pollution but also the cost of restoring
the environmental degradation. Remediation of the damaged environment is part of the process of
"Sustainable Development" and as such polluter is liable to pay the cost to the individual sufferers as
well as the cost of reversing the damaged ecology (AIR1996SC2715).
4.2 Vellore tannery case
In Vellore citizens case the court held that the precautionary principle and the polluter pay principle
have been accepted as part of the law of the land. ‘The Precautionary Principle’ and ‘The Polluter Pay
Principle’ are essential features of ‘Sustainable Development’. The ‘Precautionary Principle’ – in the
context of the municipal law means the State Government and the statutory authorities must anticipate
prevents and attacks the causes of environmental degradation. It is stated that the tanneries are
discharging untreated effluent into river Palar that is the main source of water supply to the residents of
the area. The entire surface and subsoil water of river Palar has been polluted resulting in non-
availability of potable water to the residents of the area. It is stated that the tanneries in the State of
Tamil Nadu have caused environmental degradation in the area. Further in the order it’s stated that The

21
Central Government shall constitute an authority under Section 3(3) of the Environment (Protection)
Act, 1986 and shall bestow on the said authority all the powers necessary to deal with the situation
created by the tanneries and other polluting industries in the State of Tamil Nadu.
The authority so constituted by the Central Government shall implement the "precautionary principle"
and the "polluter pays" principle. The authority shall, with the help of expert opinion will assess the loss
to the ecology/environment in the affected areas and shall also identify the individuals/families that
have suffered because of the pollution and shall assess the compensation to be paid to the said
individuals/families. The authority shall further determine the compensation to be recovered from the
polluters as cost of reversing the damaged environment. The authority shall compute the compensation
under two heads namely, for reversing the ecology and for payment to individuals (AIR1996SC2715).
4.3 The principle of different class compensation for victims in Noyyal River
The Loss of Ecology Authority required the Anna University to carry out the water quality studies and
identify the list of villages affected by the effluents discharged by the dyeing units. Each of the villages
was classified based upon a weighted average of electrical conductivity in the sample wells of the
village. The University also calculated the monetary loss of agricultural productivity loss based on type of
crop, average yield, and procurement price. The rates are based upon the theoretical agricultural
productivity loss corresponding to TDS in irrigant fields. It was also based with basic statistics on type of
crop, average yield during the recent years and purchase price of the predominant crops. The
compensation to the farmer was calculated on the basis of the cropping pattern as well as the average
level of pollution in that village.
The cropping patterns are taken according to the major crops cultivated in each Taluk. In Avinashi Taluk
(Coimbatore District) Cholam, pulses, groundnut, cotton is the major crops. Tirupur Taluk (Coimbatore
District) cholam, pulses, coconut. Erode Taluk (Erode District) paddy, cholam, groundnut, and pulses are
the major cultivated crops. The University estimated the monetized loss to ecology/environment in
terms of Rs/ha/y depending upon the class of villages (Loss of Ecology, 2004).

22
Table 3 – Rates arrived by University based on the TDS value. Source: (Loss of Ecology Authority for
the state of Tamil Nadu, 2004)
Rate Rs/ha/yr Rate Rs/ha/yr
Class of villages EC Value Erode & Karur Dist Coimbatore Dist
Class II 1.5 to 3mS/cm 900/- 300/-
Class III 3+ to 5.25mS/cm 4,600/- 1,400/-
Class IV 5.25+ to 7.5 mS/cm 14,400/- 5,800/-
Class V More than 7.5mS/cm 21,400/- 9,300/-

23
Chapter 5. Description of Noyyal river and Orathapalayam reservoir
24
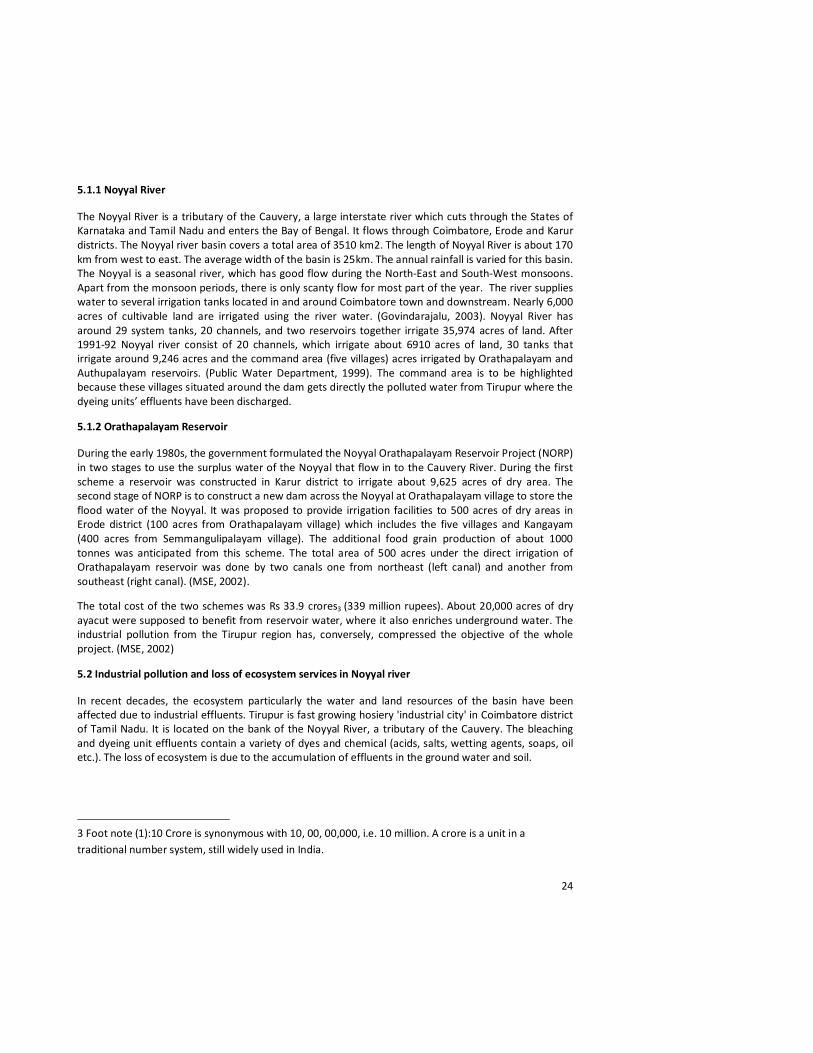
5.1.1 Noyyal River
The Noyyal River is a tributary of the Cauvery, a large interstate river which cuts through the States of
Karnataka and Tamil Nadu and enters the Bay of Bengal. It flows through Coimbatore, Erode and Karur
districts. The Noyyal river basin covers a total area of 3510 km2. The length of Noyyal River is about 170
km from west to east. The average width of the basin is 25km. The annual rainfall is varied for this basin.
The Noyyal is a seasonal river, which has good flow during the North-East and South-West monsoons.
Apart from the monsoon periods, there is only scanty flow for most part of the year. The river supplies
water to several irrigation tanks located in and around Coimbatore town and downstream. Nearly 6,000
acres of cultivable land are irrigated using the river water. (Govindarajalu, 2003). Noyyal River has
around 29 system tanks, 20 channels, and two reservoirs together irrigate 35,974 acres of land. After
1991-92 Noyyal river consist of 20 channels, which irrigate about 6910 acres of land, 30 tanks that
irrigate around 9,246 acres and the command area (five villages) acres irrigated by Orathapalayam and
Authupalayam reservoirs. (Public Water Department, 1999). The command area is to be highlighted
because these villages situated around the dam gets directly the polluted water from Tirupur where the
dyeing units’ effluents have been discharged.
5.1.2 Orathapalayam Reservoir
During the early 1980s, the government formulated the Noyyal Orathapalayam Reservoir Project (NORP)
in two stages to use the surplus water of the Noyyal that flow in to the Cauvery River. During the first
scheme a reservoir was constructed in Karur district to irrigate about 9,625 acres of dry area. The
second stage of NORP is to construct a new dam across the Noyyal at Orathapalayam village to store the
flood water of the Noyyal. It was proposed to provide irrigation facilities to 500 acres of dry areas in
Erode district (100 acres from Orathapalayam village) which includes the five villages and Kangayam
(400 acres from Semmangulipalayam village). The additional food grain production of about 1000
tonnes was anticipated from this scheme. The total area of 500 acres under the direct irrigation of
Orathapalayam reservoir was done by two canals one from northeast (left canal) and another from
southeast (right canal). (MSE, 2002).
The total cost of the two schemes was Rs 33.9 crores3 (339 million rupees). About 20,000 acres of dry
ayacut were supposed to benefit from reservoir water, where it also enriches underground water. The
industrial pollution from the Tirupur region has, conversely, compressed the objective of the whole
project. (MSE, 2002)
5.2 Industrial pollution and loss of ecosystem services in Noyyal river
In recent decades, the ecosystem particularly the water and land resources of the basin have been
affected due to industrial effluents. Tirupur is fast growing hosiery 'industrial city' in Coimbatore district
of Tamil Nadu. It is located on the bank of the Noyyal River, a tributary of the Cauvery. The bleaching
and dyeing unit effluents contain a variety of dyes and chemical (acids, salts, wetting agents, soaps, oil
etc.). The loss of ecosystem is due to the accumulation of effluents in the ground water and soil.
3 Foot note (1):10 Crore is synonymous with 10, 00, 00,000, i.e. 10 million. A crore is a unit in a
traditional number system, still widely used in India.

25
5.2.1 Pollution Load Generated by Tiruppur Textile Processing Units
From 1980 to 2003 in Noyyal River Bain (Quantity in Tonnes/year)
Table 4 Pollution load generated by Tirupur textile processing units. Source: (Nelliyat, 2005)
Period TDS CHLORIDE SULPHATE TSS COD BOD OIL&GREASE
1980-2003 2877066.17 1585933.8 161726.82 110928.95 104944.33 31990.55 1633.95
Key: TDS- Total Dissolved Solids, TSS- Total Suspended Solids, COD- Chemical Oxygen Demand, BOD-
Biochemical Oxygen Demand.
From 1980-2002, the collective TDS load discharged by the Tirupur units alone is estimated to be 2.87
million tonnes. Apart from TDS other pollutants have also accumulated during this period is shown in
the table. Rainfall (annual average of 617 mm) has only a marginal effect in reducing the impact
5.3 Previous studies on ground water pollution in the region
5.3.1 Ground Water Pollution
Studies have been done by (Senthilnathan and Azeez, 1999 and Prabakaran et al., 2002) by collecting
well water samples around Tirupur and along Noyyal up to Orathapalayam reservoir. (Prabakaran, 2002)
in his study has collected water samples around the Orathapalayam reservoir and found that many wells
have high EC-values, the wells situated near the dam having maximum EC value was 9.56 dS/m in May
and the minimum was 8.22 dS/m in December.
Another extensive study was done by the Soil Survey and Land Use Organization (SS&LUO) as a part of
the project study conducted by Madras School of Economics during 2001 to assess the environmental
impact of industrial effluents in the entire Noyyal River basin. This study covered the entire length of the
basin and the whole basin area was divided in to four zones. The area between Tirupur and
Orathapalayam reservoir falls under Zone III. This is the zone where the bleaching and dyeing activities
are taking place. The water samples are collected and characterised according to the Tamil Nadu system
for irrigation water (Table 3 & 4). Nearly 33% (82 water samples) were not suitable to raise the crops
and 42% (106 samples) are estimated to be critical for crops. The farmers in this zone have not been
able to use both surface and ground water.
Before the 1990s, ground water in and around Tiruppur was potable (PWD, 2002). Open wells and bore
wells in and around Tiruppur and the downstream stretch of Noyyal exhibit high levels of TDS (most
areas >3000 mg/l and some places even up to 11,000 mg/l) and chloride (generally > 2000 mg/l and
certain areas upto 5000 mg/l) due to industrial pollution.(PWD, 2002) The current values of pollution
concentration are very much higher than the background levels for this region. There is high
concentration of heavy metals like zinc, chromium, copper and cadmium in ground water. (Rajaguru and
Subbaram, 2000) The open and bore wells located around 4 km radius of Orathapalayam reservoir are
highly polluted with high TDS level and concentration of various salts (Loss of Ecology, 2004).
5.3.2 SURFACE WATER POLLUTION
The pollution (EC/TDS) concentration in Noyyal River is low till the river reaches Tiruppur. But it
increases in Tiruppur areas due to effluent discharge, and continues up to Orathapalayam dam. (Central
Water Commission). Pollution concentration in the river is more in summer. The existing moderate flow
in Noyyal River is not sufficient to dilute the pollutants. High alkalinity, chloride, electrical conductivity,
iron, phosphate, and BOD are seen in the water in Orathapalayam Reservoir. (PWD, 2001);(Loss of
26
ecology Authority for the state of Tamil Nadu, 2004). The flow of the Noyyal River is confined to the
monsoon periods. For most part of the year, the river carries only dyeing effluents and sewage (Joseph
et.al, 2004). The water is saline and no longer useful for irrigation (PWD, 2002). The water is very turbid,
pH is highly alkaline, EC and TDS levels are very high, and water hardness is very high (Govindarajulu,
2003). The Orathapalayam dam was filled with industrial effluents; the stagnation of polluted water in
the dam has caused pollutants to percolate to the ground water (PWD, 2002). The TDS levels in the
surface water at Orathapalayam dam is high (approximately 4000ppm) and decreases further in
downstream (Govindarajulu, 2003).
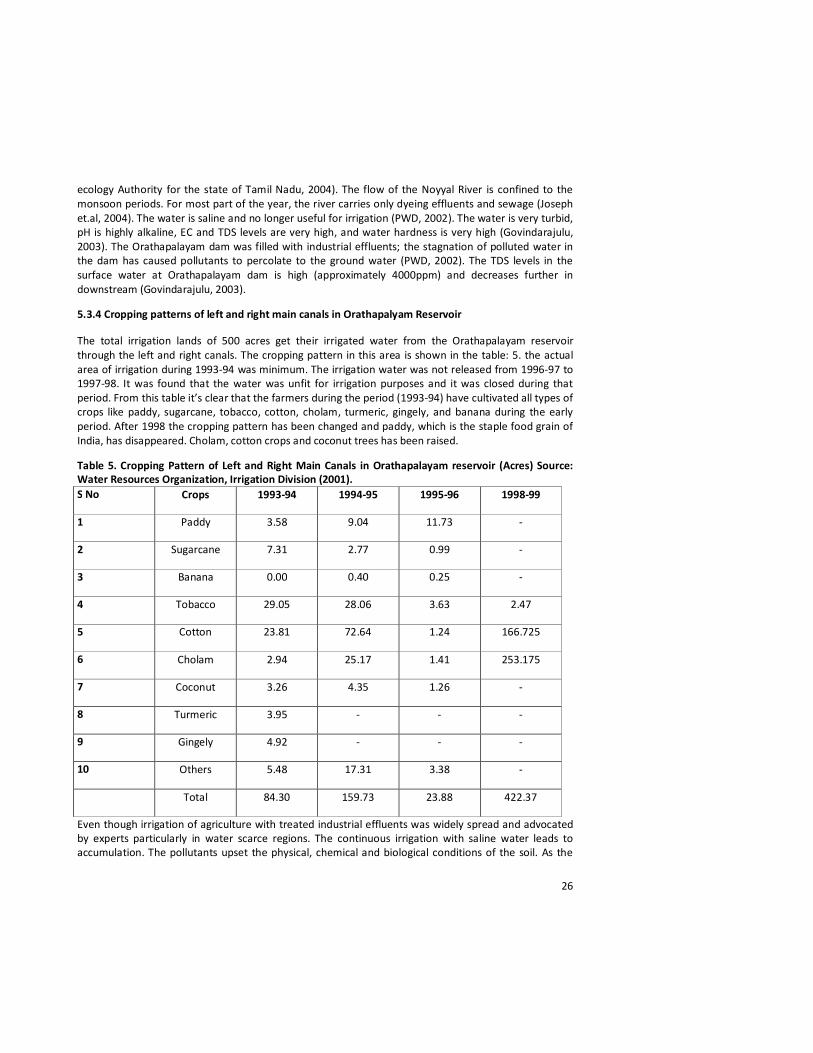
5.3.4 Cropping patterns of left and right main canals in Orathapalyam Reservoir
The total irrigation lands of 500 acres get their irrigated water from the Orathapalayam reservoir
through the left and right canals. The cropping pattern in this area is shown in the table: 5. the actual
area of irrigation during 1993-94 was minimum. The irrigation water was not released from 1996-97 to
1997-98. It was found that the water was unfit for irrigation purposes and it was closed during that
period. From this table it’s clear that the farmers during the period (1993-94) have cultivated all types of
crops like paddy, sugarcane, tobacco, cotton, cholam, turmeric, gingely, and banana during the early
period. After 1998 the cropping pattern has been changed and paddy, which is the staple food grain of
India, has disappeared. Cholam, cotton crops and coconut trees has been raised.
Table 5. Cropping Pattern of Left and Right Main Canals in Orathapalayam reservoir (Acres) Source:
Water Resources Organization, Irrigation Division (2001).
S No Crops 1993-94 1994-95 1995-96 1998-99
1 Paddy 3.58 9.04 11.73 -
2 Sugarcane 7.31 2.77 0.99 -
3 Banana 0.00 0.40 0.25 -
4 Tobacco 29.05 28.06 3.63 2.47
5 Cotton 23.81 72.64 1.24 166.725
6 Cholam 2.94 25.17 1.41 253.175
7 Coconut 3.26 4.35 1.26 -
8 Turmeric 3.95 - - -
9 Gingely 4.92 - - -
10 Others 5.48 17.31 3.38 -
Total 84.30 159.73 23.88 422.37
Even though irrigation of agriculture with treated industrial effluents was widely spread and advocated
by experts particularly in water scarce regions. The continuous irrigation with saline water leads to
accumulation. The pollutants upset the physical, chemical and biological conditions of the soil. As the

27
chloride content is high, the soil becomes saline. When the sodium content is high, the soil becomes
alkaline (Ahmed et.al., 2002)(Senthilnathan and Azeez 1999) in their study found the solids present in
ground water having EC (21000 μ mhos/cm) besides affecting the growth of the plants directly, also
affect the soil structure, permeability and aeration with indirectly affects the plant growth. Many plants
are very susceptible to salt stress, especially during germination and the early segment of growth. A dry
climate further reduces the resistance of the plant. (Furn and Hultgren, 2004).
5.4 Water and soil quality standards
The major ions present in water are sodium, potassium, calcium, magnesium, chloride, sulphate,
bicarbonate, and carbonate. The major variables used to characterize water are pH, and Electrical
Conductivity. PH indicates the degree of acidity. Electrical Conductivity is a good estimator of Total
Dissolved Solvents (TDS). It can be expressed as dS/m(decisiemens per metre) (Hounslow, 1995).
The suitability of irrigation water depends upon the a. nature and amount of salts present in water, soil
to be irrigated, climatic conditions and crop species. These conditions vary from place to place and the
classification of the irrigation water depends upon the amount and nature of salts present in the
irrigated water. (Natrajan et.al, 1998)
Table 6 Ratings on soil reaction (pH). Source: (Natrajan et.al, 1998)
Rating Status
Below 6.0 Acidic
6.0 to 8.4 Normal
8.5 to 8.9 Tending to alkaline
8.9 and above Alkaline
Table 7 Ratings of EC. Source: (Natrajan et.al, 1998)
Rating Status
Below 1.0 Normal
1.0-3.0 Critical
3.0 and above Injurious
28
Chapter: 6 Impact of pollution
The impact of pollution has been widespread in all aspects of the village life. However, here we focus on
three important impacts for an in-depth analysis. These are (a) impact on crop production (b) impact on
livestock. Before going into the details of analyzing the impacts of pollution on various aspects, it would
be pertinent to examine the impact of industrial pollution on water sources or bodies.
Impact on water sources.
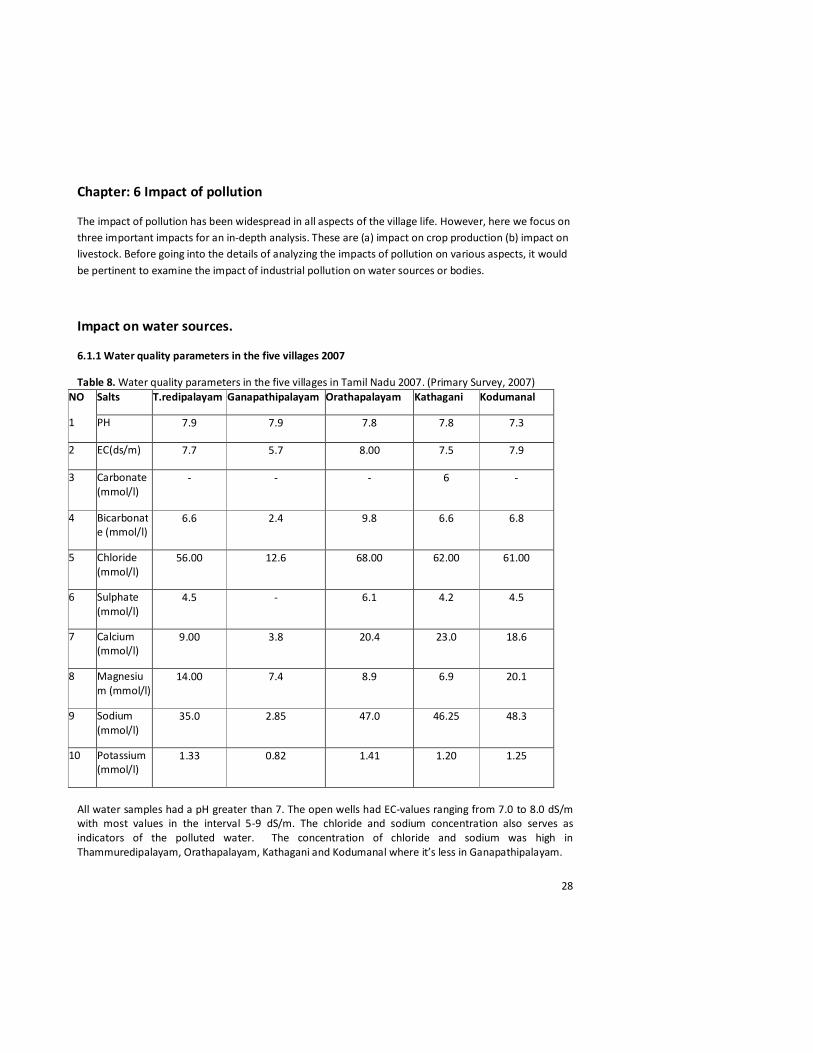
6.1.1 Water quality parameters in the five villages 2007
Table 8. Water quality parameters in the five villages in Tamil Nadu 2007. (Primary Survey, 2007)
NO Salts T.redipalayam Ganapathipalayam Orathapalayam Kathagani Kodumanal
1 PH 7.9 7.9 7.8 7.8 7.3
2 EC(ds/m) 7.7 5.7 8.00 7.5 7.9
3 Carbonate
(mmol/l)
- - - 6 -
4 Bicarbonat
e (mmol/l)
6.6 2.4 9.8 6.6 6.8
5 Chloride
(mmol/l)
56.00 12.6 68.00 62.00 61.00
6 Sulphate
(mmol/l)
4.5 - 6.1 4.2 4.5
7 Calcium
(mmol/l)
9.00 3.8 20.4 23.0 18.6
8 Magnesiu
m (mmol/l)
14.00 7.4 8.9 6.9 20.1
9 Sodium
(mmol/l)
35.0 2.85 47.0 46.25 48.3
10 Potassium
(mmol/l)
1.33 0.82 1.41 1.20 1.25
All water samples had a pH greater than 7. The open wells had EC-values ranging from 7.0 to 8.0 dS/m
with most values in the interval 5-9 dS/m. The chloride and sodium concentration also serves as
indicators of the polluted water. The concentration of chloride and sodium was high in
Thammuredipalayam, Orathapalayam, Kathagani and Kodumanal where it’s less in Ganapathipalayam.

29
The EC values were high in well water, because these wells are close to the dam with the south of the
reservoir. As EC could be used as an indicator of pollution it could be seen that the pollution had been
spread in these villages. All these open wells have high concentration of chloride, and Sodium. The
sample from open wells shows EC value is > 7.0 mS/cm. When compared with the ratings of (Table: 2)
this indicate that the ground water in these villages has been polluted. As we can see the EC level and
other important parameters of these samples are quite high in comparison to the normal range,
indicating that the water is not safe for many purposes. Therefore this water is not suitable for irrigation
under ordinary conditions. All these waters are not suitable for irrigation under normal conditions. The
concentrations of Na+ were, high in open wells and this could cause sodium toxicity to crops. The open
wells with a low sodium concentration although with a high salinity could perhaps cause less damage to
the physical structure of the soil. The sodium concentration is low in Ganapatipalayam but due to
accumulation of pollutants for a long time the water is not so good for agricultural activities. The reason
why most open wells were still used for irrigation was that there was no other alternative for the
farmers. Most of the open wells were used for irrigation, however, mainly for coconut trees.
6.1.2 Impact on Agriculture
Agriculture is the worst affected. About 123 ha of cultivable land have become uncultivable by soil
pollution leading to drastic changes in livelihood systems in polluted villages (Table: 8). As mentioned
earlier the water from these polluted villages is found to have high concentrations of electrical
conductivity (EC) which is the main indicator of irrigation of water quality (Natraj et.al 1998). EC conveys
the intensity of salinity of water bodies. The results (Table: 6) clearly indicated the high concentration of
TDS in the polluted villages. The high concentration of TDS not only affected crop production but also
damaged the agricultural machinery like pump sets that come into direct contact with water. Here we
have estimated the losses in terms of loss of production and replacement costs of the pump sets.
Apart from the decline in agricultural productivity the polluted water imposed enormous costs on
various agricultural activities, like corrosion of agricultural equipment, damage of pump sets, repairing
costs of machines etc… Only the damage of pump sets is reported from polluted village, though other
problems like corrosion of equipment and repairing costs might have occurred earlier, for that reason,
the decline of cultivation activities occurred during the last 8 decades and hence they are not able to
remember about repairing costs or loss of equipment due to pollution. As the damage of pump sets
imposes a major loss to farmers, it is still fresh in the minds of cultivators.

30
Table: 9 Estimation of damage costs on agricultural activities due to pollution (loss of production)
Thaammuredipalayam
Pump set damaged Large Farmers Md F SM MF All
Number 6 3 5 - 14
Cost 72,000 26,000 30,000 128000
Per unit cost(Rs) 12,000 8667 6000 9143
Cost per household
(Rs)
10285 6500 4286 7111
Cost/HH/yr 1714 1083 714 1185
Ganapathipalayam
Pump set damaged Large Farmers Md F SM MF All
Number 3 2 5 - 10
Cost 36,000 20,000 45,000 101000
Per unit cost(Rs) 12,000 10,000 9000 10100
Cost per household
(Rs)
12,000 10000 9000 10100
Cost/HH/ yr 2000 1667 1500 1683
Orathapalayam
Pump set damaged Large Farmers Md F SM MF All
Number 2 2 5 3 12
Cost 23,000 19,000 52,000 27000 121000
Per unit cost(Rs) 11,500 9500 10400 9000 10083
Cost per household
(Rs)
11500 9500 10400 6750 10083
Cost/HH/yr 1917 1583 1733 1125 1680
Kathagani
Pump set damaged Large Farmers Md F SM MF All
Number 4 2 7 5 18
Cost 56,000 21,000 63,000 52,000 192000
Per unit cost(Rs) 14,000 10500 9000 10400 10667
Cost per household
(Rs)
14000 10500 7875 7429 9143
Cost/HH/year 2333 1750 1313 1238 1524

31
Kodumanal
Pump set damaged Large Farmers Md F SM MF All
Number 3 5 7 8 23
Cost 42,000 45000 63,000 73000 223000
Per unit cost(Rs) 14,000 9000 9000 9125 9696
Cost per household
(Rs)
14000 9000 7000 8111 8259
Cost/HH/year 2333 1500 1167 1352 1376
At least 77 pump sets have been damaged during last 6 years in this entire polluted village. Its total costs
are estimated at about Rs.765000 (Table: 7) these costs are acquired during the last 6 years. Accordingly
per annum costs of repairing and damage of pump sets have been calculated. The per annum per
household average total cost on agricultural activities due to pollution in Thammureddipalayam is
Rs.1185, in Ganapathipalayam Rs.1683, Orathapalayam Rs.1680, Kathagani Rs. 1524, and in Kodumanal
Rs.1376.
The cost of damage of pump sets is mainly born by large and medium farmers. For that reason only
these farmers own bore wells. None of the marginal farmers own a bore well. Per unit cost are high on
large farmers. (Table: 7).

32
6.1. 3 Impact of pollution on agricultural productivity and area under cultivation
for paddy
Table: 9 Impact of pollution on agricultural productivity and area under cultivation for paddy
cultivators Area
cultivated
in ha
Average
yield per
ha
paddy(q)
Total
loss
(per
ha)
Net
loss=(QPL-
PP)-CPP
(Rs)
Per HH
net
loss(Rs)
T.R.Palayam BP AP BP AP
LF 18 - 90 - 90 775000 43055
Mdf 8 - 30 - 30 100000 25000
SM 8 - 31 - 31 125000 17857
MF 3 - 14 - 14 14000 1750
G.palayam
LF 7 - 30 - 30 85000 12142
Mdf 4 - 20 - 20 27000 6750
SM 8 - 31 - 31 104000 13000
MF 3 - 19 - 19 21500 7167
O.Palayam
LF 8 - 41 - 41 149000 18625
Mdf 5 - 33 - 33 62500 12500
SM 6 - 34 - 34 82000 13667
MF 3 - 20 - 20 23500 7833
Kathagani
LF 13 - 29 - 29 168500 12962
MdF 4 - 20 - 20 32000 8000
SM 5 - 25 - 25 52500 10500
MF 3 - 21 - 21 23500 7833
Kodumanal
LF 16 - 38 - 38 284000 17750
MdF 8 - 27 - 27 88000 11000
SM 7 - 22 - 22 59000 8428
MF 5 - 18 - 18 32000 6400
Karaikatupudur
LF 5 3 - - 0 0 0
MdF 7 6 - - 0 0 0
SF 6 5 - - 0 0 0
MF 4 4 - - 0 0 0
Arasampalayam
LF 6 6 - - - 0 0
MdF 6 5 - - - 0 0
SF 7 6 - - - 0 0
MF 3 3 - - - 0 0

33
The amount of land under cultivation for paddy has declined about 80% due to the incidence of
pollution in the case of all categories of farmers in polluted villages (Table:8 ). These differences are
attributed to uncultivable land under the polluted sources.
In Thammuredipalayam the difference of area under cultivation under pollution is for large farmers is 18
hac, for medium farmers is 8 ha, small farmers are 8 ha and for marginal farmers are 3 ha.
In Ganapathipalayam the difference of area under cultivation after pollution is for large farmers is 7 ha,
medium farmers is 4 ha, small farmers is 8 ha, and for marginal farmers is 3 ha
In Orathapalayam the difference of area under cultivation after pollution is for large farmers is 8 ha,
medium farmers is 5 ha, small farmers is 6 ha, and for marginal farmers is 3 ha
In Kathagani the difference of area under cultivation after pollution is for large farmers 13 ha, medium
farmers is 4 ha, small farmers is 5 ha, and for marginal farmers is 3 ha
In Kodumanal the difference of area under cultivation after pollution is for Large farmers is 16 hac,
medium farmers is 4 ha, small farmers is 7 ha, and for marginal farmers is 5 ha.
In proportionate terms the decline is the highest among medium size farmers followed by large farmers,
marginal farmers, and small farmers in all these five villages. In all these five villages 29 ha of land has
become unproductive for medium farmers. 34 ha of land have become unproductive for small farmers
28.5 ha of land has become uncultivable for Large farmers followed by 17 ha of land has become
uncultivable for marginal farmers. These differences are attributed to uncultivable land under the
polluted sources. Cultivation no longer takes place under polluted sources. Marginal farmers are badly
affected in all these polluted villages due to pollution. Loss of yield is estimated by subtracting the total
production of paddy in the before and after situations. Physical losses are converted in to monetary
terms using the current prices of paddy. It may be noted that per hectare yields seem to have declined
even in the case of non polluted village.
Interestingly the yield loss in Thammureddipalayam is high for large farmers followed by medium
farmers. In Ganapathipalayam the yield loss is high for small farmers followed by large farmers. But in
Orathapalyam village the yield loss is high for large farmers followed by small farmers. In Kathagani the
yield loss is almost the same for large farmers followed by small farmers. In kodumanal village the yield
loss is almost the same for large farmers followed by medium farmers. In the non polluted village there
are no changes in area and yield though land productivity is low in this village when compared to the
polluted villages.
The loss of income from agriculture is estimated on the basis of the difference between average yield
earned by the households before pollution (1995) and after pollution (2001). It may be noted here that
after pollution the farmers under polluted tank are not cultivating at all. In order to estimate the losses

34
of paddy of unproductive land we have multiplied the per acre yield of before pollution with their
respective unproductive land (BPA*BPY-APA*APY). (BPA-Before pollution acre, BPY-Before pollution
yield, APA-After pollution acre, APY-After pollution yield). The household level losses due to loss of
production are determined on the basis of market prices of paddy. The market value of one-quintal
paddy is Rs.500 approximately. However, this is not the net loss to the farmers, as the farmer would not
be incurring any production costs in the event of no crop. Hence, the net loss to farmer is calculated
after netting out the cost of production. The net loss to marginal farmers is less when compared to
large and medium farmers.
The average net loss of income to the farmers is due to pollution is estimated as Rs. 43055 for large
farmers in Thammuredipalayam per house hold per year. Per household loss of production is directly
related with the farm size. The average losses incurred by the cultivators in the form of pump sets
damaged are around Rs.1714 for large farmers per household per year. Together, the average cost per
household due to losses to the agricultural sector is (Rs. 43055+Rs.1714=Rs.44769).
In the same way the net loss of income to the farmers due to pollution for medium farmers is Rs. 26083
The net loss of income to the farmers due to pollution for small farmers is Rs.18571
The net loss of income to the farmers due to pollution for Marginalized farmers is Rs.1750
In the same way the net loss of income to the farmers due to pollution for large farmers in
Ganapathipalayam is Rs.14142.
For medium farmers the net loss is Rs.8417
For small farmers the net loss is Rs. 14500
For marginalized farmers the net loss is Rs.7167
In the case of Orathapalayam the net loss of income due to pollution for large farmers is Rs.20542
For medium farmers the net loss is Rs.14083
For small farmers the net loss is Rs. 15400
For marginalized farmers the net loss is Rs. 8958

35
In Kathagani village the net loss of income due to pollution for large farmers is Rs.15295
For medium farmers the net loss is Rs.9750
For small farmers the net loss is Rs. 11813
For marginalized farmers the net loss is Rs.9071
In kodumanal village the net loss of income due to pollution for large farmers is Rs.20083
For medium farmers the net loss is Rs.12500
For small farmers the net loss is Rs. 9595
For marginalized farmers the net loss is Rs.7752.
The total loss per household loss with total number of households in Thammuredipalayam is that is
Rs.91173x135= Rs.12308355 (12 millions). Similarly the total loss to the village for the last 6 years can be
calculated.
The total loss per household loss with total number of households in Ganapathipalayam is Rs. 5572476
(5 millions)\
The total loss per household loss with total number of households in Orathapalayam is Rs.8906433 (8
millions)
The total loss per household loss with total number of households in Kathagani village is Rs.7256782 (7
millions)
The total loss per household loss with total number of households in Kodumanal village is Rs.11590230
(11 millions)
The average loss to the crops is calculated for one season (November to April) only. Though farmers
cultivate two crops in a year, majority of the farmers while interviewing argued that Kharif (July to
November) crop is highly uncertain. For that reason, large area of land remains dry or flooded during the

36
rainy season. Looking at this uncertainity over the kahrif season, the loss to crops during kharif season is
not taken into account.
6.1.4 Discussion
The farmers in non affected villages during late 1990s have cultivated various crops like paddy. The yield
of paddy and cotton was good during late 1990s in all these polluted villages. Their cropping pattern has
not declined. During early 1990s the water/soil in the affected villages was not affected so the farmers
were able to cultivate different types of crops. The farmers in the affected villages depicted that the
problem became severe during 1997-98 and agriculture sector is the worst affected. Due to water
scarcity the water stored in the Orathapalayam Reservoir was released for irrigation during 1997-98
(Table: 5). During the interview with the farmers they told that after 1996 the farmers around the
Orathapalayam villages are not able to cultivate paddy, sugarcane, kambu, turmeric, and other crops.
Cholam cotton, coconut are only raised around the Orathapalayam villages. The Thammuredipalayam
and kodumanal has been adversely affected and the net loss of the agricultural yield is large in these
both villages.
Most of the farmers in the affected village who has used this water said that the crop was damaged.
Apart from crop damage, the soil and well water were also polluted. According to the farmers the crops
got affected after this period and the water and soil has not recovered their original quality. The
polluted water serves as one of the main reason for the change in cropping pattern. After 1998 mostly
the irrigation was done using the well water. As the pollutants percolated to their wells it damaged the
agricultural machinery like pump sets, which comes directly in contact with water. Only the damage of
pump set is commonly seen in all these villages.
Both the quality and quantity of coconut has been reduced. The coconut size has been reduced.
According to the farmers, the cotton crop grows with the salt water, but they are not getting the yield.
Some of the farmers about four years ago they stopped irrigating their lands since the crops did not
even germinate when it had been irrigated. When the pollution problem was high the farmers used a
high level of fertilizer and manure for getting normal yield. According to the farmers whatever
proportion of fertilizer was applied for raising crops did not result in normal yields since the soil was also
affected.

37
One of the contributing factors for turning of fruitful land into infertile land in these villages can be
credited due to irrigation with the polluted water from the tank and well water. The well water samples
(Table 3) further amplifies that it has high concentrations of electrical conductivity (EC), which is the
main indicator of water quality, which proves that these water is not suitable for irrigation.
6.2 Impact on livestock
Livestock is generally considered as one of the main sources of income in rural areas. Since all the local
water boides are polluted in the polluted village, it has posed serious threat to the livestock economy in
the village. In the absence of sufficient municipal water supplies, livestock is forced to depend on
polluted water. Livestock have been suffering from various diseases as they drink polluted water and
graze on contaminated grasses or grazing fields. It was reported by the villagers that around cattle died
due to drinking polluted water during the last 9 years. Another serious problem observed in the village is
that some cows have lost their reproductive capacity. Grazing contaminated grasses and drinking
polluted water have resulted in poor quality of milk and dung.
Table: 10 Status and composition of livestock holdings among the households
Village Before pollution After pollution
T.Redipalayam Goat Cow Buffalo Goat Cow Buffalo
LF 00 10 5 00 2 2
MdF 70 5 8 10 2 1
SF 90 3 4 10 00 00
MF 120 2 5 20 00 00
G.palayam
LF 00 4 5 00 2 4
MdF 30 2 2 10 - -
SF 90 3 4 10 00 00
MF 120 2 5 20 00 00
Orathapalayam
LF 20 4 4 00 1 1
Mdf 40 2 2 10 - -
SF 70 2 2 10 - -
MF 90 3 2 15 - -
Kathagani
LF 30 3 4 10 1 2
MdF 40 2 1 15 - -
SF 140 1 2 30 - -

38
MF 150 3 2 20 - -
Kodumanal
LF 00 4 3 00 3 2
MDF 80 3 2 20 1 1
SF 180 4 4 30 2 1
MF 200 5 4 20 1 3
Karaikatupudur
LF 00 4 3 00 3 2
MDF 80 3 2 85 4 5
SF 180 4 4 183 5 5
MF 150 3 2 170 4 5
Arasampalayam
LF 00 3 3 00 3 3
MDF 80 2 3 70 2 3
SF 130 3 2 120 3 2
MF 160 2 3 150 2 3
Composition and holdings of livestock have experienced changes due to the incidence of pollution in the
affected village (Table 10). On the contrary, the composition and holdings of livestock showed a little
change in the non polluted village the only exception being the positive change increase in the case of
goats among marginal farmers. It may be noted that the density of livestock is very low in non polluted
village when compared to the polluted village. The decline in livestock population across all categories in
polluted villages is due to the reasons that either the livestock have got diseases due to consequent
drinking of polluted water or the people have sold their cattle on account of fear of death. Except in the
case of buffaloes the decline in livestock holding is higher among small and marginal farmers. Besides,
farmers have started depending more on tractor to plough their land even in the non polluted villages
rather than buying buffaloes.
6.3 Impact on employment
While industrial pollution imposes severe negative externalities on rural communities, advent of
industries in the region could possibly lead to some positive externalities such as employment and
income generation. On the other hand loss of employment due to the reduction in area under
cultivation is another negative impact. Assessment of these aspects would help us understand the
extent of net (indirect) compensation to the communities. After pollution there was a significant change
in the pattern of employment in all these polluted villages. Most of the people who were depending on

39
agriculture before pollution have shifted to industry, and other sources. Majority of them have become
daily laborers. For those who are employed in industry, majority of them complained that they are
working in very hazardous conditions. On the whole employment per year has declined in these villages
across the size classes (Table 11 ). The worst affected is the large farmers in these villages/ Before
pollution they used to get employment or engaged in agricultural activities for 250 days out of 300
possible working days.
Table: 11 Impact of industrial pollution on employment
Village/siz
eclass
Before Pollution After Pollution
Averag
e no of
workin
g
person
s per
HH
Workin
g in
own
farm
Hired
out
to
farm
work
Hired
out
to
indus
try
Othe
rs
Ttl Averag
e no of
workin
g
person
s per
HH
Worki
ng in
own
farm
Hired
out to
farm
work
Hired out
to
industry
Othe
rs
Ttl
T.Redipala
yam
LF 3 250 - - - 250 2 85 - - - 85
MDF 4 160 - - - 160 4 25 10 120 - 160
SF 3 110 25 - - 135 3 15 20 80 - 115
MF 3 85 65 - 20 175 2 15 20 70 40 145
G.Palayam
LF 3 260 - - - 260 3 70 - - - 70
MDF 5 180 - - - 180 5 30 10 130 - 170
SF 4 180 30 - - 210 4 30 10 60 - 110
MF 4 80 60 - 30 170 4 15 30 65 30 140
Orathapal
ayam
LF 3 280 - - - 280 4 70 - - - 70
MDF 4 190 - - - 190 4 30 10 30 - 170
SF 4 130 40 - - 170 4 20 20 100 - 140
MF 4 90 50 - 40 180 4 15 10 100 50 115
Kathagani
LF 3 280 - - - 280 3 90 - - - 90
MDF 3 150 - - - 150 3 30 - - 100 130
SF 4 100 20 - - 120 4 20 10 80 - 110
MF 3 80 50 - 10 140 3 15 10 90 20 130
Koduman
al
LF 3 230 - - - 230 3 90 - - - 90
MDF 4 180 - - - 180 4 90 - - - 90

40
SF 3 120 30 - - 150 3 10 20 120 - 150
MF 4 60 50 - 40 160 4 - 30 90 20 140
karaikatup
udur
LF 3 250 - - - 250 3 260 - - - 260
MDF 4 190 - - - 190 4 200 - - 40 240
SF 4 140 40 - - 180 4 133 - 60 - 193
MF 4 50 50 - 20 120 4 65 - 85 - 150
Arasampal
ayam
LF 3 235 - - - 235 3 267 - - - 267
MDF 4 194 - - - 194 4 200 - - - 200
SF 4 123 50 - - 173 4 154 65 80 - 295
MF 4 70 60 -- - 130 4 80 80 95 13 268
However after pollution it has declined to a sparse of 85 days. For that reason, as the data indicates,
large farmers in all the polluted villages have not changed their occupation after pollution. They are still
cultivating their remaining land, working on their own farm. On the other hand, other size class farmers
have shifted to industry or agricultural labor on other farms. This may be due to the false status of the
large farmers, as they do not hire themselves out. In the case of small and marginal farmers the number
of days employed in a year declined only marginally while it has remained the same in the case of
medium farmers. In the control village per year employment has increased marginally for small farmers
from 250 days to 260 days. In the case of marginal farmers the increase is from 235 days to 267 days.
6.4 Problems in implementing the compensation mechanism
Determining the adequate level of compensation to the victims is a mere complicated practical problem,
through theoretical solutions are available in environmental economics. The total compensation granted
for the pollution caused in Noyyal river was Rs.24, 79, 98,548/-. The dyeing units have deposited only
the first instalment of Rs. 1.80 crores and the balance amount has not been paid till date. Some of the
affected farmers in these five villages have received their first instalment of compensation. The people
in these five villages are not content with the compensation. This study tries to highlight the problems
where the underlying disciplinary issues for these problems should be properly resolved in a damage
assessment exercise.
41
6.4.1 Scope of damage assessed
The mismatch between the actual damage and the estimated damage may arise if the scope of the
damage assessment is not properly defined. Water pollution and the extent of its environmental
consequences clearly deserve estimation of economic damage in terms of monetary values, which is a
prerequisite for determining the level of compensation for the affected victims. However, the economic
assessment of environmental damage and the compensation thereof pose different kinds of
methodological problems. In the compensation awarded to the farmers in these five villages there was a
noticeable difference between the amounts of compensation arrived at and the actual compensation to
be provided to the losers. This mismatch may be attributed to (a) selection of the economic valuation
technique to estimate the amount of compensation, (b) the limited ‘scope’ of damage assessed, and (c)
the issues related to the relationship between the property rights over the environmental resources and
compensation thereof.
6.4.2 Property rights over the environmental resources
Another important aspect to be addressed in a damage assessment study is the ‘property rights’ and its
relationship with compensation. In the damage assessment there are a large number of different kinds
of losers who do not have any well defined property rights over the benefits declined due to pollution.
One of the farmers expressed his view that the loss in health status for the human beings has not been
counted. ‘We have been suffering from various diseases like skin allergy, respiratory infections, general
allergy, gastritis and ulcer for the past ten years. We have been spending our income to medical
expenses but we have not been compensated for our health problems’.
In the case of agricultural sector the losers are easily identified as the losers have the ‘well defined
property rights’ over the land that has been affected by pollution. In the case of the five villages the
farmers having wells in their lands are identified to claim compensation. Even though the property
rights of their farm land have been submitted to receive the compensation some of their farmers are
not able to receive the compensation payment in Orathapalayam village. Around thirty of the farmers’
names have been mislaid in the revenue department, so the farmers have to struggle to claim the
compensation by legal proceedings. Farmers believe that the Orathapalayam dam has served the
interests of the dyeing units rather than farmers. The Farmer’s Association President said that if we had
not filed the petition 10 years ago the damage would have been far greater. "It has taken so long to get
justice. But at least we have prevented ecological damage all the way up to Nagapattinam and
Thanjavur along the Cauvery."
Another farmer further emphasised that ‘I does not owe a well, livestock rearing was my main income
before but due to this pollution I have lost my cows, buffaloes only I can do cattle rearing. I am not able
to claim compensation as it’s given to the people who have land only’.
There are various types of people affected by this industrial pollution. Another major impact of
industrial activity of the dyeing units in the upstream is on the livestock sector. It has affected the

42
downstream livestock rearing among marginalised farmers in all these five villages. The loss in livestock
has been discussed in (Table: 8). the compensation has not been fixed to the loss in livestock sector. The
compensation has been formulated to the affected victims who have the property rights over their
respective lands.
6.4.3 Quantifying the benefits
The impact of water pollution for these villages was estimated in terms of crop loss. The loss of
productivity was monetised based on the predominant cultivating crops like paddy, cotton, and coconut.
The loss for these crops (table 7) has been monetised for one acre. The practical problem is to identify
and quantify the benefits by water resources existed in the unpolluted condition. While calculating the
use values both quantifiable and non-quantifiable values should be included. The non-quantifiable value
such as loss in agricultural equipments, loss in pump sets, has been considered in this study for these
five villages.
One farmer conveys his view ‘the authorities came and took the water sample. They didn’t question or
survey about our farming status. We came to know later that we have been awarded this much amount
as compensation. How is it possible to derive compensation with the help of water sample not without
any dialogue with the affected people ’?
Though the data for predominant crops can be culled out from government records, the compensation
should be formulated in a contemplating way considering the affected farmers estimation of their
farming status. The secondary data on agriculture, (loss in pump set, agricultural equipments) livestock,
and fishery areas pose much difficulty to derive. Alternative sources such as primary surveys that look at
the affected victim opinion about the initial and current levels of benefits and the quantity of
agricultural output before and after pollution can be used.
As the dyeing units in Tirupur delay to pay their partial compensation to the District Collectrate, to the
affected farmers has raised much criticism from the farmers and the public. The costs of damage would
be higher if social costs such as alienation of the villages (marriages, education, social visits, health loss
etc.) by others were accounted for.
6.4.4 Selection of the economic valuation technique
In the particular case of the Noyyal River, the discharge of industrial effluents in the urban areas of the
river, particularly Tiruppur has an impact on downstream farmers as well as on drinking water. For some
parameters like Total Dissolved Solvents (TDS) these standards have in fact been relaxed, by Tamil Nadu
Pollution Control Board (TNPCB) without giving sufficient thought to cumulative impact.
The valuation technique to assess the damage in the agricultural sector was straightforward. This
method is based largely on scientific data on levels pollution. This approach looked only at the level of
Total Dissolved Solvents (TDS) in the ground water and compensation was based on the TDS. If the TDS
level is high the compensation amount will be large. In these five villages the water samples were not
collected individually from each well it was collected randomly and the compensation amount was fixed.
During the monsoon period the pollution load discharged may vary and there will be change in TDS
level. Variation in constituents from month to month, year to year does occur. Hence, the level of
compensation to the losers may vary. It also depends mainly on the nature of the valuation techniques
selected. In this study the TDS level (Table: 8) was found to be high in these five villages, which indicate

43
the range of pollution extent has not been reduced. So the ad-hoc amount of compensation should be
fixed for the subsequent years.
6.4.5 Limited scope of damage assessed
The water resource generates two types of benefits, namely use benefits and passive use benefits. In
Noyyal River these benefits include water used for drinking purpose in the household sector, for
irrigation purposes in the agricultural sector. The five villages around the Orathapalayam dam have used
the river water for drinking purpose, irrigation and for fish production. The compensation amount was
restricted only for agricultural sector for a period of six years In one of the interview with the farmer he
says ‘the award has been given up to 2002 is arbitrary. The industries are still discharging their
wastewater in to Noyyal River and have to be compensated after 2002 at least close to its original value’.
As the livestock rearing serves as an income for rural household the loss in livestock and fisheries should
be incorporated in compensation mechanism. When the non-quantifiable benefits are not incorporated
in the damage assessment, there is a possibility that the actual estimated is much lower than the
prospective compensation.
The farmers feel that the damaged lands have not been estimated in a proper way. One of the farmers
says ‘the Anna University has estimated the damage as Rs. 114.91 crores as payable by the way of
compensation. However, the Loss of Ecology Authority, reduced the compensation amount to Rs 24, 79,
98,548/-. We are still hiring the court assistance through legal proceedings to award us the right
compensation’. ‘The Noyyal River should not be further degraded the RO system should be implemented
by all dyeing units’.
6.5 Zero Discharge process in Tirupur
Clean industrial production requires a cutting edge shift, from the current approach to a positive
preventive approach (UNEP, 2001). There are three major ways of achieving clean production: reduction
at source, recycling, and product modification (PWD et al., 2002). Examples of clean production
measures in textile industries include dye bath segregation, zero discharge: reuse of process water with
RO and/or MEE system (Joseph et al. 2004). Currently there is no viable technology available to remove
TDS expect RO (PWD, 2002). RO can handle high TDS concentrations and recovers around 80% of the
process water (Shankar, 2001). The basic elements of the zero discharge system are RO filtration that
recovers pure water from the effluents, Nano Filtration (NF) that recovers salt in solution from the RO
reject, Multiple Effect Evaporation that recovers water in the RO and NF rejects, and Solar Evaportation
that evaporates the remaining water in the MEE reject. The economic benefits of zero discharge are
reuse of water and salt reduces processing expenses, ground water depletion in the surrounding areas is
averted, the industry can increase its productivity without concern on discharge units. However, the
electricity requirements of the zero discharge system are costly as well as purchase of wood. The
electricity costs can however be reduced by establishing windmills or biogas plants.
There are still problems with the RO membranes. The high COD value of the dyeing effluents, even after
pre-treatment with lime precipitation causes frequent failures and choking of the membranes.(p.a). One
informant for this study told that RO is not the final solution. Recycling of 100% pure water is not
possible. For one CETP installing of RO process involves the investment of 750 crores. In the final stage
daily 50 crore litres of water should be evaporated.(p.a) Firewood is scarcity and alternatively windmills
or biogas plants have to be constructed.

44
6.5.1 Dyers problems in paying compensation
The PPP originates from Pigou’s negative externality analysis which suggests that the negative
externality (in the form of pollution) caused by the economic activities deforms the functioning of the
product market and therefore, the deformation may be corrected by way of imposing a pollution tax
where the marginal cost of controlling pollution is equal to the marginal benefits restored. Conceptually
the PPP (Polluter Pay Principle) in many of the developing countries including India is not being properly
used. In India the pollution control policies are mainly based on the ‘command –and-control method’.
When the polluters find the cost of controlling pollution under the command-and-control regime to be
high, they are either not willing to control pollution or expect the government to bear a larger
percentage of the pollution control cost.
6.5.2 Large Dyeing Units
In Tirupur the dyeing units (polluters) have to implement both the technology needed for the
prevention of pollution zero discharge system, cleaning of the dam and to pay the compensation for the
affected victims. The large dyeing units involve manufacturing activities like knitting, dyeing, finishing
and stitching. The large dyeing units were able to achieve zero discharge through RO, and MEE. The
investment cost was Rs.11.4 million (USD 270,000). The Managing Director of large scale dyeing has
invested in RO as the recycling of water 70-80% of the water requirement appeared attractive. The
membranes are costly part of the process. Membranes are still imported. The overall water
consumption is reduced by 30% by zero discharge (p.a.). The factory uses around 1000,000 litres of
water per day,1-200,000 litres of fresh water is supplied by the New Tirupur Area Development
Corporation Ltd (NTADCL). 900,000 litres of water are recycled daily. The large dyeing units achieving
the zero liquid discharge (ZLD) status attain the appropriate certificate and they are not liable to pay the
fine and the compensation.
6.5.3 Small Scale Dyeing Units
Most small-scale dyeing industries do not have necessary land, finance or technical and managerial
expertise to establish and operate their own ETPs. Collective abatement through CETPs allows these
industries to comply with the TNPCB standards at a lower cost. The annual running costs are very high in
both individual ETPs and CETPs making up around 80% of the total pollution abatement cost. In one of
the interviews with the small scale dyeing units they complain ‘that even after pre-treatment with lime
precipitation causes frequent failures and choking of the membranes. Frequent installation of RO
membranes involves huge amount of money and have to bear the import cost. When we are not able to
install the Reverse Osmosis Plants within the time stipulated by the Court, they are imposed fine for the
discharge of effluents. The additional fine, cost to invest in installing the RO plants, the compensation
amount to be paid makes the condition more decisive for us’. ‘We need the government to support us by
providing incentive to construct RO plants’. Presently the industries do not have enough support and
expecting the government to enhance them by providing some incentives to install the RO plants in
CEPTS.
6.5.4 Medium Scale Dyeing Units
The annual turnout of medium scale dyeing units is USD 10 million. The medium scale units use around
500,000 litres of water per day. 100,000 litres of fresh water is supplied by New Tirupur Area
Development Corporation Ltd (NTADCL). 400,000 litres of water are recycled daily. The two medium
scale dyeing units previously treated the dye bath water and discharged the effluent in Noyyal River.

45
Both of the units have individual ETPs and they are constructing Multi Effect Evaporation (MEE) to attain
zero liquid discharge. In one of the interviews with the medium scale dyeing units they said ‘initially the
Pollution Control Board left the installation of CETPs to the dyers themselves no scientific solution was
suggested that gave a lot of confusion to the dyers, and still they have no basic scientific idea of
installation of RO plants in their units’. The two medium scale dyeing units have paid the compensation
and cleaning up of dam. If the court directs notice to pay the compensation the TNPCB will activate the
dyeing units to pay the amount. It was not possible to take action against all industries because the
industry brings the revenue and generates employment.
The PPP suggests that those who are responsible for the pollution should be made to pay the cost of
pollution. Even though the large scale dyeing units face the problem of competitiveness they are able to
pay the compensation and install the RO plants for prevention of pollution. The infrastructure of the
regulatory agency the Pollution Control Board (PCB) should be improved for monitoring the payment
and enforcement to pay the compensation. More precisely, the compensation amount to be collected is
being delayed by the small scale dyeing clusters. Any subsidy targeting that the beneficiary firms will
have a lower expected marginal benefit of non compliance (Stransland, 1997). Such assistance can do
wonders for small scale dyeing units crippled with technical, managerial and financial bottlenecks. If
there is no incentives provided there is a possibility that the small scale dyeing units will not be able to
sustain in this financial burden and may fade away.
6.6 Regulatory Problems
The pollution control legislations in India reveals that the government of India has tended to rely on
command and control (CAC) policy for pollution control. For successful implementation of CAC policy
certain facilities are necessary most important is the monitoring and enforcement capabilities of
regulatory agencies. In addition the penalty for non compliance is not stringent enough to set up or to
operate the treatment equipment (Dasgupta et.al 1998). Previously the wash water was treated with
lime precipitation and dye bath with solar evaporation. The treated effluent was discharged in to the
Noyyal River. In spite of the big investments in Effluent Treatment Plants (ETP)s and Common Effluent
Treatment Plant (CETP)s the industries are not fulfilling the standards (p.c) and many industries are not
running their ETPs 24 hrs and end up releasing in Noyyal River. (p.c).As the environmental externalities
occurred on a bigger scale with a large number of polluters in Tirupur and the TNPCB has meagre
resources the Court implemented the ‘two-tier monitoring’ in Tirupur. The monitoring committee
appointed by the court and the PCB act in this system. The monitoring committee bridges the
asymmetric information as they can target the polluters more efficiently. TNPCB acts as a regulator to
make the dyeing units to pay the compensation amount. TNPCB and monitoring committee monitors
the discharge of effluents in to the river and construction of RO plants. (p.c).
6.7 Impact/Damage Studies
Damage studies are taken up after the damage has occurred. Damage is based on actual measurements
which may or may not fully capture the impact on the environment. Measurements have their own
limitations in terms of accuracy and quality. However, damage studies do capture cumulative impact
over time unlike traditional environment impact studies. The discharge of TDS in any given time period
may not be reckoned to be a serious problem. However, if the TDS is not assimilated, the repeated
discharge over twenty years may result in build up which has serious impact. The regulations have to
ascertain if the environment has the capacity to assimilate the pollution load over time. When the
pollution load exceeds the threshold effects of water or soil the ecosystem can totally break down. For
example, a crop like paddy can no longer be grown in this area. Thus the regulators must also look in to

46
the carrying capacity of the receiving environment. This damage assessment provides some indication of
the cost of inaction. However, the estimate of damage may be lower than the actual impact because of
the limitations of the methodology. For example the study area in this case was limited to five villages
around Orathapalayam dam.
Chapter: 7 Final evaluation
Water Pollution: Policy and Institutional failure
Judging from the information collected in this study, Tirupur the textile city with rapid industrialization,
the disposal of liquid waste is a growing problem. However, when industrial effluents are discharged on
land or water they not only pollute the environment but also affect the ecosystem services such as
irrigation, livestock, fisheries, drinking water.
To recapitulate, the impact of industrial pollution on rural communities is quite substantial in monetary
terms alone, the real impact on health economics is difficult to assess. The losses due to agriculture are
difficult to assess the problem in pure economic terms of valuation of losses. Hence, the solution to
solving the problem lies not in compensating the loss but in removing the problem altogether. Here
compensation means giving the right to pollute. Beyond compensation something has to be done in
order to end the problems forever. This could be in terms of strict regulation on the industries to adopt
pollution mitigating technologies or face closure. However, this calls for a close look at the economics of
pollution mitigating technologies, which will be a worthy exercise. State policy also has a major role to
play in this regard.
In the present case the Tamil Nadu Pollution Control Board (TNPCB) is responsible for the area of
Tirupur industries. The villagers have complained a number of times regarding the loss of crops, loss
cattle and pollution of tank and tube well water. In response to these complaints, the officials visited the
village and surveyed the area. They took carious water samples for testing. According to the villagers,
this has become a routine for PCB, and no action has been initiated against the industries. Bringing the
judiciary into the picture also did not help much in solving the problem. Judiciary entered the scene
after a public litigation suite, as the negotiations between polluters and criticism with regard to
compensation for damages have failed. Supreme Court had, ordered that a report regarding the damage
due to pollution should be submitted and also ordered that even one drop of effluent should not be
discharged into the tank. The Supreme Court entrusted the Loss of Ecology Authority the responsibility
of estimation of damage cost. They have estimated Rs. 21400 per hectare of agricultural land, leaving
out other damages such as livestock and health. However, it is not clear how the estimates were arrived

47
at. Our estimation shows that the damage to crop production itself is Rs.91173 for
Thammuredipalayam, Rs. 44226 for Ganapathipalayam, Rs. 58983 for Orathapalayam, Rs. 459259 for
Kathagani, and Rs.54930 for Kodumanal per household per year. Therefore, the compensation offered in
these villages is a gross under-estimation of the actual losses. On the contrary Supreme Court’s
compensation package was propitious to industries rather than to the rural community. For that reason,
the compensation recommended by the Loss of Ecology Authority was half that of the amount offered
by the industry on their own. Moreover, even after 3 years of the Supreme Court judgment, the
compensation did not reach the people, though some of the neighboring villages have received the
compensation. The Court order was that the money should be collected from the polluting industries
and deposited in the account of district Collectroate. Then the Revenue department will distribute the
money among the victims. Some villagers even approached the industries for compensation, the
industries denied saying that they have already given their money to the collect rate/ The villagers visits
to the Collectroate office have also gone in vain. As a result, the villagers continue to be the victims, in
the hands of the judiciary as well as the industries.
On the other hand, majority of the households, especially small and marginal farmers, have been
compensated indirectly through employment opportunities in the industry. Since these farmers account
for 90% of the households the attempts of civil society for better compensation were not effective. In
terms of per household losses small and marginal farmers incur in the range of Rs.7000- to Rs.20000
which is much less than that of the losses incurred by large and medium farmers. Moreover, these
households are concerned about their day-to-day livelihoods and they are not in a position to join the
fight for justice. This indicates the hat homogeneity/heterogeneity in the interest or stakes in the
resources makes the collective action strategies, here the heterogeneity of interests is mainly due to the
availability of employment opportunities in the industry to majority of the population. Also, the large
and medium farmers who are losing more due to pollution are in minority. Besides, their social status
prevents them from taking up the jobs in the industry.
Industries have constantly confronted the compensation payment made by the Loss of Ecology
Authority on various technical and legal grounds. At the same time compensation amount was found to
be meagre for the farmers and do their legal proceedings to attain an acceptable compensation. The
cases drag on in the court for several years before the compensation has paid. Another issue is the
technology of pollution control. The court has introduced the two tier monitoring system where the
monitoring committee monitors the discharge of effluents and imposes fine on the dyeing units those
who are not able to attain zero liquid discharge status. The Tamil Nadu Pollution Control Board monitors
the payment of compensation to the District Collector Office. If the payment is getting delayed the
farmers file a case in the court, the court orders notice to the dyeing units to pay and the TNPCB urges
the dyeing unit to pay the amount. The payment scheme for the compensation has not been regular. It’s
clear that both IETPs and CETPs are forced to incur additional capital expenditures of this magnitude 19
crores for CETP and 20 crores for IETP for Reverse Osmosis (RO) as they are so ordered by the legal
institution Court. The legal institution Court has acted on Polluter Pay Principle (PPP) and regulated the

48
pollution to a certain extent. In this scenario the large scale dyeing units are able to sustain though they
face competitiveness but the small scale dyeing units may fade away due to financial crisis.
The compensation was drawn to the temporal limits. Can a one-time compensation for ecosystem
change is adequate? The ground water to retain to its original quality will take more than ten years and
if the loss in ecosystem services are noted the one time compensation is not adequate for the losers.
More over compensation should not be a gesture for the polluters to discharge the effluents in to the
river as they reimburse. Regulatory infrastructure should be enforced strictly to monitor their effluent
discharge.
Due to these reasons, protests in front of the State Secretariat in the form of dharna (mass squatting)
have resulted. In spite of the Supreme Court Judiciary the community did not succeed in influencing
either industries or regulatory authorities. The movement could not sustain because a majority of the
population have shifted to jobs in the industry leaving agriculture. It is clear that mere passing of laws
and creating institutional structures are necessary but not sufficient to address the environmental
problems. Policies should be implemented in their right perspective. Institutions should be strong
enough, with more autonomy and powers, to deal with the problems at hand.
7.1 Actions needed and suggestions
As of August 2007, the local people around these villages has paid a large part of the externalities of the
polluting activities of the textile industries in terms of agricultural productivity, agricultural land, fishing,
livestock, and working opportunities. Though the compensation is not a bonanza, it should be a solution
to the affected people. Though the compensation was awarded in 2004 it has not been awarded to all
affected people in these villages.
The government needs to increase the days of providing drinking water to the affected villages.
Livestock also needs safe drinking water. The Connections between diseases and the polluted water
need to be investigated and information has to reach the affected people. Local people needed to get
updated information about the quality of their water. Research should be done to train the farmers to
cultivate the crops suitable for their land. Rain water harvesting could be started in these villages in
order to utilize more of the highly variable rainfall People should have the facility to receive free health
care. Health care programme should be conducted to monitor the health of the affected people and the
livestock and to notice if there is any specific problem.
7.2 DYERS

49
Dyers should use more natural dyes. Adequate financial investment should be available for implying
both for paying compensation to the affected people in downstream and to fund for the RO plants.
Research on cleaner production and treatment methods for textile industries should be done.
Government should provide incentives for small scale dyeing units to implement the RO plants to attain
zero liquid discharge. Scientific idea should be provided to all dyers about the RO system. PCB should
enforce the dyeing units to pay the compensation amount.The capacity of the PCB need to be enhanced
for the enforcement of the effluent water quality standards in the environmental legislation. Co-
operation between different government agencies in the water sector, agriculture and irrigation,
fisheries need to work together and have a better dialogue with industries and exchange information
and data with research units.
References
Appasamy P, and Prakash Nelliyat, Working paper 14/2007. Compensating the loss of ecology services
due to pollution in Noyyal River Basin, Tamil Nadu, Madras School of Economics, February 2007.
Appasamy Paul (2005) Workshop Report:Environmental Aspects of Efflunet Irrigation, Madras School of
Economics, Chennai, India.
Beck, Ulrich., What is Globalization , 2000.
Blomqvist Anna (1996), Food and fashion. Water Management and Collective Action among Irrigation
Farmers and Textile Industrialist in South India, Linkoping Studies in art and Science. Linkoping
University, Linkoping.
Carvalho Soniya and White Howard (1995) Theory-Based Evaluation: The Case of Social Funds American
Journal of Evaluation, Vol. 25, No. 2, 141-160 (2004)
Central Water Commission (2000-01), “River Water Quality for Noyyal River” Cental Water Commission,
Coimbatore
Compendeium of Textile Statistics (1999), Office of Textile Commissioner, Government of India, Mumbai
Dasgupta, S., Laplante, B., Mamingi, N., 1998. Capital market responses to environmental performance
in developing countries. Mimeo. Policy Research Working Paper # 1909. The World Bank,
Washington, DC.
Directorate of Fisheries (2000b) “Fish Stocking and Catch for Orathapalayam Reservior”, Directorate of
Fisheries, Chennai.

50
Furn, K AND Hultgren J (2004) Effects of dyeing and bleaching industries on the area around the
Orathapalyama Dam in Southern India, External Relations of Swedish University of Agricultural
Sciences, Uppsala, Sweden.
Govindarajalu, Dr. K. Industrial Effluent and Health Status, A Case Study of Noyyal River Basin, 2003.
Grossman, Jean Baldwin. “Evaluating Social Policies: Principles and U.S. Experience.” The World Bank
Research Observer 9 (July 1994): 159-180.
Hounslow, A.W. 1995. Water Quality Analysis: analysis and interpretation. CRC Press, Boca Raton,
Florida
Joesph, K and Narain, J (1999) Industrial Effluent Management for Textile Bleaching and Dyeing Units.
Centre for Environmental Studies, Anna Univeristy, Chennai India. In: Indian Dyes and Chemicals
(1999) Silver Jubilee cum Textile Processing Seminar Tex-Tech’ 99 Souvenir, Seminar conducted by
Indian Dyes and Chemicals in March 1999 at Tirupur, India.
Loss of Ecology Authority (prevention and payments of compensation) Authority for the State of Tamil
Nadu. Report and Award for Tiruppur Cluster of Textile Industries in Noyyal River Basin 2004.
(MSE) Madras School of Economics, 2002. Environmental impact of industrial effluents in Noyyal River
Basin –Final report submitted to:Water Resource Research fund institute for water studies, chennai.
Murty, M. N., A. J. James and Smita, Misra (1999): “Economics of Water Pollution : The Indian
Experience”, Oxford University Press, New Delhi
Ministry of Textiles (1999), “Report of the Expert Committees on Textile Policy”, Government of India,
Udyog Bhavan, New Delhi.
Natarajan, S. et al. 1988. Methods of Water Analysis, Department of Soil Science and Agricultural
Chemistry, Tamil Nadu Agricultural University, Coimbatore
Nelliyat Prakash, Madras School of Economics Working Paper 17/2007 Industrial Growth and
environmental degradation:A case study of Tirupur Textile Cluster. June 2007
Nelliyat Prakash, (2003), “Industrial Growth and Water Pollution in Noyyal River Bain: India” in Abstract
Volume of The Thirteenthi Stockholm Water Symposium.
Nelliyat Prakash(2007), “Industrial Growth and Environmental Degradation: A Case Study f Tiruppur
Textile Cluster, Working Paper 17/2007. Madras School of Economics
Nelliyat, Prakash (2005) “Industrial Growth and Environmental Degradation: A case Study of Industrial
Pollution in Tiruppur”
Comment [1]:

51
Prabakaran, J. & Thangavel, P. 2002. Colour removal from textile industrial effluents by bioremediation
and reuse of treated effluents for agriculture. Sponsored by Water Resource Organisation (PWD),
Environmental Cell Divisioin., Department of Environmental Sciences, Tamil Nadu Agricultural
University, Coimbatore
26. PWD, Public Workds Department (2001) “Environmental Status Report of the River Noyyal Basin)
PWD Environment cell, WRO Pollachi Region, Coimbatore
PWD, Public Water Department (2002) “ Aprofile of Erode District”, State Ground and Surface Water
Resources Data, Water Resources Organisation
PWD et al (2002) Study on Implementation of Cleaner Production in Textile Industries at Tirupur,
Organisations involved in Project: PWD Water Resources Organisation, Coimbatore. A.S.Q Engineers,
Kuruvikkaranpalayam and School of Energy, PSG College of Technology, Coimbatore India.
Rajaguru, P. and V, Subbaram (2000) “Ground Water Quality in Tirupur” in Environmental Awareness on
Quality Management of Irrigation Waster, Lakshmanaperumalsamy and Krishnarah, Department of
Environmental Sciences, Bharathiyar University, Coimbatore
Ravallion Martin (2001) The Mystery of the Vanishing Benefits: An Introduction to Impact Evaluation.
The World Bank Economic Review. Vol, 15. No I 115- 140.
Sankar U (2001) Economic Analaysis of Environmental Problems in Tanneries and Textile Bleaching and
Dyeing Units and Suggestions for Policy Action, Madras School of Economics,
Senthilnathan S. & Azeez P.A. 1999. Influence of dyeing and bleaching industries on ground water of
Tirupur, Tamil Nadu, India. Bull Environ Contam Toxicol, 62:330-335
Steinar Kvale, 1996 An introduction to Qualitative Research Interviewing
Swaminathan, and J.Jeyaranjan (1995), “The Knitwear Cluster in Tiruppur: An Indian Industrial District in
the Making”, Working Paper No.126, Madras Institute of Development Studies, Chennai.
Stranlund, J.K. (1997), “Public Technological Aid to Support Compliance to Environmental Standards,”
Journal of Environmental Economics and Management 34, 228-39
The High Court of Judicature at Madras, 2006 Writ Petition Nos.2971 and 39368 of 2003
World Bank (1999): “Greening Industry: New Roles to Communities, Markets and Governments”, Oxford
University Press, New York
Venkatachalam L Economic and Political Weekly 2005 (Vol 40) (No. 15) 1556-1560 Damage Assessment
and Compensation to Farmers. Lessons from Verdict of Loss of Ecology Authority in Tamil Nadu.

52
Electronic Resources
1. (AIR1996SC2715).
http://www.legalserviceindia.com/article/l54-Interpretation-of-Polluter-Pays-Principle.html
2. (AIR1996SC2715). http://www.ielrc.org/content/e9607.pdf
3. Eswaramoorthi.S. Dhanapal K., Karpagam J. Zero Discharge - Treatment Options for Textile Dye
Effluent: A Case Study at Manickapurampudur Common Effluent Treatment Plant, Tirupur, Tamil
Nadu. http://www.epicin.org/documents/zero%20discharge.pdf 4. Ezemenari, K., A. Rudqvist
and K. Subbarao (2001) Impact evaluation: a note on concepts and methods http://ciat-
library.ciat.cgiar.org/paper_pobreza/082.pdf
Personal Communications
Chennai, TNPCB, Tamil Nadu Pollution Control Board, District Officials, July, 2007
Dyer, Company Manager, Tirupur August, 2007
Tirupur Dyers Association, Secretary, June 2007
CETP Consultant, Environmental Engineer, Tirupur July 2007
Quality Controller, Dyeing Unit, July 2007
Member of Monitoring Committee July, 2007
Secretary of Farmer’s Association August, 2007

53