Embed Size (px)
Citation preview

International Journal of Food Studies IJFS April 2021 Volume 10 pages 221–232
Industrial Practice for Reducing Defective Sterile MilkProducts Produced Using Overpressure Rotary Retorts
Muhamad Wahyu Pamujia, Eko Hari Purnomoa, and Azis Boing Sitangganga
a Department of Food Science and Technology, IPB University, Jalan Raya Dramaga Kampus IPB DramagaBogor 16680, West Java, Indonesia
*Corresponding [email protected].: +62-251-8626725
Received: 6 March 2020; Published online: 18 April 2021
Abstract
Indonesian consumers are fond of commercially sterilized milk as indicated by increasing productsales. High demand for products intensifies the need to increase productivity, generally achieved byminimizing product defects. This study aimed to reduce the number of defects in commercially ster-ilized milk produced using overpressure rotary retorts. Based on Pareto analysis, the percentage ofdefective products was 5.14% of which 2.37% were dented bottles. A cause-effect diagram (IshikawaDiagram) was used to find the root cause of dented bottles. The pressure difference between the retortchamber (external pressure) and inside the product packaging (internal pressure), and the number ofbottles stacked inside the retort basket (bottle density) were found as major factors for causing dentedbottles. The internal pressure was 1.20 bar higher than the external pressure. By reducing the pressuredifference to 0.40 bar, the percentage of dented bottles could be reduced to 0.79%. Applying the low-est bottle density (73% of the retort basket area occupied by bottles) during the sterilization processcould decrease the number of dented bottles, however, it also increased the appearance of striped lids.The best conditions for sterilization (pressure difference = 0.40 bar; number of bottles/basket = 1938bottles) which were used in the three-month full-scale production trial reduced the percentage of de-fective products from 5.14% to 2.24% of which 0.76% were dented bottles. Setting the retort pressureat 2.80 bar could avoid 52,920 defective bottles of commercially sterilized products per month.
Keywords: Commercially sterilized milk; Product defects; Dented bottles; Overpressure rotary retorts;Sterilization
1 Introduction
Based on the Neilsen RMS 1st quarter of 2019Survey in Indonesia, consumption of liquid andpowder milk increased by 11% and 5%, respect-ively. Increased consumption of liquid milk inIndonesia makes competition among producerseven tighter. To remain competitive notably re-quires continuous innovation and cost reductionstrategies during the production of dairy-basedproducts (Kong, Yang & Xu, 2019; Magnus-
son & Berggren, 2017). In terms of improvinga product’s quality and productivity, reducingproduct defects may be considered as a strategy(Zhang, Kano, Tani, Mori & Harada, 2018).According to Ahmad and Ginantaka (2018),product defect categories in commercially ster-ilized bottled milk are leak, blown, nonstandardlabel, no coding, dented bottle, narrow seal, fol-ded, wrinkle and overheat. The bottle used forcommercially sterilized milk is mostly made ofHDPE (high-density polyethylene) (Potts, Amin
Copyright ©2021 ISEKI-Food Association (IFA) 10.7455/ijfs/10.1.2021.a8

222 Pamuji et al.
& Duncan, 2017). As an elastic material, HDPEbottles will expand when exposed to heat (Zheng,Zhang, Ma, Wang & Yu, 2019). Balancing theinternal and external pressure of the packagingduring the sterilization process is importantto prevent deformation defects in semi-flexiblepackaging (Hariyadi, 2017). Primanintyo, Syafeiand Luviyanti (2016) reported a successful ap-plication of the six sigma method to reduce de-fects in the production of car tyres. A similar ap-proach to decrease product defects in the textileindustry (Heijacker company) was also reportedby Wulandari and Bernik (2018). These studiesindicated that product defects could be reducedby up to 50%. This study aims to reduce thenumber of defective commercially sterilized milkproducts in HDPE bottle produced using over-pressure rotary retorts.
2 Materials and Methods
2.1 Materials
High-density polyethylene (HDPE) bottles(volume of 140 mL) produced by Kalbe MilkoIndonesia Company were used in this research.Commercially sterilized milk was producedaccording to the standard operating procedures(SOP) of the company. The sterilization processwas carried out using a Stock DFT RickermanSRX 1300-4-HV-PS overpressure rotary retort(Germany) equipped with PicoVACQ OrionTMI 1 C data logger (France) and an EllabTrack Sense Pro - Wireless Data Logger (Den-mark). Statistical data analysis was carried outby Minitab 19 (United States).
2.2 Methods
Pareto Analysis
Data used for Pareto analysis was from the pro-duction period of March 2018-February 2019 atthe Kalbe Milko Indonesia Company. The defectcategories and number of defects were collectedduring this period. Based on the Pareto analysis,the defect category with the highest percentageof all defects was further investigated and dis-cussed within this study.
Cause-effect Analysis for the SelectedProduct Defect Category
An Ishikawa (fishbone) diagram was used to in-vestigate the selected product defect category.Factors causing the defect in the selected productdefect category were analyzed through discus-sions with machine suppliers and production, en-gineering and utilities unit staff in the company.The cause-effect analysis covered four aspects:man, method, machine and material. The pos-sible root causes of each aspect were determinedby focus group discussions.
Improvement of the Largest DefectCategory
Possible root causes obtained from the cause-effect analysis were mitigated and implementedduring production. During the production trial,the heat adequacy of the sterilization process wasmeasured in terms of minimum F0 value. TheF0 value was determined using the trapezoidalmethod, based on dynamic product temperaturesrecorded by the data logger (Ellab Track SensePro Wireless Data Logger).
Verification of Improvement inResults
A 3-month production trial was carried out toverify the improvement. The improvement wasquantified by comparing data from the 3-monthproduction trial and the production for oneyear prior to this study covering the number ofproduct defects in all identified defect categories.
3 Results and Discussion
3.1 Pareto Analysis of ProductDefects
Pareto analysis is used to analyze a series of pro-cesses that aim to overcome weaknesses or prob-lems that arise (Wang & Choi, 2019). Paretoanalysis focuses on risk that might occur whendesigning and modifying a process. The Paretoanalysis principle lies in determination of the20% of main causes that must be dealt with so
IJFS April 2021 Volume 10 pages 221–232

Reducing defective sterile milk products 223
as to solve 80% of the problems. Absolute val-ues can be arranged in Pareto diagrams to showwhich technical characteristics are the most im-portant and the risk priorities of existing require-ments (Erdil, 2019). Pareto analysis is also usedto prioritize determinants that can be a focus forimprovement (Shivajee, Singh & Rastogi, 2019).Pareto diagrams of defective products fromMarch 2018 to February 2019 are shown in Fig-ure 1. The largest contributor to total productdefects was dented bottles (2.37 %). Totalproduct defects were 5.14% of the total pro-duction. Therefore, dented bottles contributed46.07% of the total product defects. In thisstudy, the dented bottle defect category becamethe priority for improvement to identify the rootcause through fishbone diagram analysis.
3.2 Cause-effect Analysis for theLargest Product DefectCategory
Dented bottles were observed to occur during thesterilization production process. The determina-tion of cause-effect in the Ishikawa’s diagram isunlimited but it can be used to determine signi-ficant factors (Simanova & Gejdos, 2015). Fish-bone diagrams require a focus group discussionas the main tool to identify the main problem(Elleuch, Dafaoui, El Mhamedi & Chabchoub,2016). Through discussions with machine sup-pliers, production teams, engineering teams andthe utility team, the main causes of the prob-lem for each factor were found. The cause-effectanalysis results are shown in Figure 2.
Man
The man factor in the cause-effect analysis isthe operator who operates the retort. Retortoperators’ technical knowledge, technical skillsand technical behavior were evaluated by expertsfrom the machine supplier. Each production shifthad one operator of the retort and there werethree shifts in one day. Every year, the supplierprovides refresher training for the operators andassesses their competencies. An evaluation of op-erators’ competencies was based on pre-test andpost-test results, with a minimum pass score of
8.0. Based on Table 1, the technical knowledge,technical skills and technical behavior of the op-erators meet the supplier’s standards. Therefore,the retort operator is not the cause of dentedbottles.
Table 1: Pretest and posttest scores for retortoperators trained by the machine supplier.
Operator Pretest Posttest Note
Operator A 8.0 10.0 PassOperator B 8.5 9.5 PassOperator C 8.0 9.5 Pass
Machine
Closed containers of the food to be sterilizedare placed in the retort for a certain time, athigh temperature and pressure. A commonlyused material of containers in a retort process isHDPE (High-Density Polyethylene) plastic. Thesterilization process used with semi-flexible pack-aging requires over pressure to maintain the in-tegrity of the packaging. Packaging damage canoccur due to an improper combination of in-creased pressure and expansion of the productin the containers (Augusto, Tribst & Cristianini,2014). The sterilization process parameters thatmust be controled are temperature, time, pres-sure and temperature distribution in the retort(Hariyadi, 2017). The retort supplier ensures thegood working condition of the retort through aretort maintenance agreement. The supplier’sannual retort inspection report in June 2018showed that the retorts were in good conditionand working properly. A reading from the re-tort thermometer was within the tolerance limitbased on the calibration results. The retort ther-mometer calibration was performed at temper-atures between 100.00 oC and 122.00 oC, witha maximum correction of + 0.1597 oC which isbelow the maximum correction required by themaker (± 0.5000 oC). Other checks were carriedout on the timer used in the retort, the pressuregauge of the retort, the rotary speed of the bas-ket and the sterilization value obtained by theproducts. Checks on the timer were carried outfrom 5 minutes to 15 minutes, with the results of
IJFS April 2021 Volume 10 pages 221–232

224 Pamuji et al.
Figure 1: Pareto diagram of product defect categories during one year of production
Figure 2: Fishbone diagram for the dented bottle defect category
correction at 10 minutes showing 1 second. Thistime correction is within the maximum correc-tion limit required of 5 seconds. The pressuregauge calibration was carried out in the range of1 bar to 4 bar. The correction value of the pres-sure gauge was + 0.011 bar which is below themaximum correction of ± 0.050 bar. The rota-tional speed of the basket was inspected at 800to 1000 rpm. Correction for the rotational speedwas + 5 rpm which is lower than the maximumtolerable value of ± 10 rpm. The validation ofthe sterilization value results ranged from 10.41- 13.29 minutes which meet the required min-imum sterilization value of 10.00 minutes. Based
on these annual inspection results it can be con-cluded that the over pressure rotary retort is ingood condition and effectively performs the re-quired sterilization process.
Material
Material factors observed in the fishbone dia-gram are specifications of bottles and lids. Thebottle used is a single layer type HDPE, with acolorant agent. The HDPE material functionsas a radiation barrier and oxygen barrier. In-spection of bottles was carried out by compar-ing the required and actual specifications. Based
IJFS April 2021 Volume 10 pages 221–232

Reducing defective sterile milk products 225
Figure 3: Position of dents in a defective bottle
Table 2: Physical properties of HDPE bottles (April 2019)
Parameters Result Standard Unit Note
Glass Transition 132.25 > 130 oC PassWall thickness (S1) 1.1 0.9-1.2 mm PassWall thickness (S2) 1.1 0.8-1.2 mm PassWall thickness (S3) 0.4 0.5-1 mm PassWall thickness (S4A) 0.6 0.35-0.8 mm PassWall thickness (S4B) 0.6 0.35-0.8 mm PassWall thickness (S5) 0.6 0.35-0.8 mm PassWall thickness (S6) 1.3 0.6-1.6 mm PassSealing area 3.4 2.5-3.5 mm PassO2 Transfer 10.5 < 11.0 Ö 1010 cm3/ cm2/mm/sec/cmHg PassH2O Transfer 30.5 < 32.0 Ö 1010 cm3/ cm2/mm/sec/cmHg Pass
IJFS April 2021 Volume 10 pages 221–232

226 Pamuji et al.
Table 3: Cp and Cpk for bottle wall thicknessparameters (S1-S6)
Sampling point Cp Cpk
S1 0.56 0.56S2 0.57 0.57S3 0.54 0.54S4A 0.55 0.55S4B 0.55 0.54S5 0.56 0.57S6 0.53 0.54
on the results shown in Table 2, it can be con-cluded that all the specified parameters werewithin the required standards. Release analysisis normally carried out for every bottle arrivalonce a year. The last release analysis was inApril 2019. Plastic bottle thickness distributionand glass transition temperature are two possiblepackaging factors to cause dented bottles. Posi-tion of dents in a defective bottle after steriliza-tion is shown in Figure 3. The thickness distri-bution is checked for every release and the glasstransition temperature is checked annualy. Thebottle thickness distribution, analyzed by Min-itab 19, is shown in Table 3 and the bottles meetthe specifications since Cp is equal to Cpk, asalso indicated in Figure 4 and Figure 5. Cp isan index of short-term process capability, wherecalculations only pay attention to the distribu-tion of data but do not pay attention to datacentering. Cpk is an index of short-term processcapability, where calculations focus on the distri-bution and centering of data (Aslam, Wu, Azam& Jun, 2013) It can be concluded that the ma-terial factor has no effect on a dented bottle.The glass transition temperature of HDPE is132.25 oC which is much higher than the ster-ilization temperature of 121.0 oC. Therefore, thesterilization temperature is unlikely to cause den-ted bottles. Other possible factors that con-tribute to dented bottles are the packaging per-meability and the structure of the bottle. Per-meability of HDPE to O2 is 10.5 × 1010 cm3/cm2/mm/sec/cmHg and to H2O is 30.5Ö 1010cm3/ cm2/mm/sec/cmHg. These permeabilityvalues meet the standards as specified in Table
2.Ring design contributes to strength of the bottlestructure. The HDPE bottles used in this studyhave 4 circular rings, with a diameter of 2 mm.The aluminium lid to seal the HDPE bottle hasthree different layers, i.e. aluminum, adhesiveand LDPE. Table 3 indicates that all the lid para-meters assessed are within the required standardsand may not be the major cause of the dentedbottle.
Method
Commercially sterilized milk is processed usinga rotary over pressure retort. Process paramet-ers which are important and may contribute todented bottles are temperature, pressure and thepercentage of the retort basket area occupied bybottles (bottle density). The temperature andpressure profiles during the sterilization processare shown in Figure 6. The maximum temperat-ure experienced by products and the packagingmaterial is 121.0 oC which is much lower thanthe glass transition temperature as already dis-cussed above. More importantly, a process para-meter that potentially causes dents on the plasticbottle is pressure difference. Figure 6 shows thatexternal pressure in the retort is 2.00 bar andthe internal pressure in the bottle is 3.20 bar.An imbalance between external pressure and in-ternal pressure may deform packaging, especiallyfor packaging materials that cannot stand a highpressure difference. Hariyadi (2017) stated thatthere is excess pressure on over-pressure retortswhich serves to keep the packaging from expand-ing too much and causing damage to the pack-aging. When the retort pressure is too low, thepackaging expands because the internal pressureis higher than the external pressure. A pres-sure imbalance causes the product to expand andbottles to contact each other leading to dents.From focus group discussions it was agreed thatpressure in the retort during the sterilization pro-cess is the main possible cause of dented HDPEbottles. A plan to reduce the pressure differencewas developed for process improvement. Anotherpossible cause of dented bottles from the methodperspective is the percentage of the retort basketarea occupied by bottles (bottle density). Thebottle density used during normal production
IJFS April 2021 Volume 10 pages 221–232

Reducing defective sterile milk products 227
Figure 4: Control normal capability sixpack report on S4A for incoming bottles: March 2018-February2019
Figure 5: Control normal capability sixpack report on S4B for incoming bottles: March 2018-February2019
IJFS April 2021 Volume 10 pages 221–232
228 Pamuji et al.
Figure 6: Chart of the sterilization process at retort sterilization temperature 121 oC, sterilization time10 minutes, retort pressure 2.00 bar and 82% bottle density.
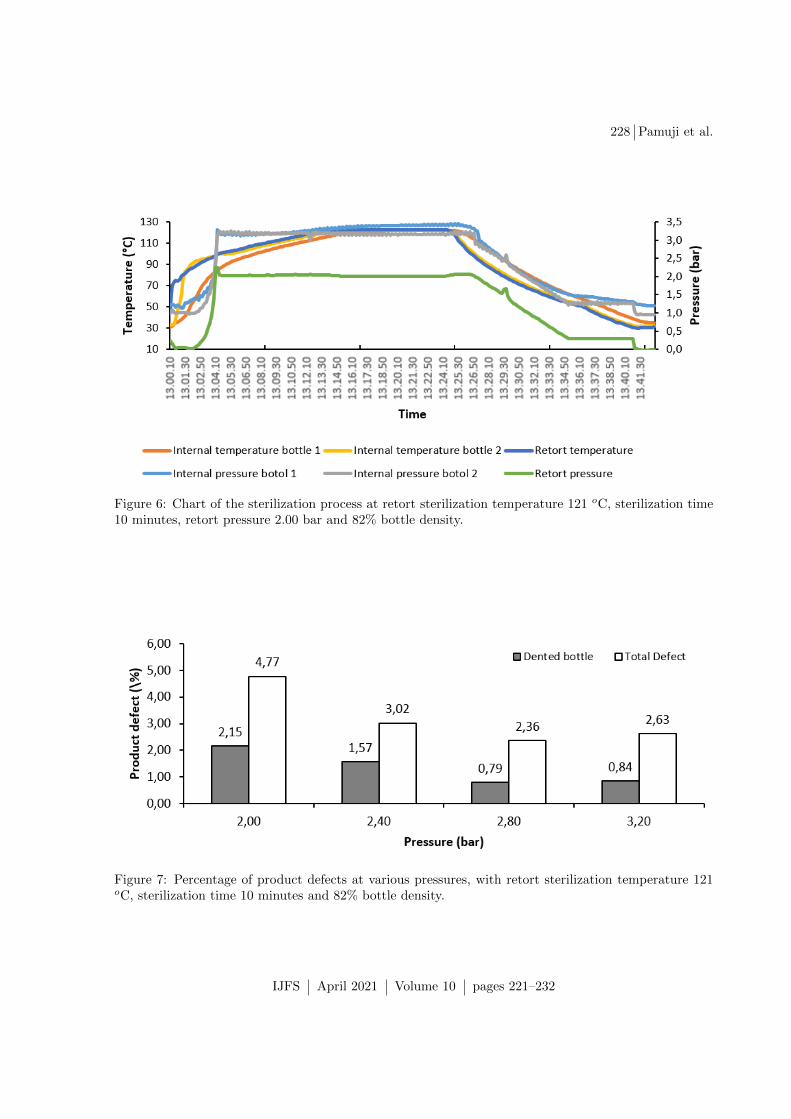
Figure 7: Percentage of product defects at various pressures, with retort sterilization temperature 121oC, sterilization time 10 minutes and 82% bottle density.
IJFS April 2021 Volume 10 pages 221–232

Reducing defective sterile milk products 229
Table 4: Physical properties of aluminium lids (April 2019)
Parameters Result Standard Unit Note
External limitation Conform Conform - PassWidth Tolerance 116 114 - 118 mm PassThickness Tolerance 125 123 - 127 µm PassPeel strength 10.28 > 3.5 N/15mm PassHeat sealing 41.69 > 4 40.00 N/15mm PassSterilization at 121 oC (30 min) Conform Conform - Pass
routine is 82%. For futher improvement, exper-iments were carried out by reducing the bottledensity from 82% to 77% and 73% at optimumretort pressure.
3.3 Improvement of the LargestDefect Category
The improvement plan to reduce dented bottledefects was executed by increasing retort pres-sure from 2.00 bar to 2.40 bar, 2.80 bar and3.20 bar. The experimental results are shownin Figure 7, where an increasing pressure de-creased the percentage of dented bottle. A bet-ter balance between internal and external pres-sure in the bottle reduces the number of dentedbottles. Least dented bottles was obtained at aretort pressure of 2.80 bar, where 2.36% of allproducts produced were defective and 0.79% ofall products were dented bottle defects. Basedon this result, the retort pressure used in study-ing the effect of bottle density was 2.80 bar.Reducing the number of defective HDPE bottlesby increasing the retort pressure may affect thesterility level received by the products. There-fore, it was necessary to measure the sterilitylevel (F0 value) by performing a heat penetra-tion test using 12 data loggers. F0 values werecalculated using a trapezoidal method, with a zvalue of 10 oC based on Clostridium botulinum(Membre & van Zuijlen, 2010). Minimum F0
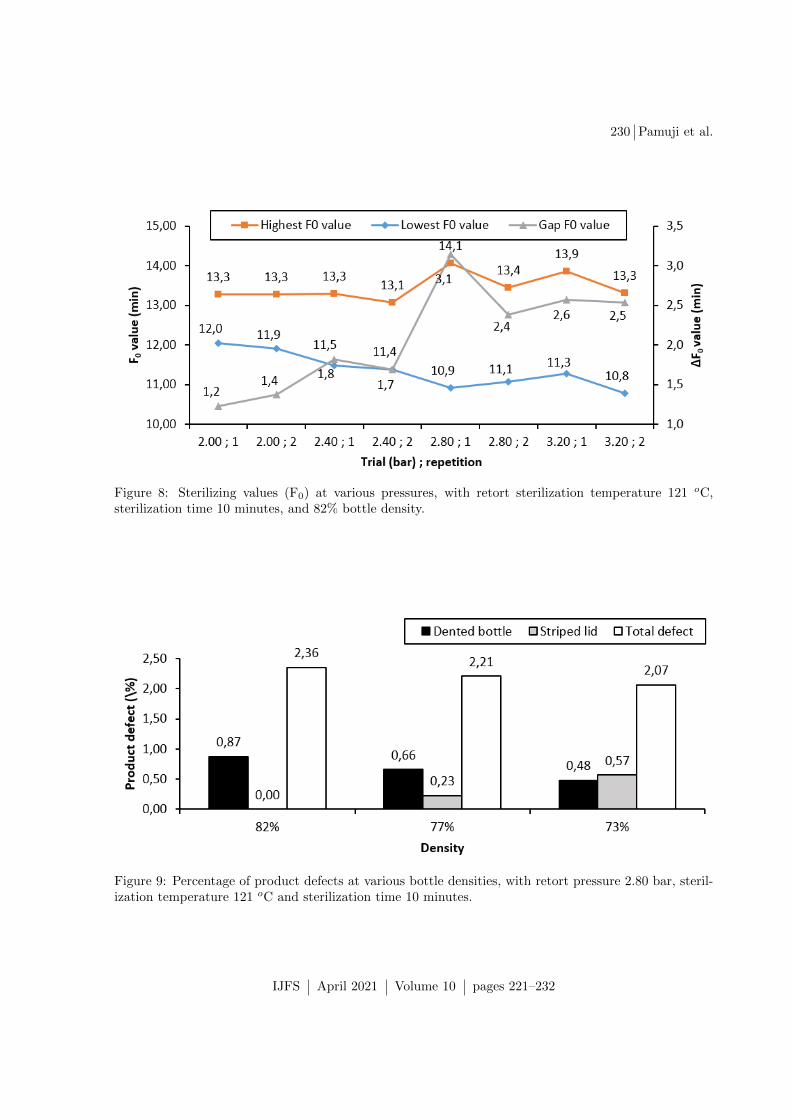
and maximum F0 results, and their difference,are shown in Figure 8. All F0 values were greaterthan 10 minutes which indicates that the steril-ization process was sufficient.The bottle density is the percentage of the re-tort basket area (6,496 cm2) occupied by bottles.
A reduction in bottle density from 82% to 77%and 73% was expected to provide the right dis-tance for bottles to expand. Based on the resultsshown in Figure 9, it can be concluded that re-ducing bottle density reduces total defects anddented bottles. However, there was an increasein striped lid defects caused by friction betweenthe aluminum lid and spacer mat due to loosespace when the basket rotates, and a reductionin productivity. Therefore, this strategy to re-duce bottle density was considered ineffective asa solution for reducing product defects.
3.4 Verification of ImprovementResults
According to Giwa et al. (2019), experiment res-ults obtained on a process over a short-termperiod of time need to be verified over a long-term period of time. Studying the processover a long-term p period of time can accom-modate other factors that did not appear dur-ing the short-term study of the process. Theresults of the long-term study over a three-month period, where 3,495,726 bottles were pro-duced, are shown in Figure 10. 2.24% of allproducts sterlized were defective and 0.76% ofall products were dented bottle defects. Theseresults are comparable with those obtained dur-ing the production trial at 2.80 bar (2.63% of allproducts defective and 0.79% dented bottle de-fects). Therefore, it can be concluded that an in-creased retort pressure to maintain pressure bal-ance in the HDPE bottles can result in a reducednumber of dented bottle defects during the com-pany’s routine production. By applying a retortpressure of 2.80 bars can reduce the percentage of
IJFS April 2021 Volume 10 pages 221–232
230 Pamuji et al.
Figure 8: Sterilizing values (F0) at various pressures, with retort sterilization temperature 121 oC,sterilization time 10 minutes, and 82% bottle density.
Figure 9: Percentage of product defects at various bottle densities, with retort pressure 2.80 bar, steril-ization temperature 121 oC and sterilization time 10 minutes.
IJFS April 2021 Volume 10 pages 221–232

Reducing defective sterile milk products 231
Figure 10: Percentage of product defects during three-month production, with retort pressure 2.80 bar,sterilization temperature 121 oC, sterilization time 10 minutes and 82% bottle density.
defective products produced by the company by2.9%. Based on the monthly production volume,the company gains an additional output of 73,080bottles which is equivalent to USD 16,733 permonth.
4 Conclusion
Production of commercially sterilized millk inHDPE bottles experienced product loss, where5.14% of all products produced were defectiveand 2.37% of all products were dented bottle de-fects. Dented HDPE bottles was the largest de-fect category based on Pareto analysis. Basedon the cause-effect diagram, the root cause ofthe dented bottles was a pressure imbalance ex-perienced by the bottles during the sterilizationprocess. The retort pressure was 2.00 bar, whilethe internal pressure was 3.20 bar. These condi-tions cause the product to expand and bottlesto contact each other leading to dents. Pro-duction trials carried out at a retort pressure of2.80 bar improved the process, where 2.36% ofall products produced were defective and 0.79%of all products were dented bottle defects. Ap-plying a lower bottle density during the ster-ilization process could decrease the number ofdented bottles, however, it increased the num-
ber of striped lid defects and reduced productiv-ity. The best conditions for sterilization (retortpressure = 2.80 bar; number of bottles/baskets= 1938 bottles) were verified over a three-monthfull-scale production trial. By applying a retortpressure at 2.80 bar the percentage of defectiveproducts could be reduced by 2.9%, and in re-turn this could save the company up to 73,080bottles monthly (equivalent to USD 16,733).
References
Ahmad, S. & Ginantaka, A. (2018). Pengaruhperlakuan fisik dan variasi produk secondgrade terhadap kebocoran dan sifat fisikpada produk industri susu dalam kemasanbotol. Jurnal Agroindustri Halal, 4 (1), 10–21. Retrieved from https://ojs.unida.ac.id/Agrohalal/article/view/010-021
Aslam, M., Wu, C.-W., Azam, M. & Jun, C.-H.(2013). Variable sampling inspection forresubmitted lots based on process cap-ability index Cpk for normally distrib-uted items. Applied Mathematical Model-ling, 37 (3), 667–675.
Augusto, P. E. D., Tribst, A. A. L. & Cristianini,M. (2014). THERMAL PROCESSES —Commercial Sterility (Retort). In C. A.
IJFS April 2021 Volume 10 pages 221–232

232 Pamuji et al.
Batt & M. L. Tortorello (Eds.), Encyclo-pedia of food microbiology (second edition)(Second Edition, pp. 567–576). doi:10 .1016/B978-0-12-384730-0.00405-5
Elleuch, H., Dafaoui, E., El Mhamedi, A. &Chabchoub, H. (2016). A quality functiondeployment approach for production resi-lience improvement in supply chain: Caseof agrifood industry. IFAC Papersonline,49 (31), 125–130. 12th IFAC Workshop onIntelligent Manufacturing Systems (IMS),Austin, TX, DEC 05-07, 2016. doi:10.1016/j.ifacol.2016.12.173
Erdil, A. (2019). An evaluation on lifecycleof products in textile industry of turkeythrough quality function deployment andpareto analysis. Procedia Computer Sci-ence, 158, 735–744. doi:10 .1016/ j .procs .2019.09.109
Giwa, A. S., Xu, H., Chang, F., Wu, J., Li,Y., Ali, N., . . . Wang, K. (2019). Effect ofbiochar on reactor performance and meth-ane generation during the anaerobic di-gestion of food waste treatment at long-run operations. Journal of EnvironmentalChemical Engineering, 7 (4). doi:10.1016/j.jece.2019.103067
Hariyadi, P. (2017). Teknologi proses termal un-tuk industri pangan. Media Pangan In-donesia Bogor.
Kong, D., Yang, X. & Xu, J. (2019). Energyprice and cost induced innovation: Evid-ence from china. Energy, 192. doi:10.1016/j.energy.2019.116586
Magnusson, T. & Berggren, C. (2017). Com-peting innovation systems and the needfor redeployment in sustainability trans-itions. Technological Forecasting and So-cial Change, 126, 217–230. doi:10.1016/j.techfore.2017.08.014
Membre, J.-M. & van Zuijlen, A. (2010). A prob-abilistic approach to determine thermalprocess setting parameters: Applicationfor commercial sterility of products. In-ternational Journal of Food Microbio-logy, 144 (3), 413–420. doi:10 . 1016 / j .ijfoodmicro.2010.10.028
Potts, H. L., Amin, K. N. & Duncan, S. E.(2017). Retail lighting and packaging in-fluence consumer acceptance of fluid milk.
Journal of Dairy Science, 100 (1), 146–156.doi:10.3168/jds.2016-11673
Primanintyo, B., Syafei, M. Y. & Luviyanti, D.(2016). Analisis penurunan jumlah defectdalam proses tire-curing dengan penerapankonsep six sigma. Journal of Industrial En-gineering, 1 (2).
Shivajee, V., Singh, R. K. & Rastogi, S. (2019).Manufacturing conversion cost reductionusing quality control tools and digitizationof real-time data. Journal of Cleaner Pro-duction, 237. doi:10.1016/j . jclepro.2019.117678
Simanova, L. & Gejdos, P. (2015). The use ofstatistical quality control tools to qual-ity improving in the furniture business.In A. Sujova & L. Krajcirova (Eds.), In-ternational scientific conference: Businesseconomics and management (bem2015)(Vol. 34, pp. 276–283). Procedia Econom-ics and Finance. 9th International ScientificConference on Business Economics andManagement (BEM), Tech Univ Zvolen,Izmir, TURKEY, APR 30-MAY 02, 2015.Wood Congress; Tech Univ Zvolen, DeptBusiness Econ. doi:10 . 1016 / S2212 -5671(15)01630-5
Wang, S. Y. & Choi, S. H. (2019). Pareto-efficientcoordination of the contract-based mtosupply chain under flexible cap-and-tradeemission constraint. Journal of CleanerProduction, 250. doi:10 . 1016 / j . jclepro .2019.119571
Wulandari, I. & Bernik, M. (2018). Penerapanmetode pengendalian kualitas six sigmapada heyjacker company. EkBis: JurnalEkonomi dan Bisnis, 1 (2), 222–241.
Zhang, X., Kano, M., Tani, M., Mori, J. &Harada, K. (2018). Defect data modelingand analysis for improving product qualityand productivity in steel industry. In Com-puter aided chemical engineering (Vol. 44,pp. 2233–2238). Elsevier.
Zheng, X., Zhang, X., Ma, L., Wang, W. &Yu, J. (2019). Mechanical characterizationnotched high density polyethylene (hdpe)pipe: Testing and prediction. InternationalJournal of Pressure Vessels and Piping,173, 11–19. doi:10.1016/j.ijpvp.2019.04.016
IJFS April 2021 Volume 10 pages 221–232