Embed Size (px)
Citation preview

Industrial production of biogas through
co-digestion of waste glycerol and sewage sludge
Research upon the effects of addition of crude glycerol to a large scale
digestion chamber of a municipal wastewater treatment plant.
Gustav Fröléen
Stockholm 2016
Industrial biotechnology
School of biotechnology
Kungliga Tekniska Högskolan

I
Abstract
Biogas production poses a good example of how wastes can be a useful resource for society. In
this master thesis large scale production of biogas through co-digestion of sewage sludge from
Henriksdal wastewater treatment plant with crude glycerol from the biodiesel industry is
evaluated with the goal to increase the methane production twofold.
The production of biogas from two full-scale reactors was monitored over time where one
reactor was given glycerol and sewage sludge whilst the other reactor received only sewage
sludge, thus becoming a reference. 78% of the theoretical methane potential of the added
glycerol was obtained at a loading rate double of the control. The consequence of the glycerol
addition was an increase in methane production by 74%, a decrease in pH by 0,25 pH-units and
in ammonium by 37%. The TS (total solids) increased by 18% while VS (volatile solids) and
VFA (volatile fatty acids) concentrations did not change. Finally, bicarbonate alkalinity showed
a trend where it dropped by up to 10%, heavy metals concentration did not change and the
reduction of VS increased with 38 % at an OLR of glycerol at 1,5 kg VS/m3,day.
It was concluded that with the addition of crude glycerol a near doubling in methane production
could be reached, accompanied with improvements in digester condition regarding the reduced
ammonium concentration. Through the addition of glycerol there was also a lowering of the pH
in the digester. A stability evaluation was performed and showed that the digester remained
stable with the addition of glycerol.

II
Sammanfattning
Biogasproduktion utgör ett bra exempel på hur avfall kan vara en användbar resurs för samhället.
I denna masteruppsats utvärderas storskalig produktion av biogas genom samrötning av
avloppsslam från Henriksdal avloppsreningsverk med orenat glycerol från biodiesel-industrin
med målet att öka metanproduktionen tvåfaldigt.
Produktionen av biogas från två fullskaliga reaktorer övervakades med tiden där en av
reaktorerna tillfördes glycerol och avloppsslam medan den andra reaktorn enbart beskickades
med avloppsslam och därmed blev en referens. 78% av den teoretiska metanpotentialen hos det
tillförda glycerolet erhölls vid en belastning som var dubbelt så stor som referensreaktorns.
Konsekvenserna av glyceroltillförseln var en ökning i metanproduktion på 74%, en sänkning i
pH med 0,25 pH-enheter och en sänkning i ammoniumkoncentration om 37%. TS
(torrsubstansen) ökade med 18% medan VS (glödförlust) och VFA (organiska syror) var
oförändrat. Slutligen visade bikarbonat-alkaliniteten en trend där den sjönk med upp till 10%,
tungmetallkoncentrationen förändrades inte och reduktionen av VS ökade med 38% vid en OLR
av glycerol på 1,5 kg VS/m3,dygn.
Slutsatsen drogs att med tillförseln av obearbetat glycerol kunde en nära fördubbling av
metanproduktionen uppnås tillsammans med förbättringar i rötkammar-förhållanden med
avseende på den reducerade ammonium-koncentrationen. Genom tillförseln av glycerol
observerades också en sänkning av pH i rötkammaren. En stabilitetsutvärdering genomfördes
och visade att rötkammaren bibehöll sin stabilitet med tillförseln av glycerol.
III
Acknowledgements
There are many people who have greatly contributed to the possibility of carrying out this master
thesis. To start with, I would like to thank my three main supervisors Björn Magnusson, Jörgen
Ejlertsson, and Martin Johansson who have been central to the progress of my work. A thank you
also goes to the project owner Ragnar Stare who have contributed with a lot of valuable
experience within the profession of industrial engineering and project management. I would like
to thank Anna Karlsson at Scandinavian Biogas for providing valuable feedback on the thesis
report.
As for my orientation in this project at Henriksdal, I would like to thank Andreas Carlsson at
SVAB for taking the time and effort of continuously helping me get to know the WWTP and
many of the procedures necessary to carry out for the project. Thanks to Ida Andersson and
Carina Almé at Scandinavian Biogas R&D in Linköping for teaching me how to perform a
number of central analysis methods and helping me with a variety of issues that presented
themselves during the master thesis.
I would also like to thank my teacher Gen Larsson, not only for putting up as examiner of this
master thesis but also for the many interesting and educational courses she has held. These
courses are largely accountable for making me realize my interest in waste water purification and
production of biofuels, not to mention that it was she who encouraged me to contact
Scandinavian Biogas in the first place which resulted in this highly appreciated master thesis.
Honestly put, my master thesis and my time at Henriksdal WWTP and the facilities of
Scandinavian Biogas in Stockholm and Linköping has without doubt been one of the most
exciting, challenging and rewarding times of my life. Never before have I been able to give vent
to my curiosity in such an honest way. This thesis has been a pleasure to work with.

Table of contents Abstract....................................................................................................................................... I
Sammanfattning ......................................................................................................................... II
Acknowledgements ....................................................................................................................III
Abbreviations ......................................................................... Fel! Bokmärket är inte definierat.
Introduction ............................................................................ Fel! Bokmärket är inte definierat.
Goal ................................................................................... Fel! Bokmärket är inte definierat.
Strategy .............................................................................. Fel! Bokmärket är inte definierat.
Hypothesis ......................................................................... Fel! Bokmärket är inte definierat.
Background ............................................................................ Fel! Bokmärket är inte definierat.
Henriksdal WWTP .............................................................. Fel! Bokmärket är inte definierat.
Biochemistry of digestion .................................................... Fel! Bokmärket är inte definierat.
Materials and methods ........................................................... Fel! Bokmärket är inte definierat.
Cultivation technology ........................................................ Fel! Bokmärket är inte definierat.
pH ...................................................................................... Fel! Bokmärket är inte definierat.
VFA .................................................................................... Fel! Bokmärket är inte definierat.
Ammonium ......................................................................... Fel! Bokmärket är inte definierat.
COD ................................................................................... Fel! Bokmärket är inte definierat.
TS and VS .......................................................................... Fel! Bokmärket är inte definierat.
Alkalinity ............................................................................. Fel! Bokmärket är inte definierat.
Heavy metals ...................................................................... Fel! Bokmärket är inte definierat.
Methane concentration and biogas production ................... Fel! Bokmärket är inte definierat.
Calculations on theoretical methane yield from glycerol ..... Fel! Bokmärket är inte definierat.
Glycerol feed ...................................................................... Fel! Bokmärket är inte definierat.
Results ................................................................................... Fel! Bokmärket är inte definierat.
Biogas and methane production ......................................... Fel! Bokmärket är inte definierat.
Yield for conversion of glycerol to methane ......................... Fel! Bokmärket är inte definierat.
pH ...................................................................................... Fel! Bokmärket är inte definierat.
VFA .................................................................................... Fel! Bokmärket är inte definierat.
Ammonium ......................................................................... Fel! Bokmärket är inte definierat.
TS and VS .......................................................................... Fel! Bokmärket är inte definierat.

Alkalinity ............................................................................. Fel! Bokmärket är inte definierat.
Heavy metals ...................................................................... Fel! Bokmärket är inte definierat.
Volatile solids reduction ...................................................... Fel! Bokmärket är inte definierat.
Discussion ............................................................................. Fel! Bokmärket är inte definierat.
Sources of error .................................................................. Fel! Bokmärket är inte definierat.
Conclusion ............................................................................. Fel! Bokmärket är inte definierat.
Future work ............................................................................ Fel! Bokmärket är inte definierat.
References ............................................................................ Fel! Bokmärket är inte definierat.
Appendix 1. Calculations
Appendix 1A. Calculation of COD in methane
Appendix 1B. Calculations on change in pH, alkalinity and ammonia
Appendix 1C. Calculations on VS-reduction
Appendix 2. Miscellaneous
Appendix 2A. Stratification issues in crude glycerol-tank
Appendix 2B. Development of H2S and calculations on sulphate reduction

1
Abbreviations
WWTP: Wastewater treatment plant
SBF: Scandinavian Biogas Fuels AB
SVAB: Stockholm Vatten AB
CSTR: Continuously stirred tank reactor
VFA: Volatile fatty acids
TS: Total solids
VS: Volatile solids
FS: Fixed solids
OLR: Organic loading rate
VSR: Volatile solids reduction
2
Introduction
All modern societies depend on a handful of basic resources where food, water and energy
constitute the foundation. These resources should be utilized in the best possible way, one
example is the utilization of wastes for production of biofuels. Digestion of sewage sludge offers
a possibility of both reducing the amount of waste sludge to be managed and producing
renewable biofuels. Many of the larger wastewater treatment plants (WWTP) found worldwide
are digesting the sludge they receive to produce biogas that can then be sold to external
consumers or be used internally.
The company Scandinavian Biogas Fuels (SBF) wishes to increase the production of biogas from
the anaerobic digesters at Henriksdal WWTP and in order to do this, substrate in addition to
sludge from the WWTP is needed. Previous lab-scale studies performed by the company have
shown that an increase in production of methane by almost 100% is possible if additional organic
material in the form of waste glycerol from the biodiesel industry is supplied as a co-substrate .
Henriksdal WWTP, owned by Stockholm Vatten AB (SVAB) and located in Nacka, Stockholm,
hosts the digesters where the full-scale pilot test for SBFs co-digestion was performed. Data
from two full-scale digesters (D5 and D6) were used, both of the model Continuously Stirred
Tank Reactor (CSTR) with a total volumetric capacity of 6900 m3
each and a liquid volume of
6700 m3. Reactor D6 was used as a reference whilst D5 was used for the co-digestion of sludge
and glycerol.
Presently, state of the art technology for digestion of sewage sludge and wastewater covers one-
phase systems. Continuous Stirred Tank Reactors (CSTR) and Upflow Anaerobic Sludge
Blanket (UASB) reactors are the two main systems employed for wet digestion (total solids <
10%, UASB often utilizes lower TS-percentages), where CSTR is more suited for digestion of
waters with high content of suspended solids and the UASB technics is mainly used to treat large
volumes of water with low levels of suspended solids. The CSTR is the most common one of
these two (Weiland, P. 2010).
The two digesters used in the pilot test have a HRT (hydraulic retention time) of 18 days
(Carlsson A., 2015). The two digesters were run under conditions as similar as possible during
the pilot test to ensure that a proper reference digester is available. This, in combination with a
supply of sludge that varies in quality and quantity due to changes in ingoing concentration of
organic material, makes an evaluation in full scale an important step towards implementation.
Goal
The goal of this thesis is to find out if it is possible to increase the production of methane twofold
through addition of crude glycerol to a process digesting sewage sludge and evaluate the
performance of the digester during this process.

3
Strategy
The strategy employed to fulfill the goal is based on the continuous surveillance of the digesters
1) prior to addition of crude glycerol, 2) as the feed of crude glycerol is gradually increased and
3) after the digester has stabilized at the maximum planned glycerol feed. As the digestion
involves a complex array of metabolic processes, many parameters can be affected. Firstly,
production (and consumption) of VFA is likely to increase with the OLR which in turn can cause
a drop in pH (Kolesárová et al., 2011). More easily available substrate could increase the active
cell mass, causing an increase in TS and/or VS (Athanasoulia et al., 2014), along with a decrease
in ammonium due to assimilation of nitrogen during cell growth. With a raise in VFA, alkalinity
may also drop. All of these parameters were surveyed continuously.
In order to evaluate the yield from the conversion of glycerol to methane, the COD in the crude
glycerol was followed by chemical analysis during the course of the pilot test and the methane
obtained was compared to the theoretical yield of 0,35 Nm3 CH4 / kg COD. Lastly, heavy metals
are present in the crude glycerol (originating from the production of biodiesel) and the
concentration of them in the digested sludge was analyzed before and after introduction of the
glycerol.

4
Hypothesis
The hypothesis is based on previous lab-scale studies carried out by SBF and on outcomes of the
pilot test that affects the activities of Henriksdal WWTP.
The first part of the hypothesis is that more than 85% of supplied COD as glycerol will be
converted to methane as this is the value obtained in SBFs lab-scale studies. A 85% conversion
would at a total loading of 3 kg VS/m3
(equal contributions from WWTP sludge and crude
glycerol) and day result in a doubling of the methane-production from reactor D5.
The second part of the hypothesis is that there will be changes in VFA, TS and ammonium (see
questions below for specifications). The addition of glycerol can affect the digester condition and
this can in turn affect on the activities of Henriksdal WWTP. A disturbance in the anaerobic
digestion process by the addition of glycerol will likely result in that the digesters concentration
of VFA increase with the increase in OLR which can cause destabilization of the digester.
Regarding the activities of Henriksdal WWTP that might be affected by the glycerol addition
two parameters are of interest; the digestates concentration of ammonium and its total solids
content. The reject water produced from thickening the digestate (see figure 1) is reintroduced to
the biological treatment of the WWTP and changes in ammonium concentration in the digestate
will thus affect the workload of the WWTP. Changes in the total solids affects the amount of
thickened digestate that needs to be disposed, as well as the workload of the centrifuges that
thickens the digestate.
In order to evaluate possible negative effects of the glycerol additions on the status of the AD
process, the following three questions are posed:
A. Will the concentration of volatile fatty acids (VFA) increase from 150 mg/L to 300 mg/L
with the addition of glycerol?
B. Will the total solids (TS, [%, mTS/msample]) increase with more than 10% with the addition
of glycerol?
C. Will the concentration of ammonium decrease from 800 mg/L to 500 mg/L with the
addition of glycerol?
If the answer to any of these three questions is yes, it is concluded that the hypothesis is false.

5
Background
Henriksdal WWTP
Henriksdal WWTP treats the wastewater from the municipalities Nacka, Tyresö, Haninge,
Huddinge and large parts of central and southern Stockholm. The WWTP thus manages the
wastewater from almost 780.000 people and has a volumetric capacity of 250.000 m3 per day
(Stockholm Vatten, 2015). The WWT starts with screening of larger solids which is then
followed by pre-aeration, pre-sedimentation and biological removal of phosphorus and nitrogen
in a activated sludge process. The procedure is finished with a post-sedimentation and
flocculation of the remaining particles that are caught in a sand-filter prior to release of the
purified water into the local water Saltviken. The WWTP has seven digesters with a total
volumetric capacity of 38.500 m3 available for production of biogas, with D5 and D6 being the
largest ones with a liquid volume of 6700 m3 per digester. The digesters of Henriksdal WWTP
are fed with primary sludge from the pre-sedimentation and surplus sludge from the active
sludge process. An overview of the WWTP can be seen in figure 1.
Figure 1. The structure of Henriksdal WWTP. (modified from Stockholm vatten, 2015).
The digestion in this pilot test was mesophilic at 37 °C and the substrates to be digested, apart
from crude glycerol in D5, consisted of a mixture of primary sludge, from the pre-sedimentation
of the WWTP, and surplus sludge (also known as biosludge) from the activated sludge process
that constitutes the biological purification (see figure 1). The volumetric ratio between the feed
of primary sludge and the surplus sludge is approximately 6:1. As supply of sludge and its
properties varies with rainfall, snow melting and disposal of organic material from society the
amount and composition of the sludge will vary somewhat over time. The sludge from the
WWTP accounts for about 1,5 kg VS/m3 day in terms of OLR in D5 and D6.

6
Biochemistry of digestion
Microbial digestion of organic substrates for the production of biogas is a complex process
encompassing complete ecosystems where the waste products of one organism is used as food
for other organisms. The process of biogas formation can be divided into four main steps:
hydrolysis, acidogenesis, acetogenesis and methanogenesis (Jarvis & Schnürer, 2009). Figure 2
summarizes the relationship between these steps.
Figure 2. Steps necessary to convert complex organic substances to biogas. The four main steps
encompass hydrolysis, acidogenesis, acetogenesis and methanogenesis (modified from Jarvis &
Schnürer, 2009).
Production of biogas is an anaerobic process where, instead of oxygen, organic substances and
CO2 are used as electron acceptors. The catabolic pathways for different organic substances will
depend on the microbial flora present in the culture, process parameters such as pH, temperature
and HRT and the type/structure of the organic material digested (substrate).
7
The hydrolysis is the initial step where particles and larger polymers are broken down into
simpler compounds, making them available for fermentation. Large polymers such as cellulose
and proteins takes longer time before available for succeeding digestive steps, as compared to
glycerol which can be more directly metabolized by the cells (Yazdani & Gonzalez, 2007). In
this sense, digestion of sewage sludge is slower than digestion of glycerol.
After the hydrolysis comes the acidogenesis. Products of this process encompasses mainly
organic acids (such as VFA) and alcohols.
The acetogenesis constitutes a critical step in the biogas production. In this step, protons are used
as electron acceptors, resulting in the formation of hydrogen gas and in order for this to be
thermodynamically favorable, the concentration of the latter product needs to be kept low (Jarvis
& Schnürer, 2009). Thus, consumption of the hydrogen gas by methanogenic organisms is
essential in order to allow these oxidative microorganisms to access energy to maintain
metabolism and growth. In this step longer VFAs are also metabolized into acetic acid.
The final step of the biogas formation is the methanogenesis. Depending on the substrate, this
step can be rate limiting as methanogenesis is a comparatively slow process in the digestion
process. Two main pathways exist for methane formation, one using carbon dioxide and
hydrogen gas as substrate and one using mainly acetate. Figure 2 shows these two pathways,
were they are referred to hydrogenotrophic and acetotrophic methanogenesis.
Glycerol belongs to the mono- and oligomeric category of chemical intermediates and is a
natural product formed from the hydrolysis of lipids. External addition of glycerol causes mainly
two effects: increased availability of substrate to oxidative microorganisms and decreased
nitrogen/carbon ratio. The easily available substrate introduced in the form of crude glycerol is
digested considerably faster than sewage sludge as no hydrolysis is necessary. An increase in the
C/N ratio is often beneficial to the digester as excess ammonia can be harmful to the microflora,
down to about 200 mg/L (Maes et al., 2013). With the low C/N ratio of sewage sludge, adding
carbon rich substrates (such as glycerol) for co-digestion is advantageous for the digester (Heo,
N. et al., 2004).
Crucial to the hydraulic retention time of the reactor is the replication time of the methanogenic
microorganisms. As these often have a replication time that is measured in weeks, the HRT must
be longer than this replication time, otherwise a sufficient concentration of methanogenic
organisms can not be maintained. Likewise the HRT must not be too high for the process to be
economically feasible. A too high HRT can also cause excessive amounts of microbes to
accumulate in the digester. Two digestion temperatures are commonly employed; mesophilic and
thermophilic temperatures. To some extent, the higher the temperature is the higher the
metabolic activity will be and thus digestion will increase. HRT for digestion in a CSTR usually
varies between 10 to 25 days (Jarvis & Schnürer, 2009). Also, a suitable HRT depends on
substrates and access to nutrients. The HRT of the digesters used in this master thesis was on
average 18 days.
There are many parameters that may change and affect the anaerobic digestion. VFA, as
mentioned above, is produced during acidogenesis and changes with the OLR of the digester as
8
well as the biodegradability of the substrates. If too much of the substrate is broken down too
quickly the concentration of VFA will rise, a result of organic overloading (too high OLR).
Organic overloading can cause acidification if production of VFA becomes too high for the
methanogenic microorganisms to handle in the conversion of VFA to biogas.
pH depends on numerous factors, where production of VFA and consumption of alkalinity are
the main ones. Alkalinity buffers the digester so it remains stable but if production of VFA
becomes too prevalent the alkalinity can be consumed to the extent where the digester loses
stability. Another aspect of potential changes in pH is the concentration of ammonium in the
digester. The concentration of ammonium can change with the substrate composition and with
changes in the microbial concentration (due to the use of nitrogen for proteins).
TS and VS depends on many parameters, especially the OLR and the biodegradability of the
substrates. If the OLR is high the TS can rise as more solids are introduced to the digester. If a
substrate with high VS-content is excessively introduced to the digester some of it may pass
through the digester undigested (this also depends on the biodegradability of the substrates),
hence raising the VS of the digestate.
9
Materials and methods
Cultivation technology
The pilot phase spanned over a time period of 158 days. On day 70 addition of crude glycerol
was initiated at 0,5 kg VS/m3,day. The digesters were allowed to stabilize with the feed until day
124, then the OLR of glycerol was increased with 0,25 kg VS/m3,day every day until the target
OLR of 1,5 kg VS/m3,day was reached at day 127. This OLR was then maintained until day 148,
giving a total of 21 days at the target OLR. Unless anything else is stated, the data presented in
the results section are based on analyses spanning from day 140 to day 148. Presentation of the
number of data points used for the different analysis parameters can be seen in table 2.
The feed of the glycerol was initially done batchwise every 6 minutes. The programming for the
feed of crude glycerol erred in the beginning of the pilot study, but this was solved by
circumventing the program mathematically. At one point, the sludge valve regulating the feed of
sludge to D5 started leaking (day 6 to 13) and the addition of sludge was stopped until the valve
had been repaired (day 13 to 18). Due to the batchwise additions of glycerol very large volumes
of biogas were produced when the OLR of glycerol was increased. The safety valves did not
manage these sharp increases in gas production and the feeding was therefore changed to
continuous by exchanging the original open/shut valve for a control valve.
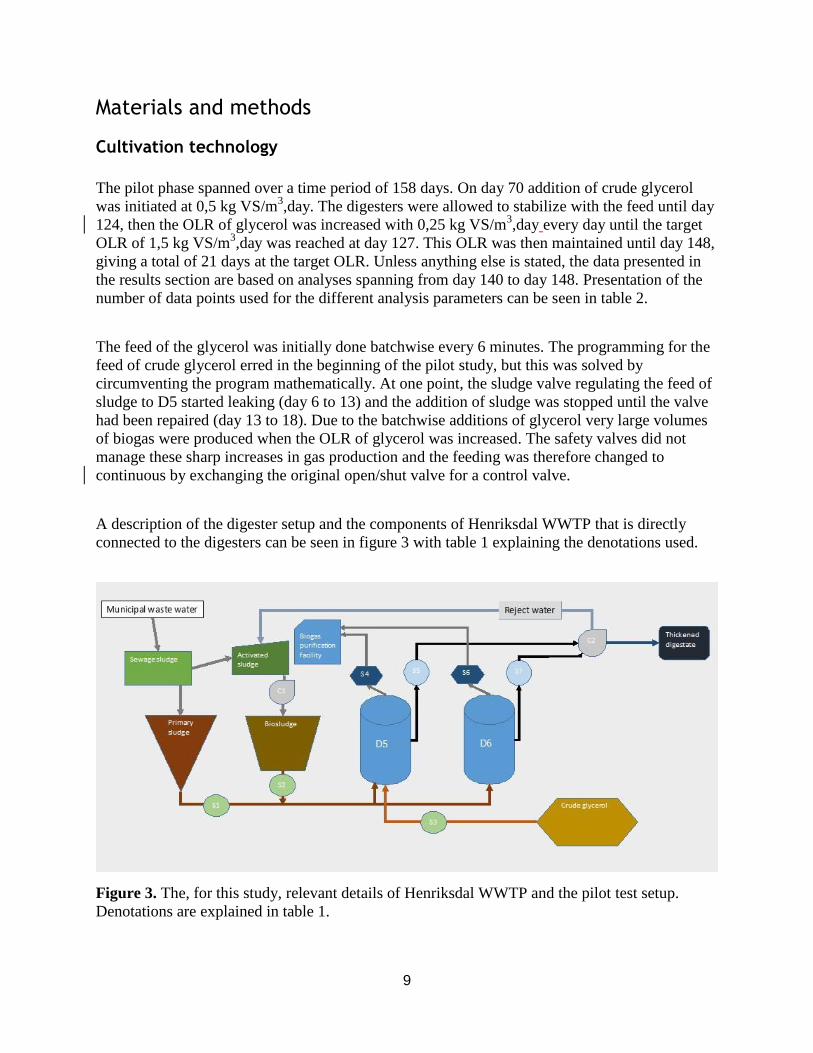
A description of the digester setup and the components of Henriksdal WWTP that is directly
connected to the digesters can be seen in figure 3 with table 1 explaining the denotations used.
Figure 3. The, for this study, relevant details of Henriksdal WWTP and the pilot test setup.
Denotations are explained in table 1.

10
Table 1. Key to denotations in figure 3.
Denotation Meaning
C1 Centrifuge for thickening of surplus activated sludge
C2 Centrifuge for managing digested sludge; separates reject water from thickened
digestate.
S1 Sample point for TS and VS measurement on primary sludge.
S2 Sample point for TS and VS measurement on surplus sludge.
S3 Sample point for crude glycerol introduced to D5.
S4 Sample point for analysis of biogas from D5, manual and automatic.
S5 Sample point for digestate from D5.
S6 Sample point for analysis of biogas from D6, manual and automatic.
S7 Sample point for digestate from D6.

11
Data collected during the pilot test are presented in table 2.
Table 2. Total amount of data points collected for each analysis performed.
Analysis
Number of data points collected
during entire
pilot test
after one HRT of maximum
OLR
Biogas production and methane
concentration
148 9
pH 60 4
VFA 57 4
Ammonium 23 3
TS and VS (for digestate) 39 3
TS and VS (for primary and surplus
sludge)
17 1
Alkalinity 24 1
Heavy metals 6 1
Volatile solids reduction 21 2
pH
pH was measured with a pH-meter of the model WTW Inolab pH 730, coupled to a pH-electrode
of the model Hamilton Polylite Bridge Lab and a thermometer of the model WTW TFK 325. A
two point calibration at pH 4 and 7 was performed once a week, in combination with use of
reference solution prior to each measurement in order to ensure reliable results. pH was
measured three times a week on digestate from the two digesters.
VFA
VFA was measured with Hach-Lange VFA-tests (product code LCK 365). The digestate was
diluted twofold and the analysis was then performed according to the instructions supplied with
the analysis-kit. The uncertainty of the analysis method is 1,32 % (Hach Lange, Quality
certificate Technical data for Validation of LCK365). The amount of VFA is given as acetic acid
equivalents. Concentration of VFA was measured three times a week on the digestate.
Ammonium
Ammonium was measured with Hach-Lange ammonium tests (product code LCK 302). The
digestate was diluted tenfold and the analysis was then performed according to the instructions
supplied with the analysis-kit. The uncertainty of the analysis method is 1,49 % (Hach Lange,
Quality certificate Technical data for Validation of LCK302). Concentration of ammonium was
measured once a week on the digestate.

12
COD
COD was measured with Hach-Lange COD tests (LCK 014). A sample of crude glycerol was
diluted 200-fold in water and the analysis was then performed according to the instructions
supplied with the analysis-kit. The uncertainty of the analysis of COD is 0,74 % (Hach Lange,
Quality certificate Technical data for Validation of LCK014). COD was measured after every
new batch of crude glycerol had been introduced to the glycerol tank, hence the frequency for
this analysis rose with the OLR.
TS and VS
TS and VS was measured according to a modification by SBF from the Swedish standard (SS
028112). This was done by weighing in sludge in a weighed, dried crucibles and noting the
sample mass. Each filled crucible was then put in an oven at 105 °C for 20 hours. After this the
crucible was put to cool in an exsiccator and then weighed again. The remainder of the sample is
the TS and it is calculated as the remaining mass of the sample divided by the original sample
mass.
After this the crucible was put into a furnace at 550 °C for two hours and thereafter allowed to
cool in the exsiccator. The remainder of the sample (the fixed solids) is the VS subtracted from
the TS, i.e. the VS has been combusted through the heat of the furnace and no longer remains.
Thus, the VS (given as % of TS) is calculated according to the formula:
𝑉𝑆𝑚𝑉𝑆/𝑚𝑇𝑆 =𝑚𝑇𝑆 − 𝑚𝑎𝑓𝑡𝑒𝑟 𝑐𝑜𝑚𝑏𝑢𝑠𝑡𝑖𝑜𝑛
𝑚𝑇𝑆
The uncertainty of measurement for TS and VS were based on data handed by SBF. These
values were 1,0 % for TS and 0,4 % for VS. TS and VS were measured two times a week for
digested sludge and once a week for primary sludge and surplus sludge.
Calculations for volatile solids reduction (VSR) can be seen in appendix 1C where two different
equations were used, the mass balance equation (MBE) and ash content equation (ACE). This
calculation usually requires large amounts of data spanning longer periods of time then the 16
days at the maximum loading rate available from the pilot test. As TS of the primary sludge was
considered to be unstable throughout the lapse of the pilot test (see appendix 1C, figure 1) the
average feed of primary sludge and surplus sludge was used and VSR was calculated week wise
with values for TS and VS of primary sludge, surplus sludge and digestate from the same day of
the week.
Though COD was measured for the crude glycerol, its VS was never determined. As the VS of
the crude glycerol was needed for calculating the VSR, the analysis sheets supplied by the
companies delivering the glycerol was consulted. From this the total mass of 85% organic
material was approximated as the total amount of VS for the crude glycerol. Likewise, the FS of
the glycerol was approximated to 10%.

13
Alkalinity
Values for carbonate alkalinity was obtained by sending samples to Eurofins Environment AB
Sweden for analysis. According to Eurofins Environment AB Sweden the uncertainty of the
measurement is 10 % (Dovberg, M., personal communication). This analysis was done every
second week for the digestate.
Heavy metals
Values for heavy metals in the digestate were obtained by sending samples to Eurofins
Environment AB Sweden for analysis once every month. The heavy metals data presented in this
master thesis encompassed copper, zinc, mercury, nickel, lead, chromium and silver, which are
considered to be especially hazardous. These heavy metals are the most interesting ones for
REVAQ-certification, which is an important parameter in the management of the thickened
digestate (Svenskt vatten, 2015). The uncertainty of measurement according to Eurofins
Environment AB Sweden is 15% for copper, 15% for zinc, 25% for mercury, 15% for nickel,
25% for lead, 15% for chromium, and 20% for silver.
Methane concentration and biogas production
The concentration of methane in the biogas [%], and the production of biogas [Nm3 / h], was
measured continuously by stationary analysis equipment. Data from this equipment was recorded
every few seconds, where daily average values for methane fraction and gas flow was used in
this master thesis. The flow of substrates in and biogas out of the digesters was measured with
totalizers which gives one pulse for every m3 of gas passing through. The composition of the
biogas (CH4 [%], CO2 [%], O2 [%], H2S [ppm] and other gases [%], mainly N2 and water vapor)
was also measured manually with a Geotech Biogas Check on a daily basis.
Calculations on theoretical methane yield from glycerol
The theoretical yield for glycerol converted to methane is given in appendix 1A.
Glycerol feed
D5 was fed with glycerol semi-continuously every 6 minutes. However, as mentioned above, due
to difficulties in managing the vastly increased biogas production, continuous feed was initiated
at day 120.

14
Results
The total OLR of each digester and OLR in the form of crude glycerol during the pilot phase can
be seen in figure 4. The high peaks could be due to build up and subsequent feeding of primary
sludge with higher content of TS, TS that has accumulated during the screening of bulky
materials in the pre-treatment of the incoming sludge (see figure 1).
Figure 4. The total OLR of each digester during the pilot phase and OLR in terms of glycerol
feed.
All of the results presented were calculated from values obtained after one HRT with maximum
OLR if nothing else is stated (day 140-148).
0,00
0,50
1,00
1,50
2,00
2,50
3,00
3,50
4,00
4,50
5,00
0 5
10
15
20
25
30
35
40
45
50
55
60
65
70
75
80
85
90
95
10
0
10
5
11
0
11
5
12
0
12
5
13
0
13
5
14
0
14
5
15
0
OLR
[kg
VS/
m3
, day
]
Day
Organic loading of digesters
Glycerol only D5, total D6, total

15
Biogas and methane production
Biogas production was 394 ± 41 Nm3/h for D5 and 216 ± 16 Nm
3/h for D6 at the end of the
experiment. This corresponds to a 82 % increase in biogas production through the introduction of
crude glycerol. The development of biogas production during the pilot phase can be seen in
figure 5.
Figure 5. Development of biogas production (Nm3/h) during the pilot phase for digesters D5
(amended with glycerol from day 70) and D6 (control).
0,00
0,50
1,00
1,50
2,00
2,50
0,0
50,0
100,0
150,0
200,0
250,0
300,0
350,0
400,0
450,0
500,0
0 5
10
15
20
25
30
35
40
45
50
55
60
65
70
75
80
85
90
95
10
0
10
5
11
0
11
5
12
0
12
5
13
0
13
5
14
0
14
5
15
0
Gly
cero
l fee
d [
kg V
S /
m3
, day
]
Met
han
e p
rod
uct
ivit
y [N
m3
/h]
Day
Biogas production
D5 D6 Glycerol feed
16
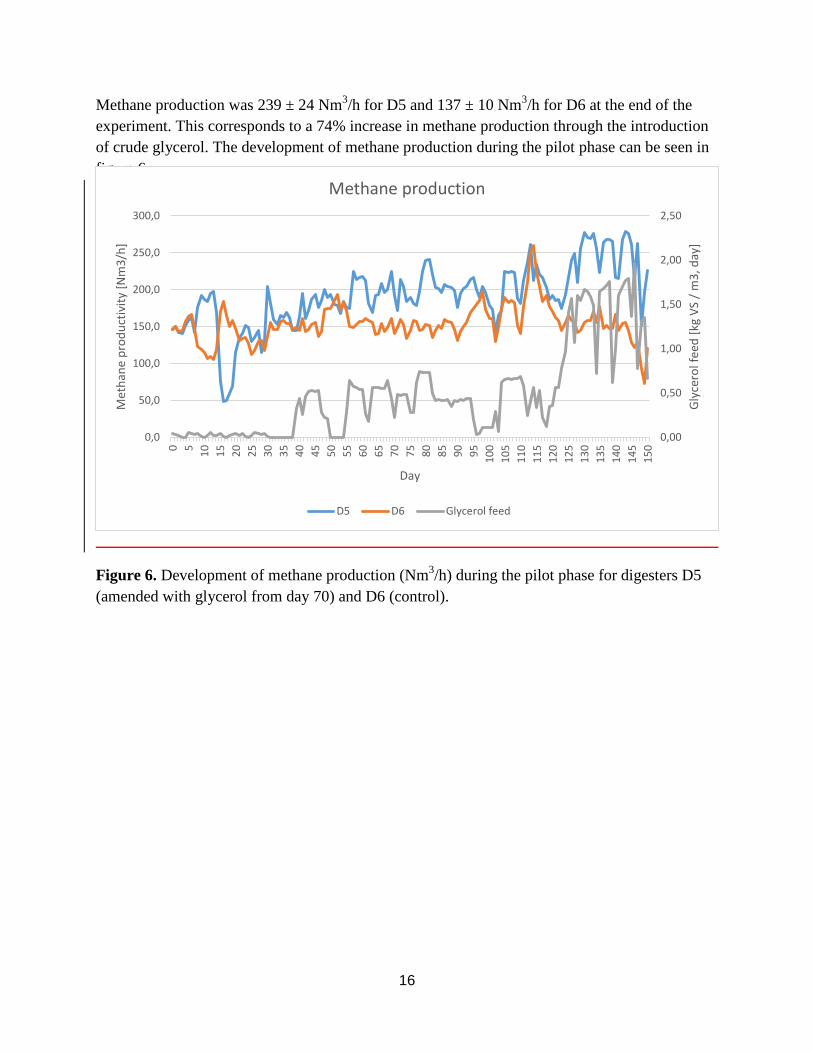
Methane production was 239 ± 24 Nm3/h for D5 and 137 ± 10 Nm
3/h for D6 at the end of the
experiment. This corresponds to a 74% increase in methane production through the introduction
of crude glycerol. The development of methane production during the pilot phase can be seen in
figure 6.
Figure 6. Development of methane production (Nm3/h) during the pilot phase for digesters D5
(amended with glycerol from day 70) and D6 (control).
0,00
0,50
1,00
1,50
2,00
2,50
0,0
50,0
100,0
150,0
200,0
250,0
300,0
0 5
10
15
20
25
30
35
40
45
50
55
60
65
70
75
80
85
90
95
10
0
10
5
11
0
11
5
12
0
12
5
13
0
13
5
14
0
14
5
15
0
Gly
cero
l fee
d [
kg V
S /
m3
, day
]
Met
han
e p
rod
uct
ivit
y [N
m3
/h]
Day
Methane production
D5 D6 Glycerol feed

17
Yield for conversion of glycerol to methane
At maximum OLR (3 kg VS/m3,day of which 50 % was glycerol), the yield for the conversion of
crude glycerol to methane was calculated to be 78 ± 4 % in terms of COD. For calculations on
theoretical COD in methane, see appendix 1A. The yield during the course of the pilot test can
be seen in figure 7.
Figure 7. Development of yield in terms of CODmethane/CODglycerol during the experiment. No
data from the stationary gas measuring equipment was available before day 40.
Due to fluctuations in the stationary equipment measuring the biogas production and
composition, a yield that exceeds 100 percent (and a negative yield) is sometimes obtained
(figure 7).
-150,0
-100,0
-50,0
0,0
50,0
100,0
150,0
200,0
250,0
40 50 60 70 80 90 100 110 120 130 140 150
Yiel
d [
%, C
OD
-met
han
e/C
OD
-gly
cero
l]
Day
Yield (glycerol to methane)

18
pH
As the OLR increased, pH decreased for D5. After one HRT at maximum OLR, pH was
measured to be 6,99 ± 0,04 for D5 and 7,24 ± 0,05 for D6. This corresponds to a difference of
0,25 pH-units. The development of pH can be seen in figure 8.
Figure 8. Development of pH in digestate from digester 5 (D5) and digester 6 (D6) is shown
together with the glycerol loading over time.
0,00
0,50
1,00
1,50
2,00
2,50
6,70
6,80
6,90
7,00
7,10
7,20
7,30
7,40
1 6
11
16
21
26
31
36
41
46
51
56
61
66
71
76
81
86
91
96
10
1
10
6
11
1
11
6
12
1
12
6
13
1
13
6
14
1
14
6
15
1
15
6
Gly
cero
l fee
d [
kg V
S /
m3
, day
]
pH
-val
ue
Day
pH-values
D5 D6 Glycerol feed

19
VFA
Throughout the entire experiment, no change in VFA was observed. The concentration of VFA
was 143 ± 2 mg/L for D5 and 139 ± 10 mg/L for D6. The development of VFA over time can be
seen in figure 9.
Figure 9. Development of concentration of VFA in digestate from digester 5 (D5) and digester
6 (D6) is shown together with the glycerol loading over time.
0,00
0,50
1,00
1,50
2,00
2,50
50
70
90
110
130
150
170
190
6
11
16
21
26
31
36
41
46
51
56
61
66
71
76
81
86
91
96
10
1
10
6
11
1
11
6
12
1
12
6
13
1
13
6
14
1
14
6
15
1
15
6
16
1
Gly
cero
l fee
d [
kg V
S /
m3
, day
]
[VFA
] (m
g/L)
Day
VFA-concentration
D5 D6 Glycerol feed

20
Ammonium
After one HRT at the maximum OLR, the concentration of ammonium was 476 ± 11 mg/L for
D5 and 754 ± 5 mg/L for D6. This corresponds to a decrease in ammonium concentration as of
37 %. The development of the ammonium concentration throughout the experiment can be seen
in figure 10.
Figure 10. Development of concentration of ammonium in digestate from digester 5 (D5) and
digester 6 (D6) is shown together with the glycerol loading over time.
0,00
0,50
1,00
1,50
2,00
2,50
400
450
500
550
600
650
700
750
800
850
900
6
11
16
21
26
31
36
41
46
51
56
61
66
71
76
81
86
91
96
10
1
10
6
11
1
11
6
12
1
12
6
13
1
13
6
14
1
14
6
15
1
15
6
Gly
cero
l fee
d [
kg V
S /
m3
, day
]
[NH
4+]
(m
g/L)
Day
NH4+-concentrations
D5 D6 Glycerol feed

21
TS and VS
As expected, total solids content in D5 increased. The average TS was 2,46 ± 0,01 % for D5 and
2,01 ± 0,02 % for D6 at the end of the experiment. This corresponds to an increase in TS of 18
%. In figure 4 it can be seen that OLR increases at day 55, which could be related to the rise in
TS in D5 as of day 80. The TS of D6 also starts to rise at day 89 but it is not clear why this
happened, it can however be seen that the TS of D6 shows no liability to change during the pilot
test in its entirety and thus the observed rise in TS in D6 at day 89 could be due to the variations
caused by the screening of primary sludge in the WWTP. The development of TS can be seen in
figure 11.
Figure 11. Development of TS in digestate from digester 5 (D5) and digester 6 (D6) is shown
together with the glycerol loading over time.
No change was observed for VS. The average VS was 63 ± 0,7 % (mVS/mTS) for D5 and 62 ± 0,3
% (mVS/mTS) for D6. The development of VS can be seen in figure 12.
0,00
0,50
1,00
1,50
2,00
2,50
1,50
1,70
1,90
2,10
2,30
2,50
2,70
1 61
1
16
21
26
31
36
41
46
51
56
61
66
71
76
81
86
91
96
10
11
06
11
11
16
12
1
12
61
31
13
61
41
14
61
51
15
6
Gly
cero
l fee
d [
kg V
S /
m3
, day
]
TS (
%)
Day
Total solids
D5 D6 Glycerol feed

22
Figure 12. Development of VS in digestate from digester 5 (D5) and digester 6 (D6) is shown
together with the glycerol loading over time.
0,00
0,50
1,00
1,50
2,00
2,50
56,0
57,0
58,0
59,0
60,0
61,0
62,0
63,0
64,0
65,0
1 61
1
16
21
26
31
36
41
46
51
56
61
66
71
76
81
86
91
96
10
11
06
11
11
16
12
1
12
61
31
13
61
41
14
61
51
15
6
Gly
cero
l fee
d [
kg V
S /
m3
, day
]
VS
(%)
Day
Volatile solids
D5 D6 Glycerol feed
23
Alkalinity
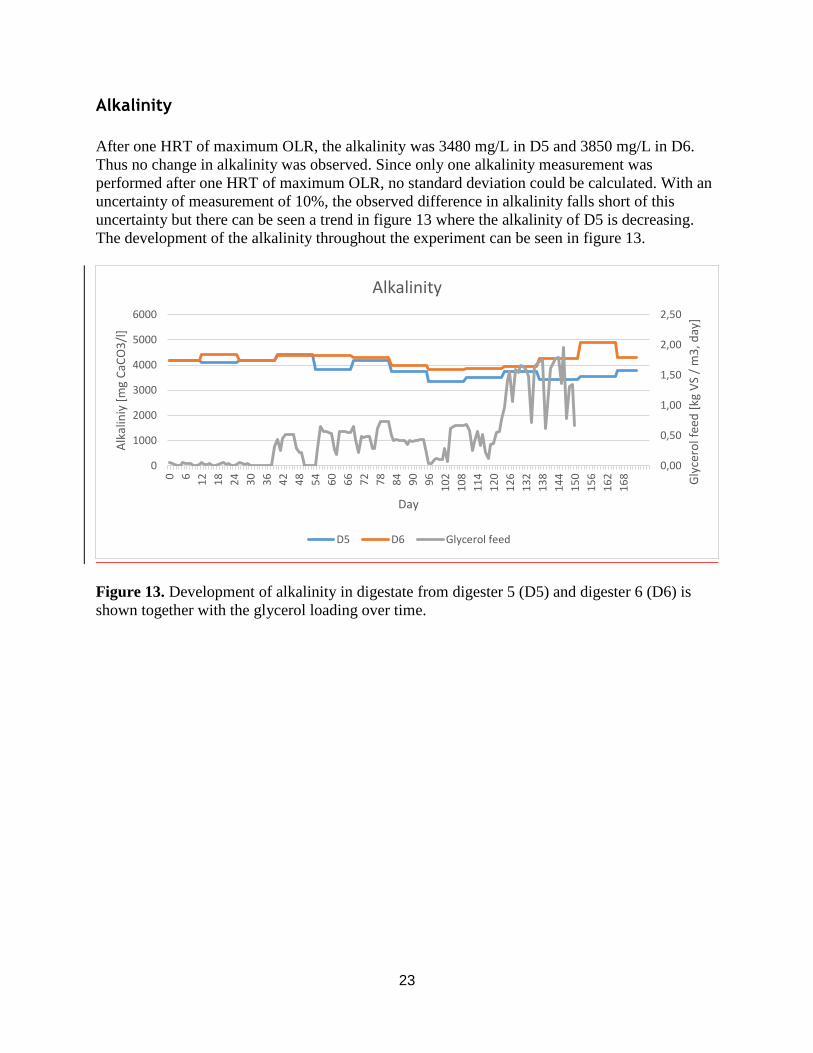
After one HRT of maximum OLR, the alkalinity was 3480 mg/L in D5 and 3850 mg/L in D6.
Thus no change in alkalinity was observed. Since only one alkalinity measurement was
performed after one HRT of maximum OLR, no standard deviation could be calculated. With an
uncertainty of measurement of 10%, the observed difference in alkalinity falls short of this
uncertainty but there can be seen a trend in figure 13 where the alkalinity of D5 is decreasing.
The development of the alkalinity throughout the experiment can be seen in figure 13.
Figure 13. Development of alkalinity in digestate from digester 5 (D5) and digester 6 (D6) is
shown together with the glycerol loading over time.
0,00
0,50
1,00
1,50
2,00
2,50
0
1000
2000
3000
4000
5000
6000
0 6
12
18
24
30
36
42
48
54
60
66
72
78
84
90
96
10
2
10
8
11
4
12
0
12
6
13
2
13
8
14
4
15
0
15
6
16
2
16
8 Gly
cero
l fee
d [
kg V
S /
m3
, day
]
Alk
alin
iy [
mg
CaC
O3
/l]
Day
Alkalinity
D5 D6 Glycerol feed

24
Heavy metals
The measured heavy metals concentrations during the pilot test can be seen in figure 14 and 15.
Figure 14. Development of concentration of copper and zinc in digestate from digester 5 (D5)
and digester 6 (D6) is shown together marks indicating the initiation of the glycerol fed and the
maximum OLR of D5.
0
100
200
300
400
500
600
700
800
900
1000
0 20 40 60 80 100 120 140 160
He
avy
met
al c
on
cen
trat
ion
[m
g m
etal
/ g
TS]
Day
Heavy metals (Cu and Zn)
Cu D5 Zn D5 Cu D6 Zn D6 Glycerol feed starts Maximum OLR begins

25
Figure 15. Development of concentration of mercury, nickel, lead, and silver in digestate from
digester 5 (D5) and digester 6 (D6) is shown together marks indicating the initiation of the
glycerol feed and the maximum OLR of D5.
After one HRT of maximum OLR the concentration of mercury had increased noticeably and the
concentration of nickel and chromium had decreased noticeably in D5 as compared to the
reference period prior to the addition of glycerol to D5. However, the concentration of zinc, lead
and silver in the reference digester D6 had increased noticeably during the HRT of maximum
OLR in D5. As only one analysis was performed after maximum OLR, no standard deviation can
be presented. The concentration of copper before introduction of glycerol and after one HRT of
maximum OLR can be seen in figure 16, these values were 410 and 350 mg/kg TS for D5 and
390 and 430 mg/kg TS for D6.
0
0,1
0,2
0,3
0,4
0,5
0,6
0,7
0
5
10
15
20
25
30
0 20 40 60 80 100 120 140 160
Hea
vy m
etal
co
nce
ntr
atio
n [
mg
met
al /
g
TS]
for
Hg
He
avy
met
al c
on
cen
trat
ion
[m
g m
etal
/ g
TS]
fo
r N
i, P
b, C
r an
d A
g
Day
Heavy metals (Hg, Ni, Pb, Cr and Ag)
Ni D5 Ni D6 Pb D5 Pb D6
Cr D5 Cr D6 Ag D5 Ag D6
Hg D5 Hg D6 Maximum OLR begins Glycerol feed starts

26
Figure 16. Concentration of copper in digestate from digester 5 (D5) and digester 6 (D6) before
glycerol feed and after maximum OLR.
The concentration of zinc before introduction of glycerol and after one HRT of maximum OLR
can be seen in figure 17, these values were 556 and 520 mg/kg TS for D5 and 550 and 660
mg/kg TS for D6.
D5
D5 D6
D6
0
50
100
150
200
250
300
350
400
450
500
Prior to glycrol feed After one HRT of maximum OLR
Hea
vy m
etal
co
nce
ntr
atio
n [
mg
met
al /
g T
S]
Copper (Cu) concentration in digestate from D5 and D6
D5 D5 D6
D6
0
100
200
300
400
500
600
700
Prior to glycrol feed After one HRT of maximum OLR
Hea
vy m
etal
co
nce
ntr
atio
n [
mg
met
al /
g T
S]
Zinc (Zn) concentration in digestate from D5 and D6
27
Figure 17. Concentration of zinc in digestate from digester 5 (D5) and digester 6 (D6) before
glycerol feed and after maximum OLR.
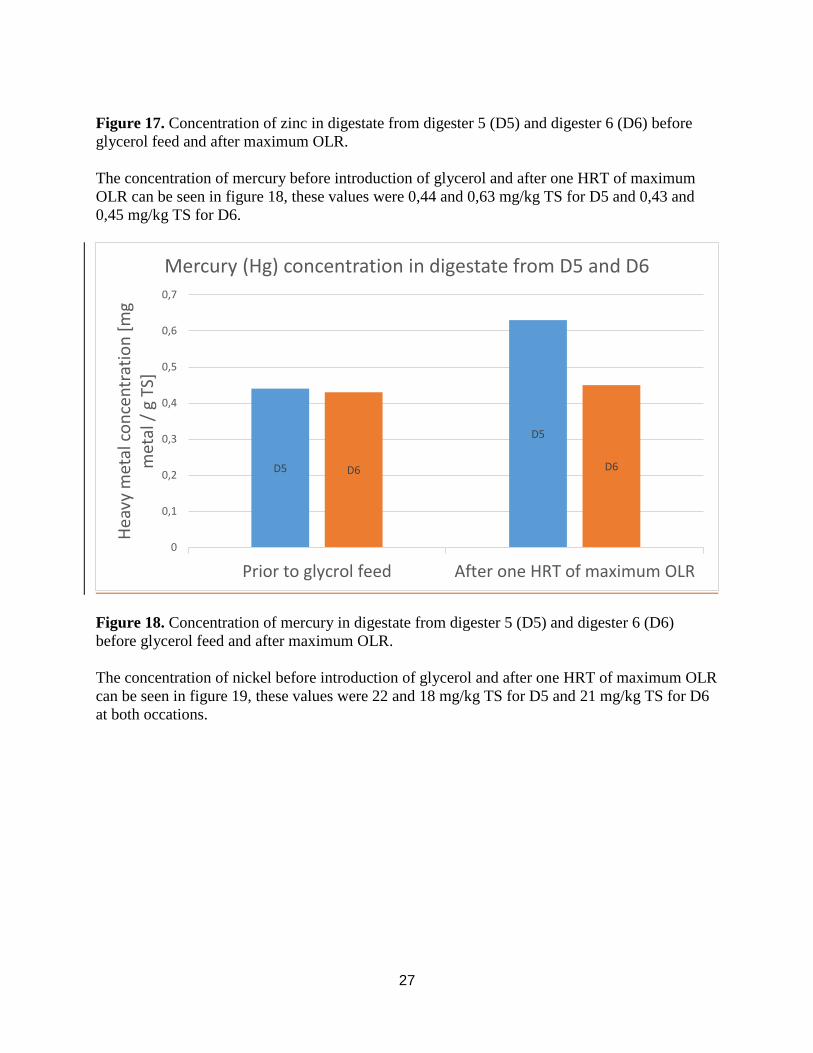
The concentration of mercury before introduction of glycerol and after one HRT of maximum
OLR can be seen in figure 18, these values were 0,44 and 0,63 mg/kg TS for D5 and 0,43 and
0,45 mg/kg TS for D6.
Figure 18. Concentration of mercury in digestate from digester 5 (D5) and digester 6 (D6)
before glycerol feed and after maximum OLR.
The concentration of nickel before introduction of glycerol and after one HRT of maximum OLR
can be seen in figure 19, these values were 22 and 18 mg/kg TS for D5 and 21 mg/kg TS for D6
at both occations.
D5
D5
D6 D6
0
0,1
0,2
0,3
0,4
0,5
0,6
0,7
Prior to glycrol feed After one HRT of maximum OLR
Hea
vy m
etal
co
nce
ntr
atio
n [
mg
met
al /
g T
S]
Mercury (Hg) concentration in digestate from D5 and D6

28
Figure 19. Concentration of nickel in digestate from digester 5 (D5) and digester 6 (D6) before
glycerol feed and after maximum OLR.
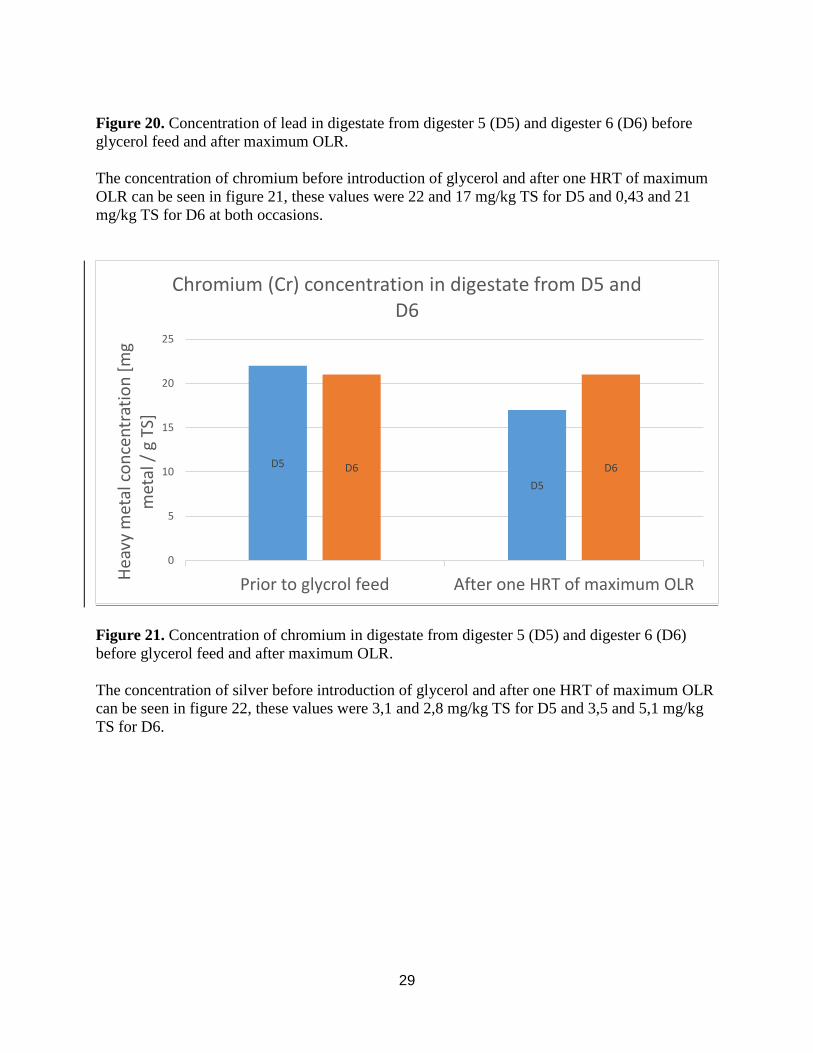
The concentration of lead before introduction of glycerol and after one HRT of maximum OLR
can be seen in figure 20, these values were 21 and 18 mg/kg TS and 19 and 24 mg/kg TS for D6.
D5
D5
D6 D6
0
5
10
15
20
25
Prior to glycrol feed After one HRT of maximum OLR
Hea
vy m
etal
co
nce
ntr
atio
n [
mg
met
al /
g T
S]
Nickel (Ni) concentration in digestate from D5 and D6
D5 D5 D6
D6
0
5
10
15
20
25
30
Prior to glycrol feed After one HRT of maximum OLR
Hea
vy m
etal
co
nce
ntr
atio
n [
mg
met
al /
g T
S]
Lead (Pb) concentration in digestate from D5 and D6
29
Figure 20. Concentration of lead in digestate from digester 5 (D5) and digester 6 (D6) before
glycerol feed and after maximum OLR.
The concentration of chromium before introduction of glycerol and after one HRT of maximum
OLR can be seen in figure 21, these values were 22 and 17 mg/kg TS for D5 and 0,43 and 21
mg/kg TS for D6 at both occasions.
Figure 21. Concentration of chromium in digestate from digester 5 (D5) and digester 6 (D6)
before glycerol feed and after maximum OLR.
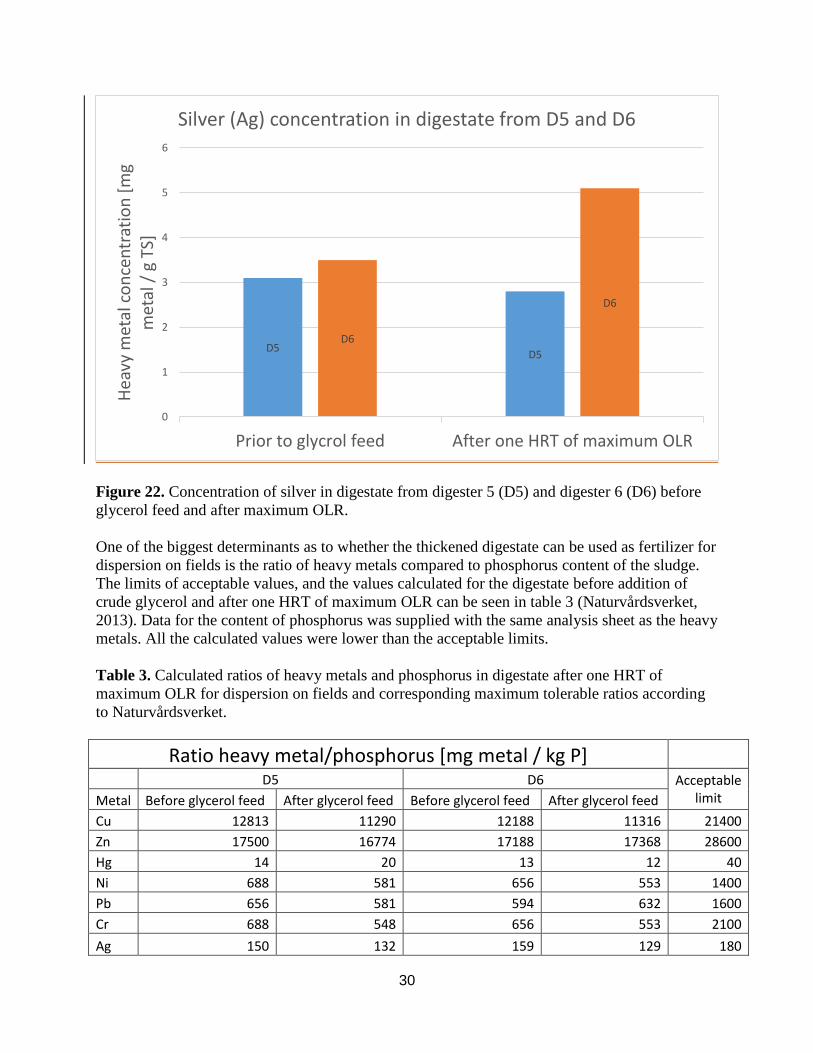
The concentration of silver before introduction of glycerol and after one HRT of maximum OLR
can be seen in figure 22, these values were 3,1 and 2,8 mg/kg TS for D5 and 3,5 and 5,1 mg/kg
TS for D6.
D5
D5
D6 D6
0
5
10
15
20
25
Prior to glycrol feed After one HRT of maximum OLR
Hea
vy m
etal
co
nce
ntr
atio
n [
mg
met
al /
g T
S]
Chromium (Cr) concentration in digestate from D5 and D6
30
Figure 22. Concentration of silver in digestate from digester 5 (D5) and digester 6 (D6) before
glycerol feed and after maximum OLR.
One of the biggest determinants as to whether the thickened digestate can be used as fertilizer for
dispersion on fields is the ratio of heavy metals compared to phosphorus content of the sludge.
The limits of acceptable values, and the values calculated for the digestate before addition of
crude glycerol and after one HRT of maximum OLR can be seen in table 3 (Naturvårdsverket,
2013). Data for the content of phosphorus was supplied with the same analysis sheet as the heavy
metals. All the calculated values were lower than the acceptable limits.
Table 3. Calculated ratios of heavy metals and phosphorus in digestate after one HRT of
maximum OLR for dispersion on fields and corresponding maximum tolerable ratios according
to Naturvårdsverket.
Ratio heavy metal/phosphorus [mg metal / kg P] D5 D6 Acceptable
limit Metal Before glycerol feed After glycerol feed Before glycerol feed After glycerol feed
Cu 12813 11290 12188 11316 21400
Zn 17500 16774 17188 17368 28600
Hg 14 20 13 12 40
Ni 688 581 656 553 1400
Pb 656 581 594 632 1600
Cr 688 548 656 553 2100
Ag 150 132 159 129 180
D5 D5
D6
D6
0
1
2
3
4
5
6
Prior to glycrol feed After one HRT of maximum OLR
Hea
vy m
etal
co
nce
ntr
atio
n [
mg
met
al /
g T
S]
Silver (Ag) concentration in digestate from D5 and D6

31
Volatile solids reduction
Reduction of volatile solids increased with the addition of crude glycerol. The two equations
used to calculate the VSR gave different results for the VSR of both digesters. The VSR during
the beginning, middle and final stage of the pilot test can be seen in table 4. The development of
volatile solids reduction can be seen in figure 23.
Table 4. Volatile solids reduction for D5 and D6 using two different equations, the ash
concentration equation (ACE) and the mass balance equation (MBE).
VSR D5,
ACE [%] VSR D6, ACE [%]
VSR increase, ACE [%]
VSR D5, MBE [%]
VSR D6, MBE [%]
VSR increase, MBE [%]
Reference period (day 21 - 41)
57 57 -0.61 56 54 3.2
Middle period (OLR = 0,5, day 77 - 97)
58 49 17 64 50 28
One HRT of maximum OLR (day 140-151)
62 51 21 68 49 38

32
Figure 23. Volatile solids reduction calculated with the mass balance equation (MBE) and the
ash content equation (ACE).
Calculations for VSR can be seen in appendix 1C.
0,00
0,50
1,00
1,50
2,00
2,50
0
10
20
30
40
50
60
70
80
90
100
7
12
17
22
27
32
37
42
47
52
57
62
67
72
77
82
87
92
97
10
2
10
7
11
2
11
7
12
2
12
7
13
2
13
7
14
2
14
7
Gly
cero
l fee
d [
kg V
S/m
3, d
ay]
VSR
[%
]
Day
Volatile solids reduction
D5, MBE D6, MBE D5, ACE D6, ACE Glycerol feed

33
Discussion
The goal of this master thesis was to see if it is possible to increase methane production twofold
through addition of crude glycerol to an anaerobic digestion process treating sewage sludge. This
goal was not reached as the increase in methane production was 74%. The hypothesized yield (as
a conversion from COD in the form of crude glycerol to COD in the form of methane) of 85 %
was not reached as the actual yield was 78%, thus the hypothesis can be discarded. One aspect
that needs to be kept in mind is the potential impairment of the digester when it is scaled up. As
the mixing of a 7000 m3 digester is not ideal, the concentration of different substrates will
fluctuate. Hewitt & Nienow (2007) reports that microbial cells can develop stress responses
because of this phenomena, but the response varies depending on the microbes, substrate and
digester conditions. Ruffino et al. (2015) mentions that a common yield for a pilot scale digester
is 80 % of the corresponding yield of a lab-scale digester. Another important factor to account
for is the position of the feed of the crude glycerol. Due to the rapid digestion of glycerol when
introduced to D5 under the impellers of the CSTR, biogas production could occur at an early
stage of the feed. If this happens directly under the impellers where the feed opening is placed,
the resulting gas formation can obstruct the mixing activity of the impellers (Sardeing, R., et al.,
2004).
Also, batchwise feed of glycerol (such as the ones performed in SBFs laboratory experiments)
allows a higher rate of digestion than continuous feed of glycerol as the latter allows some of the
glycerol to escape from the digester because of the volumetric control of D5 and D6 through
overflowing.
Due to the crude glycerols content of sulphate, electrons that could have been used for
production of methane were instead incorporated in the synthesis of H2S, which also affects the
yield of methane. It is also a concern for the downstream processing of the biogas as H2S is
corrosive (Colleran et al., 1995). If a complete reduction of the sulphate in the crude glycerol
would occur, this would require 4,7 % of the electrons supplied by the glycerol (see appendix 2B
for calculations). This alternative use of electrons can help explain the lower yield of methane.
Sulphide can be toxic to the microbial culture of anaerobic digesters (Parkin et al.,1990) but as
the digester was stable with the addition of crude glycerol it can be concluded that the
concentration of sulphide was lower than toxic level and did not affect the biology of the process
negatively.
As regards the hypothesis stated in the beginning of the master thesis one can conclude that it is
false not only due to the yield being lower than hypothesized but also because the TS increased
by more than 10%. A notable decrease in pH was observed but could not be accounted for by the
VFA. By means of pH, the concentration of protons increased with 45 nM whereas VFA
contributed with merely 64 uM of protons. The phenomena could be explained in other ways
however. The assimilation of ammonium leads to the release of protons as the ammonium is
utilized mainly for protein synthesis. If one assumes that every ammonium molecule assimilated
produces two protons during protein synthesis, the drop in free ammonium levels in D5 due to
the introduction of crude glycerol would produce 30,8 mM of protons (see appendix 1B). This
contributes substantially to any acidifying effects in the digester. Furthermore, the drop in
carbonate alkalinity equals a decrease in carbonate ions as of 6,1 mM. It is likely that the main
34
consumption of buffering capacity in the digester originates from the assimilation of ammonium
into the cell mass rather than production of VFA.
The fact that TS increased but VS (as a percentage of TS) remained the same suggests that the
active biomass in the digester indeed did increase. The unchanged proportion between the total
amount of volatile solids and fixed solids implies that the increase in TS comes from a higher
concentration of cells in D5 as the ratio of these two solids is constant in cellular structures. The
fact that ammonium levels dropped further supports this theory if the drop is due to assimilation
of ammonium for cell growth.
The consistently higher increase in VSR given by the MBE as compared to the ACE indicates a
difference in applicability of the formulas to the digestion in the pilot test. In table 4 it can be
seen that the two equations give similar values for the VSR of D6 but higher values with the
MBE than the ACE for D5. As the MBE relies on the total flow of volatile solids through the
digester and the ACE depends on a fix ash content in the flows, one could assume that the
difference in VSR for D5 with the two equations can be attributed to an increase in total ash
content in the digester with the addition of crude glycerol as the glycerol does contain ashes
(averaging 10% by weight). Thus the results of the MBE is considered more reliable and the
increase of VSR given by this formula after one HRT of maximum OLR at 38 % is consulted as
the final increase in VSR with a doubling in OLR to D5.
In many ways the stability of the digesters can change with addition of crude glycerol. With an
OLR increased by 80 % through introduction of crude glycerol co-digested wastewater sewage
sludge, Razaviarani et al. (2013) had a rise of VFA as of 85 mg/L (an increase of 1400%) in their
semi-continuously fed digester (feeding once a day with an OLR of 2,88 kg COD / m3, day). At
80 % increase in OLR the methane production decreased by 34 % in the study performed by
Razaviarani, indicating a severe impairment of the digester. However, at 50% increase in OLR
with crude glycerol the methane production rose by 40%. Razaviarani et al. also reported a
COD-removal efficiency of 80 % at this increased OLR. This was 35% higher compared to the
control digester. In Razaviaranis study the VSR was only calculated for the 50% increase in
OLR, this value amounted to a 64% increase in VSR with the addition of glycerol. The lesser
increase in VSR observed in this master thesis, amounting to 38% could be explained by the
higher organic loading rate as the system could be more stressed due to the 100% increase in
OLR.
The improvement in reduction of VS through the introduction of crude glycerol can be explained
in several ways. The first and most obvious explanation lies in the higher biodegradability of the
crude glycerol compared to the sewage sludge, thus the higher VSR. Also, what seems to be an
increased active biomass in D5 (increased TS and decreased NH4+) could contribute to a higher
rate of digestion of introduced substrates. However, a reliable calculation of VSR requires data
from a large interval of time (at least several months to compensate for HRT and fluctuations in
feed of sludge), the data used in this master thesis thus makes the calculations unreliable. As for
the VSR during the reference period (day 21-41) and the OLR of 0,5 kg VS/m3,day during day
77-97 of the pilot test, it was expected that D5 and D6 would share a common VSR prior to
introduction of crude glycerol. VSR was higher in D5 than D6 during the longer period where
the OLR was 0,5 kg VS/m3,day (which calculations for day 77-97 is referring to). In figure 11 it
35
can be observed that the higher VSR in D5 (28 % higher as compared to D6) during day 77 to 97
(0,5 kg VS/m3,day from glycerol) most likely not is due to increased biomass as the TS was yet
to change at this stage of the pilot test. The potential biomass growth in a digester is a slow
process due to the long replication time of the microorganisms and thus the increase in VSR
could be attributed mainly to the higher biodegradability of glycerol rather than an increase in
biomass.
One way of making a stability evaluation of the digester is by comparing the VFA to the
alkalinity. Siles et al. (2010) suggests that if the alkalinity is subtracted from the concentration of
VFA multiplied with 0,7 the digester is empirically considered to be in good condition if the
resulting value exceeds 1500 mg/L. For D5 this value is 3376 mg/L and for D6 it is 3752 mg/L.
In such a sense, both digesters can be considered to be in excellent condition, even when OLR is
doubled through addition of crude glycerol. The corresponding values calculated from data
reported by Razaviarani et al. is 1977 mg/L and 2368 mg/L, for the test digester and the control
respectively. The values for the digesters used in this master thesis exceeds these values
considerably, which further implies the stability of the digesters used in this pilot test.
The addition of waste glycerol to the digester has effects that extends beyond the AD-process
within the reactor. An example of such an effect is strain that the digestate subject the WWTPs
digestate centrifuges to. Through addition of crude glycerol, TS has increased. The increase in
total solids adds a strain to the centrifuges which manages the digestate. The addition of glycerol
has also brought about a decrease in ammonium levels which causes a decreased strain on the
nitrogen purification of the WWTP (see figure 3). The average liquid flow through D5 is 130
m3/h, with a drop in ammonium concentration as of 278 mg/L the flow of ammonium is
decreased with 36 kg/h in D5 when OLR is doubled with the addition of crude glycerol. The
average flow of wastewater through Henriksdal WWTP is 4,3 m3/s and if there is a concentration
of ammonia averaging 30 mg/L (Henz, M., 2002) in the wastewater prior to nitrogen removal
this gives a flow of ammonia through the WWTP of 464 kg/h. The addition of glycerol to D5 has
thus reduced the total mass of ammonia to be purified in the WWTP by 7,8 %. This reduction in
strain on the nitrogen purification is of considerable magnitude for the WWTP and should not be
neglected when evaluating the pilot test. As more people are moving in to larger cities, this could
also be interesting as a means to alleviate the strain on a WWTP.
The heavy metals present in the crude glycerol are of relevance to the management of the
digestate due to their toxicity. From the values seen prior to amendment of crude glycerol and
after one HRT of maximum OLR in D5 (figure 16 to 22) it can be seen from the reference
digester (D6) that heavy metal concentration varies naturally, the concentration of heavy metals
in the digestate of D6 varies to the same extent as the variation observed in D5 and thus no
changes in heavy metals concentration in the digestate of D5 can be asserted. REVAQ-
certification and proper disposal of the digestate will not be an issue (see table 3). Lin, C. Y.
(1992), reported that a concentration of 174 mg Pb2+
/ g VSS (Volatile suspended solids)
decreased degradation of mixed VFAs by 50%. The corresponding value for D5 is 29 mg Pb2+
/
g VSS, this can also be compared with the maximum level of lead allowed for REVAQ-
certification witch, with the VS-concentration of D5, amounts to 156 mg Pb2+
/ g VSS. The
REVAQ-value thus becomes the limiting factor rather than the lead value reported by Lin, C. Y.

36
The lead concentration in D5 after introduction of crude glycerol falls short of both of these
values.
The matter of variation in substrates is very relevant in the pilot test. Supply of sewage sludge
constitutes a natural variation in the experiment that on this industrial scale is impossible to come
around. As the WWTP is of a scale that makes it dependent on the rainfall and melted snow in
the municipalities whose wastewater is being treated, wastewater can vary in quantity and quality
accordingly. This could for example influence the consistency of sludge feed as shown in
appendix 1C, figure 1, making calculations such as VSR less reliable.
Another natural variation is the supply of crude glycerol. The quality of the crude glycerol varies
widely, mainly between suppliers but also within the frame of any one supplier. Also, the
temperature of the crude glycerol varied due to changes in weather. A consistent temperature
was difficult to maintain as the storage tank was directly exposed to seasonal weather, where the
crude glycerol in the tank could fluctuate in temperature as much as between 30 and 40 °C. This
in turn affects the viscosity of the substrate which can put a strain on the pumping system and
also the outcome of the actual feed, yielding a potentially different feed than was planned for.
Another issue with the glycerol turned out to be a degree of stratification due to insufficient
effect supplied in the homogenization pumps in the glycerol tank. This was managed by
introducing an additional submersible pump into the glycerol tank. A follow up of the issue can
be seen in appendix 2A.

37
Sources of error
Due to lack of time, maximum OLR could not be maintained longer than approximately 1,5
HRT. Parameters could still change with an extended maximum OLR and in this sense it would
be desirable to continue the experiment for at least two or three HRT to ensure a stable digester.
The first and most obvious source of error lies in the inherent error of measurement in the
analysis methods. Both manual and automatic analysis (e.g. gas composition) can contribute in
this sense. Frequent analysis of substrates and digested sludge helps to settle this, where VFA
and pH of digestate were considered to be the most important parameters to survey (thus these
analysis methods were carried out the most often). Standard deviations and uncertainty in the
measurement was presented in the results for most of the analysis methods, though not for all of
them. Analysis of alkalinity would obviously have needed more than one data point at maximum
OLR in order to establish a result rather than a trend.
There are several sources of error related to the calculations for VSR. Firstly, VSR should be
calculated over long periods of time spanning several months e.g. due to the variation in sludge
feed (see appendix 1C, figure 1), compensation for the HRT and adaption of the microbes to the
change in digester conditions. Secondly, the ash content equation could be unreliable as the ash-
content of the crude glycerol averaged around 10 % according to supplier information, which
could cause an accumulation of fixed solids in D5. If this is the case, the ACE would prove itself
unreliable for calculating VSR and the mass balance equation should be consulted instead. If
fixed solids is reduced during digestion, the ACE is prone to underestimate VSR and likewise if
fixed solids accumulate, the VSR will be overestimated. With this in mind, we can see that the
higher VSR given by the ACE likely is due to a build-up of fixed solids due to the introduction
of crude glycerol. The fact that both equations give the same VSR for D6 but differs for D5,
which was supplied with glycerol, supports this theory. The VSRs given by the mass balance
equation at 75 % and 52 % for D5 and D6 is therefore likely the most reliable results.

38
Conclusion
With a doubling in OLR through introduction of crude glycerol it was observed that:
Methane production increased by 74%.
Yield for conversion of crude glycerol to methane was 78%.
pH decreased from 7,2 to 7,0.
VFA did not change.
Ammonium showed a trend where it decreased from 754 mg/L to 476 mg/L.
TS increased from 2,0% to 2,5%.
Alkalinity showed a trend where it decreased from 3850 mg/L to 3480 mg/L.
Heavy metals concentration did not change.
The goal of the master thesis was to investigate if the methane production could be increased
twofold. This is partly successful with the 74 % increase of methane production. Not all the
hypothesized results turned out to be correct. As for increase of TS it turned out to be greater
than thought but as for decrease of ammonium and increase of VFA the results were better than
hypothesized. In all, evaluation of the pilot phase indicates that introduction of crude glycerol
does not impair the stability of the digester.

39
Future work
Few co-digestions on this scale has been reported of in the literature and thus it would be of great
interest to extend the research, especially as the interest in, and need for, renewable fuels is
increasing.
Crude glycerol from the biodiesel industry is not the only substrate that can be co-digested with
sewage sludge in order to produce biogas. Another major substrate is fat from e.g. the food
industry. Including this kind of substrate, and others possibly available, would be a subject of
interest as substrate that originates from outside the WWTP can vary in availability, often more
so than the sludge supplied by the WWTP.
More complex co-digestion, involving not only glycerol but e.g. also fat, slaughter wastes and
miscellaneous food wastes should be evaluated in the future. With variation in substrate it is
possible to balance the ratio between different macro- and micronutrients for a given OLR,
which would give the possibility of optimizing digester conditions. The ratio between carbon and
nitrogen is one such factor, but many other nutritional components could be considered e.g.
phosphorus and potassium.
It would be interesting to repeat the experiment and allow the digester to stabilize for a longer
time at the maximum OLR in order to better evaluate the effect of the introduction of glycerol,
the reduction of VS especially. The feeding point of the crude glycerol should be moved away
from the impellers of the CSTR to its side (see figure 1) as to alleviate the problem of rapid gas
development that can interfere with the mixing of the digester. Doing this might increase the
yield.
Finally, as variation of substrate greatly affects the microbial flora of the digester, it would be of
great interest to specify and quantify the different microorganisms present in the digester during
different stages of the changes in substrate feed.

40
References
Athanasoulia, E., Melidis, P., & Aivasidis, A. (2014). Co-digestion of sewage sludge and crude
glycerol from biodiesel production. Renewable Energy, 62, 73-78.
Carlsson, A., SVAB, personal communication 16/09-2015.
Colleran, E., Finnegan, S., & Lens, P. (1995). Anaerobic treatment of sulphate-containing waste
streams. Antonie van Leeuwenhoek, 67(1), 29-46.
Demirel, B., & Scherer, P. (2008). The roles of acetotrophic and hydrogenotrophic methanogens
during anaerobic conversion of biomass to methane: a review. Reviews in Environmental Science
and Bio/Technology,7(2), 173-190.
Dovberg, M., Eurofins Environment AB Sweden, personal communication 22/09-2015.
Eurofins Environment Sweden AB, sheet with analysis results 30/03-2015.
Fountoulakis, M. S., Petousi, I., & Manios, T. (2010). Co-digestion of sewage sludge with
glycerol to boost biogas production. Waste Management, 30(10), 1849-1853.
Gallert, C., Henning, A., & Winter, J. (2003). Scale-up of anaerobic digestion of the biowaste
fraction from domestic wastes. Water research, 37(6), 1433-1441.
Henze, M. (2002). Wastewater treatment: biological and chemical processes. Springer Science
& Business Media.
Heo, N. H., Park, S. C., & Kang, H. (2004). Effects of mixture ratio and hydraulic retention time
on single-stage anaerobic co-digestion of food waste and waste activated sludge. Journal of
Environmental Science and Health, Part A, 39(7), 1739-1756.
Hewitt, C. J., & Nienow, A. W. (2007). The scale‐up of microbial batch and fed‐batch
fermentation processes. Advances in applied microbiology, 62, 105-135.
Jarvis, Å., Schnürer, A. (2009), Mikrobiologisk handbok för biogasanläggningar, Svenskt
gastekniskt center.
Kizılkaya, R., and B. Bayraklı. 2005. Effects of N-enriched sewage sludge on soil enzyme
activities. Applied Soil Ecology 30:192- 202.
Kolesárová, N., Hutňan, M., Bodík, I., & Špalková, V. (2011). Utilization of biodiesel by-
products for biogas production. BioMed Research International,2011.

41
Lin, C. Y. (1992). Effect of heavy metals on volatile fatty acid degradation in anaerobic
digestion. Water Research, 26(2), 177-183.
López, J. Á. S., Santos, M. D. L. Á. M., Pérez, A. F. C., & Martín, A. M. (2009). Anaerobic
digestion of glycerol derived from biodiesel manufacturing. Bioresource technology, 100(23),
5609-5615.
Maes, L., Weemaes, M., Hellinck, N., De Gueldre, G., & Van De Steene, B. (2013). Co-
digestion of glycerine and sewage sludge to optimise green electricity production. Water Science
& Technology, 67(12), 2863-2867.
Naturvårdsverket (2013), Hållbar återföring av fosfor, Rapport 6580 September 2013.
Park, J., Park, S., & Kim, M. (2014). Anaerobic degradation of amino acids generated from the
hydrolysis of sewage sludge. Environmental technology,35(9), 1133-1139.
Parkin, G. F., Lynch, N. A., Kuo, W. C., Van Keuren, E. L., & Bhattacharya, S. K. (1990).
Interaction between sulfate reducers and methanogens fed acetate and propionate. Research
Journal of the Water Pollution Control Federation, 780-788.
Precision Digital, Specifications for PD6200 & PD6300 PROVU Flow Rate / Totalizers for
Analog & Pulse Inputs, http://www.predig.com/PD6200/index.php, extracted 21-09-2015.
Razaviarani, V., Buchanan, I. D., Malik, S., & Katalambula, H. (2013). Pilot scale anaerobic co-
digestion of municipal wastewater sludge with biodiesel waste glycerin. Bioresource technology,
133, 206-212.
Ruffino, B., Fiore, S., Roati, C., Campo, G., Novarino, D., & Zanetti, M. (2015). Scale effect of
anaerobic digestion tests in fed-batch and semi-continuous mode for the technical and economic
feasibility of a full scale digester.Bioresource technology, 182, 302-313.
Sander, R. (2015). Compilation of Henry's law constants (version 4.0) for water as
solvent. Atmospheric Chemistry and Physics, 15(8), 4399-4981.
Santibáñez, C., Varnero, M. T., & Bustamante, M. (2011). Residual glycerol from biodiesel
manufacturing, waste or potential source of bioenergy: a review.Chilean J Agric Res, 71(3), 469-
475.
Sardeing, R., Aubin, J., Poux, M., & Xuereb, C. (2004). Gas–Liquid Mass Transfer: Influence of
Sparger Location. Chemical Engineering Research and Design, 82(9), 1161-1168.
Siles, J. A., Martín, M. A., Chica, A. F., & Martín, A. (2010). Anaerobic co-digestion of glycerol
and wastewater derived from biodiesel manufacturing. Bioresource technology, 101(16), 6315-
6321.

42
Stockholm Vatten, Henriksdals avloppsreningsverk För stockholmarnas och miljöns bästa,
http://www.stockholmvatten.se/globalassets/pdf1/avloppsvatten/henriksdals-
reningsverk/henriksdals-reningsverk, extracted 04-08-2015.
Svenskt vatten, REVAQ-regler 2016 version 3.3,
http://www.svensktvatten.se/Documents/Kategorier/Avlopp%20och%20milj%c3%b6/REVAQ/R
evaq-regler%202016.2%20gul.pdf, extracted 20-09-2015.
Weiland, P. (2010). Biogas production: current state and perspectives. Applied microbiology and
biotechnology, 85(4), 849-860.
Yazdani, S. S., & Gonzalez, R. (2007). Anaerobic fermentation of glycerol: a path to economic
viability for the biofuels industry. Current opinion in biotechnology, 18(3), 213-219.

Appendix 1. Calculations
Appendix 1A. Calculation of COD in methane
The COD of methane is calculated theoretically through an electron balance, assuming a
complete combustion. The electron balance is given as:
4 𝐻2 + 𝐶𝑂2 → 𝐶𝐻4 + 2 𝐻2𝑂
Methane is measured in Nm3 (Normal m
3), which assumes a temperature of T= 273° K and a
pressure of 1 bar. Using the ideal gas law:
pV=nRT
This gives a substance amount of 43,7 moles of methane for 1 Nm3 of methane.
Thus, 1 Nm3 of methane requires 87,4 moles of O2 for complete combustion to occur. This gives
a COD of 2,80 kg O2 / Nm3 CH4, which can be rewritten as 0,35 Nm
3 CH4 / kg COD.

Appendix 1B. Calculations on change in pH, alkalinity and ammonia
VFA is measured in terms of acetic acid equivalents and since the pKa for this acid is
considerably lower than the pH of the digesters (see table 2), one could assume that effectively
all acetic acid is deprotonated. The drop in pH observed for D5 as compared to D6 corresponds
to 44,6 nM of protons whilst the negligible increase in VFA in D5 amounts to only 64 uM.
Table 2. Values needed for calculations on change in acidity and alkalinity.
Entity Value
pKaAcOH 4,75
MAcOH 60,05 g/mol
MNH4+ 18,04 g/mol
MHCO3- 61,02 g/mol
As for the drop in ammonium in D5 it corresponds to a decrease in ammonium concentration of
15,4 mM. If the the proposal stated in the discussion of this thesis is held in mind, the
assimilation of this ammonium would cause a release of 30,8 mM of protons.
Finally, the drop in carbonate alkalinity corresponds to a decrease in carbonate ions as of 6,12
mM.

Appendix 1C. Calculations on VS-reduction
Two methods for calculating reduction of volatile solids are used, the mass-balance equation and
the ash content equation. The latter assumes that the total concentration of fixed solids is
constant whilst the former is independent of changes in fixed solids concentration. Equation 1
describes the mass balance equation whilst equation 2 describes the ash content equation.
1 𝑉𝑆𝑅𝑚𝑏𝑒 =𝑚𝑉𝑆,𝑖𝑛−𝑚𝑉𝑆,𝑜𝑢𝑡
𝑚𝑉𝑆,𝑜𝑢𝑡
2 𝑉𝑆𝑅𝑎𝑐𝑒 = 1 −𝐹𝑆𝑖𝑛∙𝑉𝑆𝑜𝑢𝑡
𝐹𝑆𝑜𝑢𝑡∙𝑉𝑆𝑖𝑛
Densities were never measured for the substrates and digested sludge, instead it was assumed
that the density and the various sludges could be approximated to that of water due to the low TS
content.
The total flow of primary sludge through Henriksdal WTP during the pilot test can be seen in
figure 1. The average flow was 775 ± 190 ton/h.
Figure 1. Total flow of primary sludge through Henriksdal WWTP.
0
200
400
600
800
1 000
1 200
14
18
22
26
30
34
38
42
46
50
54
58
62
66
70
74
78
82
86
90
94
98
10
2
10
6
11
0
11
4
11
8
12
2
12
6
13
0
13
4
13
8
14
2
14
6
15
0
Tota
l flo
w t
hro
ugh
WW
TP [
ton
/h]
Day
Flow of primary sludge

Appendix 2. Miscellaneous
Appendix 2A. Stratification issues in crude glycerol-tank
During the project there were initial issues with stratification of the crude glycerol in the tank
from which it is fed to the digester. In order to evaluate this problem, density tests were made for
samples taken from the bottom of the tank, the top of the body of crude glycerol in the tank and
from the recirculation loop before the feed reaches the digester. These samples were also
compared to the batch-samples provided by the supplier of crude glycerol. It was concluded that
additional mixing was necessary and a submersible pump was installed in the tank as of day 54
in the pilot study. The homogenization that followed can be seen in figure 1.
Figure 1. Stratification of crude glycerol in the storage-tank. The mixing of the glycerol was
initially not sufficient but after the introduction of a submersible pump (day 54) the issue was
alleviated.
1050
1100
1150
1200
1250
1300
1350
38 39 40 41 42 43 44 45 46 47 48 49 50 51 52 53 54 55 56 57 58 59 60 61 62 63 64
Den
sity
[g/
L]
Date
Density variation
Bottom sample
Recirculation sample
Top sample

Appendix 2B. Development of H2S and calculations on sulphate reduction
Due to content of sulphate in the crude glycerol and the environment in the digesters, production
of H2S is inevitable. This is problematic in two ways. Firstly, the sulphate steals electrons that
could be used for production of methane. Secondly, hydrogen sulphide needs to be removed
from the raw gas in order to maintain standards for the delivered vehicle fuels quality. The
procedure for removal of H2S has its limits and the rise in hydrogen sulphide was acknowledged
to pose a possible problem for the purification process. During the pilot phase dosage of the
flocculant iron heptahydrate, meant to precipitate various compounds in the wastewater being
treated at the WWTP, was partly inhibited for an unknown period of time. The effect of this can
be seen in figure 2 whereas about day 100 the feed of the flocculant was reestablished.
With the increased OLR, more H2S was produced. In spite of fixed OLR, changes in H2S could
still be seen due to differing concentrations of sulphates in different batches of crude glycerol
received for the pilot phase. The development of H2S can be seen in figure 2.
Figure 2. Development of H2S-concentration in raw biogas during the outline of the pilot phase.
Analysis by Eurofins Environment Sweden AB showed that the content of total sulphur in the
crude glycerol was 1,4 % by weight. This corresponds to a molarity of 0,44 mol S / kg crude
glycerol. Given the molecular weight of glycerol at 92 g/mol and a glycerol content of 85% in
the crude glycerol, the molar content of glycerol is 9,2 mol glycerol / kg crude glycerol.

The sulphur reducing reaction can be simplified to:
4 𝐻2 + 𝑆𝑂42− → 2 𝑂𝐻− + 𝐻2𝑆
This means that 1,31 moles H2 / kg crude glycerol would be used for complete sulphur reduction
instead of the production of methane, as compared to the 27,7 moles H2 / kg crude glycerol that
is provided through the glycerol itself. Thus, if all sulphate is completely reduced in the crude
glycerol, this would require 4,7 % of the H2 available in the crude glycerol for production of
H2S.