Embed Size (px)
Citation preview

IndustrialsQuarterly update
Q1 2019
Deloitte Corporate Finance LLC | www.investmentbanking.deloitte.com
March 8th, 20195 – International Wire Group Holdings, Inc. (OTCPINK:ITWG) announced today that it has entered into a definitivemerger agreement to be acquired by affiliates of Atlas Holdings,LLC. Under the terms of the agreement, Atlas will acquire alloutstanding shares of IWG common stock for $10.70 per share incash. The transaction is expected to close early in the secondquarter of 2019.
February 25th, 20196 – Multi-Color Corporation (NASDAQ: LABL)today announced that it has entered into a definitive mergeragreement to be acquired by an affiliate of Platinum Equity, LLC., aleading private equity firm. Under the terms of the agreementMulti-Color Corporation shareholders will receive $50.00 in cash foreach share of common stock they own, in a transaction valued at$2.5 billion including the assumption of $1.5 billion of debt.
February 12th, 20197 – Ingersoll-Rand plc has announced it hasmade a binding offer to acquire Precision Flow Systems from fundsadvised by BC Partners Advisors L.P. and The Carlyle Group for$1.45 billion. At the time of acquisition close, PFS would combinewith Ingersoll Rand’s Fluid Management business, which designs,manufactures, and markets pumps for specialized fluid handlingapplications under the ARO brand. The PFS product portfolio iscomplementary with Ingersoll Rand’s Fluid Management portfolio.
www.investmentbanking.deloitte.com | Page 2
Industrials trends
Who we are
Deloitte Corporate Finance LLC is a leading global middle market M&A adviser. The firm’s professionals have extensive knowledge in the industrials space and use their experience to help clients create and act upon opportunities for liquidity, growth, and long-term advantages.
Contacts
Will FrameManaging [email protected]+1 (312) 486-4458
Eric AndreozziManaging [email protected]+1 (704) 333-0518
Tony BlanchardManaging [email protected]+1 (312) 486-1640
Jonathan AdamsManaging [email protected]+1 (214) 840-1779
Kevan FlaniganManaging [email protected]+1 (213) 688-6560
Vijay BalasubramanianManaging [email protected]+1 (212) 313-1723
William KerkamManaging [email protected]+1 (980) 312-3613
In the news
Oil, Gas, and Chemicals outlook1
The 2019 energy conversation is expected to increasingly include long-term issues. Sustainability is increasingly moving to the center of strategy and investment decisions. Moreover, the growth of low-carbon energy, autonomous and electric vehicles, and energy efficiency is becoming not just a topic for futurologists, but a key focus throughout the energy and chemicals value chains.
Power and Utilities outlook4
In this update
• Industrials trends
• Economic outlook
• Industry analysis
• Select M&A transactions
• Appendix
This update will focus on news and trends in the following areas:
• Oil, Gas, and Chemicals
• Metals and Mining
• Automotive
• Power and Utilities
Quarterly update | Q1 2019 | Industrials
Automotive Industry
outlook3
The industry benefited from strong economic tailwinds in 2018, which are expected to continue in 2019. Unemployment reached new lows and consumer confidence reached an 18-year high. The most impactful negative trend affecting consumer demand in 2018 was the rise in interest rates, which lead to a rise in the average vehicle payment. The largest price increase was tied to the average lease, making leases far less attractive than financing new or used vehicle purchases.
Metals and Mining outlook2
The mining industry is poised for greater growth than it’s seen in a decade, but today’s market realities are very different than those of the past. There are geopolitical tensions in the form of trade wars, tariff concerns, and looming asset shortages. Rising commodity prices in 2019 are expected to fuel expansion. Mining companies will likely need to clarify how they plan to drive value into the future and how
they will respond when prices inevitably drop.
As the US power and utilities industry continues on the path to transformation, some recently developed regulatory initiatives are emerging that may bring new opportunities to utilities in 2019 and beyond. On the generation side, the three dominant trends for 2019 seem to be a continuation of recent years—that is, displacement of coal-fired generation, steady growth in natural gas, and rapid growth in wind and solar generation.
44
46
48
50
52
54
56
58
60
62
In
dex
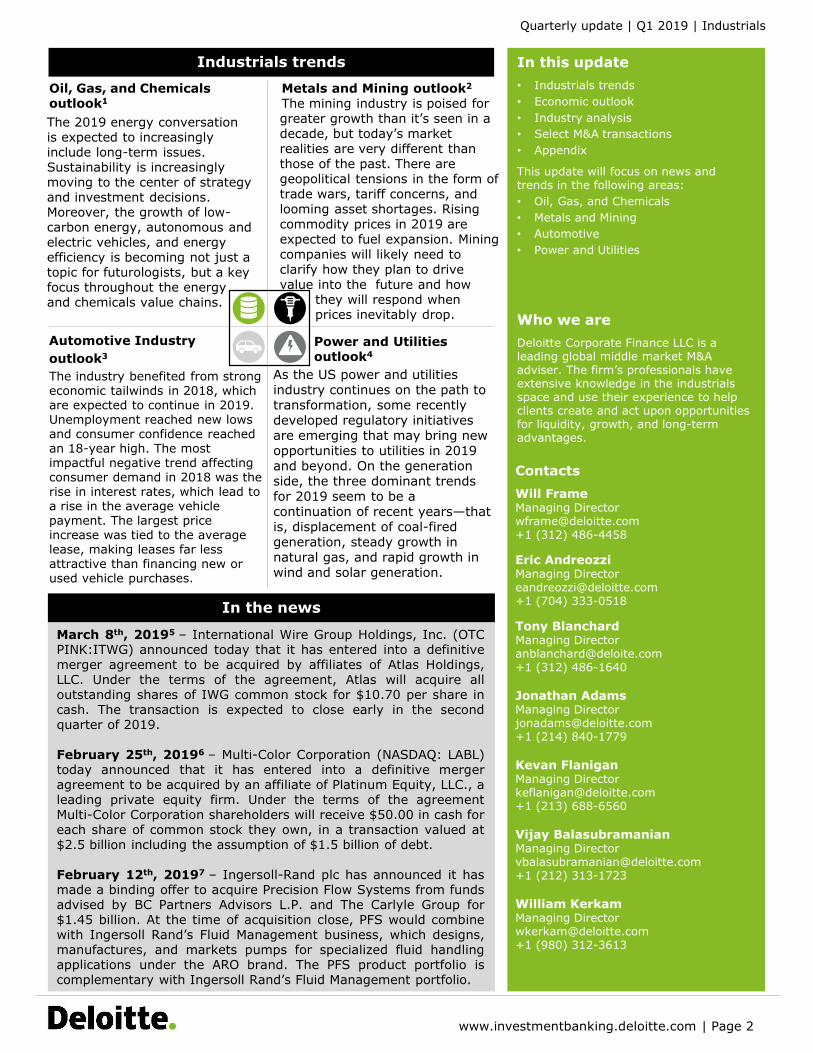
Macroeconomic outlook
www.investmentbanking.deloitte.com | Page 3
Note:An ISM purchase managers index value above 50 signals economic expansion.
ISM purchase managers index5 Industrial production index(YoY growth)6
Industrials sector outlook
Quarterly update | Q1 2019 | Industrials
US Treasury yield curve (nominal vs. real)2
US gross domestic product ($ in trillions)1
US unemployment rate (% unemployed)3
ISM non-manufacturing indexand consumer confidence index4
(20.0%)
(15.0%)
(10.0%)
(5.0%)
0.0%
5.0%
10.0%
$0.0
$5.0
$10.0
$15.0
$20.0
0.0%
1.0%
2.0%
3.0%
4.0%
5.0%
$ i
n t
ril
lio
ns
Yo
Y p
ercen
t ch
an
ge
GDP ($ in trillions) YoY % growth (Adj. for inflation)
0.0%
0.5%
1.0%
1.5%
2.0%
2.5%
3.0%
3.5%
In
terest
rate
Real yield (%) Nominal yield (%)
200
250
300
350
400
450
500
550
600
3.0%
4.0%
5.0%
6.0%
7.0%
8.0%
9.0%
10.0%
Job
less C
laim
s (
Th
ou
san
ds)
% u
nem
plo
yed
Initial jobless claims Unemployment rate (%)
65.0
75.0
85.0
95.0
105.0
115.0
125.0
135.0
145.0
48.0
50.0
52.0
54.0
56.0
58.0
60.0
62.0
64.0
Co
nsu
mer c
on
fiden
ce
IS
M N
on
-man
ufa
ctu
rin
g
ISM Non-manufacturing Consumer confidence
Industrial production indexISM purchase managers index
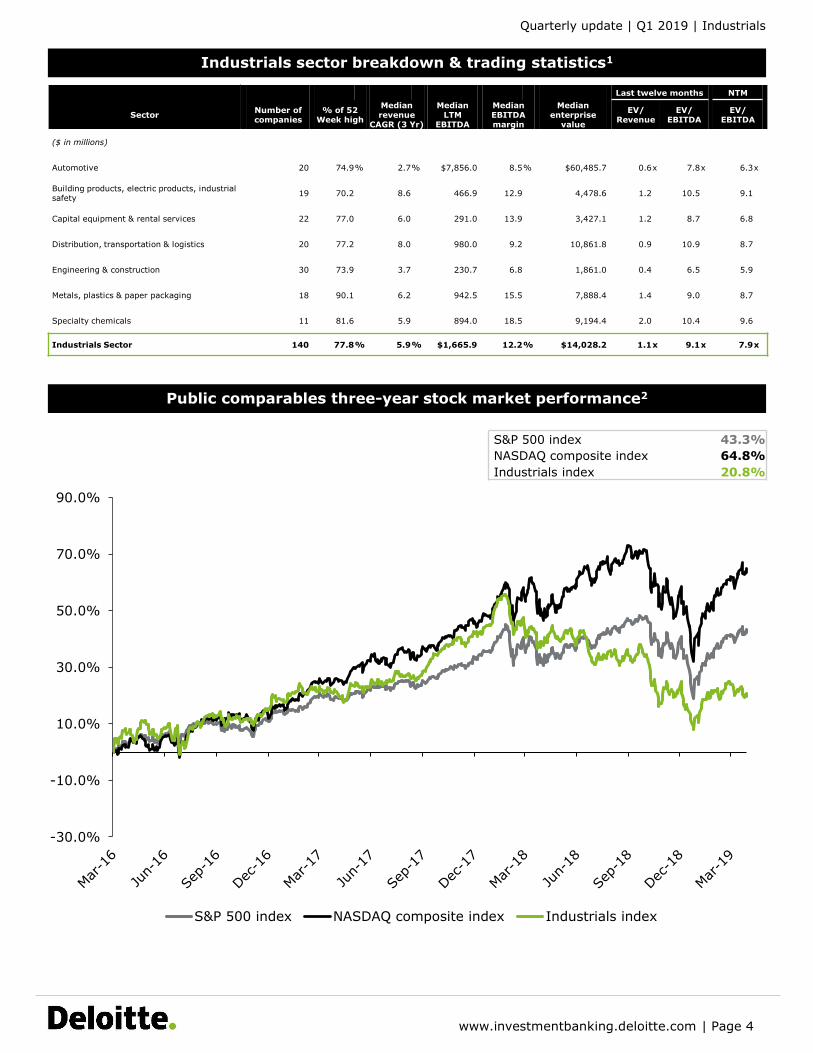
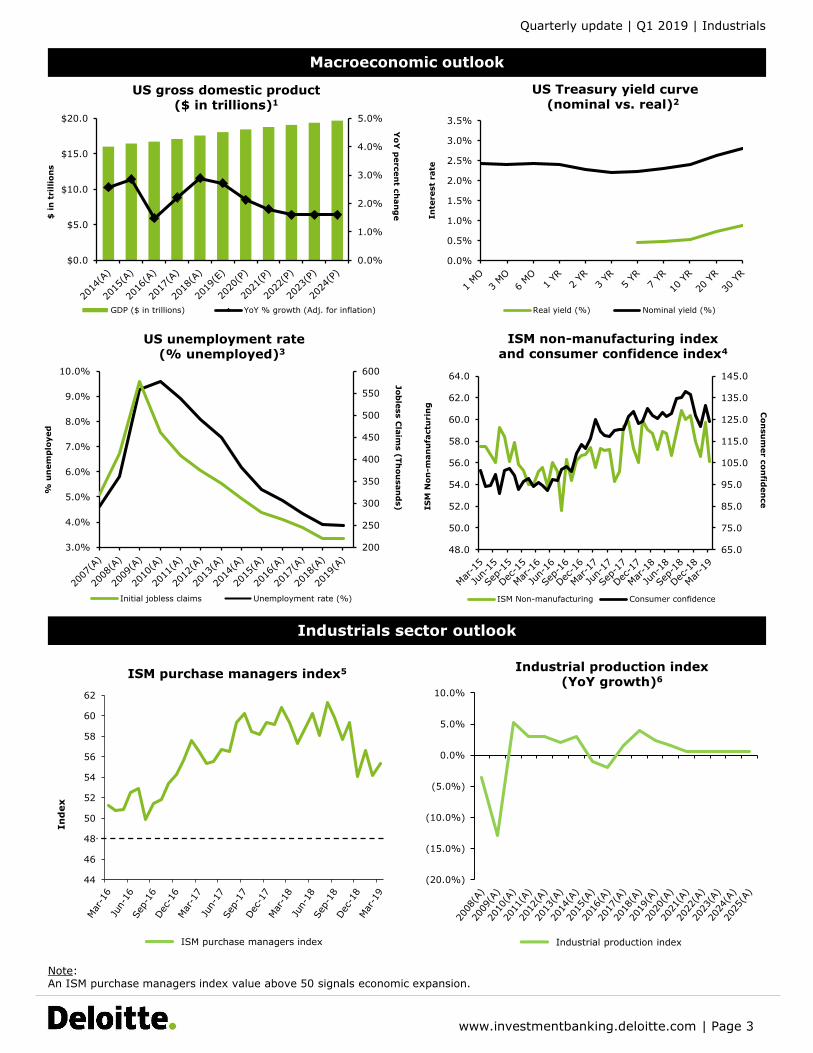
Industrials sector breakdown & trading statistics1
Public comparables three-year stock market performance2
S&P 500 index 43.3%
NASDAQ composite index 64.8%
Industrials index 20.8%
www.investmentbanking.deloitte.com | Page 4
Quarterly update | Q1 2019 | Industrials
Last twelve months NTM
SectorNumber of companies
% of 52 Week high
Median revenue
CAGR (3 Yr)
Median LTM
EBITDA
Median EBITDA margin
Median enterprise
value
EV/Revenue
EV/EBITDA
EV/EBITDA
20 74.9 % 2.7 % $7,856.0 8.5 % $60,485.7 0.6 x 7.8 x 6.3 x
19 70.2 8.6 466.9 12.9 4,478.6 1.2 10.5 9.1
22 77.0 6.0 291.0 13.9 3,427.1 1.2 8.7 6.8
20 77.2 8.0 980.0 9.2 10,861.8 0.9 10.9 8.7
30 73.9 3.7 230.7 6.8 1,861.0 0.4 6.5 5.9
18 90.1 6.2 942.5 15.5 7,888.4 1.4 9.0 8.7
($ in millions)
Automotive
Building products, electric products, industrial safety
Capital equipment & rental services
Distribution, transportation & logistics
Engineering & construction
Metals, plastics & paper packaging
Specialty chemicals 11 81.6 5.9 894.0 18.5 9,194.4 2.0 10.4 9.6
Industrials Sector 140 77.8 % 5.9 % $1,665.9 12.2 % $14,028.2 1.1 x 9.1 x 7.9 x
-30.0%
-10.0%
10.0%
30.0%
50.0%
70.0%
90.0%
S&P 500 index NASDAQ composite index Industrials index
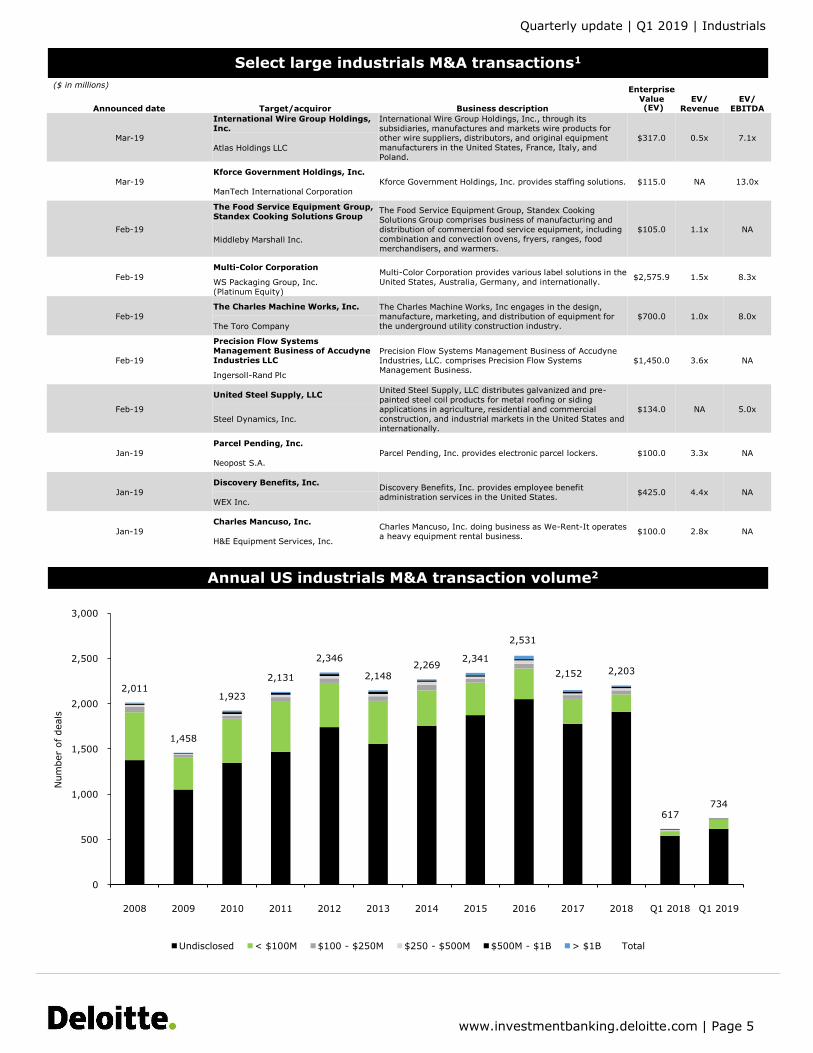
Select large industrials M&A transactions1
Annual US industrials M&A transaction volume2
www.investmentbanking.deloitte.com | Page 5
Quarterly update | Q1 2019 | Industrials
($ in millions)
2,011
1,458
1,923
2,131
2,346
2,1482,269
2,341
2,531
2,152 2,203
617734
0
500
1,000
1,500
2,000
2,500
3,000
2008 2009 2010 2011 2012 2013 2014 2015 2016 2017 2018 Q1 2018 Q1 2019
Num
ber
of de
als
Undisclosed < $100M $100 - $250M $250 - $500M $500M - $1B > $1B Total
Announced date Target/acquiror Business description
Enterprise Value (EV)
EV/Revenue
EV/EBITDA
Mar-19
International Wire Group Holdings, Inc.
International Wire Group Holdings, Inc., through its subsidiaries, manufactures and markets wire products for other wire suppliers, distributors, and original equipment manufacturers in the United States, France, Italy, and Poland.
$317.0 0.5x 7.1x
Atlas Holdings LLC
Mar-19
Kforce Government Holdings, Inc.
Kforce Government Holdings, Inc. provides staffing solutions. $115.0 NA 13.0x
ManTech International Corporation
Feb-19
The Food Service Equipment Group, Standex Cooking Solutions Group
The Food Service Equipment Group, Standex Cooking Solutions Group comprises business of manufacturing and distribution of commercial food service equipment, including combination and convection ovens, fryers, ranges, food merchandisers, and warmers.
$105.0 1.1x NA
Middleby Marshall Inc.
Feb-19
Multi-Color CorporationMulti-Color Corporation provides various label solutions in the United States, Australia, Germany, and internationally.
$2,575.9 1.5x 8.3x WS Packaging Group, Inc. (Platinum Equity)
Feb-19
The Charles Machine Works, Inc. The Charles Machine Works, Inc engages in the design, manufacture, marketing, and distribution of equipment for the underground utility construction industry.
$700.0 1.0x 8.0x
The Toro Company
Feb-19
Precision Flow Systems Management Business of Accudyne Industries LLC
Precision Flow Systems Management Business of AccudyneIndustries, LLC. comprises Precision Flow Systems Management Business.
$1,450.0 3.6x NA
Ingersoll-Rand Plc
Feb-19
United Steel Supply, LLCUnited Steel Supply, LLC distributes galvanized and pre-painted steel coil products for metal roofing or siding applications in agriculture, residential and commercial construction, and industrial markets in the United States and internationally.
$134.0 NA 5.0x
Steel Dynamics, Inc.
Jan-19
Parcel Pending, Inc.
Parcel Pending, Inc. provides electronic parcel lockers. $100.0 3.3x NA
Neopost S.A.
Jan-19
Discovery Benefits, Inc.Discovery Benefits, Inc. provides employee benefit administration services in the United States.
$425.0 4.4x NA
WEX Inc.
Jan-19
Charles Mancuso, Inc.Charles Mancuso, Inc. doing business as We-Rent-It operates a heavy equipment rental business.
$100.0 2.8x NA
H&E Equipment Services, Inc.
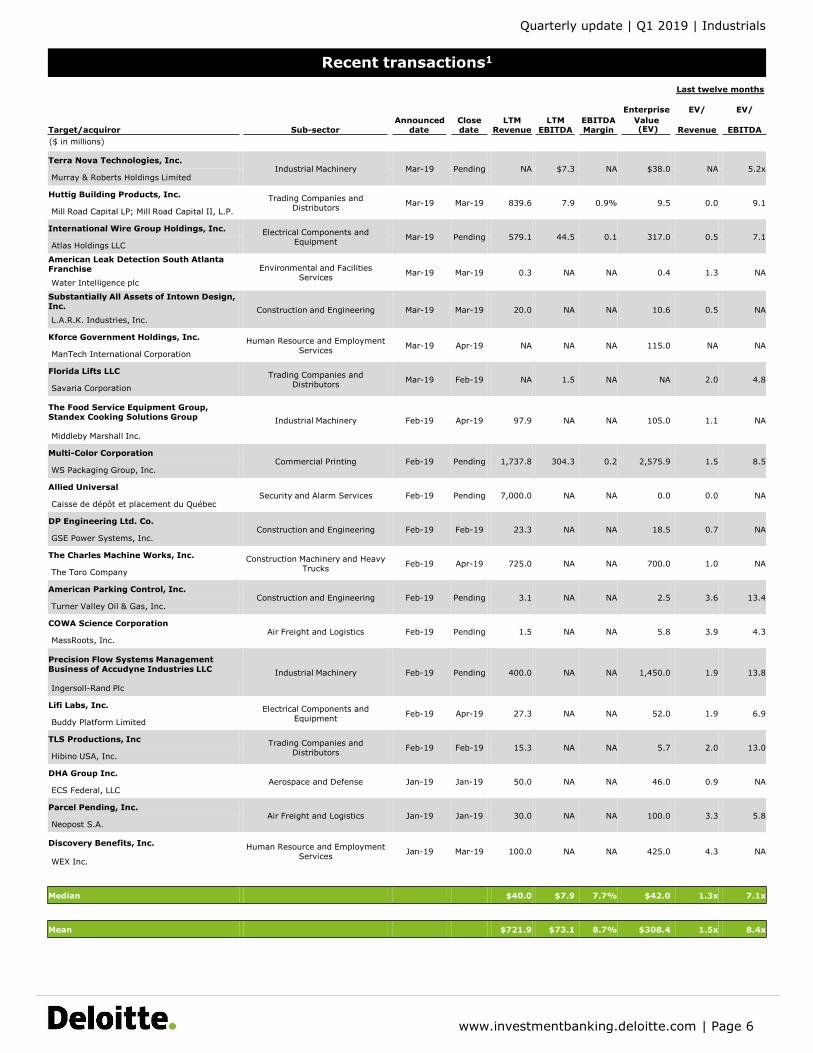
Recent transactions1
www.investmentbanking.deloitte.com | Page 6
Quarterly update | Q1 2019 | Industrials
($ in millions)
Last twelve months
Enterprise EV/ EV/
Target/acquiror Sub-sectorAnnounced
dateClose date
LTMRevenue
LTMEBITDA
EBITDAMargin
Value (EV) Revenue EBITDA
Terra Nova Technologies, Inc.Industrial Machinery Mar-19 Pending NA $7.3 NA $38.0 NA 5.2x
Murray & Roberts Holdings Limited
Huttig Building Products, Inc. Trading Companies and Distributors
Mar-19 Mar-19 839.6 7.9 0.9% 9.5 0.0 9.1 Mill Road Capital LP; Mill Road Capital II, L.P.
International Wire Group Holdings, Inc. Electrical Components and Equipment
Mar-19 Pending 579.1 44.5 0.1 317.0 0.5 7.1 Atlas Holdings LLC
American Leak Detection South Atlanta Franchise Environmental and Facilities
ServicesMar-19 Mar-19 0.3 NA NA 0.4 1.3 NA
Water Intelligence plc
Substantially All Assets of Intown Design, Inc. Construction and Engineering Mar-19 Mar-19 20.0 NA NA 10.6 0.5 NA
L.A.R.K. Industries, Inc.
Kforce Government Holdings, Inc. Human Resource and Employment Services
Mar-19 Apr-19 NA NA NA 115.0 NA NA ManTech International Corporation
Florida Lifts LLC Trading Companies and Distributors
Mar-19 Feb-19 NA 1.5 NA NA 2.0 4.8 Savaria Corporation
The Food Service Equipment Group, Standex Cooking Solutions Group Industrial Machinery Feb-19 Apr-19 97.9 NA NA 105.0 1.1 NA
Middleby Marshall Inc.
Multi-Color CorporationCommercial Printing Feb-19 Pending 1,737.8 304.3 0.2 2,575.9 1.5 8.5
WS Packaging Group, Inc.
Allied UniversalSecurity and Alarm Services Feb-19 Pending 7,000.0 NA NA 0.0 0.0 NA
Caisse de dépôt et placement du Québec
DP Engineering Ltd. Co.Construction and Engineering Feb-19 Feb-19 23.3 NA NA 18.5 0.7 NA
GSE Power Systems, Inc.
The Charles Machine Works, Inc. Construction Machinery and Heavy Trucks
Feb-19 Apr-19 725.0 NA NA 700.0 1.0 NA The Toro Company
American Parking Control, Inc.Construction and Engineering Feb-19 Pending 3.1 NA NA 2.5 3.6 13.4
Turner Valley Oil & Gas, Inc.
COWA Science CorporationAir Freight and Logistics Feb-19 Pending 1.5 NA NA 5.8 3.9 4.3
MassRoots, Inc.
Precision Flow Systems Management Business of Accudyne Industries LLC Industrial Machinery Feb-19 Pending 400.0 NA NA 1,450.0 1.9 13.8
Ingersoll-Rand Plc
Lifi Labs, Inc. Electrical Components and Equipment
Feb-19 Apr-19 27.3 NA NA 52.0 1.9 6.9 Buddy Platform Limited
TLS Productions, Inc Trading Companies and Distributors
Feb-19 Feb-19 15.3 NA NA 5.7 2.0 13.0 Hibino USA, Inc.
DHA Group Inc.Aerospace and Defense Jan-19 Jan-19 50.0 NA NA 46.0 0.9 NA
ECS Federal, LLC
Parcel Pending, Inc.Air Freight and Logistics Jan-19 Jan-19 30.0 NA NA 100.0 3.3 5.8
Neopost S.A.
Discovery Benefits, Inc. Human Resource and Employment Services
Jan-19 Mar-19 100.0 NA NA 425.0 4.3 NA
WEX Inc.
Median $40.0 $7.9 7.7% $42.0 1.3x 7.1x
Mean $721.9 $73.1 8.7% $308.4 1.5x 8.4x
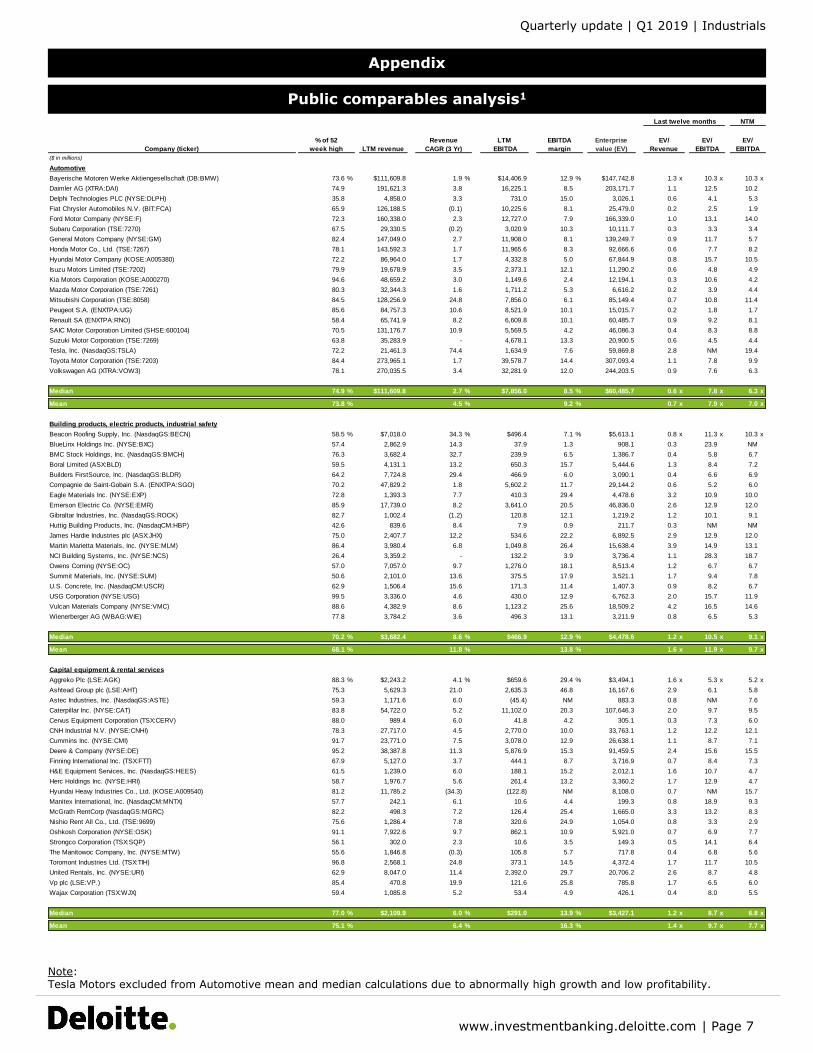
Appendix
Public comparables analysis1
www.investmentbanking.deloitte.com | Page 7
Note:Tesla Motors excluded from Automotive mean and median calculations due to abnormally high growth and low profitability.
Quarterly update | Q1 2019 | Industrials
Last twelve months
Company (ticker)
% of 52
week high LTM revenue
Revenue
CAGR (3 Yr)
LTM
EBITDA
EBITDA
margin
Enterprise
value (EV)
($ in millions)
Automotive
Bayerische Motoren Werke Aktiengesellschaft (DB:BMW) 73.6 % $111,609.8 1.9 % $14,406.9 12.9 % $147,742.8 1.3 x 10.3 x 10.3 x
Daimler AG (XTRA:DAI) 74.9 191,621.3 3.8 16,225.1 8.5 203,171.7 1.1 12.5 10.2
Delphi Technologies PLC (NYSE:DLPH) 35.8 4,858.0 3.3 731.0 15.0 3,026.1 0.6 4.1 5.3
Fiat Chrysler Automobiles N.V. (BIT:FCA) 65.9 126,188.5 (0.1) 10,225.6 8.1 25,479.0 0.2 2.5 1.9
Ford Motor Company (NYSE:F) 72.3 160,338.0 2.3 12,727.0 7.9 166,339.0 1.0 13.1 14.0
Subaru Corporation (TSE:7270) 67.5 29,330.5 (0.2) 3,020.9 10.3 10,111.7 0.3 3.3 3.4
General Motors Company (NYSE:GM) 82.4 147,049.0 2.7 11,908.0 8.1 139,249.7 0.9 11.7 5.7
Honda Motor Co., Ltd. (TSE:7267) 78.1 143,592.3 1.7 11,965.6 8.3 92,666.6 0.6 7.7 8.2
Hyundai Motor Company (KOSE:A005380) 72.2 86,964.0 1.7 4,332.8 5.0 67,844.9 0.8 15.7 10.5
Isuzu Motors Limited (TSE:7202) 79.9 19,678.9 3.5 2,373.1 12.1 11,290.2 0.6 4.8 4.9
Kia Motors Corporation (KOSE:A000270) 94.6 48,659.2 3.0 1,149.6 2.4 12,194.1 0.3 10.6 4.2
Mazda Motor Corporation (TSE:7261) 80.3 32,344.3 1.6 1,711.2 5.3 6,616.2 0.2 3.9 4.4
Mitsubishi Corporation (TSE:8058) 84.5 128,256.9 24.8 7,856.0 6.1 85,149.4 0.7 10.8 11.4
Peugeot S.A. (ENXTPA:UG) 85.6 84,757.3 10.6 8,521.9 10.1 15,015.7 0.2 1.8 1.7
Renault SA (ENXTPA:RNO) 58.4 65,741.9 8.2 6,609.8 10.1 60,485.7 0.9 9.2 8.1
SAIC Motor Corporation Limited (SHSE:600104) 70.5 131,176.7 10.9 5,569.5 4.2 46,086.3 0.4 8.3 8.8
Suzuki Motor Corporation (TSE:7269) 63.8 35,283.9 - 4,678.1 13.3 20,900.5 0.6 4.5 4.4
Tesla, Inc. (NasdaqGS:TSLA) 72.2 21,461.3 74.4 1,634.9 7.6 59,869.8 2.8 NM 19.4
Toyota Motor Corporation (TSE:7203) 84.4 273,965.1 1.7 39,578.7 14.4 307,093.4 1.1 7.8 9.9
Volkswagen AG (XTRA:VOW3) 78.1 270,035.5 3.4 32,281.9 12.0 244,203.5 0.9 7.6 6.3
Median 74.9 % $111,609.8 2.7 % $7,856.0 8.5 % $60,485.7 0.6 x 7.8 x 6.3 x
Mean 73.8 % 4.5 % 9.2 % 0.7 x 7.9 x 7.0 x
Building products, electric products, industrial safety
Beacon Roofing Supply, Inc. (NasdaqGS:BECN) 58.5 % $7,018.0 34.3 % $496.4 7.1 % $5,613.1 0.8 x 11.3 x 10.3 x
BlueLinx Holdings Inc. (NYSE:BXC) 57.4 2,862.9 14.3 37.9 1.3 908.1 0.3 23.9 NM
BMC Stock Holdings, Inc. (NasdaqGS:BMCH) 76.3 3,682.4 32.7 239.9 6.5 1,386.7 0.4 5.8 6.7
Boral Limited (ASX:BLD) 59.5 4,131.1 13.2 650.3 15.7 5,444.6 1.3 8.4 7.2
Builders FirstSource, Inc. (NasdaqGS:BLDR) 64.2 7,724.8 29.4 466.9 6.0 3,090.1 0.4 6.6 6.9
Compagnie de Saint-Gobain S.A. (ENXTPA:SGO) 70.2 47,829.2 1.8 5,602.2 11.7 29,144.2 0.6 5.2 6.0
Eagle Materials Inc. (NYSE:EXP) 72.8 1,393.3 7.7 410.3 29.4 4,478.6 3.2 10.9 10.0
Emerson Electric Co. (NYSE:EMR) 85.9 17,739.0 8.2 3,641.0 20.5 46,836.0 2.6 12.9 12.0
Gibraltar Industries, Inc. (NasdaqGS:ROCK) 82.7 1,002.4 (1.2) 120.8 12.1 1,219.2 1.2 10.1 9.1
Huttig Building Products, Inc. (NasdaqCM:HBP) 42.6 839.6 8.4 7.9 0.9 211.7 0.3 NM NM
James Hardie Industries plc (ASX:JHX) 75.0 2,407.7 12.2 534.6 22.2 6,892.5 2.9 12.9 12.0
Martin Marietta Materials, Inc. (NYSE:MLM) 86.4 3,980.4 6.8 1,049.8 26.4 15,638.4 3.9 14.9 13.1
NCI Building Systems, Inc. (NYSE:NCS) 26.4 3,359.2 - 132.2 3.9 3,736.4 1.1 28.3 18.7
Owens Corning (NYSE:OC) 57.0 7,057.0 9.7 1,276.0 18.1 8,513.4 1.2 6.7 6.7
Summit Materials, Inc. (NYSE:SUM) 50.6 2,101.0 13.6 375.5 17.9 3,521.1 1.7 9.4 7.8
U.S. Concrete, Inc. (NasdaqCM:USCR) 62.9 1,506.4 15.6 171.3 11.4 1,407.3 0.9 8.2 6.7
USG Corporation (NYSE:USG) 99.5 3,336.0 4.6 430.0 12.9 6,762.3 2.0 15.7 11.9
Vulcan Materials Company (NYSE:VMC) 88.6 4,382.9 8.6 1,123.2 25.6 18,509.2 4.2 16.5 14.6
Wienerberger AG (WBAG:WIE) 77.8 3,784.2 3.6 496.3 13.1 3,211.9 0.8 6.5 5.3
Median 70.2 % $3,682.4 8.6 % $466.9 12.9 % $4,478.6 1.2 x 10.5 x 9.1 x
Mean 68.1 % 11.8 % 13.8 % 1.6 x 11.9 x 9.7 x
Capital equipment & rental services
Aggreko Plc (LSE:AGK) 88.3 % $2,243.2 4.1 % $659.6 29.4 % $3,494.1 1.6 x 5.3 x 5.2 x
Ashtead Group plc (LSE:AHT) 75.3 5,629.3 21.0 2,635.3 46.8 16,167.6 2.9 6.1 5.8
Astec Industries, Inc. (NasdaqGS:ASTE) 59.3 1,171.6 6.0 (45.4) NM 883.3 0.8 NM 7.6
Caterpillar Inc. (NYSE:CAT) 83.8 54,722.0 5.2 11,102.0 20.3 107,646.3 2.0 9.7 9.5
Cervus Equipment Corporation (TSX:CERV) 88.0 989.4 6.0 41.8 4.2 305.1 0.3 7.3 6.0
CNH Industrial N.V. (NYSE:CNHI) 78.3 27,717.0 4.5 2,770.0 10.0 33,763.1 1.2 12.2 12.1
Cummins Inc. (NYSE:CMI) 91.7 23,771.0 7.5 3,078.0 12.9 26,638.1 1.1 8.7 7.1
Deere & Company (NYSE:DE) 95.2 38,387.8 11.3 5,876.9 15.3 91,459.5 2.4 15.6 15.5
Finning International Inc. (TSX:FTT) 67.9 5,127.0 3.7 444.1 8.7 3,716.9 0.7 8.4 7.3
H&E Equipment Services, Inc. (NasdaqGS:HEES) 61.5 1,239.0 6.0 188.1 15.2 2,012.1 1.6 10.7 4.7
Herc Holdings Inc. (NYSE:HRI) 58.7 1,976.7 5.6 261.4 13.2 3,360.2 1.7 12.9 4.7
Hyundai Heavy Industries Co., Ltd. (KOSE:A009540) 81.2 11,785.2 (34.3) (122.8) NM 8,108.0 0.7 NM 15.7
Manitex International, Inc. (NasdaqCM:MNTX) 57.7 242.1 6.1 10.6 4.4 199.3 0.8 18.9 9.3
McGrath RentCorp (NasdaqGS:MGRC) 82.2 498.3 7.2 126.4 25.4 1,665.0 3.3 13.2 8.3
Nishio Rent All Co., Ltd. (TSE:9699) 75.6 1,286.4 7.8 320.6 24.9 1,054.0 0.8 3.3 2.9
Oshkosh Corporation (NYSE:OSK) 91.1 7,922.6 9.7 862.1 10.9 5,921.0 0.7 6.9 7.7
Strongco Corporation (TSX:SQP) 56.1 302.0 2.3 10.6 3.5 149.3 0.5 14.1 6.4
The Manitowoc Company, Inc. (NYSE:MTW) 55.6 1,846.8 (0.3) 105.8 5.7 717.8 0.4 6.8 5.6
Toromont Industries Ltd. (TSX:TIH) 96.8 2,568.1 24.8 373.1 14.5 4,372.4 1.7 11.7 10.5
United Rentals, Inc. (NYSE:URI) 62.9 8,047.0 11.4 2,392.0 29.7 20,706.2 2.6 8.7 4.8
Vp plc (LSE:VP.) 85.4 470.8 19.9 121.6 25.8 785.8 1.7 6.5 6.0
Wajax Corporation (TSX:WJX) 59.4 1,085.8 5.2 53.4 4.9 426.1 0.4 8.0 5.5
Median 77.0 % $2,109.9 6.0 % $291.0 13.9 % $3,427.1 1.2 x 8.7 x 6.8 x
Mean 75.1 % 6.4 % 16.3 % 1.4 x 9.7 x 7.7 x
EV/
EBITDA
NTM
EV/
Revenue
EV/
EBITDA
Last twelve months
Company (ticker)
% of 52
week high LTM revenue
Revenue
CAGR (3 Yr)
LTM
EBITDA
EBITDA
margin
Enterprise
value (EV)
($ in millions)
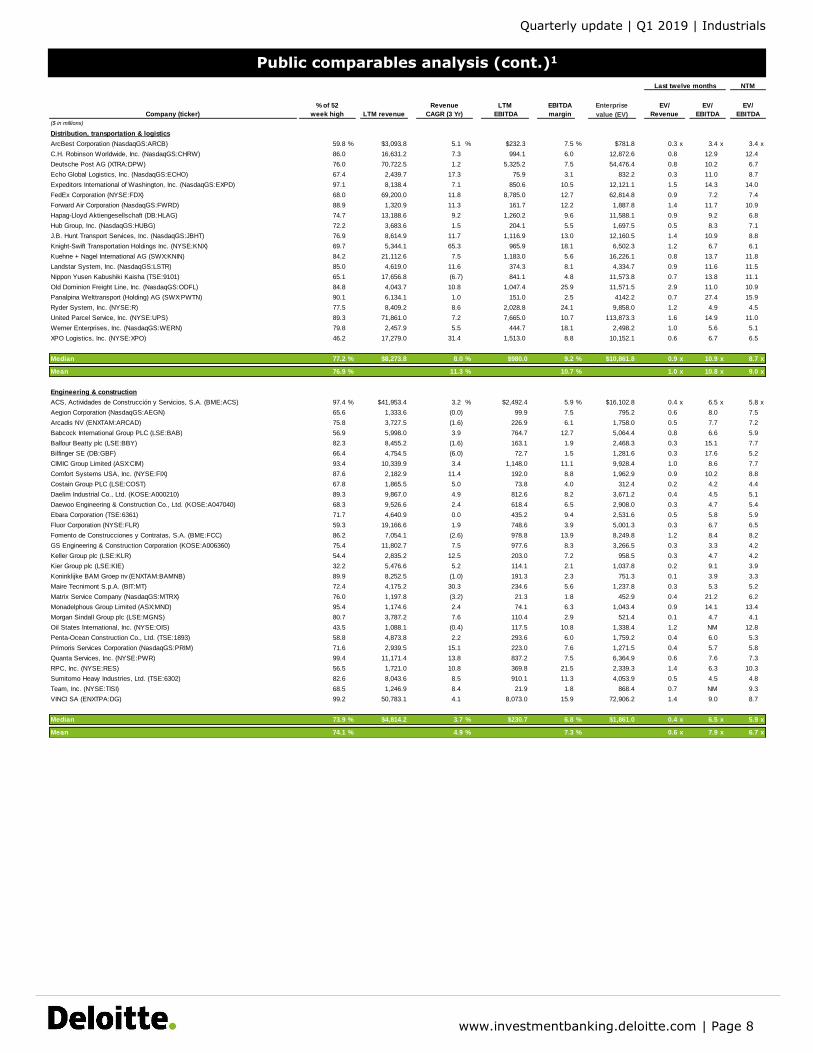
Distribution, transportation & logistics
ArcBest Corporation (NasdaqGS:ARCB) 59.8 % $3,093.8 5.1 % $232.3 7.5 % $781.8 0.3 x 3.4 x 3.4 x
C.H. Robinson Worldwide, Inc. (NasdaqGS:CHRW) 86.0 16,631.2 7.3 994.1 6.0 12,872.6 0.8 12.9 12.4
Deutsche Post AG (XTRA:DPW) 76.0 70,722.5 1.2 5,325.2 7.5 54,476.4 0.8 10.2 6.7
Echo Global Logistics, Inc. (NasdaqGS:ECHO) 67.4 2,439.7 17.3 75.9 3.1 832.2 0.3 11.0 8.7
Expeditors International of Washington, Inc. (NasdaqGS:EXPD) 97.1 8,138.4 7.1 850.6 10.5 12,121.1 1.5 14.3 14.0
FedEx Corporation (NYSE:FDX) 68.0 69,200.0 11.8 8,785.0 12.7 62,814.8 0.9 7.2 7.4
Forward Air Corporation (NasdaqGS:FWRD) 88.9 1,320.9 11.3 161.7 12.2 1,887.8 1.4 11.7 10.9
Hapag-Lloyd Aktiengesellschaft (DB:HLAG) 74.7 13,188.6 9.2 1,260.2 9.6 11,588.1 0.9 9.2 6.8
Hub Group, Inc. (NasdaqGS:HUBG) 72.2 3,683.6 1.5 204.1 5.5 1,697.5 0.5 8.3 7.1
J.B. Hunt Transport Services, Inc. (NasdaqGS:JBHT) 76.9 8,614.9 11.7 1,116.9 13.0 12,160.5 1.4 10.9 8.8
Knight-Swift Transportation Holdings Inc. (NYSE:KNX) 69.7 5,344.1 65.3 965.9 18.1 6,502.3 1.2 6.7 6.1
Kuehne + Nagel International AG (SWX:KNIN) 84.2 21,112.6 7.5 1,183.0 5.6 16,226.1 0.8 13.7 11.8
Landstar System, Inc. (NasdaqGS:LSTR) 85.0 4,619.0 11.6 374.3 8.1 4,334.7 0.9 11.6 11.5
Nippon Yusen Kabushiki Kaisha (TSE:9101) 65.1 17,656.8 (6.7) 841.1 4.8 11,573.8 0.7 13.8 11.1
Old Dominion Freight Line, Inc. (NasdaqGS:ODFL) 84.8 4,043.7 10.8 1,047.4 25.9 11,571.5 2.9 11.0 10.9
Panalpina Welttransport (Holding) AG (SWX:PWTN) 90.1 6,134.1 1.0 151.0 2.5 4142.2 0.7 27.4 15.9
Ryder System, Inc. (NYSE:R) 77.5 8,409.2 8.6 2,028.8 24.1 9,858.0 1.2 4.9 4.5
United Parcel Service, Inc. (NYSE:UPS) 89.3 71,861.0 7.2 7,665.0 10.7 113,873.3 1.6 14.9 11.0
Werner Enterprises, Inc. (NasdaqGS:WERN) 79.8 2,457.9 5.5 444.7 18.1 2,498.2 1.0 5.6 5.1
XPO Logistics, Inc. (NYSE:XPO) 46.2 17,279.0 31.4 1,513.0 8.8 10,152.1 0.6 6.7 6.5
Median 77.2 % $8,273.8 8.0 % $980.0 9.2 % $10,861.8 0.9 x 10.9 x 8.7 x
Mean 76.9 % 11.3 % 10.7 % 1.0 x 10.8 x 9.0 x
Engineering & construction
ACS, Actividades de Construcción y Servicios, S.A. (BME:ACS) 97.4 % $41,953.4 3.2 % $2,492.4 5.9 % $16,102.8 0.4 x 6.5 x 5.8 x
Aegion Corporation (NasdaqGS:AEGN) 65.6 1,333.6 (0.0) 99.9 7.5 795.2 0.6 8.0 7.5
Arcadis NV (ENXTAM:ARCAD) 75.8 3,727.5 (1.6) 226.9 6.1 1,758.0 0.5 7.7 7.2
Babcock International Group PLC (LSE:BAB) 56.9 5,998.0 3.9 764.7 12.7 5,064.4 0.8 6.6 5.9
Balfour Beatty plc (LSE:BBY) 82.3 8,455.2 (1.6) 163.1 1.9 2,468.3 0.3 15.1 7.7
Bilfinger SE (DB:GBF) 66.4 4,754.5 (6.0) 72.7 1.5 1,281.6 0.3 17.6 5.2
CIMIC Group Limited (ASX:CIM) 93.4 10,339.9 3.4 1,148.0 11.1 9,928.4 1.0 8.6 7.7
Comfort Systems USA, Inc. (NYSE:FIX) 87.6 2,182.9 11.4 192.0 8.8 1,962.9 0.9 10.2 8.8
Costain Group PLC (LSE:COST) 67.8 1,865.5 5.0 73.8 4.0 312.4 0.2 4.2 4.4
Daelim Industrial Co., Ltd. (KOSE:A000210) 89.3 9,867.0 4.9 812.6 8.2 3,671.2 0.4 4.5 5.1
Daewoo Engineering & Construction Co., Ltd. (KOSE:A047040) 68.3 9,526.6 2.4 618.4 6.5 2,908.0 0.3 4.7 5.4
Ebara Corporation (TSE:6361) 71.7 4,640.9 0.0 435.2 9.4 2,531.6 0.5 5.8 5.9
Fluor Corporation (NYSE:FLR) 59.3 19,166.6 1.9 748.6 3.9 5,001.3 0.3 6.7 6.5
Fomento de Construcciones y Contratas, S.A. (BME:FCC) 86.2 7,054.1 (2.6) 978.8 13.9 8,249.8 1.2 8.4 8.2
GS Engineering & Construction Corporation (KOSE:A006360) 75.4 11,802.7 7.5 977.6 8.3 3,266.5 0.3 3.3 4.2
Keller Group plc (LSE:KLR) 54.4 2,835.2 12.5 203.0 7.2 958.5 0.3 4.7 4.2
Kier Group plc (LSE:KIE) 32.2 5,476.6 5.2 114.1 2.1 1,037.8 0.2 9.1 3.9
Koninklijke BAM Groep nv (ENXTAM:BAMNB) 89.9 8,252.5 (1.0) 191.3 2.3 751.3 0.1 3.9 3.3
Maire Tecnimont S.p.A. (BIT:MT) 72.4 4,175.2 30.3 234.6 5.6 1,237.8 0.3 5.3 5.2
Matrix Service Company (NasdaqGS:MTRX) 76.0 1,197.8 (3.2) 21.3 1.8 452.9 0.4 21.2 6.2
Monadelphous Group Limited (ASX:MND) 95.4 1,174.6 2.4 74.1 6.3 1,043.4 0.9 14.1 13.4
Morgan Sindall Group plc (LSE:MGNS) 80.7 3,787.2 7.6 110.4 2.9 521.4 0.1 4.7 4.1
Oil States International, Inc. (NYSE:OIS) 43.5 1,088.1 (0.4) 117.5 10.8 1,338.4 1.2 NM 12.8
Penta-Ocean Construction Co., Ltd. (TSE:1893) 58.8 4,873.8 2.2 293.6 6.0 1,759.2 0.4 6.0 5.3
Primoris Services Corporation (NasdaqGS:PRIM) 71.6 2,939.5 15.1 223.0 7.6 1,271.5 0.4 5.7 5.8
Quanta Services, Inc. (NYSE:PWR) 99.4 11,171.4 13.8 837.2 7.5 6,364.9 0.6 7.6 7.3
RPC, Inc. (NYSE:RES) 56.5 1,721.0 10.8 369.8 21.5 2,339.3 1.4 6.3 10.3
Sumitomo Heavy Industries, Ltd. (TSE:6302) 82.6 8,043.6 8.5 910.1 11.3 4,053.9 0.5 4.5 4.8
Team, Inc. (NYSE:TISI) 68.5 1,246.9 8.4 21.9 1.8 868.4 0.7 NM 9.3
VINCI SA (ENXTPA:DG) 99.2 50,783.1 4.1 8,073.0 15.9 72,906.2 1.4 9.0 8.7
Median 73.9 % $4,814.2 3.7 % $230.7 6.8 % $1,861.0 0.4 x 6.5 x 5.9 x
Mean 74.1 % 4.9 % 7.3 % 0.6 x 7.9 x 6.7 x
EV/
Revenue
EV/
EBITDA
NTM
EV/
EBITDA
Public comparables analysis (cont.)1
www.investmentbanking.deloitte.com | Page 8
Quarterly update | Q1 2019 | Industrials
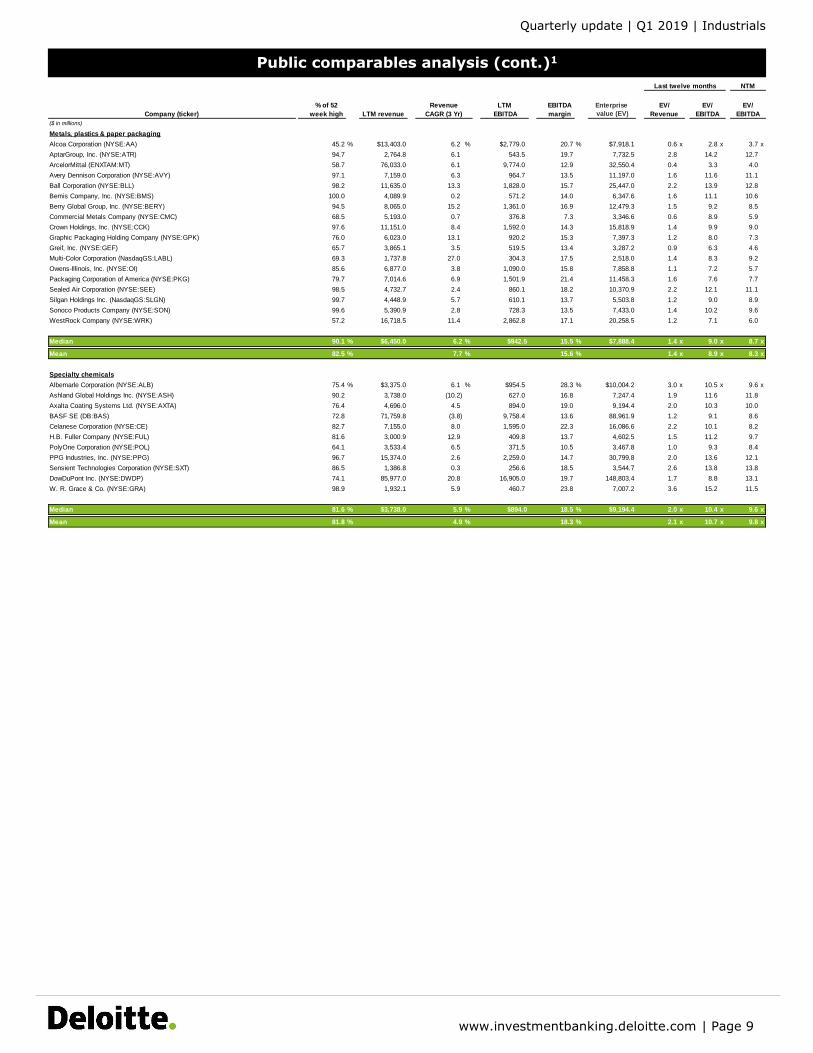
Public comparables analysis (cont.)1
www.investmentbanking.deloitte.com | Page 9
Quarterly update | Q1 2019 | Industrials
Last twelve months
Company (ticker)
% of 52
week high LTM revenue
Revenue
CAGR (3 Yr)
LTM
EBITDA
EBITDA
margin
Enterprise
value (EV)
($ in millions)
Metals, plastics & paper packaging
Alcoa Corporation (NYSE:AA) 45.2 % $13,403.0 6.2 % $2,779.0 20.7 % $7,918.1 0.6 x 2.8 x 3.7 x
AptarGroup, Inc. (NYSE:ATR) 94.7 2,764.8 6.1 543.5 19.7 7,732.5 2.8 14.2 12.7
ArcelorMittal (ENXTAM:MT) 58.7 76,033.0 6.1 9,774.0 12.9 32,550.4 0.4 3.3 4.0
Avery Dennison Corporation (NYSE:AVY) 97.1 7,159.0 6.3 964.7 13.5 11,197.0 1.6 11.6 11.1
Ball Corporation (NYSE:BLL) 98.2 11,635.0 13.3 1,828.0 15.7 25,447.0 2.2 13.9 12.8
Bemis Company, Inc. (NYSE:BMS) 100.0 4,089.9 0.2 571.2 14.0 6,347.6 1.6 11.1 10.6
Berry Global Group, Inc. (NYSE:BERY) 94.5 8,065.0 15.2 1,361.0 16.9 12,479.3 1.5 9.2 8.5
Commercial Metals Company (NYSE:CMC) 68.5 5,193.0 0.7 376.8 7.3 3,346.6 0.6 8.9 5.9
Crown Holdings, Inc. (NYSE:CCK) 97.6 11,151.0 8.4 1,592.0 14.3 15,818.9 1.4 9.9 9.0
Graphic Packaging Holding Company (NYSE:GPK) 76.0 6,023.0 13.1 920.2 15.3 7,397.3 1.2 8.0 7.3
Greif, Inc. (NYSE:GEF) 65.7 3,865.1 3.5 519.5 13.4 3,287.2 0.9 6.3 4.6
Multi-Color Corporation (NasdaqGS:LABL) 69.3 1,737.8 27.0 304.3 17.5 2,518.0 1.4 8.3 9.2
Owens-Illinois, Inc. (NYSE:OI) 85.6 6,877.0 3.8 1,090.0 15.8 7,858.8 1.1 7.2 5.7
Packaging Corporation of America (NYSE:PKG) 79.7 7,014.6 6.9 1,501.9 21.4 11,458.3 1.6 7.6 7.7
Sealed Air Corporation (NYSE:SEE) 98.5 4,732.7 2.4 860.1 18.2 10,370.9 2.2 12.1 11.1
Silgan Holdings Inc. (NasdaqGS:SLGN) 99.7 4,448.9 5.7 610.1 13.7 5,503.8 1.2 9.0 8.9
Sonoco Products Company (NYSE:SON) 99.6 5,390.9 2.8 728.3 13.5 7,433.0 1.4 10.2 9.6
WestRock Company (NYSE:WRK) 57.2 16,718.5 11.4 2,862.8 17.1 20,258.5 1.2 7.1 6.0
Median 90.1 % $6,450.0 6.2 % $942.5 15.5 % $7,888.4 1.4 x 9.0 x 8.7 x
Mean 82.5 % 7.7 % 15.6 % 1.4 x 8.9 x 8.3 x
Specialty chemicals
Albemarle Corporation (NYSE:ALB) 75.4 % $3,375.0 6.1 % $954.5 28.3 % $10,004.2 3.0 x 10.5 x 9.6 x
Ashland Global Holdings Inc. (NYSE:ASH) 90.2 3,738.0 (10.2) 627.0 16.8 7,247.4 1.9 11.6 11.8
Axalta Coating Systems Ltd. (NYSE:AXTA) 76.4 4,696.0 4.5 894.0 19.0 9,194.4 2.0 10.3 10.0
BASF SE (DB:BAS) 72.8 71,759.8 (3.8) 9,758.4 13.6 88,961.9 1.2 9.1 8.6
Celanese Corporation (NYSE:CE) 82.7 7,155.0 8.0 1,595.0 22.3 16,086.6 2.2 10.1 8.2
H.B. Fuller Company (NYSE:FUL) 81.6 3,000.9 12.9 409.8 13.7 4,602.5 1.5 11.2 9.7
PolyOne Corporation (NYSE:POL) 64.1 3,533.4 6.5 371.5 10.5 3,467.8 1.0 9.3 8.4
PPG Industries, Inc. (NYSE:PPG) 96.7 15,374.0 2.6 2,259.0 14.7 30,799.8 2.0 13.6 12.1
Sensient Technologies Corporation (NYSE:SXT) 86.5 1,386.8 0.3 256.6 18.5 3,544.7 2.6 13.8 13.8
DowDuPont Inc. (NYSE:DWDP) 74.1 85,977.0 20.8 16,905.0 19.7 148,803.4 1.7 8.8 13.1
W. R. Grace & Co. (NYSE:GRA) 98.9 1,932.1 5.9 460.7 23.8 7,007.2 3.6 15.2 11.5
Median 81.6 % $3,738.0 5.9 % $894.0 18.5 % $9,194.4 2.0 x 10.4 x 9.6 x
Mean 81.8 % 4.9 % 18.3 % 2.1 x 10.7 x 9.8 x
EV/
EBITDA
EV/
Revenue
EV/
EBITDA
NTM
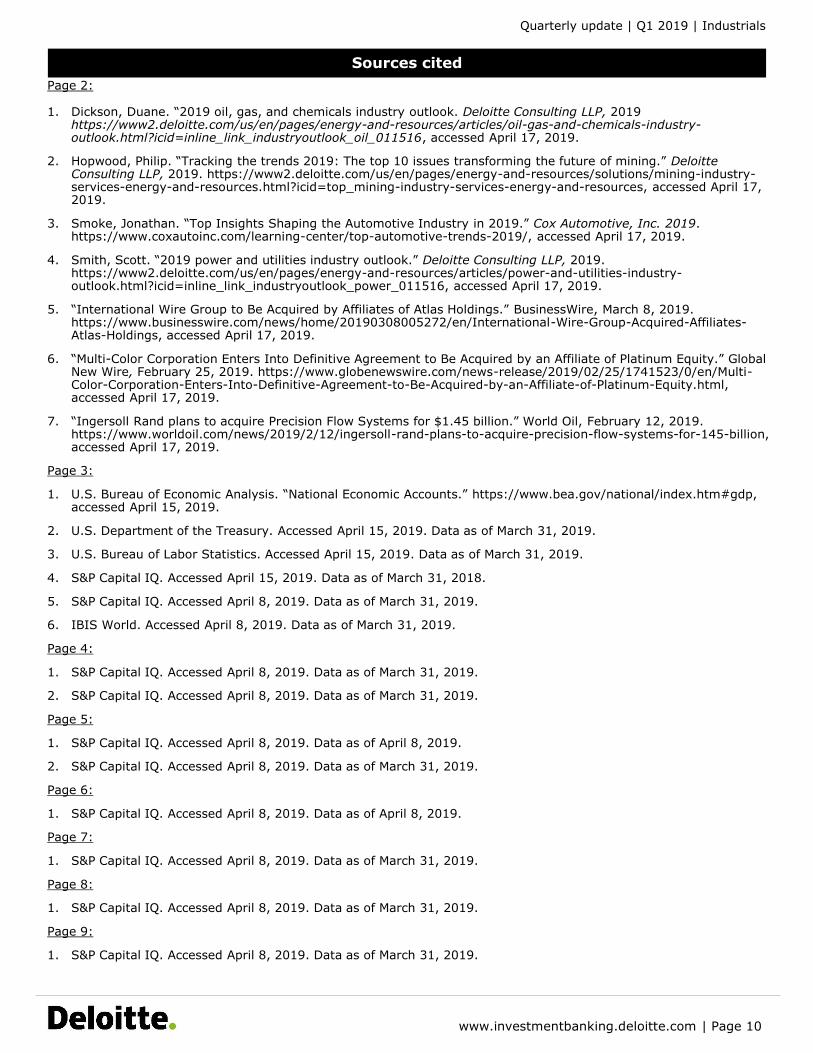
Page 2:
1. Dickson, Duane. “2019 oil, gas, and chemicals industry outlook. Deloitte Consulting LLP, 2019https://www2.deloitte.com/us/en/pages/energy-and-resources/articles/oil-gas-and-chemicals-industry-outlook.html?icid=inline_link_industryoutlook_oil_011516, accessed April 17, 2019.
2. Hopwood, Philip. “Tracking the trends 2019: The top 10 issues transforming the future of mining.” DeloitteConsulting LLP, 2019. https://www2.deloitte.com/us/en/pages/energy-and-resources/solutions/mining-industry-services-energy-and-resources.html?icid=top_mining-industry-services-energy-and-resources, accessed April 17,2019.
3. Smoke, Jonathan. “Top Insights Shaping the Automotive Industry in 2019.” Cox Automotive, Inc. 2019.https://www.coxautoinc.com/learning-center/top-automotive-trends-2019/, accessed April 17, 2019.
4. Smith, Scott. “2019 power and utilities industry outlook.” Deloitte Consulting LLP, 2019.https://www2.deloitte.com/us/en/pages/energy-and-resources/articles/power-and-utilities-industry-outlook.html?icid=inline_link_industryoutlook_power_011516, accessed April 17, 2019.
5. “International Wire Group to Be Acquired by Affiliates of Atlas Holdings.” BusinessWire, March 8, 2019.https://www.businesswire.com/news/home/20190308005272/en/International-Wire-Group-Acquired-Affiliates-Atlas-Holdings, accessed April 17, 2019.
6. “Multi-Color Corporation Enters Into Definitive Agreement to Be Acquired by an Affiliate of Platinum Equity.” GlobalNew Wire, February 25, 2019. https://www.globenewswire.com/news-release/2019/02/25/1741523/0/en/Multi-Color-Corporation-Enters-Into-Definitive-Agreement-to-Be-Acquired-by-an-Affiliate-of-Platinum-Equity.html,accessed April 17, 2019.
7. “Ingersoll Rand plans to acquire Precision Flow Systems for $1.45 billion.” World Oil, February 12, 2019.https://www.worldoil.com/news/2019/2/12/ingersoll-rand-plans-to-acquire-precision-flow-systems-for-145-billion,accessed April 17, 2019.
Page 3:
1. U.S. Bureau of Economic Analysis. “National Economic Accounts.” https://www.bea.gov/national/index.htm#gdp,accessed April 15, 2019.
2. U.S. Department of the Treasury. Accessed April 15, 2019. Data as of March 31, 2019.
3. U.S. Bureau of Labor Statistics. Accessed April 15, 2019. Data as of March 31, 2019.
4. S&P Capital IQ. Accessed April 15, 2019. Data as of March 31, 2018.
5. S&P Capital IQ. Accessed April 8, 2019. Data as of March 31, 2019.
6. IBIS World. Accessed April 8, 2019. Data as of March 31, 2019.
Page 4:
1. S&P Capital IQ. Accessed April 8, 2019. Data as of March 31, 2019.
2. S&P Capital IQ. Accessed April 8, 2019. Data as of March 31, 2019.
Page 5:
1. S&P Capital IQ. Accessed April 8, 2019. Data as of April 8, 2019.
2. S&P Capital IQ. Accessed April 8, 2019. Data as of March 31, 2019.
Page 6:
1. S&P Capital IQ. Accessed April 8, 2019. Data as of April 8, 2019.
Page 7:
1. S&P Capital IQ. Accessed April 8, 2019. Data as of March 31, 2019.
Page 8:
1. S&P Capital IQ. Accessed April 8, 2019. Data as of March 31, 2019.
Page 9:
1. S&P Capital IQ. Accessed April 8, 2019. Data as of March 31, 2019.
Sources cited
www.investmentbanking.deloitte.com | Page 10
Quarterly update | Q1 2019 | Industrials
www.investmentbanking.deloitte.com | Page 11
Deloitte Corporate Finance LLC (DCF)
Phil [email protected]+1 704 333 0533
Jonathan [email protected]+1 214 840 1779
Keith [email protected]+1 404 631 3455
Eric [email protected]+1 704 333 0518
Vijay [email protected]+1 212 313 1723
Tony Blanchard [email protected]+1 313 396 3738
Doug [email protected]+1 704 731 7219
Hector [email protected]+1 404 631 3015
Nick [email protected]+1 212 436 3273
John [email protected]+1 704 333 0574
Lorin [email protected]+1 704 333 0591
Will [email protected]+1 312 486 4458
Mike [email protected]+1 213 996 4901
Simon Gisby [email protected]+1 212 436 2495
Bill [email protected]+1 980 312 3613
Jamie [email protected]+1 214 840 7057
James [email protected]+1 704 731 8230
Byron [email protected]+1 469 417 2462
Jonathan Ohm [email protected]+1 212 436 2287
Lou [email protected]+1 704 731 7202
Jason [email protected]+1 704 333 0136
Garett [email protected]+1 213 593 4544
Matt [email protected]+1 704 731 7186
Ron [email protected]+1 404 631 3710
Justin [email protected]+1 404 942 6960
Tom [email protected]+1 214 840 7014
Charlie [email protected]+1 704 731 7201
DCF provides deal execution and lead financial advisory services to large corporate, middle market, private equity and venture capital firms. DCF and its affiliates maintain a presence in key US financial centers.
For additional information or to find out more about how DCF can assist the deal initiation and execution process, please contact one of our DCF managing directors:
Brad HestonSenior Vice President [email protected]+1 404 631 3839
Deloitte Corporate Finance Business Development Group:
www.investmentbanking.deloitte.com
John LindseySenior Vice [email protected]+1 469 417 2147
Bill PucciSenior Vice President [email protected]+1 973 602 4542
Quarterly update | Q1 2019 | Industrials
This newsletter is a periodic compilation of certain completed and announced merger and acquisition activity. Information contained in this newsletter should not be construed as a recommendation to sell or a recommendation to buy any security. Anyreference to or omission of any reference to any company in this newsletter shall not be construed as a recommendation to sell, buy or take any other action with respect to any security of any such company. We are not soliciting any action with respect to any security or company based on this newsletter. This newsletter is published solely for the general information of clients andfriends of Deloitte Corporate Finance LLC. It does not take into account the particular investment objectives, financial situation, or needs of individual recipients. Certain transactions, including those involving early stage companies, give rise to substantial risk and are not suitable for all investors. This newsletter is based on information that we consider reliable, but we do not represent that it is accurate or complete, and it should not be relied upon as such. Prediction of future events is inherently subject to both known risks, uncertainties and other factors that may cause actual results to vary materially. We are under no obligation to update the information contained in this newsletter. We and our affiliates and related entities, partners, principals, directors, and employees, including persons involved in the preparation or issuance of this newsletter, may from time to time have “long” and “short” positions in, and buy or sell, the securities, or derivatives (including options) thereof, of companies mentioned herein. The companies mentioned in this newsletter may be: (i) investment banking clients of Deloitte Corporate Finance LLC; or (ii) clients of Deloitte Financial Advisory Services LLP and its related entities. The decision to include any company for mention or discussion in this newsletter is wholly unrelated to any audit or other services that Deloitte Corporate Finance LLC may provide or to any audit services or any services that any of its affiliates or related entities may provide to such company. No part of this newsletter may be copied or duplicated in any form by any means, or redistributed without the prior written consent of Deloitte Corporate Finance LLC.
About Deloitte
Deloitte Corporate Finance LLC (DCF), a broker-dealer registered with the U.S. Securities and Exchange Commission (SEC) and member of the Financial Industry Regulatory Authority (FINRA) and the Securities Investor Protection Corporation (SIPC), is an indirect wholly-owned subsidiary of Deloitte Financial Advisory Services LLP and affiliate of Deloitte Transactions and BusinessAnalytics LLP. Investment banking or other services that would require registration as a broker-dealer with the SEC and membership in FINRA would be provided exclusively by DCF. For more information, visit www.investmentbanking.deloitte.com. Please see www.deloitte.com/us/about for a detailed description of the legal structure of Deloitte LLP and its subsidiaries. Certain services may not be available to attest clients under the rules and regulations of public accounting.
Copyright © 2019 Deloitte Development LLC. All rights reserved.
www.investmentbanking.deloitte.com | Page 12