Embed Size (px)
Citation preview

Industrials SectorJason Kraynak and Wade Guzdanski

Agenda Overview Business Analysis Economic Analysis Financial Analysis Valuation Analysis Recommendation

Overview
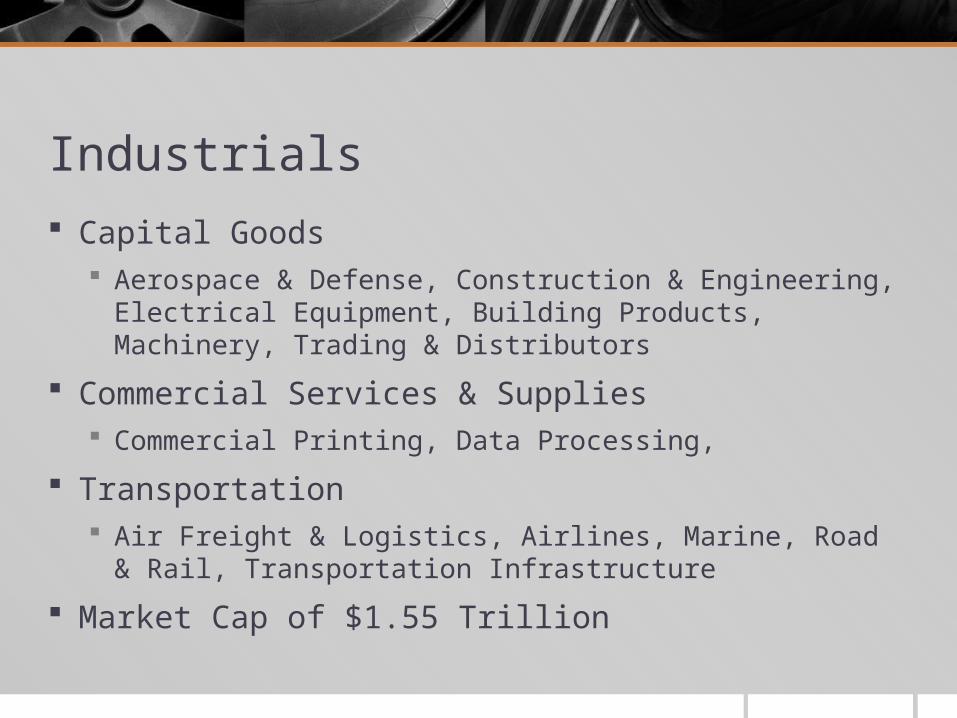
Industrials Capital Goods
Aerospace & Defense, Construction & Engineering, Electrical Equipment, Building Products, Machinery, Trading & Distributors
Commercial Services & Supplies Commercial Printing, Data Processing,
Transportation Air Freight & Logistics, Airlines, Marine, Road & Rail,
Transportation Infrastructure
Market Cap of $1.55 Trillion
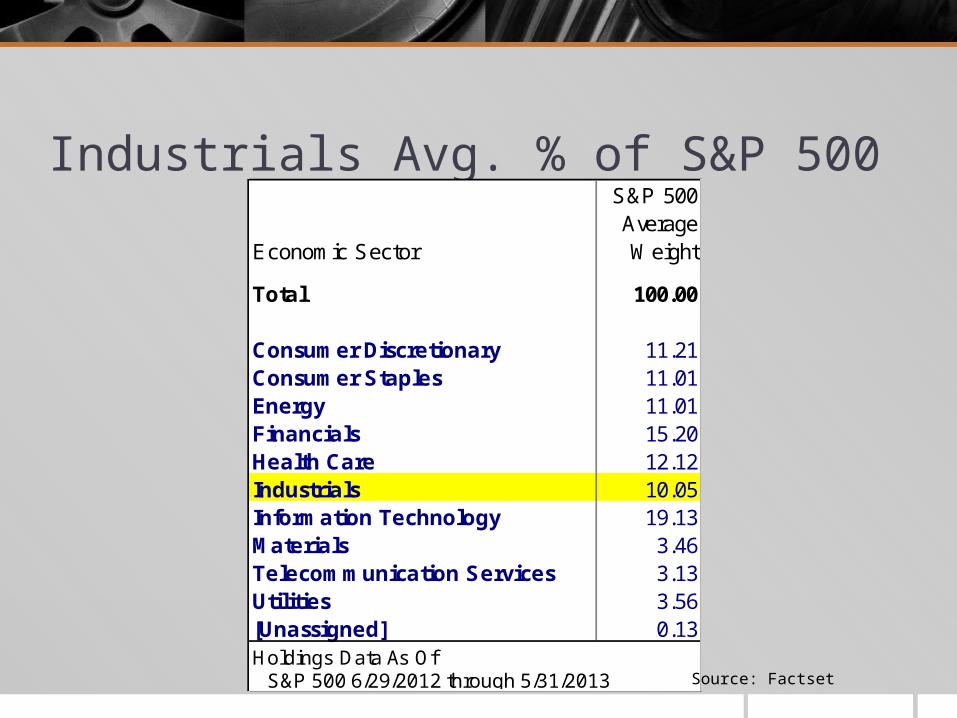
Industrials Avg. % of S&P 500S&P 500Average
Economic Sector Weight
Total 100.00
Consumer Discretionary 11.21Consumer Staples 11.01Energy 11.01Financials 15.20Health Care 12.12Industrials 10.05Information Technology 19.13Materials 3.46Telecommunication Services 3.13Utilities 3.56[Unassigned] 0.13Holdings Data As Of S&P 500 6/29/2012 through 5/31/2013 Source: Factset
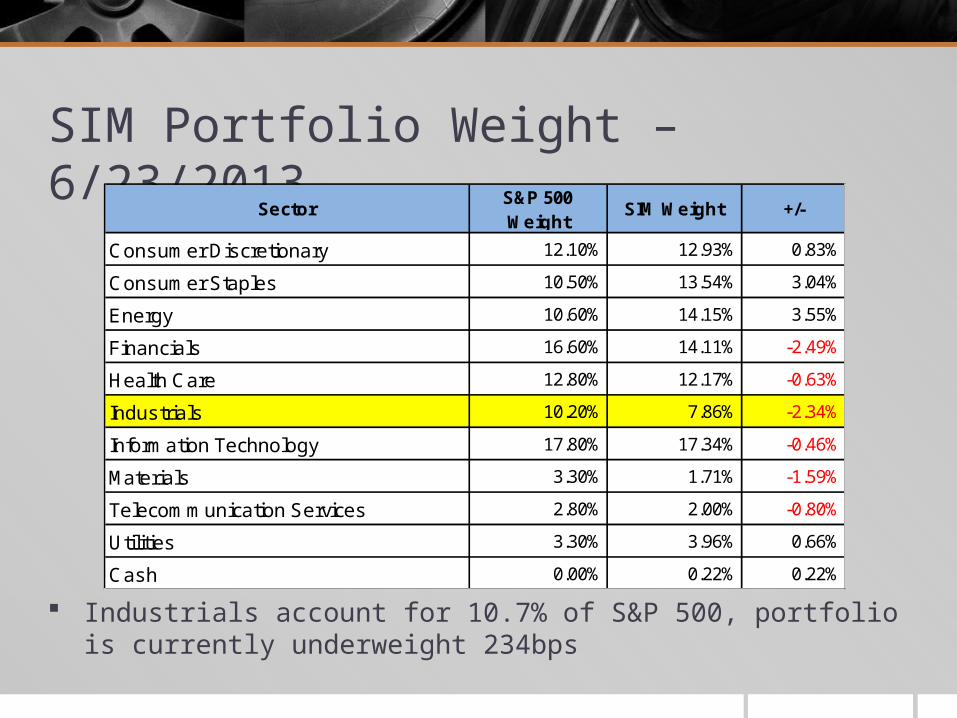
SIM Portfolio Weight – 6/23/2013
Industrials account for 10.7% of S&P 500, portfolio is currently underweight 234bps
SectorS&P 500 Weight
SIM Weight +/-
Consumer Discretionary 12.10% 12.93% 0.83%
Consumer Staples 10.50% 13.54% 3.04%
Energy 10.60% 14.15% 3.55%
Financials 16.60% 14.11% -2.49%
Health Care 12.80% 12.17% -0.63%
Industrials 10.20% 7.86% -2.34%
Information Technology 17.80% 17.34% -0.46%
Materials 3.30% 1.71% -1.59%
Telecommunication Services 2.80% 2.00% -0.80%
Utilities 3.30% 3.96% 0.66%
Cash 0.00% 0.22% 0.22%
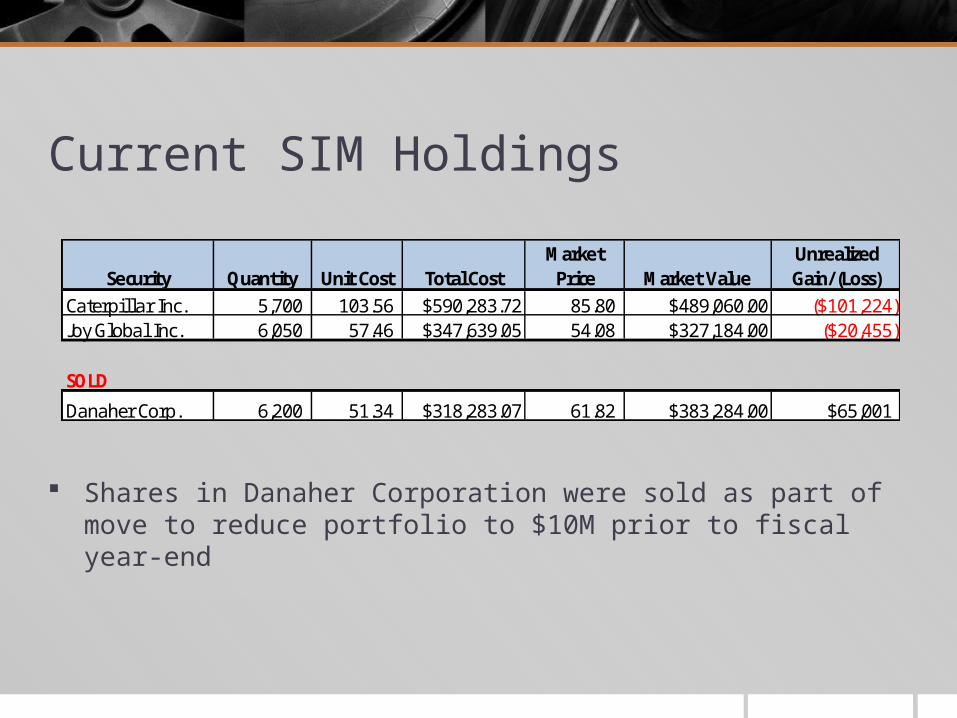
Current SIM Holdings
Shares in Danaher Corporation were sold as part of move to reduce portfolio to $10M prior to fiscal year-end
Security Quantity Unit Cost Total CostMarket
Price Market Value Unrealized Gain/(Loss)
Caterpil lar Inc. 5,700 103.56 $590,283.72 85.80 $489,060.00 ($101,224)Joy Global Inc. 6,050 57.46 $347,639.05 54.08 $327,184.00 ($20,455)
SOLD
Danaher Corp. 6,200 51.34 $318,283.07 61.82 $383,284.00 $65,001
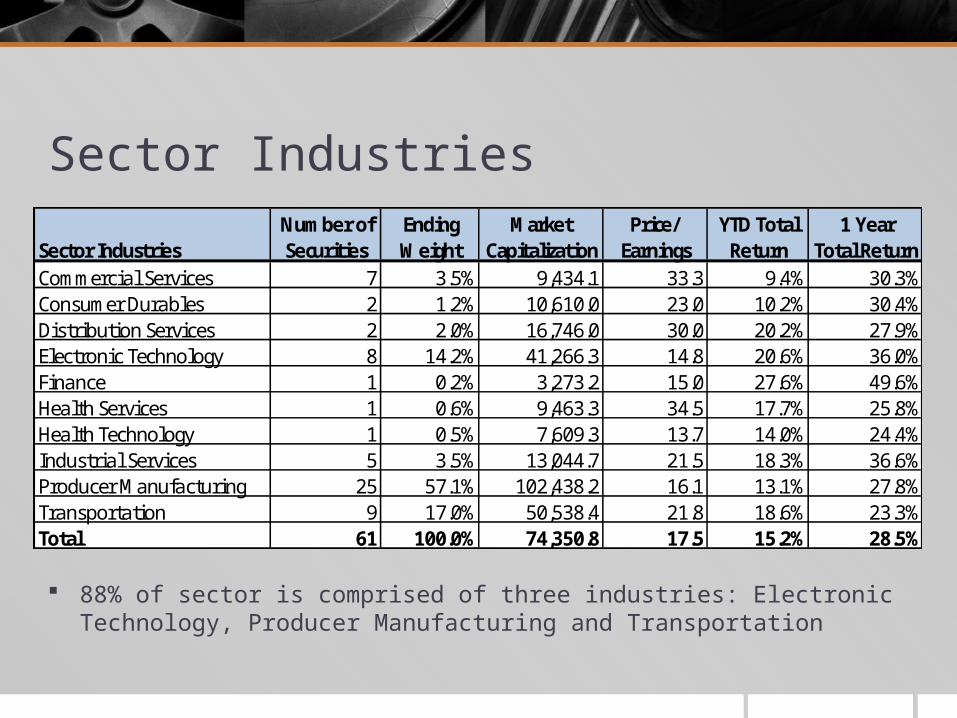
Sector Industries
88% of sector is comprised of three industries: Electronic Technology, Producer Manufacturing and Transportation
Number of Ending Market Price/ YTD Total 1 YearSector Industries Securities Weight Capitalization Earnings Return Total ReturnCommercial Services 7 3.5% 9,434.1 33.3 9.4% 30.3%Consumer Durables 2 1.2% 10,610.0 23.0 10.2% 30.4%Distribution Services 2 2.0% 16,746.0 30.0 20.2% 27.9%Electronic Technology 8 14.2% 41,266.3 14.8 20.6% 36.0%Finance 1 0.2% 3,273.2 15.0 27.6% 49.6%Health Services 1 0.6% 9,463.3 34.5 17.7% 25.8%Health Technology 1 0.5% 7,609.3 13.7 14.0% 24.4%Industrial Services 5 3.5% 13,044.7 21.5 18.3% 36.6%Producer Manufacturing 25 57.1% 102,438.2 16.1 13.1% 27.8%Transportation 9 17.0% 50,538.4 21.8 18.6% 23.3%Total 61 100.0% 74,350.8 17.5 15.2% 28.5%
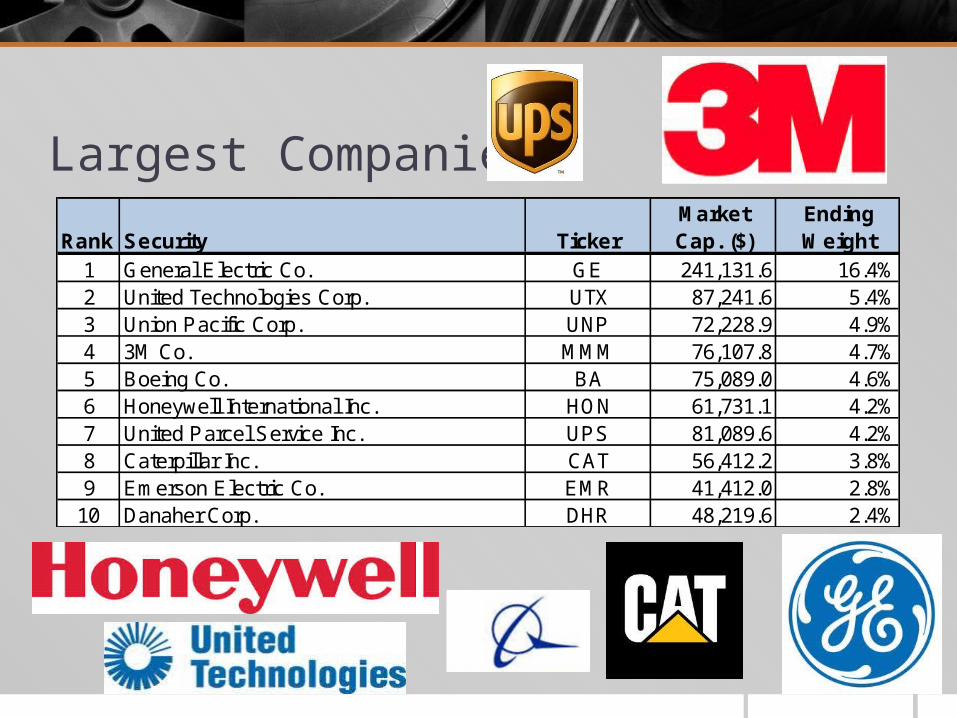
Largest CompaniesMarket Ending
Rank Security Ticker Cap. ($) Weight1 General Electric Co. GE 241,131.6 16.4%2 United Technologies Corp. UTX 87,241.6 5.4%3 Union Pacific Corp. UNP 72,228.9 4.9%4 3M Co. MMM 76,107.8 4.7%5 Boeing Co. BA 75,089.0 4.6%6 Honeywell International Inc. HON 61,731.1 4.2%7 United Parcel Service Inc. UPS 81,089.6 4.2%8 Caterpillar Inc. CAT 56,412.2 3.8%9 Emerson Electric Co. EMR 41,412.0 2.8%
10 Danaher Corp. DHR 48,219.6 2.4%
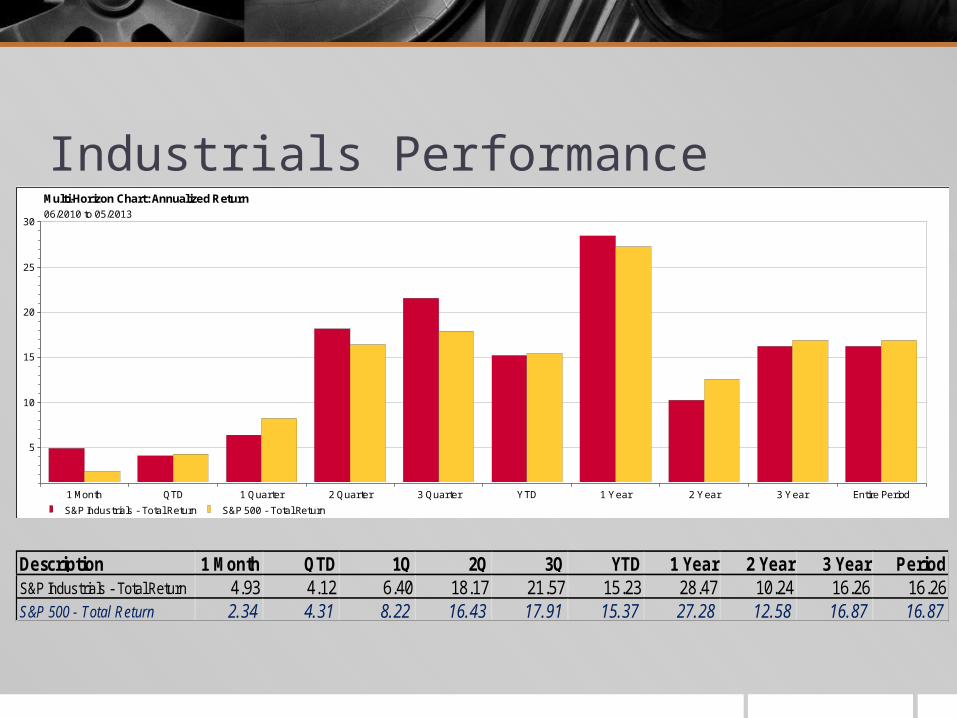
Industrials Performance
1 Month QTD 1 Quarter 2 Quarter 3 Quarter YTD 1 Year 2 Year 3 Year Entire Period
5
10
15
20
25
30
Multi-Horizon Chart: Annualized Return06/2010 to 05/2013
S&P Industrials - Total Return S&P 500 - Total Return
Description 1 Month QTD 1Q 2Q 3Q YTD 1 Year 2 Year 3 Year PeriodS&P Industrials - Total Return 4.93 4.12 6.40 18.17 21.57 15.23 28.47 10.24 16.26 16.26S&P 500 - Total Return 2.34 4.31 8.22 16.43 17.91 15.37 27.28 12.58 16.87 16.87

Business Analysis
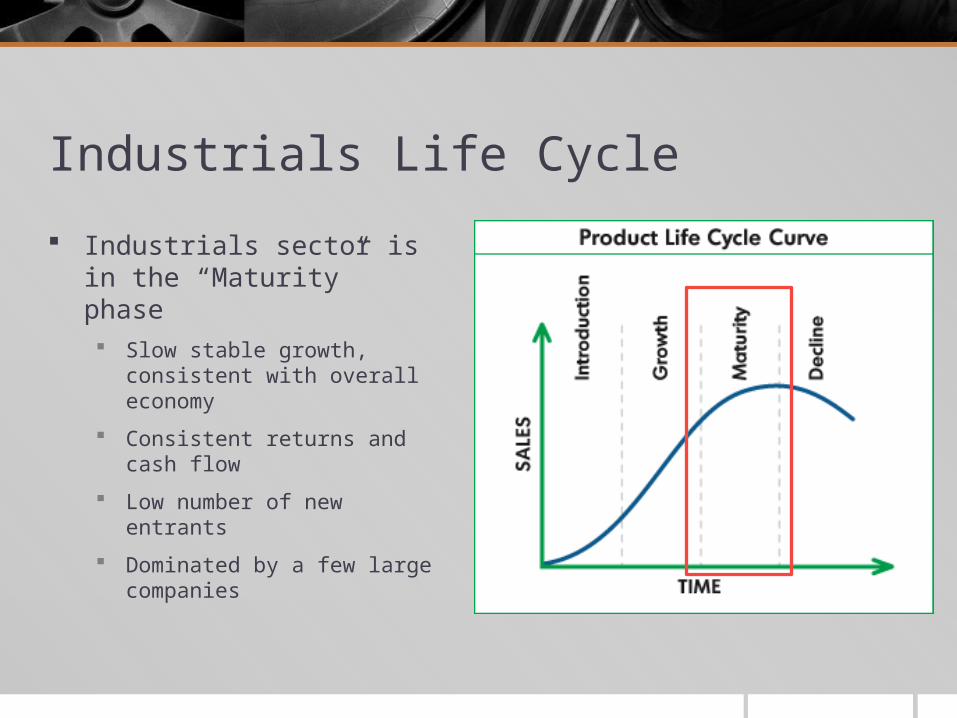
Industrials Life Cycle
Industrials sector is in the “Maturity” phase Slow stable growth, consistent with
overall economy
Consistent returns and cash flow
Low number of new entrants
Dominated by a few large companies
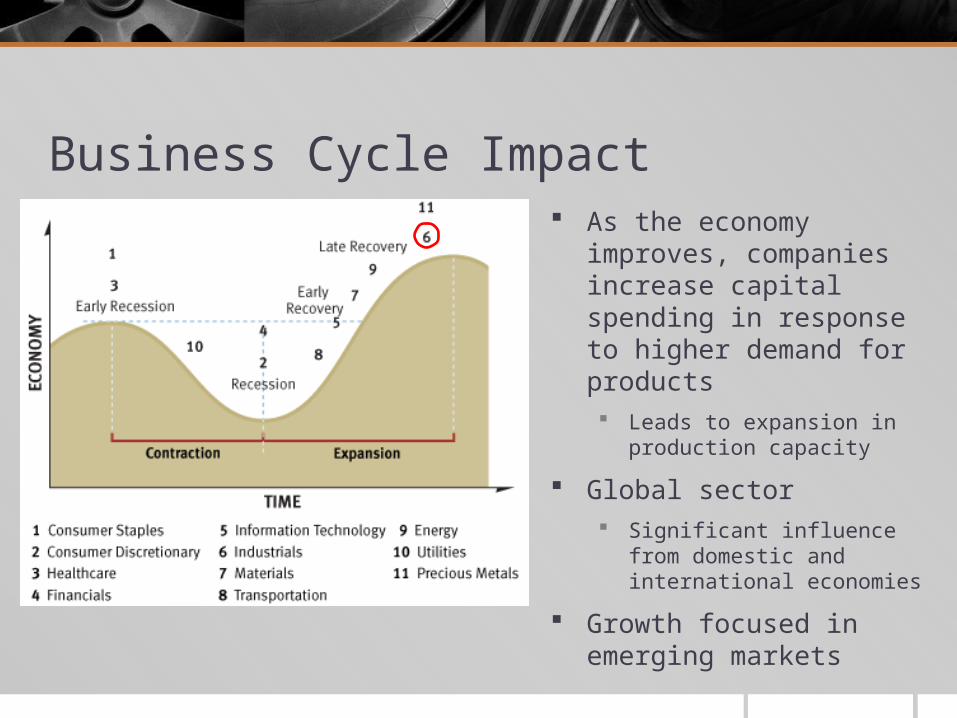
Business Cycle Impact As the economy improves,
companies increase capital spending in response to higher demand for products Leads to expansion in production
capacity
Global sector Significant influence from domestic
and international economies
Growth focused in emerging markets

Catalysts & Risks Catalysts
Europe coming out of their recession
Turnaround in China
Growth in emerging markets
Risks Lower government spending
Strengthening US Dollar
Uncertainty regarding monetary policy
Slow global growth forecast
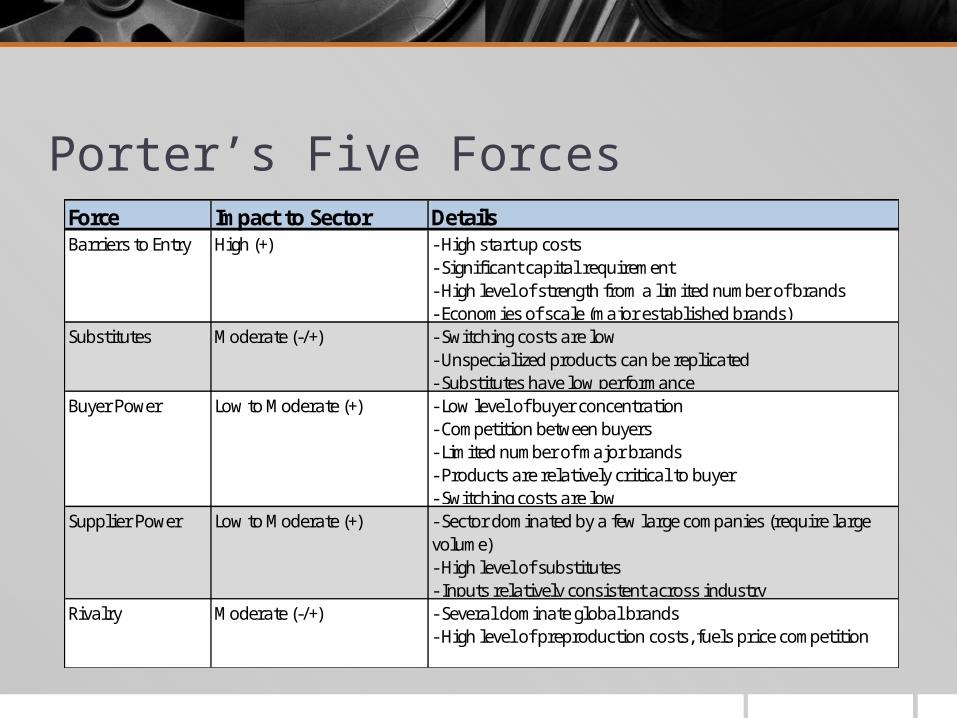
Porter’s Five ForcesForce Impact to Sector DetailsBarriers to Entry High (+) - High start up costs
- Significant capital requirement- High level of strength from a l imited number of brands- Economies of scale (major established brands)
Substitutes Moderate (-/+) - Switching costs are low- Unspecialized products can be replicated- Substitutes have low performance
Buyer Power Low to Moderate (+) - Low level of buyer concentration- Competition between buyers- Limited number of major brands- Products are relatively critical to buyer- Switching costs are low
Supplier Power Low to Moderate (+) - Sector dominated by a few large companies (require large volume)- High level of substitutes- Inputs relatively consistent across industry
Rivalry Moderate (-/+) - Several dominate global brands- High level of preproduction costs, fuels price competition

Economic Analysis

Industrials Drivers High Correlation to overall equity market
Production & Manufacturing
GDP
Unemployment
Crude Oil
Housing
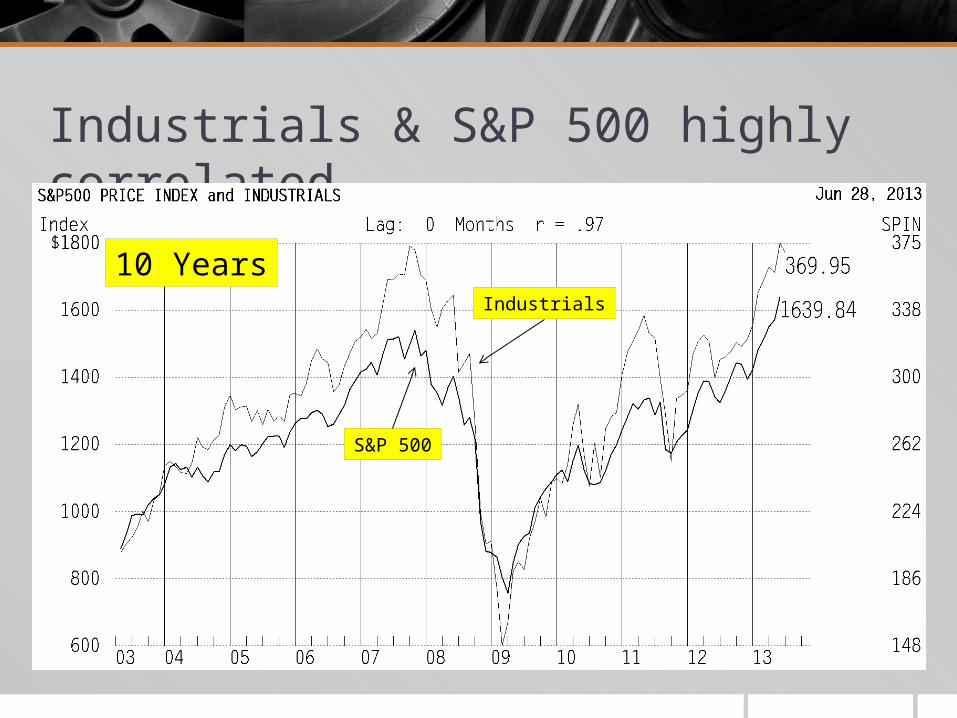
Industrials & S&P 500 highly correlated
10 YearsIndustrials
S&P 500
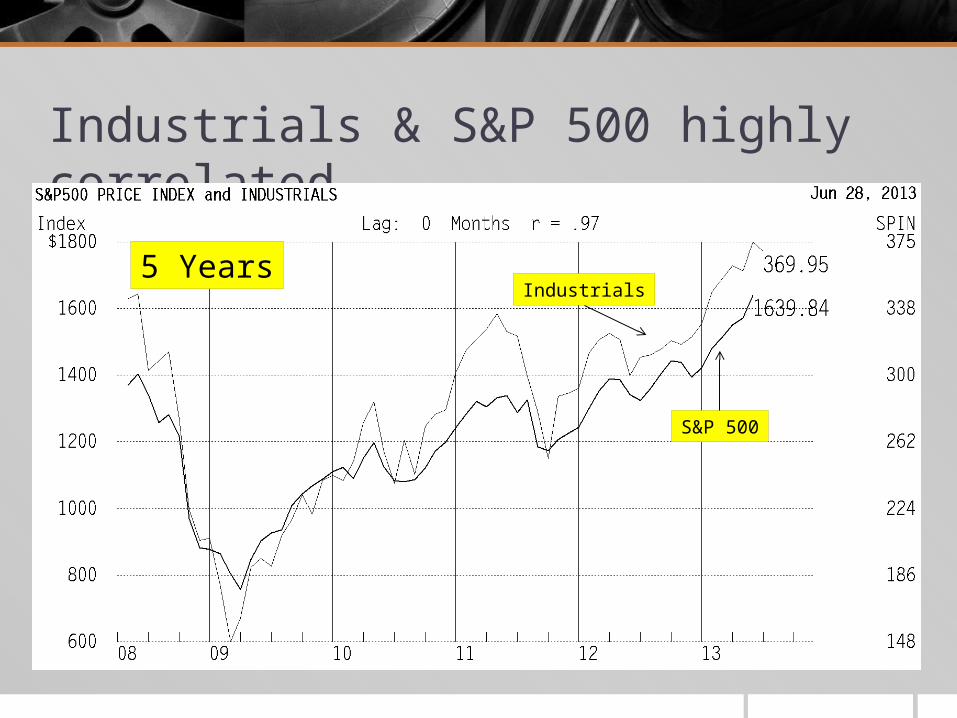
Industrials & S&P 500 highly correlated
5 YearsIndustrials
S&P 500
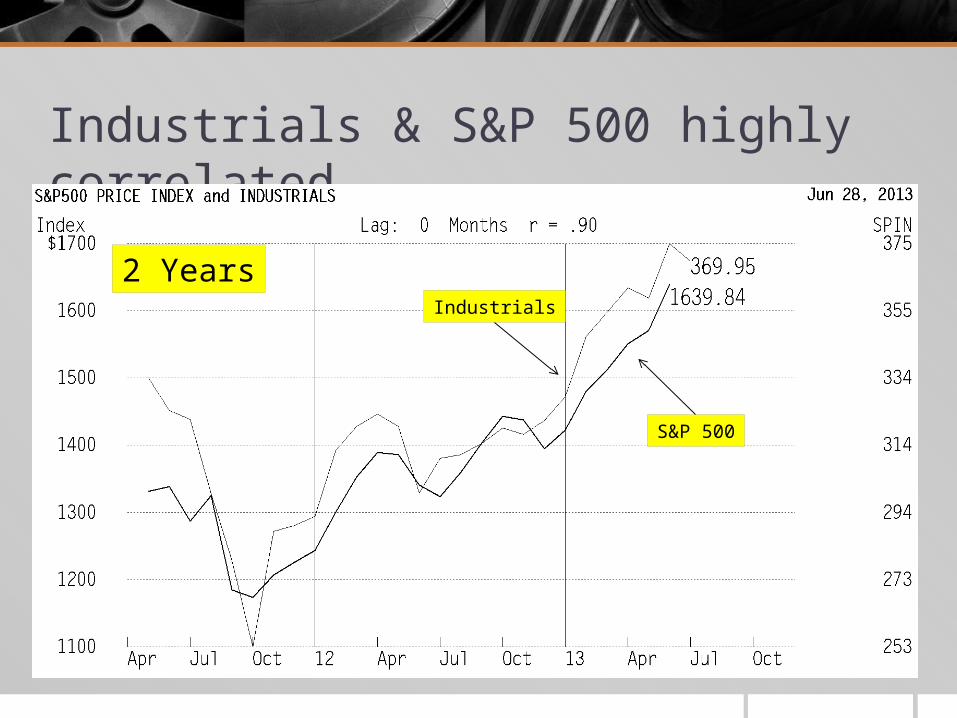
Industrials & S&P 500 highly correlated
2 YearsIndustrials
S&P 500
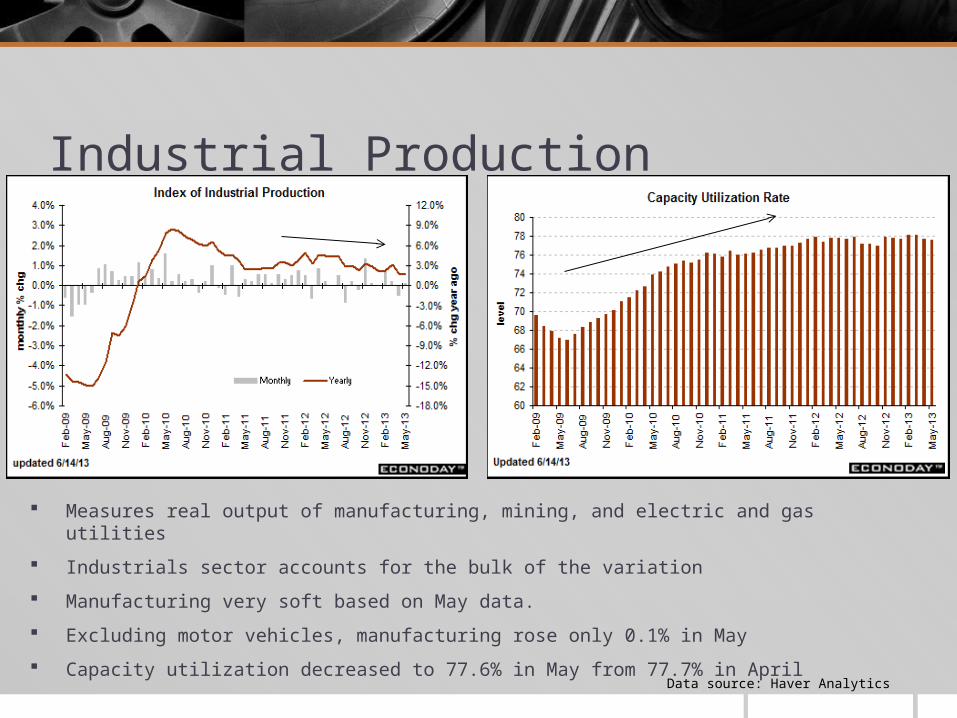
Industrial Production
Measures real output of manufacturing, mining, and electric and gas utilities
Industrials sector accounts for the bulk of the variation
Manufacturing very soft based on May data.
Excluding motor vehicles, manufacturing rose only 0.1% in May
Capacity utilization decreased to 77.6% in May from 77.7% in April
Data source: Haver Analytics
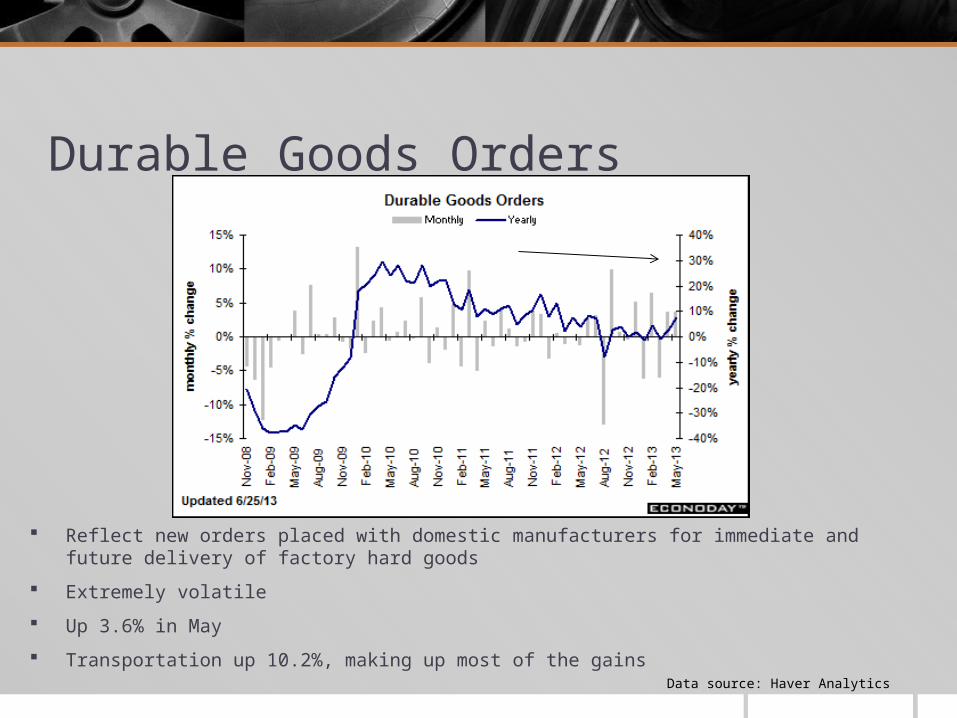
Durable Goods Orders
Data source: Haver Analytics
Reflect new orders placed with domestic manufacturers for immediate and future delivery of factory hard goods
Extremely volatile
Up 3.6% in May
Transportation up 10.2%, making up most of the gains
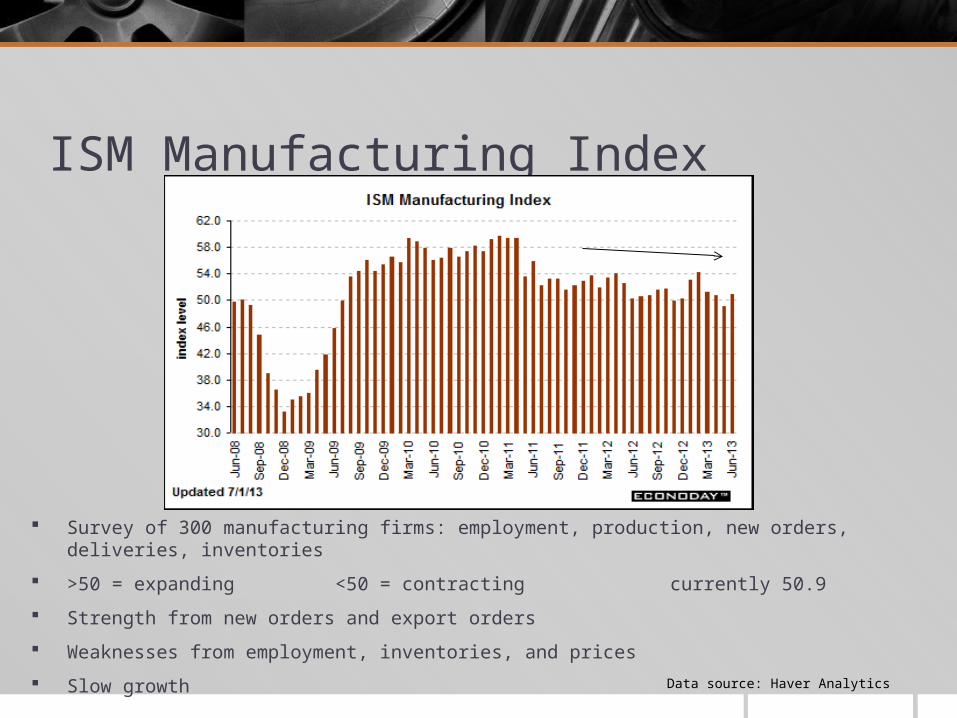
ISM Manufacturing Index
Data source: Haver Analytics
Survey of 300 manufacturing firms: employment, production, new orders, deliveries, inventories
>50 = expanding <50 = contracting currently 50.9
Strength from new orders and export orders
Weaknesses from employment, inventories, and prices
Slow growth
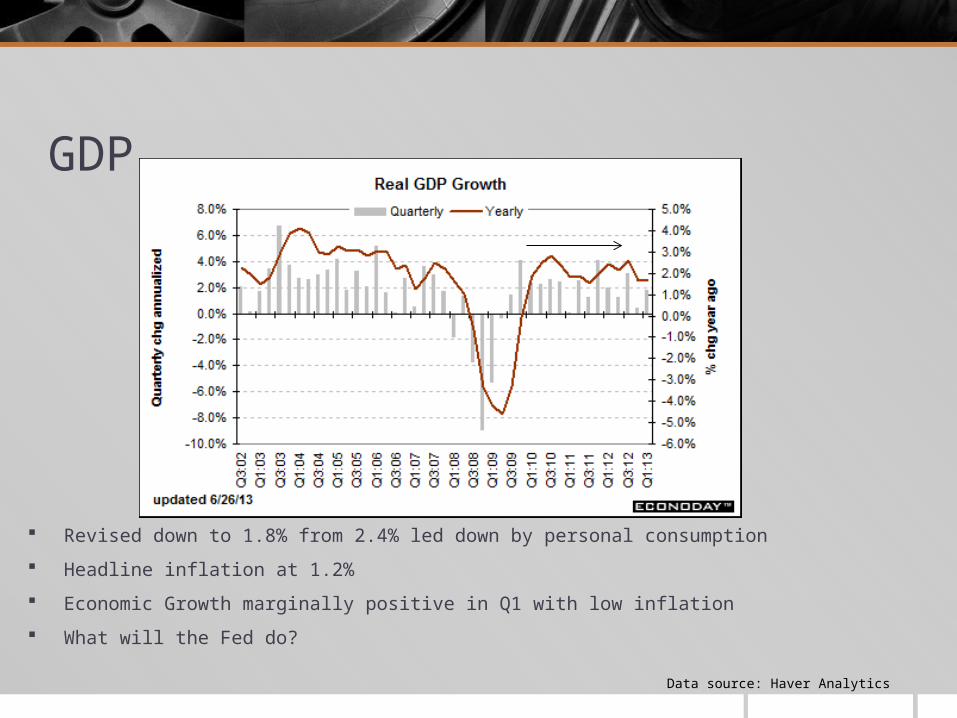
GDP
Data source: Haver Analytics
Revised down to 1.8% from 2.4% led down by personal consumption
Headline inflation at 1.2%
Economic Growth marginally positive in Q1 with low inflation
What will the Fed do?
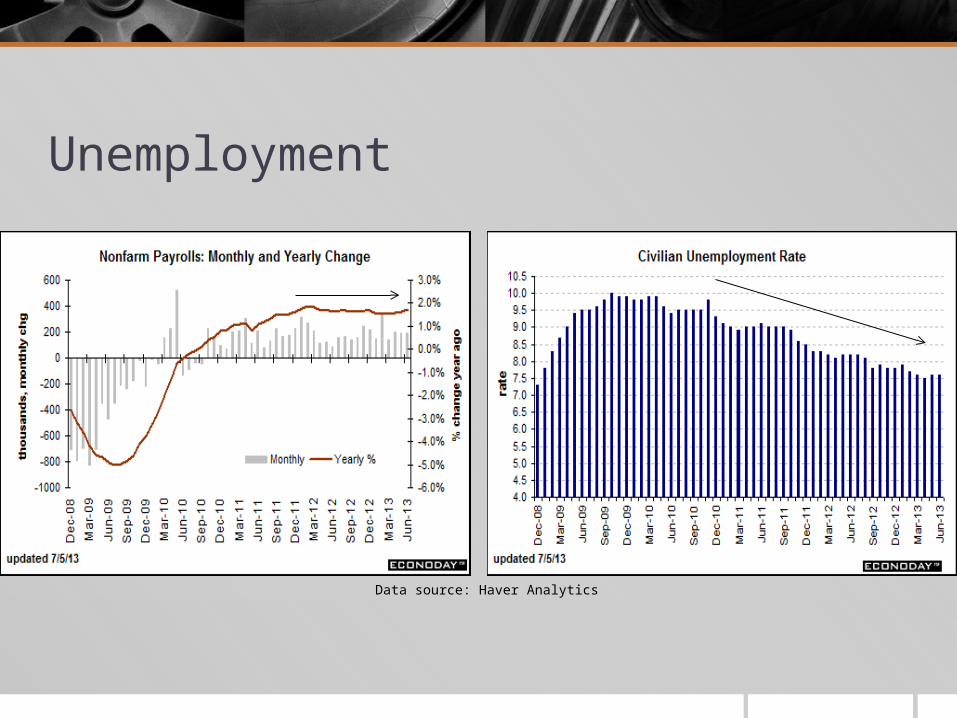
Unemployment
Data source: Haver Analytics
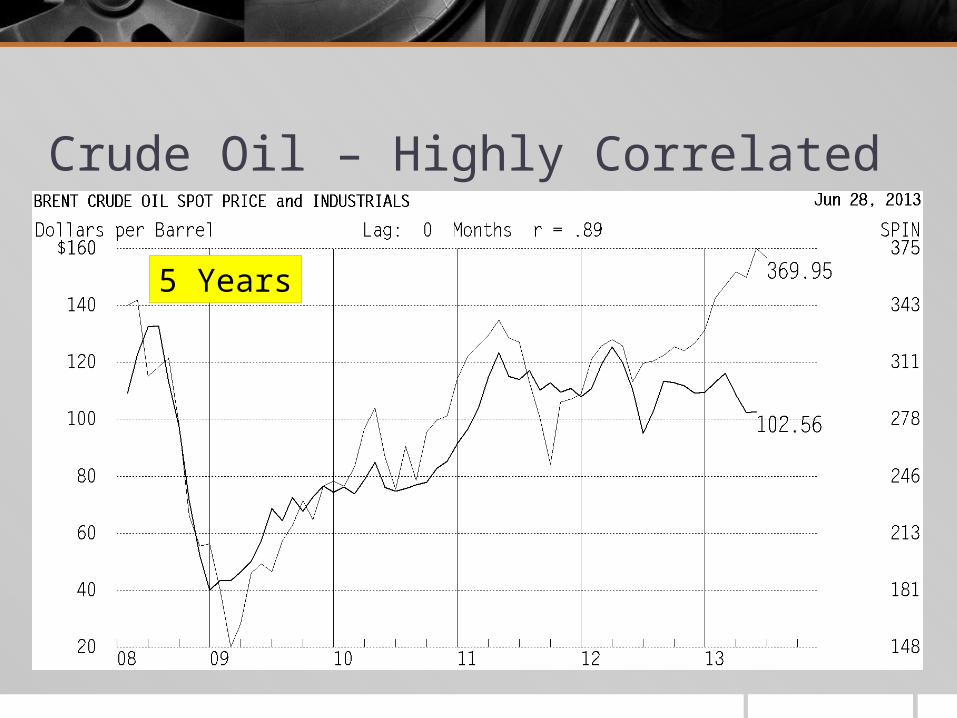
Crude Oil – Highly Correlated
5 Years
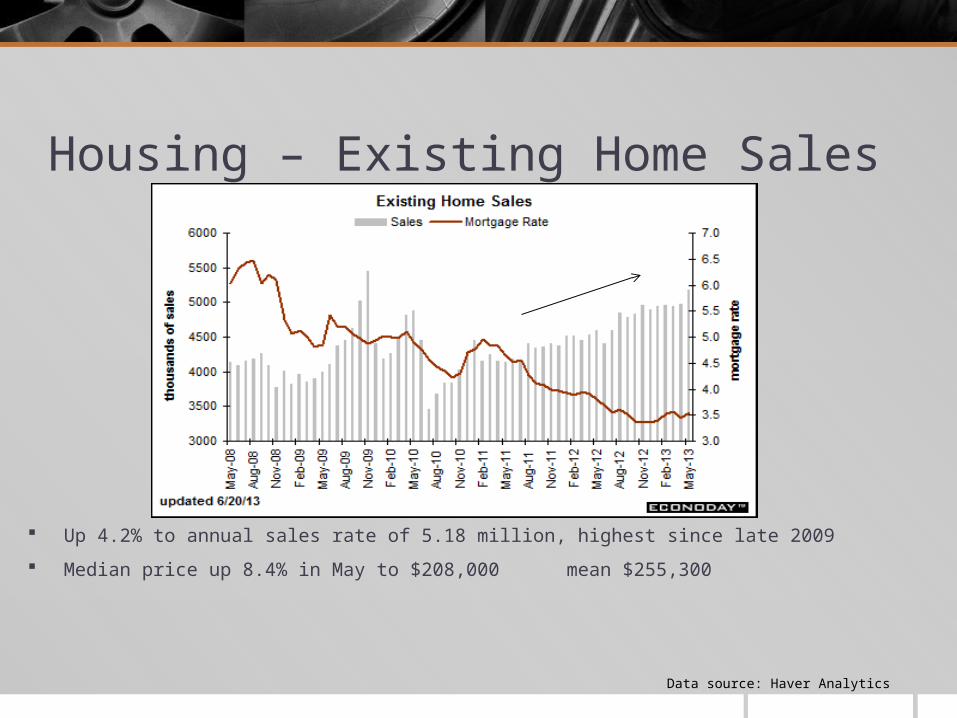
Housing – Existing Home Sales
Data source: Haver Analytics
Up 4.2% to annual sales rate of 5.18 million, highest since late 2009
Median price up 8.4% in May to $208,000 mean $255,300
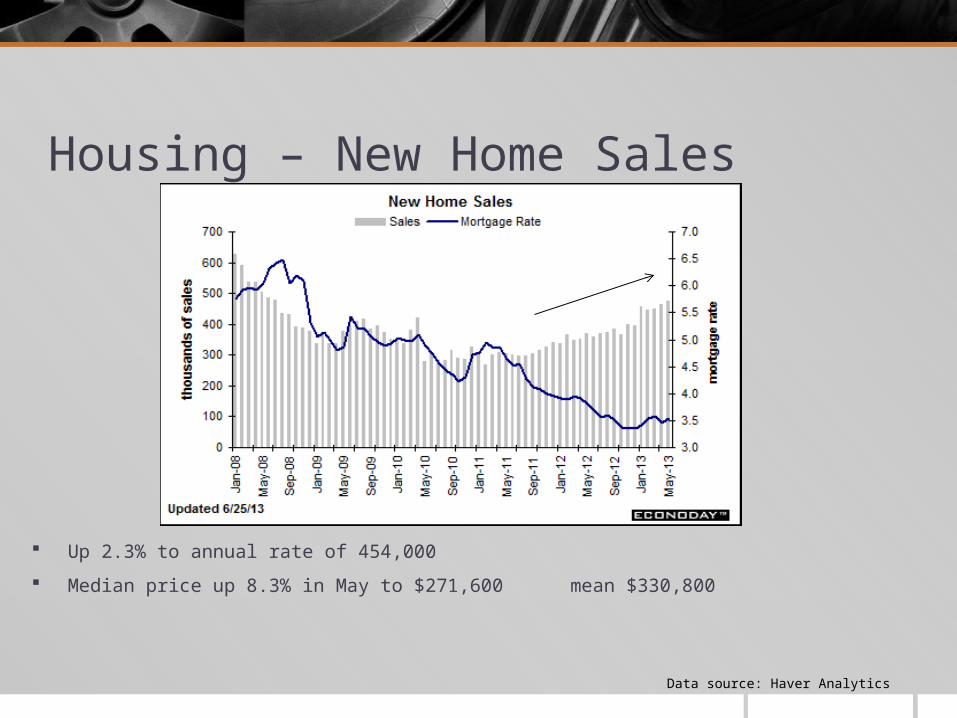
Housing – New Home Sales
Data source: Haver Analytics
Up 2.3% to annual rate of 454,000
Median price up 8.3% in May to $271,600 mean $330,800
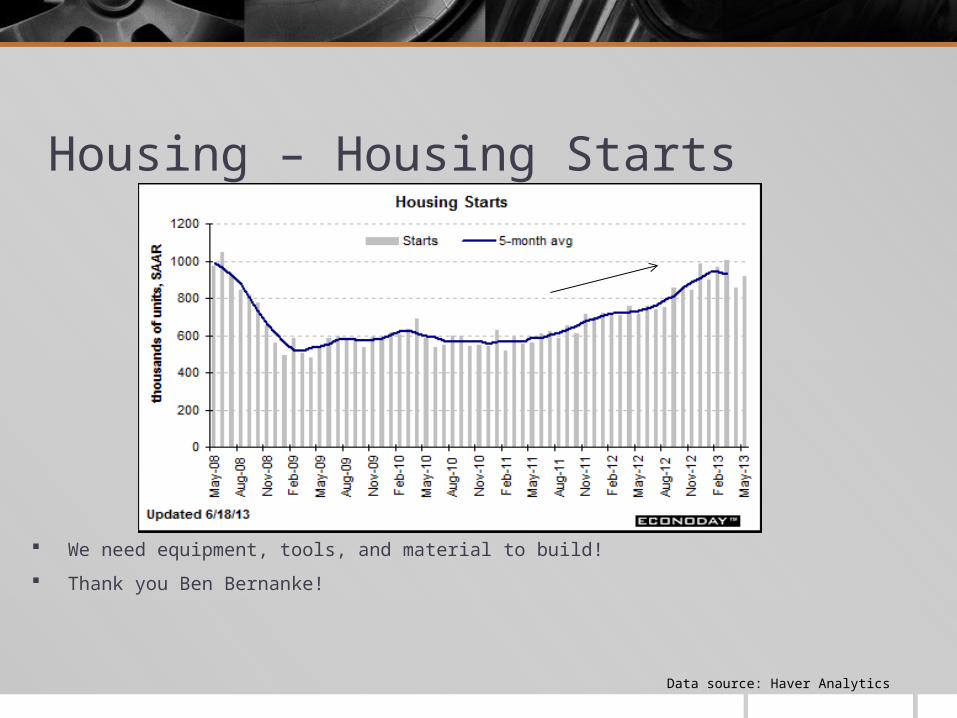
Housing – Housing Starts
Data source: Haver Analytics
We need equipment, tools, and material to build!
Thank you Ben Bernanke!

Financial Analysis
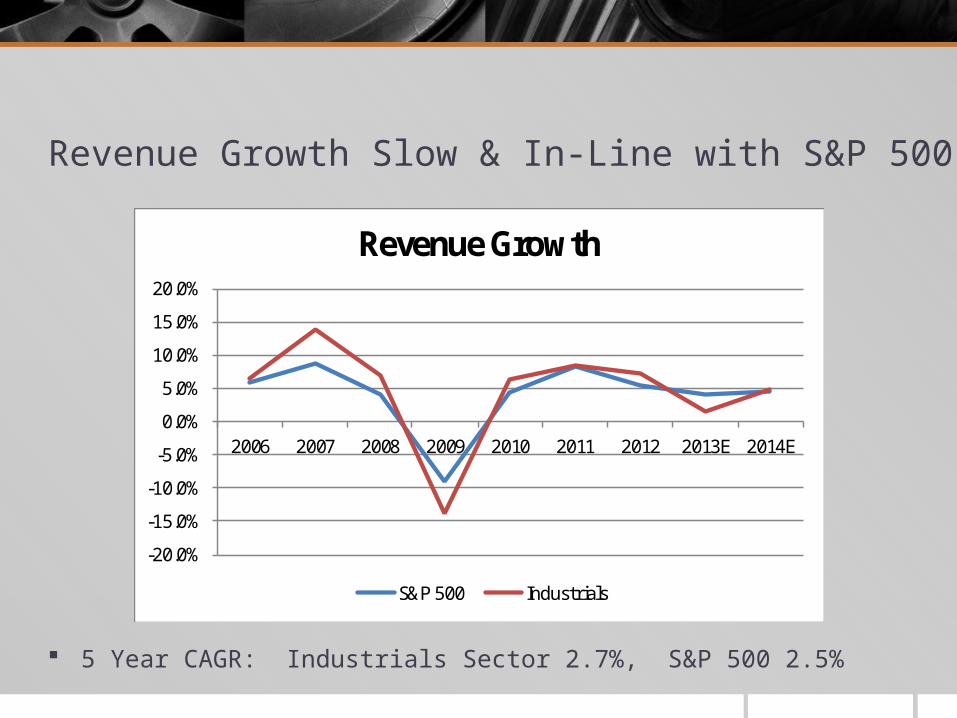
Revenue Growth Slow & In-Line with S&P 500
5 Year CAGR: Industrials Sector 2.7%, S&P 500 2.5%
-20.0%
-15.0%
-10.0%
-5.0%
0.0%
5.0%
10.0%
15.0%
20.0%
2006 2007 2008 2009 2010 2011 2012 2013E 2014E
Revenue Growth
S&P 500 Industrials
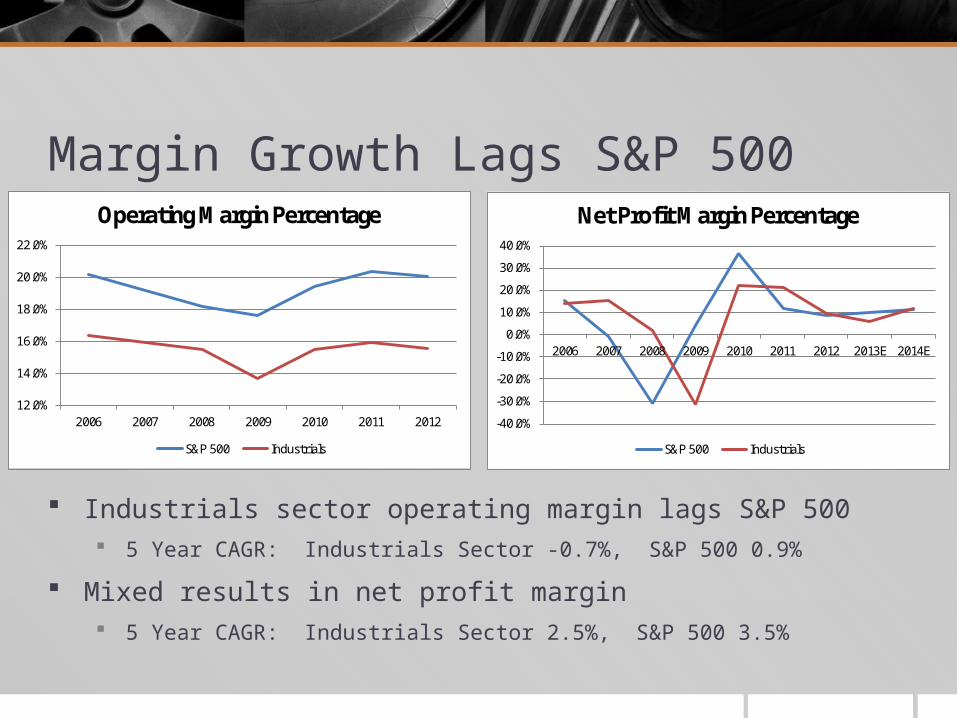
Margin Growth Lags S&P 500
Industrials sector operating margin lags S&P 500 5 Year CAGR: Industrials Sector -0.7%, S&P 500 0.9%
Mixed results in net profit margin 5 Year CAGR: Industrials Sector 2.5%, S&P 500 3.5%
12.0%
14.0%
16.0%
18.0%
20.0%
22.0%
2006 2007 2008 2009 2010 2011 2012
Operating Margin Percentage
S&P 500 Industrials
-40.0%
-30.0%
-20.0%
-10.0%
0.0%
10.0%
20.0%
30.0%
40.0%
2006 2007 2008 2009 2010 2011 2012 2013E 2014E
Net Profit Margin Percentage
S&P 500 Industrials
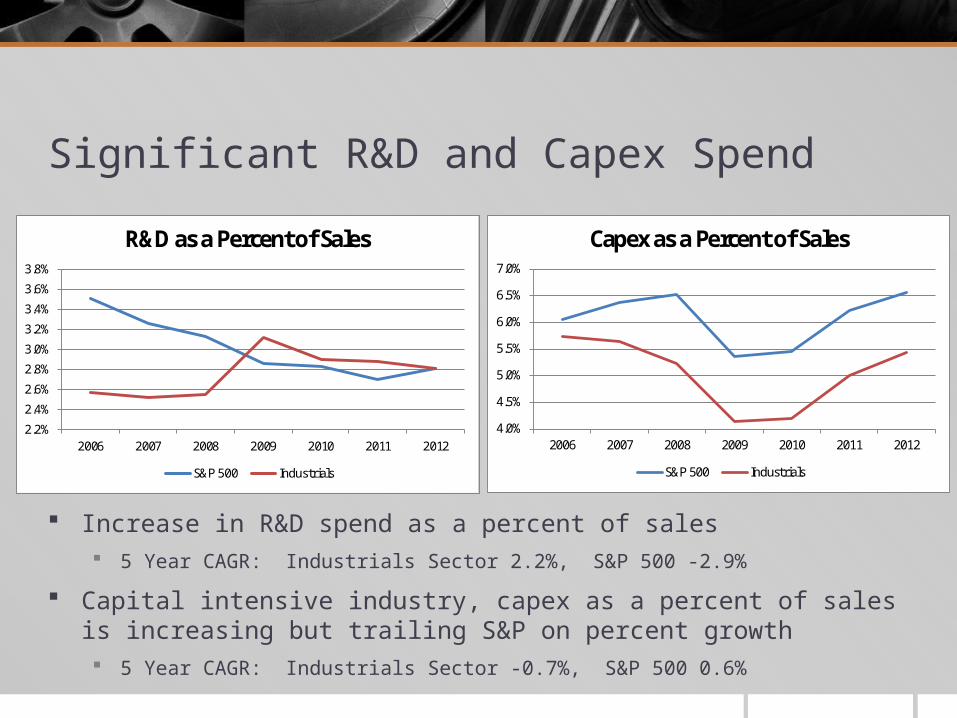
Significant R&D and Capex Spend
Increase in R&D spend as a percent of sales 5 Year CAGR: Industrials Sector 2.2%, S&P 500 -2.9%
Capital intensive industry, capex as a percent of sales is increasing but trailing S&P on percent growth 5 Year CAGR: Industrials Sector -0.7%, S&P 500 0.6%
2.2%
2.4%
2.6%
2.8%
3.0%
3.2%
3.4%
3.6%
3.8%
2006 2007 2008 2009 2010 2011 2012
R&D as a Percent of Sales
S&P 500 Industrials
4.0%
4.5%
5.0%
5.5%
6.0%
6.5%
7.0%
2006 2007 2008 2009 2010 2011 2012
Capex as a Percent of Sales
S&P 500 Industrials
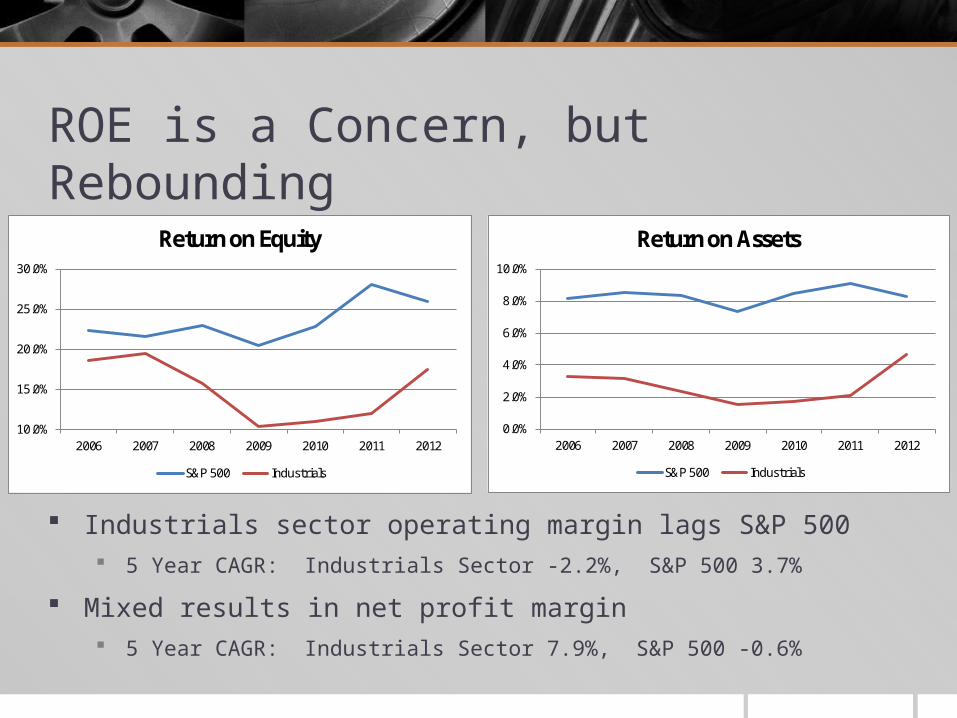
ROE is a Concern, but Rebounding
Industrials sector operating margin lags S&P 500 5 Year CAGR: Industrials Sector -2.2%, S&P 500 3.7%
Mixed results in net profit margin 5 Year CAGR: Industrials Sector 7.9%, S&P 500 -0.6%
10.0%
15.0%
20.0%
25.0%
30.0%
2006 2007 2008 2009 2010 2011 2012
Return on Equity
S&P 500 Industrials
0.0%
2.0%
4.0%
6.0%
8.0%
10.0%
2006 2007 2008 2009 2010 2011 2012
Return on Assets
S&P 500 Industrials
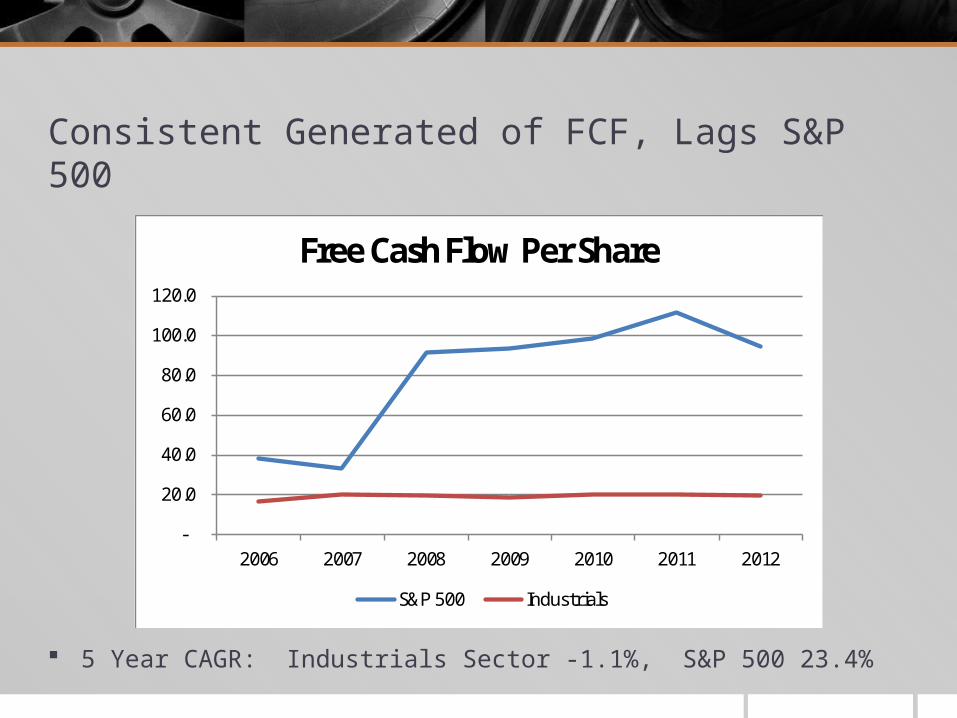
Consistent Generated of FCF, Lags S&P 500
5 Year CAGR: Industrials Sector -1.1%, S&P 500 23.4%
-
20.0
40.0
60.0
80.0
100.0
120.0
2006 2007 2008 2009 2010 2011 2012
Free Cash Flow Per Share
S&P 500 Industrials

Valuation Analysis
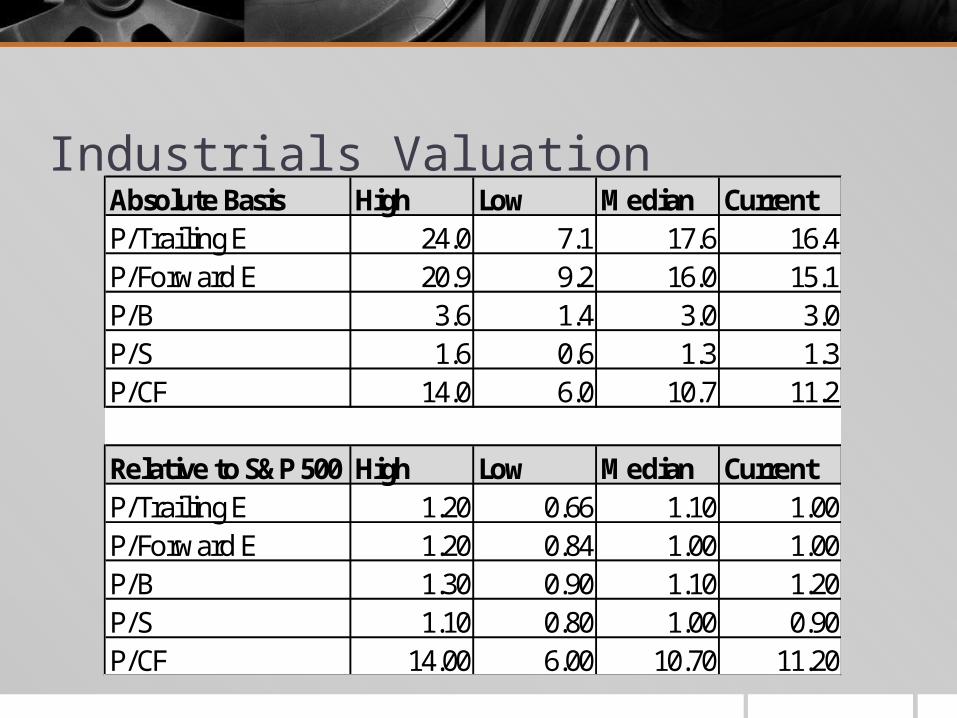
Industrials ValuationAbsolute Basis High Low Median CurrentP/Trailing E 24.0 7.1 17.6 16.4P/Forward E 20.9 9.2 16.0 15.1P/B 3.6 1.4 3.0 3.0P/S 1.6 0.6 1.3 1.3P/CF 14.0 6.0 10.7 11.2
Relative to S&P 500 High Low Median CurrentP/Trailing E 1.20 0.66 1.10 1.00P/Forward E 1.20 0.84 1.00 1.00P/B 1.30 0.90 1.10 1.20P/S 1.10 0.80 1.00 0.90P/CF 14.00 6.00 10.70 11.20
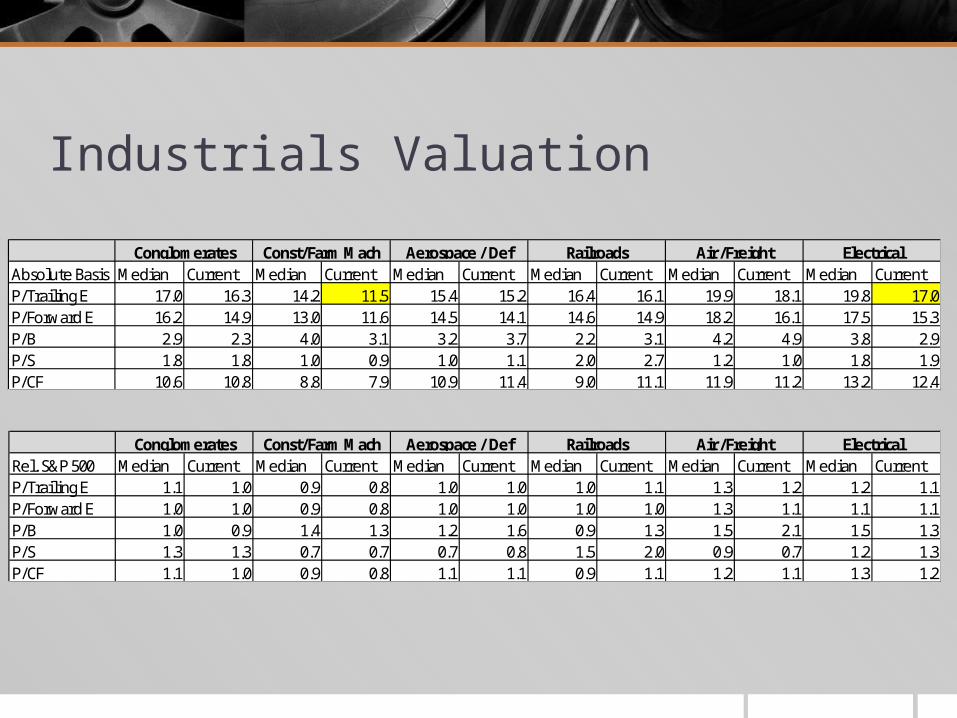
Industrials Valuation
Absolute Basis Median Current Median Current Median Current Median Current Median Current Median CurrentP/Trailing E 17.0 16.3 14.2 11.5 15.4 15.2 16.4 16.1 19.9 18.1 19.8 17.0P/Forward E 16.2 14.9 13.0 11.6 14.5 14.1 14.6 14.9 18.2 16.1 17.5 15.3P/B 2.9 2.3 4.0 3.1 3.2 3.7 2.2 3.1 4.2 4.9 3.8 2.9P/S 1.8 1.8 1.0 0.9 1.0 1.1 2.0 2.7 1.2 1.0 1.8 1.9P/CF 10.6 10.8 8.8 7.9 10.9 11.4 9.0 11.1 11.9 11.2 13.2 12.4
Railroads Air /Freight ElectricalAerospace / DefConst/Farm MachConglomerates
Rel. S&P 500 Median Current Median Current Median Current Median Current Median Current Median CurrentP/Trailing E 1.1 1.0 0.9 0.8 1.0 1.0 1.0 1.1 1.3 1.2 1.2 1.1P/Forward E 1.0 1.0 0.9 0.8 1.0 1.0 1.0 1.0 1.3 1.1 1.1 1.1P/B 1.0 0.9 1.4 1.3 1.2 1.6 0.9 1.3 1.5 2.1 1.5 1.3P/S 1.3 1.3 0.7 0.7 0.7 0.8 1.5 2.0 0.9 0.7 1.2 1.3P/CF 1.1 1.0 0.9 0.8 1.1 1.1 0.9 1.1 1.2 1.1 1.3 1.2
Railroads Air /Freight ElectricalAerospace / DefConst/Farm MachConglomerates

Recommendation
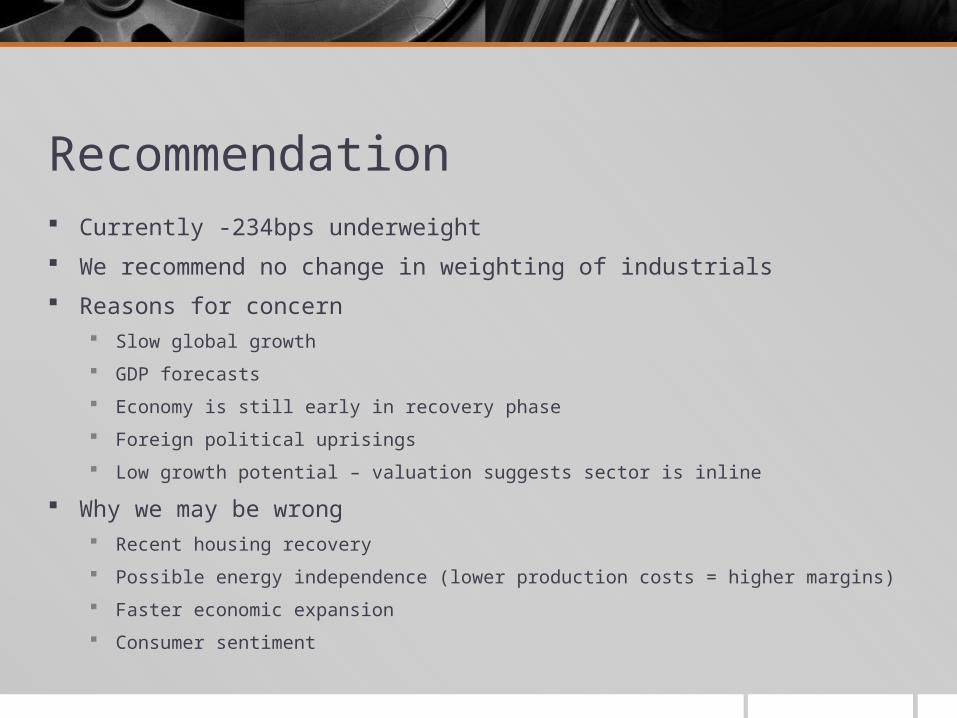
Recommendation Currently -234bps underweight
We recommend no change in weighting of industrials
Reasons for concern Slow global growth
GDP forecasts
Economy is still early in recovery phase
Foreign political uprisings
Low growth potential – valuation suggests sector is inline
Why we may be wrong Recent housing recovery
Possible energy independence (lower production costs = higher margins)
Faster economic expansion
Consumer sentiment

Questions?