Embed Size (px)
Citation preview
Industry and Occupation Health Indicators
Maryland Behavioral Risk Factor Surveillance System, 2013-2014
Acknowledgements
2
For more information on occupational
health in Maryland:
Maryland Occupational Health and
Safety website
Environmental Health Helpline:1-866-703-3266
Environmental Health email:
This publication was supported by the National
Institute for Occupational Safety and Health and the
Behavioral Risk Factor Surveillance System
(cooperative agreement numbers 1U60OH011154 and
NU58DP006039) from the Centers for Disease Control
and Prevention (CDC). Its contents are solely the
responsibility of the authors and do not necessarily
represent the official views of the CDC.
Maryland Department of Health and Mental Hygiene
Elisabeth Dissen, MSPH
Epidemiologist, Environmental Health Bureau
Georgette Lavetsky, MHS
BRFSS Coordinator, Center for Chronic Disease
Prevention and Control
Ann Liu, PhD
Chief Epidemiologist, Environmental Health Bureau
Clifford S. Mitchell, MS, MD, MPH
Director, Environmental Health Bureau
May 2017
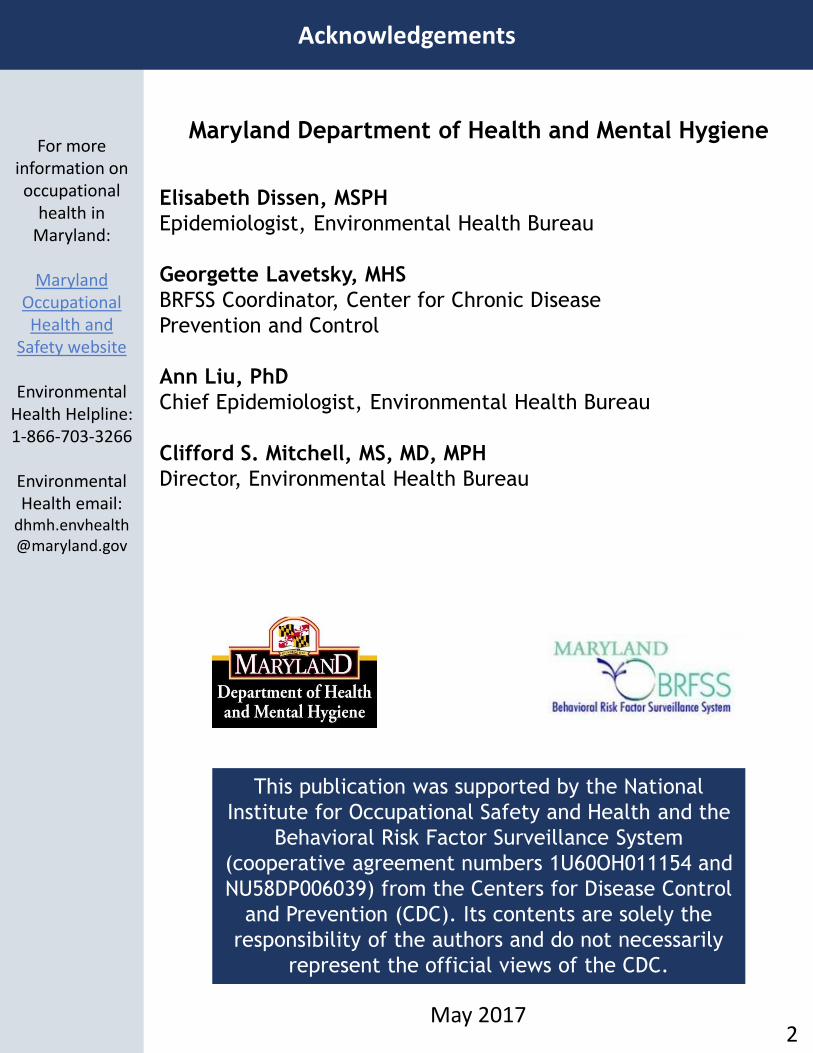
Table of Contents
3
Page
Methodology 4
Demographics of Maryland workers 8
Health Outcome Indicators 9
Maryland workers ever diagnosed with hypertension 10
Maryland workers ever diagnosed with asthma 11
Maryland workers who currently have asthma 12
Maryland workers ever diagnosed with skin cancer 13
Maryland workers ever diagnosed with arthritis, rheumatoid arthritis,
gout, lupus, or fibromyalgia
14
Maryland workers ever diagnosed with a depressive disorder 15
Maryland workers ever diagnosed with an anxiety disorder 16
Maryland workers ever diagnosed with diabetes 17
Health Status Indicators 18
Overweight Maryland workers 19
Obese Maryland workers 20
Maryland workers with poor or fair health status 21
Maryland workers with poor mental health on ≥15 days out of past 30
days
22
Health Behavior Indicators 23
Maryland workers who currently smoke 24
Maryland workers who are former smokers 25
Maryland workers who binge drank In the past 30 days 26
Maryland workers not always wearing a seatbelt 27
Maryland workers with no leisure time physical activity 28
Maryland workers with inadequate sleep (<7 hours) 29
Healthcare Access Indicators 30
Maryland workers with health insurance 31
Maryland workers who needed to see a doctor, but could not because
of cost
32
Maryland workers who had a routine checkup within the past year 33
Maryland workers who had a dental visit within the past year 34
Resources 35
For more information on occupational
health in Maryland:
Maryland Occupational Health and
Safety website
Environmental Health Helpline:1-866-703-3266
Environmental Health email:
Methodology
4
The Behavior Risk Factor Surveillance System (BRFSS) is a national telephone survey that collects data on health-related risk behaviors, chronic health conditions, and the use of preventive services. BRFSS is conducted by the Centers for Disease Control and Prevention (CDC) in all 50 states, 3 U.S. territories and the District of Columbia. Survey respondents are non-institutionalized adults (18 years or older) living in the U.S.
The typical sample size in Maryland is 12,000 non-institutionalized Maryland residents per year. BRFSS landline telephone surveys have been conducted in Maryland since 1987 and a cell phone component was added in 2009. The questionnaire has three parts: the core component, optional modules, and state-added questions. The National Institute for Occupational Safety and Health (NIOSH) funded the addition of an industry and occupation optional BRFSS module starting in 2013. During the 2013 and 2014 survey years, Maryland BRFSS collected industry and occupation data, providing insight into health outcomes and health behaviors of approximately three million Maryland workers.
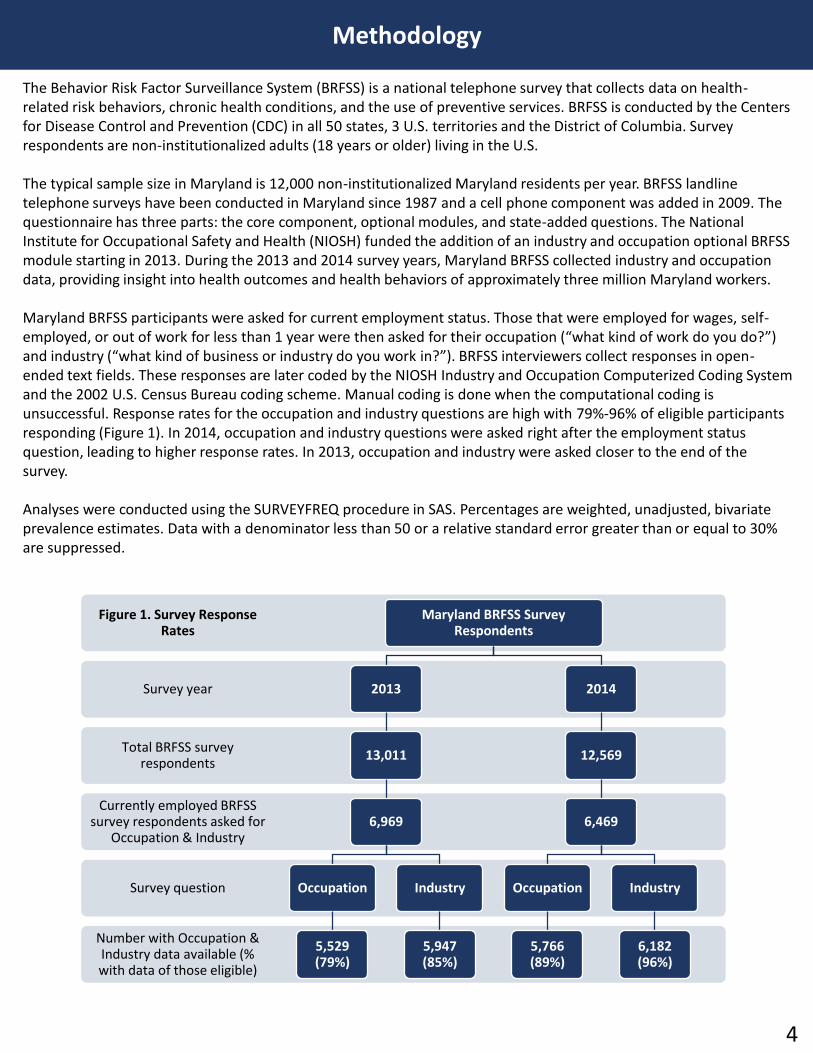
Maryland BRFSS participants were asked for current employment status. Those that were employed for wages, self-employed, or out of work for less than 1 year were then asked for their occupation (“what kind of work do you do?”) and industry (“what kind of business or industry do you work in?”). BRFSS interviewers collect responses in open-ended text fields. These responses are later coded by the NIOSH Industry and Occupation Computerized Coding System and the 2002 U.S. Census Bureau coding scheme. Manual coding is done when the computational coding is unsuccessful. Response rates for the occupation and industry questions are high with 79%-96% of eligible participants responding (Figure 1). In 2014, occupation and industry questions were asked right after the employment status question, leading to higher response rates. In 2013, occupation and industry were asked closer to the end of the survey.
Analyses were conducted using the SURVEYFREQ procedure in SAS. Percentages are weighted, unadjusted, bivariate prevalence estimates. Data with a denominator less than 50 or a relative standard error greater than or equal to 30% are suppressed.
Number with Occupation & Industry data available (% with data of those eligible)
Survey question
Currently employed BRFSS survey respondents asked for
Occupation & Industry
Total BRFSS survey respondents
Survey year
Figure 1. Survey Response Rates
Maryland BRFSS Survey Respondents
2013
13,011
6,969
Occupation
5,529 (79%)
Industry
5,947 (85%)
2014
12,569
6,469
Occupation
5,766 (89%)
Industry
6,182 (96%)
5
Figure 2. Health Indicators
Health Outcomes
Hypertension
Ever asthma
Current asthma
Skin cancer
Arthritis, rheumatoid arthritis, gout, lupus, or fibromyalgia
Depressive disorder
Anxiety disorder
Diabetes
Health Status
Overweight
Obese
Fair/poor general health status
Poor mental health status
Health Behaviors
Current smoker
Former smoker
Binge drinking
Doesn't always wear a seatbelt
Leisure time physical activity
Inadequate sleep
Healthcare Access
Health insurance
Needed to see a doctor, but could not because of cost
Last routine checkup
Last dental visit
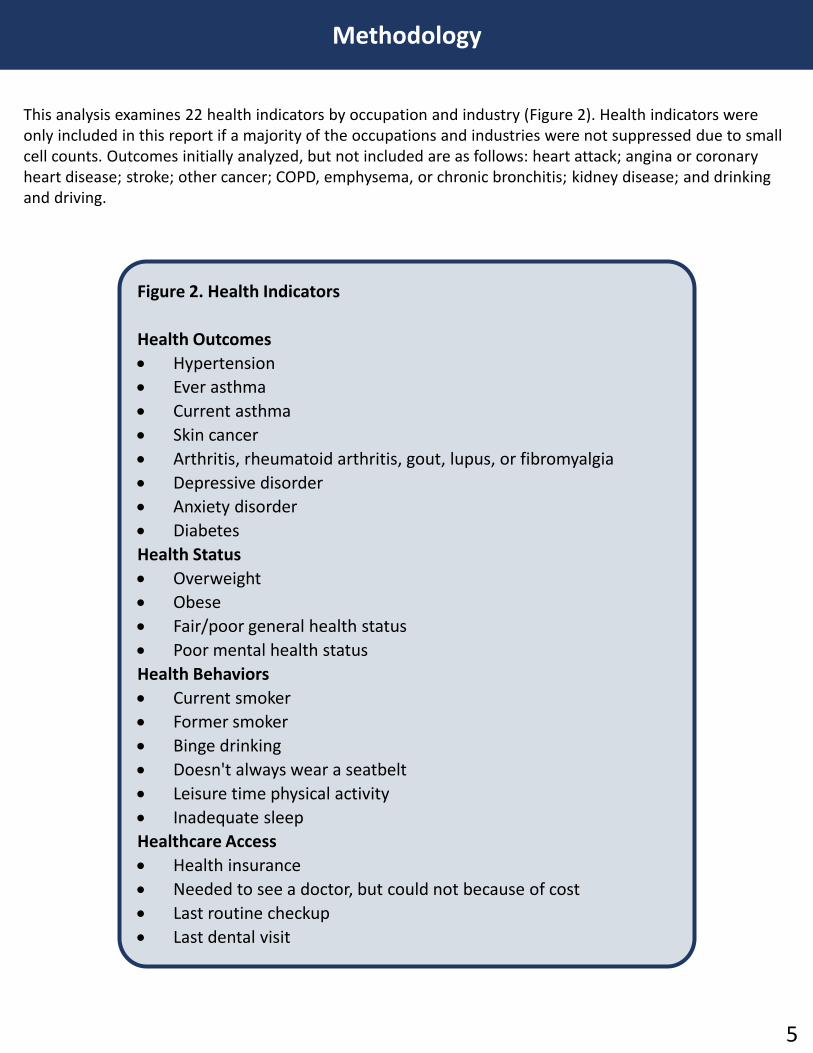
This analysis examines 22 health indicators by occupation and industry (Figure 2). Health indicators were only included in this report if a majority of the occupations and industries were not suppressed due to small cell counts. Outcomes initially analyzed, but not included are as follows: heart attack; angina or coronary heart disease; stroke; other cancer; COPD, emphysema, or chronic bronchitis; kidney disease; and drinking and driving.
Methodology
6
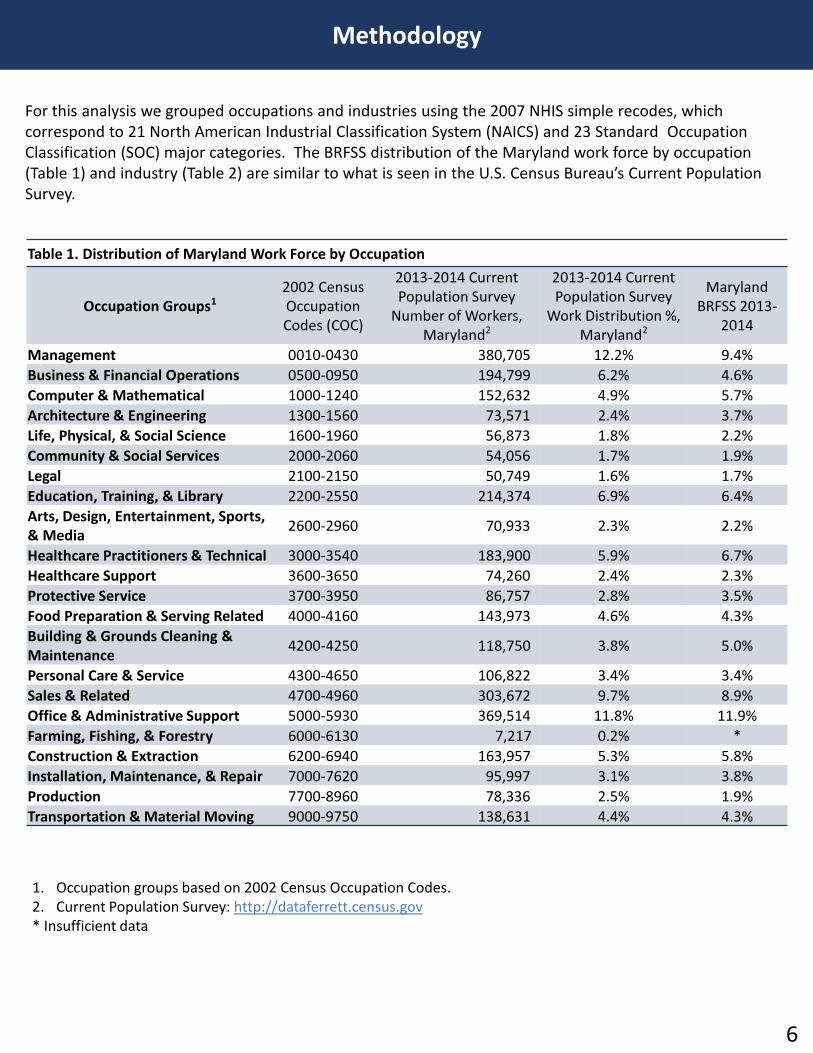
Table 1. Distribution of Maryland Work Force by Occupation
Occupation Groups12002 Census Occupation Codes (COC)
2013-2014 Current Population Survey
Number of Workers, Maryland2
2013-2014 Current Population Survey
Work Distribution %, Maryland2
Maryland BRFSS 2013-
2014
Management 0010-0430 380,705 12.2% 9.4%
Business & Financial Operations 0500-0950 194,799 6.2% 4.6%
Computer & Mathematical 1000-1240 152,632 4.9% 5.7%
Architecture & Engineering 1300-1560 73,571 2.4% 3.7%
Life, Physical, & Social Science 1600-1960 56,873 1.8% 2.2%
Community & Social Services 2000-2060 54,056 1.7% 1.9%
Legal 2100-2150 50,749 1.6% 1.7%
Education, Training, & Library 2200-2550 214,374 6.9% 6.4%
Arts, Design, Entertainment, Sports, & Media
2600-2960 70,933 2.3% 2.2%
Healthcare Practitioners & Technical 3000-3540 183,900 5.9% 6.7%
Healthcare Support 3600-3650 74,260 2.4% 2.3%
Protective Service 3700-3950 86,757 2.8% 3.5%
Food Preparation & Serving Related 4000-4160 143,973 4.6% 4.3%
Building & Grounds Cleaning & Maintenance
4200-4250 118,750 3.8% 5.0%
Personal Care & Service 4300-4650 106,822 3.4% 3.4%
Sales & Related 4700-4960 303,672 9.7% 8.9%
Office & Administrative Support 5000-5930 369,514 11.8% 11.9%
Farming, Fishing, & Forestry 6000-6130 7,217 0.2% *
Construction & Extraction 6200-6940 163,957 5.3% 5.8%
Installation, Maintenance, & Repair 7000-7620 95,997 3.1% 3.8%
Production 7700-8960 78,336 2.5% 1.9%
Transportation & Material Moving 9000-9750 138,631 4.4% 4.3%
1. Occupation groups based on 2002 Census Occupation Codes.2. Current Population Survey: http://dataferrett.census.gov* Insufficient data
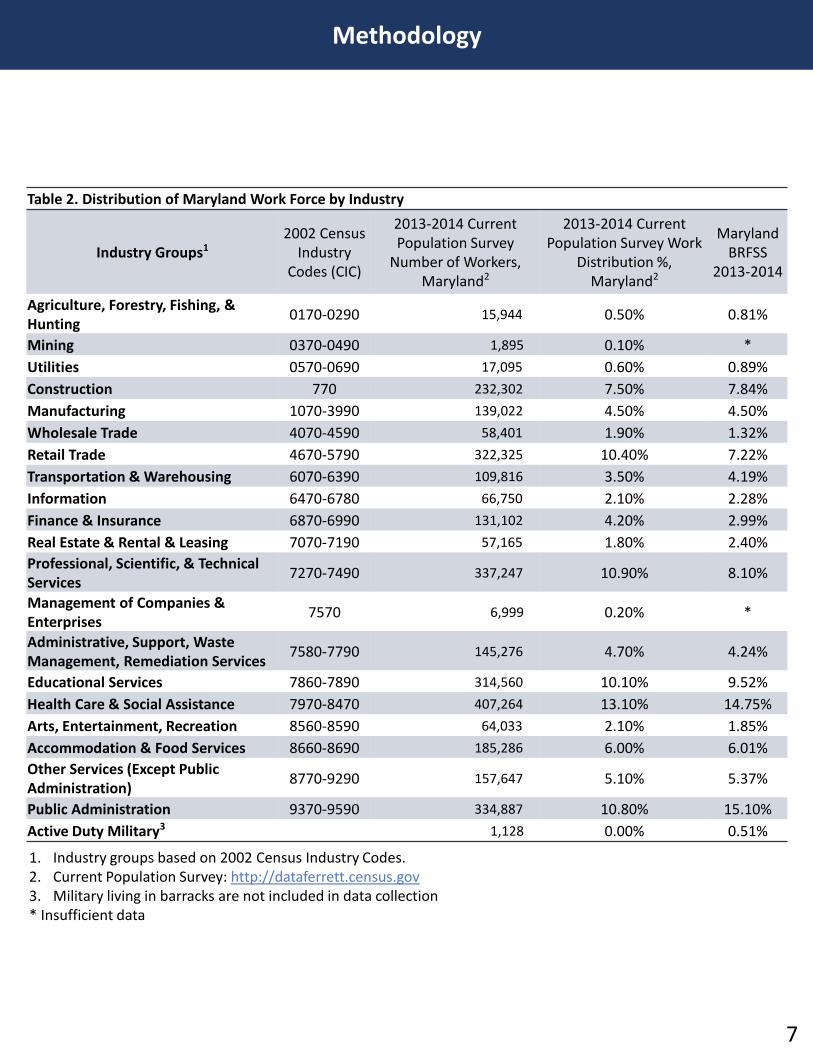
For this analysis we grouped occupations and industries using the 2007 NHIS simple recodes, which correspond to 21 North American Industrial Classification System (NAICS) and 23 Standard Occupation Classification (SOC) major categories. The BRFSS distribution of the Maryland work force by occupation (Table 1) and industry (Table 2) are similar to what is seen in the U.S. Census Bureau’s Current Population Survey.
Methodology
7
Table 2. Distribution of Maryland Work Force by Industry
Industry Groups12002 Census
Industry Codes (CIC)
2013-2014 Current Population Survey
Number of Workers, Maryland2
2013-2014 Current Population Survey Work
Distribution %, Maryland2
Maryland BRFSS
2013-2014
Agriculture, Forestry, Fishing, & Hunting
0170-0290 15,944 0.50% 0.81%
Mining 0370-0490 1,895 0.10% *
Utilities 0570-0690 17,095 0.60% 0.89%
Construction 770 232,302 7.50% 7.84%
Manufacturing 1070-3990 139,022 4.50% 4.50%
Wholesale Trade 4070-4590 58,401 1.90% 1.32%
Retail Trade 4670-5790 322,325 10.40% 7.22%
Transportation & Warehousing 6070-6390 109,816 3.50% 4.19%
Information 6470-6780 66,750 2.10% 2.28%
Finance & Insurance 6870-6990 131,102 4.20% 2.99%
Real Estate & Rental & Leasing 7070-7190 57,165 1.80% 2.40%
Professional, Scientific, & Technical Services
7270-7490 337,247 10.90% 8.10%
Management of Companies & Enterprises
7570 6,999 0.20% *
Administrative, Support, Waste Management, Remediation Services
7580-7790 145,276 4.70% 4.24%
Educational Services 7860-7890 314,560 10.10% 9.52%
Health Care & Social Assistance 7970-8470 407,264 13.10% 14.75%
Arts, Entertainment, Recreation 8560-8590 64,033 2.10% 1.85%
Accommodation & Food Services 8660-8690 185,286 6.00% 6.01%
Other Services (Except Public Administration)
8770-9290 157,647 5.10% 5.37%
Public Administration 9370-9590 334,887 10.80% 15.10%
Active Duty Military3 1,128 0.00% 0.51%
1. Industry groups based on 2002 Census Industry Codes.2. Current Population Survey: http://dataferrett.census.gov3. Military living in barracks are not included in data collection* Insufficient data
Methodology
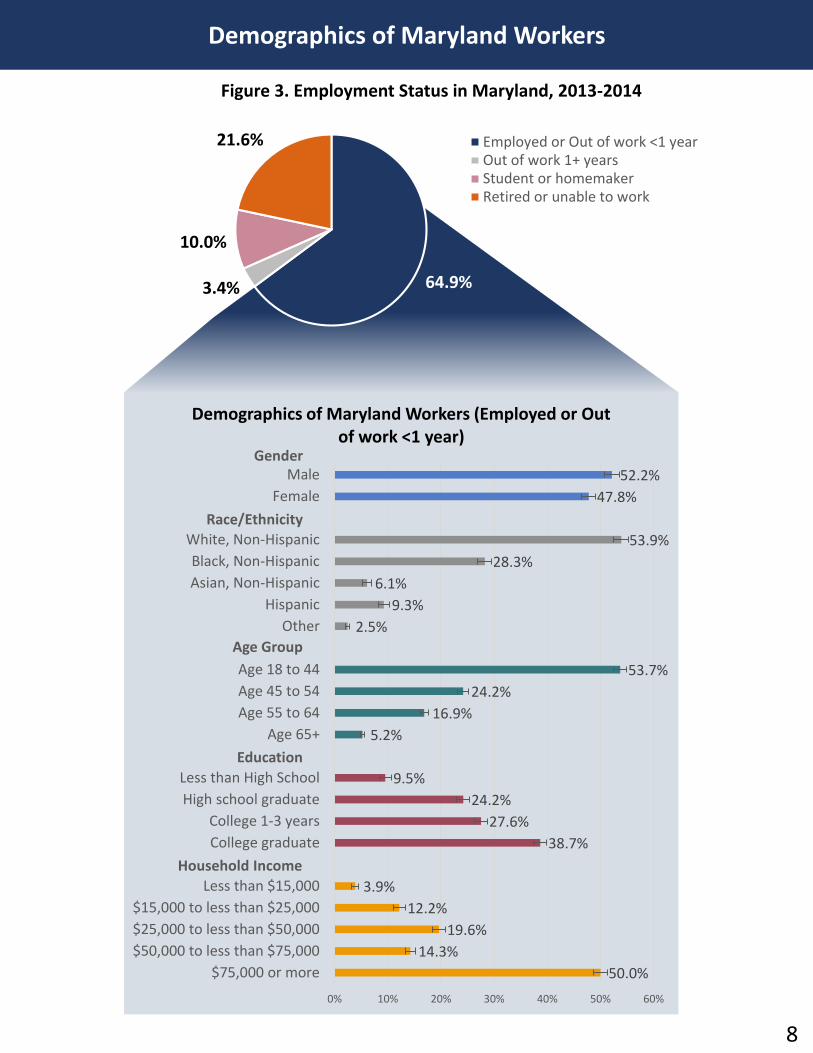
52.2%
47.8%
53.9%
28.3%
6.1%
9.3%
2.5%
53.7%
24.2%
16.9%
5.2%
9.5%
24.2%
27.6%
38.7%
3.9%
12.2%
19.6%
14.3%
50.0%
0% 10% 20% 30% 40% 50% 60%
Male
Female
White, Non-Hispanic
Black, Non-Hispanic
Asian, Non-Hispanic
Hispanic
Other
Age 18 to 44
Age 45 to 54
Age 55 to 64
Age 65+
Less than High School
High school graduate
College 1-3 years
College graduate
Less than $15,000
$15,000 to less than $25,000
$25,000 to less than $50,000
$50,000 to less than $75,000
$75,000 or more
Demographics of Maryland Workers (Employed or Out of work <1 year)
Demographics of Maryland Workers
8
64.9%3.4%
10.0%
21.6%
Figure 3. Employment Status in Maryland, 2013-2014
Employed or Out of work <1 yearOut of work 1+ yearsStudent or homemakerRetired or unable to work
Gender
Race/Ethnicity
Age Group
Education
Household Income
Health Outcome Indicators
9
Maryland Workers Ever Diagnosed With Hypertension
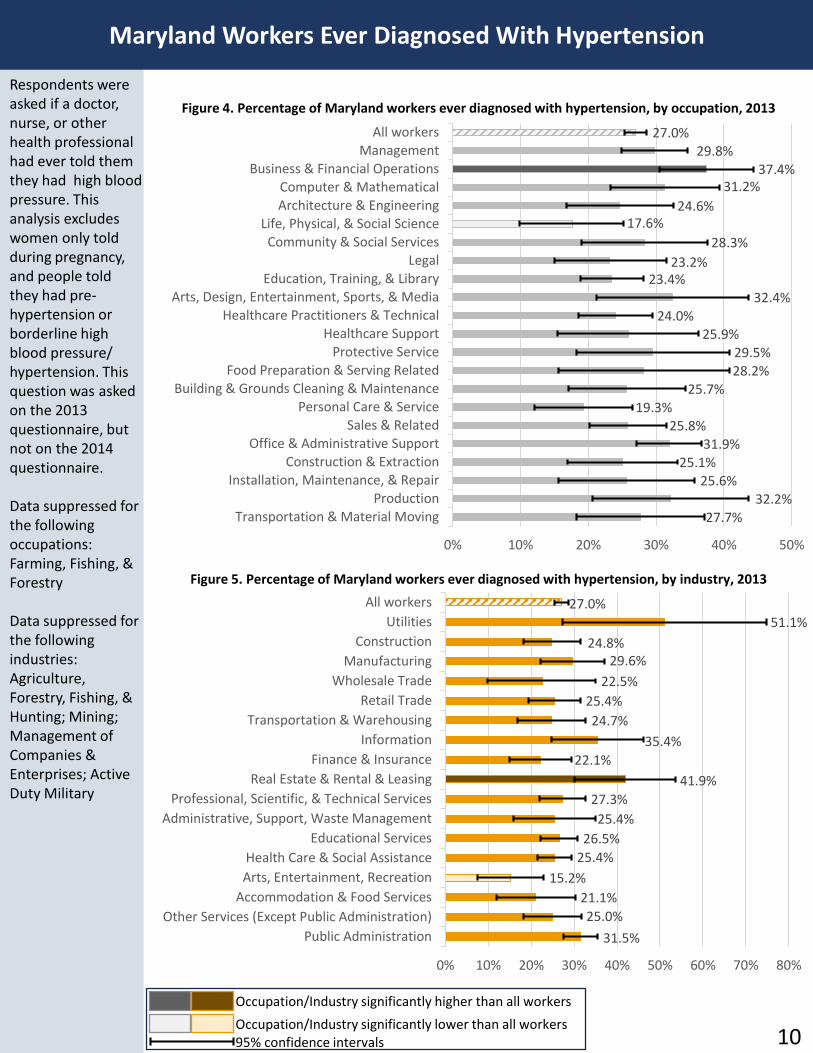
Respondents were asked if a doctor, nurse, or other health professional had ever told them they had high blood pressure. This analysis excludes women only told during pregnancy, and people told they had pre-hypertension or borderline high blood pressure/ hypertension. This question was asked on the 2013 questionnaire, but not on the 2014 questionnaire.
Data suppressed for the following occupations: Farming, Fishing, & Forestry
Data suppressed for the following industries: Agriculture, Forestry, Fishing, & Hunting; Mining; Management of Companies & Enterprises; Active Duty Military
10
Figure 5. Percentage of Maryland workers ever diagnosed with hypertension, by industry, 2013
Figure 4. Percentage of Maryland workers ever diagnosed with hypertension, by occupation, 2013
27.0%29.8%
37.4%31.2%
24.6%17.6%
28.3%
23.2%23.4%
32.4%24.0%
25.9%29.5%28.2%
25.7%19.3%
25.8%31.9%
25.1%25.6%
32.2%27.7%
0% 10% 20% 30% 40% 50%
All workersManagement
Business & Financial OperationsComputer & MathematicalArchitecture & Engineering
Life, Physical, & Social ScienceCommunity & Social Services
LegalEducation, Training, & Library
Arts, Design, Entertainment, Sports, & MediaHealthcare Practitioners & Technical
Healthcare SupportProtective Service
Food Preparation & Serving RelatedBuilding & Grounds Cleaning & Maintenance
Personal Care & ServiceSales & Related
Office & Administrative SupportConstruction & Extraction
Installation, Maintenance, & RepairProduction
Transportation & Material Moving
27.0%
51.1%
24.8%29.6%
22.5%
25.4%
24.7%
35.4%
22.1%
41.9%
27.3%
25.4%
26.5%
25.4%
15.2%
21.1%
25.0%
31.5%
0% 10% 20% 30% 40% 50% 60% 70% 80%
All workers
Utilities
Construction
Manufacturing
Wholesale Trade
Retail Trade
Transportation & Warehousing
Information
Finance & Insurance
Real Estate & Rental & Leasing
Professional, Scientific, & Technical Services
Administrative, Support, Waste Management
Educational Services
Health Care & Social Assistance
Arts, Entertainment, Recreation
Accommodation & Food Services
Other Services (Except Public Administration)
Public Administration
Occupation/Industry significantly lower than all workers
Occupation/Industry significantly higher than all workers
95% confidence intervals
Maryland Workers Ever Diagnosed With Asthma
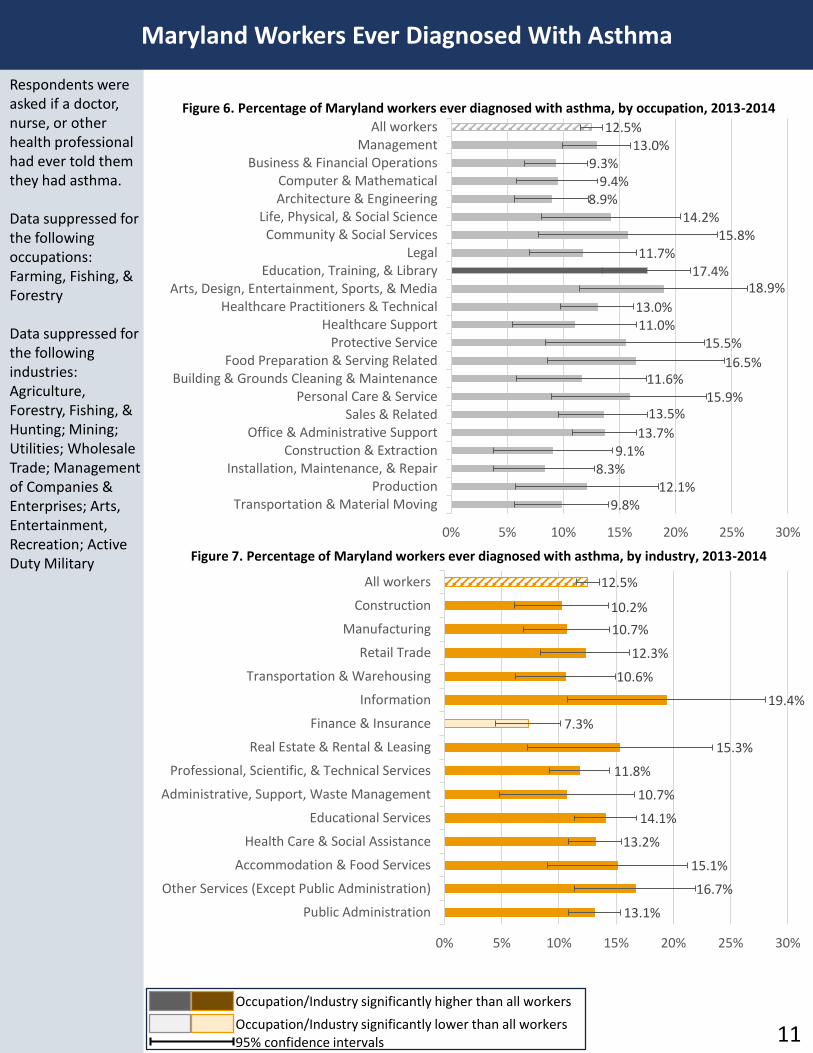
Respondents were asked if a doctor, nurse, or other health professional had ever told them they had asthma.
Data suppressed for the following occupations: Farming, Fishing, & Forestry
Data suppressed for the following industries: Agriculture, Forestry, Fishing, & Hunting; Mining; Utilities; Wholesale Trade; Management of Companies & Enterprises; Arts, Entertainment, Recreation; Active Duty Military
Figure 6. Percentage of Maryland workers ever diagnosed with asthma, by occupation, 2013-2014
Figure 7. Percentage of Maryland workers ever diagnosed with asthma, by industry, 2013-2014
12.5%13.0%
9.3%9.4%
8.9%14.2%
15.8%11.7%
17.4%18.9%
13.0%11.0%
15.5%
16.5%11.6%
15.9%13.5%
13.7%9.1%
8.3%12.1%
9.8%
0% 5% 10% 15% 20% 25% 30%
All workersManagement
Business & Financial OperationsComputer & MathematicalArchitecture & Engineering
Life, Physical, & Social ScienceCommunity & Social Services
LegalEducation, Training, & Library
Arts, Design, Entertainment, Sports, & MediaHealthcare Practitioners & Technical
Healthcare SupportProtective Service
Food Preparation & Serving RelatedBuilding & Grounds Cleaning & Maintenance
Personal Care & ServiceSales & Related
Office & Administrative SupportConstruction & Extraction
Installation, Maintenance, & RepairProduction
Transportation & Material Moving
12.5%
10.2%
10.7%
12.3%
10.6%
19.4%
7.3%
15.3%
11.8%
10.7%
14.1%
13.2%
15.1%
16.7%
13.1%
0% 5% 10% 15% 20% 25% 30%
All workers
Construction
Manufacturing
Retail Trade
Transportation & Warehousing
Information
Finance & Insurance
Real Estate & Rental & Leasing
Professional, Scientific, & Technical Services
Administrative, Support, Waste Management
Educational Services
Health Care & Social Assistance
Accommodation & Food Services
Other Services (Except Public Administration)
Public Administration
11Occupation/Industry significantly lower than all workers
Occupation/Industry significantly higher than all workers
95% confidence intervals
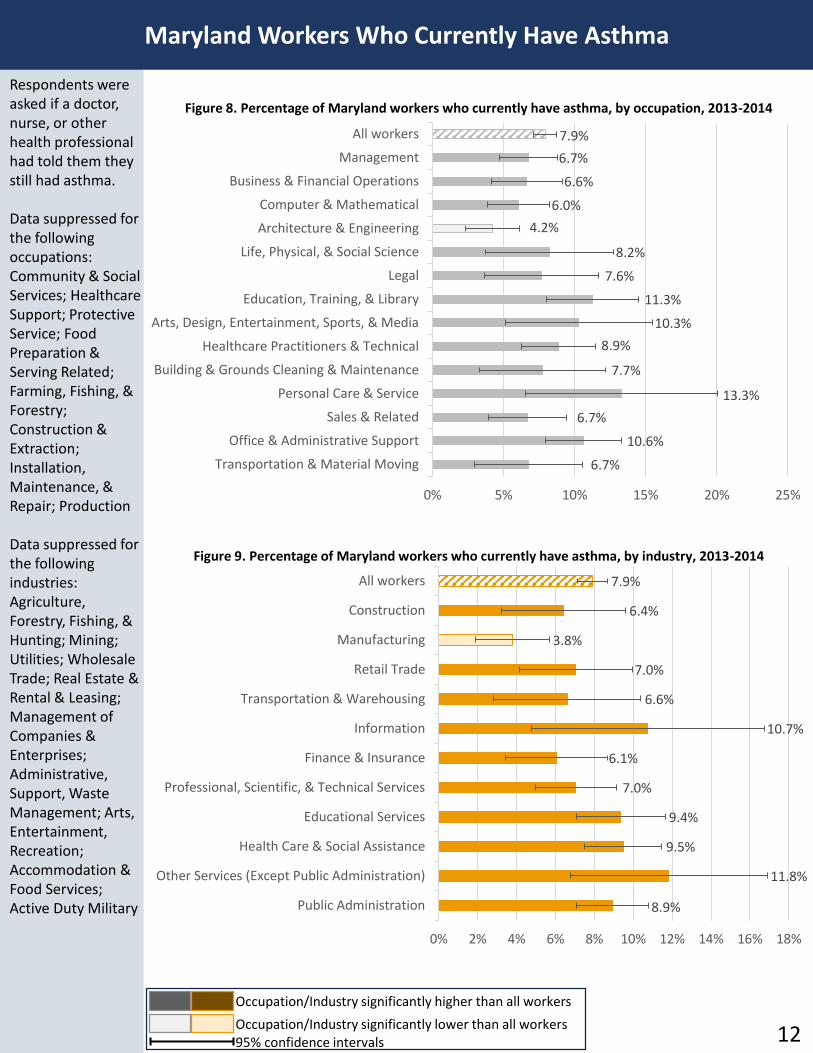
Maryland Workers Who Currently Have Asthma
Respondents were asked if a doctor, nurse, or other health professional had told them they still had asthma.
Data suppressed for the following occupations: Community & Social Services; Healthcare Support; Protective Service; Food Preparation & Serving Related; Farming, Fishing, & Forestry; Construction & Extraction; Installation, Maintenance, & Repair; Production
Data suppressed for the following industries: Agriculture, Forestry, Fishing, & Hunting; Mining; Utilities; Wholesale Trade; Real Estate & Rental & Leasing; Management of Companies & Enterprises; Administrative, Support, Waste Management; Arts, Entertainment, Recreation; Accommodation & Food Services; Active Duty Military
Figure 8. Percentage of Maryland workers who currently have asthma, by occupation, 2013-2014
Figure 9. Percentage of Maryland workers who currently have asthma, by industry, 2013-2014
7.9%
6.7%
6.6%
6.0%
4.2%
8.2%
7.6%
11.3%
10.3%
8.9%
7.7%
13.3%
6.7%
10.6%
6.7%
0% 5% 10% 15% 20% 25%
All workers
Management
Business & Financial Operations
Computer & Mathematical
Architecture & Engineering
Life, Physical, & Social Science
Legal
Education, Training, & Library
Arts, Design, Entertainment, Sports, & Media
Healthcare Practitioners & Technical
Building & Grounds Cleaning & Maintenance
Personal Care & Service
Sales & Related
Office & Administrative Support
Transportation & Material Moving
7.9%
6.4%
3.8%
7.0%
6.6%
10.7%
6.1%
7.0%
9.4%
9.5%
11.8%
8.9%
0% 2% 4% 6% 8% 10% 12% 14% 16% 18%
All workers
Construction
Manufacturing
Retail Trade
Transportation & Warehousing
Information
Finance & Insurance
Professional, Scientific, & Technical Services
Educational Services
Health Care & Social Assistance
Other Services (Except Public Administration)
Public Administration
12Occupation/Industry significantly lower than all workers
Occupation/Industry significantly higher than all workers
95% confidence intervals
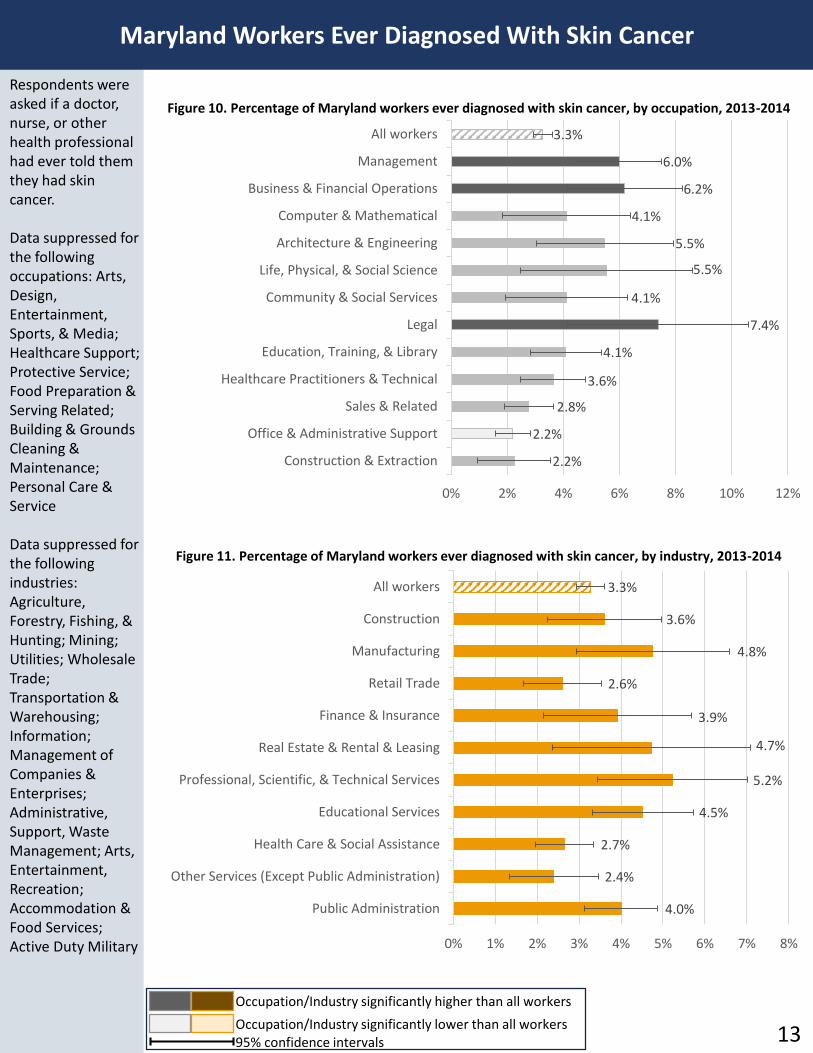
Maryland Workers Ever Diagnosed With Skin Cancer
Respondents were asked if a doctor, nurse, or other health professional had ever told them they had skin cancer.
Data suppressed for the following occupations: Arts, Design, Entertainment, Sports, & Media; Healthcare Support; Protective Service; Food Preparation & Serving Related; Building & Grounds Cleaning & Maintenance; Personal Care & Service
Data suppressed for the following industries: Agriculture, Forestry, Fishing, & Hunting; Mining; Utilities; Wholesale Trade; Transportation & Warehousing; Information; Management of Companies & Enterprises; Administrative, Support, Waste Management; Arts, Entertainment, Recreation; Accommodation & Food Services; Active Duty Military
Figure 10. Percentage of Maryland workers ever diagnosed with skin cancer, by occupation, 2013-2014
Figure 11. Percentage of Maryland workers ever diagnosed with skin cancer, by industry, 2013-2014
3.3%
6.0%
6.2%
4.1%
5.5%
5.5%
4.1%
7.4%
4.1%
3.6%
2.8%
2.2%
2.2%
0% 2% 4% 6% 8% 10% 12%
All workers
Management
Business & Financial Operations
Computer & Mathematical
Architecture & Engineering
Life, Physical, & Social Science
Community & Social Services
Legal
Education, Training, & Library
Healthcare Practitioners & Technical
Sales & Related
Office & Administrative Support
Construction & Extraction
3.3%
3.6%
4.8%
2.6%
3.9%
4.7%
5.2%
4.5%
2.7%
2.4%
4.0%
0% 1% 2% 3% 4% 5% 6% 7% 8%
All workers
Construction
Manufacturing
Retail Trade
Finance & Insurance
Real Estate & Rental & Leasing
Professional, Scientific, & Technical Services
Educational Services
Health Care & Social Assistance
Other Services (Except Public Administration)
Public Administration
13Occupation/Industry significantly lower than all workers
Occupation/Industry significantly higher than all workers
95% confidence intervals
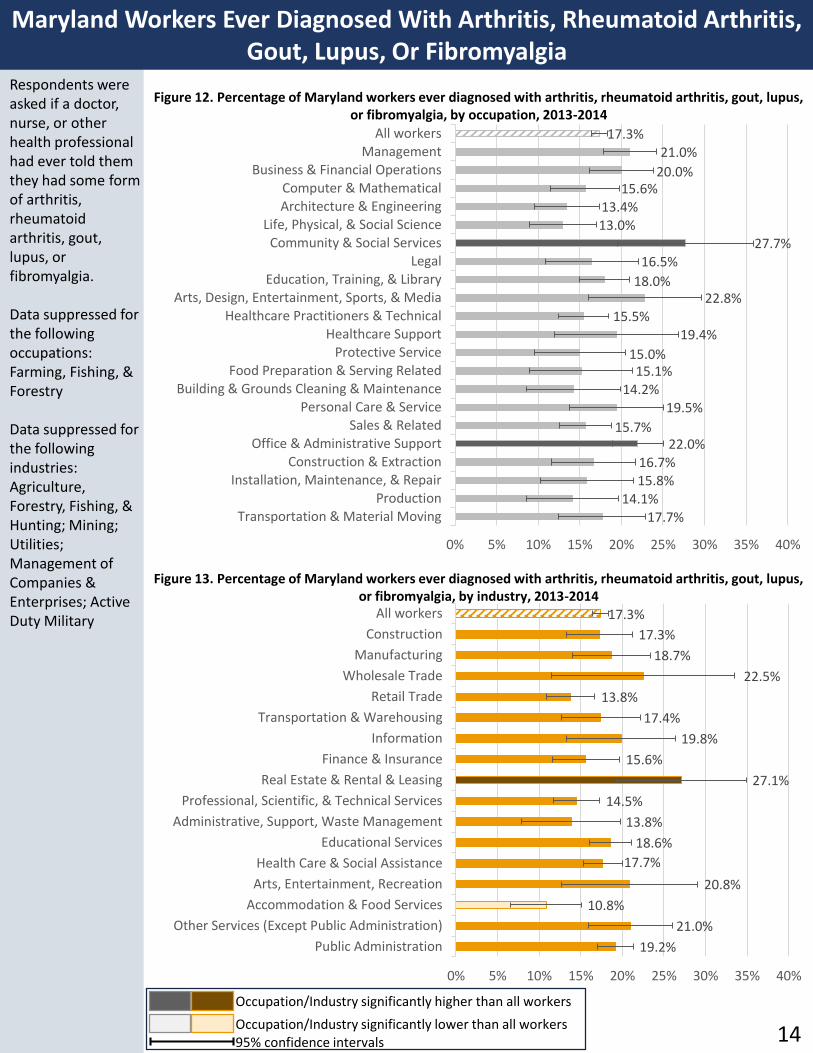
Maryland Workers Ever Diagnosed With Arthritis, Rheumatoid Arthritis, Gout, Lupus, Or Fibromyalgia
Respondents were asked if a doctor, nurse, or other health professional had ever told them they had some form of arthritis, rheumatoid arthritis, gout, lupus, or fibromyalgia.
Data suppressed for the following occupations: Farming, Fishing, & Forestry
Data suppressed for the following industries: Agriculture, Forestry, Fishing, & Hunting; Mining; Utilities; Management of Companies & Enterprises; Active Duty Military
Figure 12. Percentage of Maryland workers ever diagnosed with arthritis, rheumatoid arthritis, gout, lupus, or fibromyalgia, by occupation, 2013-2014
Figure 13. Percentage of Maryland workers ever diagnosed with arthritis, rheumatoid arthritis, gout, lupus, or fibromyalgia, by industry, 2013-2014
17.3%21.0%
20.0%15.6%
13.4%13.0%
27.7%16.5%
18.0%22.8%
15.5%19.4%
15.0%15.1%
14.2%19.5%
15.7%22.0%
16.7%15.8%
14.1%17.7%
0% 5% 10% 15% 20% 25% 30% 35% 40%
All workersManagement
Business & Financial OperationsComputer & MathematicalArchitecture & Engineering
Life, Physical, & Social ScienceCommunity & Social Services
LegalEducation, Training, & Library
Arts, Design, Entertainment, Sports, & MediaHealthcare Practitioners & Technical
Healthcare SupportProtective Service
Food Preparation & Serving RelatedBuilding & Grounds Cleaning & Maintenance
Personal Care & ServiceSales & Related
Office & Administrative SupportConstruction & Extraction
Installation, Maintenance, & RepairProduction
Transportation & Material Moving
17.3%
17.3%
18.7%
22.5%
13.8%
17.4%
19.8%
15.6%
27.1%
14.5%
13.8%
18.6%
17.7%
20.8%
10.8%
21.0%
19.2%
0% 5% 10% 15% 20% 25% 30% 35% 40%
All workers
Construction
Manufacturing
Wholesale Trade
Retail Trade
Transportation & Warehousing
Information
Finance & Insurance
Real Estate & Rental & Leasing
Professional, Scientific, & Technical Services
Administrative, Support, Waste Management
Educational Services
Health Care & Social Assistance
Arts, Entertainment, Recreation
Accommodation & Food Services
Other Services (Except Public Administration)
Public Administration
14Occupation/Industry significantly lower than all workers
Occupation/Industry significantly higher than all workers
95% confidence intervals
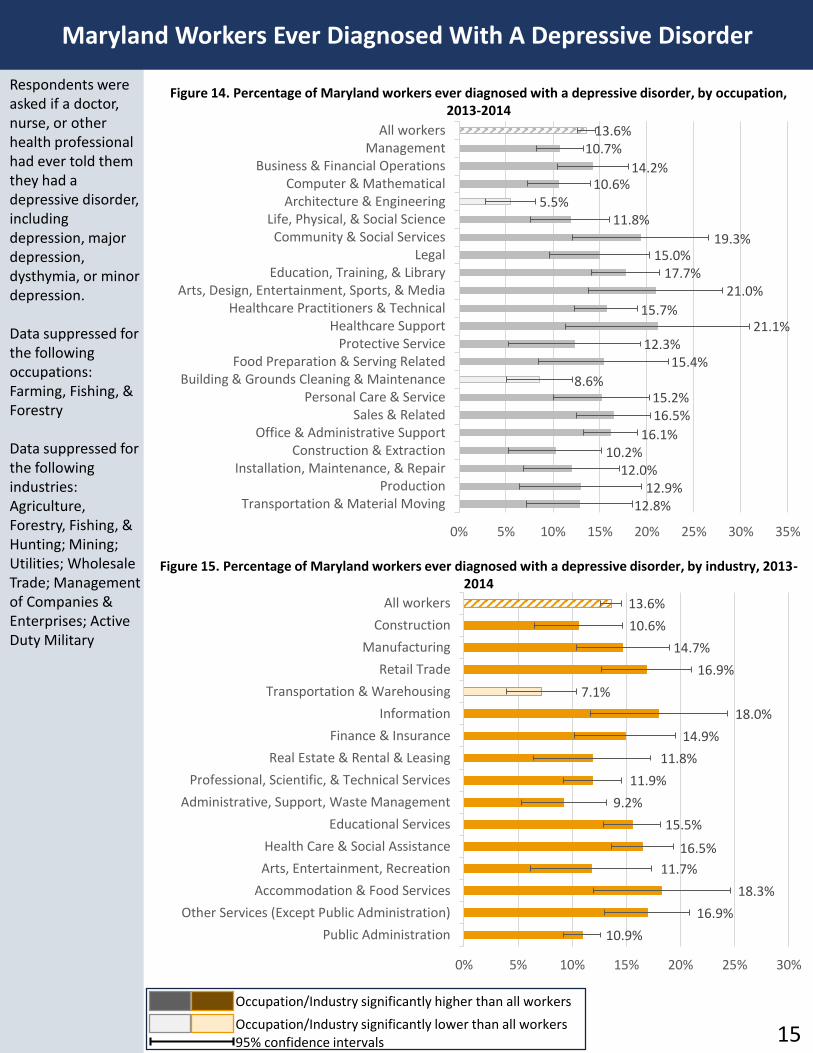
Maryland Workers Ever Diagnosed With A Depressive Disorder
Respondents were asked if a doctor, nurse, or other health professional had ever told them they had a depressive disorder, including depression, major depression, dysthymia, or minor depression.
Data suppressed for the following occupations: Farming, Fishing, & Forestry
Data suppressed for the following industries: Agriculture, Forestry, Fishing, & Hunting; Mining; Utilities; Wholesale Trade; Management of Companies & Enterprises; Active Duty Military
Figure 14. Percentage of Maryland workers ever diagnosed with a depressive disorder, by occupation, 2013-2014
Figure 15. Percentage of Maryland workers ever diagnosed with a depressive disorder, by industry, 2013-2014
13.6%10.7%
14.2%10.6%
5.5%11.8%
19.3%15.0%
17.7%21.0%
15.7%21.1%
12.3%15.4%
8.6%15.2%16.5%
16.1%10.2%
12.0%12.9%
12.8%
0% 5% 10% 15% 20% 25% 30% 35%
All workersManagement
Business & Financial OperationsComputer & MathematicalArchitecture & Engineering
Life, Physical, & Social ScienceCommunity & Social Services
LegalEducation, Training, & Library
Arts, Design, Entertainment, Sports, & MediaHealthcare Practitioners & Technical
Healthcare SupportProtective Service
Food Preparation & Serving RelatedBuilding & Grounds Cleaning & Maintenance
Personal Care & ServiceSales & Related
Office & Administrative SupportConstruction & Extraction
Installation, Maintenance, & RepairProduction
Transportation & Material Moving
13.6%
10.6%
14.7%
16.9%
7.1%
18.0%
14.9%
11.8%
11.9%
9.2%
15.5%
16.5%
11.7%
18.3%
16.9%
10.9%
0% 5% 10% 15% 20% 25% 30%
All workers
Construction
Manufacturing
Retail Trade
Transportation & Warehousing
Information
Finance & Insurance
Real Estate & Rental & Leasing
Professional, Scientific, & Technical Services
Administrative, Support, Waste Management
Educational Services
Health Care & Social Assistance
Arts, Entertainment, Recreation
Accommodation & Food Services
Other Services (Except Public Administration)
Public Administration
15Occupation/Industry significantly lower than all workers
Occupation/Industry significantly higher than all workers
95% confidence intervals
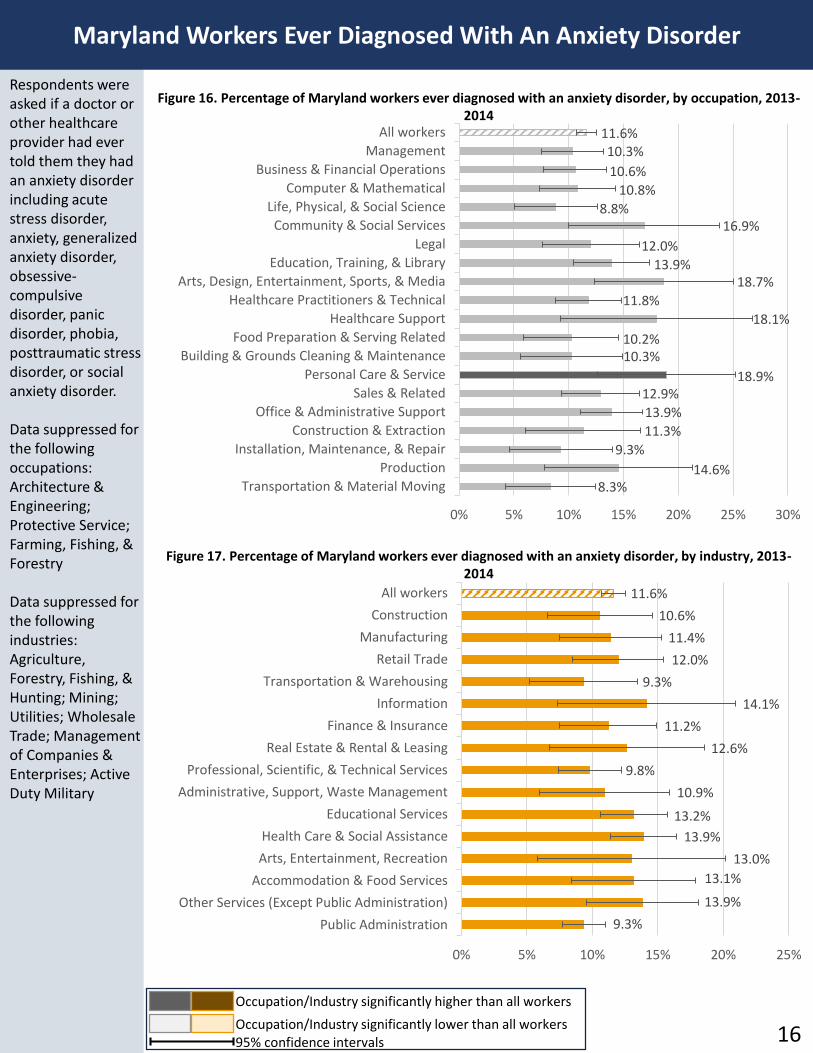
Maryland Workers Ever Diagnosed With An Anxiety Disorder
Respondents were asked if a doctor or other healthcare provider had ever told them they had an anxiety disorder including acute stress disorder, anxiety, generalized anxiety disorder, obsessive-compulsive disorder, panic disorder, phobia, posttraumatic stress disorder, or social anxiety disorder.
Data suppressed for the following occupations: Architecture & Engineering; Protective Service; Farming, Fishing, & Forestry
Data suppressed for the following industries: Agriculture, Forestry, Fishing, & Hunting; Mining; Utilities; Wholesale Trade; Management of Companies & Enterprises; Active Duty Military
Figure 16. Percentage of Maryland workers ever diagnosed with an anxiety disorder, by occupation, 2013-2014
Figure 17. Percentage of Maryland workers ever diagnosed with an anxiety disorder, by industry, 2013-2014
11.6%10.3%
10.6%
10.8%
8.8%16.9%
12.0%
13.9%18.7%
11.8%
18.1%
10.2%10.3%
18.9%12.9%
13.9%
11.3%
9.3%
14.6%8.3%
0% 5% 10% 15% 20% 25% 30%
All workers
Management
Business & Financial Operations
Computer & Mathematical
Life, Physical, & Social Science
Community & Social Services
Legal
Education, Training, & Library
Arts, Design, Entertainment, Sports, & Media
Healthcare Practitioners & Technical
Healthcare Support
Food Preparation & Serving Related
Building & Grounds Cleaning & Maintenance
Personal Care & Service
Sales & Related
Office & Administrative Support
Construction & Extraction
Installation, Maintenance, & Repair
Production
Transportation & Material Moving
11.6%
10.6%
11.4%
12.0%
9.3%
14.1%
11.2%
12.6%
9.8%
10.9%
13.2%
13.9%
13.0%
13.1%
13.9%
9.3%
0% 5% 10% 15% 20% 25%
All workers
Construction
Manufacturing
Retail Trade
Transportation & Warehousing
Information
Finance & Insurance
Real Estate & Rental & Leasing
Professional, Scientific, & Technical Services
Administrative, Support, Waste Management
Educational Services
Health Care & Social Assistance
Arts, Entertainment, Recreation
Accommodation & Food Services
Other Services (Except Public Administration)
Public Administration
16Occupation/Industry significantly lower than all workers
Occupation/Industry significantly higher than all workers
95% confidence intervals
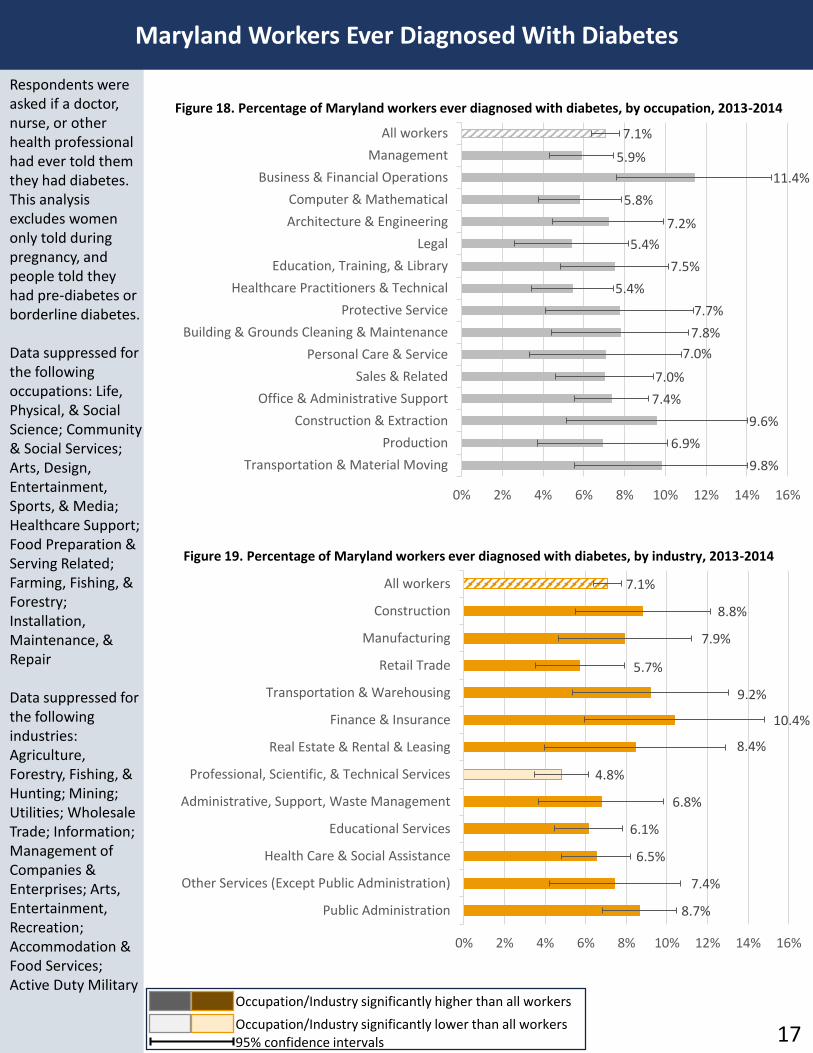
Maryland Workers Ever Diagnosed With Diabetes
Respondents were asked if a doctor, nurse, or other health professional had ever told them they had diabetes. This analysis excludes women only told during pregnancy, and people told they had pre-diabetes or borderline diabetes.
Data suppressed for the following occupations: Life, Physical, & Social Science; Community & Social Services; Arts, Design, Entertainment, Sports, & Media; Healthcare Support; Food Preparation & Serving Related; Farming, Fishing, & Forestry; Installation, Maintenance, & Repair
Data suppressed for the following industries: Agriculture, Forestry, Fishing, & Hunting; Mining; Utilities; Wholesale Trade; Information; Management of Companies & Enterprises; Arts, Entertainment, Recreation; Accommodation & Food Services; Active Duty Military
Figure 18. Percentage of Maryland workers ever diagnosed with diabetes, by occupation, 2013-2014
Figure 19. Percentage of Maryland workers ever diagnosed with diabetes, by industry, 2013-2014
7.1%
5.9%
11.4%
5.8%
7.2%
5.4%
7.5%
5.4%
7.7%
7.8%
7.0%
7.0%
7.4%
9.6%
6.9%
9.8%
0% 2% 4% 6% 8% 10% 12% 14% 16%
All workers
Management
Business & Financial Operations
Computer & Mathematical
Architecture & Engineering
Legal
Education, Training, & Library
Healthcare Practitioners & Technical
Protective Service
Building & Grounds Cleaning & Maintenance
Personal Care & Service
Sales & Related
Office & Administrative Support
Construction & Extraction
Production
Transportation & Material Moving
7.1%
8.8%
7.9%
5.7%
9.2%
10.4%
8.4%
4.8%
6.8%
6.1%
6.5%
7.4%
8.7%
0% 2% 4% 6% 8% 10% 12% 14% 16%
All workers
Construction
Manufacturing
Retail Trade
Transportation & Warehousing
Finance & Insurance
Real Estate & Rental & Leasing
Professional, Scientific, & Technical Services
Administrative, Support, Waste Management
Educational Services
Health Care & Social Assistance
Other Services (Except Public Administration)
Public Administration
17Occupation/Industry significantly lower than all workers
Occupation/Industry significantly higher than all workers
95% confidence intervals
Health Status Indicators
18
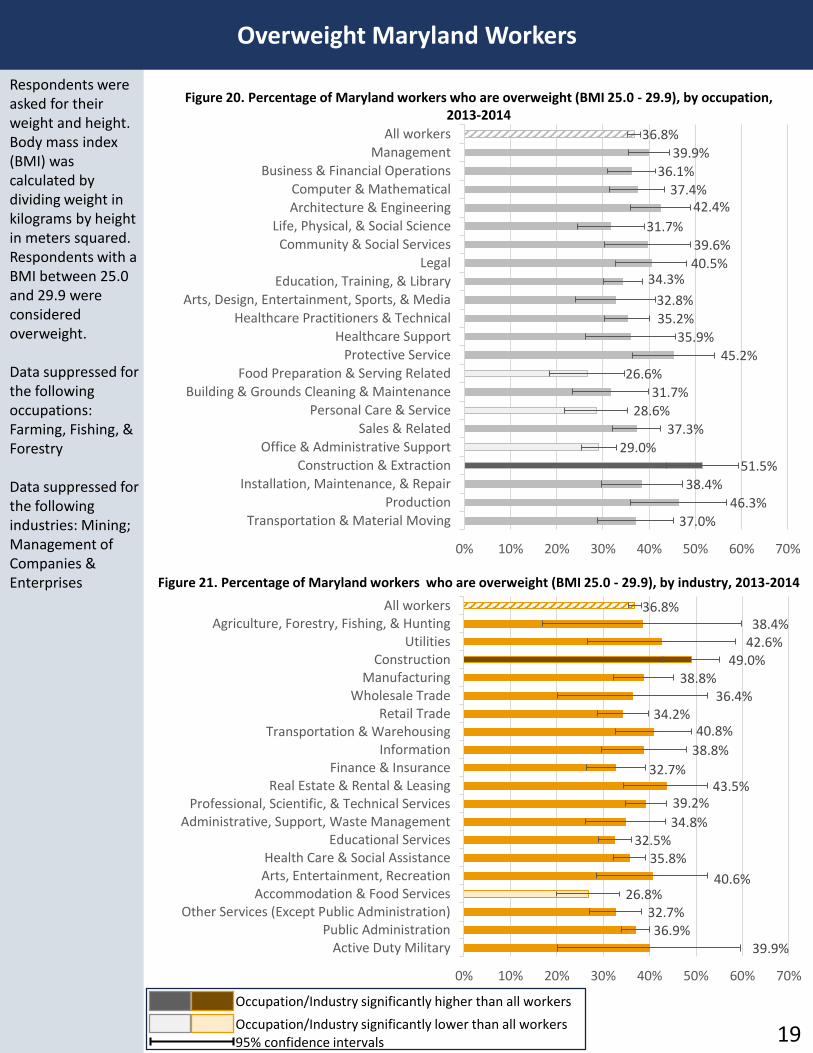
Overweight Maryland Workers
Respondents were asked for their weight and height. Body mass index (BMI) was calculated by dividing weight in kilograms by height in meters squared. Respondents with a BMI between 25.0 and 29.9 were considered overweight.
Data suppressed for the following occupations: Farming, Fishing, & Forestry
Data suppressed for the following industries: Mining; Management of Companies & Enterprises
Figure 20. Percentage of Maryland workers who are overweight (BMI 25.0 - 29.9), by occupation, 2013-2014
Figure 21. Percentage of Maryland workers who are overweight (BMI 25.0 - 29.9), by industry, 2013-2014
36.8%
39.9%
36.1%
37.4%42.4%
31.7%
39.6%
40.5%34.3%
32.8%
35.2%
35.9%
45.2%
26.6%
31.7%
28.6%
37.3%
29.0%
51.5%
38.4%
46.3%
37.0%
0% 10% 20% 30% 40% 50% 60% 70%
All workers
Management
Business & Financial Operations
Computer & Mathematical
Architecture & Engineering
Life, Physical, & Social Science
Community & Social Services
Legal
Education, Training, & Library
Arts, Design, Entertainment, Sports, & Media
Healthcare Practitioners & Technical
Healthcare Support
Protective Service
Food Preparation & Serving Related
Building & Grounds Cleaning & Maintenance
Personal Care & Service
Sales & Related
Office & Administrative Support
Construction & Extraction
Installation, Maintenance, & Repair
Production
Transportation & Material Moving
36.8%38.4%
42.6%49.0%
38.8%36.4%
34.2%40.8%
38.8%
32.7%43.5%
39.2%
34.8%32.5%
35.8%
40.6%26.8%
32.7%36.9%
39.9%
0% 10% 20% 30% 40% 50% 60% 70%
All workersAgriculture, Forestry, Fishing, & Hunting
UtilitiesConstruction
ManufacturingWholesale Trade
Retail TradeTransportation & Warehousing
InformationFinance & Insurance
Real Estate & Rental & LeasingProfessional, Scientific, & Technical Services
Administrative, Support, Waste ManagementEducational Services
Health Care & Social AssistanceArts, Entertainment, Recreation
Accommodation & Food ServicesOther Services (Except Public Administration)
Public AdministrationActive Duty Military
19Occupation/Industry significantly lower than all workers
Occupation/Industry significantly higher than all workers
95% confidence intervals
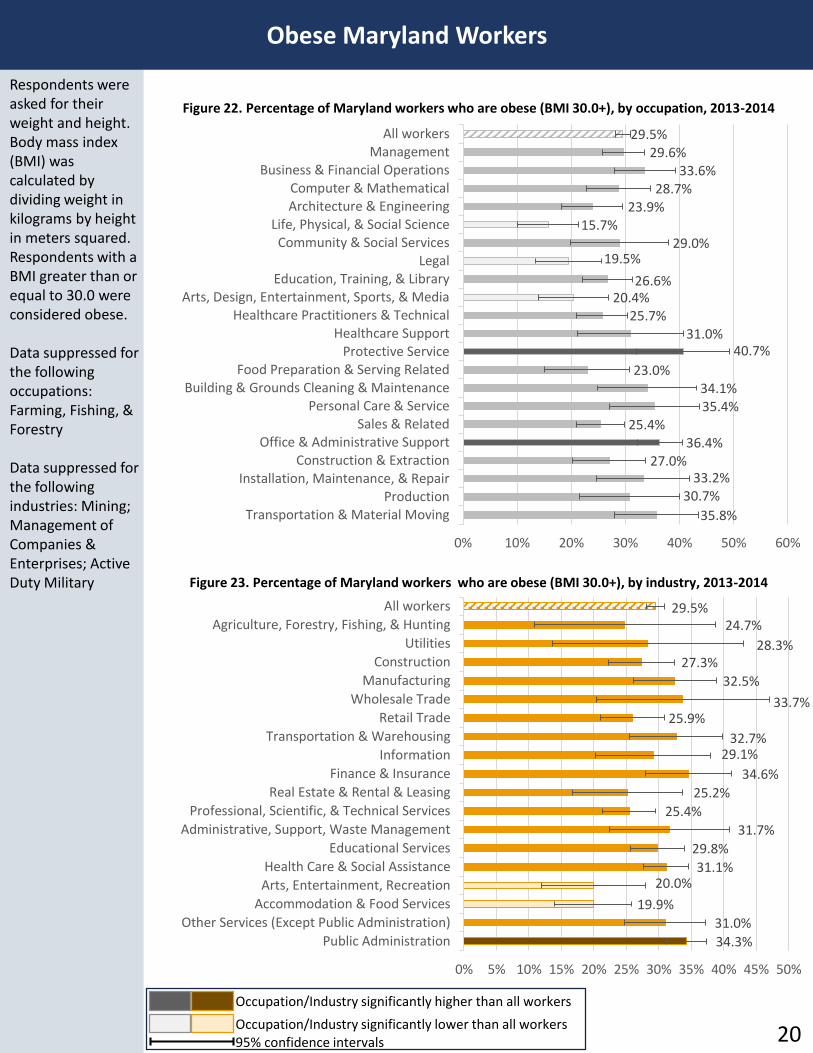
Obese Maryland Workers
Respondents were asked for their weight and height. Body mass index (BMI) was calculated by dividing weight in kilograms by height in meters squared. Respondents with a BMI greater than or equal to 30.0 were considered obese.
Data suppressed for the following occupations: Farming, Fishing, & Forestry
Data suppressed for the following industries: Mining; Management of Companies & Enterprises; Active Duty Military
Figure 22. Percentage of Maryland workers who are obese (BMI 30.0+), by occupation, 2013-2014
Figure 23. Percentage of Maryland workers who are obese (BMI 30.0+), by industry, 2013-2014
29.5%29.6%
33.6%28.7%
23.9%15.7%
29.0%19.5%
26.6%20.4%
25.7%31.0%
40.7%
23.0%34.1%35.4%
25.4%36.4%
27.0%33.2%
30.7%
35.8%
0% 10% 20% 30% 40% 50% 60%
All workersManagement
Business & Financial OperationsComputer & MathematicalArchitecture & Engineering
Life, Physical, & Social ScienceCommunity & Social Services
LegalEducation, Training, & Library
Arts, Design, Entertainment, Sports, & MediaHealthcare Practitioners & Technical
Healthcare SupportProtective Service
Food Preparation & Serving RelatedBuilding & Grounds Cleaning & Maintenance
Personal Care & ServiceSales & Related
Office & Administrative SupportConstruction & Extraction
Installation, Maintenance, & RepairProduction
Transportation & Material Moving
29.5%24.7%
28.3%27.3%
32.5%
33.7%25.9%
32.7%29.1%
34.6%
25.2%
25.4%
31.7%
29.8%
31.1%20.0%
19.9%
31.0%
34.3%
0% 5% 10% 15% 20% 25% 30% 35% 40% 45% 50%
All workers
Agriculture, Forestry, Fishing, & Hunting
Utilities
Construction
Manufacturing
Wholesale Trade
Retail Trade
Transportation & Warehousing
Information
Finance & Insurance
Real Estate & Rental & Leasing
Professional, Scientific, & Technical Services
Administrative, Support, Waste Management
Educational Services
Health Care & Social Assistance
Arts, Entertainment, Recreation
Accommodation & Food Services
Other Services (Except Public Administration)
Public Administration
20Occupation/Industry significantly lower than all workers
Occupation/Industry significantly higher than all workers
95% confidence intervals
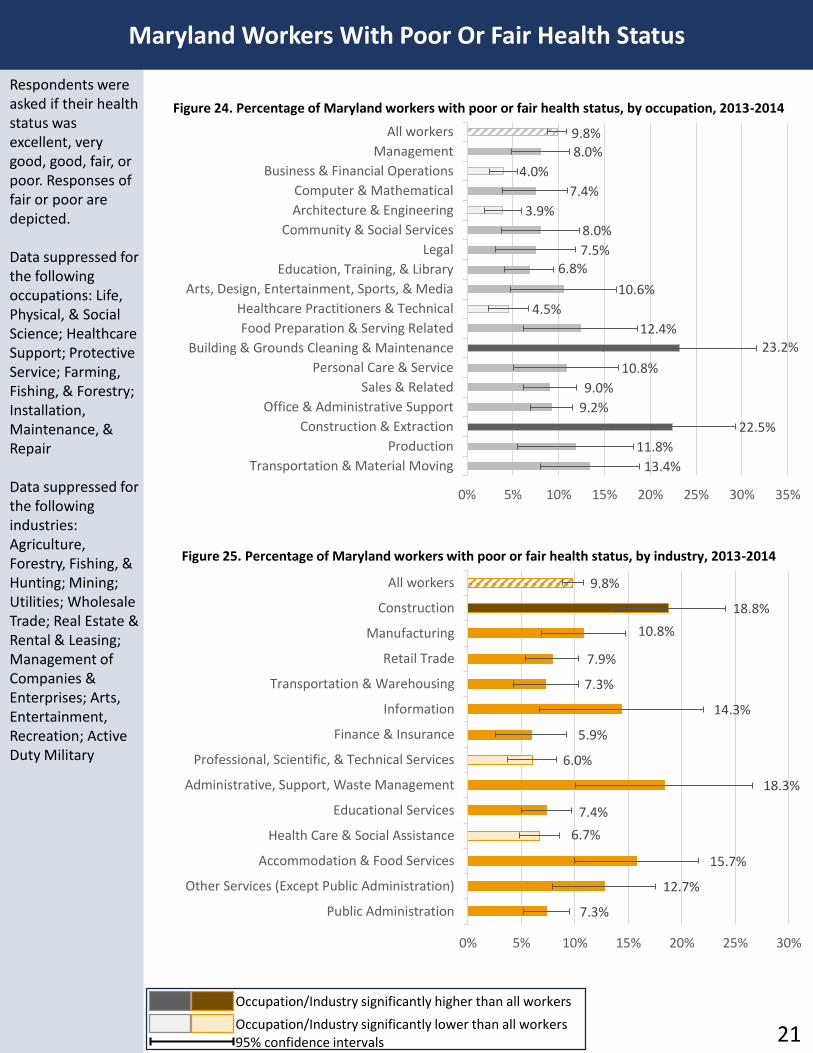
Maryland Workers With Poor Or Fair Health Status
Respondents were asked if their health status was excellent, very good, good, fair, or poor. Responses of fair or poor are depicted.
Data suppressed for the following occupations: Life, Physical, & Social Science; Healthcare Support; Protective Service; Farming, Fishing, & Forestry; Installation, Maintenance, & Repair
Data suppressed for the following industries: Agriculture, Forestry, Fishing, & Hunting; Mining; Utilities; Wholesale Trade; Real Estate & Rental & Leasing; Management of Companies & Enterprises; Arts, Entertainment, Recreation; Active Duty Military
Figure 24. Percentage of Maryland workers with poor or fair health status, by occupation, 2013-2014
Figure 25. Percentage of Maryland workers with poor or fair health status, by industry, 2013-2014
9.8%
8.0%
4.0%
7.4%
3.9%
8.0%
7.5%6.8%
10.6%
4.5%
12.4%23.2%
10.8%
9.0%
9.2%
22.5%
11.8%
13.4%
0% 5% 10% 15% 20% 25% 30% 35%
All workers
Management
Business & Financial Operations
Computer & Mathematical
Architecture & Engineering
Community & Social Services
Legal
Education, Training, & Library
Arts, Design, Entertainment, Sports, & Media
Healthcare Practitioners & Technical
Food Preparation & Serving Related
Building & Grounds Cleaning & Maintenance
Personal Care & Service
Sales & Related
Office & Administrative Support
Construction & Extraction
Production
Transportation & Material Moving
9.8%
18.8%
10.8%
7.9%
7.3%
14.3%
5.9%
6.0%
18.3%
7.4%
6.7%
15.7%
12.7%
7.3%
0% 5% 10% 15% 20% 25% 30%
All workers
Construction
Manufacturing
Retail Trade
Transportation & Warehousing
Information
Finance & Insurance
Professional, Scientific, & Technical Services
Administrative, Support, Waste Management
Educational Services
Health Care & Social Assistance
Accommodation & Food Services
Other Services (Except Public Administration)
Public Administration
21Occupation/Industry significantly lower than all workers
Occupation/Industry significantly higher than all workers
95% confidence intervals
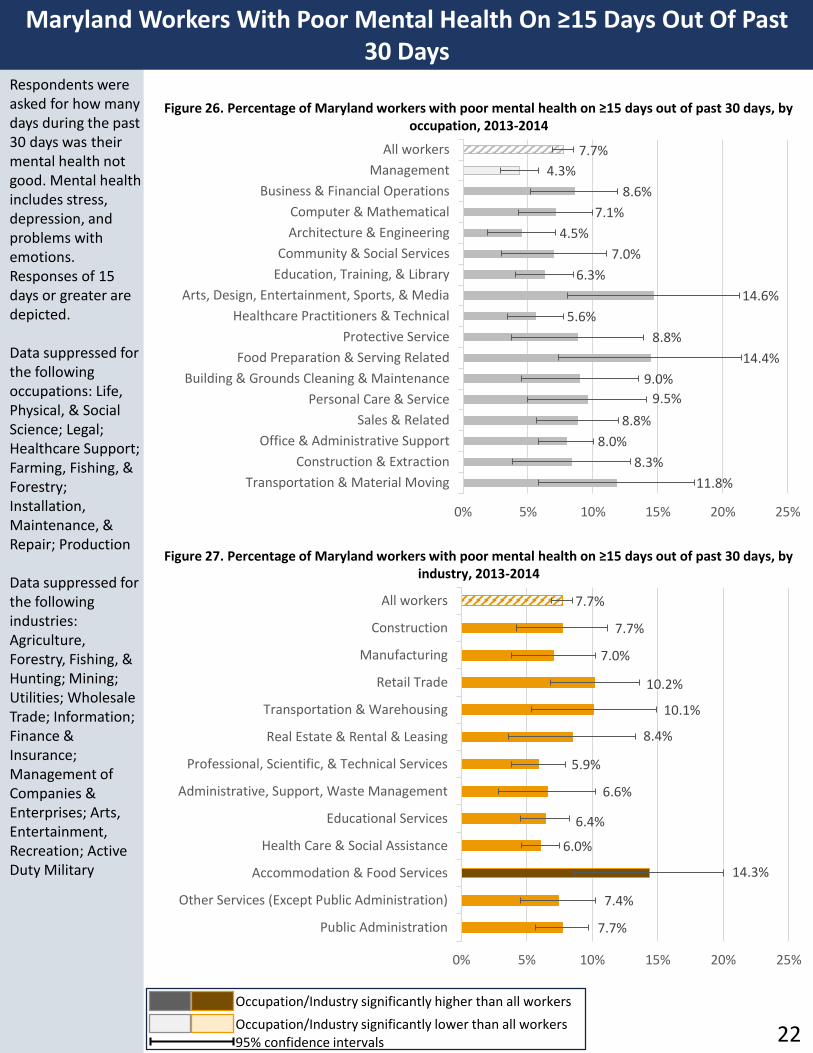
Maryland Workers With Poor Mental Health On ≥15 Days Out Of Past 30 Days
Respondents were asked for how many days during the past 30 days was their mental health not good. Mental health includes stress, depression, and problems with emotions. Responses of 15 days or greater are depicted.
Data suppressed for the following occupations: Life, Physical, & Social Science; Legal; Healthcare Support; Farming, Fishing, & Forestry; Installation, Maintenance, & Repair; Production
Data suppressed for the following industries: Agriculture, Forestry, Fishing, & Hunting; Mining; Utilities; Wholesale Trade; Information; Finance & Insurance; Management of Companies & Enterprises; Arts, Entertainment, Recreation; Active Duty Military
Figure 26. Percentage of Maryland workers with poor mental health on ≥15 days out of past 30 days, by occupation, 2013-2014
Figure 27. Percentage of Maryland workers with poor mental health on ≥15 days out of past 30 days, by industry, 2013-2014
7.7%
4.3%
8.6%
7.1%
4.5%
7.0%
6.3%
14.6%
5.6%
8.8%
14.4%
9.0%
9.5%
8.8%
8.0%
8.3%
11.8%
0% 5% 10% 15% 20% 25%
All workers
Management
Business & Financial Operations
Computer & Mathematical
Architecture & Engineering
Community & Social Services
Education, Training, & Library
Arts, Design, Entertainment, Sports, & Media
Healthcare Practitioners & Technical
Protective Service
Food Preparation & Serving Related
Building & Grounds Cleaning & Maintenance
Personal Care & Service
Sales & Related
Office & Administrative Support
Construction & Extraction
Transportation & Material Moving
7.7%
7.7%
7.0%
10.2%
10.1%
8.4%
5.9%
6.6%
6.4%
6.0%
14.3%
7.4%
7.7%
0% 5% 10% 15% 20% 25%
All workers
Construction
Manufacturing
Retail Trade
Transportation & Warehousing
Real Estate & Rental & Leasing
Professional, Scientific, & Technical Services
Administrative, Support, Waste Management
Educational Services
Health Care & Social Assistance
Accommodation & Food Services
Other Services (Except Public Administration)
Public Administration
22Occupation/Industry significantly lower than all workers
Occupation/Industry significantly higher than all workers
95% confidence intervals

Health Behavior Indicators
23
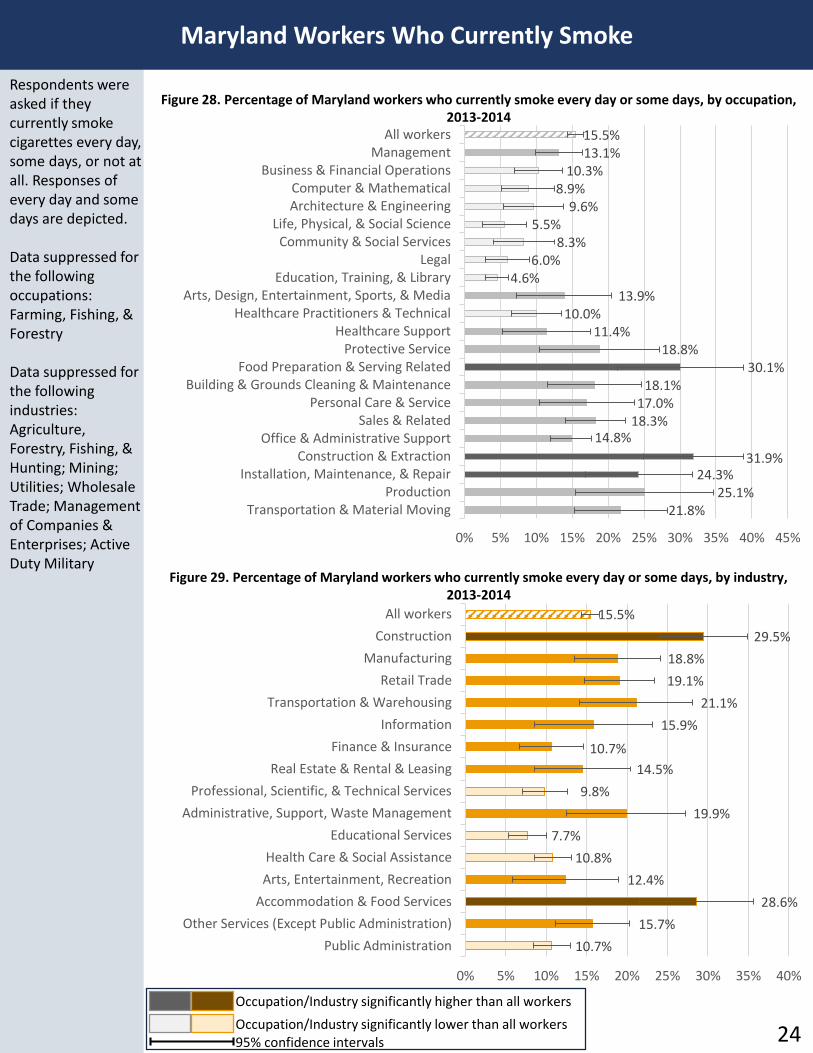
Maryland Workers Who Currently Smoke
Respondents were asked if they currently smoke cigarettes every day, some days, or not at all. Responses of every day and some days are depicted.
Data suppressed for the following occupations: Farming, Fishing, & Forestry
Data suppressed for the following industries: Agriculture, Forestry, Fishing, & Hunting; Mining; Utilities; Wholesale Trade; Management of Companies & Enterprises; Active Duty Military
Figure 28. Percentage of Maryland workers who currently smoke every day or some days, by occupation, 2013-2014
Figure 29. Percentage of Maryland workers who currently smoke every day or some days, by industry, 2013-2014
15.5%13.1%
10.3%8.9%
9.6%5.5%
8.3%6.0%
4.6%13.9%
10.0%11.4%
18.8%30.1%
18.1%17.0%
18.3%14.8%
31.9%24.3%
25.1%21.8%
0% 5% 10% 15% 20% 25% 30% 35% 40% 45%
All workersManagement
Business & Financial OperationsComputer & MathematicalArchitecture & Engineering
Life, Physical, & Social ScienceCommunity & Social Services
LegalEducation, Training, & Library
Arts, Design, Entertainment, Sports, & MediaHealthcare Practitioners & Technical
Healthcare SupportProtective Service
Food Preparation & Serving RelatedBuilding & Grounds Cleaning & Maintenance
Personal Care & ServiceSales & Related
Office & Administrative SupportConstruction & Extraction
Installation, Maintenance, & RepairProduction
Transportation & Material Moving
15.5%
29.5%
18.8%
19.1%
21.1%
15.9%
10.7%
14.5%
9.8%
19.9%
7.7%
10.8%
12.4%
28.6%
15.7%
10.7%
0% 5% 10% 15% 20% 25% 30% 35% 40%
All workers
Construction
Manufacturing
Retail Trade
Transportation & Warehousing
Information
Finance & Insurance
Real Estate & Rental & Leasing
Professional, Scientific, & Technical Services
Administrative, Support, Waste Management
Educational Services
Health Care & Social Assistance
Arts, Entertainment, Recreation
Accommodation & Food Services
Other Services (Except Public Administration)
Public Administration
24Occupation/Industry significantly lower than all workers
Occupation/Industry significantly higher than all workers
95% confidence intervals
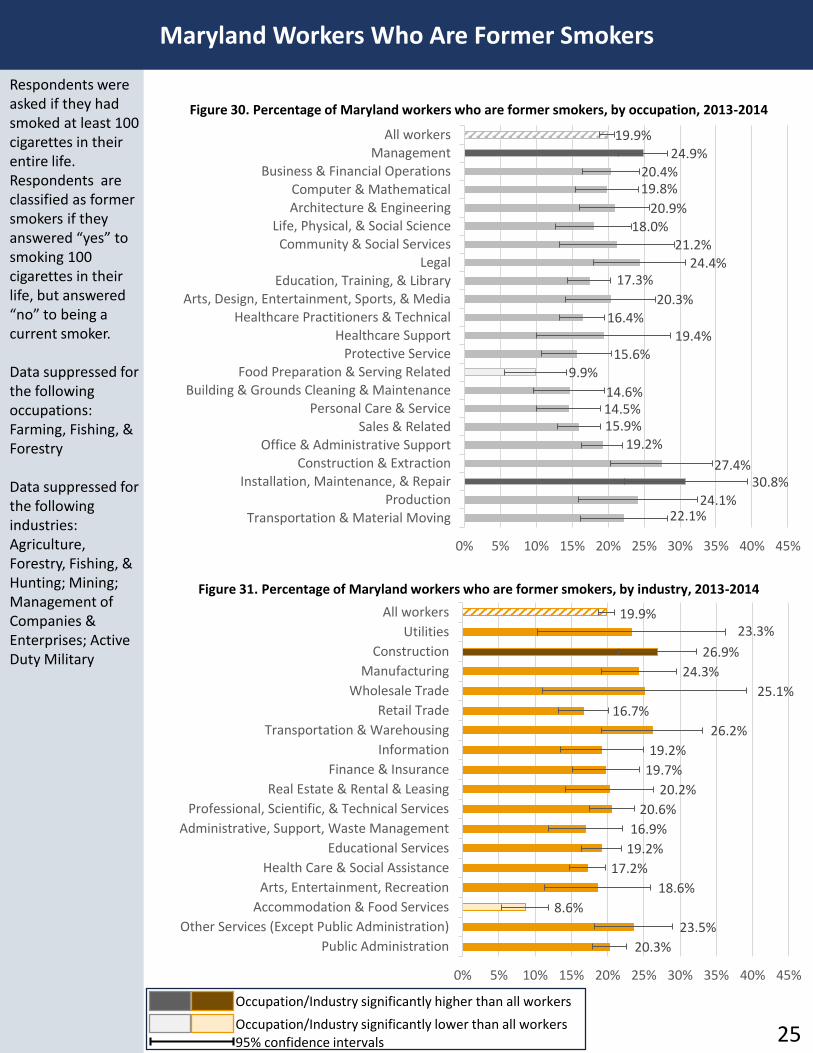
Maryland Workers Who Are Former Smokers
Respondents were asked if they had smoked at least 100 cigarettes in their entire life. Respondents are classified as former smokers if they answered “yes” to smoking 100 cigarettes in their life, but answered “no” to being a current smoker.
Data suppressed for the following occupations: Farming, Fishing, & Forestry
Data suppressed for the following industries: Agriculture, Forestry, Fishing, & Hunting; Mining; Management of Companies & Enterprises; Active Duty Military
Figure 30. Percentage of Maryland workers who are former smokers, by occupation, 2013-2014
Figure 31. Percentage of Maryland workers who are former smokers, by industry, 2013-2014
19.9%24.9%
20.4%19.8%
20.9%18.0%
21.2%24.4%
17.3%
20.3%16.4%
19.4%15.6%
9.9%
14.6%14.5%15.9%
19.2%
27.4%30.8%
24.1%22.1%
0% 5% 10% 15% 20% 25% 30% 35% 40% 45%
All workersManagement
Business & Financial OperationsComputer & MathematicalArchitecture & Engineering
Life, Physical, & Social ScienceCommunity & Social Services
LegalEducation, Training, & Library
Arts, Design, Entertainment, Sports, & MediaHealthcare Practitioners & Technical
Healthcare SupportProtective Service
Food Preparation & Serving RelatedBuilding & Grounds Cleaning & Maintenance
Personal Care & ServiceSales & Related
Office & Administrative SupportConstruction & Extraction
Installation, Maintenance, & RepairProduction
Transportation & Material Moving
19.9%23.3%
26.9%
24.3%
25.1%
16.7%
26.2%
19.2%
19.7%
20.2%
20.6%
16.9%
19.2%
17.2%
18.6%
8.6%
23.5%
20.3%
0% 5% 10% 15% 20% 25% 30% 35% 40% 45%
All workers
Utilities
Construction
Manufacturing
Wholesale Trade
Retail Trade
Transportation & Warehousing
Information
Finance & Insurance
Real Estate & Rental & Leasing
Professional, Scientific, & Technical Services
Administrative, Support, Waste Management
Educational Services
Health Care & Social Assistance
Arts, Entertainment, Recreation
Accommodation & Food Services
Other Services (Except Public Administration)
Public Administration
25Occupation/Industry significantly lower than all workers
Occupation/Industry significantly higher than all workers
95% confidence intervals
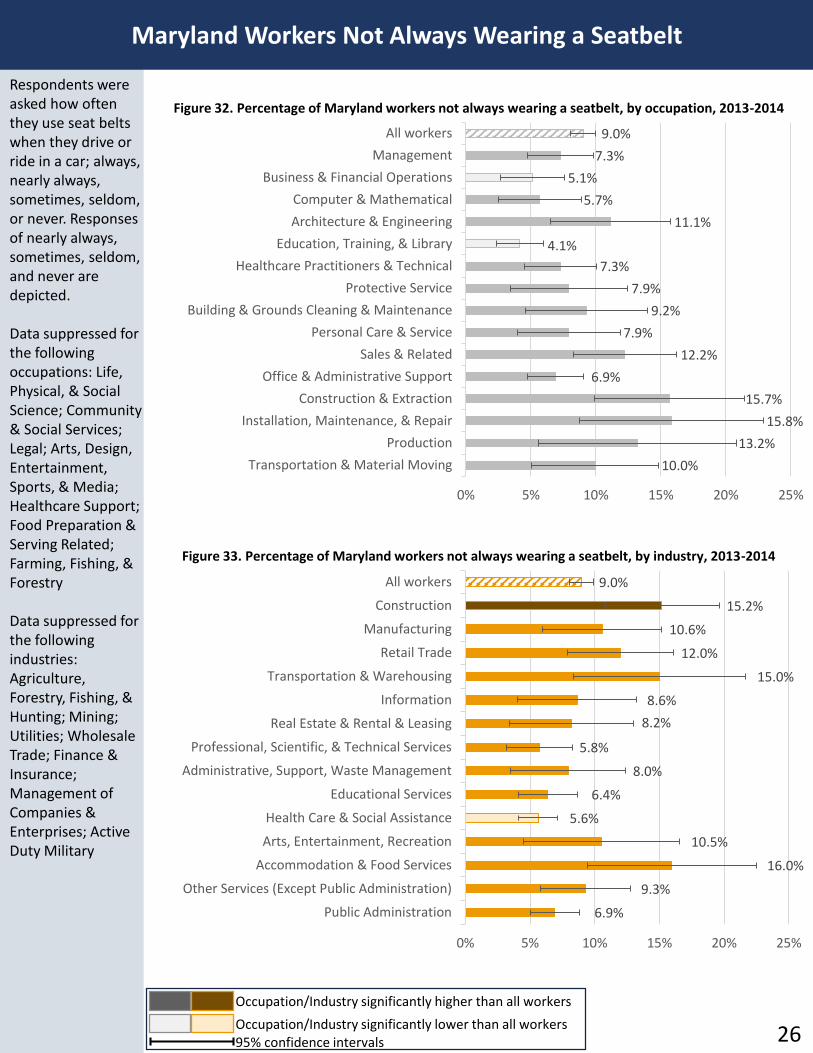
Maryland Workers Not Always Wearing a Seatbelt
Respondents were asked how often they use seat belts when they drive or ride in a car; always, nearly always, sometimes, seldom, or never. Responses of nearly always, sometimes, seldom, and never are depicted.
Data suppressed for the following occupations: Life, Physical, & Social Science; Community & Social Services; Legal; Arts, Design, Entertainment, Sports, & Media; Healthcare Support; Food Preparation & Serving Related; Farming, Fishing, & Forestry
Data suppressed for the following industries: Agriculture, Forestry, Fishing, & Hunting; Mining; Utilities; Wholesale Trade; Finance & Insurance; Management of Companies & Enterprises; Active Duty Military
Figure 32. Percentage of Maryland workers not always wearing a seatbelt, by occupation, 2013-2014
Figure 33. Percentage of Maryland workers not always wearing a seatbelt, by industry, 2013-2014
9.0%
7.3%
5.1%
5.7%
11.1%
4.1%
7.3%
7.9%
9.2%
7.9%
12.2%
6.9%
15.7%
15.8%
13.2%
10.0%
0% 5% 10% 15% 20% 25%
All workers
Management
Business & Financial Operations
Computer & Mathematical
Architecture & Engineering
Education, Training, & Library
Healthcare Practitioners & Technical
Protective Service
Building & Grounds Cleaning & Maintenance
Personal Care & Service
Sales & Related
Office & Administrative Support
Construction & Extraction
Installation, Maintenance, & Repair
Production
Transportation & Material Moving
9.0%
15.2%
10.6%
12.0%
15.0%
8.6%
8.2%
5.8%
8.0%
6.4%
5.6%
10.5%
16.0%
9.3%
6.9%
0% 5% 10% 15% 20% 25%
All workers
Construction
Manufacturing
Retail Trade
Transportation & Warehousing
Information
Real Estate & Rental & Leasing
Professional, Scientific, & Technical Services
Administrative, Support, Waste Management
Educational Services
Health Care & Social Assistance
Arts, Entertainment, Recreation
Accommodation & Food Services
Other Services (Except Public Administration)
Public Administration
26Occupation/Industry significantly lower than all workers
Occupation/Industry significantly higher than all workers
95% confidence intervals
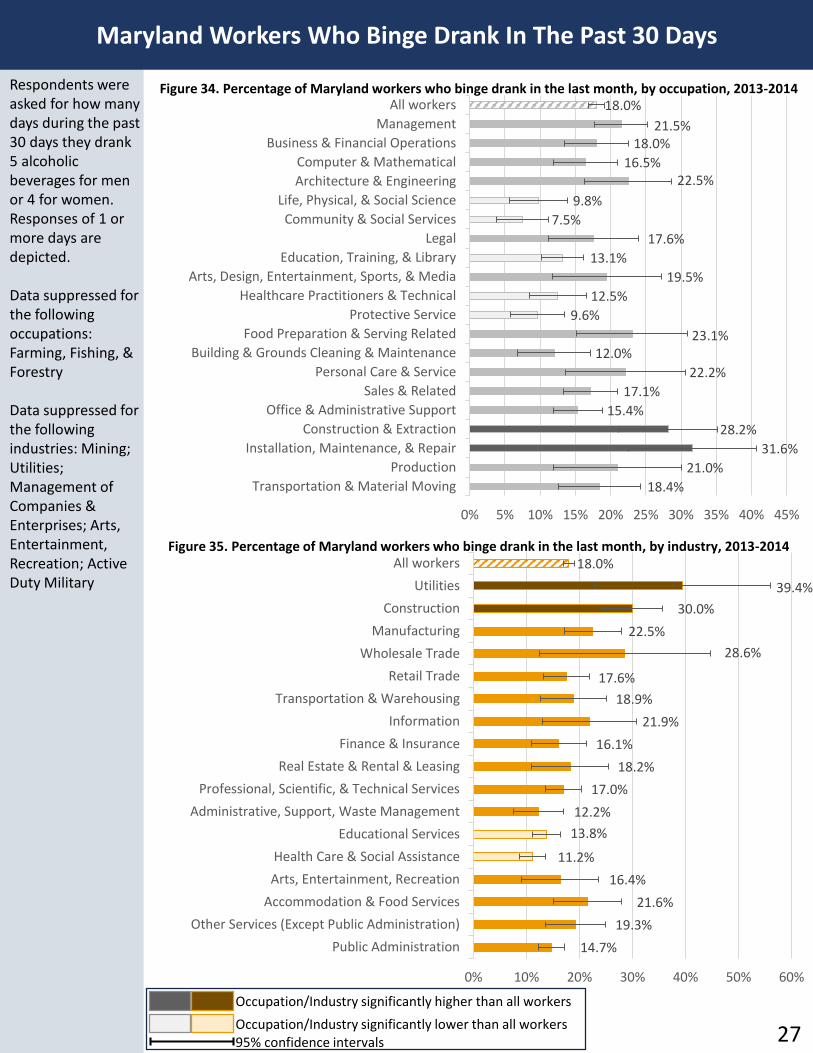
Maryland Workers Who Binge Drank In The Past 30 Days
Respondents were asked for how many days during the past 30 days they drank 5 alcoholic beverages for men or 4 for women. Responses of 1 or more days are depicted.
Data suppressed for the following occupations: Farming, Fishing, & Forestry
Data suppressed for the following industries: Mining; Utilities; Management of Companies & Enterprises; Arts, Entertainment, Recreation; Active Duty Military
Figure 34. Percentage of Maryland workers who binge drank in the last month, by occupation, 2013-2014
Figure 35. Percentage of Maryland workers who binge drank in the last month, by industry, 2013-2014
27
18.0%
21.5%18.0%
16.5%22.5%
9.8%
7.5%
17.6%
13.1%
19.5%
12.5%
9.6%
23.1%12.0%
22.2%
17.1%
15.4%
28.2%
31.6%
21.0%
18.4%
0% 5% 10% 15% 20% 25% 30% 35% 40% 45%
All workers
Management
Business & Financial Operations
Computer & Mathematical
Architecture & Engineering
Life, Physical, & Social Science
Community & Social Services
Legal
Education, Training, & Library
Arts, Design, Entertainment, Sports, & Media
Healthcare Practitioners & Technical
Protective Service
Food Preparation & Serving Related
Building & Grounds Cleaning & Maintenance
Personal Care & Service
Sales & Related
Office & Administrative Support
Construction & Extraction
Installation, Maintenance, & Repair
Production
Transportation & Material Moving
18.0%
39.4%
30.0%
22.5%
28.6%
17.6%
18.9%
21.9%
16.1%
18.2%
17.0%
12.2%
13.8%
11.2%
16.4%
21.6%
19.3%
14.7%
0% 10% 20% 30% 40% 50% 60%
All workers
Utilities
Construction
Manufacturing
Wholesale Trade
Retail Trade
Transportation & Warehousing
Information
Finance & Insurance
Real Estate & Rental & Leasing
Professional, Scientific, & Technical Services
Administrative, Support, Waste Management
Educational Services
Health Care & Social Assistance
Arts, Entertainment, Recreation
Accommodation & Food Services
Other Services (Except Public Administration)
Public Administration
Occupation/Industry significantly lower than all workers
Occupation/Industry significantly higher than all workers
95% confidence intervals
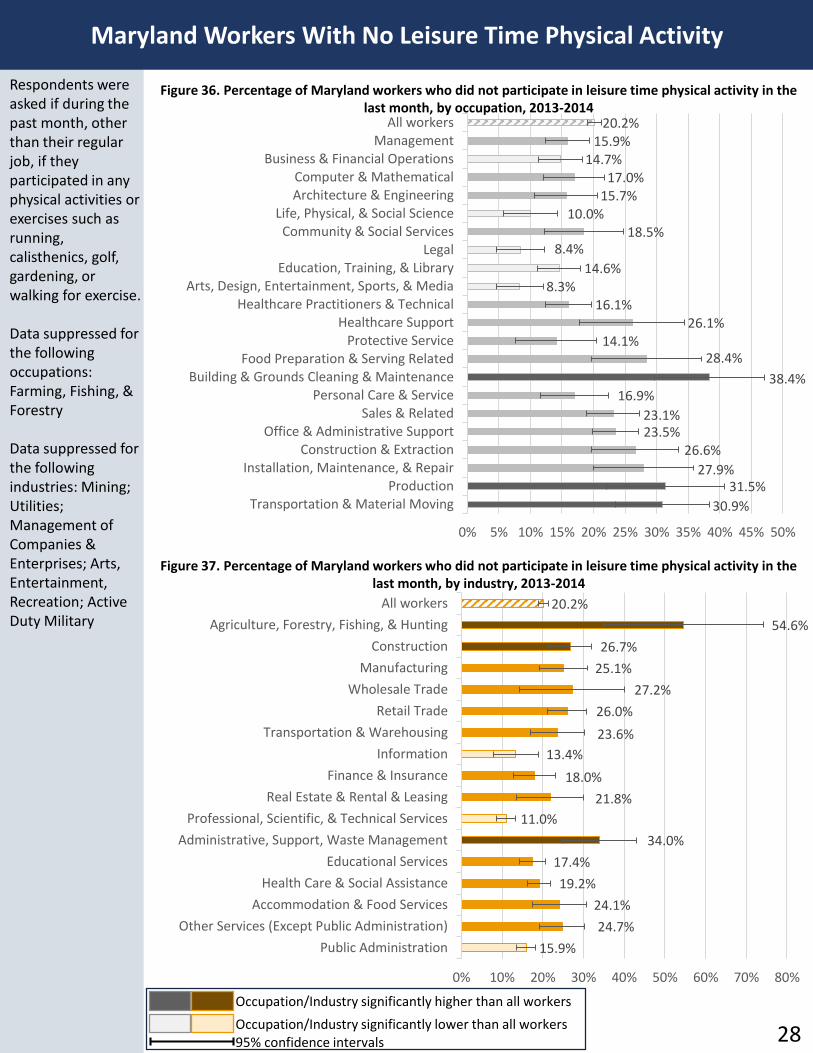
Maryland Workers With No Leisure Time Physical Activity
Respondents were asked if during the past month, other than their regular job, if they participated in any physical activities or exercises such as running, calisthenics, golf, gardening, or walking for exercise.
Data suppressed for the following occupations: Farming, Fishing, & Forestry
Data suppressed for the following industries: Mining; Utilities; Management of Companies & Enterprises; Arts, Entertainment, Recreation; Active Duty Military
Figure 36. Percentage of Maryland workers who did not participate in leisure time physical activity in the last month, by occupation, 2013-2014
Figure 37. Percentage of Maryland workers who did not participate in leisure time physical activity in the last month, by industry, 2013-2014
28
20.2%15.9%
14.7%17.0%
15.7%10.0%
18.5%8.4%
14.6%8.3%
16.1%26.1%
14.1%28.4%
38.4%16.9%
23.1%23.5%
26.6%
27.9%31.5%
30.9%
0% 5% 10% 15% 20% 25% 30% 35% 40% 45% 50%
All workersManagement
Business & Financial OperationsComputer & MathematicalArchitecture & Engineering
Life, Physical, & Social ScienceCommunity & Social Services
LegalEducation, Training, & Library
Arts, Design, Entertainment, Sports, & MediaHealthcare Practitioners & Technical
Healthcare SupportProtective Service
Food Preparation & Serving RelatedBuilding & Grounds Cleaning & Maintenance
Personal Care & ServiceSales & Related
Office & Administrative SupportConstruction & Extraction
Installation, Maintenance, & RepairProduction
Transportation & Material Moving
20.2%
54.6%
26.7%
25.1%
27.2%
26.0%
23.6%
13.4%
18.0%
21.8%
11.0%
34.0%
17.4%
19.2%
24.1%
24.7%
15.9%
0% 10% 20% 30% 40% 50% 60% 70% 80%
All workers
Agriculture, Forestry, Fishing, & Hunting
Construction
Manufacturing
Wholesale Trade
Retail Trade
Transportation & Warehousing
Information
Finance & Insurance
Real Estate & Rental & Leasing
Professional, Scientific, & Technical Services
Administrative, Support, Waste Management
Educational Services
Health Care & Social Assistance
Accommodation & Food Services
Other Services (Except Public Administration)
Public Administration
Occupation/Industry significantly lower than all workers
Occupation/Industry significantly higher than all workers
95% confidence intervals
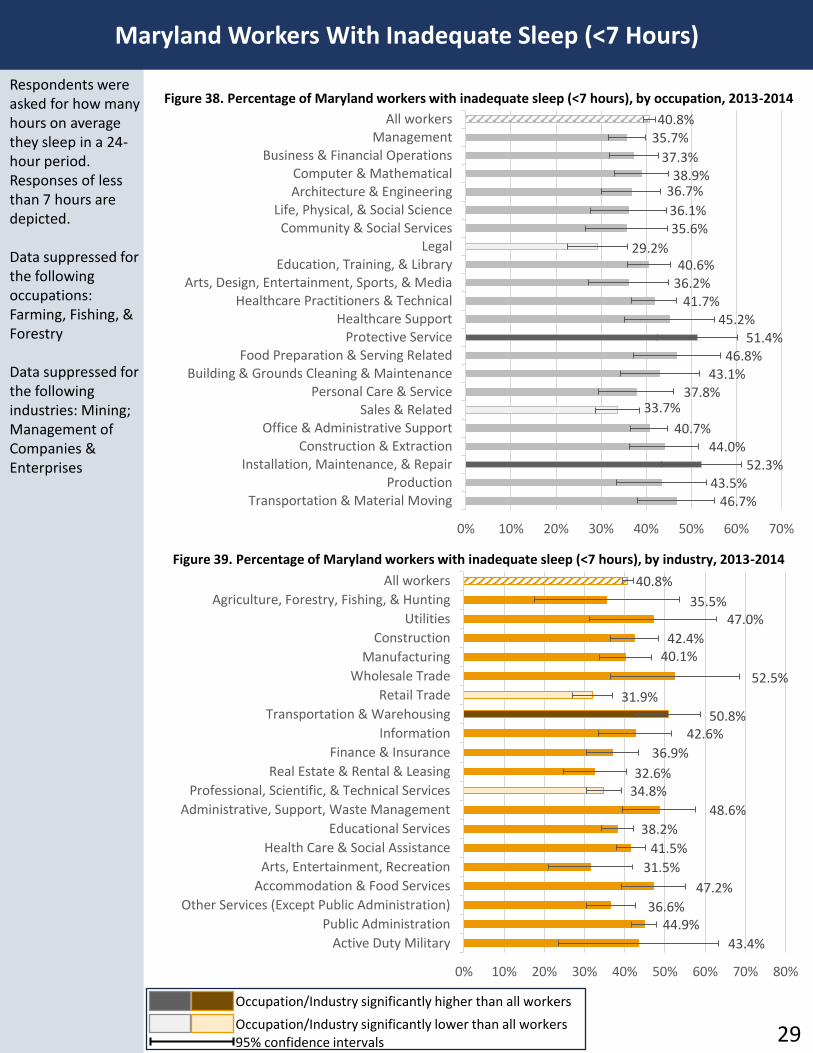
Maryland Workers With Inadequate Sleep (<7 Hours)
Respondents were asked for how many hours on average they sleep in a 24-hour period. Responses of less than 7 hours are depicted.
Data suppressed for the following occupations: Farming, Fishing, & Forestry
Data suppressed for the following industries: Mining; Management of Companies & Enterprises
Figure 38. Percentage of Maryland workers with inadequate sleep (<7 hours), by occupation, 2013-2014
Figure 39. Percentage of Maryland workers with inadequate sleep (<7 hours), by industry, 2013-2014
29
40.8%35.7%
37.3%38.9%
36.7%
36.1%35.6%
29.2%40.6%
36.2%41.7%
45.2%51.4%
46.8%43.1%
37.8%33.7%
40.7%44.0%
52.3%43.5%
46.7%
0% 10% 20% 30% 40% 50% 60% 70%
All workersManagement
Business & Financial OperationsComputer & MathematicalArchitecture & Engineering
Life, Physical, & Social ScienceCommunity & Social Services
LegalEducation, Training, & Library
Arts, Design, Entertainment, Sports, & MediaHealthcare Practitioners & Technical
Healthcare SupportProtective Service
Food Preparation & Serving RelatedBuilding & Grounds Cleaning & Maintenance
Personal Care & ServiceSales & Related
Office & Administrative SupportConstruction & Extraction
Installation, Maintenance, & RepairProduction
Transportation & Material Moving
40.8%
35.5%47.0%
42.4%40.1%
52.5%
31.9%
50.8%42.6%
36.9%
32.6%34.8%
48.6%
38.2%
41.5%
31.5%
47.2%
36.6%44.9%
43.4%
0% 10% 20% 30% 40% 50% 60% 70% 80%
All workers
Agriculture, Forestry, Fishing, & Hunting
Utilities
Construction
Manufacturing
Wholesale Trade
Retail Trade
Transportation & Warehousing
Information
Finance & Insurance
Real Estate & Rental & Leasing
Professional, Scientific, & Technical Services
Administrative, Support, Waste Management
Educational Services
Health Care & Social Assistance
Arts, Entertainment, Recreation
Accommodation & Food Services
Other Services (Except Public Administration)
Public Administration
Active Duty Military
Occupation/Industry significantly lower than all workers
Occupation/Industry significantly higher than all workers
95% confidence intervals
Healthcare Access Indicators
30
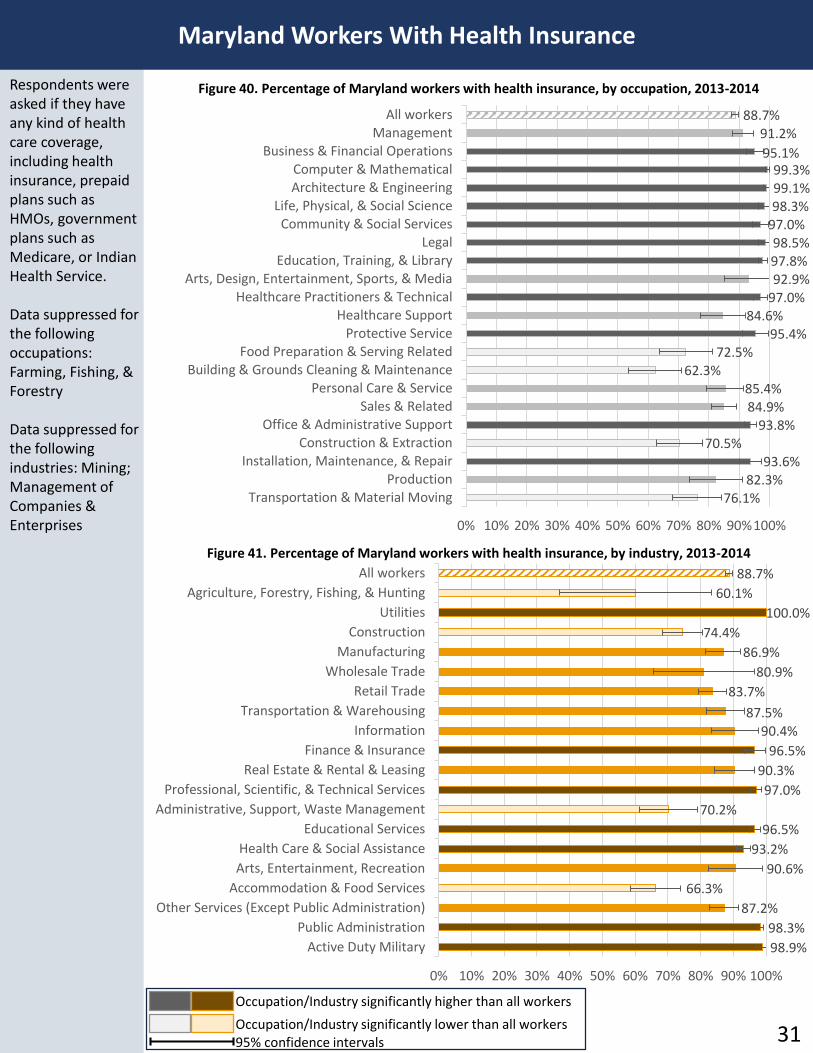
Maryland Workers With Health Insurance
Respondents were asked if they have any kind of health care coverage, including health insurance, prepaid plans such as HMOs, government plans such as Medicare, or Indian Health Service.
Data suppressed for the following occupations: Farming, Fishing, & Forestry
Data suppressed for the following industries: Mining; Management of Companies & Enterprises
Figure 40. Percentage of Maryland workers with health insurance, by occupation, 2013-2014
Figure 41. Percentage of Maryland workers with health insurance, by industry, 2013-2014
88.7%
60.1%
100.0%
74.4%
86.9%
80.9%
83.7%
87.5%90.4%
96.5%
90.3%
97.0%
70.2%
96.5%
93.2%
90.6%
66.3%
87.2%
98.3%
98.9%
0% 10% 20% 30% 40% 50% 60% 70% 80% 90% 100%
All workers
Agriculture, Forestry, Fishing, & Hunting
Utilities
Construction
Manufacturing
Wholesale Trade
Retail Trade
Transportation & Warehousing
Information
Finance & Insurance
Real Estate & Rental & Leasing
Professional, Scientific, & Technical Services
Administrative, Support, Waste Management
Educational Services
Health Care & Social Assistance
Arts, Entertainment, Recreation
Accommodation & Food Services
Other Services (Except Public Administration)
Public Administration
Active Duty Military
88.7%91.2%
95.1%99.3%99.1%98.3%
97.0%98.5%97.8%92.9%
97.0%84.6%
95.4%72.5%
62.3%85.4%84.9%
93.8%70.5%
93.6%82.3%
76.1%
0% 10% 20% 30% 40% 50% 60% 70% 80% 90%100%
All workersManagement
Business & Financial OperationsComputer & MathematicalArchitecture & Engineering
Life, Physical, & Social ScienceCommunity & Social Services
LegalEducation, Training, & Library
Arts, Design, Entertainment, Sports, & MediaHealthcare Practitioners & Technical
Healthcare SupportProtective Service
Food Preparation & Serving RelatedBuilding & Grounds Cleaning & Maintenance
Personal Care & ServiceSales & Related
Office & Administrative SupportConstruction & Extraction
Installation, Maintenance, & RepairProduction
Transportation & Material Moving
31Occupation/Industry significantly lower than all workers
Occupation/Industry significantly higher than all workers
95% confidence intervals
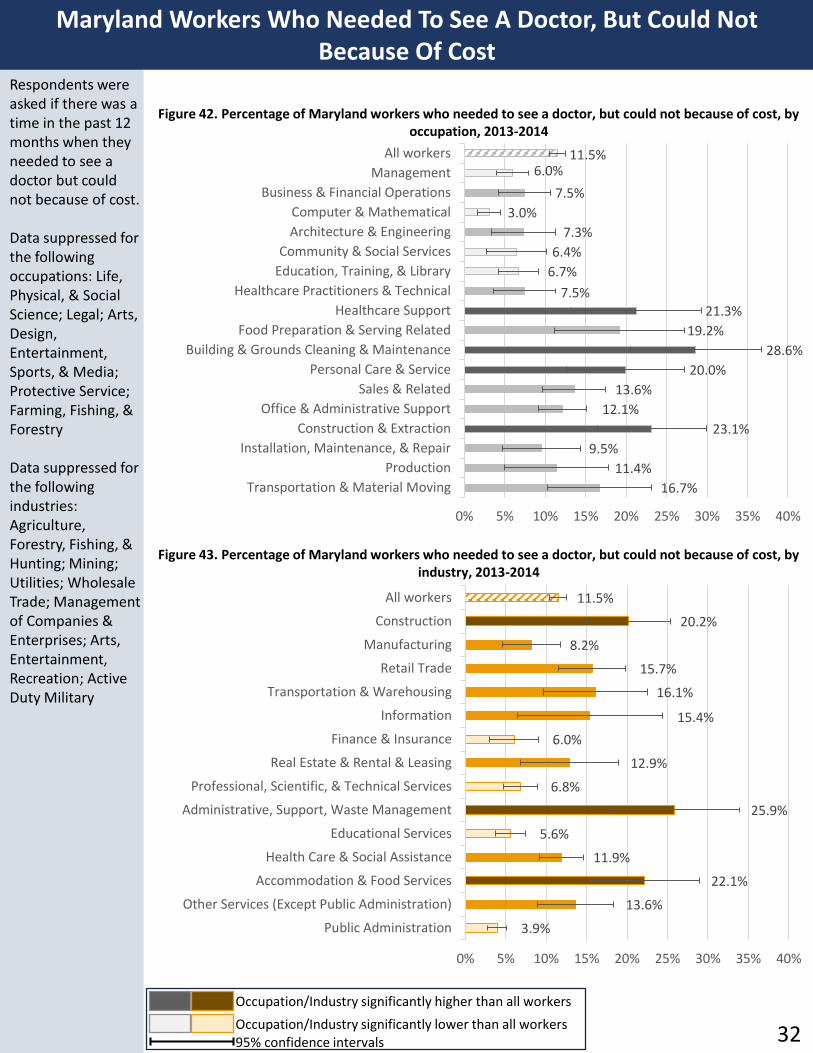
Maryland Workers Who Needed To See A Doctor, But Could Not Because Of Cost
Respondents were asked if there was a time in the past 12 months when they needed to see a doctor but could not because of cost.
Data suppressed for the following occupations: Life, Physical, & Social Science; Legal; Arts, Design, Entertainment, Sports, & Media; Protective Service; Farming, Fishing, & Forestry
Data suppressed for the following industries: Agriculture, Forestry, Fishing, & Hunting; Mining; Utilities; Wholesale Trade; Management of Companies & Enterprises; Arts, Entertainment, Recreation; Active Duty Military
Figure 42. Percentage of Maryland workers who needed to see a doctor, but could not because of cost, by occupation, 2013-2014
Figure 43. Percentage of Maryland workers who needed to see a doctor, but could not because of cost, by industry, 2013-2014
11.5%6.0%
7.5%
3.0%
7.3%
6.4%
6.7%
7.5%21.3%
19.2%
28.6%
20.0%
13.6%
12.1%
23.1%
9.5%
11.4%
16.7%
0% 5% 10% 15% 20% 25% 30% 35% 40%
All workers
Management
Business & Financial Operations
Computer & Mathematical
Architecture & Engineering
Community & Social Services
Education, Training, & Library
Healthcare Practitioners & Technical
Healthcare Support
Food Preparation & Serving Related
Building & Grounds Cleaning & Maintenance
Personal Care & Service
Sales & Related
Office & Administrative Support
Construction & Extraction
Installation, Maintenance, & Repair
Production
Transportation & Material Moving
11.5%
20.2%
8.2%
15.7%
16.1%
15.4%
6.0%
12.9%
6.8%
25.9%
5.6%
11.9%
22.1%
13.6%
3.9%
0% 5% 10% 15% 20% 25% 30% 35% 40%
All workers
Construction
Manufacturing
Retail Trade
Transportation & Warehousing
Information
Finance & Insurance
Real Estate & Rental & Leasing
Professional, Scientific, & Technical Services
Administrative, Support, Waste Management
Educational Services
Health Care & Social Assistance
Accommodation & Food Services
Other Services (Except Public Administration)
Public Administration
32Occupation/Industry significantly lower than all workers
Occupation/Industry significantly higher than all workers
95% confidence intervals
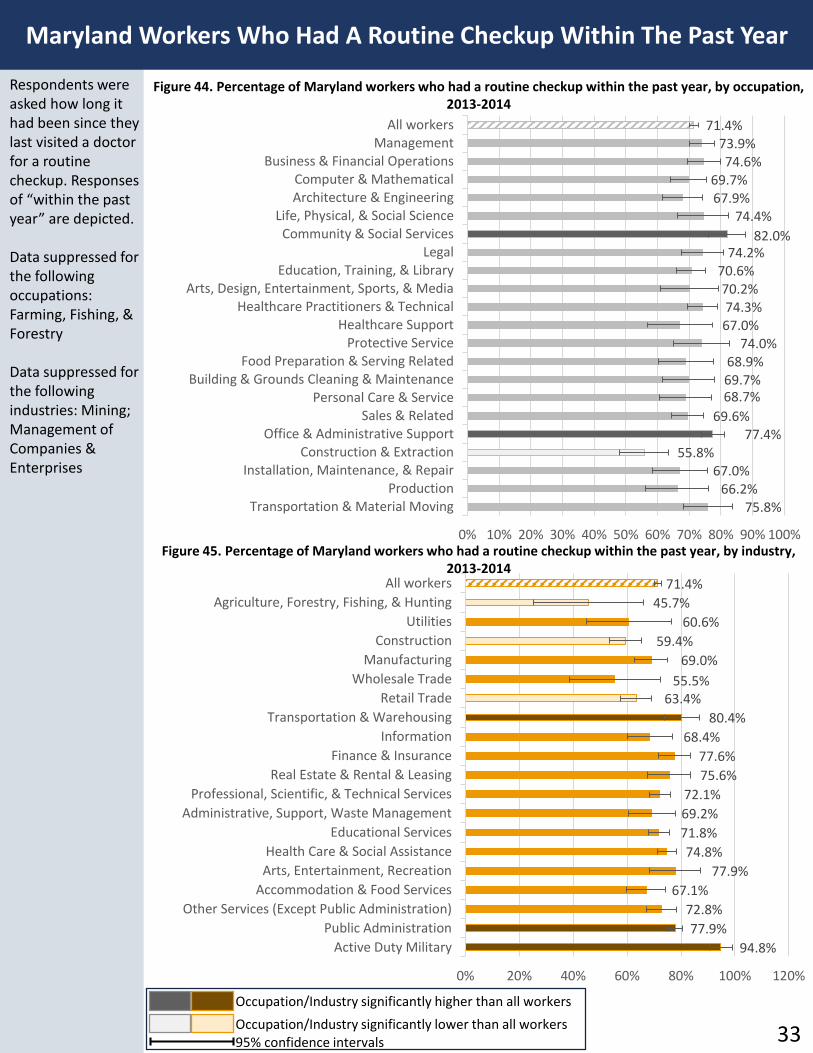
Maryland Workers Who Had A Routine Checkup Within The Past Year
Respondents were asked how long it had been since they last visited a doctor for a routine checkup. Responses of “within the past year” are depicted.
Data suppressed for the following occupations: Farming, Fishing, & Forestry
Data suppressed for the following industries: Mining; Management of Companies & Enterprises
Figure 44. Percentage of Maryland workers who had a routine checkup within the past year, by occupation, 2013-2014
Figure 45. Percentage of Maryland workers who had a routine checkup within the past year, by industry, 2013-2014
71.4%73.9%74.6%
69.7%67.9%
74.4%
82.0%74.2%
70.6%70.2%74.3%67.0%
74.0%68.9%69.7%68.7%
69.6%77.4%
55.8%67.0%
66.2%75.8%
0% 10% 20% 30% 40% 50% 60% 70% 80% 90% 100%
All workersManagement
Business & Financial OperationsComputer & MathematicalArchitecture & Engineering
Life, Physical, & Social ScienceCommunity & Social Services
LegalEducation, Training, & Library
Arts, Design, Entertainment, Sports, & MediaHealthcare Practitioners & Technical
Healthcare SupportProtective Service
Food Preparation & Serving RelatedBuilding & Grounds Cleaning & Maintenance
Personal Care & ServiceSales & Related
Office & Administrative SupportConstruction & Extraction
Installation, Maintenance, & RepairProduction
Transportation & Material Moving
71.4%
45.7%
60.6%
59.4%
69.0%
55.5%63.4%
80.4%
68.4%
77.6%
75.6%
72.1%
69.2%
71.8%
74.8%
77.9%
67.1%
72.8%
77.9%
94.8%
0% 20% 40% 60% 80% 100% 120%
All workers
Agriculture, Forestry, Fishing, & Hunting
Utilities
Construction
Manufacturing
Wholesale Trade
Retail Trade
Transportation & Warehousing
Information
Finance & Insurance
Real Estate & Rental & Leasing
Professional, Scientific, & Technical Services
Administrative, Support, Waste Management
Educational Services
Health Care & Social Assistance
Arts, Entertainment, Recreation
Accommodation & Food Services
Other Services (Except Public Administration)
Public Administration
Active Duty Military
33Occupation/Industry significantly lower than all workers
Occupation/Industry significantly higher than all workers
95% confidence intervals
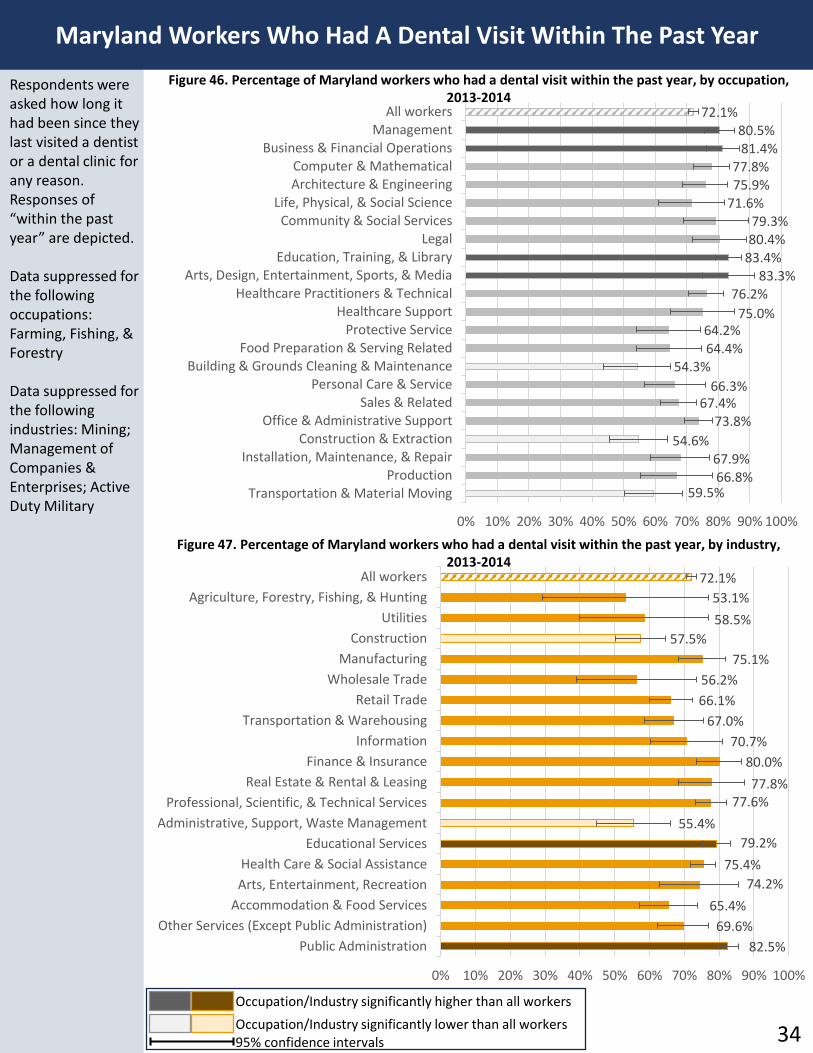
Maryland Workers Who Had A Dental Visit Within The Past Year
Respondents were asked how long it had been since they last visited a dentist or a dental clinic for any reason. Responses of “within the past year” are depicted.
Data suppressed for the following occupations: Farming, Fishing, & Forestry
Data suppressed for the following industries: Mining; Management of Companies & Enterprises; Active Duty Military
Figure 46. Percentage of Maryland workers who had a dental visit within the past year, by occupation, 2013-2014
Figure 47. Percentage of Maryland workers who had a dental visit within the past year, by industry, 2013-2014
34
72.1%80.5%81.4%
77.8%75.9%
71.6%79.3%80.4%
83.4%83.3%
76.2%
75.0%64.2%64.4%
54.3%
66.3%67.4%
73.8%
54.6%67.9%66.8%
59.5%
0% 10% 20% 30% 40% 50% 60% 70% 80% 90% 100%
All workersManagement
Business & Financial OperationsComputer & MathematicalArchitecture & Engineering
Life, Physical, & Social ScienceCommunity & Social Services
LegalEducation, Training, & Library
Arts, Design, Entertainment, Sports, & MediaHealthcare Practitioners & Technical
Healthcare SupportProtective Service
Food Preparation & Serving RelatedBuilding & Grounds Cleaning & Maintenance
Personal Care & ServiceSales & Related
Office & Administrative SupportConstruction & Extraction
Installation, Maintenance, & RepairProduction
Transportation & Material Moving
72.1%
53.1%
58.5%
57.5%
75.1%
56.2%
66.1%
67.0%
70.7%
80.0%
77.8%77.6%
55.4%
79.2%
75.4%
74.2%
65.4%
69.6%
82.5%
0% 10% 20% 30% 40% 50% 60% 70% 80% 90% 100%
All workers
Agriculture, Forestry, Fishing, & Hunting
Utilities
Construction
Manufacturing
Wholesale Trade
Retail Trade
Transportation & Warehousing
Information
Finance & Insurance
Real Estate & Rental & Leasing
Professional, Scientific, & Technical Services
Administrative, Support, Waste Management
Educational Services
Health Care & Social Assistance
Arts, Entertainment, Recreation
Accommodation & Food Services
Other Services (Except Public Administration)
Public Administration
Occupation/Industry significantly lower than all workers
Occupation/Industry significantly higher than all workers
95% confidence intervals
Resources
35
For more information on occupational
health in Maryland:
Maryland Occupational Health and
Safety website
Environmental Health Helpline:1-866-703-3266
Environmental Health email:
1. Maryland Occupation Health and Safety Surveillance Project
https://phpa.health.maryland.gov/OEHFP/EH/Pages/occupational-
safety-and-health-in-maryland.aspx
2. Maryland Behavioral Risk Factor Surveillance System
https://phpa.health.maryland.gov/ccdpc/Reports/Pages/brfss.aspx
3. CDC Behavioral Risk Factor Surveillance System
https://www.cdc.gov/brfss/
4. The National Institute for Occupational Safety and Health (NIOSH)
Behavioral Risk Factor Surveillance System Data
https://www.cdc.gov/niosh/topics/surveillance/brfss/default.html