Embed Size (px)
Citation preview

Industry Trends from Geonetric’s 2018 Healthcare Digital Marketing Survey
Survey Methodology
• Data Collection
• Partnership with eHealthcare Strategy & Trends
• Peer groups & segmentation
• Outside coding
• Insight-centered presentation
8
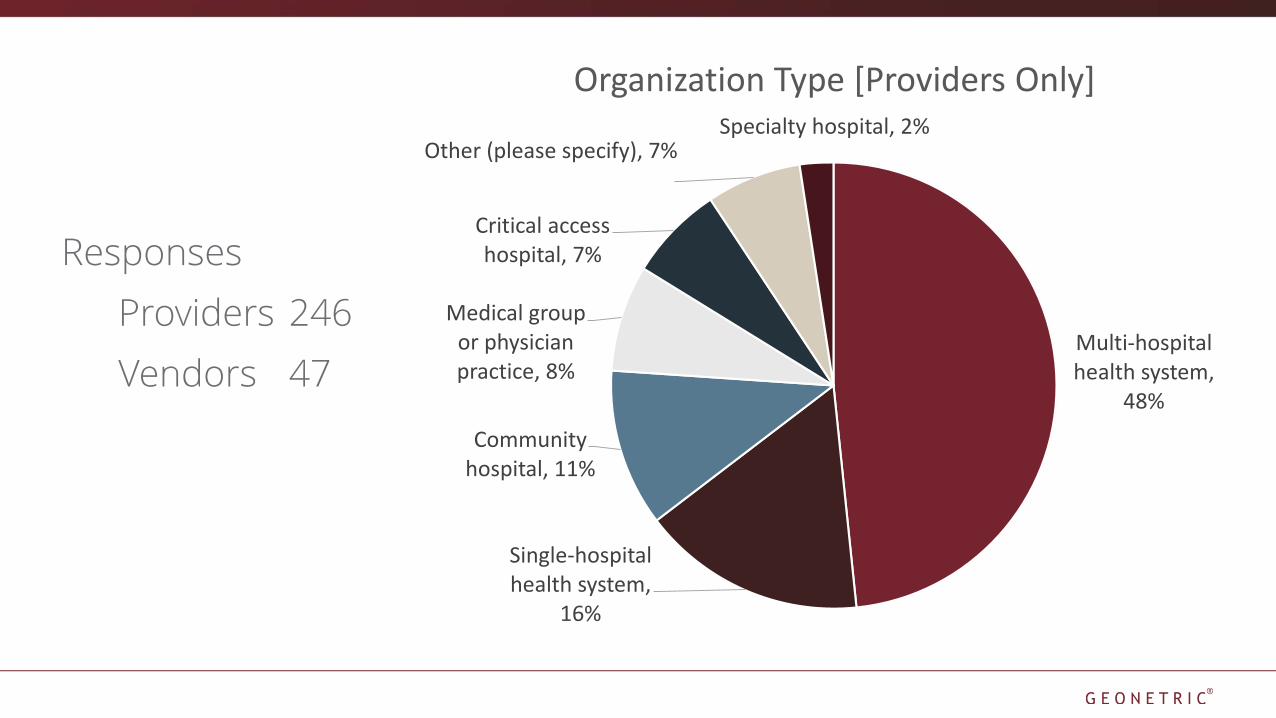
Responses
Providers 246
Vendors 47Multi-hospital health system,
48%
Single-hospital health system,
16%
Community hospital, 11%
Medical group or physician practice, 8%
Critical access hospital, 7%
Other (please specify), 7%Specialty hospital, 2%
Organization Type [Providers Only]

Content is HardThe Struggle Is Real
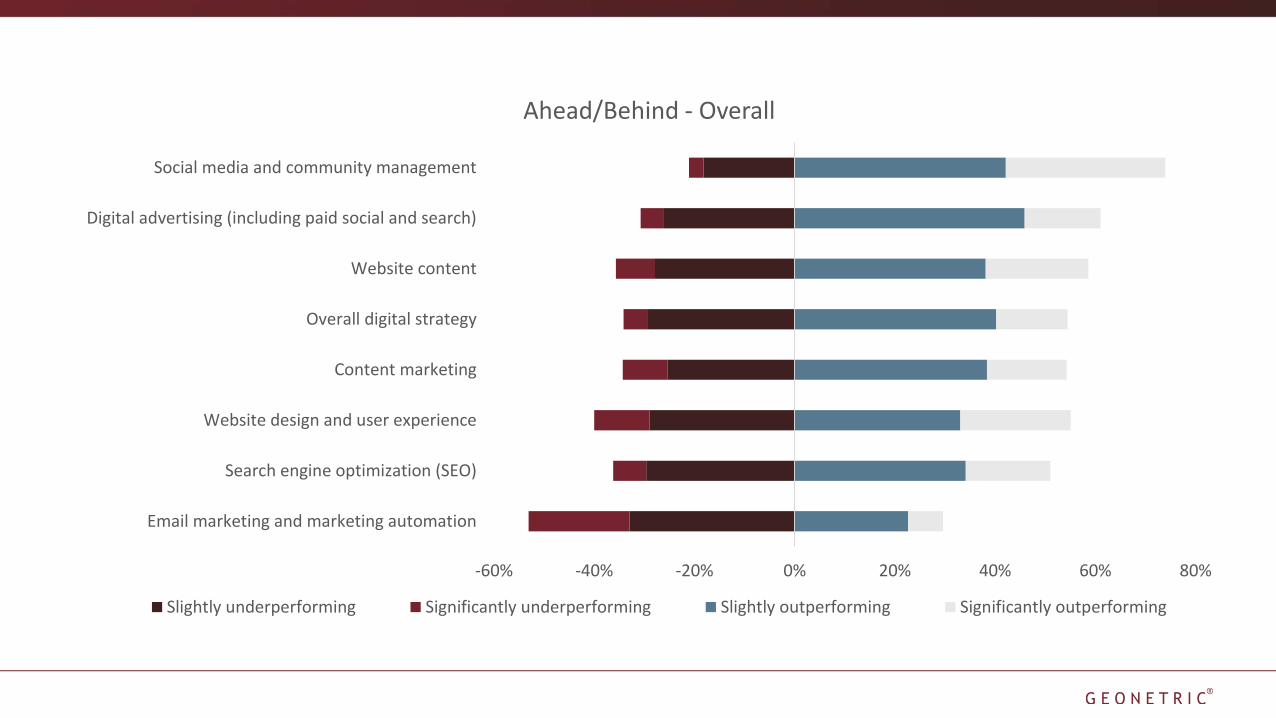
-60% -40% -20% 0% 20% 40% 60% 80%
Email marketing and marketing automation
Search engine optimization (SEO)
Website design and user experience
Content marketing
Overall digital strategy
Website content
Digital advertising (including paid social and search)
Social media and community management
Ahead/Behind - Overall
Slightly underperforming Significantly underperforming Slightly outperforming Significantly outperforming
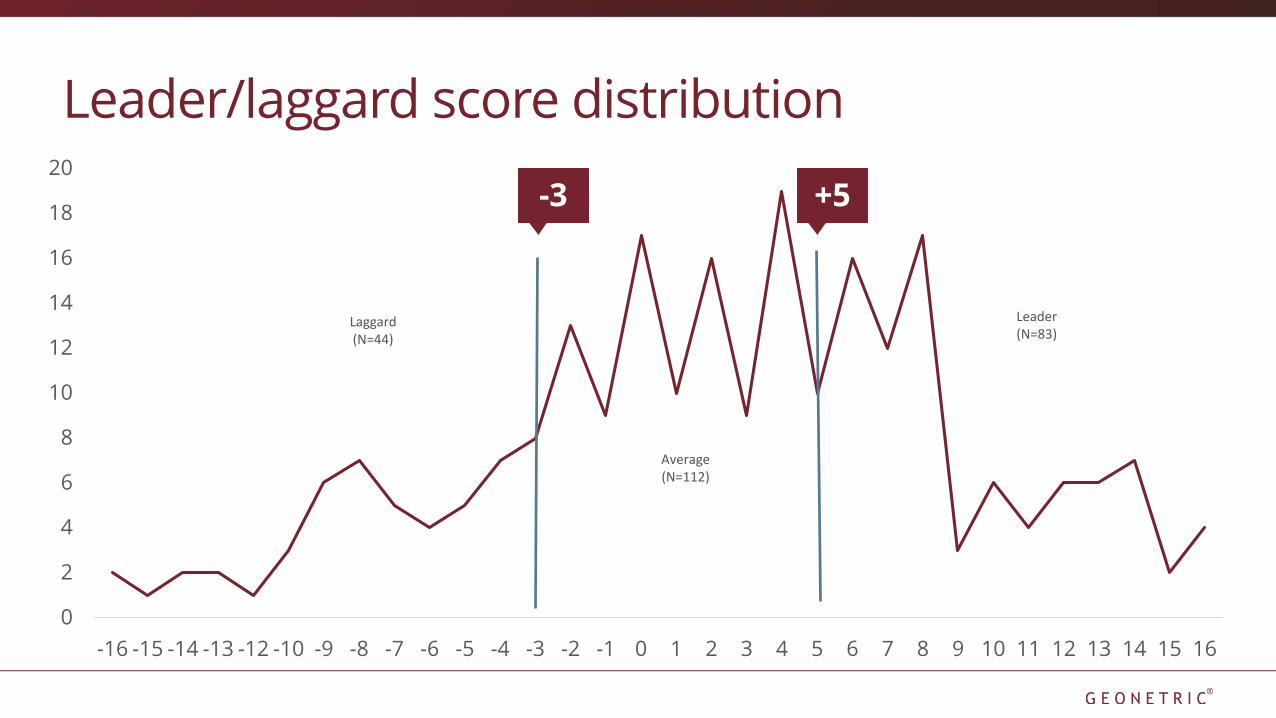
Leader/laggard score distribution
0
2
4
6
8
10
12
14
16
18
20
-16 -15 -14 -13 -12 -10 -9 -8 -7 -6 -5 -4 -3 -2 -1 0 1 2 3 4 5 6 7 8 9 10 11 12 13 14 15 16
Laggard(N=44)
Average(N=112)
Leader(N=83)
-3 +5
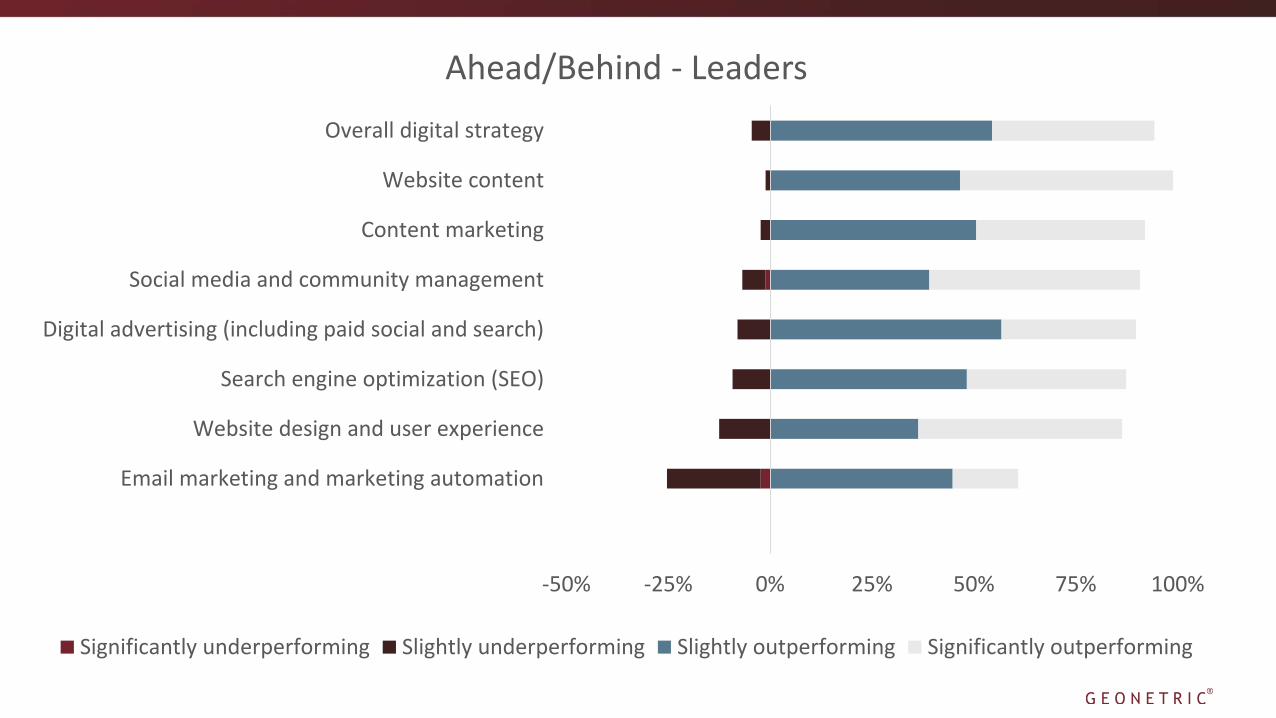
-50% -25% 0% 25% 50% 75% 100%
Overall digital strategy
Website content
Content marketing
Social media and community management
Digital advertising (including paid social and search)
Search engine optimization (SEO)
Website design and user experience
Email marketing and marketing automation
Ahead/Behind - Leaders
Significantly underperforming Slightly underperforming Slightly outperforming Significantly outperforming

Hospitals Want PatientsBut Are They Getting Them?
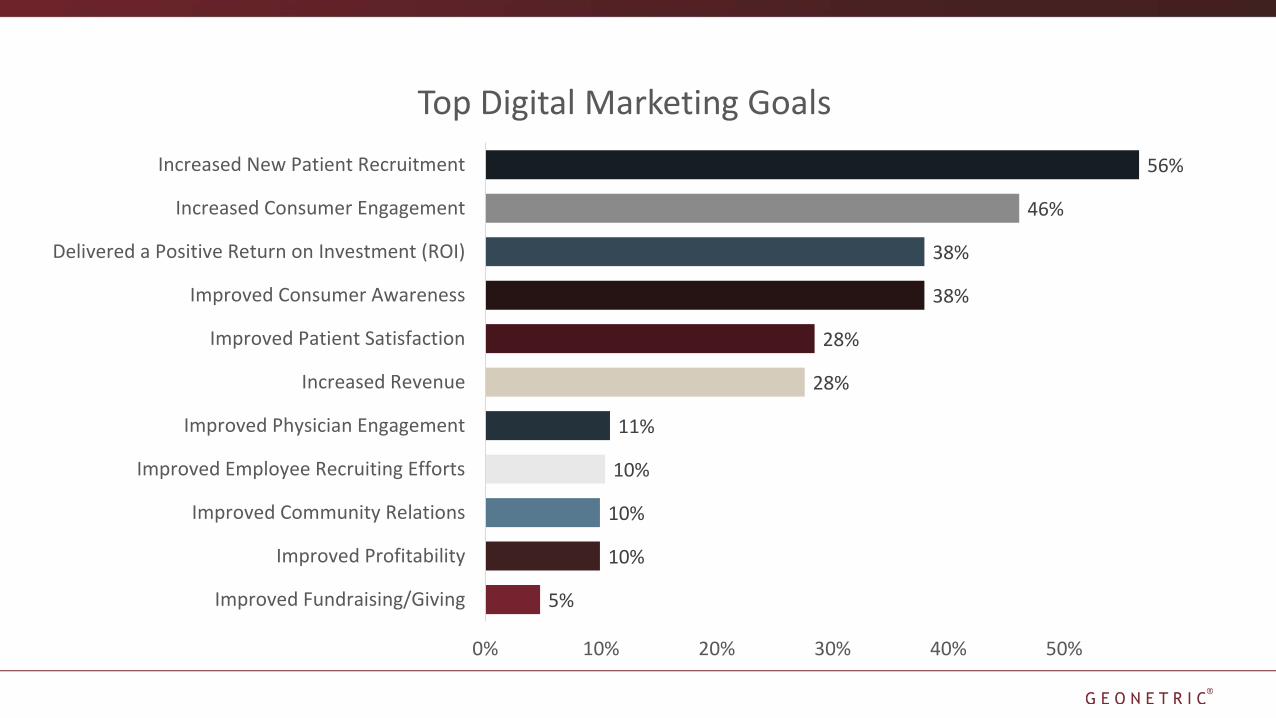
5%
10%
10%
10%
11%
28%
28%
38%
38%
46%
56%
0% 10% 20% 30% 40% 50%
Improved Fundraising/Giving
Improved Profitability
Improved Community Relations
Improved Employee Recruiting Efforts
Improved Physician Engagement
Increased Revenue
Improved Patient Satisfaction
Improved Consumer Awareness
Delivered a Positive Return on Investment (ROI)
Increased Consumer Engagement
Increased New Patient Recruitment
Top Digital Marketing Goals
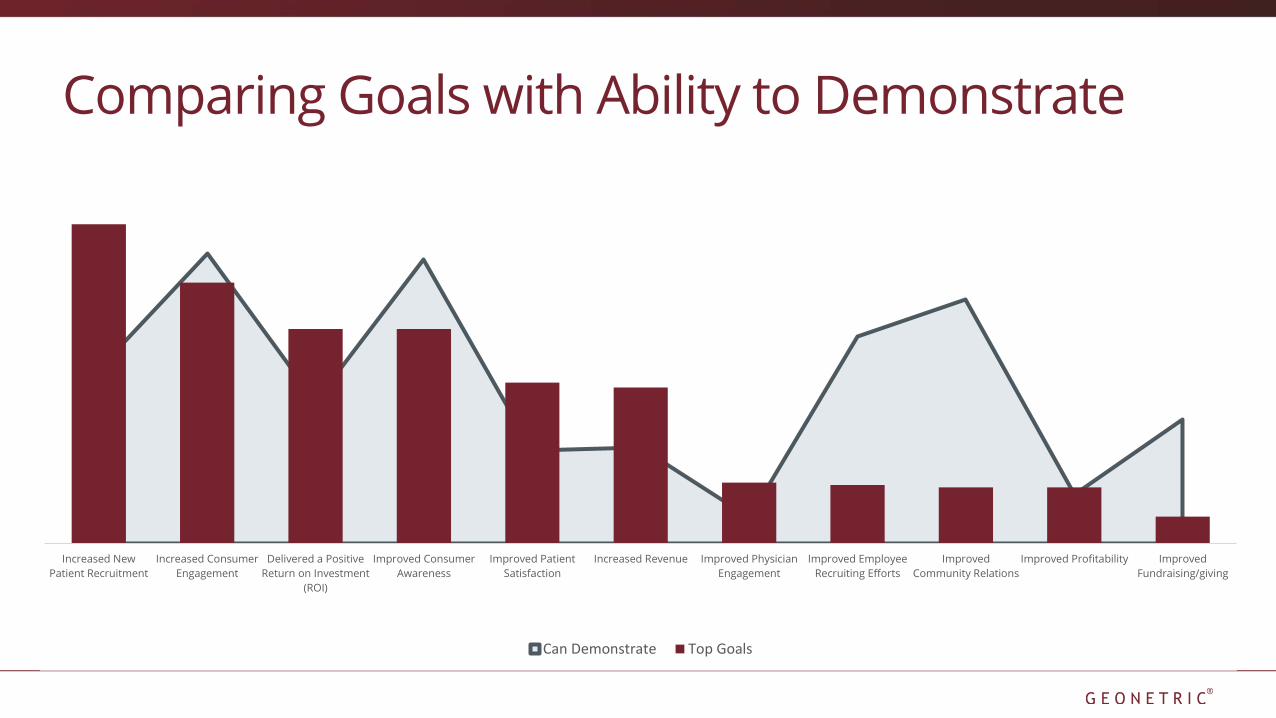
Comparing Goals with Ability to Demonstrate
Increased New
Patient Recruitment
Increased Consumer
Engagement
Delivered a Positive
Return on Investment
(ROI)
Improved Consumer
Awareness
Improved Patient
Satisfaction
Increased Revenue Improved Physician
Engagement
Improved Employee
Recruiting Efforts
Improved
Community Relations
Improved Profitability Improved
Fundraising/giving
Can Demonstrate Top Goals
Emerging Challenges:Operational Integration & Digital Strategy
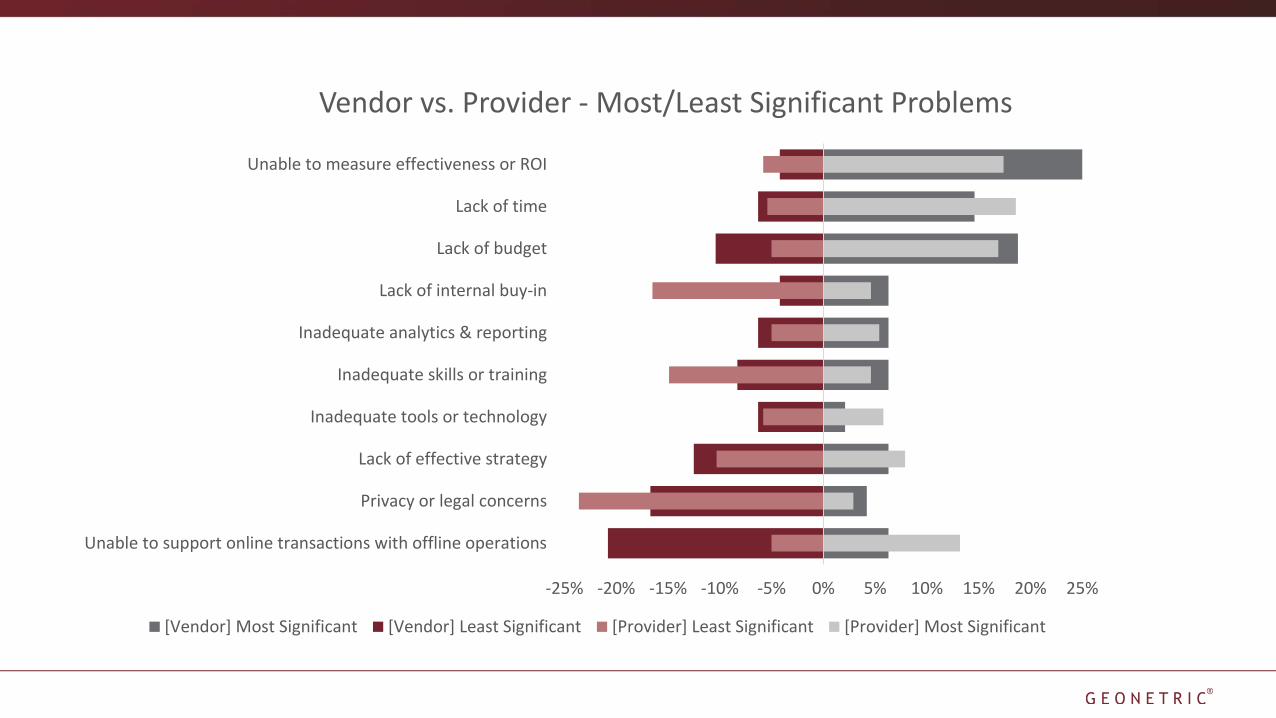
-25% -20% -15% -10% -5% 0% 5% 10% 15% 20% 25%
Unable to support online transactions with offline operations
Privacy or legal concerns
Lack of effective strategy
Inadequate tools or technology
Inadequate skills or training
Inadequate analytics & reporting
Lack of internal buy-in
Lack of budget
Lack of time
Unable to measure effectiveness or ROI
Vendor vs. Provider - Most/Least Significant Problems
[Vendor] Most Significant [Vendor] Least Significant [Provider] Least Significant [Provider] Most Significant
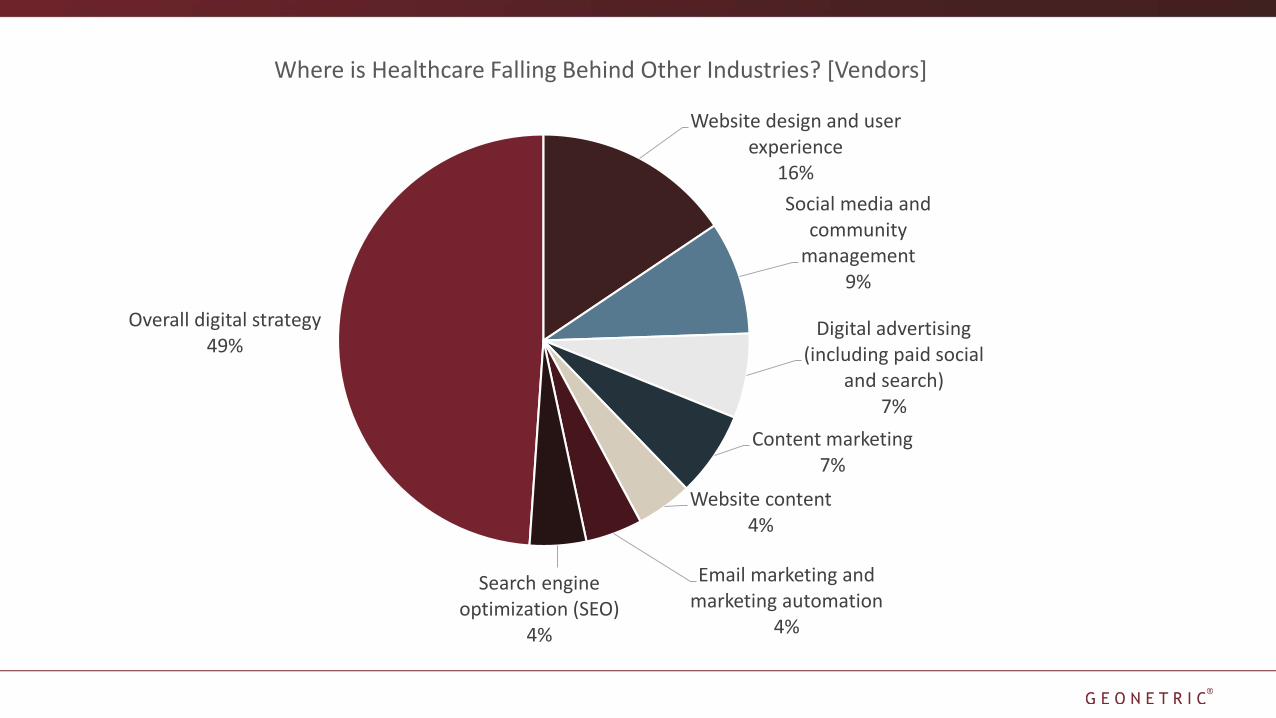
Overall digital strategy49%
Website design and user experience
16%
Social media and community
management9%
Digital advertising (including paid social
and search)7%
Content marketing7%
Website content4%
Email marketing and marketing automation
4%
Search engine optimization (SEO)
4%
Where is Healthcare Falling Behind Other Industries? [Vendors]
Hot Jobs in Healthcare:Content, CRM, Social, & Marketing Automation
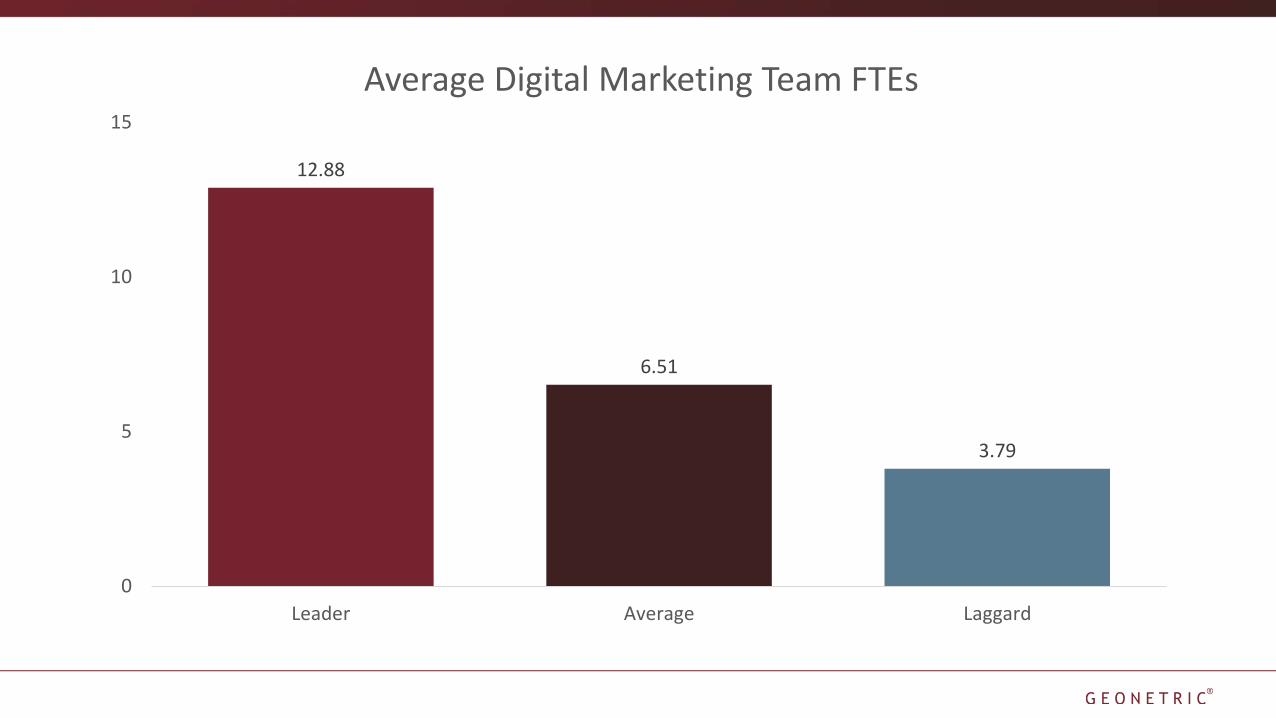
12.88
6.51
3.79
0
5
10
15
Leader Average Laggard
Average Digital Marketing Team FTEs
0% 10% 20% 30% 40% 50% 60% 70% 80% 90% 100%
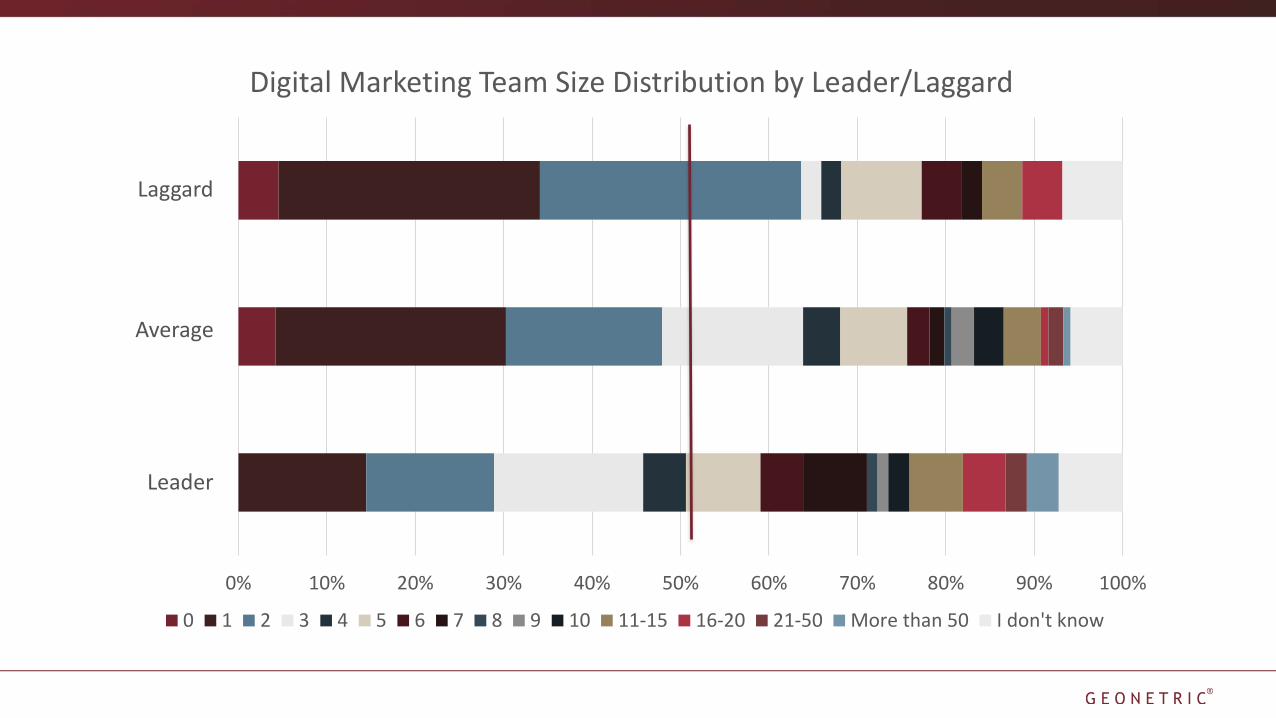
Digital Marketing Team Size Distribution by Leader/Laggard
0 1 2 3 4 5 6 7 8 9 10 11-15 16-20 21-50 More than 50 I don't know
Average
Laggard
Leader
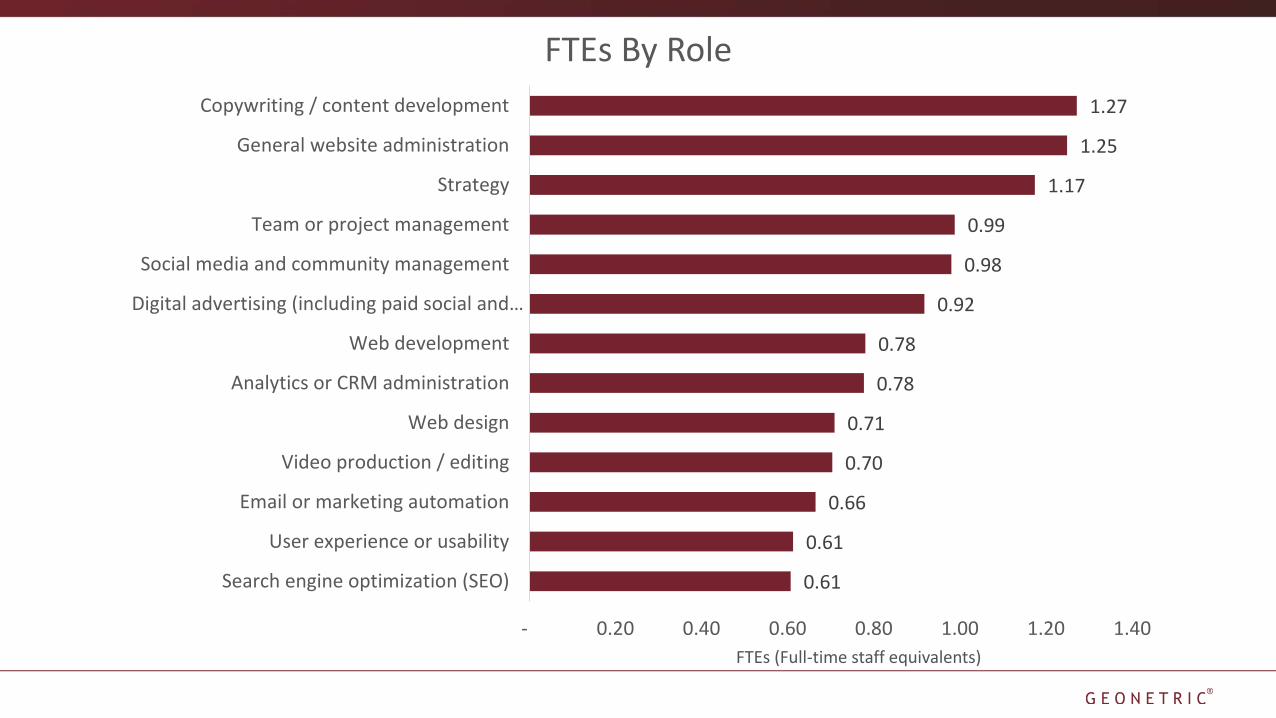
0.61
0.61
0.66
0.70
0.71
0.78
0.78
0.92
0.98
0.99
1.17
1.25
1.27
- 0.20 0.40 0.60 0.80 1.00 1.20 1.40
Search engine optimization (SEO)
User experience or usability
Email or marketing automation
Video production / editing
Web design
Analytics or CRM administration
Web development
Digital advertising (including paid social and…
Social media and community management
Team or project management
Strategy
General website administration
Copywriting / content development
FTEs By Role
FTEs (Full-time staff equivalents)
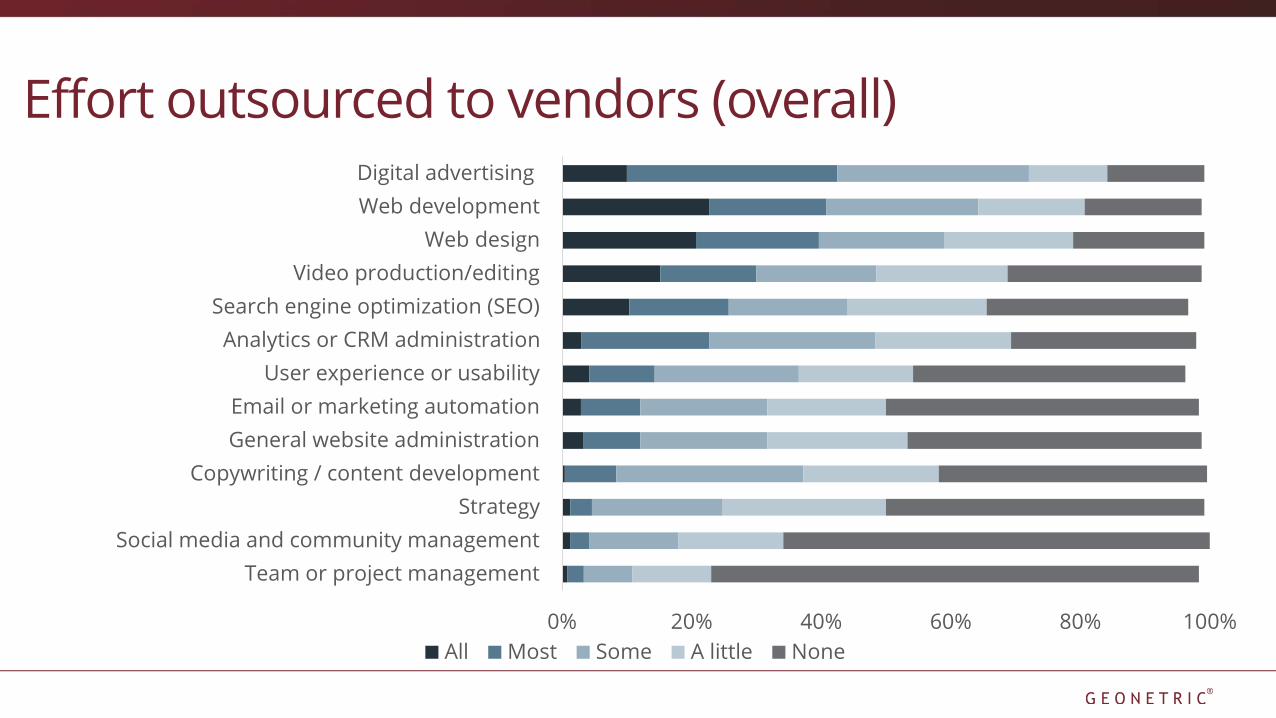
Effort outsourced to vendors (overall)
0% 20% 40% 60% 80% 100%
Team or project management
Social media and community management
Strategy
Copywriting / content development
General website administration
Email or marketing automation
User experience or usability
Analytics or CRM administration
Search engine optimization (SEO)
Video production/editing
Web design
Web development
Digital advertising
All Most Some A little None
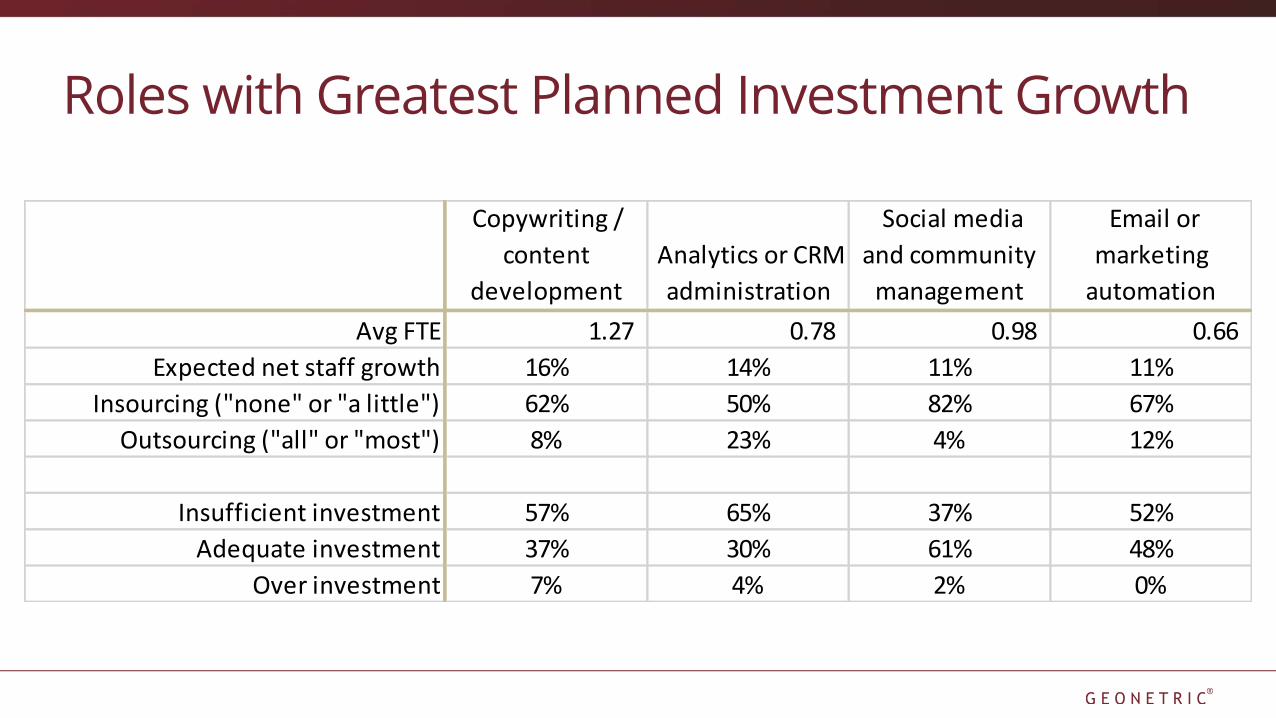
Roles with Greatest Planned Investment Growth
Copywriting /
content
development
Analytics or CRM
administration
Social media
and community
management
Email or
marketing
automation
Avg FTE 1.27 0.78 0.98 0.66
Expected net staff growth 16% 14% 11% 11%
Insourcing ("none" or "a little") 62% 50% 82% 67%
Outsourcing ("all" or "most") 8% 23% 4% 12%
Insufficient investment 57% 65% 37% 52%
Adequate investment 37% 30% 61% 48%
Over investment 7% 4% 2% 0%
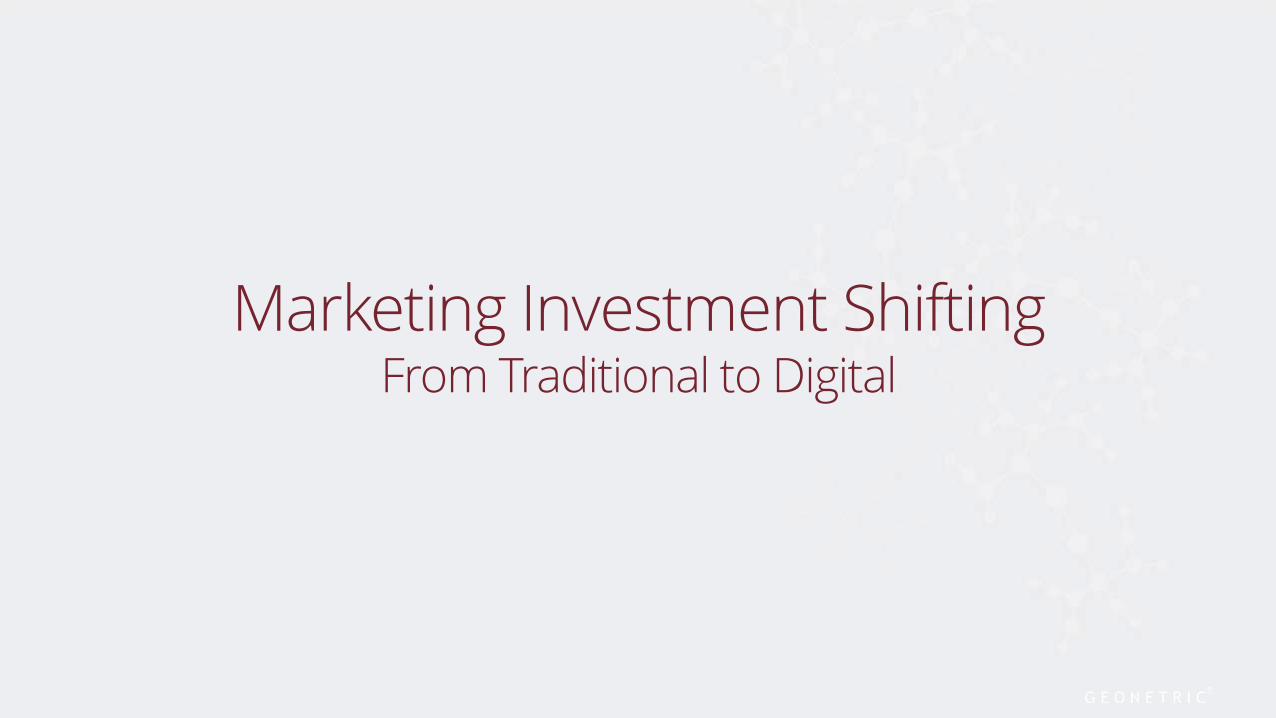
Marketing Investment Shifting From Traditional to Digital
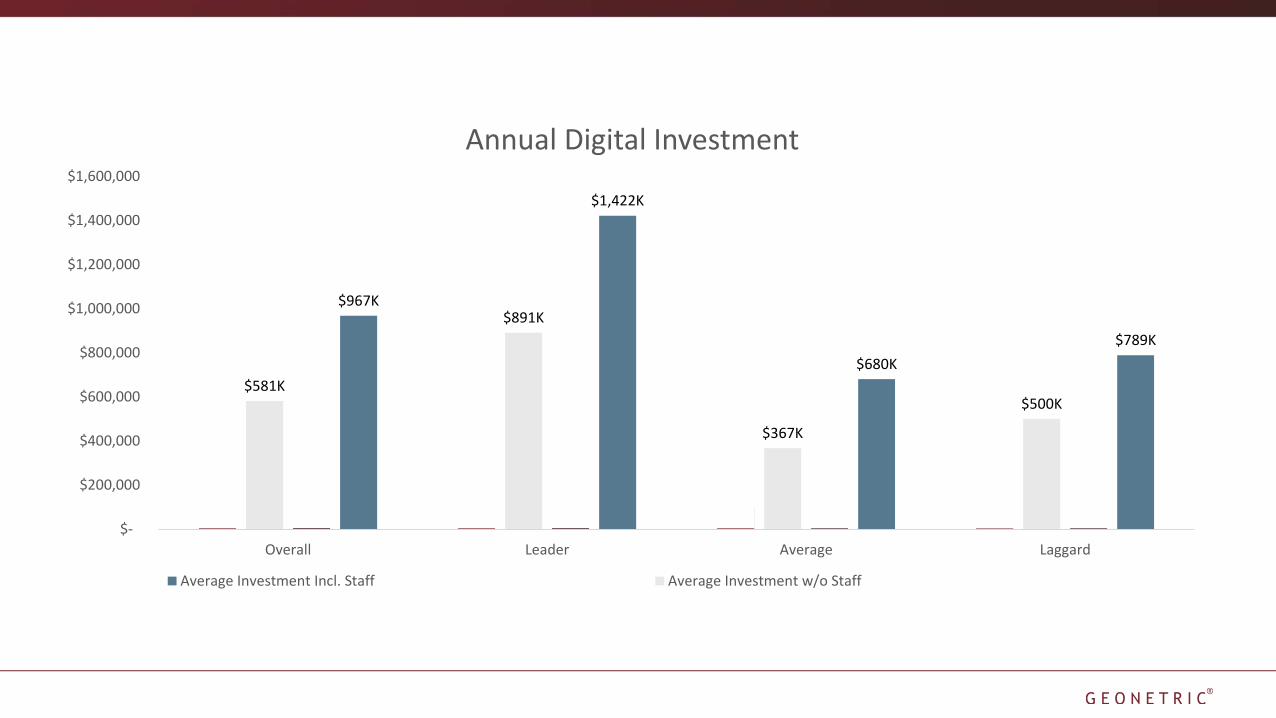
$789K
$680K
$1,422K
$967K
$200K$253K
$475K
$330K
$500K
$367K
$891K
$581K
$50K$100K
$300K
$120K
$-
$200,000
$400,000
$600,000
$800,000
$1,000,000
$1,200,000
$1,400,000
$1,600,000
LaggardAverageLeaderOverall
Annual Digital Investment
Average Investment Incl. Staff Median Investment Incl. Staff Average Investment w/o Staff Median Investment w/o Staff
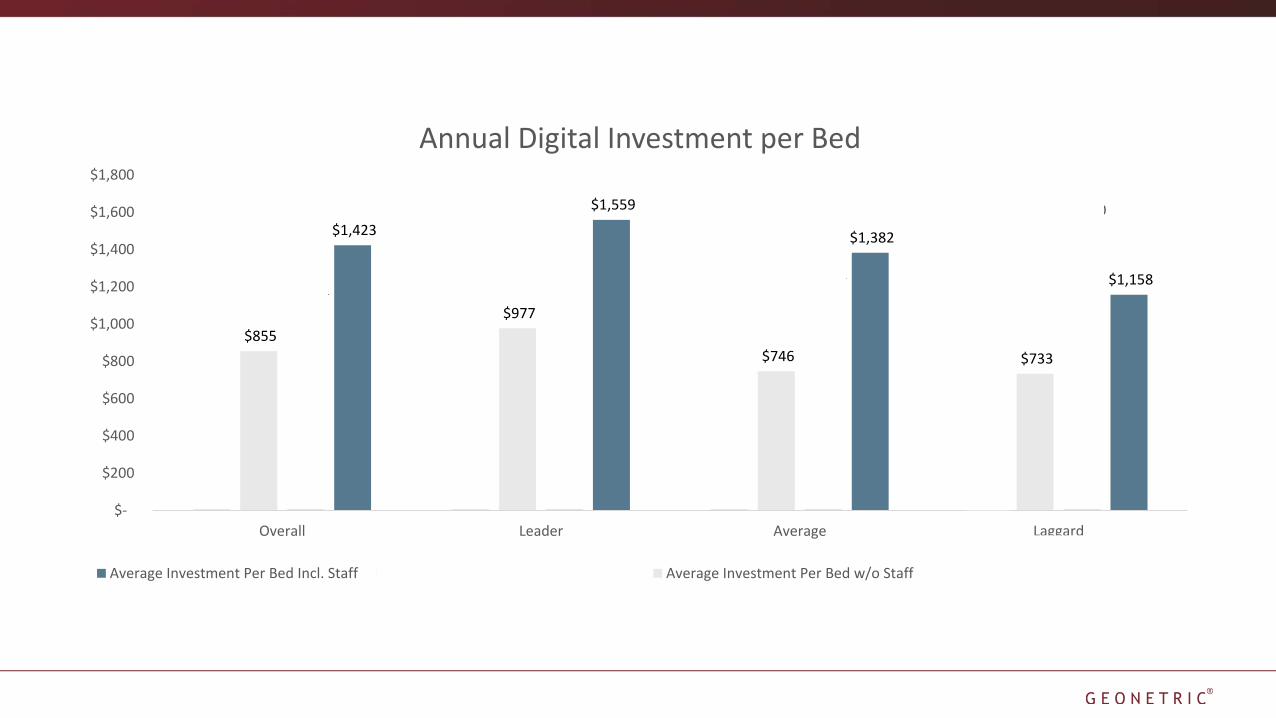
$1,158
$1,382
$1,559
$1,423
$1,530
$1,174
$1,014 $1,101
$733 $746
$977
$855
$400 $370
$500 $407
$-
$200
$400
$600
$800
$1,000
$1,200
$1,400
$1,600
$1,800
LaggardAverageLeaderOverall
Annual Digital Investment per Bed
Average Investment Per Bed Incl. Staff Median Investment Per Bed Incl. Staff Average Investment Per Bed w/o Staff Median Investment Per Bed w/o Staff
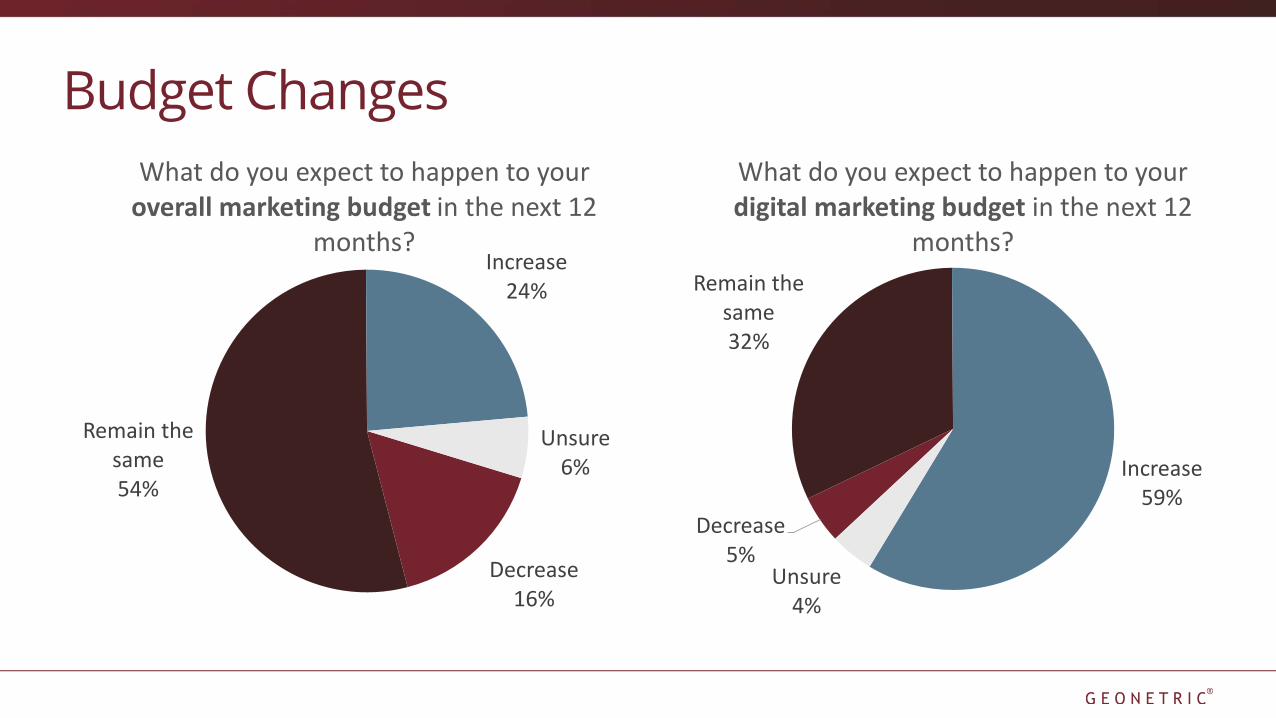
Budget Changes
Decrease16%
Remain the same54%
Increase24%
Unsure6%
What do you expect to happen to your overall marketing budget in the next 12
months?
Decrease5%
Remain the same32%
Increase59%
Unsure4%
What do you expect to happen to your digital marketing budget in the next 12
months?
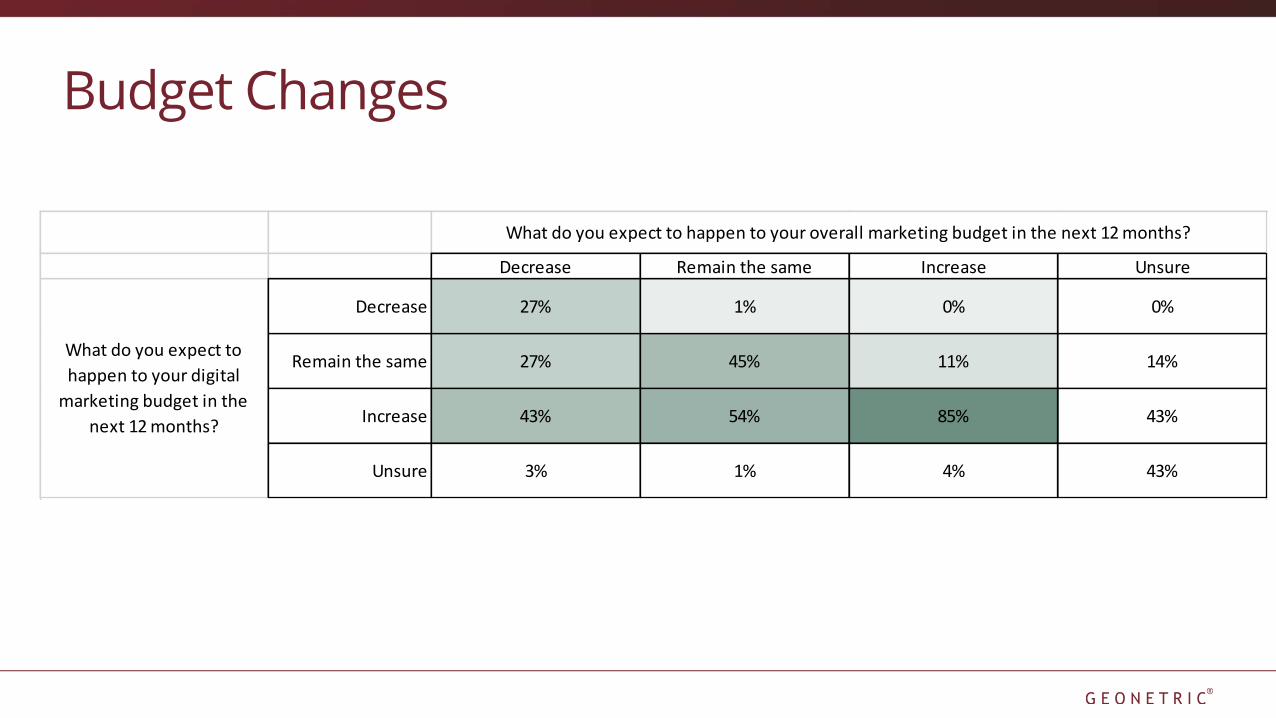
Budget Changes
Decrease Remain the same Increase Unsure
Decrease 27% 1% 0% 0%
Remain the same 27% 45% 11% 14%
Increase 43% 54% 85% 43%
Unsure 3% 1% 4% 43%
What do you expect to happen to your overall marketing budget in the next 12 months?
What do you expect to
happen to your digital
marketing budget in the
next 12 months?
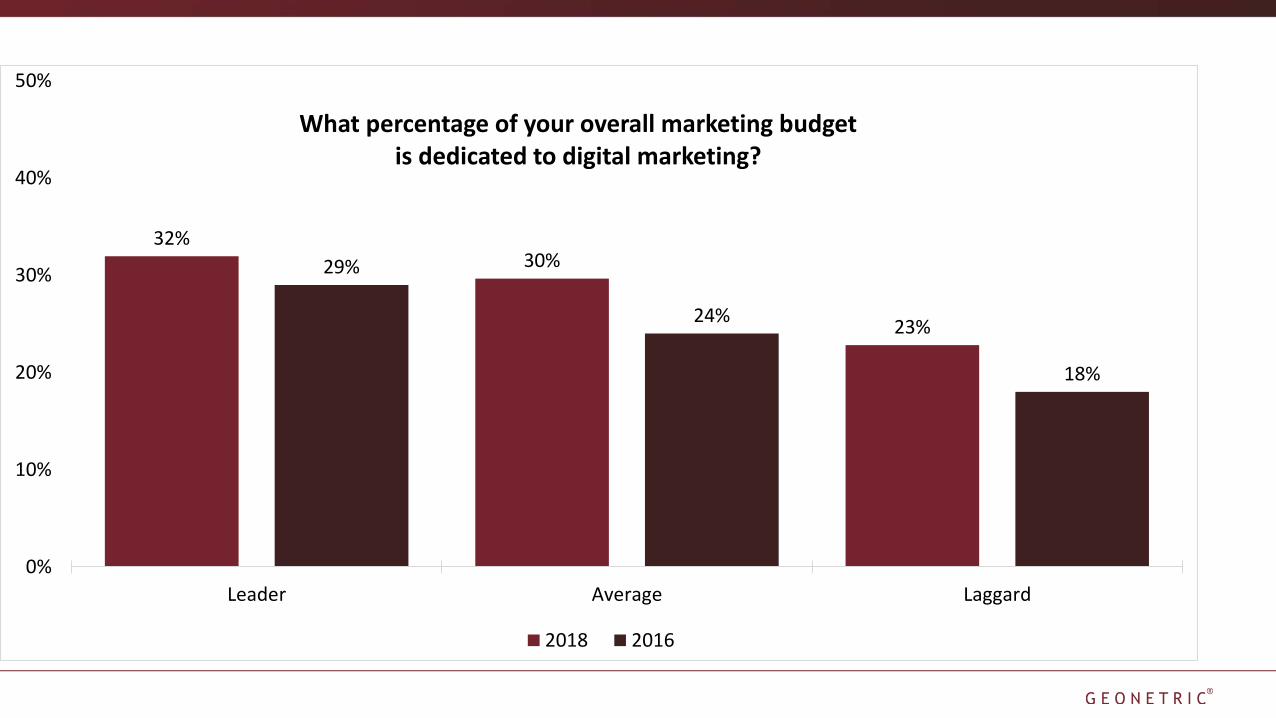
32%30%
23%
29%
24%
18%
0%
10%
20%
30%
40%
50%
Leader Average Laggard
What percentage of your overall marketing budget is dedicated to digital marketing?
2018 2016
Redesign Cycle Picking Up Steam
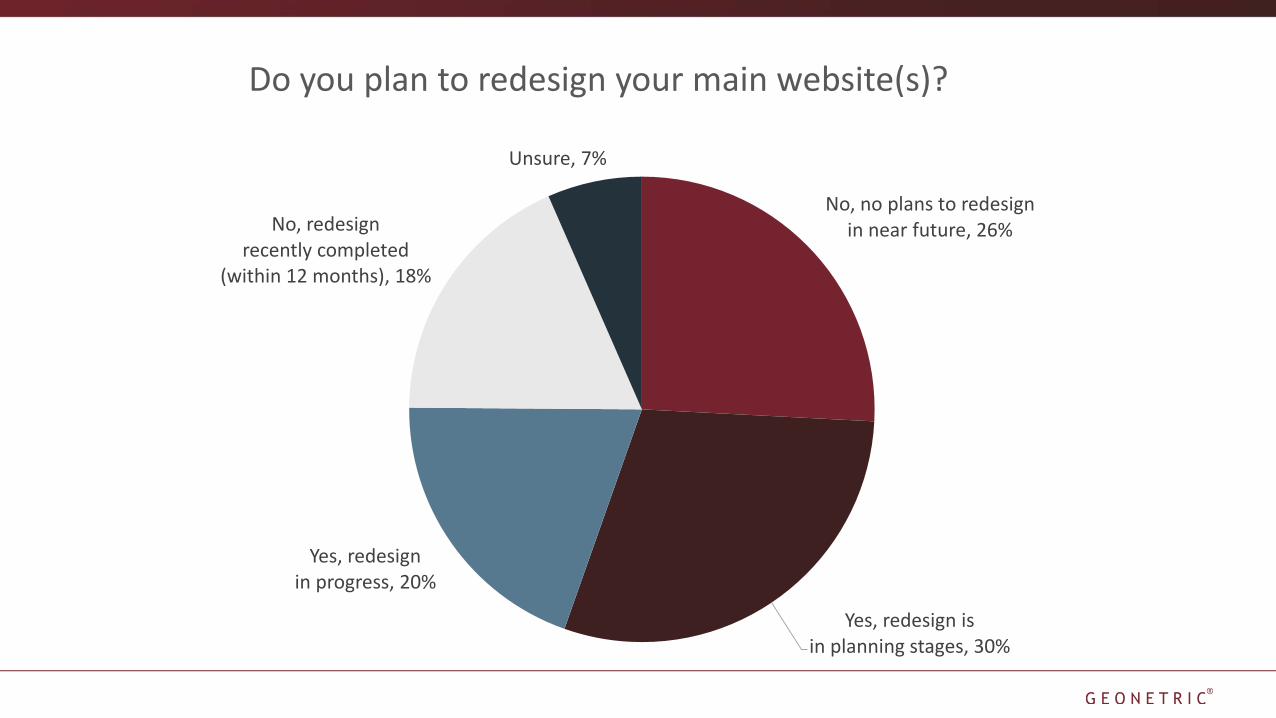
No, no plans to redesign in near future, 26%
Yes, redesign is in planning stages, 30%
Yes, redesign in progress, 20%
No, redesign recently completed
(within 12 months), 18%
Unsure, 7%
Do you plan to redesign your main website(s)?
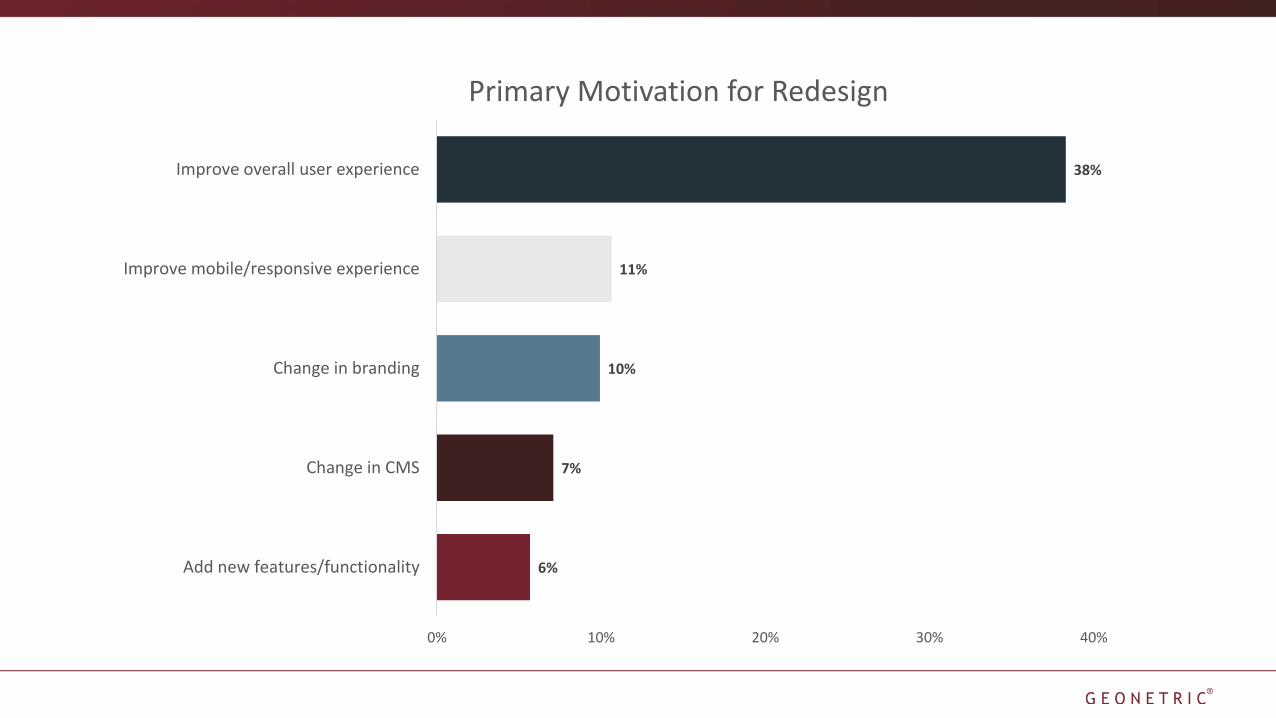
6%
7%
10%
11%
38%
0% 10% 20% 30% 40%
Add new features/functionality
Change in CMS
Change in branding
Improve mobile/responsive experience
Improve overall user experience
Primary Motivation for Redesign
PersonalizationOpportunities and Challenges
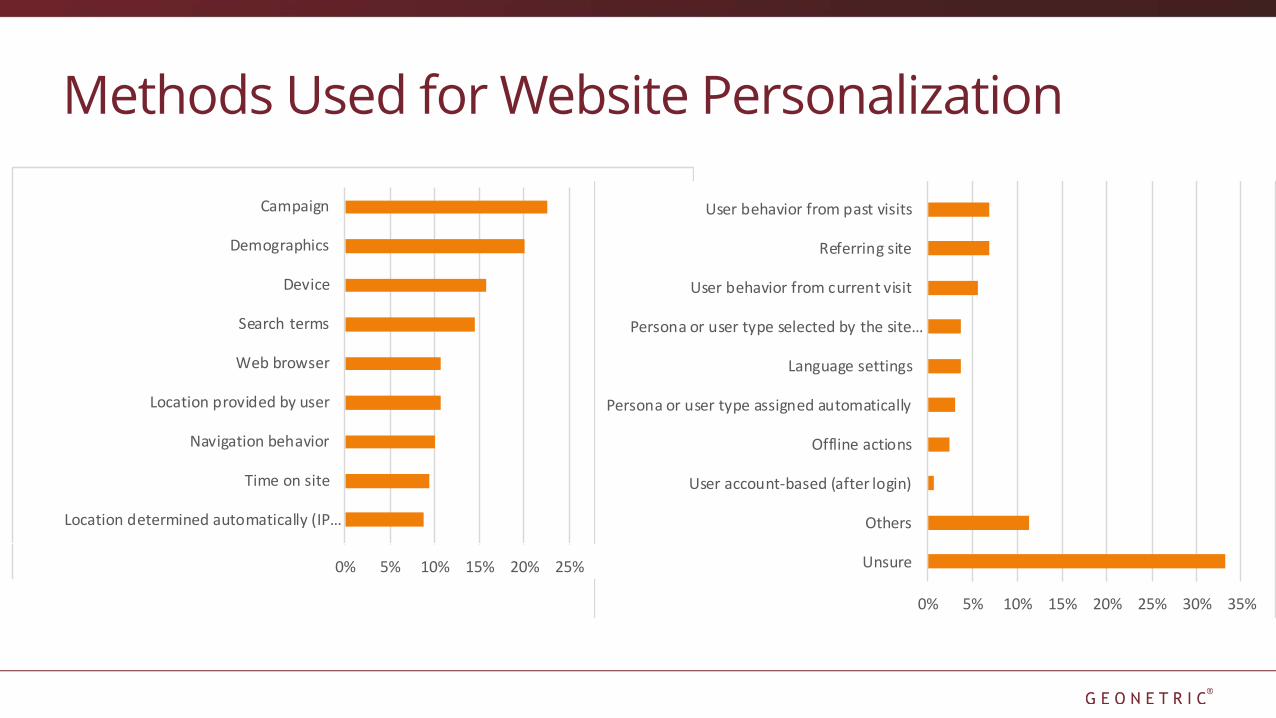
Methods Used for Website Personalization
0% 5% 10% 15% 20% 25% 30% 35%
Unsure
Others
User account-based (after login)
Offline actions
Persona or user type assigned automatically
Language settings
Persona or user type selected by the site…
User behavior from current visit
Referring site
User behavior from past visits
Location determined automatically (IP…
Time on site
Navigation behavior
Location provided by user
Web browser
Search terms
Device
Demographics
Campaign
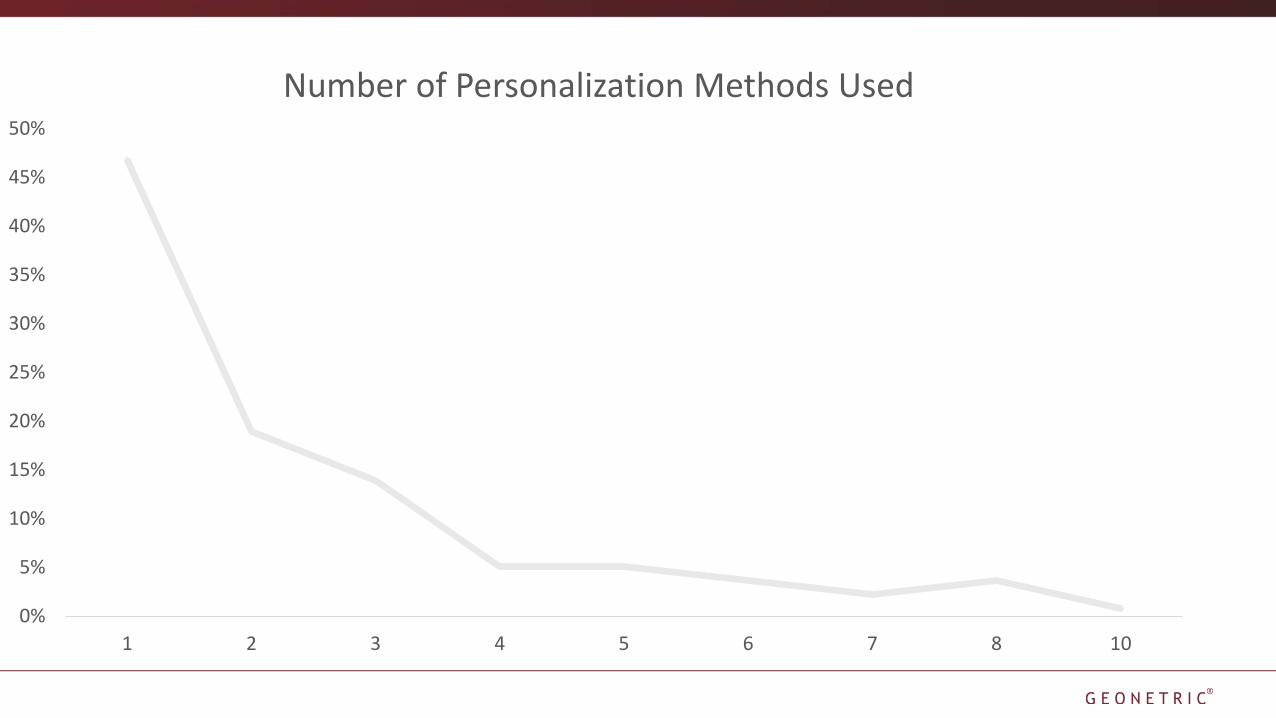
0%
5%
10%
15%
20%
25%
30%
35%
40%
45%
50%
1 2 3 4 5 6 7 8 10
Number of Personalization Methods Used
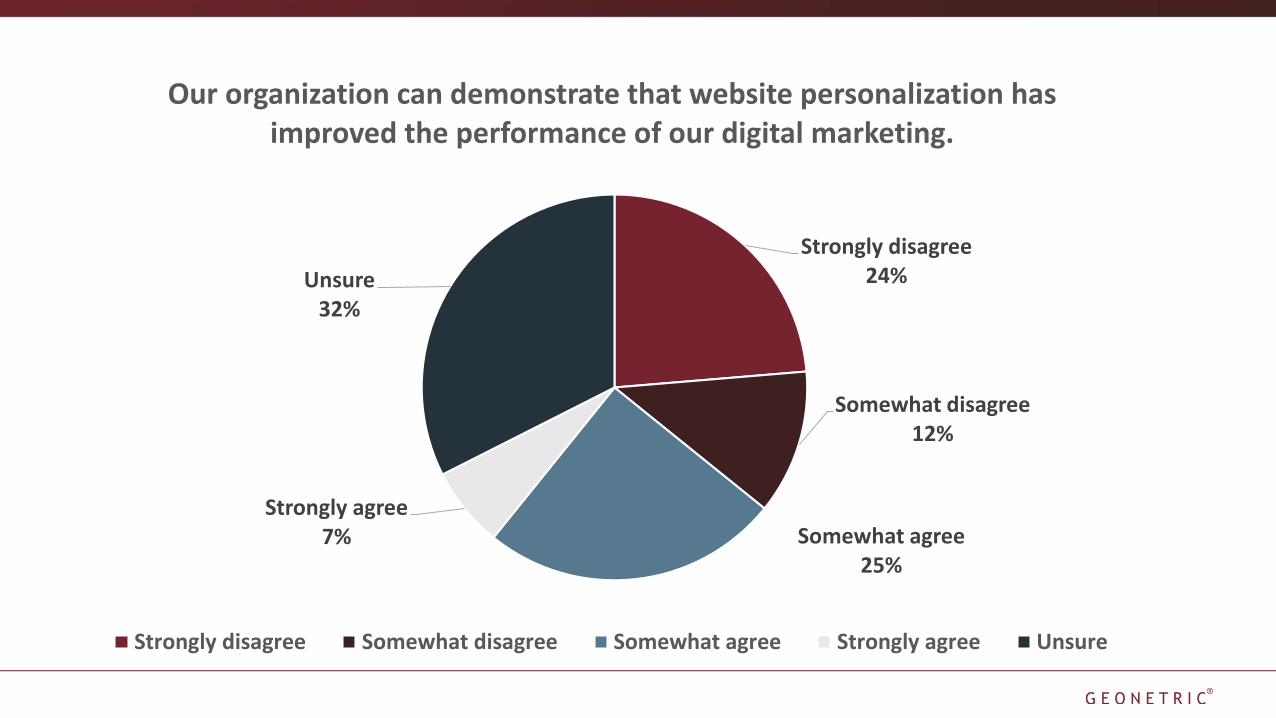
Strongly disagree24%
Somewhat disagree12%
Somewhat agree25%
Strongly agree7%
Unsure32%
Our organization can demonstrate that website personalization has improved the performance of our digital marketing.
Strongly disagree Somewhat disagree Somewhat agree Strongly agree Unsure
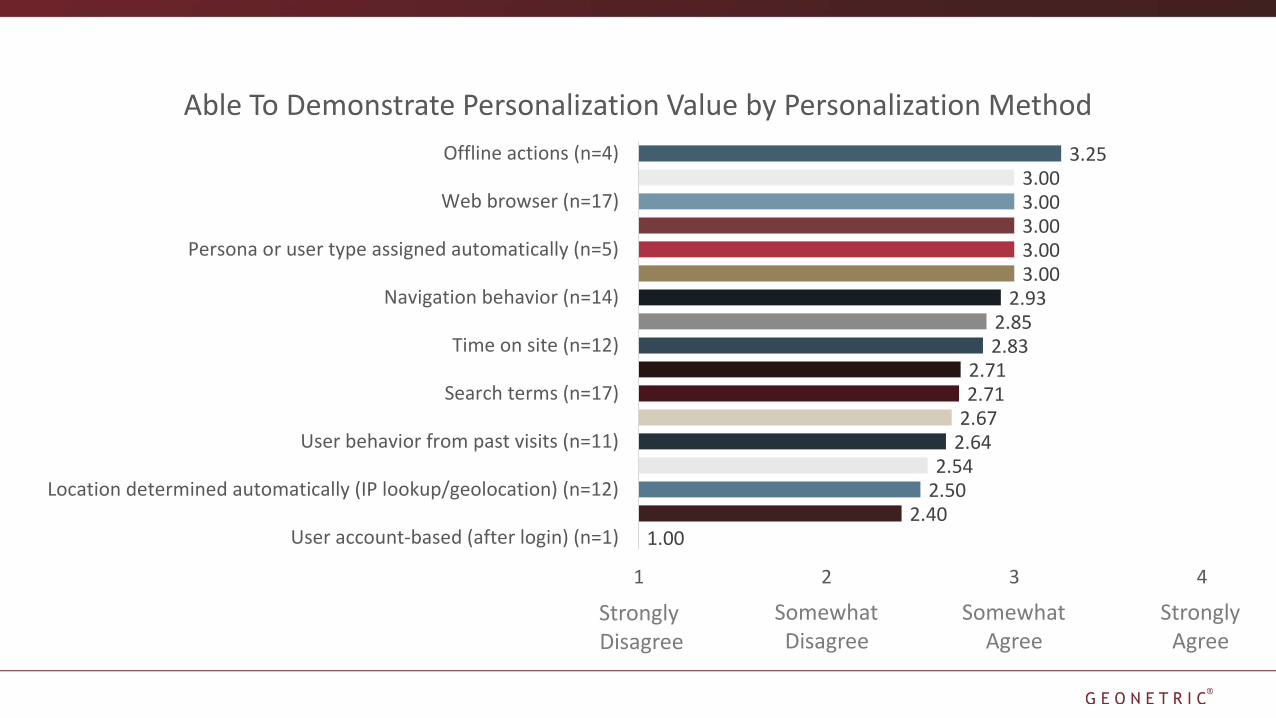
1.002.40
2.502.54
2.642.672.712.71
2.832.85
2.933.003.003.003.003.00
3.25
1 2 3 4
User account-based (after login) (n=1)
Location determined automatically (IP lookup/geolocation) (n=12)
User behavior from past visits (n=11)
Search terms (n=17)
Time on site (n=12)
Navigation behavior (n=14)
Persona or user type assigned automatically (n=5)
Web browser (n=17)
Offline actions (n=4)
Able To Demonstrate Personalization Value by Personalization Method
StronglyDisagree
SomewhatDisagree
SomewhatAgree
StronglyAgree
Upward MobilityLeader/Laggard
40
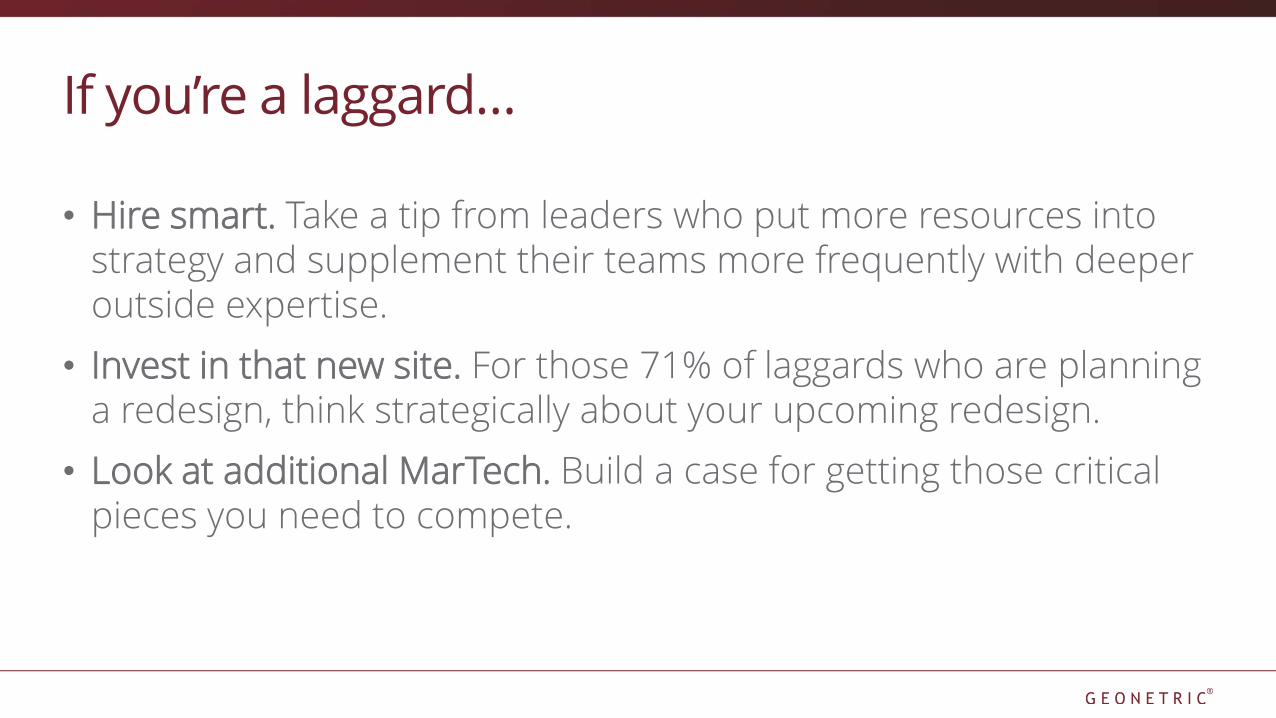
If you’re a laggard…
• Hire smart. Take a tip from leaders who put more resources into strategy and supplement their teams more frequently with deeper outside expertise.
• Invest in that new site. For those 71% of laggards who are planning a redesign, think strategically about your upcoming redesign.
• Look at additional MarTech. Build a case for getting those critical pieces you need to compete.
If you’re average…
• Make your investments pay off. Added staff should help improve your ability to measure effectiveness
• Train or outsource where you have skill gaps. Leaders, despite having the largest staffs, are most likely to use a mix of both in-house and outsourced resources.
• Push limits. Keep pushing boundaries and thinking strategically about moving offline processes to the web
If you’re a leader…
• Problems get harder to solve. Keep bringing innovative capabilities to your site and start the conversations and build relationships across teams that can make those big ideas a reality.
• Continue to invest in strategy. Your strides in strategy are paying off.
• Keep connecting the dots. To keep that top spot, you’ll need to continue to invest in measurement – not only ROI, but also how you’re impacting consumer engagement and increasing revenue.