Embed Size (px)
Citation preview

www.harriswilliams.com
Investment banking services are provided by Harris Williams LLC and Solebury Capital LCC, registered broker-dealers and members of FINRA and SIPC, and Harris Williams & Co. Ltd,which is authorized and regulated by the Financial Conduct Authority. Harris Williams & Co. is a trade name under which Harris Williams LLC and Harris Williams & Co. Ltd conductbusiness.
RESTAURANTS
INDUSTRY UPDATE │ DECEMBER 2016

PAGE |
www.harriswilliams.com
OVERVIEW
1
CONTENTS
Economic Trends
Public Company Summary
Limited Service
Full Service
Debt Markets
M&A Activity
OUR PRACTICE
Harris Williams & Co. is a leading advisor to middle market companies. Our restaurant experience covers a broad range of concepts and business models. This particular report focuses on trends and metrics in the following areas:
Quick Service
Fast Casual
Pizza
Beverage
Differentiated Casual
Casual
Family Dining
Fine Dining
CONTACTS
Glenn GurtcheffManaging [email protected]+1 (612) 359-2702
Tim AlexanderManaging [email protected]+1 (612) 359-2716
Ed ArkusManaging [email protected]+44 20 7518 8905
Ryan BudlongManaging [email protected]+1 (415) 217-3409
Will [email protected]+44 20 7518 8906
Brant [email protected]+1 (612) 359-2709
Ryan [email protected]+1 (612) 359-2703
Andy WarczakVice [email protected]+1 (612) 359-2714
INDUSTRY COMMENTARY
Economic trends and evolving consumer preferences create opportunitiesand challenges for the restaurant industry. Commodity price declinesremain a positive for restaurants from a margin perspective. However, thedecrease in grocery prices may be encouraging consumers to re-thinkeating out. Additionally, the strengthened labor market and mandatedminimum wage increases are driving up overall prime costs. Differentiatedconcepts offering healthy/better-for-you food options, unique flavors, andconvenience and/or value are creating pockets of opportunity within theindustry.
M&A market activity for restaurants remains strong for differentiatedgrowth concepts and performing franchise systems. 2016 M&A activity hasdeclined from 2015 levels, but strong companies are still attracting investorinterest. Choppiness in industry performance combined with highvaluation expectations are key drivers of reduced deal activity. Financingmarkets remain supportive of the industry, and we expect 2017 tocontinue to be a healthy M&A environment.
Notwithstanding the strong post-election jump in share prices, publiclytraded restaurants have struggled to maintain their outperformance.Several years into the recovery, investors seem less convinced about thestrength of consumers and reticent to invest in restaurants in the wake ofrecent bankruptcies (Don Pablo’s, Logan’s Roadhouse, and Cosi). Fast-casual concepts struggle to maintain their luster after food safetyconcerns stalled Chipotle’s growth and the sector has proven notimmune to the same-store sales challenges affecting the broader industry.QSRs have shown particular resilience with respect to marketperformance due to their highly franchised structures and strong valuepropositions.
RESTAURANTS
INDUSTRY UPDATE │ DECEMBER 2016
After Two Consecutive Quarters of Stalled Traffic Growth, Restaurant VisitsDecline in Third Quarter – A confluence of squeezed consumer wallets, therising cost of dining out, and changing needs and wants has brought theU.S. restaurant industry traffic growth to a halt in the first two quarters of2016 and into the negative in the third quarter, reports The NPD Group.Quick Service restaurant traffic, which represent 80 percent of totalindustry visits, was negative for the first time in five years. (Link to Article)
How McDonald's Leveraged A Key Partnership To Verify Sustainable Beef –Tracking 9,000 head of cattle from birth to burger, McDonald’s Canadaand Cargill teamed up to develop and pilot one of the industry’s firstsustainable beef programs. While the program is over, the effects are not.The learnings and best practices used to execute the pilot program will beleveraged as more consumers desire food transparency and sustainability.(Link to Article)
Why So Many Legacy Fast-Food Restaurants Are Getting Makeovers –Trying to attract millennials goes beyond the menu. More and morerestaurants are refreshing their asset base to appeal to a youngeraudience. Results seem to be favorable, with Arby’s seeing a ~15% saleslift on remodeled units. (Link to Article)
WHAT WE’RE READING

PAGE |
ECONOMIC TRENDS
2
RESTAURANTS
INDUSTRY UPDATE │ DECEMBER 2016
EMPLOYMENT1 CONSUMER CONFIDENCE2
(in millions)
LABOR PARTICIPATION RATE1 WAGE GROWTH VS CONSUMER PRICE INDEX1
AT HOME AND RESTAURANT SPENDING3 COMMODITY PRICE INDICES1,4
0
20
40
60
80
100
120
Nov-11 Nov-12 Nov-13 Nov-14 Nov-15 Nov-16
61.5%
62.0%
62.5%
63.0%
63.5%
64.0%
64.5%
Nov-11 Nov-12 Nov-13 Nov-14 Nov-15 Nov-16-2.0%
-1.0%
0.0%
1.0%
2.0%
3.0%
4.0%
Nov-11 Nov-12 Nov-13 Nov-14 Nov-15 Nov-16
120
125
130
135
140
145
150
0.0%
2.0%
4.0%
6.0%
8.0%
10.0%
12.0%
Nov-06 Nov-08 Nov-10 Nov-12 Nov-14 Nov-16
40.0%
45.0%
50.0%
55.0%
60.0%
Sep-11 Sep-12 Sep-13 Sep-14 Sep-15 Sep-16
Un
em
plo
ym
en
t R
ate To
tal E
mp
loym
en
t Ind
exe
d V
alu
e
Lab
or
Pa
rtic
ipa
tio
n R
ate
Yo
Y G
row
th R
ate
% o
f To
tal S
pe
nd
Ind
exe
d V
alu
e
Consumer Price Index Wage Growth
Total Employment Unemployment Rate
Food Away from Home Food at Home
0
20
40
60
80
100
120
140
160
Nov-11 Nov-12 Nov-13 Nov-14 Nov-15 Nov-16
Corn Wheat Beef Crude
Chicken Pork Milk
PAGE |
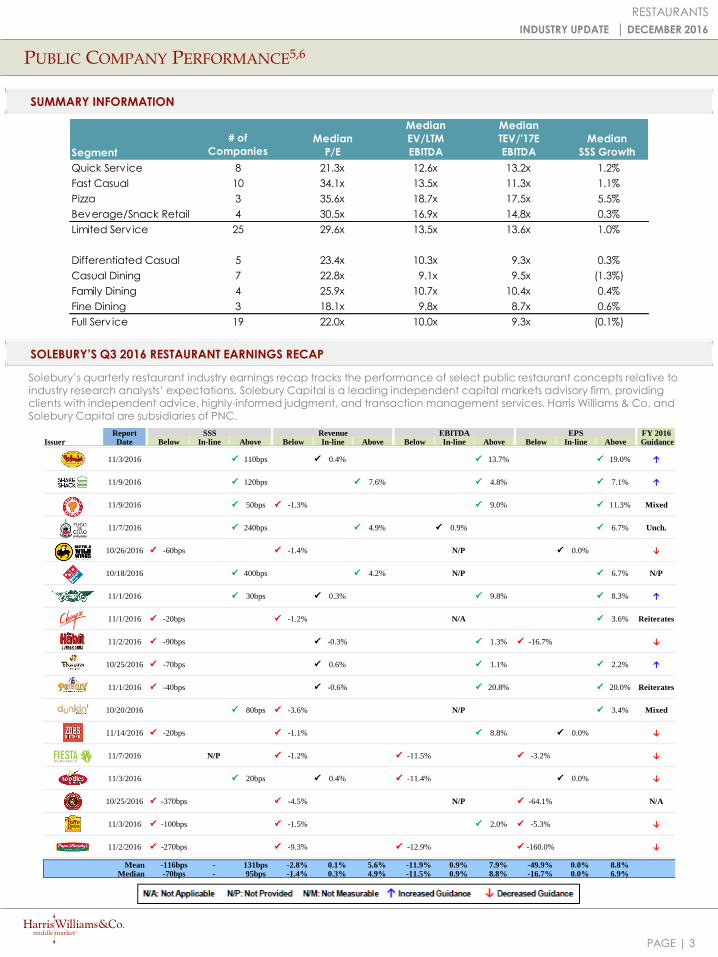
Report SSS Revenue EBITDA EPS FY 2016Issuer Date Below In-line Above Below In-line Above Below In-line Above Below In-line Above Guidance
11/3/2016 P 110bps P 0.4% P 13.7% P 19.0% ↑
11/9/2016 P 120bps P 7.6% P 4.8% P 7.1% ↑
11/9/2016 P 50bps P -1.3% P 9.0% P 11.3% Mixed
11/7/2016 P 240bps P 4.9% P 0.9% P 6.7% Unch.
10/26/2016 P -60bps P -1.4% N/P P 0.0% ↓
10/18/2016 P 400bps P 4.2% N/P P 6.7% N/P
11/1/2016 P 30bps P 0.3% P 9.8% P 8.3% ↑
11/1/2016 P -20bps P -1.2% N/A P 3.6% Reiterates
11/2/2016 P -90bps P -0.3% P 1.3% P -16.7% ↓
10/25/2016 P -70bps P 0.6% P 1.1% P 2.2% ↑
11/1/2016 P -40bps P -0.6% P 20.8% P 20.0% Reiterates
10/20/2016 P 80bps P -3.6% N/P P 3.4% Mixed
11/14/2016 P -20bps P -1.1% P 8.8% P 0.0% ↓
11/7/2016 N/P P -1.2% P -11.5% P -3.2% ↓
11/3/2016 P 20bps P 0.4% P -11.4% P 0.0% ↓
10/25/2016 P -370bps P -4.5% N/P P -64.1% N/A
11/3/2016 P -100bps P -1.5% P 2.0% P -5.3% ↓
11/2/2016 P -270bps P -9.3% P -12.9% P -160.0% ↓
Mean -116bps - 131bps -2.8% 0.1% 5.6% -11.9% 0.9% 7.9% -49.9% 0.0% 8.8%Median -70bps - 95bps -1.4% 0.3% 4.9% -11.5% 0.9% 8.8% -16.7% 0.0% 6.9%
PUBLIC COMPANY PERFORMANCE5,6
3
RESTAURANTS
INDUSTRY UPDATE │ DECEMBER 2016
SUMMARY INFORMATION
SOLEBURY’S Q3 2016 RESTAURANT EARNINGS RECAP
Solebury’s quarterly restaurant industry earnings recap tracks the performance of select public restaurant concepts relative to industry research analysts’ expectations. Solebury Capital is a leading independent capital markets advisory firm, providing clients with independent advice, highly-informed judgment, and transaction management services. Harris Williams & Co. and Solebury Capital are subsidiaries of PNC.
Segment
# of
Companies
Quick Serv ice 8 21.3x 12.6x 13.2x 1.2%
Fast Casual 10 34.1x 13.5x 11.3x 1.1%
Pizza 3 35.6x 18.7x 17.5x 5.5%
Beverage/Snack Retail 4 30.5x 16.9x 14.8x 0.3%
Limited Serv ice 25 29.6x 13.5x 13.6x 1.0%
Differentiated Casual 5 23.4x 10.3x 9.3x 0.3%
Casual Dining 7 22.8x 9.1x 9.5x (1.3%)
Family Dining 4 25.9x 10.7x 10.4x 0.4%
Fine Dining 3 18.1x 9.8x 8.7x 0.6%
Full Serv ice 19 22.0x 10.0x 9.3x (0.1%)
Median
P/E
Median
EV/LTM
EBITDA
Median
TEV/'17E
EBITDA
Median
SSS Growth
PAGE |
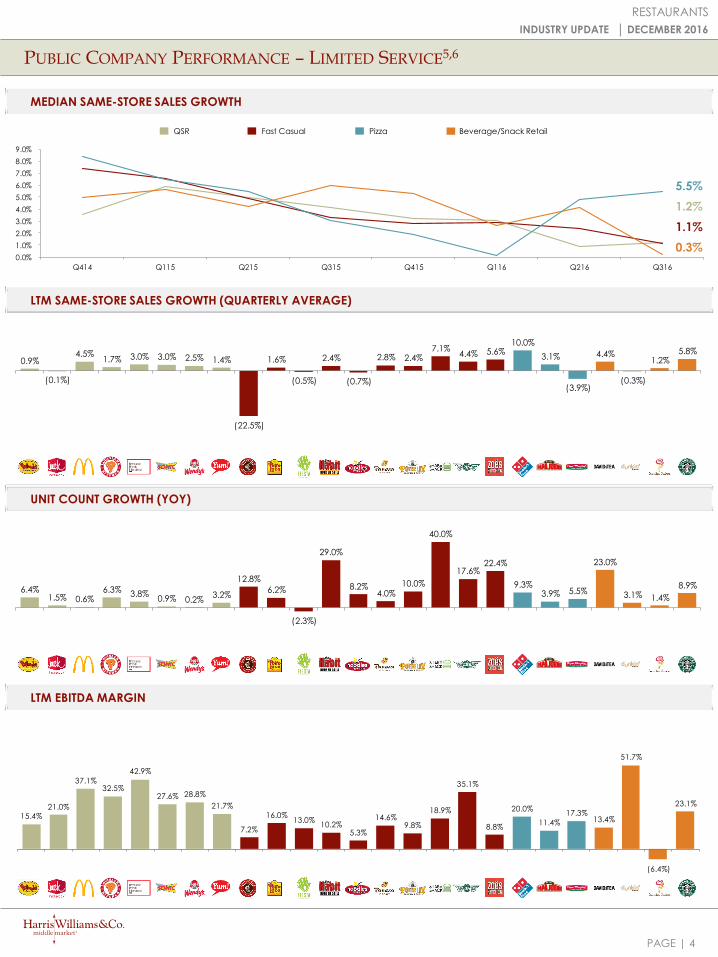
PUBLIC COMPANY PERFORMANCE – LIMITED SERVICE5,6
4
RESTAURANTS
INDUSTRY UPDATE │ DECEMBER 2016
MEDIAN SAME-STORE SALES GROWTH
LTM SAME-STORE SALES GROWTH (QUARTERLY AVERAGE)
UNIT COUNT GROWTH (YOY)
LTM EBITDA MARGIN
0.0%
1.0%
2.0%
3.0%
4.0%
5.0%
6.0%
7.0%
8.0%
9.0%
Q414 Q115 Q215 Q315 Q415 Q116 Q216 Q316
0.9%
(0.1%)
4.5% 1.7% 3.0% 3.0% 2.5% 1.4%
(22.5%)
1.6%
(0.5%)
2.4%
(0.7%)
2.8% 2.4% 7.1%
4.4% 5.6% 10.0%
3.1%
(3.9%)
4.4%
(0.3%)
1.2% 5.8%
6.4% 1.5% 0.6%
6.3% 3.8% 0.9% 0.2%
3.2%
12.8%
6.2%
(2.3%)
29.0%
8.2% 4.0%
10.0%
40.0%
17.6% 22.4%
9.3% 3.9% 5.5%
23.0%
3.1% 1.4%
8.9%
QSR Fast Casual Pizza Beverage/Snack Retail
15.4% 21.0%
37.1% 32.5%
42.9%
27.6% 28.8%
21.7%
7.2%
16.0% 13.0%
10.2% 5.3%
14.6% 9.8%
18.9%
35.1%
8.8%
20.0%
11.4%
17.3% 13.4%
51.7%
(6.4%)
23.1%
1.2%
1.1%
5.5%
0.3%
PAGE |
10.7x13.5x 13.5x
16.0x18.0x
10.8x 11.8x 11.2x
40.5x
9.9x 8.9x
13.6x
8.0x
13.2x
8.2x
26.9x
34.1x
21.2x 21.7x18.7x
8.8x 9.4x
16.9x 17.8x
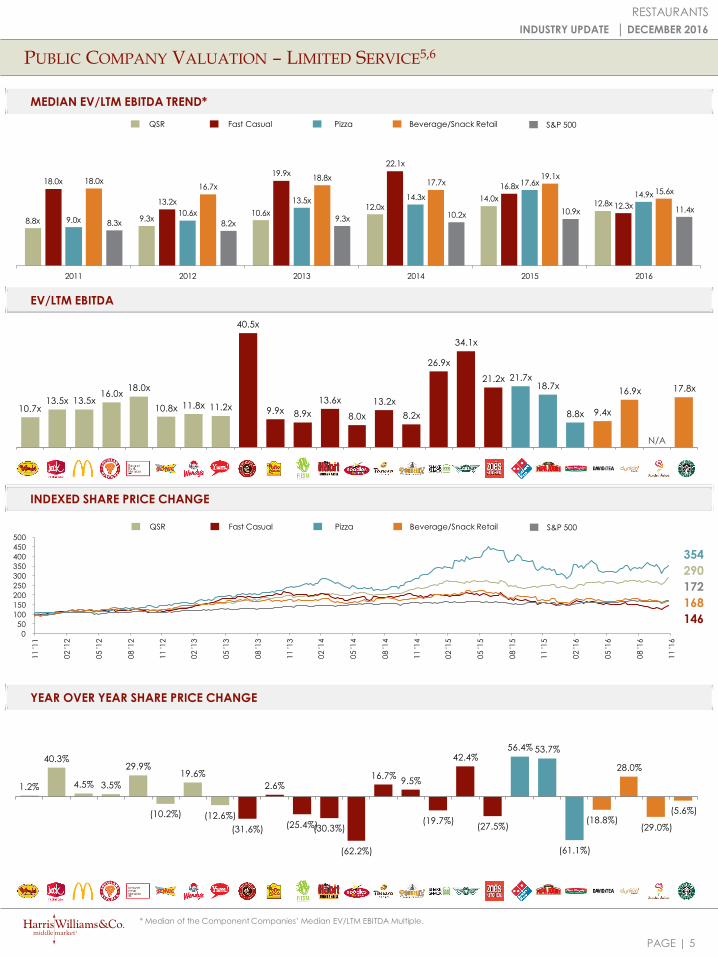
PUBLIC COMPANY VALUATION – LIMITED SERVICE5,6
5
RESTAURANTS
INDUSTRY UPDATE │ DECEMBER 2016
MEDIAN EV/LTM EBITDA TREND*
INDEXED SHARE PRICE CHANGE
EV/LTM EBITDA
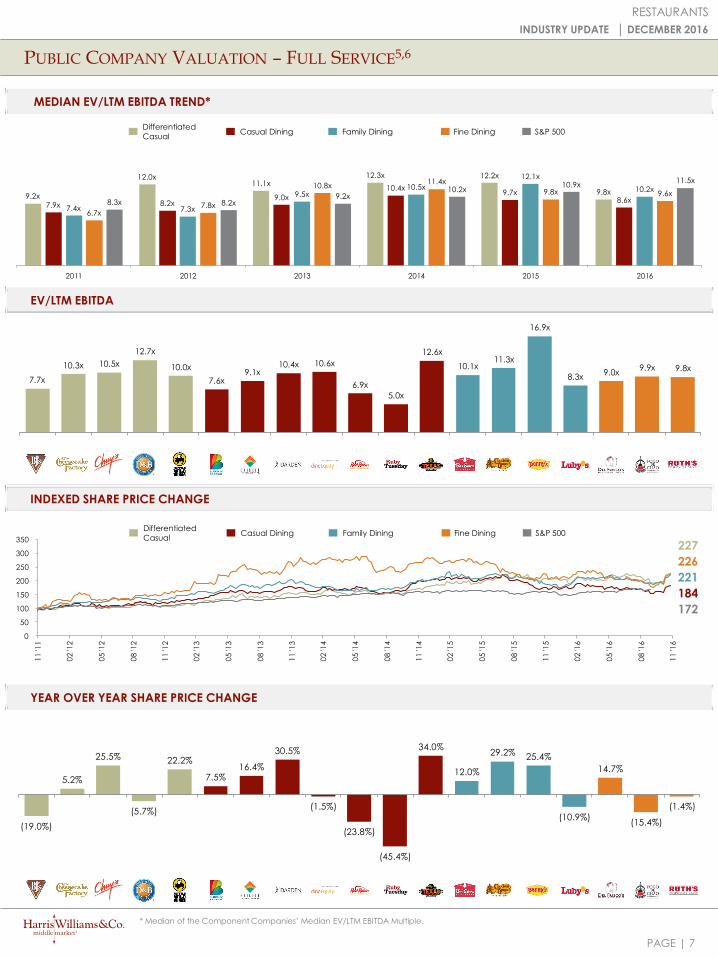
YEAR OVER YEAR SHARE PRICE CHANGE
N/A
0
50
100
150
200
250
300
350
400
450
500
11
'11
02
'12
05
'12
08
'12
11
'12
02
'13
05
'13
08
'13
11
'13
02
'14
05
'14
08
'14
11
'14
02
'15
05
'15
08
'15
11
'15
02
'16
05
'16
08
'16
11
'16
1.2%
40.3%
4.5% 3.5%
29.9%
(10.2%)
19.6%
(12.6%)
(31.6%)
2.6%
(25.4%)(30.3%)
(62.2%)
16.7% 9.5%
(19.7%)
42.4%
(27.5%)
56.4% 53.7%
(61.1%)
(18.8%)
28.0%
(29.0%)
(5.6%)
8.8x 9.3x10.6x
12.0x14.0x
12.8x
18.0x
13.2x
19.9x22.1x
16.8x
12.3x
9.0x10.6x
13.5x 14.3x
17.6x
14.9x
18.0x16.7x
18.8x17.7x
19.1x
15.6x
8.3x 8.2x9.3x 10.2x 10.9x 11.4x
2011 2012 2013 2014 2015 2016
QSR Fast Casual Pizza Beverage/Snack Retail S&P 500
290
146
354
168
172
* Median of the Component Companies’ Median EV/LTM EBITDA Multiple.
QSR Fast Casual Pizza Beverage/Snack Retail S&P 500
PAGE |
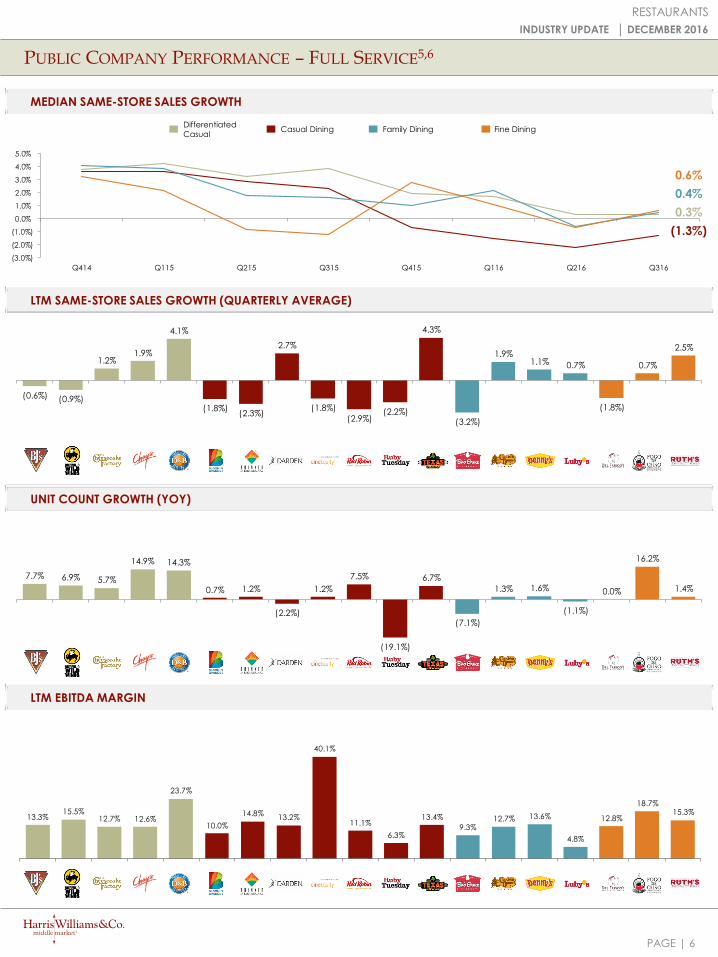
PUBLIC COMPANY PERFORMANCE – FULL SERVICE5,6
6
RESTAURANTS
INDUSTRY UPDATE │ DECEMBER 2016
MEDIAN SAME-STORE SALES GROWTH
LTM SAME-STORE SALES GROWTH (QUARTERLY AVERAGE)
UNIT COUNT GROWTH (YOY)
LTM EBITDA MARGIN
(3.0%)
(2.0%)
(1.0%)
0.0%
1.0%
2.0%
3.0%
4.0%
5.0%
Q414 Q115 Q215 Q315 Q415 Q116 Q216 Q316
(0.6%) (0.9%)
1.2% 1.9%
4.1%
(1.8%)(2.3%)
2.7%
(1.8%)
(2.9%)(2.2%)
4.3%
(3.2%)
1.9% 1.1% 0.7%
(1.8%)
0.7%
2.5%
7.7% 6.9% 5.7%
14.9% 14.3%
0.7% 1.2%
(2.2%)
1.2%
7.5%
(19.1%)
6.7%
(7.1%)
1.3% 1.6%
(1.1%)
0.0%
16.2%
1.4%
Differentiated
CasualCasual Dining Family Dining Fine Dining
13.3% 15.5%
12.7% 12.6%
23.7%
10.0%
14.8% 13.2%
40.1%
11.1%
6.3%
13.4%
9.3% 12.7% 13.6%
4.8%
12.8%
18.7% 15.3%
0.3%
(1.3%)
0.4%
0.6%
PAGE |
0
50
100
150
200
250
300
350
11
'11
02
'12
05
'12
08
'12
11
'12
02
'13
05
'13
08
'13
11
'13
02
'14
05
'14
08
'14
11
'14
02
'15
05
'15
08
'15
11
'15
02
'16
05
'16
08
'16
11
'16
172
7.7x
10.3x 10.5x
12.7x
10.0x
7.6x9.1x
10.4x 10.6x
6.9x
5.0x
12.6x
10.1x11.3x
16.9x
8.3x9.0x
9.9x 9.8x
PUBLIC COMPANY VALUATION – FULL SERVICE5,6
7
RESTAURANTS
INDUSTRY UPDATE │ DECEMBER 2016
MEDIAN EV/LTM EBITDA TREND*
INDEXED SHARE PRICE CHANGE
EV/LTM EBITDA
YEAR OVER YEAR SHARE PRICE CHANGE
(19.0%)
5.2%
25.5%
(5.7%)
22.2%
7.5% 16.4%
30.5%
(1.5%)
(23.8%)
(45.4%)
34.0%
12.0%
29.2% 25.4%
(10.9%)
14.7%
(15.4%)
(1.4%)
Differentiated
CasualCasual Dining Family Dining Fine Dining S&P 500
227
184
221
226
* Median of the Component Companies’ Median EV/LTM EBITDA Multiple.
9.2x
12.0x11.1x
12.3x 12.2x
9.8x
7.9x 8.2x9.0x
10.4x9.7x
8.6x7.4x 7.3x
9.5x10.5x
12.1x
10.2x
6.7x7.8x
10.8x11.4x
9.8x 9.6x8.3x 8.2x
9.2x10.2x
10.9x11.5x
2011 2012 2013 2014 2015 2016
Differentiated
CasualCasual Dining Family Dining Fine Dining S&P 500
PAGE |
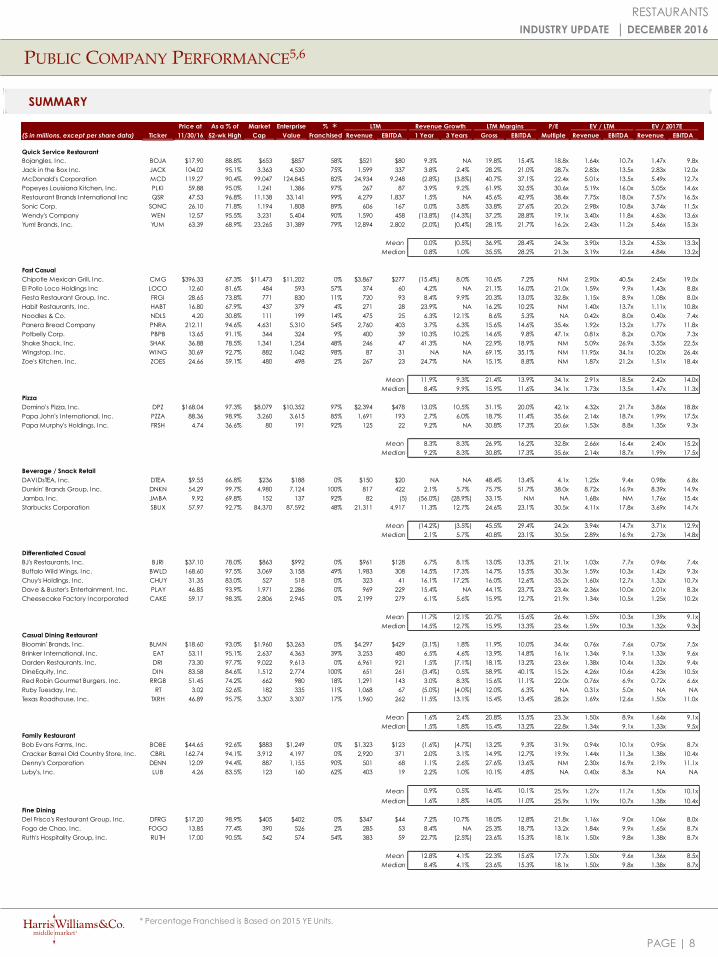
Price at As a % of Market Enterprise % P/E
($ in millions, except per share data) Ticker 11/30/16 52-wk High Cap Value Franchised Revenue EBITDA 1 Year 3 Years Gross EBITDA Multiple Revenue EBITDA Revenue EBITDA
Quick Service Restaurant
Bojangles, Inc. BOJA $17.90 88.8% $653 $857 58% $521 $80 9.3% NA 19.8% 15.4% 18.8x 1.64x 10.7x 1.47x 9.8x
Jack in the Box Inc. JACK 104.02 95.1% 3,363 4,530 75% 1,599 337 3.8% 2.4% 28.2% 21.0% 28.7x 2.83x 13.5x 2.83x 12.0x
McDonald's Corporation MCD 119.27 90.4% 99,047 124,845 82% 24,934 9,248 (2.8%) (3.8%) 40.7% 37.1% 22.4x 5.01x 13.5x 5.49x 12.7x
Popeyes Louisiana Kitchen, Inc. PLKI 59.88 95.0% 1,241 1,386 97% 267 87 3.9% 9.2% 61.9% 32.5% 30.6x 5.19x 16.0x 5.05x 14.6x
Restaurant Brands International Inc QSR 47.53 96.8% 11,138 33,141 99% 4,279 1,837 1.5% NA 45.6% 42.9% 38.4x 7.75x 18.0x 7.57x 16.5x
Sonic Corp. SONC 26.10 71.8% 1,194 1,808 89% 606 167 0.0% 3.8% 33.8% 27.6% 20.2x 2.98x 10.8x 3.74x 11.5x
Wendy's Company WEN 12.57 95.5% 3,231 5,404 90% 1,590 458 (13.8%) (14.3%) 37.2% 28.8% 19.1x 3.40x 11.8x 4.63x 13.6x
Yum! Brands, Inc. YUM 63.39 68.9% 23,265 31,389 79% 12,894 2,802 (2.0%) (0.4%) 28.1% 21.7% 16.2x 2.43x 11.2x 5.46x 15.3x
Mean 0.0% (0.5%) 36.9% 28.4% 24.3x 3.90x 13.2x 4.53x 13.3x
Median 0.8% 1.0% 35.5% 28.2% 21.3x 3.19x 12.6x 4.84x 13.2x
Fast Casual
Chipotle Mexican Grill, Inc. CMG $396.33 67.3% $11,473 $11,202 0% $3,867 $277 (15.4%) 8.0% 10.6% 7.2% NM 2.90x 40.5x 2.45x 19.0x
El Pollo Loco Holdings Inc LOCO 12.60 81.6% 484 593 57% 374 60 4.2% NA 21.1% 16.0% 21.0x 1.59x 9.9x 1.43x 8.8x
Fiesta Restaurant Group, Inc. FRGI 28.65 73.8% 771 830 11% 720 93 8.4% 9.9% 20.3% 13.0% 32.8x 1.15x 8.9x 1.08x 8.0x
Habit Restaurants, Inc. HABT 16.80 67.9% 437 379 4% 271 28 23.9% NA 16.2% 10.2% NM 1.40x 13.7x 1.11x 10.8x
Noodles & Co. NDLS 4.20 30.8% 111 199 14% 475 25 6.3% 12.1% 8.6% 5.3% NA 0.42x 8.0x 0.40x 7.4x
Panera Bread Company PNRA 212.11 94.6% 4,631 5,310 54% 2,760 403 3.7% 6.3% 15.6% 14.6% 35.4x 1.92x 13.2x 1.77x 11.8x
Potbelly Corp. PBPB 13.65 91.1% 344 324 9% 400 39 10.3% 10.2% 14.6% 9.8% 47.1x 0.81x 8.2x 0.70x 7.3x
Shake Shack, Inc. SHAK 36.88 78.5% 1,341 1,254 48% 246 47 41.3% NA 22.9% 18.9% NM 5.09x 26.9x 3.55x 22.5x
Wingstop, Inc. WING 30.69 92.7% 882 1,042 98% 87 31 NA NA 69.1% 35.1% NM 11.95x 34.1x 10.20x 26.4x
Zoe's Kitchen, Inc. ZOES 24.66 59.1% 480 498 2% 267 23 24.7% NA 15.1% 8.8% NM 1.87x 21.2x 1.51x 18.4x
Mean 11.9% 9.3% 21.4% 13.9% 34.1x 2.91x 18.5x 2.42x 14.0x
Median 8.4% 9.9% 15.9% 11.6% 34.1x 1.73x 13.5x 1.47x 11.3x
Pizza
Domino's Pizza, Inc. DPZ $168.04 97.3% $8,079 $10,352 97% $2,394 $478 13.0% 10.5% 31.1% 20.0% 42.1x 4.32x 21.7x 3.86x 18.8x
Papa John's International, Inc. PZZA 88.36 98.9% 3,260 3,615 85% 1,691 193 2.7% 6.0% 18.7% 11.4% 35.6x 2.14x 18.7x 1.99x 17.5x
Papa Murphy's Holdings, Inc. FRSH 4.74 36.6% 80 191 92% 125 22 9.2% NA 30.8% 17.3% 20.6x 1.53x 8.8x 1.35x 9.3x
Mean 8.3% 8.3% 26.9% 16.2% 32.8x 2.66x 16.4x 2.40x 15.2x
Median 9.2% 8.3% 30.8% 17.3% 35.6x 2.14x 18.7x 1.99x 17.5x
Beverage / Snack Retail
DAVIDsTEA, Inc. DTEA $9.55 66.8% $236 $188 0% $150 $20 NA NA 48.4% 13.4% 4.1x 1.25x 9.4x 0.98x 6.8x
Dunkin' Brands Group, Inc. DNKN 54.29 99.7% 4,980 7,124 100% 817 422 2.1% 5.7% 75.7% 51.7% 38.0x 8.72x 16.9x 8.39x 14.9x
Jamba, Inc. JMBA 9.92 69.8% 152 137 92% 82 (5) (56.0%) (28.9%) 33.1% NM NA 1.68x NM 1.76x 15.4x
Starbucks Corporation SBUX 57.97 92.7% 84,370 87,592 48% 21,311 4,917 11.3% 12.7% 24.6% 23.1% 30.5x 4.11x 17.8x 3.69x 14.7x
Mean (14.2%) (3.5%) 45.5% 29.4% 24.2x 3.94x 14.7x 3.71x 12.9x
Median 2.1% 5.7% 40.8% 23.1% 30.5x 2.89x 16.9x 2.73x 14.8x
Differentiated Casual
BJ's Restaurants, Inc. BJRI $37.10 78.0% $863 $992 0% $961 $128 6.7% 8.1% 13.0% 13.3% 21.1x 1.03x 7.7x 0.94x 7.4x
Buffalo Wild Wings, Inc. BWLD 168.60 97.5% 3,069 3,158 49% 1,983 308 14.5% 17.3% 14.7% 15.5% 30.3x 1.59x 10.3x 1.42x 9.3x
Chuy's Holdings, Inc. CHUY 31.35 83.0% 527 518 0% 323 41 16.1% 17.2% 16.0% 12.6% 35.2x 1.60x 12.7x 1.32x 10.7x
Dave & Buster's Entertainment, Inc. PLAY 46.85 93.9% 1,971 2,286 0% 969 229 15.4% NA 44.1% 23.7% 23.4x 2.36x 10.0x 2.01x 8.3x
Cheesecake Factory Incorporated CAKE 59.17 98.3% 2,806 2,945 0% 2,199 279 6.1% 5.6% 15.9% 12.7% 21.9x 1.34x 10.5x 1.25x 10.2x
Mean 11.7% 12.1% 20.7% 15.6% 26.4x 1.59x 10.3x 1.39x 9.1x
Median 14.5% 12.7% 15.9% 13.3% 23.4x 1.59x 10.3x 1.32x 9.3x
Casual Dining Restaurant
Bloomin' Brands, Inc. BLMN $18.60 93.0% $1,960 $3,263 0% $4,297 $429 (3.1%) 1.8% 11.9% 10.0% 34.4x 0.76x 7.6x 0.75x 7.5x
Brinker International, Inc. EAT 53.11 95.1% 2,637 4,363 39% 3,253 480 6.5% 4.6% 13.9% 14.8% 16.1x 1.34x 9.1x 1.33x 9.6x
Darden Restaurants, Inc. DRI 73.30 97.7% 9,022 9,613 0% 6,961 921 1.5% (7.1%) 18.1% 13.2% 23.6x 1.38x 10.4x 1.32x 9.4x
DineEquity, Inc. DIN 83.58 84.6% 1,512 2,774 100% 651 261 (3.4%) 0.5% 58.9% 40.1% 15.2x 4.26x 10.6x 4.23x 10.5x
Red Robin Gourmet Burgers, Inc. RRGB 51.45 74.2% 662 980 18% 1,291 143 3.0% 8.3% 15.6% 11.1% 22.0x 0.76x 6.9x 0.72x 6.6x
Ruby Tuesday, Inc. RT 3.02 52.6% 182 335 11% 1,068 67 (5.0%) (4.0%) 12.0% 6.3% NA 0.31x 5.0x NA NA
Texas Roadhouse, Inc. TXRH 46.89 95.7% 3,307 3,307 17% 1,960 262 11.5% 13.1% 15.4% 13.4% 28.2x 1.69x 12.6x 1.50x 11.0x
Mean 1.6% 2.4% 20.8% 15.5% 23.3x 1.50x 8.9x 1.64x 9.1x
Median 1.5% 1.8% 15.4% 13.2% 22.8x 1.34x 9.1x 1.33x 9.5x
Family Restaurant
Bob Evans Farms, Inc. BOBE $44.65 92.6% $883 $1,249 0% $1,323 $123 (1.6%) (4.7%) 13.2% 9.3% 31.9x 0.94x 10.1x 0.95x 8.7x
Cracker Barrel Old Country Store, Inc. CBRL 162.74 94.1% 3,912 4,197 0% 2,920 371 2.0% 3.1% 14.9% 12.7% 19.9x 1.44x 11.3x 1.38x 10.4x
Denny's Corporation DENN 12.09 94.4% 887 1,155 90% 501 68 1.1% 2.6% 27.6% 13.6% NM 2.30x 16.9x 2.19x 11.1x
Luby's, Inc. LUB 4.26 83.5% 123 160 62% 403 19 2.2% 1.0% 10.1% 4.8% NA 0.40x 8.3x NA NA
Mean 0.9% 0.5% 16.4% 10.1% 25.9x 1.27x 11.7x 1.50x 10.1x
Median 1.6% 1.8% 14.0% 11.0% 25.9x 1.19x 10.7x 1.38x 10.4x
Fine Dining
Del Frisco's Restaurant Group, Inc. DFRG $17.20 98.9% $405 $402 0% $347 $44 7.2% 10.7% 18.0% 12.8% 21.8x 1.16x 9.0x 1.06x 8.0x
Fogo de Chao, Inc. FOGO 13.85 77.4% 390 526 2% 285 53 8.4% NA 25.3% 18.7% 13.2x 1.84x 9.9x 1.65x 8.7x
Ruth's Hospitality Group, Inc. RUTH 17.00 90.5% 542 574 54% 383 59 22.7% (2.5%) 23.6% 15.3% 18.1x 1.50x 9.8x 1.38x 8.7x
Mean 12.8% 4.1% 22.3% 15.6% 17.7x 1.50x 9.6x 1.36x 8.5x
Median 8.4% 4.1% 23.6% 15.3% 18.1x 1.50x 9.8x 1.38x 8.7x
EV / LTM EV / 2017ERevenue Growth LTM MarginsLTM
PUBLIC COMPANY PERFORMANCE5,6
8
RESTAURANTS
INDUSTRY UPDATE │ DECEMBER 2016
* Percentage Franchised is Based on 2015 YE Units.
*
SUMMARY
PAGE |
0.0x
2.0x
4.0x
6.0x
Debt/
EBITDA
Senior Debt/
EBITDA
EBITDA/
Cash Interest
EBITDA -
Capex/
Cash Interest
2012 2013 2014 2015 LTM Jun-16
L+0
L+100
L+200
L+300
L+400
L+500
L+600
2010 2011 2012 2013 2014 2015 1H16
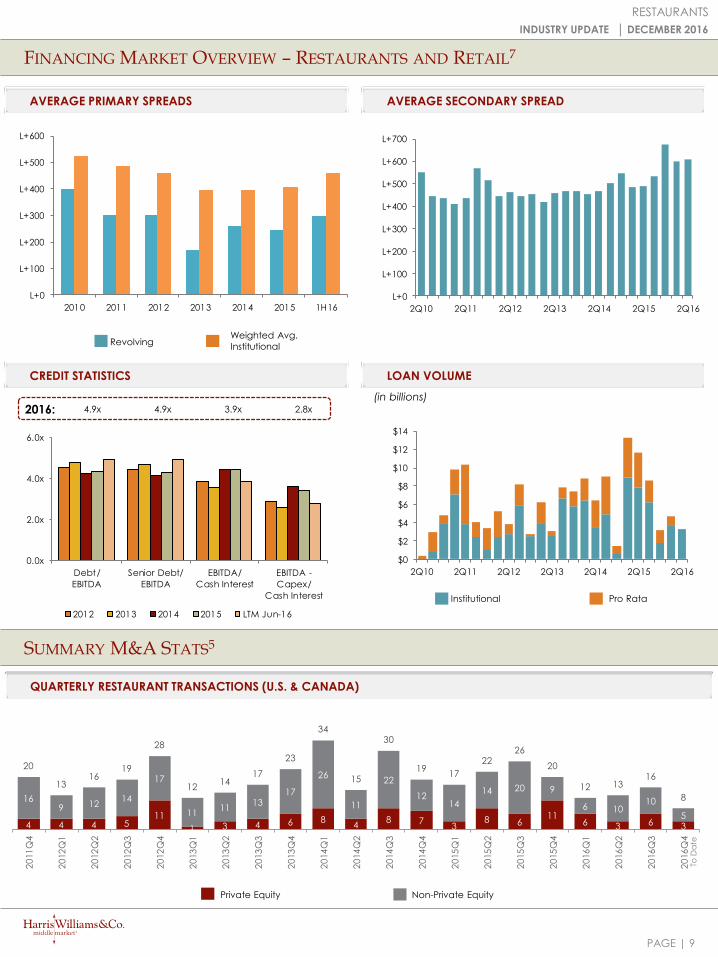
4.9x2016:
FINANCING MARKET OVERVIEW – RESTAURANTS AND RETAIL7
9
RESTAURANTS
INDUSTRY UPDATE │ DECEMBER 2016
QUARTERLY RESTAURANT TRANSACTIONS (U.S. & CANADA)
LOAN VOLUMECREDIT STATISTICS
AVERAGE PRIMARY SPREADS AVERAGE SECONDARY SPREAD
SUMMARY M&A STATS5
$0
$2
$4
$6
$8
$10
$12
$14
2Q10 2Q11 2Q12 2Q13 2Q14 2Q15 2Q16
Institutional Pro Rata
Weighted Avg.
InstitutionalRevolving
(in billions)
L+0
L+100
L+200
L+300
L+400
L+500
L+600
L+700
2Q10 2Q11 2Q12 2Q13 2Q14 2Q15 2Q16
4.9x 3.9x 2.8x
Non-Private EquityPrivate Equity
4 4 4 511
1 3 4 6 84
8 73
8 611
6 3 6 3
169 12
14
17
1111
1317
26
11
22
1214
14 20 9
6 1010
5
20
1316
19
28
1214
17
23
34
15
30
1917
2226
20
12 1316
8
20
11
Q4
20
12
Q1
20
12
Q2
20
12
Q3
20
12
Q4
20
13
Q1
20
13
Q2
20
13
Q3
20
13
Q4
20
14
Q1
20
14
Q2
20
14
Q3
20
14
Q4
20
15
Q1
20
15
Q2
20
15
Q3
20
15
Q4
20
16
Q1
20
16
Q2
20
16
Q3
20
16
Q4
To D
ate
PAGE |
M&A TRANSACTION INFORMATION5,6
10
RESTAURANTS
INDUSTRY UPDATE │ DECEMBER 2016
NOTABLE TRANSACTIONS
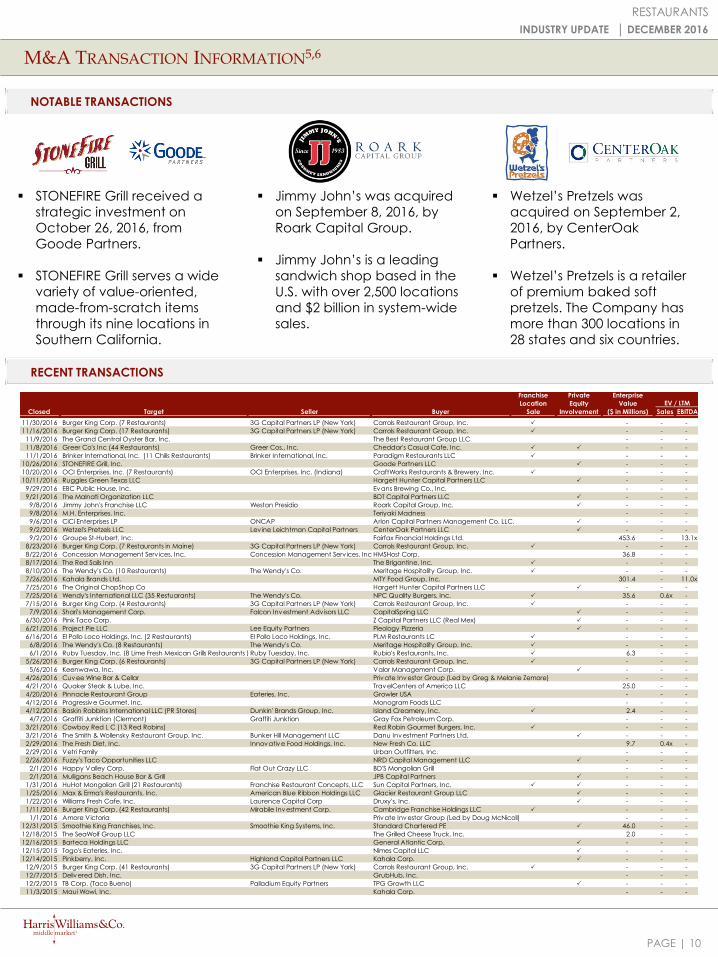
RECENT TRANSACTIONS
Jimmy John’s was acquired
on September 8, 2016, by
Roark Capital Group.
Jimmy John’s is a leading
sandwich shop based in the
U.S. with over 2,500 locations
and $2 billion in system-wide
sales.
Wetzel’s Pretzels was
acquired on September 2,
2016, by CenterOak
Partners.
Wetzel’s Pretzels is a retailer
of premium baked soft
pretzels. The Company has
more than 300 locations in
28 states and six countries.
STONEFIRE Grill received a
strategic investment on
October 26, 2016, from
Goode Partners.
STONEFIRE Grill serves a wide
variety of value-oriented,
made-from-scratch items
through its nine locations in
Southern California.
EV / LTM
Closed Target Seller Buyer Sales EBITDA
11/30/2016 Burger King Corp. (7 Restaurants) 3G Capital Partners LP (New York) Carrols Restaurant Group, Inc. P - - -
11/16/2016 Burger King Corp. (17 Restaurants) 3G Capital Partners LP (New York) Carrols Restaurant Group, Inc. P - - -
11/9/2016 The Grand Central Oyster Bar, Inc. The Best Restaurant Group LLC - - -
11/8/2016 Greer Co's Inc (44 Restaurants) Greer Cos., Inc. Cheddar's Casual Cafe, Inc. P P - - -
11/1/2016 Brinker International, Inc. (11 Chilis Restaurants) Brinker International, Inc. Paradigm Restaurants LLC P - - -
10/26/2016 STONEFIRE Grill, Inc. Goode Partners LLC P - - -
10/20/2016 OCI Enterprises, Inc. (7 Restaurants) OCI Enterprises, Inc. (Indiana) CraftWorks Restaurants & Brewery, Inc. P - - -
10/11/2016 Ruggles Green Texas LLC Hargett Hunter Capital Partners LLC P - - -
9/29/2016 EBC Public House, Inc. Evans Brewing Co., Inc. - - -
9/21/2016 The Malnati Organization LLC BDT Capital Partners LLC P - - -
9/8/2016 Jimmy John's Franchise LLC Weston Presidio Roark Capital Group, Inc. P - - -
9/8/2016 M.H. Enterprises, Inc. Teriyaki Madness - - -
9/6/2016 CiCi Enterprises LP ONCAP Arlon Capital Partners Management Co. LLC. P - - -
9/2/2016 Wetzel's Pretzels LLC Lev ine Leichtman Capital Partners CenterOak Partners LLC P - - -
9/2/2016 Groupe St-Hubert, Inc. Fairfax Financial Holdings Ltd. 453.6 - 13.1x
8/23/2016 Burger King Corp. (7 Restaurants in Maine) 3G Capital Partners LP (New York) Carrols Restaurant Group, Inc. P - - -
8/22/2016 Concession Management Serv ices, Inc. Concession Management Serv ices, Inc.HMSHost Corp. 36.8 - -
8/17/2016 The Red Sails Inn The Brigantine, Inc. P - - -
8/10/2016 The Wendy's Co. (10 Restaurants) The Wendy's Co. Meritage Hospitality Group, Inc. P - - -
7/26/2016 Kahala Brands Ltd. MTY Food Group, Inc. 301.4 - 11.0x
7/25/2016 The Original ChopShop Co Hargett Hunter Capital Partners LLC P - - -
7/25/2016 Wendy's International LLC (35 Restuarants) The Wendy's Co. NPC Quality Burgers, Inc. P 35.6 0.6x -
7/15/2016 Burger King Corp. (4 Restaurants) 3G Capital Partners LP (New York) Carrols Restaurant Group, Inc. P - - -
7/9/2016 Shari's Management Corp. Falcon Investment Adv isors LLC CapitalSpring LLC P - - -
6/30/2016 Pink Taco Corp. Z Capital Partners LLC (Real Mex) P - - -
6/21/2016 Project Pie LLC Lee Equity Partners Pieology Pizzeria P - - -
6/16/2016 El Pollo Loco Holdings, Inc. (2 Restaurants) El Pollo Loco Holdings, Inc. PLM Restaurants LC P - - -
6/8/2016 The Wendy's Co. (8 Restaurants) The Wendy's Co. Meritage Hospitality Group, Inc. P - - -
6/1/2016 Ruby Tuesday, Inc. (8 Lime Fresh Mexican Grills Restaurants ) Ruby Tuesday, Inc. Rubio's Restaurants, Inc. P 6.3 - -
5/26/2016 Burger King Corp. (6 Restaurants) 3G Capital Partners LP (New York) Carrols Restaurant Group, Inc. P - - -
5/6/2016 Keenwawa, Inc. Valor Management Corp. P - - -
4/26/2016 Cuvee Wine Bar & Cellar Private Investor Group (Led by Greg & Melanie Zemore) - - -
4/21/2016 Quaker Steak & Lube, Inc. TravelCenters of America LLC 25.0 - -
4/20/2016 Pinnacle Restaurant Group Eateries, Inc. Growler USA - - -
4/12/2016 Progressive Gourmet, Inc. Monogram Foods LLC - - -
4/12/2016 Baskin Robbins International LLC (PR Stores) Dunkin' Brands Group, Inc. Island Creamery, Inc. P 2.4 - -
4/7/2016 Graffiti Junktion (Clermont) Graffiti Junktion Gray Fox Petroleum Corp. - - -
3/21/2016 Cowboy Red L C (13 Red Robins) Red Robin Gourmet Burgers, Inc. P - - -
3/21/2016 The Smith & Wollensky Restaurant Group, Inc. Bunker Hill Management LLC Danu Investment Partners Ltd. P - - -
2/29/2016 The Fresh Diet, Inc. Innovative Food Holdings, Inc. New Fresh Co. LLC 9.7 0.4x -
2/29/2016 Vetri Family Urban Outfitters, Inc. - - -
2/26/2016 Fuzzy's Taco Opportunities LLC NRD Capital Management LLC P - - -
2/1/2016 Happy Valley Corp. Flat Out Crazy LLC BD'S Mongolian Grill - - -
2/1/2016 Mulligans Beach House Bar & Grill JPB Capital Partners P - - -
1/31/2016 HuHot Mongolian Grill (21 Restaurants) Franchise Restaurant Concepts, LLC Sun Capital Partners, Inc. P P - - -
1/25/2016 Max & Erma's Restaurants, Inc. American Blue Ribbon Holdings LLC Glacier Restaurant Group LLC P - - -
1/22/2016 Williams Fresh Cafe, Inc. Laurence Capital Corp Druxy's, Inc. P - - -
1/11/2016 Burger King Corp. (42 Restaurants) Mirabile Investment Corp. Cambridge Franchise Holdings LLC P - - -
1/1/2016 Amore Victoria Private Investor Group (Led by Doug McNicoll) - - -
12/31/2015 Smoothie King Franchises, Inc. Smoothie King Systems, Inc. Standard Chartered PE P 46.0 - -
12/18/2015 The SeaWolf Group LLC The Grilled Cheese Truck, Inc. 2.0 - -
12/16/2015 Barteca Holdings LLC General Atlantic Corp. P - - -
12/15/2015 Togo's Eateries, Inc. Nimes Capital LLC P - - -
12/14/2015 Pinkberry, Inc. Highland Capital Partners LLC Kahala Corp. P - - -
12/9/2015 Burger King Corp. (41 Restaurants) 3G Capital Partners LP (New York) Carrols Restaurant Group, Inc. P - - -
12/7/2015 Delivered Dish, Inc. GrubHub, Inc. - - -
12/2/2015 TB Corp. (Taco Bueno) Palladium Equity Partners TPG Growth LLC P - - -
11/3/2015 Maui Wowi, Inc. Kahala Corp. - - -
Franchise
Location
Sale
Private
Equity
Involvement
Enterprise
Value
($ in Millions)

Energy & Power
IndustrialsHealthcare & Life Sciences
Transportation & Logistics
Aerospace, Defense & Government
Services
Business Services
Building Products & Materials
Technology, Media & Telecom
Specialty Distribution
Consumer
PAGE |
HARRIS WILLIAMS & CO. OFFICE LOCATIONS
UNITED STATES EUROPE
BostonTwo International Place24th FloorBoston, Massachusetts 02110Phone: +1 (617) 482-7501
Cleveland1900 East 9th Street20th FloorCleveland, Ohio 44114Phone: +1 (216) 689-2400
Minneapolis222 South 9th StreetSuite 3350Minneapolis, Minnesota 55402Phone: +1 (612) 359-2700
Richmond (U.S. Headquarters)1001 Haxall Point9th FloorRichmond, Virginia 23219Phone: +1 (804) 648-0072
San Francisco575 Market Street31st FloorSan Francisco, California 94105Phone: +1 (415) 288-4260
Washington, D.C.800 17th St. NW2nd FloorWashington, D.C. 20006Phone: + 1 (202) 207-2300
FrankfurtBockenheimer Landstrasse 33-3560325 FrankfurtGermanyPhone: +49 069 3650638 00
London63 Brook StreetLondon W1K 4HS, EnglandPhone: +44 (0) 20 7518 8900
NETWORK OFFICES
Beijing
Hong Kong
Mumbai
New Delhi
Shanghai
Consumer
Harris Williams & Co. has a broad range of industry expertise, which creates powerful opportunities.Our clients benefit from our deep-sector experience, integrated industry intelligence andcollaboration across the firm, and our commitment to learning what makes them unique. For moreinformation, visit our website at www.harriswilliams.com/industries.
OUR FIRM
RESTAURANTS
INDUSTRY UPDATE │ DECEMBER 2016
11
PAGE |
HARRIS WILLIAMS & CO.
1. Bureau of Labor Statistics.
2. University of Michigan.
3. USDA Economic Research Service: Food Expenditures.
4. IMF.
5. Factset.
6. Company Filings & Press Releases.
7. S&P.
SOURCES
RESTAURANTS
INDUSTRY UPDATE │ DECEMBER 2016
Harris Williams & Co. (www.harriswilliams.com) is a preeminent middle market investment bank focused on the advisory needs of clients worldwide. The firm has deep industry knowledge, global transaction expertise, and an unwavering commitment to excellence. Harris Williams & Co. provides sell-side and acquisition advisory, restructuring advisory, board advisory, private placements, and capital markets advisory services.
Investment banking services are provided by Harris Williams LLC and Solebury Capital LCC, registered broker-dealers and members of FINRA and SIPC,and Harris Williams & Co. Ltd, which is authorized and regulated by the Financial Conduct Authority. Harris Williams & Co. is a trade name under whichHarris Williams LLC and Harris Williams & Co. Ltd conduct business.
THIS REPORT MAY CONTAIN REFERENCES TO REGISTERED TRADEMARKS, SERVICE MARKS AND COPYRIGHTS OWNED BY THIRD-PARTY INFORMATION PROVIDERS. NONE OF THE THIRD-PARTY INFORMATION PROVIDERS IS ENDORSING THE OFFERING OF, AND SHALL NOT IN ANY WAY BE DEEMED AN ISSUER OR UNDERWRITER OF, THE SECURITIES, FINANCIAL INSTRUMENTS OR OTHER INVESTMENTS DISCUSSED IN THIS REPORT, AND SHALL NOT HAVE ANY LIABILITY OR RESPONSIBILITY FOR ANY STATEMENTS MADE IN THE REPORT OR FOR ANY FINANCIAL STATEMENTS, FINANCIAL PROJECTIONS OR OTHER FINANCIAL INFORMATION CONTAINED OR ATTACHED AS AN EXHIBIT TO THE REPORT. FOR MORE INFORMATION ABOUT THE MATERIALS PROVIDED BY SUCH THIRD PARTIES, PLEASE CONTACT US AT THE ABOVE ADDRESSES OR NUMBERS.
The information and views contained in this report were prepared by Harris Williams & Co. (“Harris Williams”). It is not a research report, as such term is defined by applicable law and regulations, and is provided for informational purposes only. It is not to be construed as an offer to buy or sell or a solicitation of an offer to buy or sell any financial instruments or to participate in any particular trading strategy. The information contained herein is believed by Harris Williams to be reliable, but Harris Williams makes no representation as to the accuracy or completeness of such information. Harris Williams and/or its affiliates may be market makers or specialists in, act as advisers or lenders to, have positions in and effect transactions in securities of companies mentioned herein and also may provide, may have provided, or may seek to provide investment banking services for those companies. In addition, Harris Williams and/or its affiliates or their respective officers, directors and employees may hold long or short positions in the securities, options thereon or other related financial products of companies discussed herein. Opinions, estimates and projections in this report constitute Harris Williams’ judgment and are subject to change without notice. The financial instruments discussed in this report may not be suitable for all investors, and investors must make their own investment decisions using their own independent advisors as they believe necessary and based upon their specific financial situations and investment objectives. Also, past performance is not necessarily indicative of future results. No part of this material may be copied or duplicated in any form or by any means, or redistributed, without Harris Williams’ prior written consent.
Copyright© 2016 Harris Williams & Co., all rights reserved.
DISCLOSURES
12