Embed Size (px)
Citation preview
Please cite this paper as:
Beltramello, A., K. De Backer and L. Moussiegt (2012),“The Export Performance of Countries within Global ValueChains (GVCs)”, OECD Science, Technology and IndustryWorking Papers, 2012/02, OECD Publishing.http://dx.doi.org/10.1787/5k9bh3gv6647-en
OECD Science, Technology andIndustry Working Papers 2012/02
The Export Performanceof Countries within GlobalValue Chains (GVCs)
Andrea Beltramello, Koen De Backer,Laurent Moussiegt
Unclassified DSTI/DOC(2012)2 Organisation de Coopération et de Développement Économiques Organisation for Economic Co-operation and Development 12-Apr-2012 ___________________________________________________________________________________________
English - Or. English DIRECTORATE FOR SCIENCE, TECHNOLOGY AND INDUSTRY
THE EXPORT PERFORMANCE OF COUNTRIES WITHIN GLOBAL VALUE CHAINS (GVCs) OECD Science, Technology and Industry Working Paper 2012/2
By Andrea Beltramello, Koen De Backer and Laurent Moussiegt (OECD)
JT03319656
Complete document available on OLIS in its original format This document and any map included herein are without prejudice to the status of or sovereignty over any territory, to the delimitation of international frontiers and boundaries and to the name of any territory, city or area.
DSTI/D
OC
(2012)2 U
nclassified
English - O
r. English
DSTI/DOC(2012)2
2
STI Working Paper Series
The Working Paper series of the OECD Directorate for Science, Technology and Industry is designed to make available to a wider readership selected studies prepared by staff in the Directorate or by outside consultants working on OECD projects. The papers included in the series cover a broad range of issues, of both a technical and policy-analytical nature, in the areas of work of the DSTI. The Working Papers are generally available only in their original language – English or French – with a summary in the other.
Comments on the papers are invited, and should be sent to the Directorate for Science, Technology and Industry, OECD, 2 rue André-Pascal, 75775 Paris Cedex 16, France.
The opinions expressed in these papers are the sole responsibility of the author(s) and do not necessarily reflect those of the OECD or of the governments of its member countries.
www.oecd.org/sti/working-papers
OECD/OCDE, 2012
Applications for permission to reproduce or translate all or part of this material should be made to: OECD Publications, 2 rue André-Pascal, 75775 Paris, Cedex 16, France; e-mail: [email protected]
DSTI/DOC(2012)2
3
ABSTRACT
Andrea Beltramello, Koen de Backer and Laurent Moussiegt
The growing importance of global value chains (GVCs) in the international organisation of production increasingly challenges the traditional way of measuring countries’ export performance and hence international competitiveness. As a result of growing production fragmentation, a country’s export bundle nowadays incorporates imports of intermediate goods representing a (large) part of its value. In this case, simply looking at the evolution of exports may misrepresent the international competitive position of a country. This paper discusses the export performance of countries along the value chain by distinguishing upstream activities (i.e. the production of intermediate inputs) and more downstream activities (e.g. the final assembly of products). The empirical analysis first shows how imports of intermediates increasingly determine the export competitiveness of countries in final products. Second, the paper analyses the developments at the intensive and extensive margins of trade and studies how structural changes in terms of geographical and sectoral composition, largely outside the influence of national policies, have contributed to countries’ export performance.
RÉSUMÉ
Andrea Beltramello, Koen de Backer, et Laurent Moussiegt
L'importance croissante des chaînes de valeur mondiales (CVM) dans l'organisation internationale de la production remet en question la façon traditionnelle de mesurer la performance à l’exportation et par conséquent la compétitivité internationale des pays. De nos jours, en raison de la fragmentation de la production, les exportations d'un pays intègrent des importations de biens intermédiaires qui représentent une partie (importante) de leur valeur. Dans ce cas, regarder exclusivement l'évolution des exportations peut biaiser la position concurrentielle internationale d'un pays. Ce document de travail examine la performance à l’exportation des pays au long des CVM, en distinguant les activités en amont (à savoir la production d'intrants) des activités en aval (par exemple l'assemblage final des produits). L'analyse empirique montre d'abord que les importations de biens intermédiaires déterminent de plus en plus la compétitivité des exportations des biens finaux des pays. Deuxièmement, le document de travail analyse les développements au niveau des marges intensive et extensive du commerce, et examine comment les changements structurels en termes de composition géographique et sectorielle des exportations, qui sont en grande partie hors de l'influence des politiques nationales, ont contribué à la performance à l’exportation des pays.
DSTI/DOC(2012)2
4
TABLE OF CONTENTS
EXECUTIVE SUMMARY ............................................................................................................................ 5
THE EXPORT PERFORMANCE OF COUNTRIES WITHIN GLOBAL VALUE CHAINS (GVCs)........ 7
1. Introduction .......................................................................................................................................... 7
2. Export performance at a glance: global repositioning.......................................................................... 9
3. Export performance and the role of GVCs......................................................................................... 11
4. Export performance at the intensive and extensive margin ............................................................... 17
5. Export growth: a decomposition of the geographic, sectoral and performance effects ..................... 23
6. Export performance during the 2007-2009 “great trade collapse”: a disaggregated view ................. 27
7. Conclusion ......................................................................................................................................... 30
REFERENCES ............................................................................................................................................. 32
ANNEX 1: TECHNOLOGY CLASSIFICATION OF INDUSTRIES ........................................................ 32
ANNEX 2: ADDITIONAL DATA ON EXPORT PERFORMANCE AND GVC INTEGRATION .......... 33
ANNEX 3: SHIFT-SHARE ANALYSIS METHODOLOGY ..................................................................... 38
Traditional Shift-share analysis methodology ........................................................................................... 38
Shift-share analysis methodology based on econometrics ........................................................................ 40
DSTI/DOC(2012)2
5
EXECUTIVE SUMMARY
The increasing importance of global value chains (GVCs) in the international organisation of production poses some challenges to the traditional way of measuring countries’ export performance and international competitiveness. A country’s export bundle often incorporates imports of intermediate goods representing a large part (or even the majority) of its value. In this case, simply looking at the evolution of exports at the industry or even product level may misrepresent the international competitive position of a country. In order to get a more accurate picture of competitiveness, one also has to analyse the specialisation of countries in terms of activities, e.g. upstream activities in the production of components and inputs or more downstream activities in the final assembly of products. The purpose of this paper is to analyse the export performance of countries in the context of the increasing importance of GVCs.
Aggregate figures on export and import market shares show that a strong repositioning is taking place within the global economy, resulting in a more prominent role for emerging economies. Conventional wisdom holds that emerging economies made significant gains in world export market shares mainly in low-tech industries, while OECD countries maintained an advantage in high tech products. However, an analysis of export performance at the level of industries with different technological intensities shows that this is an inaccurate assumption at best, as emerging countries also gained large shares of world exports in high and medium-high technology industries.
In addition, emerging economies have gained export shares in final as well as intermediate goods, further underlining the growing importance of these countries in international markets. At the same time, the combination of emerging countries' fast growing exports and imports of intermediate goods and their increasing exports of final goods shows that these countries have been able to integrate into GVCs strongly. An increasing part of international trade (i.e. vertical trade) concerns the import of intermediates that will be included in the exports of final or further processed intermediate products.
The growing development of GVCs increasingly challenge the ‘export’ measures of competitiveness given that countries’ exports are to a large extent made up of imports of intermediate inputs from abroad. Case studies have already demonstrated the importance of imported intermediates for the exports of specific products, and also more aggregate evidence increasingly confirms that GVCs are not only about exports but also imports. In addition, correlating measures of specialisation of final goods exports with corresponding indicators of specialisation in intermediate goods imports shows an increasingly positive impact of import specialisation (in intermediates) on export specialisation (of final products).
The above conclusions are confirmed when distinguishing between high, medium and low technology intensive industries. Significant gains in import shares by China and other emerging economies have been recorded in high and medium-high technology parts and components. These imports (partially) explain the large gains realised by these countries in exports of high-tech consumption goods. However, this standard view of the division of labour between advanced and emerging economies is tempered by the evidence of a parallel increase in exports of high and medium-high technology intermediate goods from countries like China.
DSTI/DOC(2012)2
6
Disaggregating the growth of world market shares in the period 1995–2007 shows that export growth occurred mainly at the intensive margin (i.e. through an increase in the value of existing trade flows). This is especially the case for final goods, while the extensive margin (i.e. the emergence of new flows in terms of products traded and destination markets served) seems to be relatively more important in explaining the growth of exports in intermediate goods. This suggests that the international fragmentation of production has accommodated the emergence of new competitors within the category of intermediate goods. In addition, an important process of reallocation/churning takes place within GVCs with important new product-market combinations (entries) that have replaced existing combinations (exits).
One explanation for the difference between final and intermediate goods could be given by the often large sunk investments required to begin exporting final products (e.g. R&D, branding, capital, etc.); hence, competition with incumbent companies could be expected to be more intense and less successful. GVCs have allowed emerging countries to integrate rapidly into global operations and enter export markets, but this does not guarantee their upgrading in later stages.
Emerging countries display stronger growth at the extensive margin across all categories of products, with the largest changes in intermediates. The results seem to suggest that these countries have established a foothold in international markets especially in intermediate goods and to a lesser extent in final products.
Overall, the results are in line with previous research: the intensive margin is the main driver of trade growth, followed by, in order of importance: new combinations of existing exported products to existing export markets; new products exported to existing markets; and finally, existing products exported to new markets. Product diversification seems to play a relatively more important role than geographic diversification in explaining trade growth. Simultaneous product and geographic diversification accounts for only a small fraction of the extensive margin of export growth.
A decomposition of structural and performance-related contributions to changes in export market shares at the intensive margin reveals that “pure” competitiveness (or lack thereof) was the main driver of trade growth in the period 1995-2007. A positive performance effect was the main contributing factor to growth for emerging countries. On the contrary, for the largest OECD exporters, the performance effect was negative and the most important explanation for the loss in market shares.
In addition, breaking down total trade by end use allows taking into account the role of GVCs in explaining countries' trade performance. Overall, most large OECD economies, with just a few exceptions, have not experienced growth in the exporting of either consumption or intermediate goods, and this is mainly due to their lack of (pure) competitiveness. Conversely, emerging economies have gained competitiveness especially in intermediate goods. Hence, countries that are increasing their world market shares seem to be relatively more successful (in terms of their “pure” competitiveness) in exporting intermediate goods compared to consumption goods.
The large negative performance effect of most large OECD economies was (partially) compensated by positive sectoral and geographic effects, and this relatively more for consumption goods than for intermediate goods. While the sectoral effect is positive both in consumption and intermediate goods for almost all OECD countries, the geographic effect is much more diverse, particularly for the category of intermediate goods. This is probably due to the - still limited - focus in OECD countries on emerging economies as centres of production; export promotion policies could help here.
Several high-performing emerging economies exhibit negative values of the structural effects, particularly of the sectoral effect for both consumption and intermediate goods, reflecting these economies’ specialisation in industries with relatively low growth.
DSTI/DOC(2012)2
7
THE EXPORT PERFORMANCE OF COUNTRIES WITHIN GLOBAL VALUE CHAINS (GVCs)
1. Introduction
International competitiveness has traditionally been high on the policy agenda in most countries as it is believed to be key for economic growth, jobs and productivity in a global economy. Although the academic debate is still ongoing (and probably will continue for some time) on how to define the competitiveness of countries,1 the economic and political discourse typically assesses international competitiveness based on export market shares (i.e. the share of an economy in the world market for a particular good/industry). However, the process of globalisation increasingly challenges this (simple) measurement of competitiveness by export market shares and calls for a more qualified, read disaggregated, level of analysis.
A general observation emerging from aggregate export figures is that during the past decades the international competitiveness of developed countries has gradually been eroded to the advantage of emerging countries. OECD countries have lost, in some cases significant, export market shares while especially China, and to a lesser extent other emerging countries, have gained strong positions in international markets. A first broad question is if these figures have to be interpreted as a real loss of competitiveness of developed countries; after all, is it not logical that in an increasingly global economy with a growing number of exporters, relative measures such as market shares decrease for incumbent players? Second, what do these export market shares actually measure in a world of global value chains (GVCs) where exports (of final goods) are increasingly composed of imports (of intermediate goods)? Third, what constitutes the true competitiveness of countries in international markets, and do governments have an impact on it?
Production processes have become internationally fragmented with goods increasingly produced in subsequent stages across different countries. As a result, a country’s export bundle incorporates imports of intermediate goods representing a large part (or even the majority) of its value; hence, simply looking at the evolution of exports at the industry or even product level may misrepresent the international competitive position of a country. Case studies like the one on Apple’s iPod (Linden, Kraemer and Dedrick, 2009) have demonstrated the importance of high value intermediates exported for final assembly to China. The corresponding export market share of China as it appears from official trade statistics does not necessarily tell much about the competitive edge of the country in this product (OECD, 2011).
The international fragmentation allows (or forces) countries to specialise in different activities in the production process (manufacturing of intermediates, final assembly, etc.), in addition to their traditional specialisation in products and industries. In order to achieve a more accurate picture of a country’s competitiveness, one has to analyse the specialisation of countries in terms of activities, e.g. upstream activities in the production of components and inputs or more downstream activities in the final assembly of products. This paper tries first to disentangle the export performance of countries along the value chain by analysing the competitive strengths of countries in final (consumption) goods and intermediate goods. In doing this, the impact of imported intermediates on the export competitiveness of countries is studied across different types of industries.
DSTI/DOC(2012)2
8
Second, the export performance of countries is further analysed through developments at the intensive and extensive margins. Exports can grow as firms export higher volumes and/or values of the products they have been already exporting to existing trade partners (the intensive margin). Alternatively, countries’ exports can also grow through market development, as firms export their existing products to new partners, and through innovation, as firms develop new products and export these to existing partners and/or new markets (extensive margin). This distinction has direct policy implications since the welfare effects of export growth along the intensive and extensive margin are quite different. Export growth at the intensive margin may worsen a country's terms of trade by causing a decrease in the price of the exported product in world markets; the extensive margin does generally not display this adverse term of trade effect and hence may lead to additional welfare gains (Liapis, 2009). Likewise, the same negative shock may affect the two margins differently: for example, deteriorating terms of trade may have a relatively less significant negative effect on a country that is exporting new products (i.e. whose trade grows at the extensive margin).
Separating export margins of final and intermediate products also allows us to analyse how new competitors have become integrated in GVCs (through the extensive margin). It can be hypothesised that getting a foothold in international markets by exporting final goods is more difficult than by exporting intermediate goods, largely as a reflection of the higher investments (often with a sunk cost character) required to start exporting final goods (e.g. capital investments, R&D, branding, etc.). Hence, it could be expected that emerging economies would be relatively more successful in growing along the extensive margin in exporting intermediate goods.
Lastly, the paper discusses how structural changes in terms of geographical and sectoral composition, largely outside the influence of national policies, have contributed to countries’ export performance (through the intensive margin). The remaining performance could be considered as a “purer” measure of competitiveness explaining how countries have gained or lost global market shares.
All together, this paper analyses the export performance of countries within GVCs in order to answer a number of questions that are directly relevant for policy:
• How has the export performance of developed and emerging countries changed over the years? Are there differences between industries with different levels of technological intensity?
• Is there a difference in the evolution of export market shares according to the position of goods along the value chain? And are these changes in export performance related to changes in countries' imports? Given that GVCs are not only about exports, but increasingly also about imports, the analysis will focus on how import shares of countries have changed across consumption and intermediate goods.
• Do changes in export flows result from an increase in the volume of existing flows or from the emergence of new products and/or export markets? An analysis separating between final and intermediate goods will shed light on the reallocation of production activities caused by the development of GVCs, more particularly where new competitors emerge.
• What are the drivers of export growth? Is growth primarily related to the growth of demand in export markets and the growth of world demand for the exported product? Or, alternatively, have companies in the exporting country become more competitive?
DSTI/DOC(2012)2
9
The analysis includes OECD countries as well as emerging economies (OECD accession and enhanced engagement countries)2 given the growing role of the latter in the global economy. The paper discusses the export performance over the period 1995-2007, thus before the great trade collapse of 2008-2009 in order to focus exclusively on structural trends. Section 5 however discusses focuses specifically on the period 2008-2009, in order to see if divergent developments have taken place. Box 1 describes the dataset used throughout this paper.
Box 1. The dataset
The data used in the paper comes from BACI (Base pour l'Analyse du Commerce International), an international trade database of the Centre d’Etudes Prospectives et d’Informations Internationals (CEPII) developed by Gaulier and Zignago (2010). The database covers more than 200 countries and 5 000 products. This database is developed using an original procedure that reconciles the declarations of the exporter and the importer (United Nations COMTRADE data), resulting in a larger number of countries for which trade data are available, as compared to the original dataset. CIF (cost, insurance and freight) costs have been estimated and removed from the import values in order to arrive at mirror FOB (free on board) flows of exports and imports.
Changes in market shares are broken down according to the end use of exports: final consumption and intermediate. The latter category is further separated into parts and components, semi-finished goods and primary goods. This allows relating the changes in export market shares to the international fragmentation of production and the formation of GVCs. Consumption and intermediate goods are identified through the United Nations Broad Economic Categories (BEC) classification, which groups commodities according to their main end use. In BACI, the traded commodities themselves are defined in terms of the Harmonised Commodity Description and Coding System (HS). Hence, BEC assigns HS commodities to 19 basic categories of goods, of which: six are categories of consumption goods; two are categories of capital goods; and eight are categories of intermediate goods. 1
A further dimension is added to the analysis by looking at exports and imports by level of technological intensity. The OECD classifies manufacturing industries in four categories of technological intensity: high technology, medium-high technology, medium-low technology and low technology. This classification is based on indicators of (direct as well indirect) technological intensity which reflect to some degree “technology-producer” or “technology-user” aspects (Hatzichronoglou, 1997). See Annex 1 for additional details.
1. The remaining three categories are not classified and include: “fuels and lubricant, processed, motor spirit”; passenger motor cars”; “goods not elsewhere specified”.
2. Export performance at a glance: global repositioning
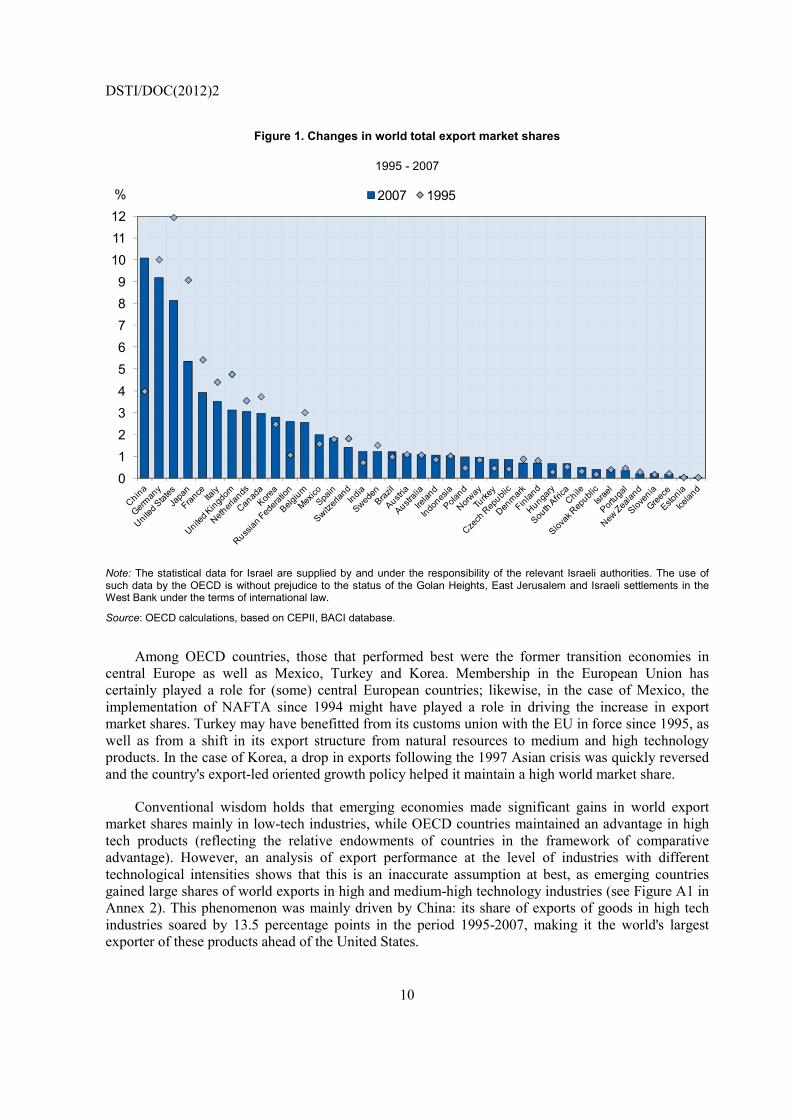
Aggregate figures on export shares clearly show the strong repositioning taking place within the global economy resulting in a more prominent role for emerging economies (Figure 1). Larger OECD countries lost market shares between 1995 and 2007, particularly the United States and Japan (by 3.8 and 3.7 percentage points, respectively). These losses occurred mainly to the advantage of China, which more than doubled its export market share (from 4% in 1995 to 10.1% in 2007) and became the world’s largest exporter. Other important emerging economies (the Russian Federation, India, Brazil and South Africa) also increased their market share although none of them achieved the same growth rate as China.
DSTI/DOC(2012)2
10
Figure 1. Changes in world total export market shares
1995 - 2007
0123456789
101112
2007 1995%
Note: The statistical data for Israel are supplied by and under the responsibility of the relevant Israeli authorities. The use of such data by the OECD is without prejudice to the status of the Golan Heights, East Jerusalem and Israeli settlements in the West Bank under the terms of international law.
Source: OECD calculations, based on CEPII, BACI database.
Among OECD countries, those that performed best were the former transition economies in central Europe as well as Mexico, Turkey and Korea. Membership in the European Union has certainly played a role for (some) central European countries; likewise, in the case of Mexico, the implementation of NAFTA since 1994 might have played a role in driving the increase in export market shares. Turkey may have benefitted from its customs union with the EU in force since 1995, as well as from a shift in its export structure from natural resources to medium and high technology products. In the case of Korea, a drop in exports following the 1997 Asian crisis was quickly reversed and the country's export-led oriented growth policy helped it maintain a high world market share.
Conventional wisdom holds that emerging economies made significant gains in world export market shares mainly in low-tech industries, while OECD countries maintained an advantage in high tech products (reflecting the relative endowments of countries in the framework of comparative advantage). However, an analysis of export performance at the level of industries with different technological intensities shows that this is an inaccurate assumption at best, as emerging countries gained large shares of world exports in high and medium-high technology industries (see Figure A1 in Annex 2). This phenomenon was mainly driven by China: its share of exports of goods in high tech industries soared by 13.5 percentage points in the period 1995-2007, making it the world's largest exporter of these products ahead of the United States.
DSTI/DOC(2012)2
11
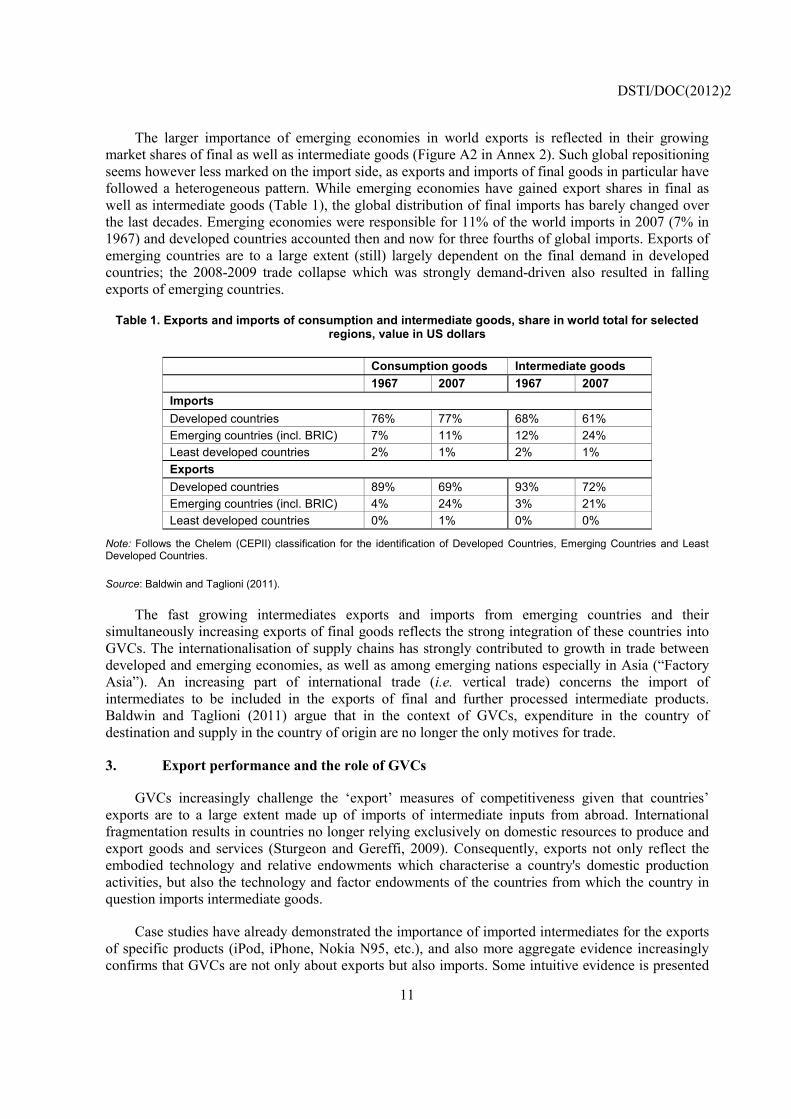
The larger importance of emerging economies in world exports is reflected in their growing market shares of final as well as intermediate goods (Figure A2 in Annex 2). Such global repositioning seems however less marked on the import side, as exports and imports of final goods in particular have followed a heterogeneous pattern. While emerging economies have gained export shares in final as well as intermediate goods (Table 1), the global distribution of final imports has barely changed over the last decades. Emerging economies were responsible for 11% of the world imports in 2007 (7% in 1967) and developed countries accounted then and now for three fourths of global imports. Exports of emerging countries are to a large extent (still) largely dependent on the final demand in developed countries; the 2008-2009 trade collapse which was strongly demand-driven also resulted in falling exports of emerging countries.
Table 1. Exports and imports of consumption and intermediate goods, share in world total for selected regions, value in US dollars
Consumption goods Intermediate goods 1967 2007 1967 2007 Imports Developed countries 76% 77% 68% 61% Emerging countries (incl. BRIC) 7% 11% 12% 24% Least developed countries 2% 1% 2% 1% Exports Developed countries 89% 69% 93% 72% Emerging countries (incl. BRIC) 4% 24% 3% 21% Least developed countries 0% 1% 0% 0%
Note: Follows the Chelem (CEPII) classification for the identification of Developed Countries, Emerging Countries and Least Developed Countries.
Source: Baldwin and Taglioni (2011).
The fast growing intermediates exports and imports from emerging countries and their simultaneously increasing exports of final goods reflects the strong integration of these countries into GVCs. The internationalisation of supply chains has strongly contributed to growth in trade between developed and emerging economies, as well as among emerging nations especially in Asia (“Factory Asia”). An increasing part of international trade (i.e. vertical trade) concerns the import of intermediates to be included in the exports of final and further processed intermediate products. Baldwin and Taglioni (2011) argue that in the context of GVCs, expenditure in the country of destination and supply in the country of origin are no longer the only motives for trade.
3. Export performance and the role of GVCs
GVCs increasingly challenge the ‘export’ measures of competitiveness given that countries’ exports are to a large extent made up of imports of intermediate inputs from abroad. International fragmentation results in countries no longer relying exclusively on domestic resources to produce and export goods and services (Sturgeon and Gereffi, 2009). Consequently, exports not only reflect the embodied technology and relative endowments which characterise a country's domestic production activities, but also the technology and factor endowments of the countries from which the country in question imports intermediate goods.
Case studies have already demonstrated the importance of imported intermediates for the exports of specific products (iPod, iPhone, Nokia N95, etc.), and also more aggregate evidence increasingly confirms that GVCs are not only about exports but also imports. Some intuitive evidence is presented
DSTI/DOC(2012)2
12
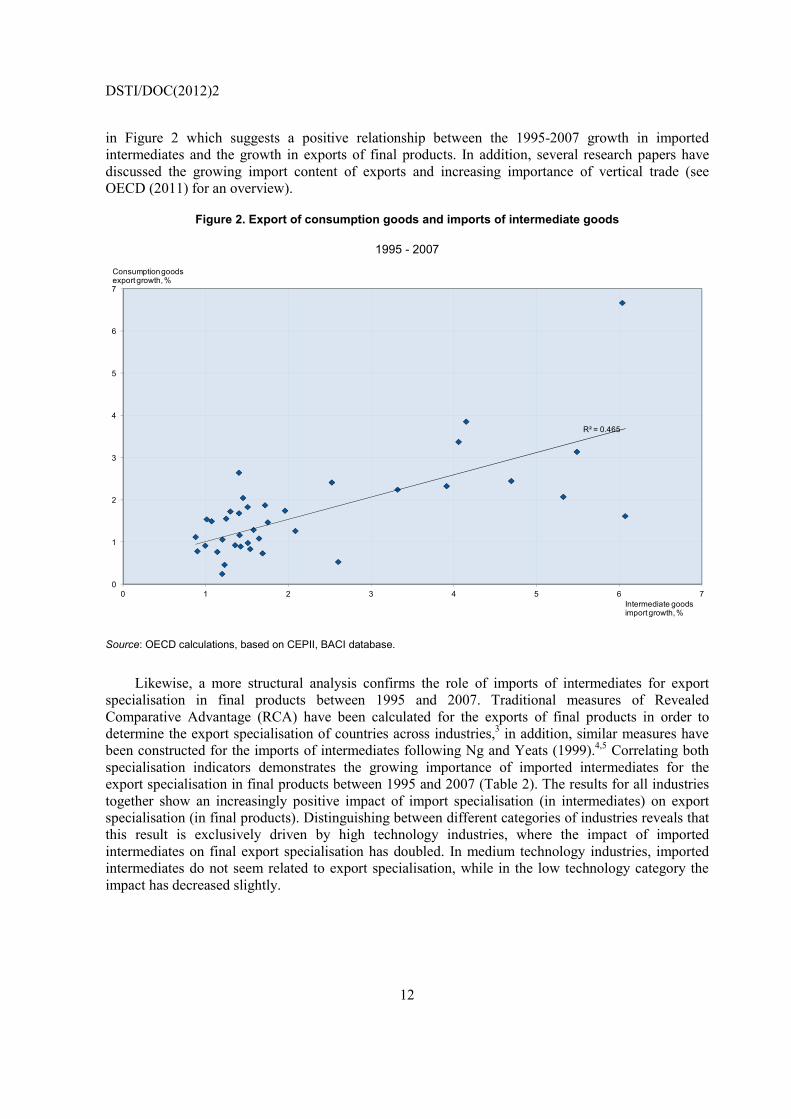
in Figure 2 which suggests a positive relationship between the 1995-2007 growth in imported intermediates and the growth in exports of final products. In addition, several research papers have discussed the growing import content of exports and increasing importance of vertical trade (see OECD (2011) for an overview).
Figure 2. Export of consumption goods and imports of intermediate goods
1995 - 2007
Source: OECD calculations, based on CEPII, BACI database.
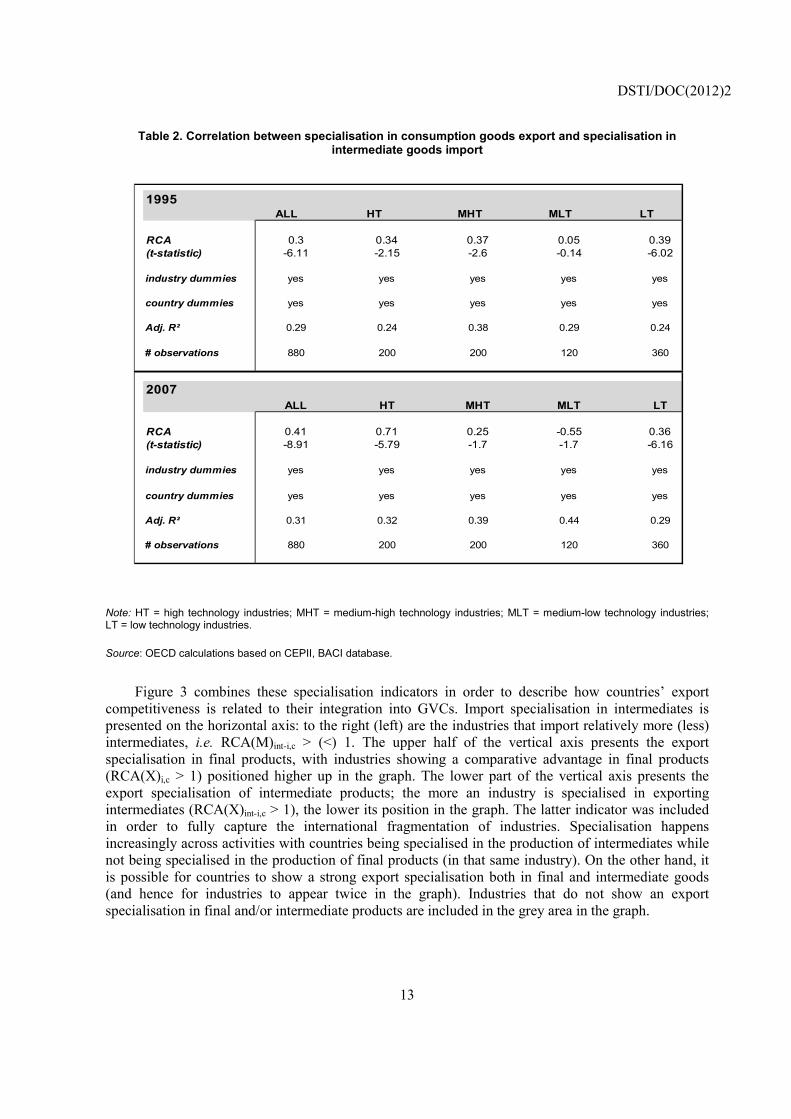
Likewise, a more structural analysis confirms the role of imports of intermediates for export specialisation in final products between 1995 and 2007. Traditional measures of Revealed Comparative Advantage (RCA) have been calculated for the exports of final products in order to determine the export specialisation of countries across industries,3 in addition, similar measures have been constructed for the imports of intermediates following Ng and Yeats (1999).4,5 Correlating both specialisation indicators demonstrates the growing importance of imported intermediates for the export specialisation in final products between 1995 and 2007 (Table 2). The results for all industries together show an increasingly positive impact of import specialisation (in intermediates) on export specialisation (in final products). Distinguishing between different categories of industries reveals that this result is exclusively driven by high technology industries, where the impact of imported intermediates on final export specialisation has doubled. In medium technology industries, imported intermediates do not seem related to export specialisation, while in the low technology category the impact has decreased slightly.
R² = 0.465
0
1
2
3
4
5
6
7
0 1 2 3 4 5 6 7
Consumptiongoods export growth, %
Intermediate goods import growth, %
DSTI/DOC(2012)2
13
Table 2. Correlation between specialisation in consumption goods export and specialisation in intermediate goods import
Note: HT = high technology industries; MHT = medium-high technology industries; MLT = medium-low technology industries; LT = low technology industries.
Source: OECD calculations based on CEPII, BACI database.
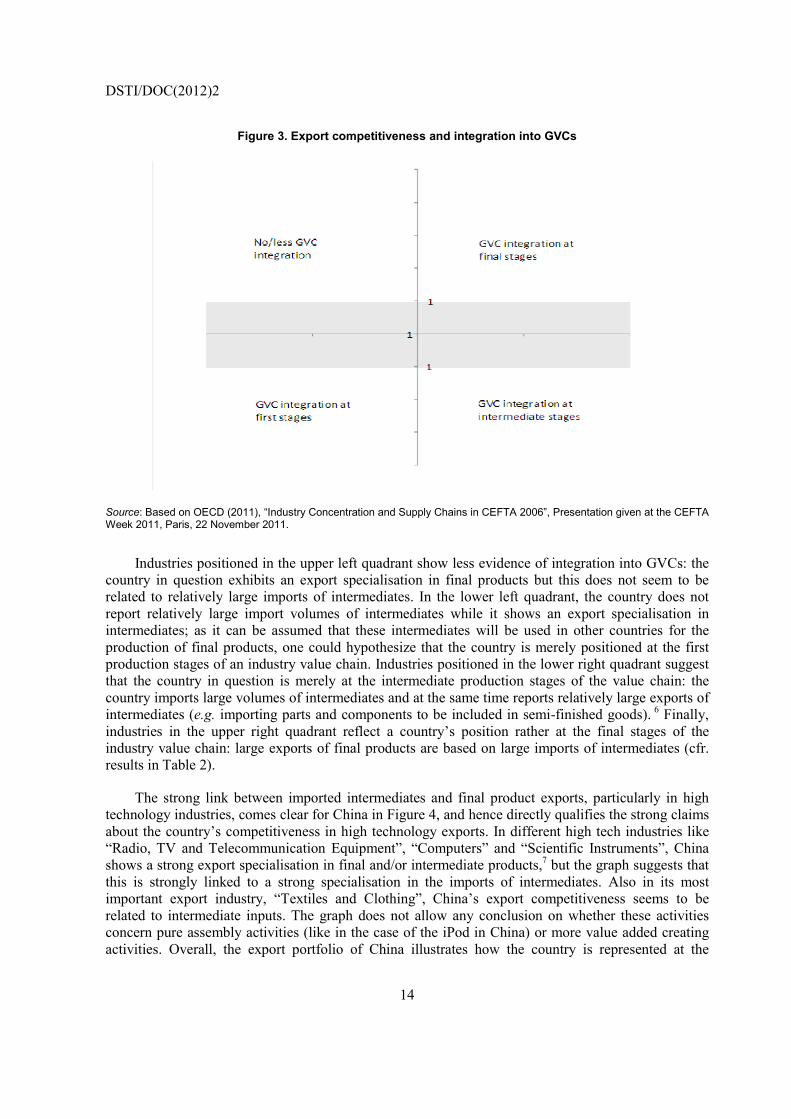
Figure 3 combines these specialisation indicators in order to describe how countries’ export competitiveness is related to their integration into GVCs. Import specialisation in intermediates is presented on the horizontal axis: to the right (left) are the industries that import relatively more (less) intermediates, i.e. RCA(M)int-i,c > (<) 1. The upper half of the vertical axis presents the export specialisation in final products, with industries showing a comparative advantage in final products (RCA(X)i,c > 1) positioned higher up in the graph. The lower part of the vertical axis presents the export specialisation of intermediate products; the more an industry is specialised in exporting intermediates (RCA(X)int-i,c > 1), the lower its position in the graph. The latter indicator was included in order to fully capture the international fragmentation of industries. Specialisation happens increasingly across activities with countries being specialised in the production of intermediates while not being specialised in the production of final products (in that same industry). On the other hand, it is possible for countries to show a strong export specialisation both in final and intermediate goods (and hence for industries to appear twice in the graph). Industries that do not show an export specialisation in final and/or intermediate products are included in the grey area in the graph.
1995ALL HT MHT MLT LT
RCA 0.3 0.34 0.37 0.05 0.39(t-statistic) -6.11 -2.15 -2.6 -0.14 -6.02
industry dummies yes yes yes yes yes
country dummies yes yes yes yes yes
Adj. R² 0.29 0.24 0.38 0.29 0.24
# observations 880 200 200 120 360
2007ALL HT MHT MLT LT
RCA 0.41 0.71 0.25 -0.55 0.36(t-statistic) -8.91 -5.79 -1.7 -1.7 -6.16
industry dummies yes yes yes yes yes
country dummies yes yes yes yes yes
Adj. R² 0.31 0.32 0.39 0.44 0.29
# observations 880 200 200 120 360
DSTI/DOC(2012)2
14
Figure 3. Export competitiveness and integration into GVCs
Source: Based on OECD (2011), “Industry Concentration and Supply Chains in CEFTA 2006”, Presentation given at the CEFTA Week 2011, Paris, 22 November 2011.
Industries positioned in the upper left quadrant show less evidence of integration into GVCs: the country in question exhibits an export specialisation in final products but this does not seem to be related to relatively large imports of intermediates. In the lower left quadrant, the country does not report relatively large import volumes of intermediates while it shows an export specialisation in intermediates; as it can be assumed that these intermediates will be used in other countries for the production of final products, one could hypothesize that the country is merely positioned at the first production stages of an industry value chain. Industries positioned in the lower right quadrant suggest that the country in question is merely at the intermediate production stages of the value chain: the country imports large volumes of intermediates and at the same time reports relatively large exports of intermediates (e.g. importing parts and components to be included in semi-finished goods). 6 Finally, industries in the upper right quadrant reflect a country’s position rather at the final stages of the industry value chain: large exports of final products are based on large imports of intermediates (cfr. results in Table 2).
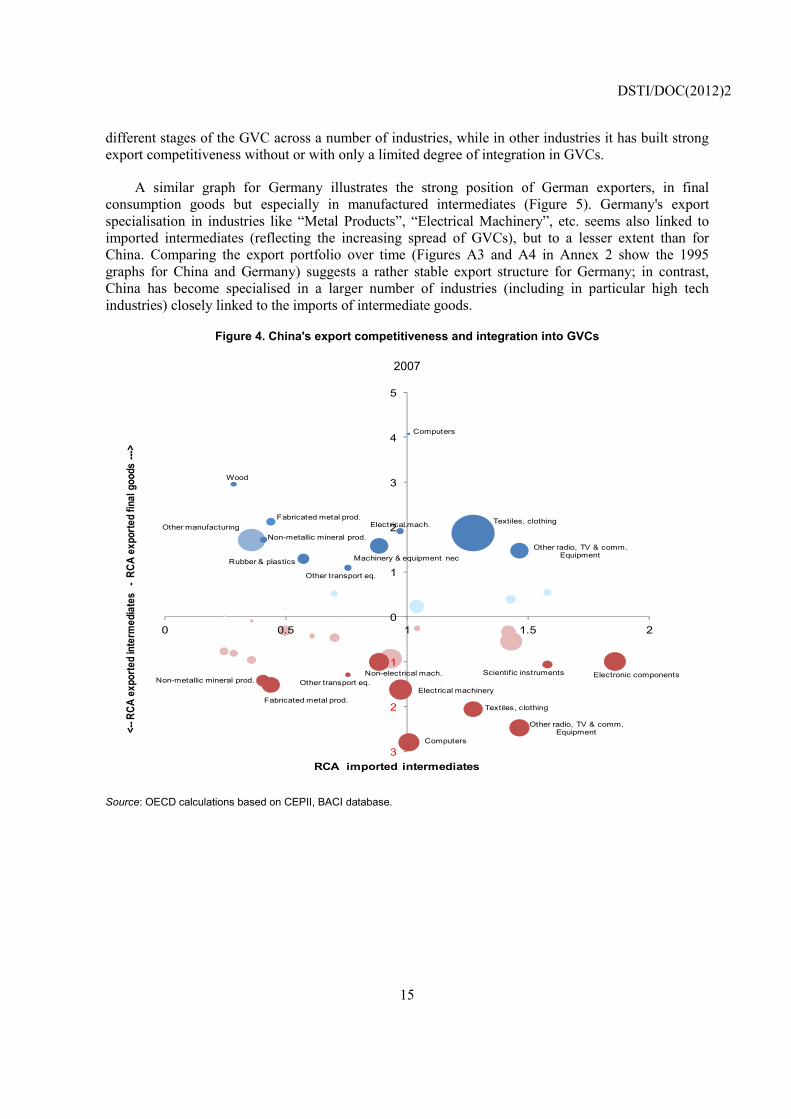
The strong link between imported intermediates and final product exports, particularly in high technology industries, comes clear for China in Figure 4, and hence directly qualifies the strong claims about the country’s competitiveness in high technology exports. In different high tech industries like “Radio, TV and Telecommunication Equipment”, “Computers” and “Scientific Instruments”, China shows a strong export specialisation in final and/or intermediate products,7 but the graph suggests that this is strongly linked to a strong specialisation in the imports of intermediates. Also in its most important export industry, “Textiles and Clothing”, China’s export competitiveness seems to be related to intermediate inputs. The graph does not allow any conclusion on whether these activities concern pure assembly activities (like in the case of the iPod in China) or more value added creating activities. Overall, the export portfolio of China illustrates how the country is represented at the
DSTI/DOC(2012)2
15
different stages of the GVC across a number of industries, while in other industries it has built strong export competitiveness without or with only a limited degree of integration in GVCs.
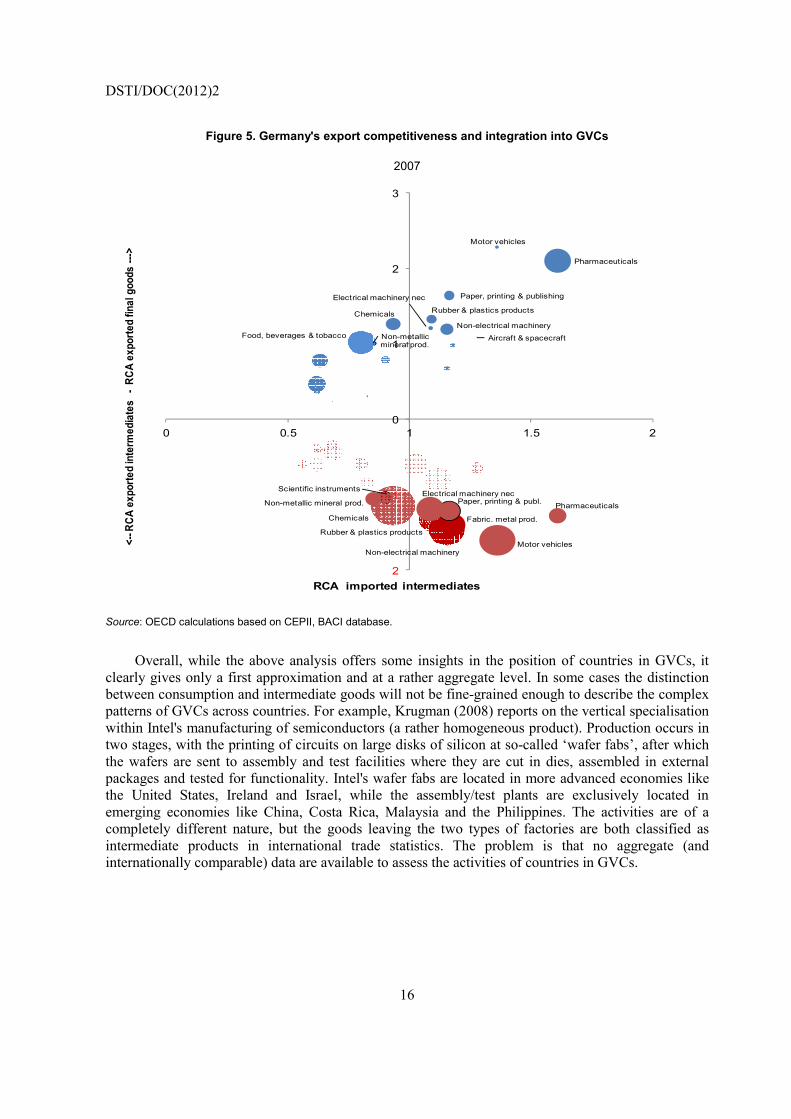
A similar graph for Germany illustrates the strong position of German exporters, in final consumption goods but especially in manufactured intermediates (Figure 5). Germany's export specialisation in industries like “Metal Products”, “Electrical Machinery”, etc. seems also linked to imported intermediates (reflecting the increasing spread of GVCs), but to a lesser extent than for China. Comparing the export portfolio over time (Figures A3 and A4 in Annex 2 show the 1995 graphs for China and Germany) suggests a rather stable export structure for Germany; in contrast, China has become specialised in a larger number of industries (including in particular high tech industries) closely linked to the imports of intermediate goods.
Figure 4. China's export competitiveness and integration into GVCs
2007
Computers
Other radio, TV & comm. EquipmentMachinery & equipment nec
Electrical mach.
Other transport eq.
Rubber & plastics
Non-metallic mineral prod.
Fabricated metal prod. Textiles, clothing
Wood
Other manufacturing
Computers
Electronic components
Other radio, TV & comm. Equipment
Scientific instrumentsNon-electrical mach.
Electrical machineryOther transport eq.Non-metallic mineral prod.
Fabricated metal prod.Textiles, clothing
3
2
1
0
1
2
3
4
5
0 0.5 1 1.5 2
<--R
CA e
xpor
ted
inte
rmed
iate
s -
RCA
expo
rted
final
goo
ds --
->
RCA imported intermediates
Source: OECD calculations based on CEPII, BACI database.
DSTI/DOC(2012)2
16
Figure 5. Germany's export competitiveness and integration into GVCs
2007
Pharmaceuticals
Aircraft & spacecraft
ChemicalsNon-electrical machinery
Electrical machinery nec
Motor vehicles
Rubber & plastics products
Non-metallic mineral prod.
Food, beverages & tobacco
Paper, printing & publishing
Pharmaceuticals
Scientific instruments
Chemicals
Non-electrical machinery
Electrical machinery nec
Motor vehicles
Rubber & plastics products
Non-metallic mineral prod.
Fabric. metal prod.
Paper, printing & publ.
2
1
0
1
2
3
0 0.5 1 1.5 2
<--R
CA e
xpor
ted
inte
rmed
iate
s -
RCA
expo
rted
final
goo
ds --
->
RCA imported intermediates
Source: OECD calculations based on CEPII, BACI database.
Overall, while the above analysis offers some insights in the position of countries in GVCs, it clearly gives only a first approximation and at a rather aggregate level. In some cases the distinction between consumption and intermediate goods will not be fine-grained enough to describe the complex patterns of GVCs across countries. For example, Krugman (2008) reports on the vertical specialisation within Intel's manufacturing of semiconductors (a rather homogeneous product). Production occurs in two stages, with the printing of circuits on large disks of silicon at so-called ‘wafer fabs’, after which the wafers are sent to assembly and test facilities where they are cut in dies, assembled in external packages and tested for functionality. Intel's wafer fabs are located in more advanced economies like the United States, Ireland and Israel, while the assembly/test plants are exclusively located in emerging economies like China, Costa Rica, Malaysia and the Philippines. The activities are of a completely different nature, but the goods leaving the two types of factories are both classified as intermediate products in international trade statistics. The problem is that no aggregate (and internationally comparable) data are available to assess the activities of countries in GVCs.
DSTI/DOC(2012)2
17
4. Export performance at the intensive and extensive margin
In a next step countries’ export growth is decomposed into changes at the intensive and extensive margins in order to get complementary insights into the dynamics of countries' integration in world trade flows. The intensive margin refers to the growth of existing trade flows, while the extensive margin of export growth is accounted for by trade flows of new products and/or by flows to new geographic destinations. While defining the intensive margin is relatively straightforward (as it refers to an increase in value/volume of existing trade flows), movements at the extensive margin can take different forms (BIS, 2010). 8
• Change in the number or range of goods traded: this may be due either to exporter entry and exit, or to an existing exporter altering the range of its products exported;
• Change in the number or range of bilateral trading parts;9 and
• Change in the number of firms engaged in international trade: this is due to an increase in the number of new firms entering a market.
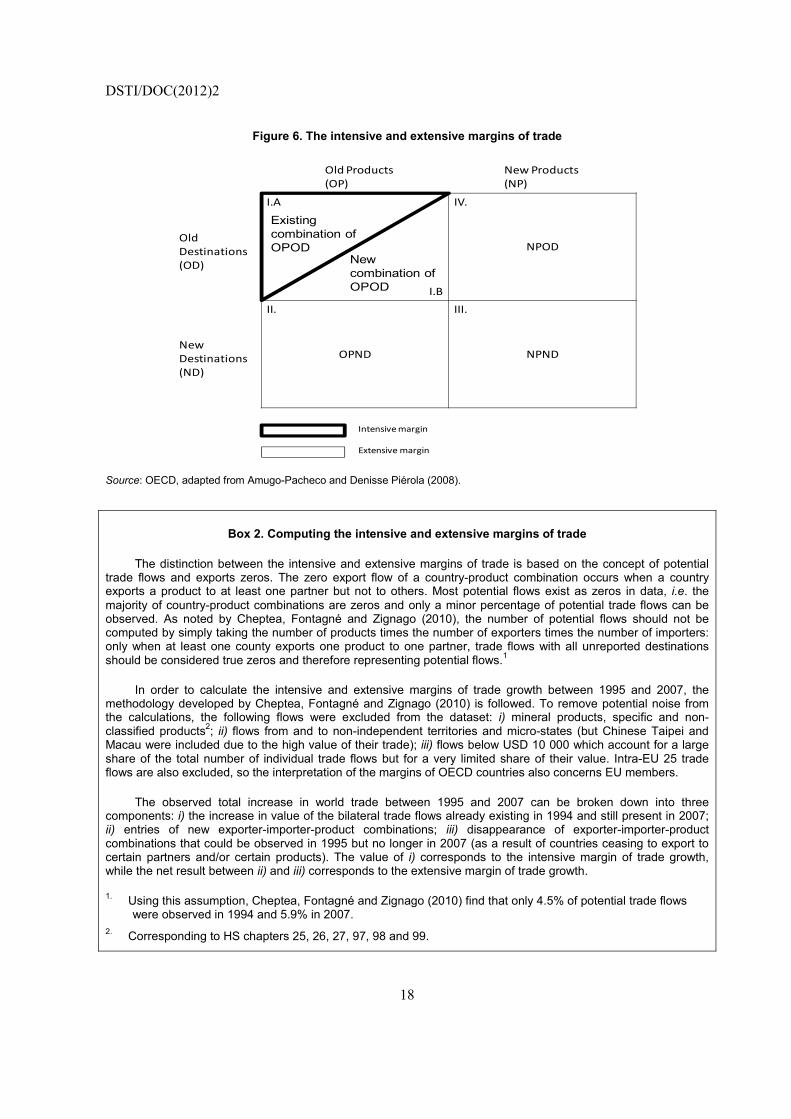
As shown in Figure 6, the intensive margin consists of (i.A) growth of export of an existing combination of “Old Products” to “Old Destinations” (OPOD), while the extensive margins may consist of: (i.B) a new combination of “Old Products” to “Old Destinations” (OPOD); (ii) “Old Products” being exported to “New Destinations” (OPND); (iii) “New Products” being exported to “New Destinations” (NPND); and (iv) “New Products” being exported to “Old Destinations” (NPOD). The methodology to compute the margins of trade is described in Box 2.
Several studies have highlighted the importance of both the intensive and extensive margins in explaining the growth of world trade. In some cases, the literature has reached opposing conclusions on the importance of the two margins (Besedeš and Prusa, 2010). For example, Felbermayr and Kohler (2006) note that about 40% of world trade growth from 1950 to 1997 came from movements at the extensive margin. Looking at levels instead of growth figures, Hummels and Klenow (2005) find that large economies export more in absolute terms than do small economies, and the extensive margin accounts for around 60% of the greater exports of larger economies.
DSTI/DOC(2012)2
18
Figure 6. The intensive and extensive margins of trade
NPOD
OPND NPND
Old Products (OP)
New Products (NP)
Old Destinations (OD)
New Destinations (ND)
I.A IV.
II. III.
Intensive margin
Extensive margin
Existing combination of OPOD
New combination of OPOD I.B
Source: OECD, adapted from Amugo-Pacheco and Denisse Piérola (2008).
Box 2. Computing the intensive and extensive margins of trade
The distinction between the intensive and extensive margins of trade is based on the concept of potential trade flows and exports zeros. The zero export flow of a country-product combination occurs when a country exports a product to at least one partner but not to others. Most potential flows exist as zeros in data, i.e. the majority of country-product combinations are zeros and only a minor percentage of potential trade flows can be observed. As noted by Cheptea, Fontagné and Zignago (2010), the number of potential flows should not be computed by simply taking the number of products times the number of exporters times the number of importers: only when at least one county exports one product to one partner, trade flows with all unreported destinations should be considered true zeros and therefore representing potential flows.1
In order to calculate the intensive and extensive margins of trade growth between 1995 and 2007, the methodology developed by Cheptea, Fontagné and Zignago (2010) is followed. To remove potential noise from the calculations, the following flows were excluded from the dataset: i) mineral products, specific and non-classified products2; ii) flows from and to non-independent territories and micro-states (but Chinese Taipei and Macau were included due to the high value of their trade); iii) flows below USD 10 000 which account for a large share of the total number of individual trade flows but for a very limited share of their value. Intra-EU 25 trade flows are also excluded, so the interpretation of the margins of OECD countries also concerns EU members.
The observed total increase in world trade between 1995 and 2007 can be broken down into three components: i) the increase in value of the bilateral trade flows already existing in 1994 and still present in 2007; ii) entries of new exporter-importer-product combinations; iii) disappearance of exporter-importer-product combinations that could be observed in 1995 but no longer in 2007 (as a result of countries ceasing to export to certain partners and/or certain products). The value of i) corresponds to the intensive margin of trade growth, while the net result between ii) and iii) corresponds to the extensive margin of trade growth.
1. Using this assumption, Cheptea, Fontagné and Zignago (2010) find that only 4.5% of potential trade flows were observed in 1994 and 5.9% in 2007.
2. Corresponding to HS chapters 25, 26, 27, 97, 98 and 99.
DSTI/DOC(2012)2
19
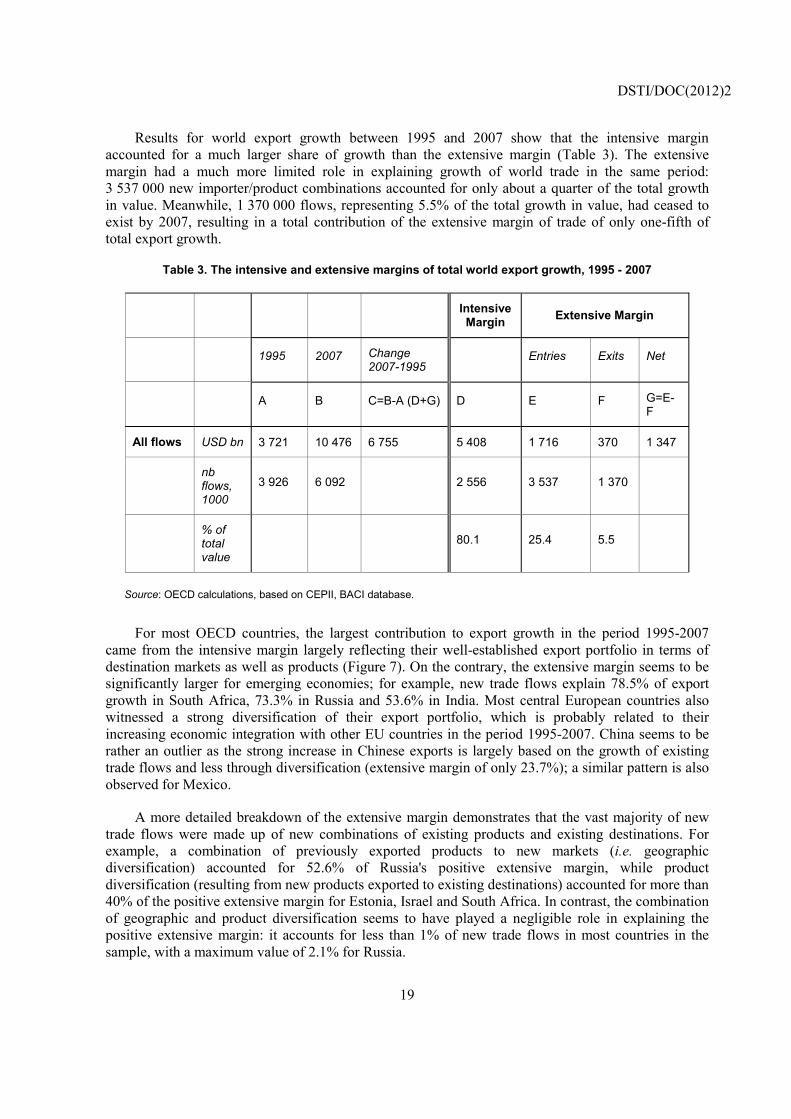
Results for world export growth between 1995 and 2007 show that the intensive margin accounted for a much larger share of growth than the extensive margin (Table 3). The extensive margin had a much more limited role in explaining growth of world trade in the same period: 3 537 000 new importer/product combinations accounted for only about a quarter of the total growth in value. Meanwhile, 1 370 000 flows, representing 5.5% of the total growth in value, had ceased to exist by 2007, resulting in a total contribution of the extensive margin of trade of only one-fifth of total export growth.
Table 3. The intensive and extensive margins of total world export growth, 1995 - 2007
Intensive Margin Extensive Margin
1995 2007 Change
2007-1995 Entries Exits Net
A B C=B-A (D+G) D E F G=E-
F
All flows USD bn 3 721 10 476 6 755 5 408 1 716 370 1 347
nb flows, 1000
3 926 6 092 2 556 3 537 1 370
% of total value
80.1 25.4 5.5
Source: OECD calculations, based on CEPII, BACI database.
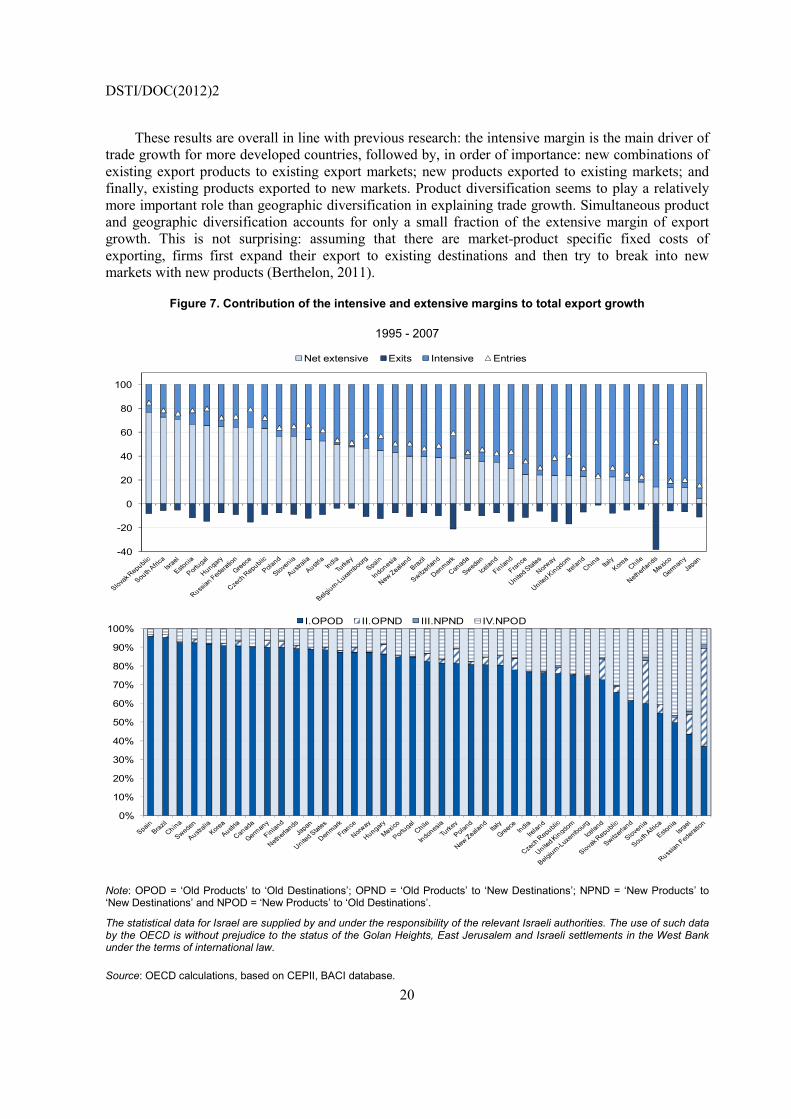
For most OECD countries, the largest contribution to export growth in the period 1995-2007 came from the intensive margin largely reflecting their well-established export portfolio in terms of destination markets as well as products (Figure 7). On the contrary, the extensive margin seems to be significantly larger for emerging economies; for example, new trade flows explain 78.5% of export growth in South Africa, 73.3% in Russia and 53.6% in India. Most central European countries also witnessed a strong diversification of their export portfolio, which is probably related to their increasing economic integration with other EU countries in the period 1995-2007. China seems to be rather an outlier as the strong increase in Chinese exports is largely based on the growth of existing trade flows and less through diversification (extensive margin of only 23.7%); a similar pattern is also observed for Mexico.
A more detailed breakdown of the extensive margin demonstrates that the vast majority of new trade flows were made up of new combinations of existing products and existing destinations. For example, a combination of previously exported products to new markets (i.e. geographic diversification) accounted for 52.6% of Russia's positive extensive margin, while product diversification (resulting from new products exported to existing destinations) accounted for more than 40% of the positive extensive margin for Estonia, Israel and South Africa. In contrast, the combination of geographic and product diversification seems to have played a negligible role in explaining the positive extensive margin: it accounts for less than 1% of new trade flows in most countries in the sample, with a maximum value of 2.1% for Russia.
DSTI/DOC(2012)2
20
These results are overall in line with previous research: the intensive margin is the main driver of trade growth for more developed countries, followed by, in order of importance: new combinations of existing export products to existing export markets; new products exported to existing markets; and finally, existing products exported to new markets. Product diversification seems to play a relatively more important role than geographic diversification in explaining trade growth. Simultaneous product and geographic diversification accounts for only a small fraction of the extensive margin of export growth. This is not surprising: assuming that there are market-product specific fixed costs of exporting, firms first expand their export to existing destinations and then try to break into new markets with new products (Berthelon, 2011).
Figure 7. Contribution of the intensive and extensive margins to total export growth
1995 - 2007
-40
-20
0
20
40
60
80
100
Net extensive Exits Intensive Entries
0%
10%
20%
30%
40%
50%
60%
70%
80%
90%
100%I.OPOD II.OPND III.NPND IV.NPOD
Note: OPOD = ‘Old Products’ to ‘Old Destinations’; OPND = ‘Old Products’ to ‘New Destinations’; NPND = ‘New Products’ to ‘New Destinations’ and NPOD = ‘New Products’ to ‘Old Destinations’.
The statistical data for Israel are supplied by and under the responsibility of the relevant Israeli authorities. The use of such data by the OECD is without prejudice to the status of the Golan Heights, East Jerusalem and Israeli settlements in the West Bank under the terms of international law.
Source: OECD calculations, based on CEPII, BACI database.
DSTI/DOC(2012)2
21
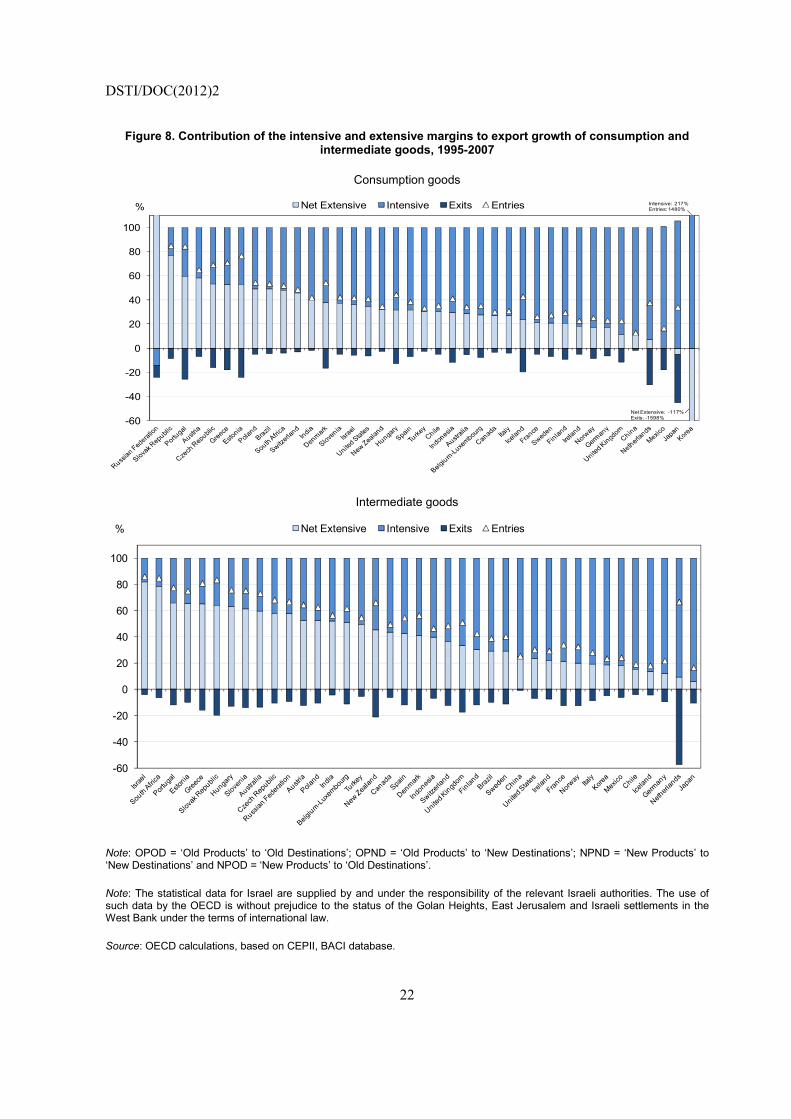
As the aim of this paper is to study the export performance of countries within GVCs in more detail, the analysis distinguishes between consumption and intermediate goods. The results show that overall, export growth at the intensive margin is more important for consumption goods (Figure 8) indicating that most countries had already reached a high level of diversification in their portfolio of consumption products and markets prior to 1995.10 New competition through product and market diversification has been a more important driver of growth of trade in intermediate goods. The larger extensive margins for intermediates suggest that the international fragmentation of production has accommodated the emergence of new competitors within the category of intermediate goods.11 An important process of reallocation/churning has taken place within GVCs with new product-market combinations (entries) that have replaced existing combinations (exits). Relative to other product categories, a higher share of the positive extensive margin is explained by new combinations of old products and old destinations (see Figure A5 in Annex 2).
Emerging economies and also central European countries display relatively stronger growth at the extensive margin, particularly in intermediate goods. The results thus suggest that these countries gained a foothold in international markets especially in intermediate goods and to a lesser extent in final products. Former transition countries like the Czech Republic, Hungary and Poland for example, seem to have significantly altered their positioning in GVCs in the period 1995–2007 as reflected by their large extensive margins. One exception seems to be China, due to the large importance of the intensive margin (in intermediate and especially in final consumption goods): unlike other emerging economies, China has increased its market shares in different industries by exporting more of its existing products to existing markets. This strong intensive growth may have negatively affected the terms of trade of China, while the larger extensive margins for other emerging countries may indicate larger welfare effects.
One explanation for the reported differences between final and intermediate goods could be given by the often large sunk investments required to begin exporting final products (e.g. R&D, branding, capital, etc.). Several case studies have reported on the difficulties companies face when moving up the value chain, from being smaller suppliers at lower levels (parts and components) to first tier supplier (semi-finished goods) and finally to final producers with own brands. Competition with incumbent companies could also be expected to be more intense and less successful since suppliers trying to upgrade in the value chain and move into the production of final products may become direct competitors of their customers. As such, newcomers might get stuck in lower value added activities; the fact that GVCs allow emerging countries to integrate rapidly into global operations and enter into export markets does not guarantee their upgrading in later stages. Song (2007) describes how the Chinese electronics industry had been caught in a so-called “modularity trap” until recently: despite significant increases in labour productivity, Chinese companies were operating in low value niches and activities without any possibility for upgrading their capabilities.
DSTI/DOC(2012)2
22
Figure 8. Contribution of the intensive and extensive margins to export growth of consumption and intermediate goods, 1995-2007
Consumption goods
-60
-40
-20
0
20
40
60
80
100
Net Extensive Intensive Exits Entries% Intensive: 217%Entries: 1480%
Net Extensive: -117%Exits: -1598%
Intermediate goods
-60
-40
-20
0
20
40
60
80
100
Net Extensive Intensive Exits Entries%
Note: OPOD = ‘Old Products’ to ‘Old Destinations’; OPND = ‘Old Products’ to ‘New Destinations’; NPND = ‘New Products’ to ‘New Destinations’ and NPOD = ‘New Products’ to ‘Old Destinations’.
Note: The statistical data for Israel are supplied by and under the responsibility of the relevant Israeli authorities. The use of such data by the OECD is without prejudice to the status of the Golan Heights, East Jerusalem and Israeli settlements in the West Bank under the terms of international law.
Source: OECD calculations, based on CEPII, BACI database.
DSTI/DOC(2012)2
23
5. Export growth: a decomposition of the geographic, sectoral and performance effects
The analysis so far has shown that the intensive margin played a predominant role in export growth during the period 1995-2007 in consumption as well as intermediate goods and for most countries. While the previous section has tried to dig a bit deeper into the drivers behind the extensive margin, this section analyses in more detail the intensive margin: is it due to countries' higher levels of specialisation in exporting products for which world demand was high, and/or in exporting to markets where demand for imports was high relative to world demand? And to what extent were gains (or losses) in market shares due to pure export competitiveness (or lack thereof) of the exporting countries?
The following analysis breaks down the contributions to the changes in market shares by different product categories along the value chain. Countries' changes in market shares between 1995 and 2007 are decomposed into three separate components:
• A sectoral component measuring growth due to the mix of products exported;
• A geographical component indicating changes due to the country’s distribution of trading partners; and
• A residual term representing the growth induced by a country's competitiveness or trade performance.
The decomposition is done through the “shift-share analysis” technique. The approach adopted in this paper is an econometric version of traditional shift-share analysis based on a methodology developed by Cheptea, Gaulier and Zignago (2005) and further refined in Cheptea, Fontagné and Zignago (2010). Because the decomposition is carried out for each pair of subsequent years between 1995 and 2007, it can only explain the intensive margin of export growth (by definition, trade grows at the extensive margin only when a new flow appears or disappears between two consecutive periods of time). For a full description of the methodology see Annex 3.
The key intuition behind shift-share analysis is that a country’s export growth does not occur in a vacuum but in a global trade context. Hence, export growth is affected by several variables, notably the growth of world trade itself, the country’s mix of trading partners as well as the bundle of products it exports. All these factors that contribute to a country’s export growth can be broken down and analysed individually. The residual term, capturing the variation that is not explained by those variables, can then be interpreted as a pure indicator of the export competitiveness of a country.12
Shift-share analysis is based on the assumption that if all the factors influencing export growth rates are held constant, the country’s share in world trade should also remain constant.13 The sectoral and geographic effects measure the variations in a country’s market shares resulting from the structure of world demand: the more a country specialises in products in growing sectors to growing import destinations, the larger the growth in market share. The performance (residual) term explains the gain or loss in export market share that would result if the structural terms (both geographic and related to the product-mix) were to remain unchanged. The analysis therefore identifies out- and under-performers among countries.
The decomposition shows that in most cases the performance effect (i.e. “pure” export competitiveness) was the main contributing factor to growth for emerging countries (Figure 9). OECD countries showing the largest (positive) performance effects in the period 1995-2007 were central European countries like the Slovak Republic (which shows the highest performance effect among all countries in the sample), Hungary, Poland and the Czech Republic. On the contrary, for the largest

DSTI/DOC(2012)2
24
OECD exporters, the performance effect was negative and provided the largest contribution to the loss in market shares.14
The geographic effect measures the contribution to export growth deriving from the extent to which a country's exports are oriented towards markets with dynamic demand relative to the rest of the world. This effect was very large for the central European countries, reflecting the fact that their exports were to a large extent driven by demand from EU countries (following their membership in the EU). On the other hand, the geographic effect did not play a significant role in the case of emerging economies, except for the Russian Federation.
The sectoral effect captures the part of export growth that is explained by the predominance in a country's export basket of the products benefitting from relatively high world demand. In the period 1995–2007, this effect contributed to the majority of export growth for most of the largest OECD economies, notably the United States, Japan, France, Germany and the United Kingdom. It was also the main driver of export growth for Belgium, Luxembourg and the Netherlands, i.e. small and open European economies with very high levels of exports. For most emerging economies, the sectoral effect was negative, reflecting export specialisation towards products with slow-growing demand (often in more traditional, lower technology industries).
Figure 9. Contribution of structural and performance effects to total export market shares growth
1995 - 2007
Note: The statistical data for Israel are supplied by and under the responsibility of the relevant Israeli authorities. The use of such data by the OECD is without prejudice to the status of the Golan Heights, East Jerusalem and Israeli settlements in the West Bank under the terms of international law.
Source: OECD calculations, based on CEPII, BACI database.
-50
0
50
100
150
200
250
300
350
400Performance Geographic Sectoral
DSTI/DOC(2012)2
25
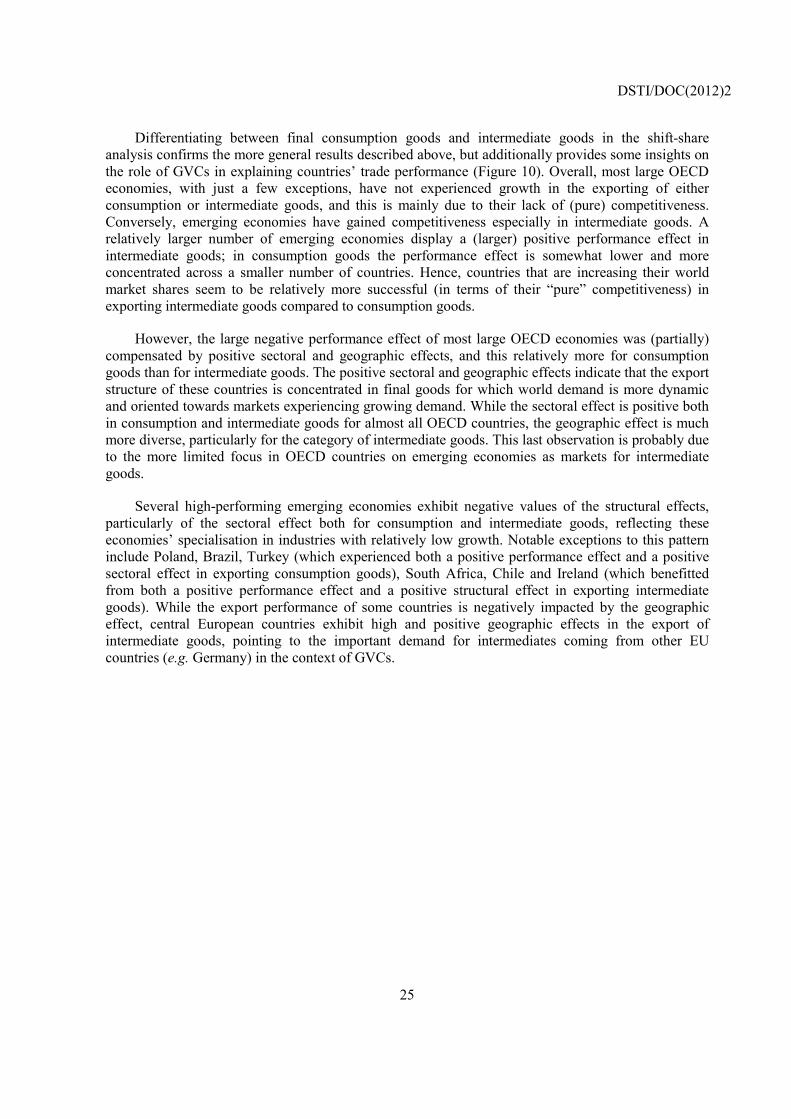
Differentiating between final consumption goods and intermediate goods in the shift-share analysis confirms the more general results described above, but additionally provides some insights on the role of GVCs in explaining countries’ trade performance (Figure 10). Overall, most large OECD economies, with just a few exceptions, have not experienced growth in the exporting of either consumption or intermediate goods, and this is mainly due to their lack of (pure) competitiveness. Conversely, emerging economies have gained competitiveness especially in intermediate goods. A relatively larger number of emerging economies display a (larger) positive performance effect in intermediate goods; in consumption goods the performance effect is somewhat lower and more concentrated across a smaller number of countries. Hence, countries that are increasing their world market shares seem to be relatively more successful (in terms of their “pure” competitiveness) in exporting intermediate goods compared to consumption goods.
However, the large negative performance effect of most large OECD economies was (partially) compensated by positive sectoral and geographic effects, and this relatively more for consumption goods than for intermediate goods. The positive sectoral and geographic effects indicate that the export structure of these countries is concentrated in final goods for which world demand is more dynamic and oriented towards markets experiencing growing demand. While the sectoral effect is positive both in consumption and intermediate goods for almost all OECD countries, the geographic effect is much more diverse, particularly for the category of intermediate goods. This last observation is probably due to the more limited focus in OECD countries on emerging economies as markets for intermediate goods.
Several high-performing emerging economies exhibit negative values of the structural effects, particularly of the sectoral effect both for consumption and intermediate goods, reflecting these economies’ specialisation in industries with relatively low growth. Notable exceptions to this pattern include Poland, Brazil, Turkey (which experienced both a positive performance effect and a positive sectoral effect in exporting consumption goods), South Africa, Chile and Ireland (which benefitted from both a positive performance effect and a positive structural effect in exporting intermediate goods). While the export performance of some countries is negatively impacted by the geographic effect, central European countries exhibit high and positive geographic effects in the export of intermediate goods, pointing to the important demand for intermediates coming from other EU countries (e.g. Germany) in the context of GVCs.
DSTI/DOC(2012)2
26
Figure 10. Contribution of structural and performance effects to export market shares growth of consumption and intermediate goods, 1995-2007
Consumption goods
Intermediate goods
Note: The statistical data for Israel are supplied by and under the responsibility of the relevant Israeli authorities. The use of such data by the OECD is without prejudice to the status of the Golan Heights, East Jerusalem and Israeli settlements in the West Bank under the terms of international law.
Source: OECD calculations, based on CEPII, BACI database.
-60
-30
0
30
60
90
120
150
180Performance Geographic Sectoral
-50
-30
-10
10
30
50
70
90
110
130
150Performance Geographic SectoralPerfo:385
DSTI/DOC(2012)2
27
6. Export performance during the 2007-2009 “great trade collapse”: a disaggregated view
The impacts of the economic crisis of 2008-2009 on world trade have been well documented; Baldwin (2009) described the decline of world merchandise trade between 2008 and 2009 as the “great trade collapse”. The drop was severe and sudden: after more than six years of positive trade growth, trade in 23 OECD economies dived in October 2008, reaching a record negative growth of -37% in April 2009 (Araújo and Oliveira Martins, 2009). It was also synchronised: more than 90% of OECD countries simultaneously exhibit a decline in exports and imports exceeding 10%. This share reached 100% at the end of the 2009Q1 (Araújo and Oliveira Martins, 2009).
The analyses in previous sections were based on a dataset covering the period 1995-2007, aiming to focus on the structural trends and exclude the recent exceptional effects of the financial and economic crisis on trade. This additional discussion of the export performance in the period 2007-2009 aims to analyse if the developments in the intensive and extensive margins are the same in downturn periods (i.e. periods with negative export growth) as in upturn periods (i.e. periods with positive export growth).
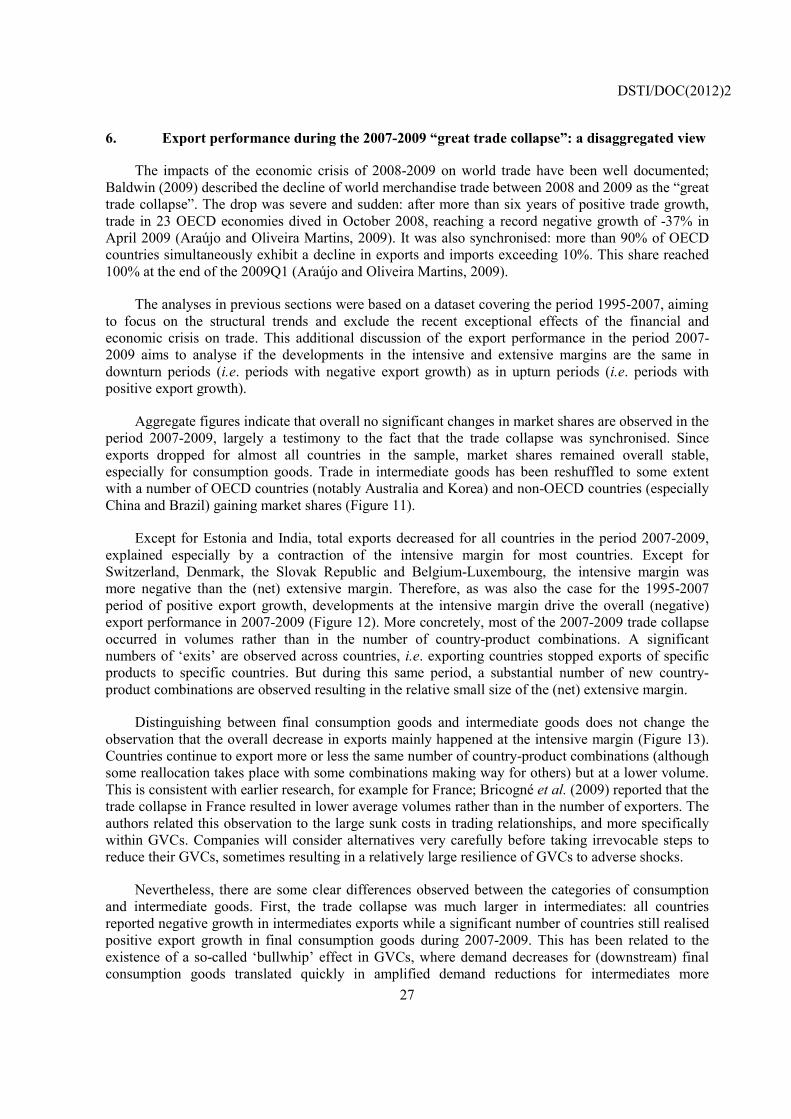
Aggregate figures indicate that overall no significant changes in market shares are observed in the period 2007-2009, largely a testimony to the fact that the trade collapse was synchronised. Since exports dropped for almost all countries in the sample, market shares remained overall stable, especially for consumption goods. Trade in intermediate goods has been reshuffled to some extent with a number of OECD countries (notably Australia and Korea) and non-OECD countries (especially China and Brazil) gaining market shares (Figure 11).
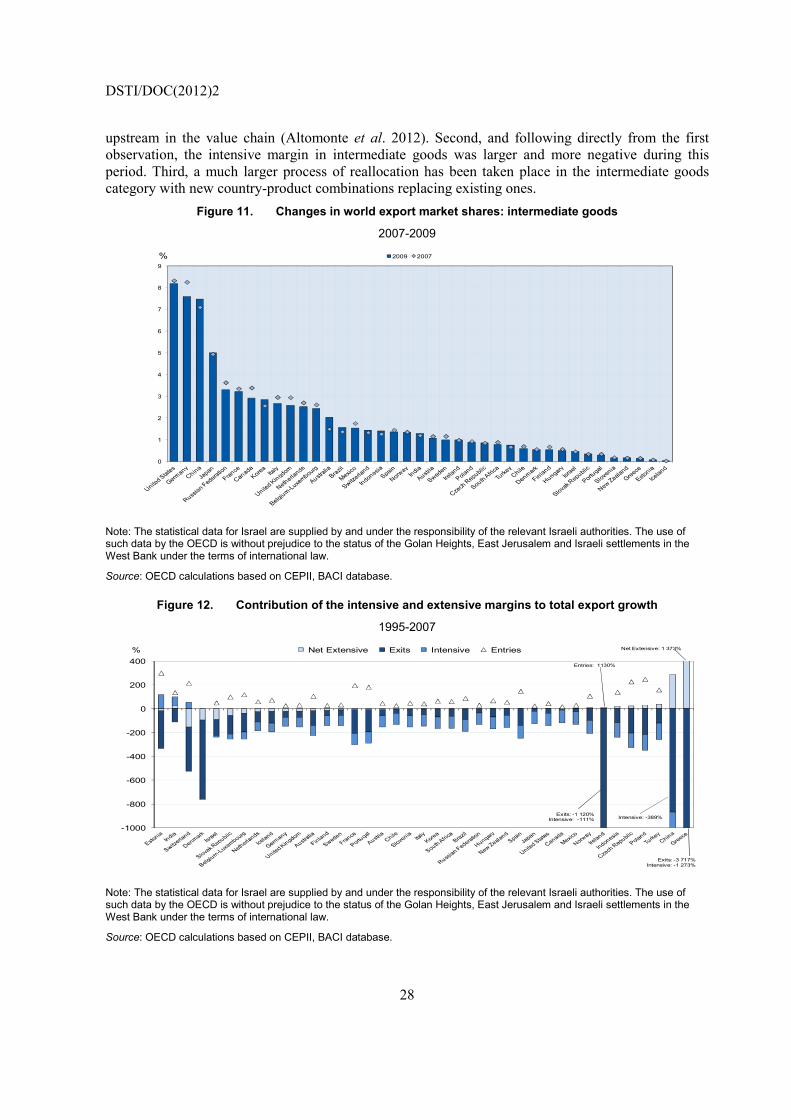
Except for Estonia and India, total exports decreased for all countries in the period 2007-2009, explained especially by a contraction of the intensive margin for most countries. Except for Switzerland, Denmark, the Slovak Republic and Belgium-Luxembourg, the intensive margin was more negative than the (net) extensive margin. Therefore, as was also the case for the 1995-2007 period of positive export growth, developments at the intensive margin drive the overall (negative) export performance in 2007-2009 (Figure 12). More concretely, most of the 2007-2009 trade collapse occurred in volumes rather than in the number of country-product combinations. A significant numbers of ‘exits’ are observed across countries, i.e. exporting countries stopped exports of specific products to specific countries. But during this same period, a substantial number of new country-product combinations are observed resulting in the relative small size of the (net) extensive margin.
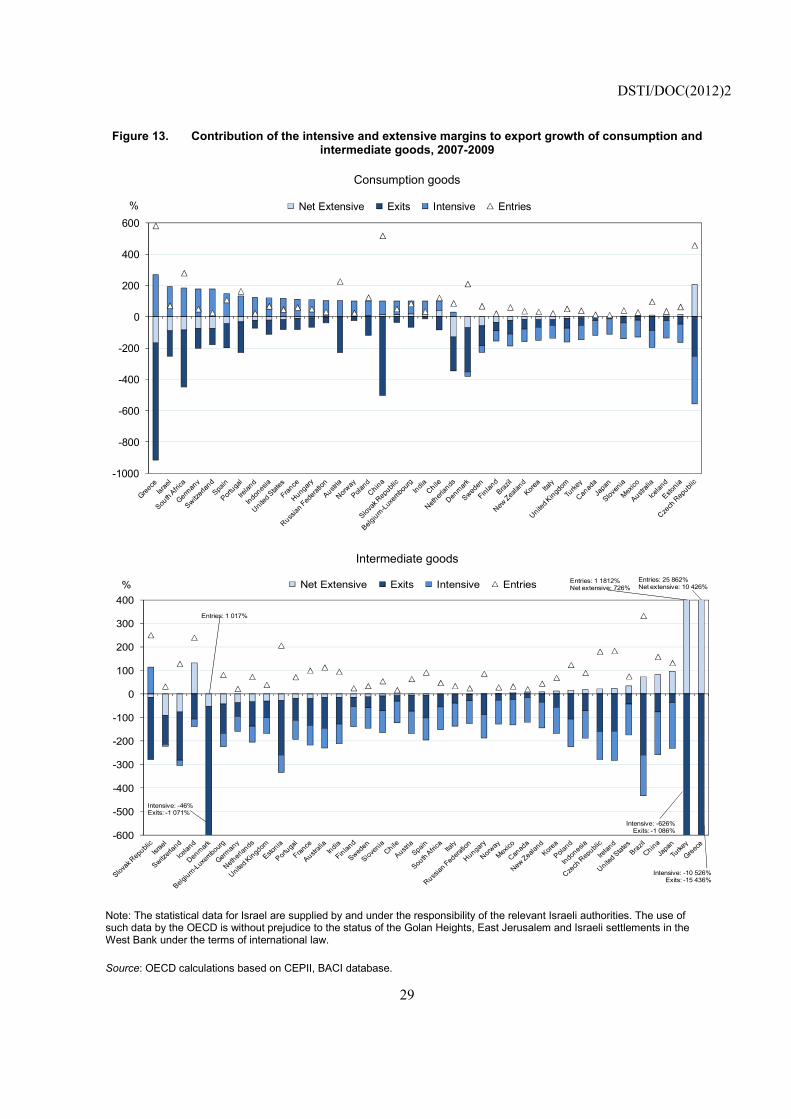
Distinguishing between final consumption goods and intermediate goods does not change the observation that the overall decrease in exports mainly happened at the intensive margin (Figure 13). Countries continue to export more or less the same number of country-product combinations (although some reallocation takes place with some combinations making way for others) but at a lower volume. This is consistent with earlier research, for example for France; Bricogné et al. (2009) reported that the trade collapse in France resulted in lower average volumes rather than in the number of exporters. The authors related this observation to the large sunk costs in trading relationships, and more specifically within GVCs. Companies will consider alternatives very carefully before taking irrevocable steps to reduce their GVCs, sometimes resulting in a relatively large resilience of GVCs to adverse shocks.
Nevertheless, there are some clear differences observed between the categories of consumption and intermediate goods. First, the trade collapse was much larger in intermediates: all countries reported negative growth in intermediates exports while a significant number of countries still realised positive export growth in final consumption goods during 2007-2009. This has been related to the existence of a so-called ‘bullwhip’ effect in GVCs, where demand decreases for (downstream) final consumption goods translated quickly in amplified demand reductions for intermediates more
DSTI/DOC(2012)2
28
upstream in the value chain (Altomonte et al. 2012). Second, and following directly from the first observation, the intensive margin in intermediate goods was larger and more negative during this period. Third, a much larger process of reallocation has been taken place in the intermediate goods category with new country-product combinations replacing existing ones.
Figure 11. Changes in world export market shares: intermediate goods
2007-2009
Note: The statistical data for Israel are supplied by and under the responsibility of the relevant Israeli authorities. The use of such data by the OECD is without prejudice to the status of the Golan Heights, East Jerusalem and Israeli settlements in the West Bank under the terms of international law.
Source: OECD calculations based on CEPII, BACI database.
Figure 12. Contribution of the intensive and extensive margins to total export growth
1995-2007
Note: The statistical data for Israel are supplied by and under the responsibility of the relevant Israeli authorities. The use of such data by the OECD is without prejudice to the status of the Golan Heights, East Jerusalem and Israeli settlements in the West Bank under the terms of international law.
Source: OECD calculations based on CEPII, BACI database.
0
1
2
3
4
5
6
7
8
9
2009 2007%
-1000
-800
-600
-400
-200
0
200
400Net Extensive Exits Intensive Entries Net Extensive: 1 373%
Entries: 1130%
Exits: -1 120%Intensive: -111% Intensive: -389%
Exits: -3 717%Intensive: -1 273%
%
DSTI/DOC(2012)2
29
Figure 13. Contribution of the intensive and extensive margins to export growth of consumption and intermediate goods, 2007-2009
Consumption goods
Intermediate goods
Note: The statistical data for Israel are supplied by and under the responsibility of the relevant Israeli authorities. The use of such data by the OECD is without prejudice to the status of the Golan Heights, East Jerusalem and Israeli settlements in the West Bank under the terms of international law.
Source: OECD calculations based on CEPII, BACI database.
-1000
-800
-600
-400
-200
0
200
400
600Net Extensive Exits Intensive Entries%
-600
-500
-400
-300
-200
-100
0
100
200
300
400Net Extensive Exits Intensive Entries
Intensive: -46%Exits: -1 071%
Entries: 1 017%
Entries: 1 1812% Net extensive: 726%
Entries: 25 862% Net extensive: 10 426%
Intensive: -626%Exits: -1 086%
Intensive: -10 526%Exits: -15 436%
%
DSTI/DOC(2012)2
30
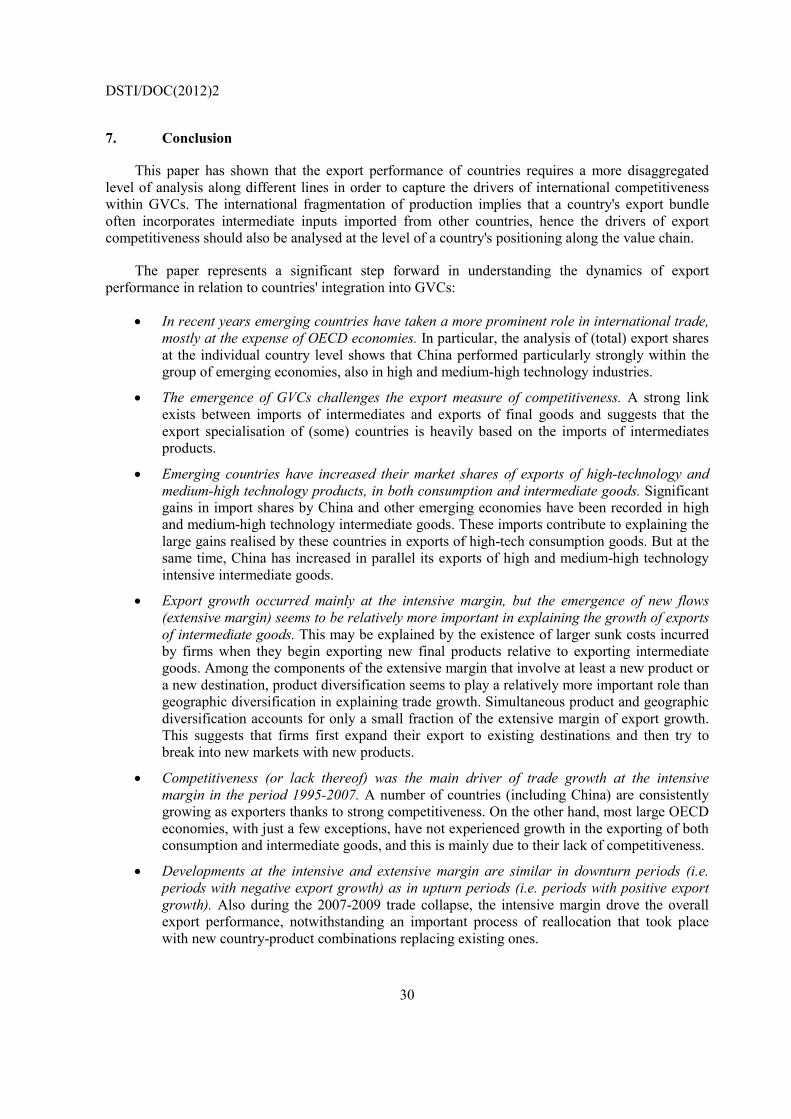
7. Conclusion
This paper has shown that the export performance of countries requires a more disaggregated level of analysis along different lines in order to capture the drivers of international competitiveness within GVCs. The international fragmentation of production implies that a country's export bundle often incorporates intermediate inputs imported from other countries, hence the drivers of export competitiveness should also be analysed at the level of a country's positioning along the value chain.
The paper represents a significant step forward in understanding the dynamics of export performance in relation to countries' integration into GVCs:
• In recent years emerging countries have taken a more prominent role in international trade, mostly at the expense of OECD economies. In particular, the analysis of (total) export shares at the individual country level shows that China performed particularly strongly within the group of emerging economies, also in high and medium-high technology industries.
• The emergence of GVCs challenges the export measure of competitiveness. A strong link exists between imports of intermediates and exports of final goods and suggests that the export specialisation of (some) countries is heavily based on the imports of intermediates products.
• Emerging countries have increased their market shares of exports of high-technology and medium-high technology products, in both consumption and intermediate goods. Significant gains in import shares by China and other emerging economies have been recorded in high and medium-high technology intermediate goods. These imports contribute to explaining the large gains realised by these countries in exports of high-tech consumption goods. But at the same time, China has increased in parallel its exports of high and medium-high technology intensive intermediate goods.
• Export growth occurred mainly at the intensive margin, but the emergence of new flows (extensive margin) seems to be relatively more important in explaining the growth of exports of intermediate goods. This may be explained by the existence of larger sunk costs incurred by firms when they begin exporting new final products relative to exporting intermediate goods. Among the components of the extensive margin that involve at least a new product or a new destination, product diversification seems to play a relatively more important role than geographic diversification in explaining trade growth. Simultaneous product and geographic diversification accounts for only a small fraction of the extensive margin of export growth. This suggests that firms first expand their export to existing destinations and then try to break into new markets with new products.
• Competitiveness (or lack thereof) was the main driver of trade growth at the intensive margin in the period 1995-2007. A number of countries (including China) are consistently growing as exporters thanks to strong competitiveness. On the other hand, most large OECD economies, with just a few exceptions, have not experienced growth in the exporting of both consumption and intermediate goods, and this is mainly due to their lack of competitiveness.
• Developments at the intensive and extensive margin are similar in downturn periods (i.e. periods with negative export growth) as in upturn periods (i.e. periods with positive export growth). Also during the 2007-2009 trade collapse, the intensive margin drove the overall export performance, notwithstanding an important process of reallocation that took place with new country-product combinations replacing existing ones.
DSTI/DOC(2012)2
31
Yet, the paper also has some limitations and further research is needed. For example, the analysis is based exclusively on trade in manufactured goods, while services are not included. Service trade statistics are highly aggregated, and therefore do not allow to perform an analysis as fine-grained as for manufactured goods. In addition, breaking down service trade data on the basis of their end use is more difficult than for manufactured goods (Miroudot, Lanz and Ragoussis, 2009). The exclusion of services trade from the analysis means that an important piece is missing in fully understanding the dynamics of export competitiveness and integration into global production networks. Companies like Apple and Nokia can capture a large part of the value of their products thanks to their capabilities to deliver services such as product development and design in the pre-production stage and branding, logistics/distribution and marketing in the post-production stage, among others. Services may represent another opportunity for emerging countries to increase their value-creating capabilities as an economic development strategy.
Another shortcoming of the approach taken in this paper is the focus on the product/dimension of specialisation, while not accounting for the quality of products. Recent research has shown that while exports of developed and emerging economies increasingly overlap in terms of products and industries, they are not in fact close substitutes. Generally, emerging countries export lower quality products, and differences in quality increase, the higher the technology intensity of industries both for consumption and intermediate goods. A closer analysis of the international competition in product varieties in relation to GVCs is the focus of another STI Working Paper.
DSTI/DOC(2012)2
32
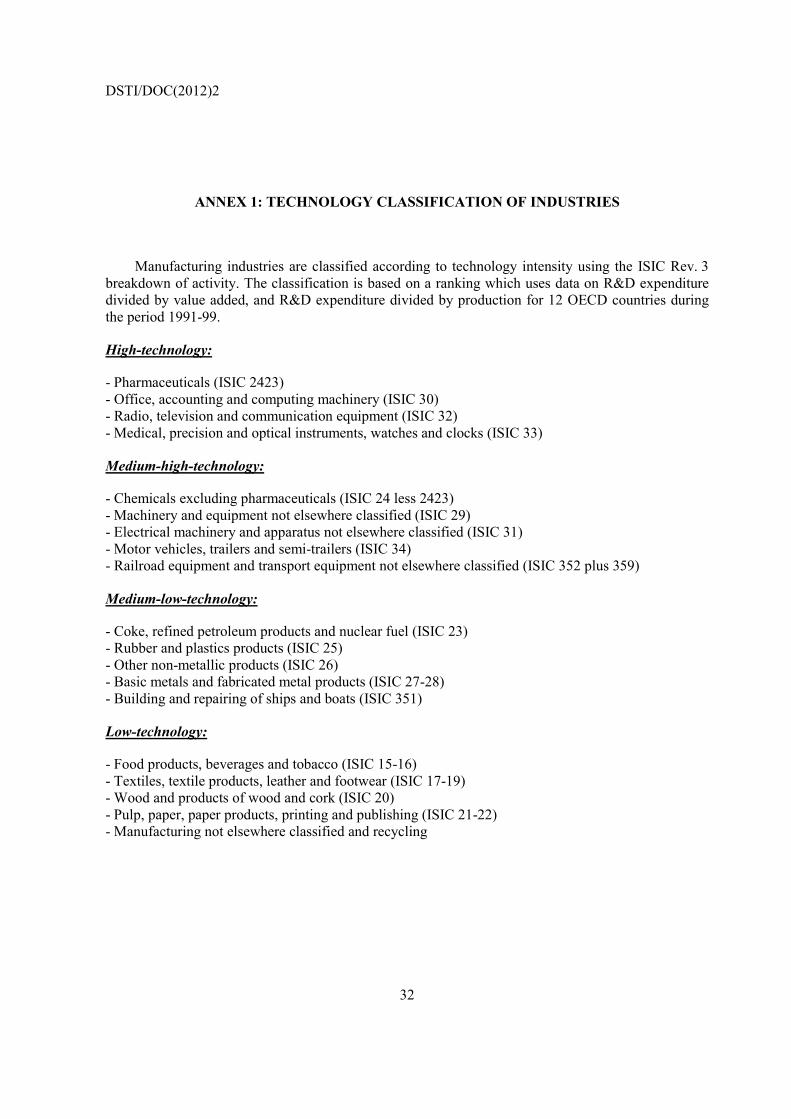
ANNEX 1: TECHNOLOGY CLASSIFICATION OF INDUSTRIES
Manufacturing industries are classified according to technology intensity using the ISIC Rev. 3 breakdown of activity. The classification is based on a ranking which uses data on R&D expenditure divided by value added, and R&D expenditure divided by production for 12 OECD countries during the period 1991-99.
High-technology:
- Pharmaceuticals (ISIC 2423) - Office, accounting and computing machinery (ISIC 30) - Radio, television and communication equipment (ISIC 32) - Medical, precision and optical instruments, watches and clocks (ISIC 33)
Medium-high-technology:
- Chemicals excluding pharmaceuticals (ISIC 24 less 2423) - Machinery and equipment not elsewhere classified (ISIC 29) - Electrical machinery and apparatus not elsewhere classified (ISIC 31) - Motor vehicles, trailers and semi-trailers (ISIC 34) - Railroad equipment and transport equipment not elsewhere classified (ISIC 352 plus 359)
Medium-low-technology:
- Coke, refined petroleum products and nuclear fuel (ISIC 23) - Rubber and plastics products (ISIC 25) - Other non-metallic products (ISIC 26) - Basic metals and fabricated metal products (ISIC 27-28) - Building and repairing of ships and boats (ISIC 351)
Low-technology:
- Food products, beverages and tobacco (ISIC 15-16) - Textiles, textile products, leather and footwear (ISIC 17-19) - Wood and products of wood and cork (ISIC 20) - Pulp, paper, paper products, printing and publishing (ISIC 21-22) - Manufacturing not elsewhere classified and recycling
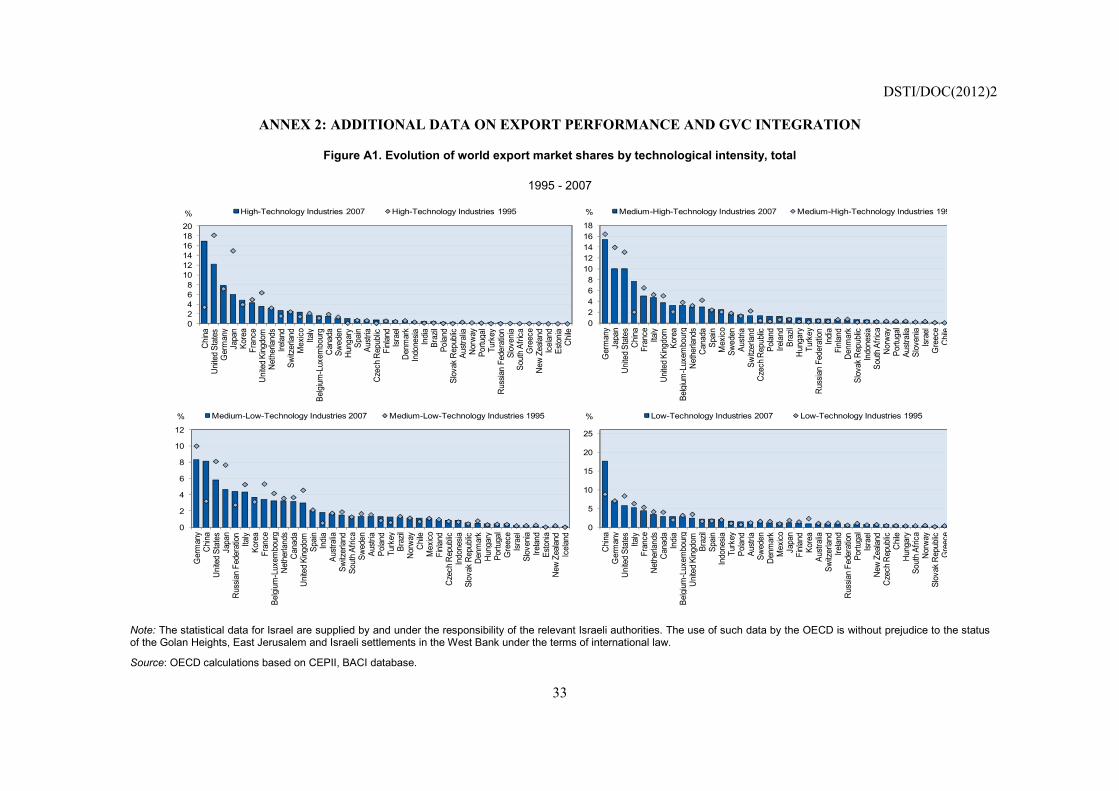
DSTI/DOC(2012)2
33
ANNEX 2: ADDITIONAL DATA ON EXPORT PERFORMANCE AND GVC INTEGRATION
Figure A1. Evolution of world export market shares by technological intensity, total
1995 - 2007
02468
101214161820
China
Unite
d Sta
tes
Ger
man
yJa
pan
Kore
aFr
ance
Unite
d Kin g
dom
Neth
erlan
dsIre
land
Switz
erlan
dM
exico Ital y
Belgi
um-L
uxem
bour
gCa
nada
Swed
enHu
ngar
yS p
ainAu
stria
Czec
h Re p
ublic
Finla
ndIsr
ael
Denm
ark
Indo
nesia
India
Braz
ilPo
land
Slov
ak R
epub
licAu
strali
aNo
rway
Portu
gal
Turk
e yRu
ssian
Fed
erat
ionSl
oven
iaSo
uth A
frica
Gre
ece
New
Zeala
ndIc
eland
Esto
niaCh
ile
High-Technology Industries 2007 High-Technology Industries 1995%
02468
1012141618
Ger
man
yJa
pan
Unite
d Sta
tes
China
Fran
ceIta
lyUn
ited K
ingdo
mKo
rea
Belgi
um-L
uxem
bour
gNe
ther
lands
Cana
daSp
ainM
exico
Swed
enAu
stria
Switz
erlan
dCz
ech R
epub
licPo
land
Irelan
dBr
azil
Hung
ary
Turk
eyRu
ssian
Fed
erat
ionIn
diaFi
nland
Denm
ark
Slov
ak R
epub
licIn
done
siaSo
uth A
frica
Norw
ayPo
rtuga
lAu
strali
aSl
oven
iaIsr
ael
Gre
ece
Chile
Medium-High-Technology Industries 2007 Medium-High-Technology Industries 199%
0
2
4
6
8
10
12
Ger
man
yCh
inaUn
ited S
tate
sJa
pan
Russ
ian F
eder
ation Ita
l yKo
rea
Fran
ceBe
lgium
-Lux
embo
urg
Neth
erlan
dsCa
nada
Unite
d King
dom
Spain
India
Austr
alia
Switz
erlan
dSo
uth A
frica
Swed
enAu
stria
Polan
dTu
rkey
Braz
ilNo
rway
Chile
Mex
icoFi
nland
Czec
h Rep
ublic
Indo
nesia
Slov
ak R
epub
licDe
nmar
kHu
n gar
yPo
rtuga
lG
reec
eIsr
ael
Slov
enia
Irelan
dEs
tonia
New
Zeala
ndIc
eland
Medium-Low-Technology Industries 2007 Medium-Low-Technology Industries 1995%
0
5
10
15
20
25
China
Ger
man
yUn
ited S
tate
sIta
lyFr
ance
Neth
erlan
dsCa
nada
India
Belgi
um-L
uxem
bour
gUn
ited K
ingdo
mBr
azil
Spain
Indo
nesia
Turk
eyPo
land
Austr
iaSw
eden
Denm
ark
Mex
icoJa
pan
Finla
ndKo
rea
Austr
alia
Switz
erlan
dIre
land
Russ
ian F
eder
ation
Portu
gal
Israe
lNe
w Ze
aland
Czec
h Rep
ublic
Chile
Hung
ary
Sout
h Afri
caNo
rwa y
Slov
ak R
epub
licG
reec
e
Low-Technology Industries 2007 Low-Technology Industries 1995%
Note: The statistical data for Israel are supplied by and under the responsibility of the relevant Israeli authorities. The use of such data by the OECD is without prejudice to the status of the Golan Heights, East Jerusalem and Israeli settlements in the West Bank under the terms of international law.
Source: OECD calculations based on CEPII, BACI database.
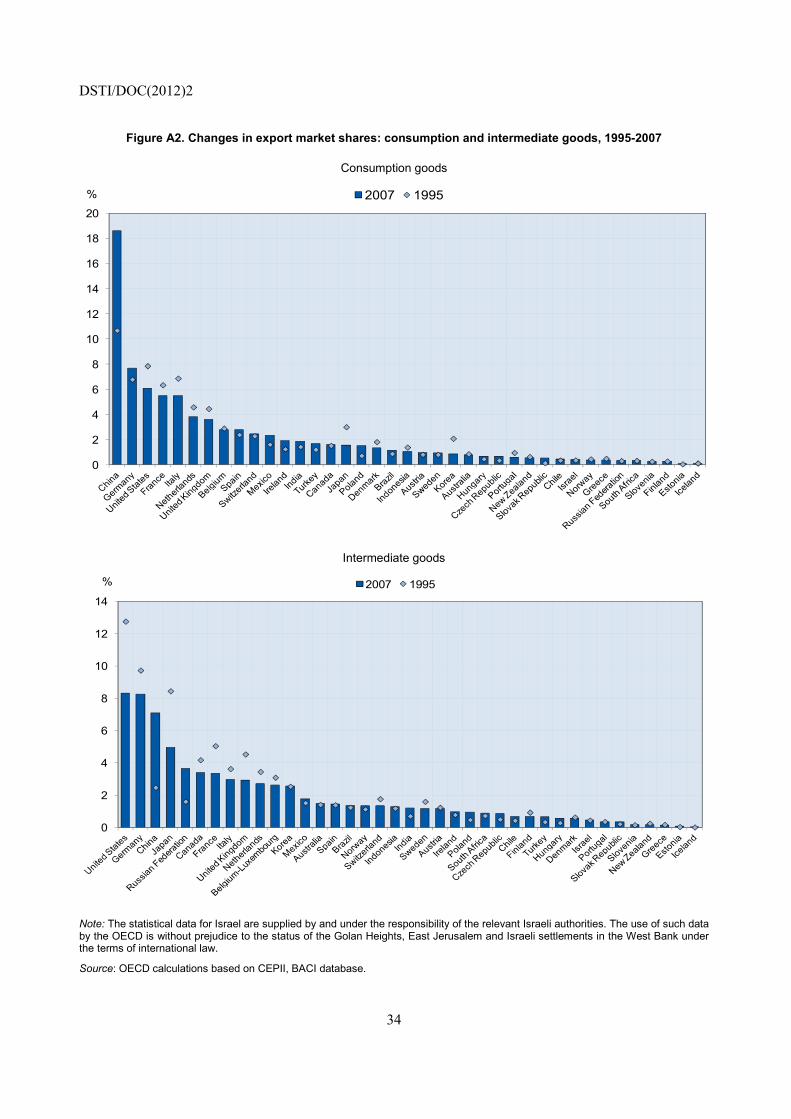
DSTI/DOC(2012)2
34
Figure A2. Changes in export market shares: consumption and intermediate goods, 1995-2007
Consumption goods
0
2
4
6
8
10
12
14
16
18
202007 1995%
Intermediate goods
0
2
4
6
8
10
12
142007 1995%
Note: The statistical data for Israel are supplied by and under the responsibility of the relevant Israeli authorities. The use of such data by the OECD is without prejudice to the status of the Golan Heights, East Jerusalem and Israeli settlements in the West Bank under the terms of international law.
Source: OECD calculations based on CEPII, BACI database.
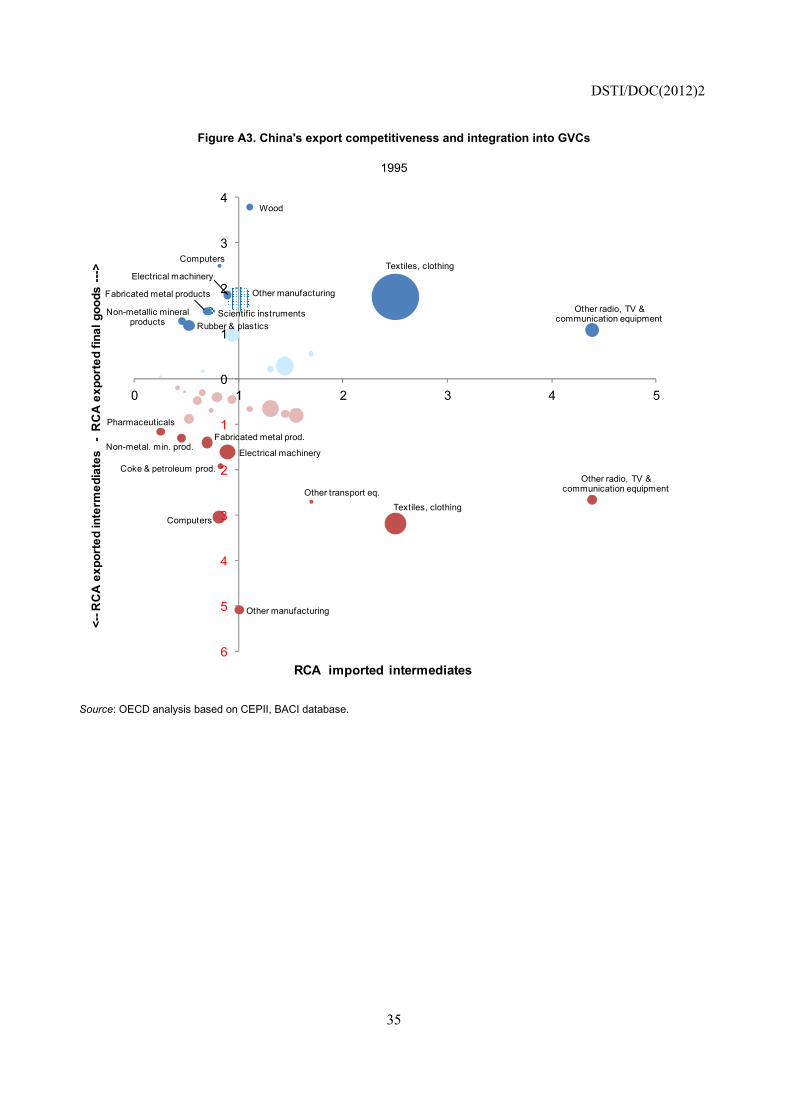
DSTI/DOC(2012)2
35
Figure A3. China's export competitiveness and integration into GVCs
1995
Computers
Other radio, TV & communication equipmentScientific instruments
Electrical machinery
Rubber & plasticsNon-metallic mineral
products
Fabricated metal products
Textiles, clothing
Wood
Other manufacturing
Pharmaceuticals
Computers
Other radio, TV & communication equipment
Electrical machinery
Other transport eq.
Coke & petroleum prod.
Non-metal. min. prod.Fabricated metal prod.
Textiles, clothing
Other manufacturing
6
5
4
3
2
1
0
1
2
3
4
0 1 2 3 4 5
<--R
CA
expo
rted
inte
rmed
iate
s -
RC
A ex
port
ed fi
nal g
oods
--->
RCA imported intermediates
Source: OECD analysis based on CEPII, BACI database.
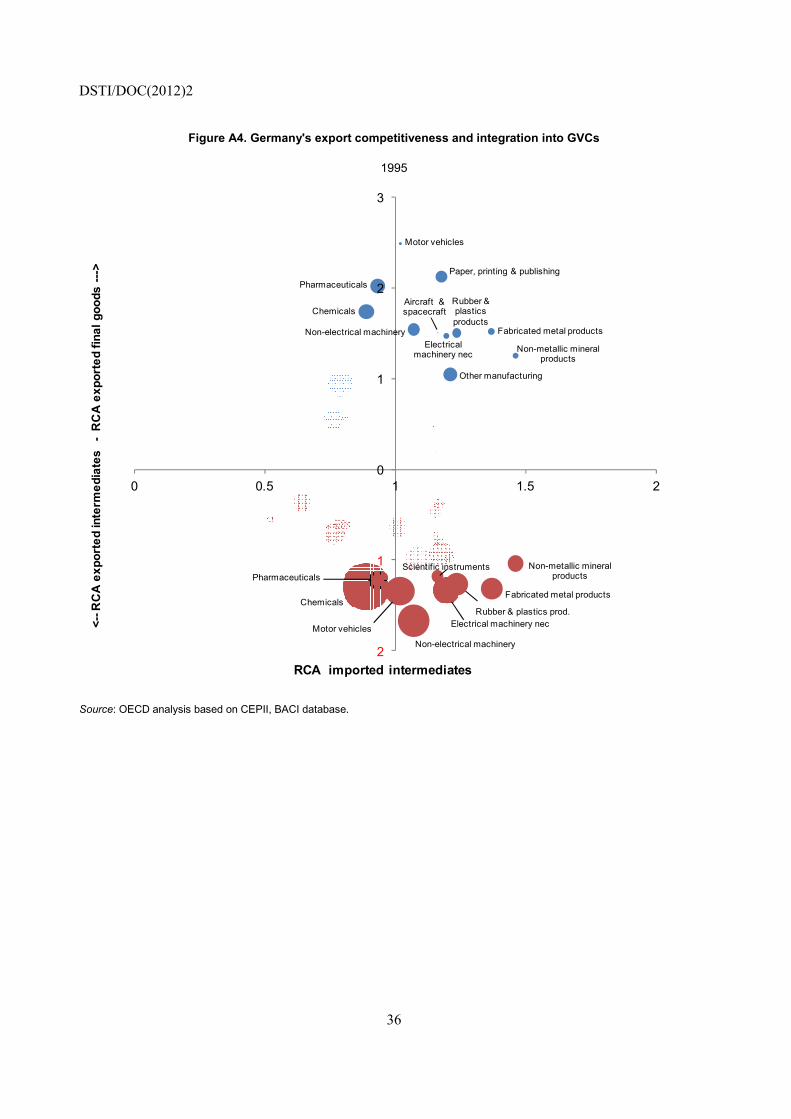
DSTI/DOC(2012)2
36
Figure A4. Germany's export competitiveness and integration into GVCs
1995
Pharmaceuticals
Aircraft &spacecraftChemicals
Non-electrical machineryElectrical
machinery nec
Motor vehicles
Rubber & plastics products
Non-metallic mineral products
Fabricated metal products
Paper, printing & publishing
Other manufacturing
PharmaceuticalsScientific instruments
Chemicals
Non-electrical machinery
Electrical machinery necMotor vehicles
Rubber & plastics prod.
Non-metallic mineral products
Fabricated metal products
2
1
0
1
2
3
0 0.5 1 1.5 2
<--R
CA
expo
rted
inte
rmed
iate
s -
RC
A ex
port
ed fi
nal g
oods
--->
RCA imported intermediates
Source: OECD analysis based on CEPII, BACI database.
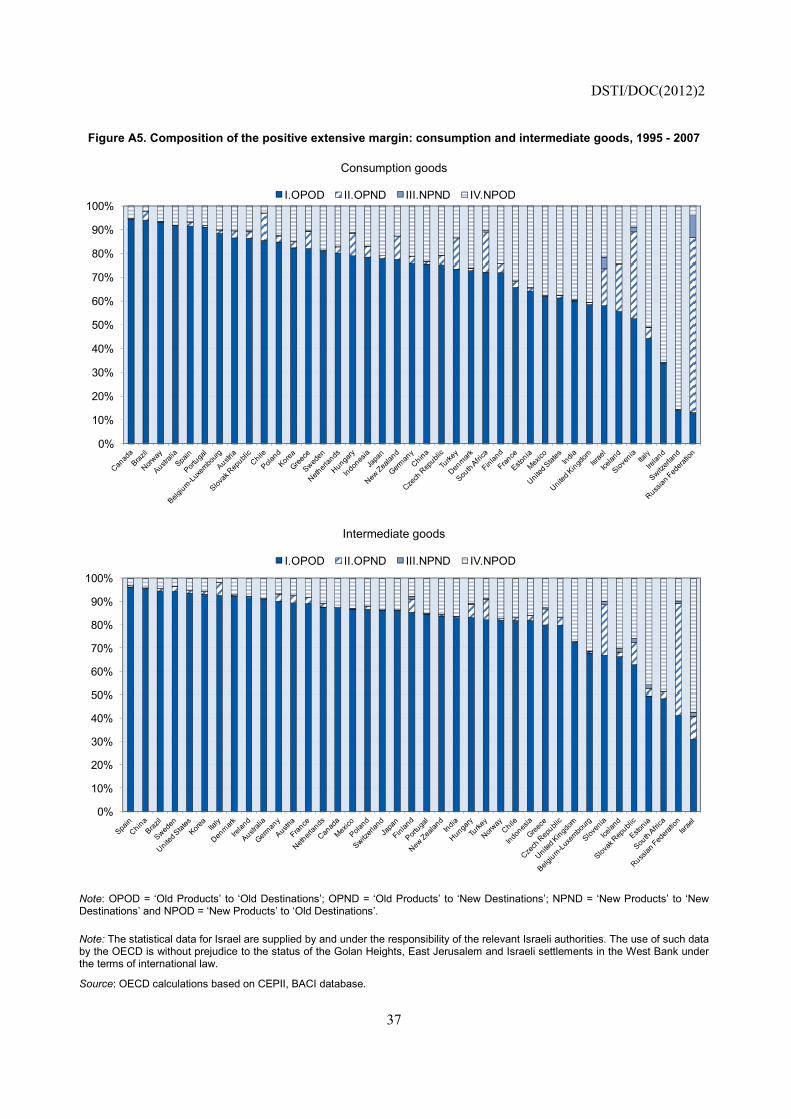
DSTI/DOC(2012)2
37
Figure A5. Composition of the positive extensive margin: consumption and intermediate goods, 1995 - 2007
Consumption goods
0%
10%
20%
30%
40%
50%
60%
70%
80%
90%
100%I.OPOD II.OPND III.NPND IV.NPOD
Intermediate goods
0%
10%
20%
30%
40%
50%
60%
70%
80%
90%
100%I.OPOD II.OPND III.NPND IV.NPOD
Note: OPOD = ‘Old Products’ to ‘Old Destinations’; OPND = ‘Old Products’ to ‘New Destinations’; NPND = ‘New Products’ to ‘New Destinations’ and NPOD = ‘New Products’ to ‘Old Destinations’.
Note: The statistical data for Israel are supplied by and under the responsibility of the relevant Israeli authorities. The use of such data by the OECD is without prejudice to the status of the Golan Heights, East Jerusalem and Israeli settlements in the West Bank under the terms of international law.
Source: OECD calculations based on CEPII, BACI database.
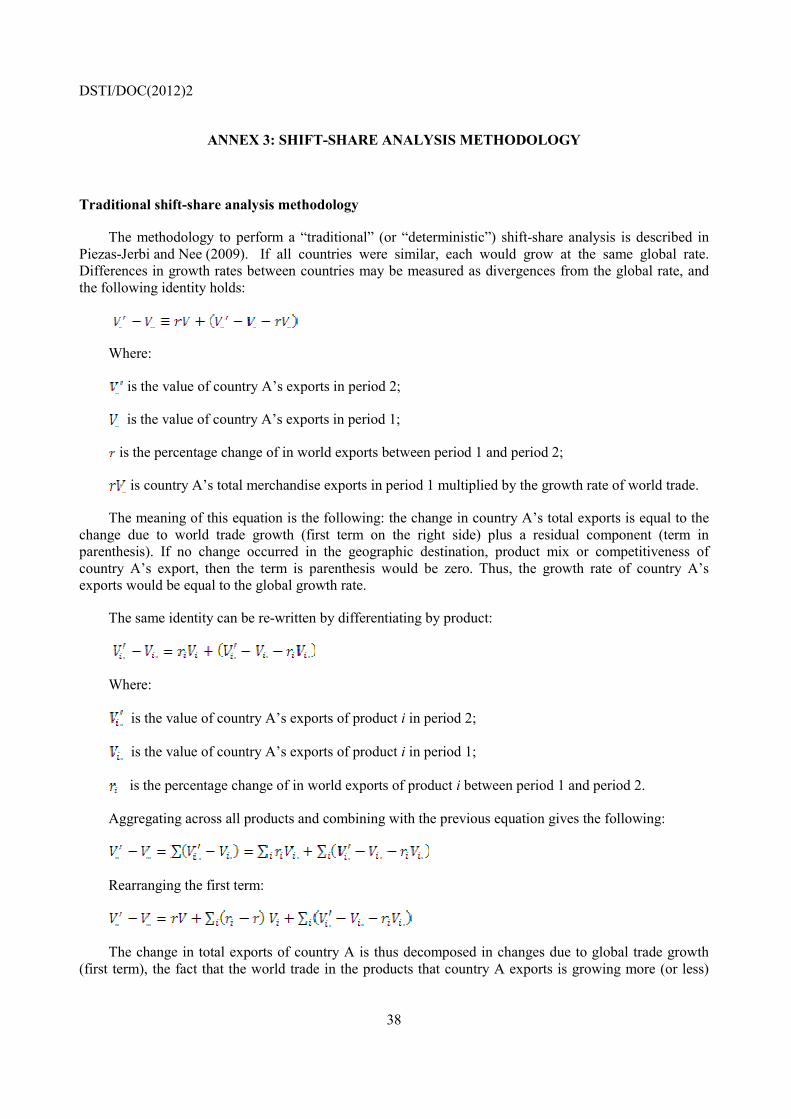
DSTI/DOC(2012)2
38
ANNEX 3: SHIFT-SHARE ANALYSIS METHODOLOGY
Traditional shift-share analysis methodology
The methodology to perform a “traditional” (or “deterministic”) shift-share analysis is described in Piezas-Jerbi and Nee (2009). If all countries were similar, each would grow at the same global rate. Differences in growth rates between countries may be measured as divergences from the global rate, and the following identity holds:
Where:
is the value of country A’s exports in period 2;
is the value of country A’s exports in period 1;
is the percentage change of in world exports between period 1 and period 2;
is country A’s total merchandise exports in period 1 multiplied by the growth rate of world trade.
The meaning of this equation is the following: the change in country A’s total exports is equal to the change due to world trade growth (first term on the right side) plus a residual component (term in parenthesis). If no change occurred in the geographic destination, product mix or competitiveness of country A’s export, then the term is parenthesis would be zero. Thus, the growth rate of country A’s exports would be equal to the global growth rate.
The same identity can be re-written by differentiating by product:
Where:
is the value of country A’s exports of product i in period 2;
is the value of country A’s exports of product i in period 1;
is the percentage change of in world exports of product i between period 1 and period 2.
Aggregating across all products and combining with the previous equation gives the following:
Rearranging the first term:
The change in total exports of country A is thus decomposed in changes due to global trade growth (first term), the fact that the world trade in the products that country A exports is growing more (or less)
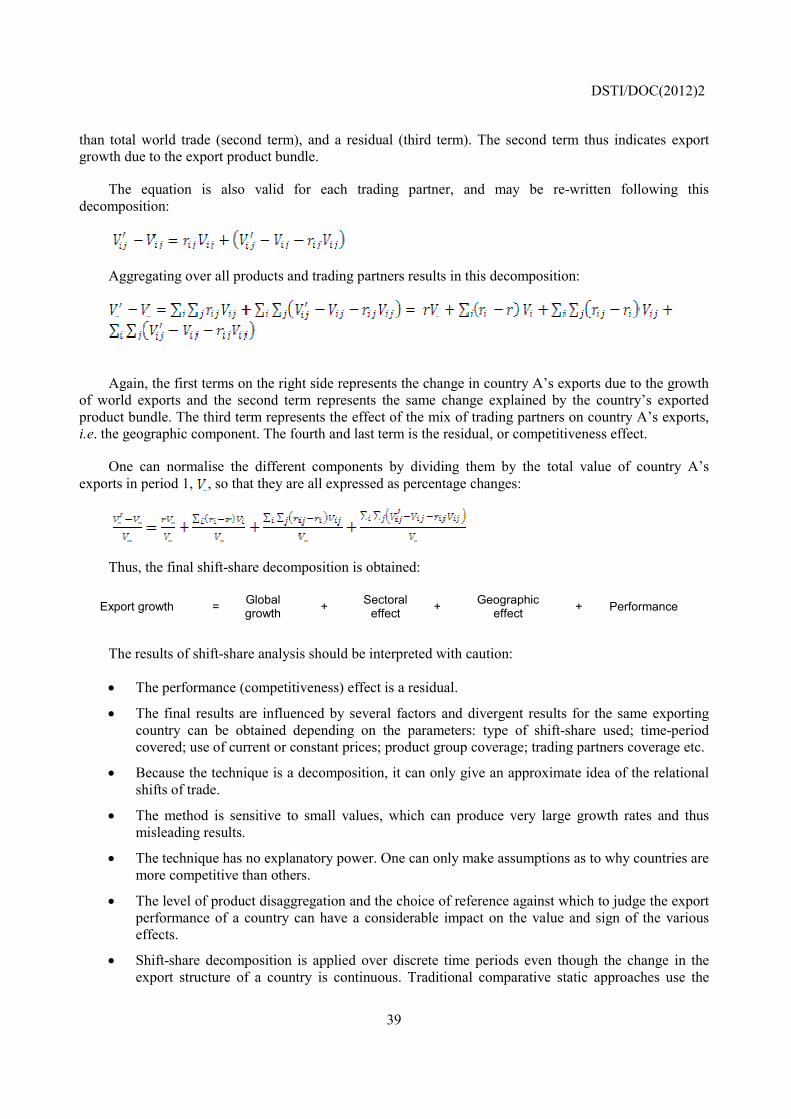
DSTI/DOC(2012)2
39
than total world trade (second term), and a residual (third term). The second term thus indicates export growth due to the export product bundle.
The equation is also valid for each trading partner, and may be re-written following this decomposition:
Aggregating over all products and trading partners results in this decomposition:
Again, the first terms on the right side represents the change in country A’s exports due to the growth of world exports and the second term represents the same change explained by the country’s exported product bundle. The third term represents the effect of the mix of trading partners on country A’s exports, i.e. the geographic component. The fourth and last term is the residual, or competitiveness effect.
One can normalise the different components by dividing them by the total value of country A’s exports in period 1, , so that they are all expressed as percentage changes:
Thus, the final shift-share decomposition is obtained:
Export growth = Global growth + Sectoral
effect + Geographic effect + Performance
The results of shift-share analysis should be interpreted with caution:
• The performance (competitiveness) effect is a residual.
• The final results are influenced by several factors and divergent results for the same exporting country can be obtained depending on the parameters: type of shift-share used; time-period covered; use of current or constant prices; product group coverage; trading partners coverage etc.
• Because the technique is a decomposition, it can only give an approximate idea of the relational shifts of trade.
• The method is sensitive to small values, which can produce very large growth rates and thus misleading results.
• The technique has no explanatory power. One can only make assumptions as to why countries are more competitive than others.
• The level of product disaggregation and the choice of reference against which to judge the export performance of a country can have a considerable impact on the value and sign of the various effects.
• Shift-share decomposition is applied over discrete time periods even though the change in the export structure of a country is continuous. Traditional comparative static approaches use the
DSTI/DOC(2012)2
40
structure of the initial year in the calculation of the geographic and product composition effects, but this means that the competitiveness effect is affected by changes in the structure that occurred between the initial and the final year under analysis.
• In the traditional shift-share, the geographic and product effects are calculated in an asymmetric way. The results depend on the ordering of the effect: computing first geographical effects and then product effects yield different results. This is because depending on the ordering, one of the effects will also include an interaction term between the two.
Shift-share analysis methodology based on econometrics
The traditional shift-share analysis is an algebraic technique, and as such has a serious shortcoming: the results of the decomposition are sensitive to the order in which the effects are computed. In other words, removing first the sectoral component and then the geographic effect from the growth in market share yields different results than doing vice-versa. In order to overcome this problem, several solutions have been proposed. For example, Abreu et al. (2005) compute a separate mixed structural effect representing the interaction between the sectoral and geographical effect, thus treating the sectoral and geographical effects symmetrically. However, the interpretation of this residual is not straightforward.
Another issue with shift-share analysis is that its traditional formulation only considers the export values in the beginning and end years. Thus, the results of the decomposition depend crucially on the choice of period, and the chosen beginning or the end year (or both) could be outliers. A dynamic version of the shift-share technique allows this problem to be addressed, by summing the results of the decomposition for each pair of adjacent years, and thus accounting for in-between years variations (Piezas-Jerbi and Nee, 2009).
Patterson (1991) introduces a full-analogue regression model of the “deterministic” shift-share method, allowing the issue of a lack of a test of statistical significance to be addressed. His model applies to regional employment change, but can be generalised to other fields, including international trade.
The approach adopted in this paper is an econometric version of traditional shift-share analysis based on a methodology developed by Cheptea, Gaulier and Zignago (2005) and further refined in Cheptea, Fontagné and Zignago (2011). Using an econometric approach allows results that are independent of the order of the effects. It also allows testing the statistical significance of the effects as generated by the model. In addition, the decomposition for the 1995–2007 period is obtained by summing the results of the decomposition of annual growth.15
Cheptea, Gaulier and Zignago (2005) write the decomposition as follows:
Where:
is the growth rate of sectoral bilateral exports;
is the intercept roughly corresponding to the average growth rate of world exports;
is a country dummy (fixed effects);
is a partner dummy (fixed effects);
is a sector dummy (fixed effects).
DSTI/DOC(2012)2
41
Bilateral export growth rates are regressed on dummies identifying exporters (i), importers (j) and HS2 groups of products (k). Parameters are estimated at the 2-digit level of the Harmonised System as this ensures a higher level of statistical significant.
The methodology is further refined in Cheptea, Fontagné and Zignago (2010). They use as a dependent variable the growth rate of country i’s exports computed as the change in the logarithm of the Törnqvist index of its exports (i.e. the weighted average of the logarithmic changes in its exports): , where stands for the value of exports, , and .
The growth rate of each individual trade flow is estimated with ordinary least squares (OLS), weighted by , with exporter ( ), importer ( ), and product ( ) fixed effects:
and capture the contribution of the geographic and sectoral effects and measures the export performance of country i. The decomposition is done separately for each year between 1996 and 2007 (as 1995 serves as the base year for the 1995–1996 growth rates), for a total of twelve equations with exporter, importer and product fixed effects in each year.
The growth of country exports can then be written as follows:
.
A fixed effect estimation with constant term will lead to a fixed effect for each dimension to be dropped from the equation due to collinearity. Estimates obtained for the left country, partner and sector dummies will actually represent deviations from the dropped effect, and effects for the omitted group are equal to zero. There are two solutions for the identification problem of all parameters:
1. Drop the fixed effects corresponding to a country/partner/product of a particular interest and interpret estimated effects as deviations from results obtained from the omitted group. The latter becomes accordingly the benchmark for all trade flows in the sample, and is a measure of country i’s “pure” export growth relatively to the omitted country.
2. Add the intercept and the weighted mean of partner and product effects to the estimated effect to obtain the least square mean (LSMEAN) which becomes thus a measure of country i's effect independent of the choice of the omitted country.
Adopting the second approach, the decomposition can be written as follows:
where hats indicate OLS-estimated coefficients.
DSTI/DOC(2012)2
42
The estimated importer and product effects are also normalised by subtracting the weighted average of estimated effects from the parameters estimated originally: and
. Hence the decomposition can be written as:
To sum up: is the growth of exports; is the performance (competitiveness) effect of
country; and and are structural effects: the former is the geographic effect and the latter
is the sectoral effect.
Results for the total period 1995 –2007 are obtained by summing up the effect estimated separately in each year:
.
Finally, the decomposition of export growth is transformed into a decomposition of market shares. This is done by subtracting from both the left and right side of the above equation the logarithmic change in world exports over the period, , and take the exponentials of the resulting expressions:
Where and and are the exponentials of
and , respectively.
DSTI/DOC(2012)2
43
REFERENCES
Abreu, I. et al. (2005), “A disaggragated analysis of the export performance of the Euro area and the Euro area countries”, in T. F. Banks, Competitiveness and the Export Performance of the Euro Area, Occasional Paper Series No. 30/June 2005.
Altomonte, C., F. Di Mauro, G. Ottaviano, A. Rungi and V. Vicard (2012), “Global Value Chains During the Great Trade Collapse: a Bullwhip Effect?”, Document de Travail No 364, Banque de France
Amurgo-Pacheco, A. and D. M. Piérola (2008), “Patterns of Export Diversification in Developing Countries: Intensive and Extensive margins”, Policy Research Working Paper 4473, Washington, DC: The World Bank.
Ando, M. (2006), “Fragmentation and Vertical Intra-industry Trade in East Asia”, North American Journal of Economics and Finance, 17 (3), pp. 257-281.
Araújo, S. and J. Oliveira Martins (2009), “The Great Synchronisation: tracking the trade collapse with high-frequency data”, in R. Baldwin, The Great Trade Collapse: Causes, Consequences and Prospects. A voxeu.org publication, pp. 101-106, London: Centre for Economic Policy and Research (CEPR).
Baldwin, R. (2009), “The great trade collapse: What caused it and what does it mean?”, in R. Baldwin, The great trade collapse: Causes, Consequences and Prospects. A voxeu.org publication, pp. 1-14, London: Centre for Economic Policy Research (CEPR).
Baldwin, R. and D. Taglioni (2011), “Gravity Chains: Estimating Bilateral Trade Flows When Parts and Components Trade is Important”, NBER Working Paper 16672, Cambridge, MA: National Bureau of Economic Research.
Berthelon, M. (2011), “Chilean export performance: the role of intensive and extensive margins”, Central Bank of Chile Working Papers N. 615.
Besedeš, T. and T. J. Prusa (2010), “The role of extensive and intensive margins and export growth”, Journal of Development Economics.
BIS (2010), “UK trade performance: Patterns in UK and global trade growth”, BIS Economic Paper No. 8, London: Department for Business, Innovation & Skills.
Bricogné, J.-C., L. Fontagné, G. Gaulier, D. Taglioni and D. Vicard (2009), “Firms and the global crisis: French exports in the turmoil”, Banque de France Document de Travail No 265, Paris: Banque de France.
Cheptea, A., L. Fontagné and S. Zignago (2010), “European Export Performance”, CEPII Document de travail No 2010 - 12, Paris: CEPII.
DSTI/DOC(2012)2
44
Cheptea, A., G. Gaulier and S. Zignago (2005), “World Trade Competitiveness: A disaggregated view by shift-share analysis”, CEPII Working Paper No. 2005-23, Paris: CEPII.
Felbermayr, G. J. and W. Kohler (2006), “Exploring the Intensive and Extensive Margins of World Trade”, Review of World Economics, Volume 142, Number 4, 642-674.
Frensch, R. (2009), “Trade Liberalisation and Import Margins”, FIW Working Paper N° 39, retrieved from: www.fiw.ac.at/fileadmin/Documents/Publikationen/Working_Paper/N_039-frensch.pdf.
Gaulier, G. and S. Zignago (2010), “BACI: International Trade Database at the Product Level. The 1994-2007 Version”, Paris: CEPII.
Hatzichronoglou, T. (1997), “Revision of the High-Technology Sector and Product Classification”, STI Working Paper1997/2, Paris: OECD.
Hummels, D. and P. J. Klenow (2005), “The Variety and Quality of a Nation's Exports”, The American Economic Review, Vol. 95, No. 3, pp. 704 - 723.
Krugman, P. (2008), “Trade and Wages, reconsidered”, Brooking Papers on Economic Activity (Spring), 103-137.
Krugman, P. (1996), Pop Internationalism, Cambridge, MA: MIT Press.
Liapis, P. (2009), “Extensive Margins in Agriculture”, OECD Food, Agriculture and Fisheries Working Papers, No. 17, Paris: OECD Publishing.
Linden, G., K. L. Kraemer and J. Dedrick (2009), “Who Captures Value in a Global Innovation Network? The Case of Apple's iPod”, Communications of the ACM - Being Human in the Digital Age, Volume 52 Issue 3, March 2009, New York: ACM.
Ng, F. and A. Yeats (1999), “Production sharing in East Asia: who does what for whom, and why?”, Policy Research Working Paper Series 2197, Washington, DC: The World Bank.
OECD (2011), Attractiveness for Innovation: Location Factors for International Investment, Paris: OECD Publishing.
Patterson, M. G. (1991), “A note on the formulation of a full-analogue regression model of the shift-share method”, Journal of Regional Science, Vol. 31, No. 2, pp. 211-216.
Piezas-Jerbi, N. and C. Nee (2009), “Market shares in the post-Uruguay era: a closer look using shift-share analysis”, WTO Staff Working Paper ERSD-2009-14, Geneva:WTO.
Porter, M. (1990), The competitive advantage of nations, New York: The Free Press.
Whittaker, H., T. Zhu, T. J. Sturgeon, M. H. Tsai, T. Okita (2008), “Compressed Development”, MIT IPC Working Paper 08-005, retrieved from: http://web.mit.edu/ipc/publications/pdf/08-005.pdf.
DSTI/DOC(2012)2
45
NOTES
1 Competitiveness has proved to be an elusive concept and little consensus has emerged on how to even
define and measure the international competitiveness of an economy. Krugman (1996) famously noted that while we can refer to the competitiveness of firms, we cannot speak about competitiveness of countries. If a corporation is not performing and its business positition is unsustainable, i.e. it is uncompetitive, it will eventually go out of business. On the other hand, it is much harder to define when a country is uncompetitive. Nevertheless, the concept of “competitive advantage” of countries has emerged in the strategic management literature and has been defined as “the presence of substantial and sustained exports to a wide array of nations and/or significant outbound foreign investment based on skills and assets created in the home country” (Porter, 1990). In a recent issue of the Harvard Business review devoted to United States. competitveness (March 2012), Porter and Rivkin (2012) defined the United States as a competitive location ‘to the extent that companies operating in the United States are able to compete successfully in the global economy while supporting high and rising living standards for the average American’.
2 The Russian Federation is an accession country to the OECD. Brazil, China, India, Indonesia and South Africa are part of the OECD enhanced engagement process.
3 The index is calculated RCA(X)i,c = (Xi,c/Xi, world)/(Xtotal, c /Xtotal, world) where Xi,c and Xi, world are respectively the exports of industry i by country c and the world, while Xtotal, c. and Xtotal, world refer to total (manufacturing) exports by country c and the world. A value larger than 1 indicates that country c possesses a comparative advantage and is specialised in industry i, while a value smaller than 1 points to a comparative disadvantage.
4 Calculated as RCA(M)int-i,c = (Mint-i,c/Mint-i, world)/(Mint-total, c /Mint-total, world) where Mint-i,c and Xint-i, world are respectively the imported intermediates of industry i by country c and the world, while Xint-total, c. and Xint-
total, world refer to total intermediates imported by country c and the world.
5 It has been argued that RCA measures for final exports indicate if a country has a comparative advantage in the production in an industry, while RCA measures for imported intermediates shows whether a country has a comparative advantage in the assembly in industry j. The reasoning is that intermediate inputs have no general use in themselves but are exchanged for further assembly into other products. However the growing spread of GVCs challenges this binary view; countries can import intermediates for the production of other intermediates (e.g. parts and components for the production of semi-finished products).
6 In addition to be the result of international fragmentation, intra-industry trade in intermediates can be also point to horizontal and vertical differentiation (see Ando, 2006).
7 The size of bubbles indicate the volume of exports (in USD) for, respectively, intermediate (below the horizontal axis) and final (above the horizontal axis) goods.
8 Different definitions of the extensive margin have been used. As noted by Besedeš and Prusa (2010), exports classified at the extensive margin by one approach could be classified at the intensive margin by another. For example: country A exports products X and Y to country B, and product Z to country C. If country A starts exporting product Z to country B, it will generate bilateral trade growth that some authors would categorise at the extensive margin, as it involves a new flow (although it is represented by a new combination of an already exported product to an existing destination market). Others would not consider this trade growth as happening at the extensive margin, as it involves neither a new product nor a new destination.
9 In this respect a number of authors (e.g. Felbermayr and Kohler, 2006) warns of the existence of a “pseudo extensive” margin, which arises from the emergence of new countries.
DSTI/DOC(2012)2
46
10 In countries like Japan and Korea but also Mexico, the intensive margin was the only positive contributing
factor in the export growth in consumption goods.
11 Similar results have been reported by Frensch (2009) in analysing the effect of trade liberalisation on import margins in European emerging economies.
12 Of course this residual term includes all the elements that bear on the growth of exports other than the variables that may be accounted for in the analysis. Piezas-Jerbi and Nee (2009) note that the performance effect, like the Solow residual in growth accounting, can be seen as a “measure of our ignorance”, as it captures the cumulative effect of all factors other than the structural components in explaining the change in a country’s world export share. This residual component explains the trade that “shifts away” from expected proportional changes, hence the term “shift-share analysis”.
13 Hence, this technique is also called “constant market share” analysis.
14 Shift-share analysis is based on change over a period, therefore does not reflect the level of development of countries: countries that are further behind typically show a positive residual performance effect indicating that these countries are catching up with more advanced economies.
15 An important implication of this approach is that only the intensive margin (meaning flows existing in any two consecutive years in the period 1995 – 2007) is explained by the decomposition.