Embed Size (px)
Citation preview

J.Nuclear Energy I, 1957. Vol. 4, PP. 3 to 25. Pqamon Press Ltd., London
INELASTIC CROSS-SECTIONS FOR FISSION-SPECTRUM NEUTRONS-III*
H. A. BETHE, J. R. BEYSTER, and R. E. CARTER Los Alamos Scientific Laboratory of the University of California
(Received I February 1956)
CONTENTS OF PART III
CHAPTER 7. DETECTOR CHARACTERWICS
CHAPTER 8. GENERAL GROUP THEORY R 1 Rwinmritrr f’nnrlitinn. Y. I. ““UF”“CJ V”ll..l.lYll” . . . . . . . 8.2. Group Formulation . . . . . . . . 8.3. A Conservation Theorem . . . . . . . 8.4. Determination of Group Constants by Variation of Shell Thickness 8.5. An Approximate Relation Between Cross-Sections
CHAPTER 9. EXPERIMENTAL ARRANGEMENTS 9.1. Reactor Facilities . . . . . 9.2. Monitor Systems and Reactor Stability . . 9.3. Spiral Counter System . . . . 9.4. Alz7(n,p)Mgz7 Counting System . . . 9.5. Sphere Design and Dimensions . . .
CHAPTER 10. EXTRANEOUS EFFECTS 10.1. Fast Neutrons Not Produced by the Source . 10.2. Room Scattering of Source Neutrons . . 10.3. Scattering from Supports . . . . 10.4. Check on Neutron Spectrum . . . 10.5. Non-threshold Neutron Detection . , 10.6. y-ray Effects . . . . . . 10.7. Spurious Counter Effects . . . . 10.8. Counter Size and Position in Sphere . . 10.9. Counter Angular Asymmetry . . .
Chapter 7
3
. 7
. 10
. 12 13
. 15
. 16
. 17
. 17
. 19
. 20
. 21 21
. 22
. 23
. 23
. 23
. 24
. 24
. 25
IN the experimental work presented in the following chapters, three neutron threshold detectors were used : Np237 and U238 fission detectors, and an Alz7(n, p)Mg2’ activation detector. The theory used to evaluate the experiments has been derived by assuming an ideal step function threshold detector and energy loss on all inelastic collisions sufficient to degrade the neutron belpw the ideal threshold.
Since there is no guarantee that a neutron will lose sufficient energy on an inelastic collision to go below the threshold, it is necessary to think of the elastic cross-section used in the analysis as containing a contribution from those inelastic processes
* Part I--J. Nuclear Energy (1956) 3,207; Part II--ibid, 273. Part IV will be published in the next issue.
;

4 H. A. BETHE, J. R. BEYSTER, and R. E. CARTER
which leave the resultant neutron with an energy above the threshold. Furthermore, the threshold detectors used in the experiments do not have ideal responses, as shown in Fig. 7.1. It would be useful, however, to designate as the effective threshold of a nonideal detector, the threshold energy at which an ideal step-function detector would give the same response to the neutron spectrum as the nonideal threshold detector.
For a reasonably flat neutron spectrum over the energy region of interest, this --z-r :_ I-__r_.J _^ Cl_..& ^_^^ * --..-I,. ^_^^ D :, c:.. ?? TL.,..,&--a.- ..,:-- .a-.a:l-,l youn IS ,“GilLCU S” LIISLC ale11 /l cylkzls illl.Xl D 111 L.16;. I .L. 1 llcjlG1 “I C) UJlllg 1I”l”UGcz‘
wi r I
\
i
/
I I -
-
I -
iP
i- 6
-
)Mc
Neutron energy (MeV) FIG. 7.1-Relative detection sensitivitness for the threshold detectors used in the sphere transmission experiments. The general shape of A,._ P..?__ __..I___ __ _ _._.- :_ ̂ 1_^ _.--...- me nsslon-neurron spefrrulll15 US” SLLVWU.
threshold detectors, one measures the cross-section for collisions leading to energies below the effective detector threshold, instead of measuring average total inelastic cross-sections. The effective energy threshold of a Np237 detector, according to the above definition, is O-7 MeV, that of a Wss counter is 1.4 MeV, and that of the alumi- nium detector is about 5.0 MeV. This choice is influenced by the fact that the fission spectrum is far from flat over the sensitive range of the Al detector.
The measured inelastic cross-sections may also be interpreted in another way, in terms of a certain average over the fission neutron spectrum. This average is obtained by deriving eq. (1.2) for a continuous neutron spectrum. The energy losses on

G’L)
6 H. A. BETHE, J. R. BEYSTER, and R. E. CARTER
and s
?V(,9) dE o,,(E) on(E) - m E
ss N(E) dE o&T-+ E’) dE’ #(E’)
Aa= ’ 0 0
s %(E) dE oD(E).
(7.6)
0
Equation 7.6 is the apparent inelastic cross-section due to losses of energy on elastic collisions, and is exactly the same as eq. (6.37). Equation (7.5) is one of the ways of defining the average inelastic cross-section that we measure experimentally. This
-
-
NF
-
17Eh
-
I
3 4 5 ,..6
Neutron energy (MeV)
FIG. 7.3--N(E) CID(E) curves obtained by combining the sensitivity of each neutron detector with the fission neutron spectrum.
integral definition is, of course, approximate since only a thin shell analysis has been used in this discussion.
Another cross-section which we use in the numerical analysis is the average total cross-section
.cn
s N(E) a,(E) oD(E) dE
ZZ 0 at SE
a N(E) aD(E) dE (7.7)

Inelastic cross-sections for fission-spectrum neutrons-III I
The average elastic cross-section to use then is A _= =
Get = Ot - Gin* (7.8) The proper average total cross-section to use in the analysis (eq. 7.7) was obtained
either by numerical integration of eq. (7.7) or by measuring this average directly. JURNEY and ZABEL performed these measurements using a beam from the Los Alamos Fast Reactor (JURNEY (1951) JURNEY and ZABEL (1952). Angular distributions for elastic scattering used in our numerical analysis were those for elastic collisions as defined by eq. (7.8). These angular distributions were also measured by JURNEY and ZABEL for the Np237 and U238 threshold detectors. Angular distributions used in the aluminium threshold-detector analysis are discussed in Chapter 13. A single set of average cross-sections was used for all collisions in the shell. No hardening effects or spectrum changes were considered in the analysis, and the results of the analysis have indicated no need for considering these effects.
A method of comparing integral inelastic cross-sections given in Chapters 11, 12, and 13 quantitatively with inelastic cross-sections obtained with monoenergetic- neutron sources, is to evaluate eq. (7.5) numerically using the differential data. Equation (7.5) indicates that it is not correct to just average the differential data over the fission spectrum, but that the detector energy response must be included. In other words the inelastic cross-section depends on an apparent spectrum shape that is given by N(E) #(E). These so-called spectra are shown in Fig. 7.3 for the three detectors.
Thus, in conclusion, one may think of the inelastic cross-sections for fission- spectrum neutrons given in this report as defined by (1) the neutron cross-section for collisions leading to energies below the effective detection threshold, or (2) the neutron cross-section defined by eq. (7.5).
Chapter 8
GENERAL GROUP THEORY To study the behaviour of a continuous spectrum of neutrons realistically in a
material, it is very often necessary to divide the spectrum into several energy groups and to assign average cross-sections to each energy group. We have until now in this report placed all neutrons in one energy group in deriving sphere transmission and correction formulas. However, the methods developed in previous chapters are adaptable to the description of many group phenomena where transfer of neutrons back and forth between groups by successive scattering occurs.
We are, of course, interested mainly in spherical geometries with the detector inside the sphere and an external source. However, as before, the transmission equations are most easily derived for a central source and external detector. Therefore it is again necessary to test the validity of the reciprocity theorem. Unfortunately, the reciprocity theorem (source-detector interchange) does not hold unless one makes certain changes in the formulas derived with source inside of the sphere. We will first show what those changes have to be.
8.1 Reciprocity Conditions As nearly as possible, we will follow the proof of the reciprocity theorem given in
LA-1428 (BETHE, 1952). However, in that report it was assumed that elastic scattering did not change the energy of the neutron and that inelastic scattering rendered the
8 H. A. BETHE, J. R. BEYSTER, and R. E. CARTER
neutron undetectable. The second assumption is not made in the generalized group treatment in this section. Unfortunately, some of the parameters will be designated by slightly different symbols here to conform with nomenclature in this report. In this report, rr and r2 are the inner and outer radii of the scattering shell and r the radius of an arbitrary point in the shell. tit is the total cross-section measured in cm-r in energy group i. ai dm is the elastic scattering cross-section into solid angle do for neutrons in energy group i. oJ0) dco is the inelastic scattering cross-section into solid angle dm for events that remove neutrons from energy group i and furnish these same neutrons to energy group j.
We will consider a neutron source at the centre of the sphere with a probability of emission into energy group i ofPiS and treat two successive inelastic scattering followed by escape from the shell. The first inelastic collision occurs in arbitrary volume element dV, and the second in dV2 (see Fig. 8.1). On the first inelastic collision the
FIG. I.l-Geometry used for discussion of reciprocity conditions for multi-group analysis.
neutron changes from group i to group j, and on the second from group j to group k. After escaping from the sphere, the neutrons in energy group k hit an isotropic detector of area A,, thickness Td, and detection sensitivity per unit volume of PkD at distance b from the sphere centre. PkD is, of course, proportional to aD, used in Section 6.5 and Chapter 7.
Assuming that the first scattering volume has an area dA,, and a thickness dT, = dV,/dA,, the number of source neutrons in energy group i hitting it is
Pi’ dA, e_o,q-, b rcn2
(8.1)
where r,,is the distance of dV, from the sphere centre, and Xi is the distance actually travelled through the shell material. The fraction of expression 8.1 which is inelastically scattered at dV, from group i to group j through angle 8 into solid angle dw, is
a&) dT, da,. Thus the number of neutrons scattered into solid angle do,, at the same time changing energy group from i to j, is
PCS dVle-oitX1 cij (0) dw, 477 ro12 ’ (8.2)
Inelastic cross-sections for fission-spectrum neutrons-111 9
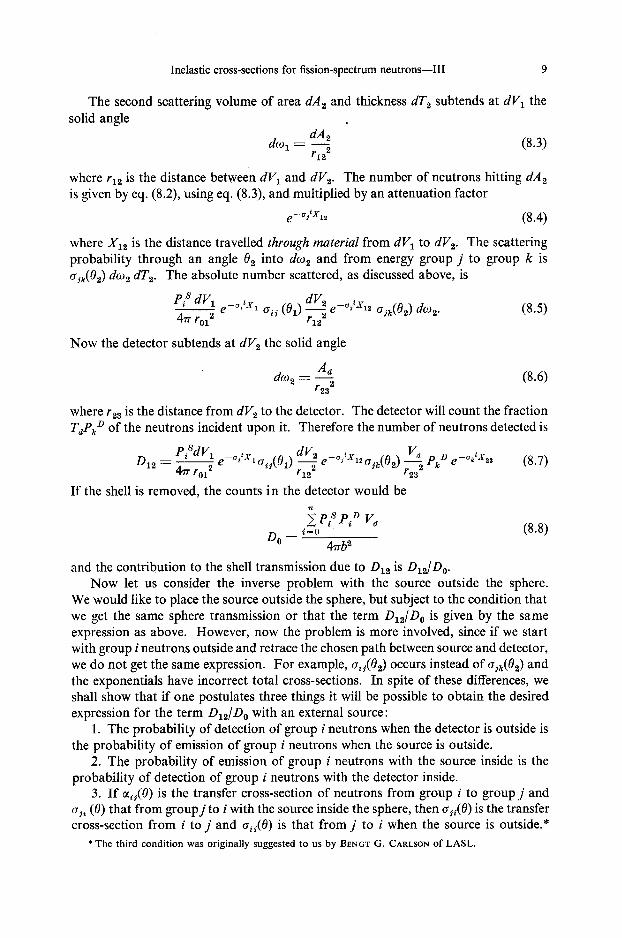
The second scattering volume of area dA, and thickness dT, subtends at dV, the solid angle
(8.3)
where r12 is the distance between dV, and dV,. The number of neutrons hitting dA, is given by eq. (8.2), using eq. (8.3), and multiplied by an attenuation factor
e +x1, (8.4)
where X1, is the distance travelled through materid from dV, to dV2. The scattering probability through an angle 19, into dco, and from energy group j to group k is ~~~(8,) dco, dT,. The absolute number scattered, as discussed above, is
Pi’ dV1 e_o”tx 1
4%. ro12 crii (19,) 3 e-“jfxle ujk(02) dco,.
Now the detector subtends at dV, the solid angle
(8.5)
where rz3 is the distance from dV, to the detector. The detector will count the fraction T,P,” of the neutrons incident upon it. Therefore the number of neutrons detected is
42 = P?% e__oitx dV2 +X
4~ rO12 la&%) 7 e f-12
12 f~~~((j,) 2 pkD e-“ktX*3
r232 (8.7)
If the shell is removed, the counts in the detector would be
and the contribution to the shell transmission due to D,, is D1,/D,. Now let us consider the inverse problem with the source outside the sphere.
We would like to place the source outside the sphere, but subject to the condition that we get the same sphere transmission or that the term D,,/D,-, is given by the same expression as above. However, now the problem is more involved, since if we start with group i neutrons outside and retrace the chosen path between source and detector, we do not get the same expression. For example, o&3,) occurs instead of oik(Q and the exponentials have incorrect total cross-sections. In spite of these differences, we shall show that if one postulates three things it will be possible to obtain the desired expression for the term D,,/D, with an external source:
1. The probability of detection of group i neutrons when the detector is outside is the probability of emission of group i neutrons when the source is outside.
2. The probability of emission of group i neutrons with the source inside is the probability of detection of group i neutrons with the detector inside.
3. If a&3) is the transfer cross-section of neutrons from group i to group j and crjz (6) that from groupj to i with the source inside the sphere, then uri(0) is the transfer cross-section from i to j and oJf3) is that from j to i when the source is outside.*
*The third condition was originally suggested to us by BENGT G. CARLSON of LASL.

10 H. A. BETHE, J. R. BEYSTER, and R. E. CARTER
Using this method, let us retrace the arbitrary path through the shell, starting with group k neutrons outside the sphere. The number of source neutrons hitting dV2 is now
p,D dA, e-%%
4x I.222
The number of those scattered at dV, from group k to group j which hit dV, is
PLDdVZe-U*” x,, o 4-R r2a2
(8.9)
where we have used condition 3 for ojk(B2). The number detected by the central detector is
‘kD dv2 D,,= -e -aktXes dV1 +X1* h r232
ajk @2) 2 e aij (4) e-aitxl vhSpis
rln2 (8.10)
where V, is the volume of the original source inside the sphere and Pi’ is the sensitivity per unit volume. The counting rate with the sphere removed is
D,’ = i PkBPkSVS
k=O 4rb2
It is clear then that D12 D2, D,=D,’
(8.11)
(8.12)
It is, .therefore, possible to do an experiment with the neutron source outside the sphere and to do the group multiple scattering analysis by putting the source inside the sphere, if the source and detector used in the analysis have the characteristics given in conditions 1 and 2 above, and if one also satisfies condition 3 concerning the group transfer cross-sections. Of course, there was no mention of these conditions when we were concerned only with elastic scatterings, as in LA-1428 (BETHE, 1952). The reciprocity theorem for the elastic-scattering case can be proved, either using the three conditions or not using them.
8.2 Group Formulation
The purpose of this section is to derive general formulas for use in determining average transfer cross sections between energy groups. Using a central neutron source, the expression for the number of neutrons escaping from a spherical shell in energy group i, the measurable quantity qi, will be formulated in terms of average group transfer cqefficients and known group cross-sections. We will consider iO energy groups. The highest energy groupwill be denoted by the highest group number. The fraction of the neutrons from the central source in energy group i is di. Yin is the flux of group i neutrons that have suffered n qollisions, integrated over the shell volume. ait’, aiet, aif, sic, and aain are the transport, elastic transport, fission, capture, and inelastic scattering cross-sections, respectively, for energy group i. We are assuming, for generality, that the substance of the shell is fissionable, in addition to having inelastic and elastic scattering. vi is the number of neutrons for each fission

Irdastic cross-sections for fission-spectrum neutrons--III II
produced by a neutron in group i, and uji is the cross-section for transferring neutrons from group j to group i by inelastic collisions. The fraction of the fission neutron spectrum in energy group i is fi. Then the number of n + 1 collisions for neutrons in energy group i is Yin aLtr.
The number of neutrons of group i produced in the n + 1 collisions is
We shall rewrite Sin+l as follows
sp” = 2 cji?rjn (8.14) j=l
where Cji = a;Vji + cji + ujfvifi (8.15)
Of course, gji = 0 forj < i. The number of neutrons of group i which stay in the shell after the n + 1 collision
is ST+l(l - Pi). This is also the number of n + 2 collisions for group i neutrons. Therefore
$1 (1 -pi) =~+lQ (8.16)
The same escape probability will be used in this ,analysis after every collision for energy group i. This is a highly desirable simplification and introduces very little error, as discussed in Section 5.4. Indeed, this simplification makes it possible to sum eq. (8.16) over all collisions, which gives the more useful equation
Or, using eq. (8.14)
.tr $ y+1 = (1 -pi) T ,;+l 2 (8.17)
n=O n=O
OitpnzoY;+l = (1 -Pi) : $c,,YP,n n=Oj=1
(8.18)
We now introduce a quantity Yi, which is the total flux of neutrons of energy group i in the shell
yPi= 5 Yi” (8.19) n=o
Rewriting eq. (8.18)
Oil’ (Y1 - YiO) = (1 - Pi) 2 CjiYj j=l
(8.20)
This is essentially the desired equation, relating the total fluxes Yi to each other and to Y i”. We can find Yio since we know the total number of first collisions, namely
Oi6’Yi% c$i(l _ pi”x) (8.21)
The purpose of the multigroup analysis is, of course, to find Cii, the transfer cross-sections between groups. This can be done from eq. (8.20) if we know Y,. The directly measurable quantity is qi, the number of neutrons in energy group i escaping from the shell. Thus we must obtain Yi from qi. It is easily seen that
qi z +i e-@x + pi 5 ST+1

12 H. A. BETHE, J. R. BEYSTER, and R. E. CARTER
From eqs. (8.17) and (8.19)
uitr (Yi - YiO) 2 TS1= (1 -pi) n=o
Inserting eq. (8.23) in eq. (8.22), we obtain
uitryi = r$i (1 - p’*‘x)+ i!+q+ - & e-cx) z
(8.23)
This is the desired equation, giving Yi in terms of the measured quantity qi and other known quantities.
8.3 A Conservation Theorem
Unfortunately, the Yi do not give us sufficient information to solve eq. (8.20) for the Cj,. In fact, there are only i, equations (8.20), one for each i, while there are altogether io2 unknown coefficients Cj,. The situation could be changed by doing the measurement not only with olte source, but with i. different sources having different spectra $i* If, for instance, each source emitted only neutrons of one group, it is clear that we would have enough information to determine all the C&. Unfortunately, at least in our experiments, we had only one source available, the fission source.
On the other hand, the Cii are not entirely unknown. Going back to their definition, eq. (8.15), we may assume that we know the fission cross-section ujf, the number of neutrons per fission, yj, and the fission spectrumf,. Furthermore, we may assume that we know the total cross-section (rjt and cjet/ciez. Hence, if we know all inelastic cross-sections cii, we also know oiez and therefore ajet. This means that the unknowns are really only the inelastic cross-sections cfi, which are io(io - 1)/2 in number. We shall do all our analyses with three groups, i, = 3, and in this case the number of uii values is also three, so that it seems that we have sufficient information to determine all of the unknowns from the three values of Yi measured with a given source.
However, this is not so because there is a linear relation between the Yi which is always fulfilled. This is most easily seen for a material which has neither capture nor fission. Then the total number of neutrons emerging must be equal to the total number of source neutrons, in other words
This means, for example, that q1 can bepredicted once all the other qi (from i = 2 to io) have been measured. Thus, the measurement of q1 does not give any further inform- ation, but merely a check on the other measurements. The number of independent pieces of information is i. - 1, not i,, and in particular, when we use three groups, we have only two sets of experimental data. One of the three inelastic cross-sections uii will, therefore, remain undetermined.
Similarly, if the material captures neutrons, then the total number of emitted neutrons Cqi will determine the average capture cross-section uc of the sphere material for the neutron spectrum. If the material also undergoes fission, the quantity deter- mined will be the average of uf(y - 1) - u c. To show this explicitly, divide eq. (8.20)

Inelastic cross-sections for fission-spectrum neutrons--III 13
by 1 - Pi and sum over i. Then the inelastic cross-sections oii combine to form xoji = ajin. Using eq. (8.15) and the definition
a.tr = ajet + ajc + cjf + ajin 3 (8.25)
We obtain then
i. ,zl (A) (Yi - Y,O) ,I[ajty + ajf(vi - 1) - at] Yj . (8.26)
2
It will be seen that the inelastic scattering has cancelled out. Combining the terms aitr Yi on both sides of the equation, we may then use eq. (8.24) for this quantity and eq. (8.21) for Yi O. After some algebra we obtain
i0_ ill. i0 Z [eif(vi - 1) - a.icl vi = 2p - izI 4i - (8.27) i=l
On the right hand side is the difference between the total number of neutrons emerging from the sphere and the total number of source neutrons. dn the left is the quantity af(y - 1) - ac, averaged with the “measured” fluxes Yi (eq. 8.24) as statistical weights. Equation (8.27) gives a very accurate means of determining the average of af(y - 1) - a c, or of the capture cross-section ac alone for nonfissionable materials. The accuracy depends, of course, on one’s ability to measure Cq, precisely; i.e., on the availability of a detector whose response is truly “flat” as a function of energy.
8.4 Determination of Group Constants by Variation of Shell Thickness
The discussion of the preceding section leaves unsolved the problem of determining the three inelastic cross-sections as2, aa1, and a2i (if we decide to use three groups). Of course, if one of these three can be determined from other information, then the remaining two can be found from eq. (8.20)-in fact from two of the three substitutions in eq. (8.20) since the third yields eq. (8.27).
If we have no other such information, and if we have only one primary neutron spectrum available, then the only possibility is to try to moderate that spectrum by using shells of different thickness. As the shell thickness increases, we may expect that the number of neutrons in energy group 3, the highest energy group, will decrease relative to that in the two lower groups.. There are two reasons for this: (a) both the lower groups receive neutrons in addition to losing them, and (b) the inelastic cross- section is usually largest in the highest energy group (see Chapters 11 to 14).
The increase of the population of group 1 is unimportant since no inelastic scattering starts from this group, but the relative increase of group 2 means that a measurement at large thicknessweightsazin more thanaain. Since theneutron spectrum does not change rapidly with thickness, this method does not permit a very accurate determination of the three inelastic cross-sections, but still, if we are satisfied with fairly wide limits, a determination of all three is possible. This method was used to determine the aji for some nonfissionable elements; the results are given in Chapter 14.
We shall now derive the necessary formulae for this analysis. The experiments were done with an external fission-neutron source, and detector inside the sphere. Since we wish to use our previous calculations of escape probabilities, we must employ the reciprocity theorem of Section 8.1 and the conditions 1, 2, and 3 stated in that

14 H. A. BETHE, J. R. BEYSTER, and R. E. CARTER
section. We shall be interested in the transfer from energy group 3 to 2, caa. Con- dition 3 now states that the transfer cross section between groups 3 and 2, os2, is to be called that between 2 and 3. Condition 2 specifies that the fictitious neutron source inside the sphere must have a group emission probability equal to the actual detector- group response.
Two detectors were used for this work. The first (“28” or U238 detector) detected only in group 3, and the other (“37” or Np 237 detector) in both groups 2 and 3, with relative efficiencies of P237 and P337 for the two groups. To conform with condition 2, we must, therefore, consider two neutron sources, one emitting only group 3 neutrons and the other both group 2 and group 3 neutrons, with probabilities pro- portional to P237 and P337.
The sphere transmission measured with the “28” counter, group 3 source, is, of course, the same as eq. (3.37). With the two-group neutron source, eq. (8.20) gives
and
. OBtT (Y, - Y30) = (1 - P3)(a3et Y, + u,,Y,) (8.28)
a2t’ (Y, - Y20) = (1 - P2)02et Y,.
For the integrated flux in group 2, we obtain from eq. (8.29)
(8.29)
Y, = 02 t7 Y,O
($in + 02c + OZet P2)
The number of neutrons escaping in group 2 is given by
q2 = p237 e-%Q + P237 P,(l - e-“cX)02et
(a2in + (Tzc + azet P2) *
(8.30)
(8.31)
The integrated flux in group 3 is, from eqs. (8.28) and (8.30)
Y3 = c3 tr Y,O (1 - P3)fJ3262tr Y,O
cogin + cT3c + 03et P3) + ( cr2in + G2C + a2ec P2)(03i” + u3G + a3et P3) . (8.32)
The number of neutrons’escaping in group 3 is now
q3 = P337 emacA* + P,(Y, u3et + Y, CT~~). (8.33)
Or introducing eqs. (8.30) and (8.32), we get
et P 3
(u3in + (T3c + LT3et P3) 1 P23’( 1 - e-“zt’X) fJ32 y3tp P, + (fJ2in + B2C + a2et P2)(c3in + (T3c + 03et P3) * (8.34)
The transmission with the “37” counter is given by
92f2 + 93f3 ’ T37 = f2 P237 + f3 P33’
(8.35)
where f2 and f3 are the probabilities of fission spectrum neutrons being in groups 2 and 3, respectively, which in the “reciprocal” problem is the detector response in those two groups.
Now that eq. (8.35) is derived, ‘we may forget the reciprocity theorem and describe

Inelastic cross-sections for fission-spectrum neutrons-III 15
how the equation is to be used in analysing experiments. The experimental informa- tion (for a given shell thickness) consists of the transmissions measured with a “28” and a “37” counter. From the “28” transmission, we obtain the group 3 constants, using the analysis of Chapter 3. In eq. (8.35), we must insert q2 from eq. (8.31) and q3 from eq. (8.34). The resulting equation contains the known distribution of fission spectrum neutrons fi and f3, the known relative efficiency of the “37” counter for neutrons ofgroups 2and 3, P237 and P3 37 the knowngroup 3constantso,t’ando3in + crsc, , and finally the two unknowns 03s and oZin + 2c (crZt’ follows from the measured oZt and aZet/aZel, once aain + aZc is known, as given by Section 3.5). From a given measure- ment, we can therefore obtain only a relation between aa2 and aZiiE + asG.
In practice, we allow a32 to take several values between zero and aQin (fixed by the “28” counter analysis) and plot a curve of the resulting azin + aso vs aa2.
For each shell thickness we get a different slope for this curve, which is almost a straight line. Thus, if all measurements were infinitely precise, we should obtain an intersection of all the curves of azin + aZc vs aa2 corresponding to different shell thicknesses, and this would represent the correct cross-sections. In practice, the various curves are nearly parallel, and not very precise, so that their intersection cannot be obtained very accurately. This is illustrated in Chapter 14 by the application of these methods to actual measurements.
8.5 An Approximate Relation Between Cross-Sections
In Chapter 12 it is shown that it is possible to deduce consistent one-group cross- sections from the “37” counter measurements that are independent of shell thickness. This result is rather surprising in view of the fact that group 2 neutrons increase at the expense of group 3 as the shell thickness increases, and the inelastic scattering for the two groups is very different. In fact, we can explain the result only if there is an approximate relation between the various inelastic cross-sections. To obtain this relation, we note that the cross-section for removal of neutrons from group 2 is atl” + aZc. The effective cross-section for removing from the “37” counter counts that are due to group 3 neutrons, is
37
a3 eff = aa + as2 1 - ‘+, ( 1 a3
+ asc
where as3’ and a337 are the detection cross-sections of groups 2 and 3.
the “37” counter for
Since the experiments tell us that the neutron removal cross-section as measured by a “37” counter is apparently independent of the spectrum of neutrons in the shell (i.e., of the fraction of group 2 and group 3 neutrons present), the removal cross- sections a3eff and apin + aZc must be approximately equal, i.e.
(8.36)
37
asc + aZin = a31 + a32 1 - 3, + a3’. i 1 (8.37)
It should be emphasized once more that this equation is only approximate because the fact that the inelastic cross-section as measured with a “37” counter is independent of shell thickness, has been established only crudely. The analysis using eq. (8.35) for various shell thicknesses is more reliable.

16 H. A. BE~HE, J. R. BEYSTER, and R. E. CARTER
Chapter 9
EXPERIMENTAL ARRANGEMENTS 9.1 Reactor Facilities
A schematic diagram and typical photographs of the experimental setup at the “Water Boiler” reactor* are given in Figs. 9.1, 9.2, and 9.3. The large cavity in the graphite thermal column provides an external thermal neutron flux of relatively high intensity and cadmium ratio. The ‘internal tapered paraffin blocks reduce the number of escaping fast neutrons. Both internal and external collimators are made of materials which either produce low-energy capture y rays, or have low thermal- neutron capture cross-sections. Cadmium, in particular, was avoided wherever the thermal neutron flux was high. This is because the photofission cross-sections of the detectors are not zero for the high-energy capture y rays emitted by cadmium. Experi- mental checks on this point are described in Section 10.6.
Cadmium shield
FIG. 9.1--Schematic drawing of “Water Boiler” aqd the experimental arrangement.
The thermal neutrons irradiated a plate of U235, producing a fission spectrum (NERESON, 1952; BONNER et al., 1952; HILL, 1952; and WATT, 1952) source of about 2 x lOlo neutrons per second. The uranium was covered on the outside by a thin sandwich of aluminium and boron lo. This had two functions: (1) to attenuate the thermal neutrons which passed through the uranium plate, and (2) to prevent scattered thermal neutrons from entering the uranium plate from the room and causing fission. It was calculated that less than 2 per cent of the fast-source neutrons suffered collisions in the uranium and aluminium-boron cover plate before escaping. The last 10 inches of collimator, onto which the source plate was fastened, was a thin aluminium box containing boronlo (Fig. 9.2). Not more than about 1 per cent of the neutrons reaching the detector resulted from single scattering in this collimator. The scattering from the floor and reactor face is discussed in Section 10.2.
*Rev. Sci. Instrum (1951) 22,489

FIG. 9.2.43ternal collimator with source and a typical S-inch (outside diameter) sphere on its supporting cone.
facing p. 16

FIG. 9.3.-Source plate and a spiral counter in positiod at the centre of a hemisphere.

Inelastic cross-sections for fission-spectrum neutrons-III 17
The thermal column used for this work is provided with a boron “curtain” which can be lowered easily to decrease the neutron flux by a factor of about 500. This curtain was lowered when personnel entered the reactor room.
The fast neutron detectors were held in position by a system of clamps and stands which were completely independent of the sphere supports. The spheres were held by an aluminium cone, supported on a thin aluminium vertical tube, and braced at right angles by aluminium tubes. A discussion of the scattering by supports is in Section 10.3.
The source-to-counter distance was measured from the midpoint of the uranium plate to the middle of the detector, and was accurate to about &inch. The detector was centred in the sphere to about & inch.
9.2 Monitor System; and Reactor Stability
Two independent neutron monitors were inserted into the side of the thermal column (Fig. 9.1). One was a spiral fission counter (ROSSI and STAUB, 1949) containing U235. The slope of its counting rate vs bias curve was about 0.2 per cent per volt, for about ‘25 volts. The electronic circuits for this counter were duplicate systems, housed in a thermostated cabinet.
The second monitor also contained U235, and the slope of its counting rate vs bias curve was about O-1 per cent per volt for about 60 volts. The positions in the column of these two monitors were arranged so that their counting rates were approxi- mately equal, and about 10 to 100 times the counting rates of threshold detectors. The monitor counts were always used to normalize the data.
With these monitors, incidentally, the flux from the “Water Boiler” was found to be constant to about O-2 per cent over periods of the order of an hour or two. These were the lengths of time involved in making a single transmission measurement.
9.3 Spiral Counter System
9.3.1 Counters and Electronics. In order to obtain sufficient sensitivity in the fission- threshold detectors, spiral counters were used (Fig. 9.3). If the fissionable material is thicker than a few tenths of a milligram per square centimetre, the counting rate will generally be a rapid function of the discriminator setting. This was the case for the counters used in these experiments, the counting rates changing a few per cent per volt change in bias. To obtain accuracies of the order of O-1 per cent, therefore, required electronics stability of the order of a few hundredths of a volt.
Some of the things which were done to the electronic-counting systems to promote reliability and convenience are listed below.
1. A special service transformer isolated the electronics circuits from the commercial power line.
2. Line filters and Sorenson voltage regulators were used on all circuits. 3. All circuits were housed in closed cabinets, thermostated to f2”C. 4. Some questionable components in the circuits were replaced. 5. The electronic circuits on the threshold detector were in triplicate, from
preamplifier through scaler. 6. Care was taken to avoid grounding the detector, except through the cable
shields connecting to the main amplifier chassis. 2
18 H. A. BETHE, J. R. BEYSTER, and R. E. CARPER
7. The sensitivity of the detectors to the collecting voltage was checked at different gain settings.
8. The amplifier noise and preamplifier noise were periodically examined on an oscilloscope.
9. A thermostated Los Alamos Model 500 pulser was used between runs to check overall gains through a lF-,XP capacitor.
10. Most of the vacuum tubes were checked before each running period. 11. The circuits were normally left on, so that temperature equilibrium was
established. 12. The counter and preamplifiers were mounted on rubber to minimize
microphonics. 13. To minimize radiation hazards, the counts were registered in an adjacent,
shielded room. Checking the gain stability of the electronic components through the small
capacitor was done as follows: The coarse gain of the Model 101 amplifier was reduced, the fine gain left in its
running position. The 60-cycle pulser was plugged into the preamplifier distribution box and the discriminators on the three scalers were adjusted to give a counting rate of 30 f 3 counts per second on each one.
The discriminator heliopot readings could be estimated to 0.02 volt, and changes of about this amount would remove the pulser counting rate from within the above limits. On successive gain checks, at intervals of approximately 30 minutes, the three systems generally did not change in the same direction. This indicated that the pulser, when used in this way, was stable to about 0.02 volt. The actual changes required in discrimator setting were usually not more than about 0.03 volt.
Estimates of cpunting rate stability, based on the gain checks and bias curves of the counters, were as follows:
(1) U23s counter &O-OS per cent
(2) Np237 counter ho.09 per cent
These numbers, together with the confidence gained by making independent repeat transmission measurements, indicate that the statistical uncertainties quoted on the transmissions are reliable. The results of the experiments recorded in Chapters 11, 12, and 13 show that the present accuracy was necessary for the following reasons:
1. To obtain meaningful transmissions for very thin shells. 2. To obtain reliable measurements of some of the small effects in order to verify
the theory which explains them. 3. To obtain reasonably accurate final inelastic-scattering cross-sections.
9.3.2 Collection of Data. With the reactor off, the source, counter, and sometimes a sphere were set up. The amplifier gains were checked with the pulser, and the noise patterns were observed with the oscilloscope. The reactor was started. Personnel left the reactor room, the boron curtain was raised, and three to six lo-minute runs were taken. The three sets of counts from the threshold detector, and three sets from the monitors were recorded for each run. All counting rates were examined to insure that all systems indicated the same changes, if any.

Inelastic cross-sections for fission-spectrum neutrons-III 19
The boron curtain was then lowered, the amplifier gains were checked with the pulser, and the sphere was changed, if appropriate. After more data were taken, transmissions were computed for each of the six electronic channels.
If there was not agreement to well within the statistics for at least two of the three systems on the threshold detector, the data were not used, but the counter and electronics were suspected and investigated. When at least two of the systems did agree, which usually occurred, the average of these was computed, and this was divided by the average ratio of counts for the monitors. The resultant transmissions are given in the Tables 11.1, 12.1,13.1. The statistical uncertainty is that computed from the numbers of counts recorded. The fractional statistical uncertainty in the monitor transmissions was about one-sixth of that for the threshold detectors.
In many cases, the transmission which is recorded in the tables is the average of two or more independent measurements made on different days. Such repeat runs were seldom outside of the combined statistical accuracies.
9.4 A12’(n, p)Mg2’ Counting System
9.4.1 Detector and Counting Arrangement. For sensitivity reasons, spirals of alu- minium foil were used as detectors. Pure 2-S aluminium foils were cut uniformly to the following dimensions : 0.010 inch thick by O-50 inch wide by 18 inches long. During irradiation, a foil was rolled into a tight spiral and inserted into a small brass holder which was similar in design to, and supported like, the fission detectors. The foil was then covered by a &-inch thick cadmium cup.
During counting, the foil was wrapped around a 0.003 inch thick aluminium sleeve which fitted snugly over a cylindrical, aluminium-walled, proportional, methane flow ,Ll counter. This counter, with a O-0005 inch diameter central stainless-steel wire operated at about 2.5 kv, had a flat bias curve, and at the gain and bias settings used, had a voltage plateau of about 1 per cent per 100 volts. The effective deadtime of the system was less than 10 microseconds. This was the primary reason for building it, The counts were recorded on either one of two Model 750 scalers which could be alternated instantaneously by a switch.
The uniformity of sensitivity of the counter was checked by sliding a Cs13’ /? source over the surface of the aluminium sleeve. The counting rate over most of the surface was constant to within & 1 per cent. The maximum deviation from the average was 2 per cent. The effect seems to be caused by variations in the wall-thickness, and is expected to be smaller for the higher energy Mg2’ /Ys.
For the aluminium foils used, the self-attenuation of neutrons during irradiation and of p’s during counting are both small, and are about the same for both sphere-off and sphere-on runs. Errors of this sort tend to cancel out, particularly if the neutron attenuation is caused principally by elastic scattering. A directional asymmetry in sensitivity of the spiral is an indication that effects caused by attenuations will not cancel in a sphere transmission. The foils which were used in these experiments had been checked in a well-collimated fast neutron beam and recut to decrease such asymmetry to not more than 1 per cent.
Some incidental observations made during the course of these runs are: 1. The Mg2’ half-life was checked to about I per cent, and, though slightly shorter,
does not disagree with the previously reported value (EKLUND and HOLE, 1943). 2. A localized decrease in gas amplification of about 20 per cent was found after 109

20 H. A. BETHE, J. R. BEYSTER, and R. E. CARTER
counts. This was produced by a collimated /? source, and was easily observed by sliding the source along the counter. The effect may have been caused by a deposit on the 0.0005 inch diameter central wire. The measurements of this report were not affected by this change in gain.
9.4.2 Collection of Data. With the reactor off, the foil was inserted into its holder. The reactor was brought up to operating power in about 1 minute, and a 30-minute irradiation was timed by a stop-watch and monitored with counters. Shutting off the reactor ended the irradiation. The aluminium foil was unwound, washed in clean acetone, and wrapped around an aluminium sleeve, which was slid over the b counter. With the two scalers and the alternating switch, counts were taken every 30 seconds for about 10 minutes, and then every minute for about 20 minutes more.
Two or three more counts were taken at intervals of a couple of hours to determine the effective background, of which about 60 per cent was true counter background and about 40 per cent was due to the foil. The half-life of this latter activity was about 14 hours, and presumably was caused by the A12’(n, a)Na24 reaction.
The background, long-lived activity, and short-lived A12’(n, y)A12* activity were subtracted graphically from the total counts recorded in 30 minutes. This left only the counts caused by the A12’(n, p)Mg2’ reaction. Of approximately IO5 counts recorded for each irradiation, about 90 per cent were due to the (n,p) reaction. A systematic method of making the subtractions had been established by studying foils whose activations were much higher than the foils irradiated in the transmission measurements.
9.5 Sphere Design and Dimensions The spheres were machined as two hemispheres with an overlap in the equatorial
plane. There was one hole, centred in this plane, through which the counter stem entered. The area of the hole was, in general, much less than 1 per cent of the sphere surface area, and faced normal to the line joining source and detector.
All sphere dimensions were measured with a micrometer to the nearest O*OOl inch, and the spheres were weighed to an accuracy of better than 0.1 per cent. Average densities were then computed to about 0.1 per cent, and usually agreed with the best handbook values.
The composition or uniformity of some spheres was questionable. Spectroscopic analyses or radiographic measurements were made, and where these indicated a necessity, corrections were made, or the limits of error were increased on the inelastic cross-section.
In making repeat transmission measurements, the position of the hemispheres were sometimes interchanged, with no apparent real change in the observed transmission.
Chapter 10 EXTRANEOUS EFFECTS
In this chapter a more detailed discussion is presented of some of the effects which may cause uncertainties or errors in a sphere transmission experiment. Some are characteristic of the present experiments, in which a reactor was used, and some are characteristic of sphere transmission experiments in general.

Inelastic cross-sections for fission-spectrum neutrons-111 21
10.1 Fast Neutrons Not Produced by the Source
In reactor experiments, some fast neutrons are always present. These constitute a background of uncertain spectrum and geometry. In the present cavity and collimation system the magnitude was less than 1 per cent at all source-to-counter distances used, and was nearly the same for both U238 and Np 237 detectors. Since these neutrons were in a broad beam, however, it was not clear how they would affect the measured transmission of a sphere. Sphere transmissions were therefore run without the U235 fission source in order to remove this effect. The largest correction, about 1 per cent in transmission, was found for the largest spheres at the 5 inch source-to-counter distance.
10.2 Room Scattering of Source Neutrons
The distances of the source and detector from the floor and reactor face were not large, so there was a background at the counter caused by source neutrons scattered from these surfaces. This background was expected to be relatively uniform through- out the region around the source which was used in these experiments. The neutron flux coming directly from the source will fall off approximately as the inverse of the square of the distance. Therefore, if measurements of this background are made at the largest source-to-counter distance, a rough estimate can be made of the background at other positions.
The following measurements were made with the U23s counter to evaluate this background, and its effect on a sphere transmission :
(1) The residual counts were determined behind a bulk shadow shield covering the large (49 by 6 inches) source plate.
(2) The residual counts were determined behind a good geometry shadow shield of a l-inch-diameter fission source.
(3) An approximate computation of the percentage of scattering was made. (4) A measurement was made of the counting rate as a function of source-to-
counter distance. (5) Sphere transmissions were run behind the bulk shadow shield. 10.2.1. Large Source with Bulk Shadow Shield. The detector was mounted 20 inches
from the large U235 source, and the counting rate was determined with various thicknesses of the scattering pieces between the two. The scattering pieces, made of steel, polyethylene, or a B&-paraffin mixture were large enough to shield the counter from every point of the source. With a 13-inch thickness of each of these, for which the simply computed transmission is not more than 1 per cent, the apparent background was about 6 per cent. To eliminate the possibility that much of this apparent back- ground was caused by the poor geometry of the shadow shield, the following experi- ment was done:
10.2.2. Small Source with Good Geometry Shadow Shield. The large U235 plate was replaced by a l-inch-diameter disk of U235, and the counter set up at 20 inches. In this geometry, the computed transmissions of the shadow bars were less than 1 per cent, but the same value, approximately 6 per cent, was obtained for the back- ground at 20 inches. The counter was moved farther from the source and longer shadow bars inserted. The apparent relative background increased with increasing source to counter distance, as was expected.

22 H. A. BETHE, J. R. BEYSTER, and R. E. CARTER
10.2.3. Computation of Background. The expected behaviour of the relative back- ground as a function of source to counter distance was computed under the following assumptions :
(1) Source neutrons are emitted isotropically from a point. (2) All neutrons which enter either the floor or reactor face are elastically scattered
isotropically at the surface. (3) Air scattering is neglected, and the roof and other walls are very far away. This should give an overestimate, because of assumption 2, and because the
counter actually has a relatively high threshold. The computed relative background at 20 inches from the source was 9 per cent.
10.2.4. Inverse Square Measurement. A measurement \;las made of the counting rate as a function of the distance between the 1 inch disk source and the counter. The accuracy was not high, but the deviation from an inverse square falloff indicated about 5 per cent relative background at 20 inches from the source.
10.25. Small Sphere Transmission Behind Bulk Shadow Shield. Since all measure- ments were consistent with a relative background of about 6 per cent at 20 inches from the source, the effect on a sphere transmission was studied directly. The transmissions of small spheres were measured while the counter and entire sphere were shielded from the large U235 source by bulk shadow shields. In the cases tried, the transmission of the background was within 2 per cent of that obtained with no shadow shield present. Upon removal of the properly weighted background transmission from the transmission obtained with no shadow shield present, the apparent inelastic cross- section changed by only about 1 per cent. On transmissions run at 5 inches and 10 inches from the source, the background effect must be several times smaller, but it was not measured. Since this background correction is not large, it has not been applied to the data.
With the Np237 counter, the relative background at 20 inches from the source was 8.5 per cent. The transmissions of the small spheres were not measured behind the large shadow shield, however. This is because of relatively low counter sensitivity, and the fact that the sphere transmissions would have been very close to unity and con- sequently difficult to interpret. As in the case of the U 238 counter, the effect at 5 inches was not measured because of the prohibitively high transmissions of such short shadow shields.
For the Np237 counter, correction for this background might increase the inelastic cross-sections by 5 per cent at the most. However, since it is probably smaller in most cases and we do not know it accurately, we have not made this correction.
Because of the shape of the fission spectrum and the positions in energy of the thresholds, the background in the A12’(n,p)Mgz7 detector was expected to be even lower than in the U2sscounter. A measurement wasnot made, however, nor acorrection.
10.3 Scattering from Supports In the initial experiments, small steel rods were used for hanging the spheres.
When a sphere was removed, it was most convenient to remove the rods also. This procedure removed some scattering material, and caused an error of 2 to 5 per cent in cross-section. A small aluminium cone system was later used for supporting the spheres. This caused less than 0.2 per cent scattering into the counter. The cone was left in place when the sphere was removed and mechanically was much superior to the

Inelastic cross-sections for fission-spectrum neutrons-III 23
hanging rods. All of the data in the tables of Chapters 11, 12, 13 and 14 have been obtained with this cone support.
10.4 Check on Neutron Spectrum Some of the data on total cross-sections and angular distribution of elastic
scattering which are used in the calculations of tin (see Chapters 11 and 12) were obtained with a beam of neutrons from the fast reactor (Clementine). In order to determine how similar the spectrum of that beam was to a fission spectrum for neutrons above the U238 threshold, the same detector was used to measure the total cross-section of hydrogen in both spectra. The measurements in the fast reactor beam were made by JURNEY and ZABEL (1952). The value obtained in the fast- reactor beam was 2.15 f 0*2 barns.
To determine the average hydrogen cross-section at the “Water Boiler,” poly- ethylene and graphite scatterers were interposed midway between the external l-inch- diameter U235 source and the Uz3* counter. The scattering cylinders were 1.27 inches in diameter and about 1 inch long. The distance between source and counter was 13 inches. The total cross-section for hydrogen which was obtained, with no correction for inscattering, was 2.18 * 0.11 barns. The numerical integration of the published hydrogen cross-section over the fission spectrum* and the U238 fission cross-section gave 2.45 barns.
10.5 Nonthreshold Neutron Detection Two effects to be considered here may introduce errors into the sphere-trans-
mission measurements. First, the fissionable material of the threshold detector may have a finite thermal-fission cross-section. Second, there might be a contaminant which has a finite fission cross-section at all energies. If either of these should occur, some low energy neutrons will be detected.
With cadmium sheets placed on the floor and face of the reactor, cadmium cups on the detector made no observable effect on the counting rate. The fraction of the counts to be expected from the two above causes was determined by further experi- ments to be less than 1O-4 for the Np237 and U23* counters. Any such effects were routinely eliminated by the method of analysis of the A12’(n, p)Mg2’ data.
10.6 y-Ray Effects 10.6.1. y Fission in the Threshold Detectors. High energy y rays can produce photo-
fission in the detectors. The two principal y-ray sources are capture of thermal neutrons in the collimator materials and y rays accompanying fission or radiative capture in the U235 source. The first was minimized, as has been pointed out in Section 9.1. The second could not be avoided. The following two evaluations were made of these effects:
(1) Transmission measurements were made on small spheres behind different types of shadow shields.
(2) Computations were made of the number of y rays from the fission source. In the experiments when a low atomic-weight shadow shield was inserted (Section
10.2.5), the neutrons were attenuated by a factor of about 20, whereas the high-energy
* Neutron Cross-Sections Compilations AECU-2040, 1952.

24 H. A. BETHE, J. R. BEYSTER, and R. E. CARTER
y rays were attenuated by a factor of 2. This increased the relative number of y rays by a factor of about 10. Sphere transmissions behind the shadow shield thus gave an upper limit of the relative numbers of photo-fissions in the detector.
By replacing the central 2 inches of B&-paraffin shadow shield with 2 inches of lead and repeating the sphere transmission measurements, a more accurate value was obtained. The relative number of photo-fissions in the detector with no shadow shield and no sphere was O*OOO f 0.005.
For the computations, the following assumptions were made: (1) All y rays come from the source. (2) There are 12 y rays per fission, distributed in energy like the spectrum reported
by MOTZ (1952). (3) The photofission cross-section in the region of 6 to 7 MeV is 0.030 barns. With no sphere around the detector, the number of photo-fissions in the U23s
detector is computed to be 0.1 per cent of the number of neutron fissions. 10.6.2. Photo-Neutron Production in the Sphere. The y-n cross-section of many of the
sphere materials is finite at the y-ray energies involved. Some of the neutrons pro- duced are above the counter thresholds. However, the contribution is less than 0.01 per cent in transmission.
10.7 Spurious Counter Efects
It was desired that the statistical uncertainties in counting should give reliable estimates of the accuracy of the experiments. Therefore, it was necessary to look for obscure and spurious counter effects which might cause about O-1 per cent error in a transmission. Many effects, such as dead-time counting losses, y ray pileup pulses, a pulses, and temperature effects, have been looked for in the spiral counters used. Simple experiments were performed to evaluate some of these effects separately, and sphere transmissions were measured under various conditions to make integral- type studies. All of the differential measurements indicated that there should be no observable effect, but sphere transmissions run at low bias and high-counting rate (at the 5 inch source-to-counter distance) deviated by a few tenths of a percent from those run at lower source strength, higher bias, or lower flux (at IO-inch and 20-inch positions).
The conclusion from the experiments is that transmissions measured at biases which are high relative to noise are not subject to peculiar effects. Those measured with low bias seem to be, and none of these have been used in computing tin.
10.8 Counter Size and Position in Sphere
In Section 6.2 the calculation of counter-size corrections is discussed, and formulas are derived. An effect intimately connected with this is the position of the centre of the counter inside of the sphere. If the counter-size correction is small, then one also expects the counter position to be relatively unimportant, as long as the distance between sphere centre and counter centre is of the order of the counter dimensions.
Transmissions run with the U 23s detector about 1 inch off-centre in an 8 inch outside diameter, 7 inch inside diameter sphere were within 0.2 per cent of the values obtained with the detector centred in the spheres. This is consistent with the computed counter-size corrections of about O-1 per cent in transmission.

Inelastic cross-sections for fission-spectrum neutrons-111 25
10.9 Counter Angular Asymmetry
The method of correcting a measured transmission when the detector is not isotropically efficient is discussed in Section 6.4. As was pointed out there, the correc- tion is most sensitive to the quantity A, which can also be measured most easily. The following two things were done to evaluate this factor:
(1) Each detector was irradiated in a l*Cinch-wide, well-collimated, fast neutron beam in two positions. The first position was with the axis of the spiral parallel to the beam, and the second position was with this axis perpendicular to the beam, the centre of the detector remaining at a fixed point. The ratio of the two sets of counts is the A of Section 6.4. A rough measurement of the angle over which A was constant indicated that it was a few degrees. The smallest value of A, that for the U238 counter, was 0.950 & O-004; A for the Np237 counter was 0.976 I_t 0.010; and A for the aluminium foils was made 1.00 f 0.01 by proper cutting of the foils.
(2) The second evaluation of A for the U 238 detector was made by running sphere transmissions with the axis of the counter both parallel and perpendicular to the normal to the fission source plate. For two different spheres, one lead and the other iron, analysed as discussed in Section 6.4, the values of A were 0.952 f 0.01 and 0.966 f 0.01. These agree with the directly measured A of O-950 f O-004.
REFERENCES
BETHE H. A. (1952) Los Alamos Scientific Laboratory Report LA-1428. BONNER T. W., FERRELL R. A., and RINEHART M. C. (1952) Phys. Reu. 87,1032, EKLUND and HOLE (1943) Arkiv Mat., Astron. Fysik 29A, No. 26, 1. HILL DAVID L. (1952) Phys. Rev. 87,1034; WATT B. E. (1952) Phys. Rev. fJ7,1037. JURNEY E. T. (1951) Los Alamos Scientific Laboratory Report LA-1339. JURNEY E. T. and ZABEL C. W. (1952) Phys. Rev. 86, 594A. MOTZ J. W. (1952) Phys. Rev. 86,753. NERESON. N. (1952) Phys. Rev. 85, 600.