Embed Size (px)
Citation preview

Inequality in Elmbridge Exploring the Surrey borough’s hidden challenges

New Economics Foundation (NEF) is an independent think-and-do tank that inspires and demonstrates real economic wellbeing.
We aim to improve quality of life by promoting innovative solutions that challenge mainstream thinking on economic, environmental and social issues. We work in partnership and put people and the planet first.

Contents
Foreword 2
Summary 3
Introduction 5
1. Hidden challenges 8
2. The cost of living in Elmbridge 16
3. Experiences of low-income residents 20
4. Experiences of middle-income residents 28
5. Experiences of high-income residents 31
6. Social impacts of inequality 34
7. Perceptions of inequality 37
Conclusion 39
Walton Charity: How we will respond 40
Appendix A 44
Acknowledgements 45
End notes 46

2 Inequality in Elmbridge
Foreword
Walton Charity is an independent charity, whose principal objective is to help and support those who live in the area and are in need. We are committed to identifying local needs and seeking innovative ways to address these. This is the first time that we have commissioned such extensive research and our intention is to set out an agenda both for our own response and actions and also for engaging with local partners to achieve more by working together.
Walton Charity has a stated aim of increasing support to other charities and community organisations that are able to deliver a wide range of responsive services. We very much hope that this report is shared widely, not as a dust-gathering document, rather something to generate action and partnerships to ensure that Elmbridge is a better place to live for everyone.
Rob DouglasChairman, Grants Committee – Walton Charity
Elmbridge is a pleasant place to live for many and whilst the UK economy is recovering after the 2008 crash, this has not translated into reality for many people living in the borough. The work of Walton Charity and many local organisations is to tackle a range of needs including poverty, debt, lack of affordable housing, poor health, food and fuel poverty, disability, domestic abuse, transport challenges and social isolation. These issues are all too often masked by the average wealth and prosperity of the local area. Those struggling are not all living on benefits – but include those who are in low paid or unstable employment and, due to the high cost of living in the area, those with incomes that would be relatively comfortable elsewhere.
Whilst the focus of this report is on inequality of housing, pay and health, this is not to say that our work is limited to these areas. Walton Charity is committed to working in partnership to address a wide range of needs and not just those highlighted in this report. We are keenly aware that we cannot change the lives of everyone locally and that we are setting out ambitious plans. However, we hope that by setting out our goals, we can encourage more partnerships where we can be a catalyst for change.
Jackie LodgeChief Executive – Walton Charity

3 Inequality in Elmbridge
Summary
Elmbridge is a pleasant place to live for many, but it also has its hidden challenges. This report focuses on the challenge of inequality, which appears more significant in Elmbridge than in the UK as a whole, and affects everyone in the borough. Despite such challenges, local people and organisations can make a difference by working together to ensure that Elmbridge is a better place to live for everyone.
This report is concerned with economic inequality and its consequences in Elmbridge. Through interviews with residents as well as a statistical analysis of key trends, this report explores:
y The extent of inequalities in pay, housing and health.
y The challenges faced by residents in Elmbridge, be they on a high, middle or low income.
Elmbridge is seen by its residents as a pleasant place to live but the borough has a number of hidden challenges. It is an unequal borough, with a much wider pay gap between those in the top and bottom 20% of earnings than nationwide. Inequalities can also be seen in housing, where Elmbridge is host to some of the most expensive properties in the country and high house prices mean that home ownership is out of reach for many. The gap in life expectancy between the least and most deprived stands at around six years. As has been demonstrated elsewhere, inequality affects everyone – across the income spectrum – but in different ways.1
Elmbridge is an expensive borough and those on low incomes struggle to meet everyday costs. They feel looked down on and cut off from certain places. They find it hard to access stable, reasonably paid employment. Due to inadequate public transport and being unable to afford to run a car, many lack mobility. Several feel a lack of control and involvement over the decisions that affect their lives and their communities.
Proportionally, Elmbridge has fewer middle-income people than elsewhere in the UK. People in this income group are well aware of the promotion of a certain ‘Surrey lifestyle’ but do not earn enough to achieve this without financial strain. They often feel worried by extensive financial commitments and experience a sense of insecurity about their future employment. While those on high incomes are not immune to the social and financial pressures experienced by middle-income residents, they are less likely to feel financially squeezed and spend more time outside the borough.

4 Diversity and Integration 4 Inequality in Elmbridge
Inequality is affecting Elmbridge as a whole. This may lead to a decline in community spirit and mixing between social groups. Inequalities in income and life experience are large enough to cause some to express feelings of suspicion and alienation. Elmbridge residents recognise the extent of inequality in the borough and think that such inequality is unfair, yet hard to change.
There are already many examples of local groups working together to alleviate the challenges of living in Elmbridge, but more could be done. Based on our conversations with Elmbridge residents, as well as our workshop with members of the local statutory, voluntary, and community sectors, Walton Charity intends to: address inequality, work in partnership with others, encourage and support others to work together, and champion positive change for local people.

5 Inequality in Elmbridge
Introduction
Elmbridge is a place of wealth, but also of inequality. This report draws on quantitative and qualitative research examining the extent, forms and consequences of inequality in the borough. We spoke to a diverse range of people who live and work in Elmbridge, as well as professionals from the statutory, voluntary and community sectors.
Elmbridge is a borough in Surrey that is home to 130,875 people. Twenty-six per cent of the borough is aged 0-19, fifty-eight per cent is 20-64, and sixteen per cent is 65 and over.2 Fifty-four per cent of the working population commutes to London for work.3 It is known to be a wealthy borough in one of the wealthiest counties in Britain, with residents including many international sport stars and business leaders from tennis player Andy Murray to Gavin Patterson, Chief Executive of BT.
Elmbridge is seen as a pleasant place to live, particularly in terms of green and outdoor space, the quality of local schools and the positive reputation of Surrey as a county. The borough has placed first in Halifax’s Quality of Life Survey four times, with a second place in 2014.4 Elmbridge, however, also has its hidden challenges. Economic life, for instance, is highly unequal with a significant gap between the highest and lowest income groups.
This report looks at the extent and forms of inequality in the borough and explores its effects on residents. We find that inequality is affecting everyone in Elmbridge, with those interviewed expressing their perceptions of people being less likely to mix with their neighbours and of a declining community spirit. Those on a low income struggle to meet everyday costs, saying they feel looked down on and cut off from certain places. Those interviewed on a middle-income identify pressures to consume status goods, as well as a sense of insecurity and worry over financial commitments.
Elmbridge is already a great place to live for many, but those with a stake in the borough could increasingly work together to ensure that it works for everyone. There are many examples of groups working together to address some of the hidden challenges of living in Elmbridge - including initiatives such as Cobham Transition Town (including the Chatter Bus), Winter Shelter Project, Elmbridge Community Fund and Streets Apart (Box A) - but more can be done.

6 Inequality in Elmbridge
Research methods
This report is the culmination of a period of quantitative and qualitative research. For the quantitative element, we analysed a variety of national and local statistics to review the social, economic, and health-related characteristics of the borough. This enabled us to compare the local community of Elmbridge with county and national averages and to assess the impact of inequality on the area.
For the qualitative research we first held a participatory workshop with 22 representatives from the statutory, voluntary and community sector (see acknowledgements at the back of this document for a list of participating organisations), discussing the nature of poverty and inequality in the area, existing activities aimed at addressing these challenges and what more could be done to make a difference locally.
Box A. Examples of partnership projects
Chatterbus Cobham: Formally launched in March 2015, Cobham Community CIC is a group of local people who formed and now manage this new community bus service linking Cobham, Weybridge, and surrounding villages. Many residents in Cobham and the surrounding area have access to their own transport. However, a significant minority does not. There are also many car owners who need a cheap, eco-friendly alternative for local journeys. Chatterbus was set up to provide a reliable bus service to help everyone, young and old, to get around more easily.
Winter Shelter: In winter 2014, having previously identified the need for overnight accommodation for homeless people, local partnership working led to the successful opening of a Winter Shelter in Elmbridge. Nineteen homeless people were referred to the shelter in 2014, whilst in 2015 a tri-borough partnership (including Runnymede and Spelthorne) saw 28 homeless people offered shelter locally. This was achieved by partnership working between local statutory, voluntary, and faith-based groups to meet an urgent local need.
Elmbridge Community Fund: Set up in 2014, this is one of a network of local community funds set up by Surrey Community Foundation (itself part of a national network of 48 Community Foundations in the UK). It aims to support disadvantaged individuals and communities in Elmbridge via the encouragement of local philanthropic giving, which is used to create a permanent endowment fund, from which grants are then awarded.
Streets Apart: Published in 2014, having been commissioned by Surrey County Council and Walton Charity, with the support of Elmbridge Borough Council, Streets Apart aims to be the start of continuing work to find innovative approaches to support vulnerable young people and their families in Elmbridge. It looks specifically at the impact of social exclusion and wider inequalities on young people in Elmbridge and considers what could be done differently to improve conditions for the most disadvantaged.
7 Inequality in Elmbridge
Next we interviewed 11 residents in depth, asking how they came to live in Elmbridge, where they go and what they do on a regular basis, what challenges and opportunities life in the borough offers and their perceptions of inequality and its causes. We deliberately included residents from different parts of the income spectrum, speaking to five residents with a low household income, three residents on a middle income, and three residents on a high income.
It is important to note that the research was conducted before the change from the Coalition government to the Conservative government in 2015 and the changes to the social security system that followed. The effects of such changes on the topics covered in this report are uncertain.
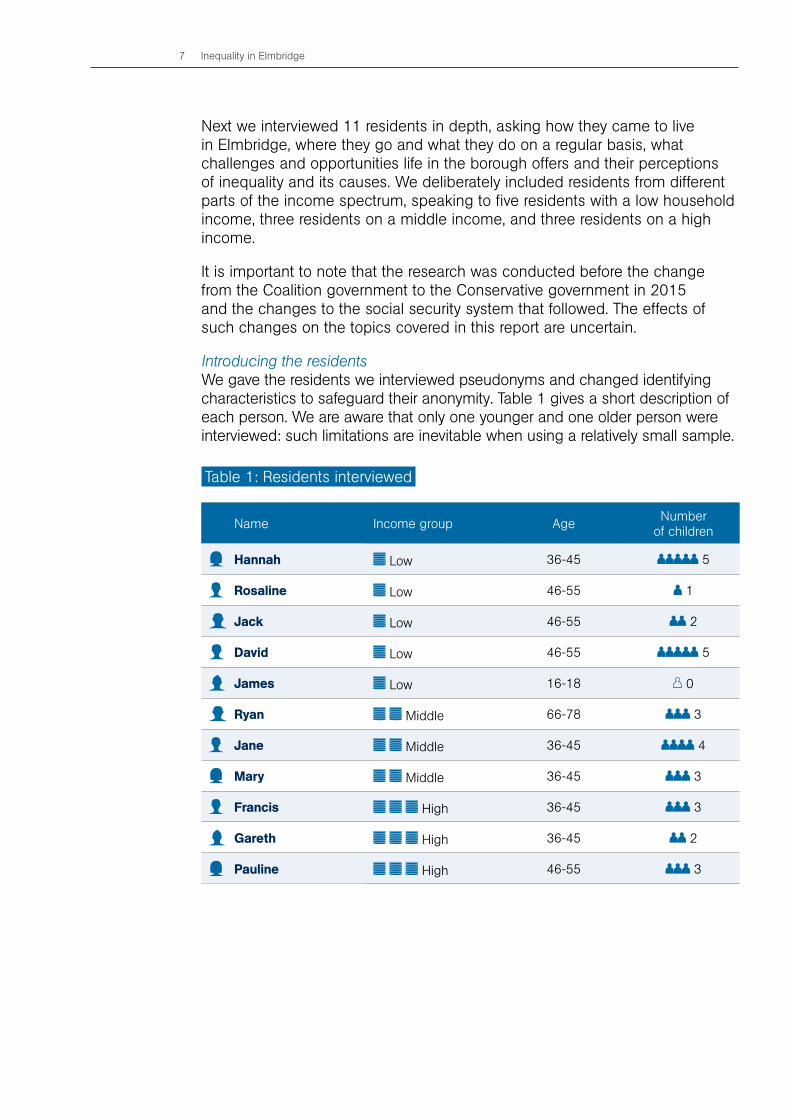
Introducing the residentsWe gave the residents we interviewed pseudonyms and changed identifying characteristics to safeguard their anonymity. Table 1 gives a short description of each person. We are aware that only one younger and one older person were interviewed: such limitations are inevitable when using a relatively small sample.
Table 1: Residents interviewed
Name Income group Age Number of children
Hannah Low 36-45 5
Rosaline Low 46-55 1
Jack Low 46-55 2
David Low 46-55 5
James Low 16-18 0
Ryan Middle 66-78 3
Jane Middle 36-45 4
Mary Middle 36-45 3
Francis High 36-45 3
Gareth High 36-45 2
Pauline High 46-55 3

8 Inequality in Elmbridge
Hidden challenges
In this section, we detail the extent and forms of the challenge of inequality, focusing on earnings, wealth and health.
This report is focused on the problem of economic inequality and the social consequencies of this. We recognise that there are a number of issues - such as domestic abuse, the impact of disability, caring, ethnic background, substance misuse and mental health, for instance - which all have a direct bearing on people’s income and experience of life (Box B). While these issues have not been directly addressed by this research, their impact is recognised.
Pay inequality
Graph 1 shows the distribution of earnings per annum in Elmbridge and the UK as a whole at the 20th, 40th, 60th and 80th percentiles. Someone with earnings at the 20th percentile, for instance, would be in the bottom 20% of earners, whereas someone in the 80th percentile, would be in the top 20%.
1.
Box B. Additional issues that impact on inequality
Domestic abuse: The incidence of domestic abuse may be higher than expected in Surrey as a whole and cuts across all income groups.5 In May 2015, Elmbridge had the fourth highest rate of incidence of reported domestic abuse in the county.6 To give an idea of scale, from January 2014 to May 2015, an average of 136 cases were reported to the Police each month. This means that there are at least between 4 and 5 incidents of domestic violence each day in the borough and, most likely, other incidences which go unreported.7
Caring: Approximately 6,600 people of working age in Elmbridge are carers, out of a total of 12,000 people who provide unpaid care for family members or others in the borough.8
Unemployment: Elmbridge has lower rates of unemployment than the UK as a whole. Compared to the national average of 9.4%, 4.1% of people aged 16-64 years claim out-of-work benefits. Many of those who claim out-of-work benefits do so as a result of disability, impairment, or due to caring responsibilities. Out of approximately 3,310 people claiming this support, 68.9% have impairment and 15.7% are carers. 9
Ethnicity: Of the children and young people in Elmbridge, 8.6% live in poverty, which is lower than the county average (9.7%) and the national average (19.2%).10 Most of the children and young people in poverty in Elmbridge are white British; however, the likelihood of being in poverty is higher for those from Gypsy, Roma, Black African, Black Caribbean, and Pakistani groups aged 0-19.11
Mental health: Elmbridge is estimated to have 12,400 18-64 year-olds with common mental health disorders; 2,500 of those aged over 65 are estimated to have depression.12

9 Inequality in Elmbridge
Graph 1: Distribution of full-time gross annual earnings in the UK and Elmbridge
Source: Annual Survey of Hours and Earnings13
Graph 1 shows that the earnings distribution in Elmbridge is much steeper than the UK, which means that the gap between the highest and lowest earners is greater. Elmbridge residents in the bottom fifth of the local pay distribution take home £35,121 per annum less than those in the top fifth.14
This pay gap is £11,423 wider than the UK-wide equivalent, which currently stands at £23,698 (graph 2).
Graph 2: Gap between the top and bottom 20% of full-time gross annual earnings in the UK and Elmbridge
Source: Annual Survey of Hours and Earnings15
Graph 3 shows that, in keeping higher numbers of high-income earners, Elmbridge has higher proportions of managers, directors, and senior officials (16% compared to 10.1%); professionals (28.5% compared to 19.2%); and associate professional and technical occupations (18.3% compared to 13.9%) than the UK as a whole.
£50,000
£40,000
£30,000
£20,000
£10,000
0 20th percentile 40th percentile 60th percentile 80th percentile
Elmbridge UKKey:
£60,000
Elmbridge UK
£40,000
£35,000
£30,000
£25,000
£20,000
£15,000
£10,000
£5,000
£0
£35,121
£23,698

10 Inequality in Elmbridge
Graph 3: Employment by occupation
Source: Annual Population Survey16
High earnersAt a national level, the top 20% of earners make at least £41,460 before tax annually. By comparison, in Elmbridge 45.4% of earners earn this amount and more. There is, therefore, a much higher proportion of high earners in Elmbridge than in the UK as a whole.
This pattern can also be seen further up the income distribution scale. At a national level, the top 10% of earners make at least £53,777 before tax annually, while a conservative estimate suggests that at least 20% of Elmbridge residents earn this amount and more.
In the UK, once you move beyond the top 10%, incomes begin to increase at a rapid rate, with those in the top 1% having substantially higher incomes than the rest of the upper decile. The World Top Incomes Database 2011, for instance, estimates that the UK’s top 1% earn an income of £248,480 on average.17 The top 0.1% average income for the same year is estimated at £922,433. Pay for some will, of course, be higher, even during times of economic uncertainty. The average FTSE 100 Chief Executive was paid £4.7 million in 2014, up £600,000 from £4.1 million in 2013.18 A number of FTSE 100 Chief Executives are known to live in Elmbridge, including the CEOs of the BT Group and ITV.
For reasons of anonymity, official data on these top-level earners are not available at a local level. However, analysis of income tax statistics by the accountancy firm UHY Hacker Young notes that residents of Elmbridge paid the highest amount of income tax in the UK in 2012, at £1.18 billion.19 This suggests that Elmbridge is host to some extremely high earners.
30%
25%
20%
15%
10%
5%
0%
Manag
ers,
direc
tors
and
senio
r
Asso
ciate
profe
ssion
al
and
techn
ical
Adm
inistr
ative
and
secre
tarial
Caring
, leisu
re an
d
othe
r ser
vice
Sales
and
custo
mer
servi
ce
Proc
ess,
plant
and
mac
hine
Elem
entar
y
Skille
d tra
des
Profe
ssion
al
Key: Elmbridge Surrey South East UK

11 Inequality in Elmbridge
Middle and low earnersWhile there is a high proportion of high earners in Elmbridge, we know that there are fewer middle (20-80th percentile nationally) and low (0-20th percentile nationally) earners.
UK-wide, the upper middle 20% of earners (60-80th percentile) earn between £30,372 and £41,460 before tax per annum. Only 15.8% have earnings within this bracket in Elmbridge.
The middle 20% (40-60th percentile) earn between £23,649 and £30,792 before tax per annum at the national level. In Elmbridge, 15.2% have earnings within this bracket.
Nationally, the lower middle 20% of earners (40-60th percentile) earn between £17,762 and £23,649 per annum and the lowest 20% of earners earn below £17,762 before tax per annum. There is no publically available data on how many people in Elmbridge earn within each of these brackets. However, we do know that 23.6% of earners in Elmbridge have earnings between these two brackets combined. Moreover, on a Surrey-wide basis, 13.7% of earners have earnings within the lower middle category and 10.6% of earners have earnings in the low earnings category. It can be inferred, therefore, that Elmbridge has lower proportions of both lower middle and low earners than the UK as a whole.
Reports on Surrey demonstrate that there is hidden poverty in the county, despite its reputation for affluence.20 This is also true of Elmbridge. Earning less than £17,762 puts people at risk of falling below the poverty line.21 Indeed, official statistics show that 8.7% of children under 16 in Elmbridge are living in poverty with higher levels in particular wards such as Walton North (21.3%) and Walton Ambleside (15.5%). Although rates are broadly lower than the England average of 20.6%, the statistics point to 2,300 local children who are in poverty.22
Having a houshold income below the poverty threshold means that families often have to go without items commonly viewed as essential to a socially acceptable, minimum standard of living. In 2013, the Poverty and Social Exclusion Project found that out of the UK population as a whole:
y 5% of children aged over 5 have no place to study.
y 9% of children go without one or more items of basic clothing, such as a warm winter coat or properly fitting shoes.
y 6% of children cannot afford a hobby or leisure activity.
y 8% of children cannot go on school trips once a term.
y 26% of children miss out on a holiday away from home for a week a year.23
Poverty is a function not only of earnings but of the living costs and household needs, which in turn depend on family size. This is explored in the next section on the cost of living.

12 Inequality in Elmbridge
Growing inequality
Although there is no local data to examine whether inequality in Elmbridge has intensified over time, there is good reason to believe that this is the case given the ever widening gap between top and bottom incomes in the UK as a whole over the last decade. This can be seen in Graph 4, which compares the income distribution between 1993 and 2011. The graph shows how the incomes of the top 0.1%, 0.5%, and 1% have grown exponentially over this period while the majority of incomes (in the 0-90% bracket) have remained relatively stagnant, increasing inequality nationwide.
Graph 4: Average incomes for selected groups in the UK
Source: BBC The Wealth Gap Analysis, updated with the latest data from the World Top Incomes Database.
Wealth inequality
It is important to make a distinction between pay inequality on the one hand and wealth inequality on the other. Pay inequality describes the difference between people’s payment from employment, while wealth inequality refers to the unequal distribution of assets, such as property.
Elmbridge offers some of the most lucrative and sought-after housing in the country. Analysis by the property website Zoopla, for instance, puts the average property price in St George’s Hill – a particularly affluent part of Elmbridge – to be as high as £2,800,929, and this average figure is likely to be pulled down by some lower value properties in the area with house prices vastly exceeding this figure.24 Asking prices can be as high as £12.8 million.
Elmbridge is known for such high cost, luxury housing. High house prices mean that home ownership is out of reach for many residents. Median house prices have grown to over 14 times that of median earnings, which is far higher than both Surrey and England as a whole.25
Top 0.1%
Income groups
Top 0.5%
Top 1%
Top 0% - 90%
£460,050
£214,392
£154,243
£10,200 £12,993
£248,480
£365,130
1993£922,433
2011

13 Inequality in Elmbridge
Graph 5. Ratio of median house prices to median earnings (1997-2013) in Elmbridge, Surrey and England
Source: Annual Survey of Hours and Earnings & HM Land Registry.26
Home ownership is already rare for people under 34 years of age in Elmbridge. It is concentrated among people aged 35–64 and those occupying senior positions in their careers.27 With house prices rising faster than pay (Graph 5), it is likely that young people in Elmbridge will struggle to buy homes without the help of their parents.28 This is underlined by analysis from the National Housing Federation (NHF), which shows that Elmbridge is the most difficult place in England, outside of London, to get a foot on the property ladder, with the lower quartile house price being £285,000 or 21.5 times the average salary (£13,255) of a first-time buyer.29
These figures reflect what has been become known, on a UK-wide basis, as ‘generation rent’. With rising house prices and a shortage of affordable homes, the proportion of under 40s living in private rented properties has more than doubled since 2001. UK-wide, by 2025, the majority of 20–39-year-olds are predicted to be living in privately rented properties. In Elmbridge, between 2001 and 2011, as house prices have risen higher and higher relative to wages, the proportion of under-35-year-old owner occupiers dropped from 62% to 46% while the portion of those renting privately rose from 27% to 42%.30
Health inequality
The term health inequality refers to ‘gaps in the quality of health of different groups of people based on differences in social, economic and environmental conditions’.31
In 2007, Alan Johnson, then Secretary of State for Health, asked Professor Michael Marmot to conduct an independent review into the causes of health inequalities in England and strategies for reducing them. The Marmot Review notes that inequalities in health reflect the conditions in which people are ‘born, grow, live, work and age’ – the social determinants of health – which are in turn influenced by a number of fundamental drivers: ‘inequities in power, money and resources’.32 Research into health inequalities in Elmbridge
Elmbridge SurreyKey: UK
16
14
12
10
8
6
4
2
0
Rat
io
1997 1999 2001 2003 2005 2007 2009 2011 2013

14 Inequality in Elmbridge
Elmbridge
66.4
7.7
Surrey South East
9
8
7
6
5
4
3
2
1
0
Year
s
reflects this finding: inequalities in life expectancy between the most and least deprived in the borough range from 6 years for males and 2.4 years for females (Graphs 6 and 7).
Graph 6: Life expectancy gap between least and most deprived (male)
Graph 7: Life expectancy gap between least and most deprived (female)
Source: Public Health England33
While these figures compare favourably to health inequalities in Surrey and the South East in general, such a gap should cause concern. Everyone has a right to health, regardless of their backgound. As Michael Marmot notes:
Inequalities are a matter of life and death, of health and sickness, of well-being and misery. The fact that in England today people in different social circumstances experience avoidable differences in health, well-being and length of life is, quite simply, unfair.34
The diseases contributing most to the life expectancy gap between the most and the least deprived in Elmbridge are repiratory disease among men and cancer among women.35 These disease groups may be driven by certain behaviours. Smoking is more prevalent among routine and manual works as well as Gypsy, Roma, and Travellers in Elmbridge. Excess weight is correlated with deprivation and there are clear differences in the prevalence of physical inactivity according to income, gender, age, ethnicity and disability.36 However, inequalities of health cannot be attributed solely to differences in behaviour.
Elmbridge
66.4
7.7
Surrey South East
9
8
7
6
5
4
3
2
1
0
Year
s

15 Inequality in Elmbridge
First, behaviours are themselves influenced by social, economic and environmental factors. Second, although behaviours play a part, they are not thought to account for the whole picture. As the Marmot Review makes clear:
Health inequalities do not arise by chance, and they cannot be attributed simply to genetic makeup, ‘bad’, unhealthy behaviour, or difficulties in access to medical care, important as those factors may be. Social and economic differences in health status reflect, and are caused by, social and economic inequalities in society.37
As well as behavioural factors, material circumstances – whether you live in a decent, well-insulated house and have enough money to live healthily – and psychosocial factors – whether you have a sense of control and autonmy over your life and adequate support networks – interact in complex ways to affect the distribution of health nationwide.38 The NHS Clinical Commissioning Group covering the West of Elmbridge has made tackling health inequalities for communities living in deprivation one of their priorities.
While inequalities in life expectancy between the least and the most deprived in Elmbridge stand around six years, health inequalities between wards appear wider. Gaps between wards are as wide as 10 years for men (between Hinchley Wood and Weybridge North) and 12.7 years for women (between Cobham Fairmile and Weybridge North).39 This may be explained by a number of factors which include the existence of nursing and residential homes which attract older people into an area and the underlying age structure of the local population.40,41 The King’s Fund has shown that some factors are consistently important in explaining such differences in life expectancy among older people, most notably unemployment, deprivation and the impact of lifestyle.42

16 Inequality in Elmbridge
The cost of living in Elmbridge
Childcare and housing all cost more in Elmbridge than many other places in the UK, making it harder for those on median and low incomes to meet everyday needs.
Looking at different types of household – single adult, single parent, and couple with children – we demonstrate the gap between actual earnings in the area among people on median and low incomes and what is needed to achieve a standard of living people that is deemed socially acceptable.
Reaching the Minimum Income Standard in Elmbridge
Calculated by the Centre for Research in Social Policy (CRSP) at the University of Loughborough, the Minimum Income Standard shows how much money people need to earn to enable them to buy the things that members of the public think everyone in the UK should be able to afford.
To make this calculation, the CRSP asks a large number of people from different backgrounds in discussion groups about everything that a household would have to be able to afford to reach a socially acceptable standard of living, defined as not just ‘food, clothes and shelter’ but ‘having what you need in order to have the opportunities and choices necessary to participate in society’.43 Based on these discussions detailed lists of necessary goods and services are drawn up, priced, and added together.
Using data specific to Elmbridge on local housing and childcare costs, we have examined what you need to earn in order to meet the Minimum Income Standard in the borough for three household types: a single adult, a single parent and a couple with two children.
y In order to reach the Minimum Income Standard in Elmbridge, a single adult would have to be earning £21,089 before tax per annum, or £11.58 per hour assuming a 35-hour working week. This is higher than the earnings a single adult would need to reach the Minimum Income Standard nationally, which stands at £17,102.
y In order to reach the Minimum Income Standard in Elmbridge, a single parent with one child would have to be earning £32,414 or £41 per hour assuming a 15-hour working week. This is higher than the earnings a single parent would need to reach the Minimum Income Standard nationally, which stands at £26,045. It is worth noting here that the Minimum Income Standard does not account for child maintenance payments or support, financial or otherwise, from family members.
2.

17 Inequality in Elmbridge
Graph 8 a-c: Actual earnings, Minimum Income Standard and minimum wage - single adult, single parent and a couple with two children
20thPercentile
Graph 9: actual earnings, minimum income standard and minimum - single adult
40thPercentile
60thPercentile
80thPercentile
£50,000
£40,000
£30,000
£20,000
£10,000
0
£60,000 a. Single adult
Graph 10: Actual earnings, Minimum Income Standard and minimum wage - single parent
20thPercentile
40thPercentile
60thPercentile
80thPercentile
£35,000
£30,000
£25,000
£20,000
£15,000
£10,000
£5,000
£0
b. Single parent
Graph 11: Actual earnings, minimum income standard and minimum - couple, two children
c. Couple, two children
20thPercentile
40thPercentile
60thPercentile
80thPercentile
£50,000
£40,000
£30,000
£20,000
£10,000
0
£60,000
Actual earnings Minimum Income StandardKey: Minimum wage
Source: Minimum Income Standard and Annual Survey of Hours and Earnings
Assumptions:
Single adult: (1) A one-bedroom property rented at affordable rent levels; and (2) 35-hour working week.
Single parent with one child: (1) A two-bedroom property rented at affordable rent levels; (2) 25 hours of childcare a week at the average rate for the South East; (3) child aged 3-4; (4) childcare subsidy paid at £4.15 for 15 hours a week; and (5) 15-hour working week. (6) Minimum Income Standard does not account for child maintenance payments or support, financial or otherwise, from family members.
Couple with two children: (1) A three-bedroom property at affordable rent levels; (2) one primary-school-aged child and one secondary-school-aged child; and (3) partner works 15 hours a week at median earnings.
18 Inequality in Elmbridge
y In order to reach the Minimum Income Standard in Elmbridge, the main earner of a household with two parents and two children would have to be earning £30,129 before tax per annum. This is higher than the earnings needed to reach the Minimum Income Standard nationwide, which stands at £19,757.
These figures are compared in graphs 8 a-c to what residents actually earn in Elmbridge at the 20th, 40th, 60th, and 80th percentiles as well as the current national minimum wage. Appendix A lists the breakdown of weekly outgoings and weekly income for each of the household types.
Being a single adult on a low income
Living as a single adult in Elmbridge can be a challenge. The Minimum Income Standard shows how those with earnings in the lowest 20% locally will struggle to meet a minimum, socially acceptable standard of living. Part of the reason for this is the high cost of housing in the borough.
As shown earlier in this report, house prices in Elmbridge are high; with the median house price over 14 times that of median earnings. Rental prices are also extremely high in the borough: a one-bedroom property is on average £860 per month, which is £241 more expensive to rent than the South East average.44
Research from Savills has recently listed Elmbridge as having the highest housing costs – including mortgage costs and renting costs – outside of London.45 Elmbridge Borough Council has noted the difficulty of housing costs in its latest housing strategy, where it is acknowledged that:
…affordability is getting worse and the gap between housing costs and income makes it challenging for many younger households and would-be first-time buyers to afford to buy or rent locally.46
Having children
The Minimum Income Standard also shows how difficult it can be to reach a social acceptable standard of living with children in Elmbridge. As well as having to deal with high house prices, those with children have to cope with extremely high costs for childcare. Childcare costs in the South East are the second highest in the UK, as Table 2 from the Family and Childcare Trust shows.
All 3-4-year-olds in England are entitled to 15 hours of free childcare for 38 weeks of the year and the government plans on doubling the number of hours to 30 per week. However, the rate at which the childcare is offered is lower than the average cost of childcare in the South East, meaning that the extra costs often have to be paid for out of parents’ pockets.

19 Inequality in Elmbridge
Even when 15 hours of free childcare is factored in to the Minimum Income Standard calculations, the high cost of childcare means that many single parents are unable to reach a socially acceptable standard of living. For single parents, work will not pay for a socially acceptable standard of living in the borough. Even couples will struggle to meet the Minimum Income Standard in Elmbridge if they are in the lower 40% of earners. Those on a minimum wage will struggle to meet the Minimum Income Standard whatever their family demographic – single adult, single parent or a couple with children.
Table 2. Average childcare costs by region.
Region/ Nation
Nursery25 hours(under 2)
Nursery25 hours(2 and over)
Child-minder
25 hours(under 2)
Child-minder
25 hours(2 and over)
After-schoolclub 15hours
Child-minderafter-
schoolpick up
East of England £110.93 £107.43 £120.88 £120.43 £49.46 £57.87
East Midlands £118.82 £107.74 £92.20 £90.54 £48.20 £72.13
London £152.06 £140.64 £146.31 £144.27 £53.65 £89.94
North East £110.49 £107.08 £96.03 £95.48 £49.67 £62.01
North West £106.14 £102.27 £91.55 £89.94 £43.03 £52.11
South East £133.27 £128.17 £114.21 £112.67 £52.03 £65.63
South West £114.72 £108.87 £101.50 £101.10 £49.16 £60.53
West Midlands £112.77 £110.20 £94.68 £94.08 £43.18 £62.22
Yorkshire and Humberside
£96.47 £92.37 £90.12 £88.83 £42.84 £64.14
England regional average
£117.30 £111.64 £105.28 £104.15 £47.91 £65.18
Scotland average £110.01 £99.93 £100.37 £99.30 £49.03 £64.57
Wales average £104.32 £103.44 £96.81 £96.81 £49.74 £59.97
Britain average of regionsand nations
£115.45 £109.83 £104.06 £103.04 £48.18 £64.65
Source: Childcare Cost Survey 2015. 47

20 Inequality in Elmbridge
Experiences of low-income residents
The low-income residents we spoke to struggle to meet everyday costs. They feel looked down on and cut off from certain places in the borough and find it hard to access reasonably paid, stable employment. Many suffer from a lack of mobility and feel a lack of control over their lives.
Struggling to meet everyday costsMost low-income residents point to a growing gap between wages and costs. They are experiencing declining real incomes, high housing costs, high energy costs, and the need to travel outside the borough to find, for example, affordable clothes shops. One resident who works for a betting office and has done for the last 20 years said quite bluntly: ‘You don’t get pay rises anymore.’ Another resident relies on her husband’s income because she cares for their disabled son. She is experiencing declining real household wages:
You’re on one income and the money hasn’t gone up for nearly four or five years, but the bills are going up and up. – Rosaline
The effect of this, as another resident describes, is a constant struggle to meet everyday costs of living:
It’s a struggle. You’ve never enough money to survive. You’ve just barely got enough money to get through.– Jack
Barely having enough, or having to juggle debts and bills, is a common experience for those with low incomes. Hannah is behind on gas, water, electricity, and Internet bills. She is facing having her phone and internet disconnected and has been considering using a credit card to cover the costs of clothes and running a car. She recently had debt charges of over a £100 because she did not have sufficient funds in her account to meet direct debit payments she set up for gas and electric. Hannah feels caught in a downward spiral because her income is never enough to cover such charges on top of her normal outgoings.
A £20 bank charge for declining a direct debit, then whoever’s direct debit was bounced charges you a £20 admin fee. It just mounts up and you can’t get out of it. It spirals and spirals. – Hannah
In 2013/2014, Citizens Advice Elmbridge prevented 180 families from losing their homes; they managed £3.3 million of debt and wrote off a further £550,000.48 During 2014/2015, 227 grants were awarded in support of 153 local households by Walton Charity. In these households, 103 individuals admitted to either debt or rent arrears totalling £982,018.49 During 2014/2015, demand in Elmbridge for support via the Surrey Local Assistance Scheme was the highest in Surrey.50
3.

21 Inequality in Elmbridge
Participants pointed out that high rents make it difficult for people on low incomes, including young people who are just starting out in their careers and do not have financial help from their parents. Moreover, proposals to remove access to Housing Benefit for people aged between 18 and 21 may make the housing situation even more difficult for young people on a low income.
I can’t think that many young people are going to be able to live in Elmbridge unless they work in the City or in Financial Services… Unless they have parental help or live with their parents. – Ryan
As can be seen from the Minimum Income Standard described in the previous section, housing costs in Elmbridge are a particular challenge. Average monthly rents in the borough are higher than averages for Surrey, the South East and England.
Table 3. Average monthly private sector rents 2013/2014.
Size Elmbridge Surrey South East England
1 bedroom £860 £783 £619 £606
2 bedrooms £1,164 £1,040 £796 £677
3 bedrooms £1,500 £1,296 £969 £771
4 bedrooms+ £3,772 £2,454 £1,710 £1,348
Overall average £1,579 £1,190 £864 £720
Source: Valuation Office Agency 2013/1451
The definition of ‘affordable rent’ changed in January 2012. It now means that homes can be let at up to 80% of market rents and still be considered ‘affordable’ in official records. Table 4 compares average monthly rents for privately rented homes in Elmbridge with rents charged by housing associations in Elmbridge for properties let at social and affordable rent levels.
Table 4. Comparison of average rents (per month) in Elmbridge 2013/2014 by tenure.
Size Private rent Social rent Affordable rent
1 bedroom £860 £426 £603
2 bedrooms £1164 £503 £760
3 bedrooms £1500 £589 £994
4 bedrooms £3772 £653 £1058
Source: Elmbridge Borough Council52

22 Inequality in Elmbridge
This change in the definition of affordable rent is causing problems for people on low incomes:
We are paying £950 a month because it is ‘affordable rent’ apparently. I have tried to do a home swap but nobody wants my house. People see it as £236 a week on Home Swapper and they think it is a misprint. – Hannah
I get housing benefit. – Jack Does that cover all of the housing? No. It covers less than half. – Jack
Hannah and Rosaline are both thinking of leaving Elmbridge due to the cost of housing. Hannah rents at the ‘affordable’ rate, which she does not find affordable. Rosaline owns her home but expects a crunch-point when her husband has to retire from his job. At that point their mortgage (which was interest-only) will become unaffordable.
My husband is older than me so he retires in three years’ time and we have to move because we have to pay back what we owe the bank… We won’t be able to afford to live here on what excess money we have left once we’ve paid back the money. We won’t have enough even for a two-bed flat which is sad. – Rosaline
Childcare is also expensive, costing an average of £133 a week for under 2s in nursery for 25 hours, and £128 a week for 2-5-year-olds.53 One middle-income resident said it cost them between £1,000 and £1,300 a month for a combination of nursery and child-minding for two children, one of school age and one 3 years old, with both parents working full-time. For the low-income residents we interviewed, this cost is prohibitive, particularly for those whose children have special educational needs.
If I was to get someone to look after my son who’s got special needs, it’s around £18 an hour. I remember when I was back in work I was only getting £6 an hour so where would I find the other tenner? – Rosaline
I can’t afford to put them into childcare. So what do I do? They can’t stay at home on their own. I don’t really have anybody who would have them on a regular basis. I’d love to get a part-time job, but as I said during school hours that would be fine but outside of that it wouldn’t. – Hannah
Looked down onResidents who have low average earnings or who are on benefits describe feeling inferior in Elmbridge – either being ‘looked down on’ or ignored. They worry that assumptions are made about their children’s behaviour or achievement at school. They find it hard to shake off the idea that expensively dressed residents ‘think they are better than you’, despite wishing that they could be immune to this sense of stigma.
Stigma commonly attaches to children who come from estates within Elmbridge. As one middle-income woman with children described:
The perception is that if you live on a council estate, your children will behave worse than if you don’t live on a council estate. Whether it’s

23 Inequality in Elmbridge
accurate or not, that’s the perception and that’s what gives the schools in the area a bad name. – Frances
Hannah, a low-income resident with children, wants to protect her children from stigma by sending them to a Church of England school with a good reputation and renting a new housing association property. Despite struggling with the rent payments, Hannah perseveres because she finds it helps reduce stigma. She described friends of her daughter visiting with their parents:
It is a lovely brand new house. Even they come in and say, ‘oh I love your house’ and I think, ‘oh it’s alright then’. So I feel happy for my children. They are not going to get picked on about where they live. - Hannah
Hannah feels buffered from stigma because other parents assume she owns the home rather than rents it, but she maintains low-level anxiety that her daughter will be looked down on because her family is poorer than others.
Rosaline: I’m an outsider here
Rosaline and her husband moved to Walton in Elmbridge when they were originally re-housed by Surrey Council having been made homeless in Cobham (another part of Elmbridge). They have one son who has special educational needs, whom Rosaline currently home-schools.
Rosaline explains that despite living in the borough for 20 years, she still feels like an outsider, especially when she picked her son up from school when he wasn’t being home schooled:
I mean you stand at the school gate and you just feel like you don’t belong. Because I’m an outsider here. That’s how I feel.
For her, these outsider feelings derive from an inability to display wealth:
If you can’t, you know, display money here, there and everywhere then people don’t want to know you … If you haven’t got money, you’re nothing here.
Rosaline also says that she feels her situation as an unemployed woman caring for her disabled son is misunderstood. When her son has a tantrum due to his sensory needs, she feels that other parents judge this as a parenting problem and look down on her as a result.
It just makes you feel you’re not worth anything and often I would say I just want to get out of this area.
Rosaline used to attend a support group for carers, but due to lack of funding, the group no longer meets.
They’ve stripped away services. Support groups for us as parents, which we need.
A combination of her husband’s stagnant wages – which have not increased in four or five years – and the interest on their mortgage mean that the family may have to move from the borough, whether they want to stay or not.

24 Inequality in Elmbridge
Growing separation
Inequality has been growing in the UK and house prices suggest that this process has been particularly stark in places like Elmbridge. Housing that works for lower-income households are increasingly separate from the rest of the borough which can lead to a sense of exclusion and heightened stigma.
David was born in Hersham, Elmbridge, and has lived there for over 30 years. Growing up in the area, he did not feel much of a sense of stigma related to his working class background. However, this changed over the course of his lifetime and he now struggles with not feeling good enough, as the levels of wealth reached by those in the highest social classes have become more extreme.
I never grew up feeling that somebody was better than me or better off than me, so much as I do now. I didn’t used to think Burwood Park was too good for me to walk through, or that people there were too good for me to talk to. – David
David’s experience shows that Elmbridge has not always been this way. In the 1970s there was not such a large gap in terms of income or social standing. In official measures of income inequality the UK was more equal then, than it is today. Having a higher income did not make you a ‘better person’ or even necessarily ‘better off’, in having a much better standard of living. David feels that this has changed and he is more likely to feel he is of less worth than rich residents.
Difficulty accessing employmentLoss of jobs for traditionally working class groups in Elmbridge has contributed to the stigma now felt by David and others. Two residents in this study are struggling to find jobs – one of them is David, and the other is James who left college at the age of 16 and has been looking for his first job for the last six months. Both highlight the particular lack of skilled manual work.
James has taken small, casual jobs at the local allotment but aspires to work in carpentry for which there are some decent but limited opportunities. David, now in his late 40s, has not been offered a job within the borough in four years. He is experienced in factory work but re-trained in security in the hope of opening up more opportunities. David is saddened by the loss of local jobs and the reality that the only substantial local labour market is London. He describes a change over the last 10 to 20 years:
I remember growing up as a kid here. My dad worked in Hersham. His dad worked in Hersham. Factory work was everywhere, all along the River Mole. But where has it all gone now? Industry is just disappearing. If you don’t work in McDonalds and you’re not a policeman, then you’ve got to be an estate agent. – David

25 Inequality in Elmbridge
Lack of mobilityA related issue is transport. Low-income residents cannot necessarily afford to own cars and find that public transport is unaffordable or impractical, making it harder for them to take advantage of opportunities outside or across the borough, whether in employment, leisure, or culture. This contrasts with the ‘hypermobility’ of wealthier residents who are able to travel abroad frequently and make trips to London for leisure and work.
Residents from low-income and middle-income households say that the bus service does not connect up the borough as usefully as it could, which causes problems.
If you’re going into London or Woking, it’s fine, but if you want to go anywhere else… I tried once. I tried to get a bus with the children from our house to their school. It’s 1.7 miles. The bus is only every half an hour and it cost me £10. – Frances
Getting the bus to some places is really annoying. On Sundays they’re only once every half an hour and they’re a dodgy service already so that’s annoying. I just try not to use the bus to be honest. – James
Public transport, that’s a huge issue, particularly for my lower-income clients. To get from Walton to Molesey can take an hour because you have to go round the houses. The transport here is really rubbish. – Mary
The expense of buses was also highlighted. One resident makes a comparison with the cheaper bus service in London, describing how this makes it harder for him and his children to make the most of amenities in Elmbridge:
The bus services and train fares are more expensive than in London. If you haven’t got a car sometimes it’s a lot harder to get to the places you want to get to. – Jack
Levels of car ownership in Elmbridge are much higher than in England as a whole. 87.3% of Elmbridge households have at least one car or van.54 This compares with 74.2% England-wide. However, 11.8% of households in Elmbridge do not own a car, suggesting that policies should not assume that everyone does. It is also noted that multiple ownership of cars is higher in Elmbridge than nationally.
Table 5. Car ownership in Elmbridge and England
Elmbridge England
No cars or vans in household 11.8% 25.8%
1 car or van in household 42.4% 42.2%
2 cars or vans in household 34.3% 24.7%
3 cars or vans in household 8.5% 5.5%
4 or more cars or vans in household 3.1% 1.9%

26 Inequality in Elmbridge
An inadequate public transport system interferes with residents’ ability to make the most of Elmbridge for themselves and their families. Jack is a low-income resident with two children aged seven and nine. He rides a moped to work in New Malden because it is cheaper than taking public transport. Outside of travel to work, he and his children walk most places. Shops are within walking distance but the leisure centre is not.
I must admit there isn’t a great deal round here unless you’ve got a car. Of course, if you’ve got a car then the Walton area is not so bad – you’ve got leisure centres and stuff. We don’t have a car so it makes it trickier. – Jack
Jack takes his family to the woods for walks because his children enjoy outdoor activities but this is limited through not having a car and finding the public transport expensive and impractical. Comparing his mobility around the borough with someone like Frances, a woman from a middle-income family with a car, there is a clear difference. Frances uses her car to go to a wide range of local sites with her children including the swimming pool, tennis courts, Hampton Court Palace, National Trust properties and gardens, parks, and the multiplex cinema. Another middle-income resident explains that her husband takes their children to a bike park at weekends, but that this is not possible for low-income residents with whom she works in her role on a local council estate.
He will take them off for a couple of hours and they’ll go to Brooklands Park and enjoy some ice cream. But we’re fortunate that we’re mobile and have a car. That’s not the case for everybody. – Jane
A combination of entry fees, unaffordable transport, and possibly also a feeling that lower-income residents are not welcome in places that higher-income residents frequent, mean that families like Jack’s are shut off from such local opportunities for culture and leisure. As the teenage resident we interviewed summarised:
If you’ve got a lot more money, it will be easier for you to do a lot more things. That’s just how it is. – James

27 Inequality in Elmbridge
Lack of controlResidents on a low income expressed said that they felt a lack of control and agency over their lives, with many feeling they had no influence or say over decisions affecting them at both local and national levels. This lack of influence over decision-making led many to conclude that the wrong decisions were being taken.
Rosaline, for instance, cares about education and social care in the borough, but argues that these issues have been side-lined:
I mean they build a massive bridge and they don’t put money into schools, they don’t put it into nursing homes. – Rosaline
David, meanwhile, is passionate about increasing the supply of affordable housing in Elmbridge, but feels unable to do anything about it.
Issues such as empowering people to have more control over their lives and surroundings are outside the scope of this report. However, not only do the principles of democracy justify involving local people in local decisions, local input can help to ensure that services are better suited to local needs.55 There is a considerable body of evidence linking issues of control and empowerment with health. Perceived control over one’s life, for instance, has been found to be related to ‘health, achievement, optimism, persistence, motivation, coping, self-esteem, personal adjustment, and success and failure in a variety of life domains’.56 Community control over local decisions is also thought to be related to health and wellbeing and a body of evidence is beginning to emerge that demonstrates this.57,58

28 Inequality in Elmbridge
4. Experiences of middle-income residents
The middle-income residents we spoke to felt a strong pressure to consume various status goods, a sense of insecurity over their future employment and worry over extensive financial commitments.
Social pressure to consumeThe pressure to show your value and status through what you buy and own, for example, having an impressive wedding and home, the schools children are sent to, the number and type of holidays, the brand of car owned, or having an expensive watch, can be felt by most groups but may be especially poignant for those in middle-income groups. Residents in the middle are well aware of the promotion of a certain ‘Surrey lifestyle’ but do not earn enough to achieve it without financial strain.
I think there’s a lot of ‘I’ve got to keep up with what my boss is doing’ or ‘I’ve got to keep up with somebody’, you know… It’s the competition to be in the right house, in the right spot to get into schools. – Gareth
One middle-income resident describes how struggling to maintain a certain lifestyle quickly ‘becomes your normal’ as you seek to provide the right standard of living for your children according to local standards – including school trips and meals out – and increase the value of your home through extensions and conversions, even if this means re-mortgaging your house and taking on more debt.
Another resident says spending money is part of ‘how you progress your career in an investment bank’ in London, and thus is important for status and success.
The conversation on a Monday morning about what you did at the weekend is quite important. It’s what you did, how much money you spent, where you went and what show you saw. The music, concert or tickets for Wimbledon. – Gareth
All this can put immense pressure on incomes and leave residents in precarious circumstances - financially over-committed - particularly if one member of the family loses their job and has to take a job with a lower salary than they had anticipated.
I remember having a couple of conversations with friends who were having an extension on their house. They felt they needed it to make more room for their children but they’re going to have to really struggle to pay for the mortgage and the extension. During the financial crisis a lot of people had to change jobs and they’ve been made redundant or they’re doing a job they weren’t planning to do which is paying a lower salary. So they’re in difficulty. – Gareth

29 Inequality in Elmbridge
Always being overstretched financially, struggling to keep up with accepted levels of spending and lifestyle and narrowly avoiding dangerous debt, were summed up by one resident as ‘the Surrey Trap’.
InsecurityThe experience of those in the middle is therefore often insecure – spending more than you earn and fearing redundancy. Mary is aware that her husband feels stuck in a job he does not enjoy for the sake of sustaining their family’s outgoings, because it is more secure than other kinds of jobs he could consider. Another interviewee, Gareth, was made redundant after the financial crisis. He found it took over a year to find a new job, during which time he and his family were sustained by his wife’s salary which is relatively secure and enough to cover their mortgage.
Mary’s story: It’s the Surrey Trap
Mary moved to Elmbridge as a young child and has since lived in Walton, East Molesey, and Hersham. She now lives with her husband in the borough and has three children, two of whom live at home, while the other is away at university. Mary works for a charity and her husband, George, works for a firm of surveyors.
Mary talks about the pressure of living up to commonly held assumptions about life in Surrey:
Shopping in Waitrose as opposed Aldi or having a nice ground-floor extension at the back where you’ve got the open-plan kitchen and the bi-fold doors that every other house you go into has. You feel you need to aspire to that, whereas I think if you live in a different environment in a different place you wouldn’t feel like that. I tend to get into that mind-set, wanting a lifestyle – to be able to go out for dinner.
Being on a middle income, Mary’s family would not be expected to struggle elsewhere in the country. In Elmbridge, however, the higher cost of living and social pressure combine to cause financial strain:
I realised that we have a lifestyle and you wouldn’t want to be without it I suppose. It’s always a struggle, but it becomes your normal…I’m always just meeting my financial responsibilities. Just when you think there might be a bit of extra money, something else comes along.
Much of this pressure, Mary says, is driven by a sense of having to match the lifestyles of others in Elmbridge:
There is an element of keeping-up-with the Joneses. If you’re in that peer set you don’t even realise that you’re doing something unusual because it’s what everybody else does. So you find yourself doing it or aspiring to it.
Mary cited the example of school trips to illustrate the issue of aspirational consumption and the pressures this brings:
It’s about £1,000 for a ski trip and I just couldn’t do it. Then I started doing this job. So I paid for the next ski trip in instalments. I made a payment every month for about two years so they could go.

30 Inequality in Elmbridge
We defined what house to buy based on her salary so we didn’t have the financial worry. I knew I’d be made redundant because it’s part and parcel of working in the City. – Gareth
Gareth and his wife were fortunate due to their prudence and high earning potential, but others are not always able to be as resilient to economic shocks. As noted, house prices are 14 times that of median annual household income in Elmbridge. Mary and her husband have ‘a huge mortgage for quite an average house’ that they have always managed to keep up with, but sometimes only just – ‘touch wood’. They still have nearly £300,000 left to pay despite paying it for 10 years. Since then house prices have risen so middle-income families like Mary’s will find it even harder to buy in the area in the future. One older resident commented on this trend:
I hear tales of well-paid young professionals - husband is a barrister, wife is a teacher or something like that - who are still struggling to buy a house with two incomes. The cost of housing in Elmbridge has gone up more than anywhere else in the country…Once they’d canalised the River Mole, property prices here were the second highest increase in either the country percentage wise or in the south east. – Ryan
Another source of financial pressure is the cost of commuting to work. Data from the UK census shows that out of the workers living in Elmbridge, 54% (35,150 people) commute out of the borough for their work, with the most popular destination for commuters being the London boroughs of Westminster and the City of London.59 An annual season train ticket from Elmbridge to London costs over £2,000 – a considerable extra financial strain for middle-income households.
Two middle-income residents we spoke to (Mary and Jane) are planning to leave Elmbridge because they feel they could live a better life somewhere else where house prices are more reasonable and there is not the same level of social pressure to consume.
I suppose if I could afford to stay here I probably would stay here, but I know that I’m going to have a better quality of life elsewhere. You do need to be quite comfortable financially to be comfortable in Surrey and to appreciate it. – Mary
Jane is aware that she and her husband can only afford to stay in the area because her job comes with a subsidy to help cover the cost of renting in the area. Once that job comes to an end, they will want to move, probably to the north of England where properties are cheaper.
If this middle-income group continues to decline, differences in the local population could become even more marked, with an increasingly polarised community of rich and poor.

31 Inequality in Elmbridge
5. Experiences of high-income residents
High-income residents are not immune to the social and financial pressures described by middle-income residents, but their experiences differ because they are less likely to feel financially squeezed, and spend more time outside the borough.
Low- and middle-income residents compare their experiences to what they expect life in Elmbridge is like for those with wealth and high incomes. Our interviews did not access people with the top 1% of national earnings but we did speak to people in the top 10%, earning at least £53,777 before tax annually, potentially with a partner who is also earning an equivalent amount. There is a higher proportion of people in this income group living in Elmbridge compared to the UK as a whole.
Leisure experiences and ‘hypermobility’
The leisure activities of the residents on the highest incomes are diverse and often take place outside Elmbridge.
Pauline is a high-income resident with three children. Her husband owns a company for which she works a few hours a week. She also spends time looking after their children and home. She and her husband are often abroad for both work and holidays and she spends time in London with friends. She does not have experience of local community groups or services, except for local primary schools.
I have friends who live in Surrey, but if we eat out with them it would usually be in London. – Pauline
Pauline is aware of how Elmbridge attracts people like her who ‘skew the statistics’ in terms of income and wealth, and may cause resentment with their luxurious standard of living.
It probably doesn’t help that there’s some very expensive property in the area. Consequently, people who maybe don’t work in the area but live in the area have access to the best of everything, and that’s why there’s such a discrepancy. – Pauline
Gareth is a high-income resident with two children. His family participates in a diverse range of activities which, combined with his commuting pattern, he sometimes finds exhausting. Spending so much time outside of the borough for work and his children’s activities means that Gareth feels disconnected from the neighbourhood. He describes visiting the local high street recently:

32 Inequality in Elmbridge
I went to Walton-on-Thames for the first time in two years. I drove through the High Street…I hardly knew where I was and I was five miles away from my front door, perhaps less than that. – Gareth
Some of the 35,150 who commute out of the borough for work like Gareth will be earning salaries in the top 20% of incomes nationally, but constant travelling leaves little time for them to forge connections within the borough. Their experience is similar to one described by the academic John Adams as ‘hypermobility’. In 2001, he predicted that:
The increase in the transport mobility of the average Briton conceals a growing gap between the mobility-rich and the mobility have-nots. All those too young, or old, or otherwise disqualified from driving will get left behind, along with those too poor to afford cars and plane tickets… Even when they live in close physical proximity to each other, the mobile wealthy and the immobile poor live in different worlds.60
John Adams goes on to point out that this can have negative impacts on all social groups – not just on the poorest. Societies with hypermobility are less healthy due to reduced exercise, more dangerous for children due to higher volumes of traffic, and more dispersed and less convivial.
Disconnected from the experiences of othersA consequence of being out of the borough a lot and not having opportunities to mix with groups that are less wealthy is disconnection. High-income residents can be less aware of the existence of poverty in Elmbridge and surprised when they encounter it. Pauline feels that she herself has observed the poorer parts of the borough and has some understanding, but that her peers are often not aware:
Some people who are extremely fortunate tend to [have] a sort of ‘let them eat cake’ mentality’ – Pauline
She says it is easy to become ‘oblivious’, especially when coming from ‘a position of strength’ through wealth, health and education – which makes it harder for high-income residents to empathise with residents who are ‘less fortunate’.
To convey his surprise over the existence of poverty in Elmbridge, Gareth told a story about going to his local supermarket. It was one of the few times, as a commuter, that he saw evidence of the income gap in his local area:
Going to Tesco for example at 8pm, I couldn’t believe what I saw. I was in the fruit and veg section in Tesco and there was a large group of people hovering around the vegetable section. The first time I saw it I felt uncomfortable and threatened.
But then a man came along and reduced all of the food. Then it was a free for all and I have never seen anything like it in my life. A cabbage which was probably £1.50, reduced to 20p and it was a fight to get the food. I guess these people live in Elmbridge, I don’t know. If you want some concrete evidence of this diversity gap, go to Tesco at about 8 at night when they reduce the food! – Gareth
33 Inequality in Elmbridge
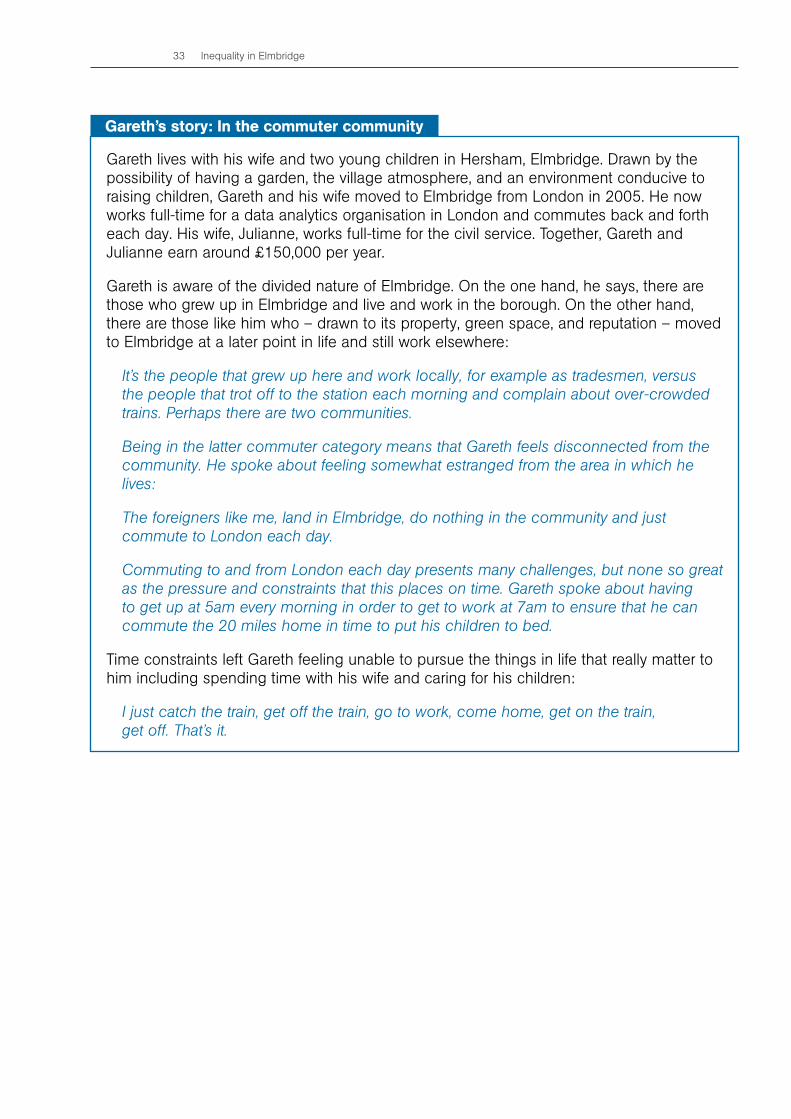
Gareth’s story: In the commuter community
Gareth lives with his wife and two young children in Hersham, Elmbridge. Drawn by the possibility of having a garden, the village atmosphere, and an environment conducive to raising children, Gareth and his wife moved to Elmbridge from London in 2005. He now works full-time for a data analytics organisation in London and commutes back and forth each day. His wife, Julianne, works full-time for the civil service. Together, Gareth and Julianne earn around £150,000 per year.
Gareth is aware of the divided nature of Elmbridge. On the one hand, he says, there are those who grew up in Elmbridge and live and work in the borough. On the other hand, there are those like him who – drawn to its property, green space, and reputation – moved to Elmbridge at a later point in life and still work elsewhere:
It’s the people that grew up here and work locally, for example as tradesmen, versus the people that trot off to the station each morning and complain about over-crowded trains. Perhaps there are two communities.
Being in the latter commuter category means that Gareth feels disconnected from the community. He spoke about feeling somewhat estranged from the area in which he lives:
The foreigners like me, land in Elmbridge, do nothing in the community and just commute to London each day.
Commuting to and from London each day presents many challenges, but none so great as the pressure and constraints that this places on time. Gareth spoke about having to get up at 5am every morning in order to get to work at 7am to ensure that he can commute the 20 miles home in time to put his children to bed.
Time constraints left Gareth feeling unable to pursue the things in life that really matter to him including spending time with his wife and caring for his children:
I just catch the train, get off the train, go to work, come home, get on the train, get off. That’s it.

34 Inequality in Elmbridge
6. Social impacts of inequality
Inequality in Elmbridge impacts the whole borough. This section describes how inequalities have led to a decline in community spirit and mixing between social groups.
Growing inequality is impacting Elmbridge as a whole – it affects everyone. Residents described people being less likely to mix with their neighbours if they are from a different social group. They also described experiencing a decline in community spirit at the local level.
Little to no social mixing
Residents we spoke to said they liked the idea of mixing with people who are different from themselves but this rarely happens in practice. Various different reasons were given for why people from different income groups do not mix. Several residents think it is due to perceptions and assumptions that people hold about each other which act as a barrier, whether through feeling ‘not good enough’ or feeling superior.
People who are at the lower end may feel resentful or that they’re not good enough and therefore they wouldn’t aspire to socialise with other people. – Pauline
The different income levels perceive each other differently even though we’re all just people. It’s not as if a lower-income person is a bad person and a higher-income [person] is not a bad person either. But they probably don’t mix socially. I can’t imagine how they would run into each other. – Frances
Interviewees also pointed out that people from different income groups spend time in distinctly different places, which reduces opportunities for mixing, as do commuters being out of the borough for large parts of the week. Gates on expensive estates also constitute a physical barrier.
Somebody who lives on a gated estate is not going to socialise with somebody who lives in a council estate. Mixing children is an opportunity but I don’t see the children of somebody who lives in a council estate going to attend birthday parties on the gated estate. It just wouldn’t happen. And where else might they interact? – Gareth
I mean Weybridge and Walton are like two different time zones. I have friends who live in Weybridge and there’s a little pub they go to. It’s quite out of the way, but it’s pretty much only the very posh who go there. Then you have [the pub in Walton]. That’s where all the dregs go. They will not go there and vice versa. It’s the divide. – David

35 Inequality in Elmbridge
Jane coordinates an annual community lunch on a local council estate so has experience of encouraging people to mix. She finds that wealthier residents assume it’s ‘not for them’ and are not used to getting involved in that sort of local event or public service.
The lunch brings out a mixed group but not as much as we would like. We know there are professionals who live on the estate who don’t come to anything. There are people who own their own homes who don’t mix with others in the estate…There’s prejudice on the estate but our hope was to try and build some community. If the only people who come forward are the same lot, there’s a not a lot we can do about it. But we keep trying. – Jane
One low-income resident pointed out that mixing is difficult when you feel you are on the bottom of the pile. Having been unemployed for a few years he struggles to relate to people who want to talk about their career successes.
I’ve met people who’ve got jobs in IT and are doing very well but I don’t want them to keep telling me how well they’re doing. When I go out I want to talk about football but all they seem to be interested in doing is rubbing your nose in the fact that they’re doing so much better than you. – David
Declining community spiritWith some notable exceptions, most residents feel that there has been a decline in neighbourliness and community spirit.
I don’t think there’s the same community spirit anymore. I mean I would never refuse to do anything for anyone but I don’t think people socialise anymore – knock on doors and have cups of tea. There isn’t that community anymore. – Pauline
It’s very insular and isolated now. There’s not much chatting. You don’t hear people just stopping in the street bumping into each other and saying ‘Hello’. I hardly ever see people my age bumping accidentally into somebody on the High Street but I remember my Mum and Dad doing that when I was a kid. – Gareth
Jack comments on the difference he experienced when he moved into Elmbridge from another, less wealthy area.
I don’t know my neighbours that well honestly. I suppose if you’ve got more money maybe you keep yourself to yourselves. You don’t mix so much, you’re not home. I presume there’s more of that. – Jack
Some residents picked up on commuting and busyness as a factor in the declining sense of community:
Compared to where I lived in London, it’s much less of a community. People are off to work so you don’t see your neighbours, especially in the winter months... The East End is much more outgoing and you don’t have to make an appointment to see people! – Rosaline

36 Inequality in Elmbridge
I don’t think we have a ‘village feel’, personally. Everybody just leaves Monday to Friday and is there at the weekend. There’s little community spirit. – Gareth
Two interviewees had notably positive experiences of their neighbours being community-minded and helping them. Hannah found her neighbours in the housing association development helpful and friendly and Ryan was part of a long-lasting social group on his street.
There’s only eight of us living in this row of houses and we all say ‘Hello’ to each other. The neighbour next door put the aerial up in my loft for me and helped us put up a trampoline in the back garden. They are really nice along there. But obviously not everybody has the same experiences. – Hannah
You happen to be talking to someone who probably lives in the friendliest road in Elmbridge…people get on well with each other. We have our own reading group, we have a music club. People are very friendly to each other and we have a dinner every January. – Ryan
Both mention that their situations feel exceptional compared to norms in Elmbridge. It is worth noting that these positive examples are from streets or blocks in which people have fairly similar levels of income, in the low-to-middle bracket. More challenging is encouraging people from different backgrounds to mix with each other.

37 Inequality in Elmbridge
7. Perceptions of inequality
This section describes residents’ perceptions of inequality as hidden, unfair, and hard to change. Despite this, the residents we spoke to wanted to see the community brought together to address the inequality challenge.
Elmbridge residents recognise the extent of inequality in Elmbridge and are aware of the spatial separation of more deprived council estates from wealthy areas and gated mansions. Residents said that inequality is hidden, unfair, and hard to change but that people wanted to see the community coming together to address it.
Inequality: hidden, unfair and hard to change
Elmbridge has a reputation of being a particularly wealthy borough and the residents we spoke to recognised that this reputation is not unfounded. Gareth, for instance, describes how ‘Surrey is wealthy and Elmbridge is super-wealthy’, while Pauline says that ‘Elmbridge is overall a wealthy borough.’
However, residents note, Elmbridge is also a place of inequality. Ryan, for instance, describes how despite the many wealthy professional residents in the borough, there are pockets of deprivation:
Obviously Elmbridge has more than its fair share of City workers or people who are retired from the City: accountants, solicitors, professionals as opposed to the traditional blue collar…But there are pockets in Elmbridge of deprivation which we’re all very aware of. – Ryan
Similarly David describes how, ‘behind the scenes’, there are issues of poverty that are often obscured by perceptions of Elmbridge as a place of great wealth:
You know behind the scenes it isn’t wealthy...People are struggling here and there’s child poverty. In Cobham we get clothes together and do food parcels. Surrey is supposed to be a very wealthy area – that’s what it is recognised as and that’s what everybody thinks. Poverty is covered up… you have those people within the small corners all tucked away. – David
Residents find that the large gap between high and low incomes can be seen most evidently through differences in housing between the gated mansions in areas such as St George’s Hill and the spatially separated social housing estates such as the St John’s Estate or Field Common.
You can see inequality in the different types of houses. Obviously, there’s the private areas, the bigger houses, the nicer streets. And then there are the council estates and things like that. You can definitely see the difference. – Frances

38 Inequality in Elmbridge
You can drive down one road and go from a council estate to property where you’re not just doing really well, you’re multi-millionaire status. There is a huge disparity. – Mary
While most residents recognise Elmbridge as an unequal borough, some have concerns that those on higher incomes maybe unaware of just how unequal Elmbridge has become. Pauline, one of the wealthier residents that we spoke to, expresses apprehensions about this:
Some of higher-income residents are probably quite oblivious because they almost live in their castles. – Pauline
Many residents spoke about a desire for a more equal society, while recognising the difficulty of achieving this in practice. Inequality, in Jack’s view, is ‘just the way life is I’m afraid’.
Despite the recognition of the difficulty of tackling such a knotty issue as inequality, all residents expressed a desire for the community of Elmbridge to come together to tackle its adverse affects.

39 Inequality in Elmbridge
Conclusion
There is a great deal of wealth – both financial and non-financial – in Elmbridge. It is a borough that works very well for many, but presents a number of challenges. The cost of housing, transport and childcare make it difficult for lower-income residents to afford to live in the area. They often feel stigmatised and lack a sense of control over their lives. The cost of living combined with the pressure to live a ‘Surrey lifestyle’ can lead to insecurity and anxiety amongst people on a middle income. Finally, a lack of social mixing can make the area appear disjointed and subject to a declining community spirit, which has a negative impact on Elmbridge as a whole.
If inequality is allowed to go unchecked, then these challenges are likely to grow. In the following section, Walton Charity sets out how they intend to respond to the findings of this report and contribute to making Elmbridge a better place to live for everyone.

40 Inequality in Elmbridge
Walton Charity: How we will respond
Walton Charity, along with numerous other organisations in Elmbridge, is concerned with improving opportunities for those living in the borough. In order to do so, we need to take the issue of inequality seriously. Inequality appears to be rising locally as well as nationally, which makes it increasingly difficult for people on low and middle incomes to have a good quality of life. Inequality can create divisions between people that affect everyone, whatever their income, for example by limiting opportunities to share experiences and strengthen communities.
Based on the findings of this research, Walton Charity has identified how we will respond to these challenges:
y By continuing to address inequality
y By continuing to work in partnership with others and by encouraging and supporting others to work together
y By continuing to champion positive change for local people
Box C. Recent activities Walton Charity has been involved in
y Founding Steering Group member of Surrey Community Foundation’s local Elmbridge Community Fund.
y Jointly developed with Voluntary Action Elmbridge, now delivering an Action Plan to grow local Corporate Engagement.
y Hersham & Walton Foodbank partner, providing additional support with staff and premises.
y Joint funder and active participant in a range of local activities, such as the Winter Shelter Project for homeless people; the purchase of the THP House for homeless; and Transport Grants for small groups supporting older people.
y Joint supporter and developer of the annual Burview Woodland Arts Workshops for adults with learning disabilities.
y Funding support for community activities such as the Felix Community Tapestry Project, Elmbridge Borough Council Nutrition Week and Hydration Month, design and delivery of Community Days, Frost Festival, Sing-a-long, and Arts Projects for older people.
y Provision of extensive corporate volunteering activities, including those based on the Charity’s four allotment sites and other properties.
y Facilitation of proactive local corporate relationships for both Walton Charity and other local voluntary sector organisations.

41 Inequality in Elmbridge
Walton charity’s reponse to the findings in this report
Despite the challenges set out in this report, local people and organisations can make a difference by working together to ensure that Elmbridge is a better place to live for everyone.
Walton Charity will continue to address local inequality
y Walton Charity will continue to identify need and offer assistance to the local community via existing individual and community grants mechanisms and also via the development of a range new initiatives, either alone or in partnership with others.
y Walton Charity will continue to identify and offer assistance to local children and families living in poverty. We will do this directly via our various existing individual grant mechanisms and other initiatives. We will do this indirectly via our community grants, project programmes and involvement in a range of local working groups and including, for example, Streets Apart, Elmbridge Youth Strategy, Universal Credit Working Group and the local Housing Network.
y Walton Charity will identify and offer encouragement and support to community self-help activities including offering support to local “community champions.
Box C. continued
y Provision of affordable shared office, and other accommodation for 19 local charities and community groups.
y A range of support to a local charity, The Burwood Playgroup
y Community Grant provision to local organisations for, amongst other things, providing financial capability advice and support to local people
y Provision of a range of Crisis and Enabling Grants to individuals in need
y Research commissioning partner for the Streets Apart project, leading on the Families Living in Poverty workstream.
y Membership of a range of local working groups considering the impacts of welfare and benefits changes.
y Allocation of four houses providing move-on accomodation for the non-statutory homeless.
y Commissioner of research into local homelessness.
y Development of a partnership Community Allotment Pilot Project
y Living Wage employer.
y This is not intended to be a comprehensive list and excludes many of Walton Charity’s operational activities and undertakings.

42 Inequality in Elmbridge
Walton Charity will continue to work with others and encourage others to work together
y Walton Charity will continue to engage in and support a range of activities that enhance and complement the newly formed Elmbridge Community Fund, which involves the widest spectrum of our local community.
y Walton Charity will continue to engage in and support a wide range of partnerships across the local community, in particular those which address: child poverty, improve educational attainment for children living in low-income families, access to affordable housing, and issues relating to equality of access.
y Walton Charity will continue to engage in, develop, and support a range of local volunteering opportunities including, for example, the newly forming Elmbridge Timebank, development of local corporate partnership activities, and the joint Corporate Engagement Project with Voluntary Action Elmbridge.
y Walton Charity remains committed to the provision of Charity House – A Community Under One Roof – providing flexible and responsive office and resource space for a range of local charities, social enterprise, voluntary sector organisations, and people. This will be a building designed to meet local community needs and aspirations that will change over time.
Walton Charity will continue to champion positive change for local people
y Walton Charity will continue to use networks, partnerships, and relationships to benefit local people wherever possible.
y Walton Charity will work within and without charitable and geographical boundaries to influence decision makers to benefit local people.
Over recent years, we have reviewed and broadened our reach locally. Our strategic aim is to focus increasingly on activities which enable and support those working with local people in need and to continue to develop a wide range of partnerships so that we can all achieve more by working together.
As a Charity with over 800 years of experience, Walton Charity will use this report to continue to build on our existing and new partnerships and on our ever developing plans. We aim to support and further enable activities that bring about real and lasting improvements for people living in Elmbridge. Along with our independence, we value our many and strengthening links and relationships among and beyond our local community. We will continue to use these to benefit local people wherever possible.

43 Inequality in Elmbridge
We will continue to support and enable what is already going on in our community which makes a positive difference to those in need and help to find new ways of doing more. We are also interested in promoting positive changes that local people themselves aspire to. We do not expect that everything we do or becoming involved in will work, but that will not stop us trying.
If this report has interested you and you would like to find out more please contact Walton Charity on [email protected]
Box D. What Walton Charity will do
Enable and Support We will deliver the Charity House project to enable some of the most vital local charities and social enterprises to grow and flourish together.
We will support and encourage shared purpose community activities to support a strong and self-supporting community.
We will further develop our ‘funding plus’ approach through professional training and support to facilitate the development of the local voluntary sector.
Children living` in poverty We will prioritise activities which will alleviate child poverty and improve educational attainment for children from low-income families.
We will support initiatives that increase affordable local childcare for low-income families and seek how to improve access and provision.
Debt and in-work poverty We will support improvement of access to credit unions and other affordable finance and financial capability advice and support.
We will more activity promote the National Living Wage Campaign (e.g. by making membership a community grant application criterion).
Transport We will support and encourage the review and potential development of community-based transport provision to improve access to affordable transport.
Local giving We will develop a cohesive local giving framework to enhance and complement the newly formed Elmbridge Community Foundation.

44 Inequality in Elmbridge
Appendix A
Single Adult
Outgoings Income
Food and drink £48.26 Your Pre-tax Earnings £405.4
Clothing £7.25 Your Income Tax £40.42
Utilities and council tax £40.14 Your National Insurance £30.05
Household goods and services £14.91 After Tax Earnings £334.93
Personal goods and services £13.67
Travel costs and motoring £26.68
Social and cultural activities £45.25
Rent £138.77
Single parent with one child
Outgoings Income
Food and drink £63.45 Your Pre-tax Earnings £623.34
Clothing £26.56 Your Income Tax £84.01
Utilities £52.83 Your National Insurance £56.2
Household goods and services £30.82 After Tax Earnings £483.13
Childcare £65.92 Child Benefit £20.7
Personal goods and services £26.84 Housing Benefit £36.94
Travel costs and motoring £46.94
Social and cultural activities £52.51
Rent £174.9
Couple with two children
Outgoings Income
Food and drink £126.4 Your Pre-tax Earnings £579.4
Clothing £49.58 Your Income Tax £75.22
Utilities £68.95 Your National Insurance £50.93
Household goods and services £40.08 Partner’s Pre-tax Earnings £289.9
Personal goods and services £47.43 Partner’s Income Tax £17.32
Travel costs and motoring £77.04 Partner’s National Insurance £16.19
Social and cultural activities £105.81 After Tax Earnings £709.64
Rent £228.76 Child Benefit £34.4

45 Inequality in Elmbridge
Acknowledgements
We would like to acknowledge the generous help of all participants in the study, including those from the voluntary and community sector who attended a research workshop at the outset of this process and a seminar to consider the draft document, as well as the residents who spoke to us about their experiences of living in Elmbridge and shared their ideas for action.
Workshop attendees
Attendees including representatives from:
y Debtscape
y Eikon Charity
y Elmbridge Borough Council
y Elmbridge Social Services Locality Team (Adults & Older People)
y Elmbridge Youth Support Service
y Guildford Diocese
y JobCentre Plus
y Kingdom Fruit CIC
y Lookahead Care & Support
y Multi faith Forum
y North West Surrey CCG
y Paragon Community Housing Group
y Public Health, Surrey County Council
y Rydens Enterprise School
y Surrey Community Action
y Surrey Welfare Rights Unit
y Voluntary Action Elmbridge
y Walton Charity
y Walton, Weybridge & Hersham CAB
y Wellness with a Goal
y White Lodge

46 Inequality in Elmbridge
Endnotes
1. Wilkinson, R., & Pickett, K. (2009). The Spirit-Level: Why more equal societies almost always do better. London: Allen Lane.
2. Office for National Statistics. (2012). 2011 Census: Key Statistics for local authorities in England and Wales. London: ONS.
3. Office for National Statistics. (2012) 2011 Census: Commuting Patterns in the UK. London: ONS.
4. Lloyds Banking Group. (2014). Halifax Quality of Life Survey [webpage]. Retrieved from http://www.lloydsbankinggroup.com/Media/Press-Releases/2014/halifax/halifax-quality-of-life-survey/
5. Sian Sangarde-Brown. (2013). Surrey Uncovered: Why local giving is needed to strengthen our communities. Surrey: Community Foundation for Surrey.
6. Surrey-I (2015) Surrey: Incidents of domestic violence. Surrey: Surrey-I Partnership.
7. Surrey-I (2015) Surrey: Incidents of domestic violence. Surrey: Surrey-I Partnership.
8. Surrey-I (2013) Census 2011: People providing unpaid care. Surrey: Surrey-I Partnership.
9. Department for Work and Pensions. (2014). Work and Pensions Longitudinal Study: October to December 2014. Retrieved from https://www.surreyi.gov.uk/ViewPage.aspx?c=datasetinformation&did=1216&v=4059
10. Surrey-I (2015). Community well-being, Elmbridge Local Authority in Surrey. Surrey: Surrey-I Partnership.
11. Surrey County Council. (2011). Families in Poverty Needs Assessment: Part 2. Retrieved from http://bit.ly/1UJBM9u p.3.
12. Surrey-I (2014). JSNA Summary, Elmbridge Local Authority in Surrey. Surrey: Surrey-I Partnership.
13. Annual Survey of Hours and Earnings (ASHE). (2013). This survey only contains data for those up to the 60th percentile for Elmbridge area. In order to estimate proportions of high earners in Elmbridge we used data for Surrey as a whole for the 60th to the 100th percentile. We would expect Elmbridge to have higher incomes at these thresholds given the patterns seen in the data we have. This means that our statistic probably slightly underestimates the proportion of people living in Elmbridge with incomes in the top 20% of earnings nationally and is therefore useful as a conservative estimate.
14. Office for National Statistics (2014). 2013 Annual Survey of Hours and Earnings. London: ONS.
15. Office for National Statistics (2014). 2013 Annual Survey of Hours and Earnings. London: ONS.
16. Nomis. (2014). Labour Market Profile for Elmbridge [webpage]. Retrieved from http://bit.ly/1G4W9TJ
17. Alvaredo, F., Atkinson, T. & Piketty, T. The World Top Incomes Database. Retrieved from http://bit.ly/1CkHk4j
18. Hildyard, L. (n.d.). FTSE 100 bosses now paid an average 100 times as much as their employees [blog]. Retrieved from http://highpaycentre.org/blog/ftse-100-bosses-now-paid-an-average-143-times-as-much-as-their-employees
19. UHY Hacker Young. (n.d.) 28 out of top 30 highest income tax areas are stockbroker belt-towns [webpage]. Retrieved from http://bit.ly/1UwdAYc
20. Surrey Community Foundation/ Sian Sangarde-Brown. (2013). Surrey Uncovered: Why local giving is needed to strengthen our communities. Surrey: Community Foundation for Surrey.
21. Calculated as 60% of national median earnings. A threshold of £16,425 for England.
22. Surrey Public Health. Food Access Needs Assessment 2014. Surrey: Surrey Borough Council. Retrieved from http://bit.ly/1L9fj1c
23. Gordon, D., Mack, J., Lansley, S., Main, G., Nandy, S., Patsios, D. & Pomati, M. The impoverishment of the UK: PSE UK first results. London: PSE UK.
24. Zoopla. Zed Index [wage page]. Retrieved from http://bit.ly/1KKqoqT
25. Office for National Statistics. (2014). Annual Survey of Hours and Earnings and HM land Registry. London: ONS.
26. Office for National Statistics. (2014). Annual Survey of Hours and Earnings and HM land Registry. London: ONS.
27. Office for National Statistics (2012). 2011 Census: Tenure by Age. London: ONS.
28. Ibid.
29. National Housing Federation. (2015). Elmbridge, Chichester and Horsham among the most difficult places to become a first-time buyer [webpage]. Retrieved from http://www.housing.org.uk/press/press-releases/elmbridge-chichester-and-horsham-among-the-most-difficult-places-to-become-/
30. Elmbridge Borough Council. (2015). Housing in Elmbridge: Facts and figures 2015. Elmbridge: Elmbridge Borough Council.

47 Inequality in Elmbridge
31. O’Mara-Eves, A. Brunton, G. McDaid, D. Oliver, S. Kavanagh,J., Jamal, F., Matosevic, T., Harden, A. & Thomas, J. (2013). Community engagement to reduce inequalities in health: a systematic review, meta-analysis and economic analysis. Public Health Research, 1(4).
32. Marmot, M.G., Allen, J., Goldblatt, P., Boyce, T., McNeish, D., Grady, M., & Geddes, I. (2010). Fair society, healthy lives: Strategic review of health inequalities in England post-2010. London: University College London. p.16.
33. Public Health England. (2014). Health Profile for Surrey 2014. London: Public Health England.
34. Marmot, M.G., Allen, J., Goldblatt, P., Boyce, T., McNeish, D., Grady, M., & Geddes, I. (2010). Fair society, healthy lives: Strategic review of health inequalities in England post-2010. London: University College London.p.16
35. Public Health England (2015). The Segment Tool: segmenting gaps by cause of death – key results for Elmbridge. London: Public Health England.
36. Ibid.
37. Marmot, M.G., Allen, J., Goldblatt, P., Boyce, T., McNeish, D., Grady, M., & Geddes, I. (2010). Fair society, healthy lives: Strategic review of health inequalities in England post-2010. London: University College LondonP.16
38. Ibid. p. 39.
39. Public Health England. (2013). Life Expectancy at birth: 2008-2012. London: Public Health England.
40. Williams, T., Dinsdale, H., Eayres, D. & Tahzib, F. (2005). Technical report: Calculating life expectancy in small areas. SEPHO. Retrieved from http://www.sepho.org.uk/viewResource.aspx?id=9847 p.49
41. Office for National Statistics. (2006). Life expectancy at birth for wards in England and Wales, 1999-2003. Retrieved from http://www.ons.gov.uk/ons/rel/subnational-health4/life-expec-birth-wards-eng-wal/results/life-expectancy-at-birth-for-wards-in-england---wales--experimental-.pdf
42. Buck, D., & Maguire, D. (2015). Inequalities in life expectancy: changes over time and implications for policy. The Kings Fund. Retrieved from http://www.kingsfund.org.uk/publications/inequalities-life-expectancy
43. Bradshaw, J. et al. (2008). A Minimum Income Standard for Britain: what people think. York: Joseph Rowntree Foundation. p.1
44. Valuation office Agency (2014). Private rental market statistics.
45. Savils. (2015) Interactive map: annual housing costs in England and Wales [webpage]. Retrieved from http://www.savills.co.uk/blog/article/188887/residential-property/interactive-map-annual-housing-costs-in-england-and-wales.aspx
46. Elmbridge Borough Council. (2015). A Housing and Homelessness Strategy for 2015-2019. Elmbridge: Elmbridge Borough Council.
47. Family and Childcare Trust. (2015). Childcare Cost Survey 2015. Retrieved from http://www.familyandchildcaretrust.org/childcare-cost-survey-2015
48. Citizens Advice Bureau. (2014). Impact Report 2013/14. Elmbridge: Citizens Advice Elmbridge.
49. Walton Charity (unpublished). Level of indebtedness of individual grant beneficiaries. Elmbridge: Walton Charity.
50. Citizens Advice Bureau. (2014). Impact Report 2014/15. Elmbridge: Citizens Advice Elmbridge.
51. Valuation Office Agency (2014). Private rental market statistics. London: Valuation Office Agency.
52. Elmbridge Borough Council. (2015). A Housing and Homelessness Strategy for 2015-2019. Elmbridge: Elmbridge Borough Council.
53. Family and Childcare Trust. (2015). Childcare Cost Survey 2015. London: Family and Childcare Trust.
54. Office for National Statistics. Census 2011: Car Ownership. London: ONS.
55. Milton, B., Attree, p., French, B., Povall, S., Whitehead, M., & Popay, J. (2011). The impact of community engagement on health and social outcomes: a systematic review. Community Development Journal 2012, 47(3) p. 330.
56. Skinner, E. (1996). ‘A guide to constructs of control’, Journal of Personality and Social Psychology. 1996, 71(3) p. 549.
57. Milton, B., Attree, p., French, B., Povall, S., Whitehead, M., & Popay, J. (2011). The impact of community engagement on health and social outcomes: a systematic review. Community Development Journal 2012,47(3) pp.317-334.
58. Piachaud, D., Bennett, F., Nazroo, J. & Popay, J. (2009). Social Inclusion and Social mobility: Report of Task Group 9. Retrieved from http://www.instituteofhealthequity.org/projects/marmot-review-task-groups p. 49.
59. Office for National Statistics. 2011 census: Commuting patterns in the united kingdom. London: ONS.
60. Adams, J. (2001.) The social consequences of hypermobility. RSA lecture. Retrieved from http://bit.ly/1KPsxjs

New Economics [email protected]+44 (0)20 7820 6300@NEF
Registered charity number 1055254© November 2015 New Economics FoundationISBN 978-1-908506-93-1
Written by: Sarah Lyall and Daniel ButtonThanks to: Andrea Watson and Jackie Lodge at Walton Charity, Anna Coote and all of those who took part in the research.Designed by: danfarleydesign.co.ukCover image: Adam37 via Wikimedia Commons
This research was commissioned by: