Embed Size (px)
Citation preview
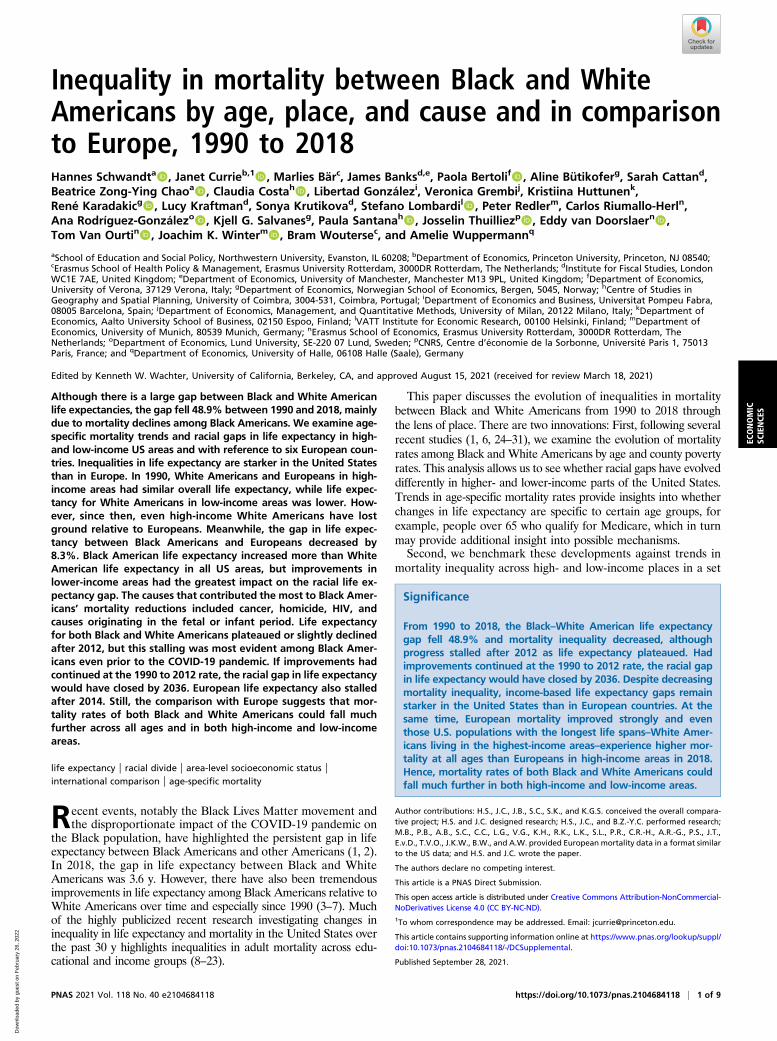
Inequality in mortality between Black and WhiteAmericans by age, place, and cause and in comparisonto Europe, 1990 to 2018Hannes Schwandta, Janet Currieb,1, Marlies Bärc, James Banksd,e, Paola Bertolif, Aline Bütikoferg, Sarah Cattand,Beatrice Zong-Ying Chaoa
, Claudia Costah, Libertad Gonzálezi, Veronica Grembij, Kristiina Huttunenk,René Karadakicg, Lucy Kraftmand, Sonya Krutikovad, Stefano Lombardil, Peter Redlerm, Carlos Riumallo-Herln,Ana Rodríguez-Gonzálezo, Kjell G. Salvanesg, Paula Santanah, Josselin Thuilliezp, Eddy van Doorslaern,Tom Van Ourtin, Joachim K. Winterm, Bram Woutersec, and Amelie Wuppermannq
aSchool of Education and Social Policy, Northwestern University, Evanston, IL 60208; bDepartment of Economics, Princeton University, Princeton, NJ 08540;cErasmus School of Health Policy & Management, Erasmus University Rotterdam, 3000DR Rotterdam, The Netherlands; dInstitute for Fiscal Studies, LondonWC1E 7AE, United Kingdom; eDepartment of Economics, University of Manchester, Manchester M13 9PL, United Kingdom; fDepartment of Economics,University of Verona, 37129 Verona, Italy; gDepartment of Economics, Norwegian School of Economics, Bergen, 5045, Norway; hCentre of Studies inGeography and Spatial Planning, University of Coimbra, 3004-531, Coimbra, Portugal; iDepartment of Economics and Business, Universitat Pompeu Fabra,08005 Barcelona, Spain; jDepartment of Economics, Management, and Quantitative Methods, University of Milan, 20122 Milano, Italy; kDepartment ofEconomics, Aalto University School of Business, 02150 Espoo, Finland; lVATT Institute for Economic Research, 00100 Helsinki, Finland; mDepartment ofEconomics, University of Munich, 80539 Munich, Germany; nErasmus School of Economics, Erasmus University Rotterdam, 3000DR Rotterdam, TheNetherlands; oDepartment of Economics, Lund University, SE-220 07 Lund, Sweden; pCNRS, Centre d’économie de la Sorbonne, Université Paris 1, 75013Paris, France; and qDepartment of Economics, University of Halle, 06108 Halle (Saale), Germany
Edited by Kenneth W. Wachter, University of California, Berkeley, CA, and approved August 15, 2021 (received for review March 18, 2021)
Although there is a large gap between Black and White Americanlife expectancies, the gap fell 48.9% between 1990 and 2018, mainlydue to mortality declines among Black Americans. We examine age-specific mortality trends and racial gaps in life expectancy in high-and low-income US areas and with reference to six European coun-tries. Inequalities in life expectancy are starker in the United Statesthan in Europe. In 1990, White Americans and Europeans in high-income areas had similar overall life expectancy, while life expec-tancy for White Americans in low-income areas was lower. How-ever, since then, even high-income White Americans have lostground relative to Europeans. Meanwhile, the gap in life expec-tancy between Black Americans and Europeans decreased by8.3%. Black American life expectancy increased more than WhiteAmerican life expectancy in all US areas, but improvements inlower-income areas had the greatest impact on the racial life ex-pectancy gap. The causes that contributed the most to Black Amer-icans’ mortality reductions included cancer, homicide, HIV, andcauses originating in the fetal or infant period. Life expectancyfor both Black and White Americans plateaued or slightly declinedafter 2012, but this stalling was most evident among Black Amer-icans even prior to the COVID-19 pandemic. If improvements hadcontinued at the 1990 to 2012 rate, the racial gap in life expectancywould have closed by 2036. European life expectancy also stalledafter 2014. Still, the comparison with Europe suggests that mor-tality rates of both Black and White Americans could fall muchfurther across all ages and in both high-income and low-incomeareas.
life expectancy | racial divide | area-level socioeconomic status |international comparison | age-specific mortality
Recent events, notably the Black Lives Matter movement andthe disproportionate impact of the COVID-19 pandemic on
the Black population, have highlighted the persistent gap in lifeexpectancy between Black Americans and other Americans (1, 2).In 2018, the gap in life expectancy between Black and WhiteAmericans was 3.6 y. However, there have also been tremendousimprovements in life expectancy among Black Americans relative toWhite Americans over time and especially since 1990 (3–7). Muchof the highly publicized recent research investigating changes ininequality in life expectancy and mortality in the United States overthe past 30 y highlights inequalities in adult mortality across edu-cational and income groups (8–23).
This paper discusses the evolution of inequalities in mortalitybetween Black and White Americans from 1990 to 2018 throughthe lens of place. There are two innovations: First, following severalrecent studies (1, 6, 24–31), we examine the evolution of mortalityrates among Black and White Americans by age and county povertyrates. This analysis allows us to see whether racial gaps have evolveddifferently in higher- and lower-income parts of the United States.Trends in age-specific mortality rates provide insights into whetherchanges in life expectancy are specific to certain age groups, forexample, people over 65 who qualify for Medicare, which in turnmay provide additional insight into possible mechanisms.Second, we benchmark these developments against trends in
mortality inequality across high- and low-income places in a set
Significance
From 1990 to 2018, the Black–White American life expectancygap fell 48.9% and mortality inequality decreased, althoughprogress stalled after 2012 as life expectancy plateaued. Hadimprovements continued at the 1990 to 2012 rate, the racial gapin life expectancy would have closed by 2036. Despite decreasingmortality inequality, income-based life expectancy gaps remainstarker in the United States than in European countries. At thesame time, European mortality improved strongly and eventhose U.S. populations with the longest life spans–White Amer-icans living in the highest-income areas–experience higher mor-tality at all ages than Europeans in high-income areas in 2018.Hence, mortality rates of both Black and White Americans couldfall much further in both high-income and low-income areas.
Author contributions: H.S., J.C., J.B., S.C., S.K., and K.G.S. conceived the overall compara-tive project; H.S. and J.C. designed research; H.S., J.C., and B.Z.-Y.C. performed research;M.B., P.B., A.B., S.C., C.C., L.G., V.G., K.H., R.K., L.K., S.L., P.R., C.R.-H., A.R.-G., P.S., J.T.,E.v.D., T.V.O., J.K.W., B.W., and A.W. provided European mortality data in a format similarto the US data; and H.S. and J.C. wrote the paper.
The authors declare no competing interest.
This article is a PNAS Direct Submission.
This open access article is distributed under Creative Commons Attribution-NonCommercial-NoDerivatives License 4.0 (CC BY-NC-ND).1To whom correspondence may be addressed. Email: [email protected].
This article contains supporting information online at https://www.pnas.org/lookup/suppl/doi:10.1073/pnas.2104684118/-/DCSupplemental.
Published September 28, 2021.
PNAS 2021 Vol. 118 No. 40 e2104684118 https://doi.org/10.1073/pnas.2104684118 | 1 of 9
ECONOMIC
SCIENCE
S
Dow
nloa
ded
by g
uest
on
Feb
ruar
y 26
, 202
2
of six prosperous European countries. This comparison offers sev-eral potential insights, such as whether mortality in higher-incomeparts of the United States is more similar to that of Europeancountries or whether both high- and low-income US places tend tolag behind. It also provides additional perspective on the gaps be-tween Black and White Americans, allowing us to ask, for example,if only Black Americans fall short of a European benchmark or ifthe mechanisms driving lower life expectancy in the United Statesalso affect White Americans.Our analysis proceeds by first ranking counties by their poverty
rate in each year and then grouping counties into clusters that eachaccount for about 5% of the population (Materials and Methods).A key advantage of this approach is that we can examine alldeaths, whereas information on income and completed educationis not available for every person. We also avoid problems due tochanges in the education distribution over time. For example, highschool dropouts in the United States have become an increasinglysmall and more negatively selected group as high school completionand college attendance have become more normative (32–35). Alimitation of our approach is that we cannot examine inequalitieswithin small areas. Set against this limitation is evidence that low-income Americans live longer in high-income areas than in low-income ones (12), so that mortality across geographic areas is ofindependent interest. Our approach allows us to see whetherchanges in mortality occur in both high- and low-income areas orare driven largely by improvements in lower-income areas.A second advantage of this geographical approach is that it can
be easily adapted to examine mortality inequality in other coun-tries using a similar framework. We examine trends in mortalityinequality in six wealthy European countries using methodsidentical to the US analysis. Mortality inequality in these countriesis of interest in its own right but also serves as a useful baseline forconsidering developments in the United States, contributing to agrowing body of comparative literature on mortality differentials(6–39). Our main analysis focuses on six countries (England,France, Germany, the Netherlands, Norway, and Spain) for whichconsistent mortality data by geographic areas exist for the entiretime period. All six are prosperous countries with well-developedhealth care and social welfare systems. The experience of thesecountries provides some insight into questions such as how low USmortality rates could fall given current medical standards; whetherincreasing gaps in life expectancy between the United States andEurope are driven only by lower-income areas or whether higher-income areas are also falling behind; and finally, whether mortalityamong Black Americans declined only relative to White Americansor whether it also declined relative to a European life expectancybenchmark.
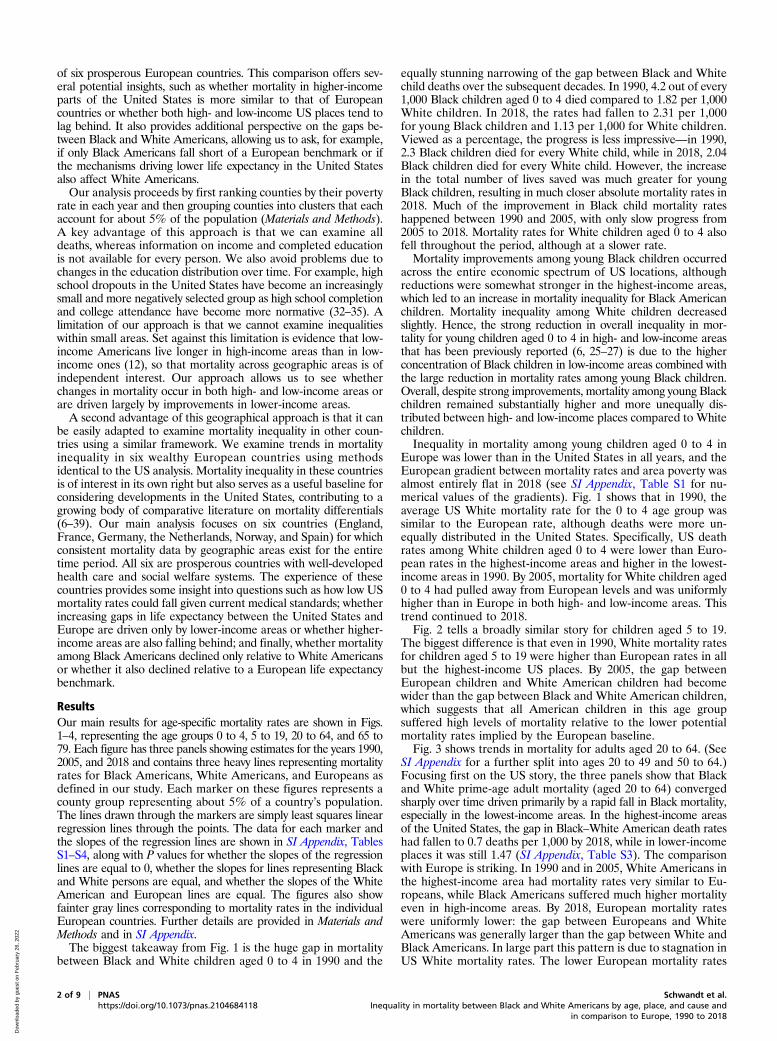
ResultsOur main results for age-specific mortality rates are shown in Figs.1–4, representing the age groups 0 to 4, 5 to 19, 20 to 64, and 65 to79. Each figure has three panels showing estimates for the years 1990,2005, and 2018 and contains three heavy lines representing mortalityrates for Black Americans, White Americans, and Europeans asdefined in our study. Each marker on these figures represents acounty group representing about 5% of a country’s population.The lines drawn through the markers are simply least squares linearregression lines through the points. The data for each marker andthe slopes of the regression lines are shown in SI Appendix, TablesS1–S4, along with P values for whether the slopes of the regressionlines are equal to 0, whether the slopes for lines representing Blackand White persons are equal, and whether the slopes of the WhiteAmerican and European lines are equal. The figures also showfainter gray lines corresponding to mortality rates in the individualEuropean countries. Further details are provided in Materials andMethods and in SI Appendix.The biggest takeaway from Fig. 1 is the huge gap in mortality
between Black and White children aged 0 to 4 in 1990 and the
equally stunning narrowing of the gap between Black and Whitechild deaths over the subsequent decades. In 1990, 4.2 out of every1,000 Black children aged 0 to 4 died compared to 1.82 per 1,000White children. In 2018, the rates had fallen to 2.31 per 1,000for young Black children and 1.13 per 1,000 for White children.Viewed as a percentage, the progress is less impressive—in 1990,2.3 Black children died for every White child, while in 2018, 2.04Black children died for every White child. However, the increasein the total number of lives saved was much greater for youngBlack children, resulting in much closer absolute mortality rates in2018. Much of the improvement in Black child mortality rateshappened between 1990 and 2005, with only slow progress from2005 to 2018. Mortality rates for White children aged 0 to 4 alsofell throughout the period, although at a slower rate.Mortality improvements among young Black children occurred
across the entire economic spectrum of US locations, althoughreductions were somewhat stronger in the highest-income areas,which led to an increase in mortality inequality for Black Americanchildren. Mortality inequality among White children decreasedslightly. Hence, the strong reduction in overall inequality in mor-tality for young children aged 0 to 4 in high- and low-income areasthat has been previously reported (6, 25–27) is due to the higherconcentration of Black children in low-income areas combined withthe large reduction in mortality rates among young Black children.Overall, despite strong improvements, mortality among young Blackchildren remained substantially higher and more unequally dis-tributed between high- and low-income places compared to Whitechildren.Inequality in mortality among young children aged 0 to 4 in
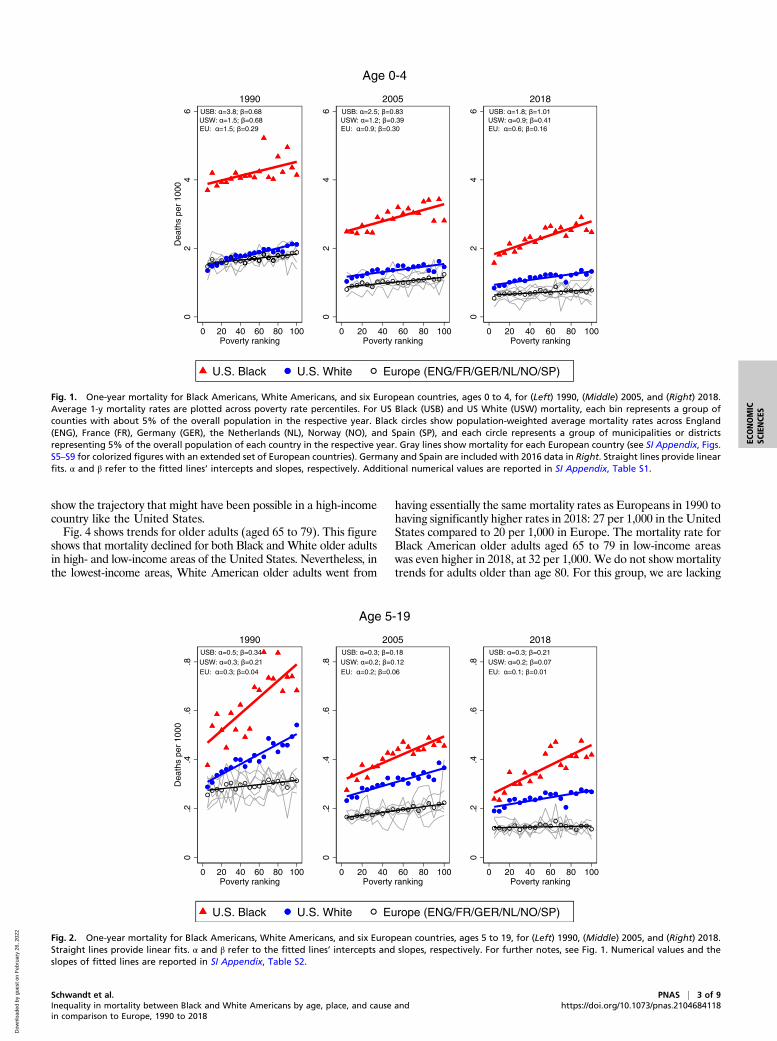
Europe was lower than in the United States in all years, and theEuropean gradient between mortality rates and area poverty wasalmost entirely flat in 2018 (see SI Appendix, Table S1 for nu-merical values of the gradients). Fig. 1 shows that in 1990, theaverage US White mortality rate for the 0 to 4 age group wassimilar to the European rate, although deaths were more un-equally distributed in the United States. Specifically, US deathrates among White children aged 0 to 4 were lower than Euro-pean rates in the highest-income areas and higher in the lowest-income areas in 1990. By 2005, mortality for White children aged0 to 4 had pulled away from European levels and was uniformlyhigher than in Europe in both high- and low-income areas. Thistrend continued to 2018.Fig. 2 tells a broadly similar story for children aged 5 to 19.
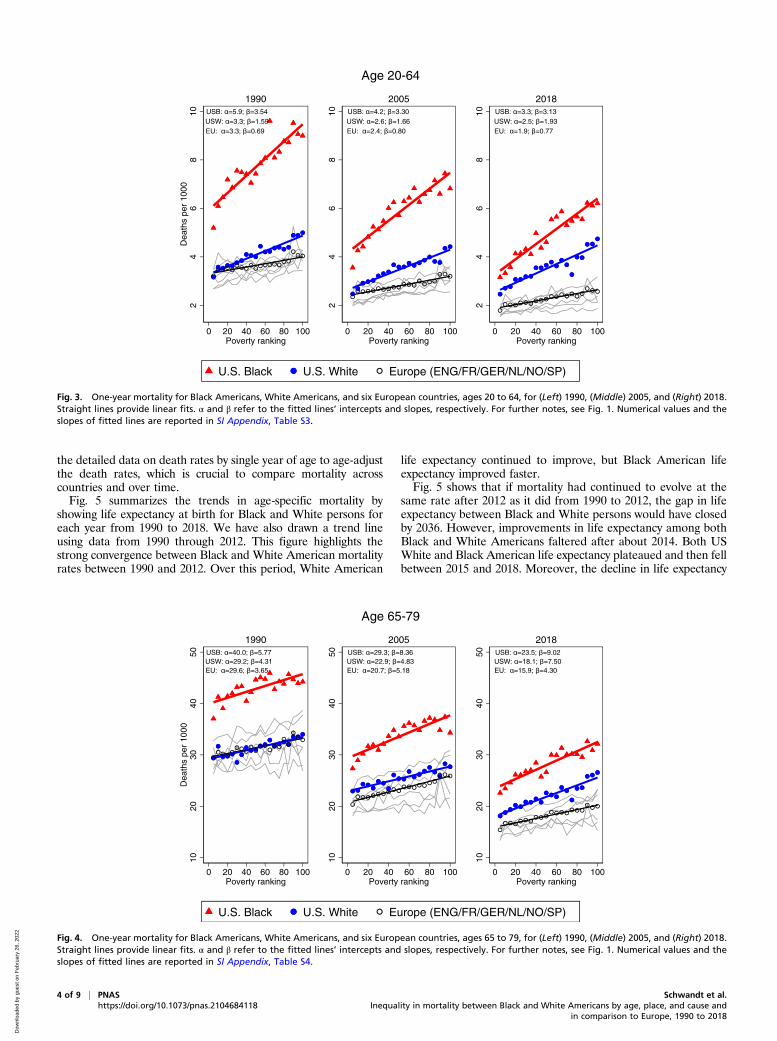
The biggest difference is that even in 1990, White mortality ratesfor children aged 5 to 19 were higher than European rates in allbut the highest-income US places. By 2005, the gap betweenEuropean children and White American children had becomewider than the gap between Black and White American children,which suggests that all American children in this age groupsuffered high levels of mortality relative to the lower potentialmortality rates implied by the European baseline.Fig. 3 shows trends in mortality for adults aged 20 to 64. (See
SI Appendix for a further split into ages 20 to 49 and 50 to 64.)Focusing first on the US story, the three panels show that Blackand White prime-age adult mortality (aged 20 to 64) convergedsharply over time driven primarily by a rapid fall in Black mortality,especially in the lowest-income areas. In the highest-income areasof the United States, the gap in Black–White American death rateshad fallen to 0.7 deaths per 1,000 by 2018, while in lower-incomeplaces it was still 1.47 (SI Appendix, Table S3). The comparisonwith Europe is striking. In 1990 and in 2005, White Americans inthe highest-income area had mortality rates very similar to Eu-ropeans, while Black Americans suffered much higher mortalityeven in high-income areas. By 2018, European mortality rateswere uniformly lower: the gap between Europeans and WhiteAmericans was generally larger than the gap between White andBlack Americans. In large part this pattern is due to stagnation inUS White mortality rates. The lower European mortality rates
2 of 9 | PNAS Schwandt et al.https://doi.org/10.1073/pnas.2104684118 Inequality in mortality between Black and White Americans by age, place, and cause and
in comparison to Europe, 1990 to 2018
Dow
nloa
ded
by g
uest
on
Feb
ruar
y 26
, 202
2
show the trajectory that might have been possible in a high-incomecountry like the United States.Fig. 4 shows trends for older adults (aged 65 to 79). This figure
shows that mortality declined for both Black and White older adultsin high- and low-income areas of the United States. Nevertheless, inthe lowest-income areas, White American older adults went from
having essentially the same mortality rates as Europeans in 1990 tohaving significantly higher rates in 2018: 27 per 1,000 in the UnitedStates compared to 20 per 1,000 in Europe. The mortality rate forBlack American older adults aged 65 to 79 in low-income areaswas even higher in 2018, at 32 per 1,000. We do not showmortalitytrends for adults older than age 80. For this group, we are lacking
USB: =3.8; =0.68USW: =1.5; =0.68EU: =1.5; =0.29
02
46
Dea
ths
per
1000
0 20 40 60 80 100Poverty ranking
1990 USB: =2.5; =0.83USW: =1.2; =0.39EU: =0.9; =0.30
02
46
0 20 40 60 80 100Poverty ranking
2005 USB: =1.8; =1.01USW: =0.9; =0.41EU: =0.6; =0.16
02
46
0 20 40 60 80 100Poverty ranking
2018
Age 0-4
U.S. Black U.S. White Europe (ENG/FR/GER/NL/NO/SP)
Fig. 1. One-year mortality for Black Americans, White Americans, and six European countries, ages 0 to 4, for (Left) 1990, (Middle) 2005, and (Right) 2018.Average 1-y mortality rates are plotted across poverty rate percentiles. For US Black (USB) and US White (USW) mortality, each bin represents a group ofcounties with about 5% of the overall population in the respective year. Black circles show population-weighted average mortality rates across England(ENG), France (FR), Germany (GER), the Netherlands (NL), Norway (NO), and Spain (SP), and each circle represents a group of municipalities or districtsrepresenting 5% of the overall population of each country in the respective year. Gray lines show mortality for each European country (see SI Appendix, Figs.S5–S9 for colorized figures with an extended set of European countries). Germany and Spain are included with 2016 data in Right. Straight lines provide linearfits. α and β refer to the fitted lines’ intercepts and slopes, respectively. Additional numerical values are reported in SI Appendix, Table S1.
USB: =0.5; =0.34USW: =0.3; =0.21EU: =0.3; =0.04
0.2
.4.6
.8D
eath
s pe
r 10
00
0 20 40 60 80 100Poverty ranking
1990 USB: =0.3; =0.18USW: =0.2; =0.12EU: =0.2; =0.06
0.2
.4.6
.8
0 20 40 60 80 100Poverty ranking
2005 USB: =0.3; =0.21USW: =0.2; =0.07EU: =0.1; =0.01
0.2
.4.6
.8
0 20 40 60 80 100Poverty ranking
2018
Age 5-19
U.S. Black U.S. White Europe (ENG/FR/GER/NL/NO/SP)
Fig. 2. One-year mortality for Black Americans, White Americans, and six European countries, ages 5 to 19, for (Left) 1990, (Middle) 2005, and (Right) 2018.Straight lines provide linear fits. α and β refer to the fitted lines’ intercepts and slopes, respectively. For further notes, see Fig. 1. Numerical values and theslopes of fitted lines are reported in SI Appendix, Table S2.
Schwandt et al. PNAS | 3 of 9Inequality in mortality between Black and White Americans by age, place, and cause andin comparison to Europe, 1990 to 2018
https://doi.org/10.1073/pnas.2104684118
ECONOMIC
SCIENCE
S
Dow
nloa
ded
by g
uest
on
Feb
ruar
y 26
, 202
2
the detailed data on death rates by single year of age to age-adjustthe death rates, which is crucial to compare mortality acrosscountries and over time.Fig. 5 summarizes the trends in age-specific mortality by
showing life expectancy at birth for Black and White persons foreach year from 1990 to 2018. We have also drawn a trend lineusing data from 1990 through 2012. This figure highlights thestrong convergence between Black and White American mortalityrates between 1990 and 2012. Over this period, White American
life expectancy continued to improve, but Black American lifeexpectancy improved faster.Fig. 5 shows that if mortality had continued to evolve at the
same rate after 2012 as it did from 1990 to 2012, the gap in lifeexpectancy between Black and White persons would have closedby 2036. However, improvements in life expectancy among bothBlack and White Americans faltered after about 2014. Both USWhite and Black American life expectancy plateaued and then fellbetween 2015 and 2018. Moreover, the decline in life expectancy
USB: =5.9; =3.54USW: =3.3; =1.59EU: =3.3; =0.69
24
68
10D
eath
s pe
r 10
00
0 20 40 60 80 100Poverty ranking
1990 USB: =4.2; =3.30USW: =2.6; =1.66EU: =2.4; =0.80
24
68
100 20 40 60 80 100
Poverty ranking
2005 USB: =3.3; =3.13USW: =2.5; =1.93EU: =1.9; =0.77
24
68
10
0 20 40 60 80 100Poverty ranking
2018
Age 20-64
U.S. Black U.S. White Europe (ENG/FR/GER/NL/NO/SP)
Fig. 3. One-year mortality for Black Americans, White Americans, and six European countries, ages 20 to 64, for (Left) 1990, (Middle) 2005, and (Right) 2018.Straight lines provide linear fits. α and β refer to the fitted lines’ intercepts and slopes, respectively. For further notes, see Fig. 1. Numerical values and theslopes of fitted lines are reported in SI Appendix, Table S3.
USB: =40.0; =5.77USW: =29.2; =4.31EU: =29.6; =3.65
1020
3040
50D
eath
s pe
r 10
00
0 20 40 60 80 100Poverty ranking
1990 USB: =29.3; =8.36USW: =22.9; =4.83EU: =20.7; =5.18
1020
3040
50
0 20 40 60 80 100Poverty ranking
2005 USB: =23.5; =9.02USW: =18.1; =7.50EU: =15.9; =4.30
1020
3040
50
0 20 40 60 80 100Poverty ranking
2018
Age 65-79
U.S. Black U.S. White Europe (ENG/FR/GER/NL/NO/SP)
Fig. 4. One-year mortality for Black Americans, White Americans, and six European countries, ages 65 to 79, for (Left) 1990, (Middle) 2005, and (Right) 2018.Straight lines provide linear fits. α and β refer to the fitted lines’ intercepts and slopes, respectively. For further notes, see Fig. 1. Numerical values and theslopes of fitted lines are reported in SI Appendix, Table S4.
4 of 9 | PNAS Schwandt et al.https://doi.org/10.1073/pnas.2104684118 Inequality in mortality between Black and White Americans by age, place, and cause and
in comparison to Europe, 1990 to 2018
Dow
nloa
ded
by g
uest
on
Feb
ruar
y 26
, 202
2
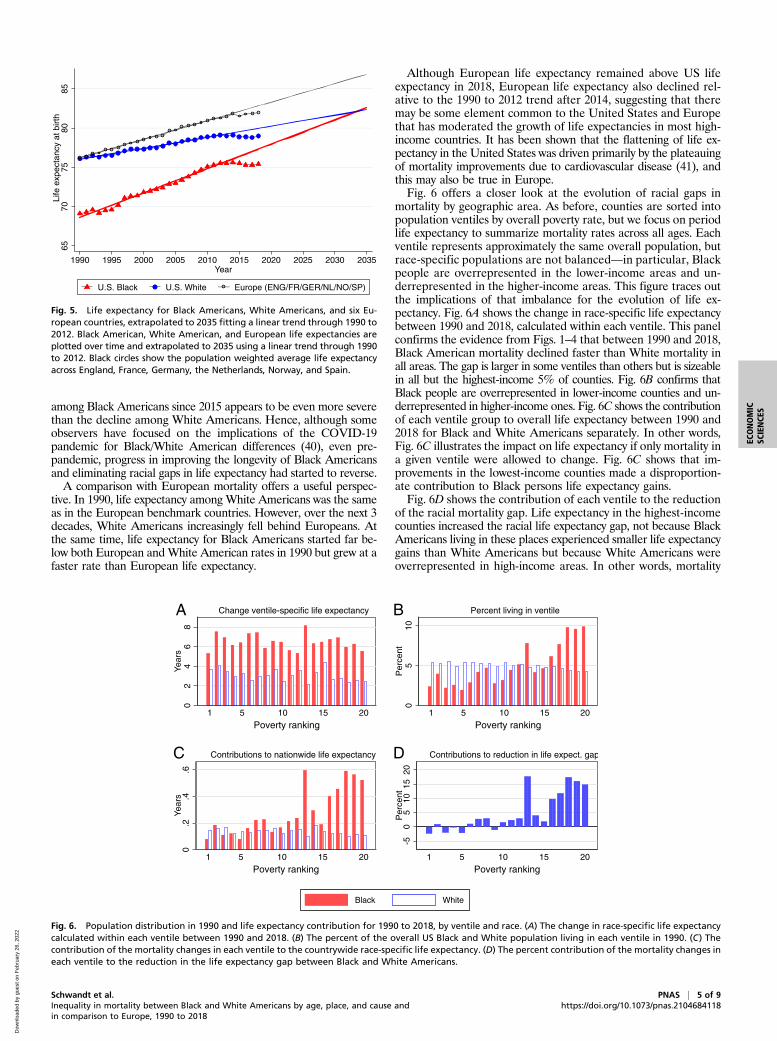
among Black Americans since 2015 appears to be even more severethan the decline among White Americans. Hence, although someobservers have focused on the implications of the COVID-19pandemic for Black/White American differences (40), even pre-pandemic, progress in improving the longevity of Black Americansand eliminating racial gaps in life expectancy had started to reverse.A comparison with European mortality offers a useful perspec-
tive. In 1990, life expectancy among White Americans was the sameas in the European benchmark countries. However, over the next 3decades, White Americans increasingly fell behind Europeans. Atthe same time, life expectancy for Black Americans started far be-low both European andWhite American rates in 1990 but grew at afaster rate than European life expectancy.
Although European life expectancy remained above US lifeexpectancy in 2018, European life expectancy also declined rel-ative to the 1990 to 2012 trend after 2014, suggesting that theremay be some element common to the United States and Europethat has moderated the growth of life expectancies in most high-income countries. It has been shown that the flattening of life ex-pectancy in the United States was driven primarily by the plateauingof mortality improvements due to cardiovascular disease (41), andthis may also be true in Europe.Fig. 6 offers a closer look at the evolution of racial gaps in
mortality by geographic area. As before, counties are sorted intopopulation ventiles by overall poverty rate, but we focus on periodlife expectancy to summarize mortality rates across all ages. Eachventile represents approximately the same overall population, butrace-specific populations are not balanced—in particular, Blackpeople are overrepresented in the lower-income areas and un-derrepresented in the higher-income areas. This figure traces outthe implications of that imbalance for the evolution of life ex-pectancy. Fig. 6A shows the change in race-specific life expectancybetween 1990 and 2018, calculated within each ventile. This panelconfirms the evidence from Figs. 1–4 that between 1990 and 2018,Black American mortality declined faster than White mortality inall areas. The gap is larger in some ventiles than others but is sizeablein all but the highest-income 5% of counties. Fig. 6B confirms thatBlack people are overrepresented in lower-income counties and un-derrepresented in higher-income ones. Fig. 6C shows the contributionof each ventile group to overall life expectancy between 1990 and2018 for Black and White Americans separately. In other words,Fig. 6C illustrates the impact on life expectancy if only mortality ina given ventile were allowed to change. Fig. 6C shows that im-provements in the lowest-income counties made a disproportion-ate contribution to Black persons life expectancy gains.Fig. 6D shows the contribution of each ventile to the reduction
of the racial mortality gap. Life expectancy in the highest-incomecounties increased the racial life expectancy gap, not because BlackAmericans living in these places experienced smaller life expectancygains than White Americans but because White Americans wereoverrepresented in high-income areas. In other words, mortality
6570
7580
85Li
fe e
xpec
tanc
y at
birt
h
1990 1995 2000 2005 2010 2015 2020 2025 2030 2035Year
U.S. Black U.S. White Europe (ENG/FR/GER/NL/NO/SP)
Fig. 5. Life expectancy for Black Americans, White Americans, and six Eu-ropean countries, extrapolated to 2035 fitting a linear trend through 1990 to2012. Black American, White American, and European life expectancies areplotted over time and extrapolated to 2035 using a linear trend through 1990to 2012. Black circles show the population weighted average life expectancyacross England, France, Germany, the Netherlands, Norway, and Spain.
02
46
8Ye
ars
1 5 10 15 20
Poverty ranking
05
10P
erce
nt
1 5 10 15 20
Poverty ranking
0.2
.4.6
Year
s
1 5 10 15 20
Poverty ranking
-50
510
1520
Per
cent
1 5 10 15 20
Poverty ranking
Black White
A B
DC
Fig. 6. Population distribution in 1990 and life expectancy contribution for 1990 to 2018, by ventile and race. (A) The change in race-specific life expectancycalculated within each ventile between 1990 and 2018. (B) The percent of the overall US Black and White population living in each ventile in 1990. (C) Thecontribution of the mortality changes in each ventile to the countrywide race-specific life expectancy. (D) The percent contribution of the mortality changes ineach ventile to the reduction in the life expectancy gap between Black and White Americans.
Schwandt et al. PNAS | 5 of 9Inequality in mortality between Black and White Americans by age, place, and cause andin comparison to Europe, 1990 to 2018
https://doi.org/10.1073/pnas.2104684118
ECONOMIC
SCIENCE
S
Dow
nloa
ded
by g
uest
on
Feb
ruar
y 26
, 202
2
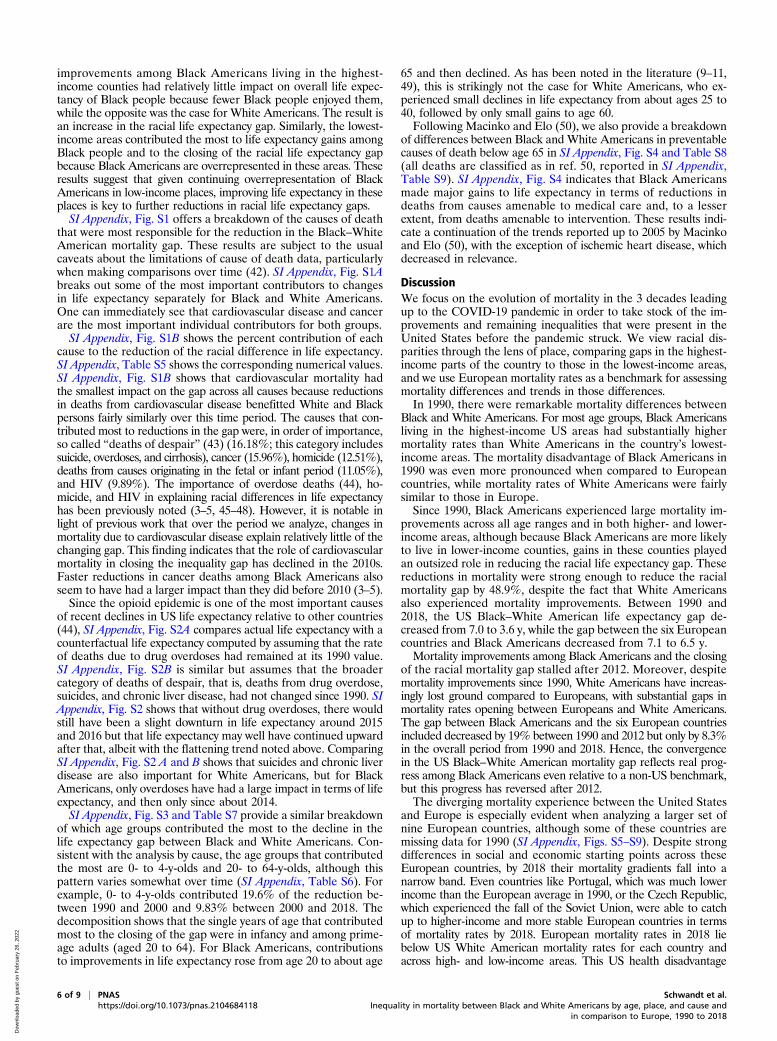
improvements among Black Americans living in the highest-income counties had relatively little impact on overall life expec-tancy of Black people because fewer Black people enjoyed them,while the opposite was the case for White Americans. The result isan increase in the racial life expectancy gap. Similarly, the lowest-income areas contributed the most to life expectancy gains amongBlack people and to the closing of the racial life expectancy gapbecause Black Americans are overrepresented in these areas. Theseresults suggest that given continuing overrepresentation of BlackAmericans in low-income places, improving life expectancy in theseplaces is key to further reductions in racial life expectancy gaps.SI Appendix, Fig. S1 offers a breakdown of the causes of death
that were most responsible for the reduction in the Black–WhiteAmerican mortality gap. These results are subject to the usualcaveats about the limitations of cause of death data, particularlywhen making comparisons over time (42). SI Appendix, Fig. S1Abreaks out some of the most important contributors to changesin life expectancy separately for Black and White Americans.One can immediately see that cardiovascular disease and cancerare the most important individual contributors for both groups.SI Appendix, Fig. S1B shows the percent contribution of each
cause to the reduction of the racial difference in life expectancy.SI Appendix, Table S5 shows the corresponding numerical values.SI Appendix, Fig. S1B shows that cardiovascular mortality hadthe smallest impact on the gap across all causes because reductionsin deaths from cardiovascular disease benefitted White and Blackpersons fairly similarly over this time period. The causes that con-tributed most to reductions in the gap were, in order of importance,so called “deaths of despair” (43) (16.18%; this category includessuicide, overdoses, and cirrhosis), cancer (15.96%), homicide (12.51%),deaths from causes originating in the fetal or infant period (11.05%),and HIV (9.89%). The importance of overdose deaths (44), ho-micide, and HIV in explaining racial differences in life expectancyhas been previously noted (3–5, 45–48). However, it is notable inlight of previous work that over the period we analyze, changes inmortality due to cardiovascular disease explain relatively little of thechanging gap. This finding indicates that the role of cardiovascularmortality in closing the inequality gap has declined in the 2010s.Faster reductions in cancer deaths among Black Americans alsoseem to have had a larger impact than they did before 2010 (3–5).Since the opioid epidemic is one of the most important causes
of recent declines in US life expectancy relative to other countries(44), SI Appendix, Fig. S2A compares actual life expectancy with acounterfactual life expectancy computed by assuming that the rateof deaths due to drug overdoses had remained at its 1990 value.SI Appendix, Fig. S2B is similar but assumes that the broadercategory of deaths of despair, that is, deaths from drug overdose,suicides, and chronic liver disease, had not changed since 1990. SIAppendix, Fig. S2 shows that without drug overdoses, there wouldstill have been a slight downturn in life expectancy around 2015and 2016 but that life expectancy may well have continued upwardafter that, albeit with the flattening trend noted above. ComparingSI Appendix, Fig. S2 A and B shows that suicides and chronic liverdisease are also important for White Americans, but for BlackAmericans, only overdoses have had a large impact in terms of lifeexpectancy, and then only since about 2014.SI Appendix, Fig. S3 and Table S7 provide a similar breakdown
of which age groups contributed the most to the decline in thelife expectancy gap between Black and White Americans. Con-sistent with the analysis by cause, the age groups that contributedthe most are 0- to 4-y-olds and 20- to 64-y-olds, although thispattern varies somewhat over time (SI Appendix, Table S6). Forexample, 0- to 4-y-olds contributed 19.6% of the reduction be-tween 1990 and 2000 and 9.83% between 2000 and 2018. Thedecomposition shows that the single years of age that contributedmost to the closing of the gap were in infancy and among prime-age adults (aged 20 to 64). For Black Americans, contributionsto improvements in life expectancy rose from age 20 to about age
65 and then declined. As has been noted in the literature (9–11,49), this is strikingly not the case for White Americans, who ex-perienced small declines in life expectancy from about ages 25 to40, followed by only small gains to age 60.Following Macinko and Elo (50), we also provide a breakdown
of differences between Black and White Americans in preventablecauses of death below age 65 in SI Appendix, Fig. S4 and Table S8(all deaths are classified as in ref. 50, reported in SI Appendix,Table S9). SI Appendix, Fig. S4 indicates that Black Americansmade major gains to life expectancy in terms of reductions indeaths from causes amenable to medical care and, to a lesserextent, from deaths amenable to intervention. These results indi-cate a continuation of the trends reported up to 2005 by Macinkoand Elo (50), with the exception of ischemic heart disease, whichdecreased in relevance.
DiscussionWe focus on the evolution of mortality in the 3 decades leadingup to the COVID-19 pandemic in order to take stock of the im-provements and remaining inequalities that were present in theUnited States before the pandemic struck. We view racial dis-parities through the lens of place, comparing gaps in the highest-income parts of the country to those in the lowest-income areas,and we use European mortality rates as a benchmark for assessingmortality differences and trends in those differences.In 1990, there were remarkable mortality differences between
Black and White Americans. For most age groups, Black Americansliving in the highest-income US areas had substantially highermortality rates than White Americans in the country’s lowest-income areas. The mortality disadvantage of Black Americans in1990 was even more pronounced when compared to Europeancountries, while mortality rates of White Americans were fairlysimilar to those in Europe.Since 1990, Black Americans experienced large mortality im-
provements across all age ranges and in both higher- and lower-income areas, although because Black Americans are more likelyto live in lower-income counties, gains in these counties playedan outsized role in reducing the racial life expectancy gap. Thesereductions in mortality were strong enough to reduce the racialmortality gap by 48.9%, despite the fact that White Americansalso experienced mortality improvements. Between 1990 and2018, the US Black–White American life expectancy gap de-creased from 7.0 to 3.6 y, while the gap between the six Europeancountries and Black Americans decreased from 7.1 to 6.5 y.Mortality improvements among Black Americans and the closing
of the racial mortality gap stalled after 2012. Moreover, despitemortality improvements since 1990, White Americans have increas-ingly lost ground compared to Europeans, with substantial gaps inmortality rates opening between Europeans and White Americans.The gap between Black Americans and the six European countriesincluded decreased by 19% between 1990 and 2012 but only by 8.3%in the overall period from 1990 and 2018. Hence, the convergencein the US Black–White American mortality gap reflects real prog-ress among Black Americans even relative to a non-US benchmark,but this progress has reversed after 2012.The diverging mortality experience between the United States
and Europe is especially evident when analyzing a larger set ofnine European countries, although some of these countries aremissing data for 1990 (SI Appendix, Figs. S5–S9). Despite strongdifferences in social and economic starting points across theseEuropean countries, by 2018 their mortality gradients fall into anarrow band. Even countries like Portugal, which was much lowerincome than the European average in 1990, or the Czech Republic,which experienced the fall of the Soviet Union, were able to catchup to higher-income and more stable European countries in termsof mortality rates by 2018. European mortality rates in 2018 liebelow US White American mortality rates for each country andacross high- and low-income areas. This US health disadvantage
6 of 9 | PNAS Schwandt et al.https://doi.org/10.1073/pnas.2104684118 Inequality in mortality between Black and White Americans by age, place, and cause and
in comparison to Europe, 1990 to 2018
Dow
nloa
ded
by g
uest
on
Feb
ruar
y 26
, 202
2
even among economically advantaged groups in high-income USlocations has also been shown for a broad set of health conditions(51, 52).Another remarkable observation is how flat mortality gradients
are at younger ages across all European countries. This patternshows that health improvements among infants, children, and youthhave been disseminated within European countries in a way thatincludes even the lowest-income areas. It suggests that there is greatpotential for disadvantaged infants, children, and youth living inlower-income US areas to catch up to European standards.Focusing on the disparity between Black and White Americans,
we show that improvements in Black Americans’ relative to WhiteAmericans’ life expectancy in the lowest-income counties had thegreatest impact in narrowing the gap overall. In terms of mortalitycauses driving these improvements, greater reductions in Blackrelative to White American death rates due to cancer, homicide,HIV, and causes originating in the fetal or infant period had thelargest impacts, while smaller increases in Black American com-pared to White American deaths of despair also closed the gap.Consistent with the importance of these causes, we find that rapidreductions in Black relative to White American deaths in earlychildhood and prime-aged adults (aged 20 to 64) accounted forthe majority of the closure of the gap. Consistent once again withthe importance of these causes (49), deaths due to causes amenableto medical care showed greater reductions for Black Americansrelative to White Americans, greatly contributing to the closure ofthe gap in life expectancy. Reductions in causes amenable to in-tervention also played an important role, in line with prior re-search studying longitudinal racial disparities in more nuancedhealth indicators (53).Many authors have commented on the role of systemic racism
in shortening Black relative to White American life expectanciesin the United States (54–56). Unpacking some of the dimensionsof racism suggests that there are many possible reasons for thesebroad improvements in the health of Black Americans. The literatureon the relationship between education and health suggests thatimprovements in the quantity and quality of education availableto Black children and young adults over the past decades is onepossible contributor to improved longevity and reduced gaps inlife expectancy spread broadly over prime-aged adults (aged 20to 64) (57, 58). Our results suggest that improvements in theavailability of medical care are also likely to have been importantin reducing racial disparities in mortality (59). Health care de-velopments that may have been particularly important includeexpansions of the Medicaid program to cover pregnant womenand children starting in the 1990s, which likely account for muchof the improvement among infants (60), as well as improvedaccess to treatment for cancer and HIV. Long-term health ef-fects of access to Medicaid as well as other safety net programssuch as food stamps and the Earned Income Tax Credit may alsobe an important contributor to mortality reductions (61). Re-ductions in pollution may have played a role given that BlackAmericans are more likely than White Americans to live inmore-polluted areas (62–64).Despite the strong mortality improvements among Black
Americans over the past 3 decades, a dramatic gap remains, andthis gap has increased again in recent years. It is important tounderstand which medical, social, and policy developments helpedto increase the longevity of Black Americans through 2012 andhow these positive changes can be reinforced over the comingdecades with the ultimate goal of fully closing the racial longevitygap in the United States. Moreover, the comparisons with Europesuggest that mortality rates of both Black and White Americanscould fall much further across all ages and across higher- andlower-income areas.
Materials and MethodsUS Mortality. US Black andWhite American mortality rates are constructed bydividing death counts by population estimates for single years of age, county,and calendar year. Death counts come from the US Vital Statistics mortalityfiles, while population estimates are providedby theNational Center for HealthStatistics (NCHS). The NCHS estimates are “bridged”; that is, they convertmultiple race categories reported in the 2000 and 2010 Censuses back to singlerace categories comparable with those reported on the death certificates.Throughout the paper, “Black” populations include both non-Hispanic andHispanic Black persons, while “White” populations include both non-Hispanicand Hispanic White persons. Neither race group includes American Indian andAlaska Native, Asian, or Native Hawaiian and Other Pacific Islander (the NCHSnotes that these race categories “represent a social-political construct and arenot anthropologically or biologically based”) (65). Mortality rates spanningmultiple years of age are age-adjusted using the 2015 US population. We age-adjust because in an age bracket such as ages 65 to 79, a group with more79-y-olds would be expected to have higher mortality.
US Poverty Ranking. As in ref. 25, we rank counties by their poverty rate andplace them into groups of fixed population size. This allows us to analyzetrends in age-specific mortality across areas ranked by an area’s poverty ratewhile taking into account population shifts across areas. We rank all UScounties in 1990, 2005, and 2018 by their poverty level and then divide theminto 20 groups, each representing roughly 5% of the overall US population.This way we can compare, for example, the 5% of the population living inthe lowest-income counties in 1990 with the 5% of the population living inthe highest-income counties in 1990 and analyze how the mortality differ-ences between these groups change over time. We refer to the countygroups with the highest (lowest) fractions of their populations in poverty asthe lowest-income (highest-income) counties. Our approach reassigns countygroups in 1990, 2005, and 2018 to adjust for changes in county ranking andpopulation size. Poverty rates are taken from the 1990 and 2000 Censusesand the 2014 to 2018 American Community Survey 5-y sample andinterpolated for intermediate years.
European Mortality. Data for nine European countries (Czech Republic,England, Finland, France, Germany, the Netherlands, Norway, Portugal, andSpain) come from the Institute for Fiscal Studies (IFS) project on GeographicApproaches to Inequalities in Mortality (66) and are treated similarly. Ad-ditional details on data sources are provided in SI Appendix.
Figs. 1–4 include the six European countries that provide consistentmortality data from 1990 onward (England, France, Germany, the Nether-lands, Norway, and Spain). Figs. 1–4 include a mean Europe mortality rate,representing the population-weighted average of mortality rates acrossthese countries in each ventile. SI Appendix, Figs. S5–S9 show analogousfigures using all nine of the European countries in the IFS study. See SIAppendix for further information about these countries.
Mortality rates across all countries and years are age-adjusted using the2015 US population, based on 5-y age groups. The following describes therespective area definitions, ranking measures, and available data yearsfor each of the European countries included in Figs. 1–4: England, localauthorities ranked by a deprivation index, for 1992 to 2017; France,départements ranked by poverty rate, for 1990 to 2018; Germany, dis-tricts ranked by per-capita income in 1990, 2005, and 2016 (1990 excludesEast Germany because of the exceptionally high mortality in East Ger-many around the time of reunification); the Netherlands, municipalitiesranked by poverty rate, 1995, 2005, and 2016; Norway, municipalitiesranked by poverty rate, 1990 to 2018; and Spain, municipalities ranked bymedian income, 1990 to 2016. Further details on area definitions and thepoverty or deprivation variables used for ranking areas can be found inref. 51.
Life Expectancy Data. We construct US Black and White American life ex-pectancy at birth based on 1-y mortality rates for the years 1990 to 2018. TheHuman Mortality Database (67) provides life expectancy estimates for theEuropean countries in our study, while life expectancy estimates for Englandare provided by the United Kingdom Office for National Statistics.
Decompositions. We offer breakdowns of the contributions of location, age,and cause of death to Black and White American life expectancy and to theclosing of the racial mortality gap. Each breakdown is based on asking howlife expectancy would have changed if all other factors besides the one beingconsidered had remained constant at their 1990 levels. For example, we askhow life expectancy would have changed between 1990 and 2018 if only the
Schwandt et al. PNAS | 7 of 9Inequality in mortality between Black and White Americans by age, place, and cause andin comparison to Europe, 1990 to 2018
https://doi.org/10.1073/pnas.2104684118
ECONOMIC
SCIENCE
S
Dow
nloa
ded
by g
uest
on
Feb
ruar
y 26
, 202
2
homicide rate had fallen while all other causes remained at their 1990 values.In all cases, this hypothetical exercise is conducted separately for Black andWhite Americans. Letting only one mortality rate change while keepingall other rates constant understates the one rate’s overall contribution tolife expectancy if other rates also improved. The reason is that the lifeexpectancy formula interacts mortality rates at all ages. For example, ahigher survival rate in old age makes improvements in infant mortalitymore valuable and vice versa. Our hypothetical life expectancy measureignores interaction effects because they cannot be assigned to a specificage. Hence, our results should be interpreted as the partial effect ofa given factor, which is sometimes referred to as the exclusive life ex-pectancy impact of an age-specific effect (68). For further details, seeSI Appendix.
Data Availability.All datasets used in this study are publicly available online orcan be obtained from the National Vital Statistics offices. See SI Appendix,section C, for additional details and download links.
ACKNOWLEDGMENTS. We thank J.B., S.K., and K.G.S. for organizing the IFSworking group on geographical approaches to measuring inequality in mortal-ity, with financial support from the Economic and Social Research Council Centrefor the Microeconomic Analysis of Public Policy at IFS (Grant ES/T014334/1). C.C.received support from the Science and Technology Foundation (Fundação para aCiência e a Tecnologia [FCT]), the European Social Fund, and the Centro Oper-ational Programme (Grant SFRH/BD/132218/2017). P.S. received support from theCentre of Studies in Geography and Spatial Planning (Grant UIDB/04084/2020),through an FCT fund.
1. C. J. L. Murray et al., Eight Americas: Investigating mortality disparities across races,counties, and race-counties in the United States. PLoS Med. 3, e260 (2006).
2. M. S. Shiels et al., Trends in premature mortality in the USA by sex, race, and ethnicityfrom 1999 to 2014: An analysis of death certificate data. Lancet 389, 1043–1054(2017).
3. S. Harper, J. Lynch, S. Burris, G. Davey Smith, Trends in the black-white life expectancygap in the United States, 1983–2003. JAMA 297, 1224–1232 (2007).
4. N. E. Adler, D. H. Rehkopf, U.S. disparities in health: Descriptions, causes, and mech-anisms. Annu. Rev. Public Health 29, 235–252 (2008).
5. S. Harper, D. Rushani, J. S. Kaufman, Trends in the black-white life expectancy gap,2003-2008. JAMA 307, 2257–2259 (2012).
6. J. Currie, H. Schwandt, Mortality inequality: The good news from a county-level ap-proach. J. Econ. Perspect. 30, 29–52 (2016).
7. A. Case, A. Deaton, Life expectancy in adulthood is falling for those without a BAdegree, but as educational gaps have widened, racial gaps have narrowed. Proc. Natl.Acad. Sci. U.S.A. 118, e2024777118 (2021).
8. B. Bosworth, K. Zhang, Evidence of increasing differential mortality: A comparison ofthe HRS and SIPP. SSRN [Preprint] (2015). https://doi.org/10.2139/ssrn.2625792(Accessed 14 September 2021).
9. A. Case, A. Deaton, Rising morbidity and mortality in midlife among white non-Hispanic Americans in the 21st century. Proc. Natl. Acad. Sci. U.S.A. 112, 15078–15083(2015).
10. A. Case, A. Deaton, Mortality and morbidity in the 21st century. Brookings Pap. Econ.Act. 2017, 397–476 (2017).
11. A. Case, A. Deaton, Deaths of Despair and the Future of Capitalism (Princeton Uni-versity Press, 2020).
12. R. Chetty et al., The association between income and life expectancy in the UnitedStates, 2001–2014. JAMA 315, 1750–1766 (2016).
13. D. M. Cutler, F. Lange, E. Meara, S. Richards-Shubik, C. J. Ruhm, Rising educationalgradients in mortality: The role of behavioral risk factors. J. Health Econ. 30,1174–1187 (2011).
14. E. R. Meara, S. Richards, D. M. Cutler, The gap gets bigger: Changes in mortality andlife expectancy, by education, 1981–2000. Health Aff. (Millwood) 27, 350–360(2008).
15. J. K. Montez, L. F. Berkman, Trends in the educational gradient of mortality amongUS adults aged 45 to 84 years: Bringing regional context into the explanation. Am.J. Public Health 104, e82–e90 (2014).
16. J. K. Montez, A. Zajacova, Explaining the widening education gap in mortality amongU.S. white women. J. Health Soc. Behav. 54, 166–182 (2013).
17. National Academies of Sciences, Engineering, and Medicine et al., The Growing Gapin Life Expectancy by Income: Implications for Federal Programs and Policy Responses(National Academies Press, 2015).
18. S. J. Olshansky et al., Differences in life expectancy due to race and educational dif-ferences are widening, and many may not catch up. Health Aff. (Millwood) 31,1803–1813 (2012).
19. G. Pappas, S. Queen, W. Hadden, G. Fisher, The increasing disparity in mortality be-tween socioeconomic groups in the United States, 1960 and 1986. N. Engl. J. Med.329, 103–109 (1993).
20. J. Pijoan-Mas, J.-V. Ríos-Rull, Heterogeneity in expected longevities. Demography 51,2075–2102 (2014).
21. S. H. Preston, I. T. Elo, Are educational differentials in adult mortality increasing in theUnited States? J. Aging Health 7, 476–496 (1995).
22. H. Waldron, Mortality differentials by lifetime earnings decile: Implications forevaluations of proposed Social Security law changes. Soc. Secur. Bull. 73, 1–37(2013).
23. A. S. Venkataramani, R. O’Brien, A. C. Tsai, Declining life expectancy in the UnitedStates: The need for social policy as health policy. JAMA 325, 621–622 (2021).
24. M. Baker, J. Currie, H. Schwandt, Mortality inequality in Canada and the UnitedStates: Divergent or convergent trends? J. Labor Econ. 37, S325–S353 (2019).
25. J. Currie, H. Schwandt, Inequality in mortality decreased among the young whileincreasing for older adults, 1990–2010. Science 352, 708–712 (2016).
26. J. Currie, H. Schwandt, J. Thuilliez, Pauvreté, Egalité, Mortalité: Mortality (in)equalityin France and the United States. J. Popul. Econ. 33, 197–231 (2020).
27. M. Ezzati, A. B. Friedman, S. C. Kulkarni, C. J. L. Murray, The reversal of fortunes:Trends in county mortality and cross-county mortality disparities in the United States.PLoS Med. 5, e66 (2008).
28. N. Krieger et al., The fall and rise of US inequities in premature mortality: 1960–2002.PLoS Med. 5, e46 (2008).
29. H. Wang, A. E. Schumacher, C. E. Levitz, A. H. Mokdad, C. J. Murray, Left behind:Widening disparities for males and females in US county life expectancy, 1985–2010.Popul. Health Metr. 11, 8 (2013).
30. G. K. Singh, M. Siahpush, Widening socioeconomic inequalities in US life expectancy,1980-2000. Int. J. Epidemiol. 35, 969–979 (2006).
31. Y. C. Vierboom, S. H. Preston, A. S. Hendi, Rising geographic inequality in mortality inthe United States. SSM Popul. Health 9, 100478 (2019).
32. J. B. Dowd, A. Hamoudi, Is life expectancy really falling for groups of low socio-economic status? Lagged selection bias and artefactual trends in mortality. Int.J. Epidemiol. 43, 983–988 (2014).
33. A. S. Hendi, Trends in U.S. life expectancy gradients: The role of changing educationalcomposition. Int. J. Epidemiol. 44, 946–955 (2015).
34. T. Goldring, F. Lange, S. Richards-Shubik, Testing for changes in the SES-mortalitygradient when the distribution of education changes too. J. Health Econ. 46,120–130 (2016).
35. A. S. Hendi, I. T. Elo, P. Martikainen, The implications of changing education distri-butions for life expectancy gradients. Soc. Sci. Med. 272, 113712 (2021).
36. J. R. Wilmoth, C. Boe, M. Barbieri, “Geographic differences in life expectancy at age50 in the United States compared with other high-income countries” in InternationalDifferences in Mortality at Older Ages: Dimensions and Sources, E. M. Crimmins,S. H. Preston, B. Cohen, Eds. (The National Academies Press, 2010), pp. 333–366.
37. J. P. Mackenbach et al., Socioeconomic inequalities in health in 22 European coun-tries. N. Engl. J. Med. 358, 2468–2481 (2008).
38. J. P. Mackenbach et al., Changes in mortality inequalities over two decades: Registerbased study of European countries. BMJ 353, i1732 (2016).
39. J. Y. Ho, A. S. Hendi, Recent trends in life expectancy across high income countries:Retrospective observational study. BMJ 362, k2562 (2018).
40. T. Andrasfay, N. Goldman, Reductions in 2020 US life expectancy due to COVID-19and the disproportionate impact on the Black and Latino populations. Proc. Natl.Acad. Sci. U.S.A. 118, e2014746118 (2021).
41. N. K. Mehta, L. R. Abrams, M. Myrskylä, US life expectancy stalls due to cardiovasculardisease, not drug deaths. Proc. Natl. Acad. Sci. U.S.A. 117, 6998–7000 (2020).
42. I. T. Elo, G. L. Drevenstedt, Cause-specific contributions to black-white differences inmale mortality from 1960 to 1995. Demogr. Res. 2 (Special), 255–276 (2004).
43. A. Case, A. Deaton, Mortality and morbidity in the 21st century. Brookings Pap. Econ.Act. 2017, 397–476 (2017).
44. S. Harper, C. A. Riddell, N. B. King, Declining life expectancy in the United States:Missing the trees for the forest. Annu. Rev. Public Health 42, 381–403 (2021).
45. K. D. Kochanek, J. D. Maurer, H. M. Rosenberg, Why did black life expectancydecline from 1984 through 1989 in the United States? Am. J. Public Health 84,938–944 (1994).
46. M. Roberts, E. N. Reither, S. Lim, Contributors to the black-white life expectancy gapin Washington D.C. Sci. Rep. 10, 13416 (2020).
47. P. Sharkey, M. Friedson, The impact of the homicide decline on life expectancy ofAfrican American males. Demography 56, 645–663 (2019).
48. A. Leive, C. Ruhm, Education Gradients in Mortality Trends by Gender and Race(National Bureau of Economic Research, 2021).
49. I. T. Elo, A. S. Hendi, J. Y. Ho, Y. C. Vierboom, S. H. Preston, Trends in Non-HispanicWhite mortality in the United States by metropolitan-nonmetropolitan status andregion, 1990–2016. Popul. Dev. Rev. 45, 549–583 (2019).
50. J. Macinko, I. T. Elo, Black-white differences in avoidable mortality in the USA, 1980-2005. J. Epidemiol. Community Health 63, 715–721 (2009).
51. E. J. Emanuel et al., Comparing health outcomes of privileged US Citizens with thoseof average residents of other developed countries. JAMA Intern. Med. 181, 339–344(2021).
52. J. Banks, M. Marmot, Z. Oldfield, J. P. Smith, Disease and disadvantage in the UnitedStates and in England. JAMA 295, 2037–2045 (2006).
53. K. M. Harris, P. Gordon-Larsen, K. Chantala, J. R. Udry, Longitudinal trends in race/ethnic disparities in leading health indicators from adolescence to young adulthood.Arch. Pediatr. Adolesc. Med. 160, 74–81 (2006).
54. D. R. Williams, C. Collins, US socioeconomic and racial differences in health: Patternsand explanations. Annu. Rev. Sociol. 21, 349–386 (1995).
55. D. R. Williams, P. B. Jackson, Social sources of racial disparities in health. Health Aff.(Millwood) 24, 325–334 (2005).
56. J. C. Phelan, B. G. Link, Is racism a fundamental cause of inequalities in health? Annu.Rev. Sociol. 41, 311–330 (2015).
57. I. T. Elo, S. H. Preston, Educational differentials in mortality: United States, 1979-85.Soc. Sci. Med. 42, 47–57 (1996).
8 of 9 | PNAS Schwandt et al.https://doi.org/10.1073/pnas.2104684118 Inequality in mortality between Black and White Americans by age, place, and cause and
in comparison to Europe, 1990 to 2018
Dow
nloa
ded
by g
uest
on
Feb
ruar
y 26
, 202
2

58. D. Frisvold, E. Golberstein, The effect of school quality on black-white health differences:Evidence from segregated southern schools. Demography 50, 1989–2012 (2013).
59. A. Nelson, Unequal treatment: Confronting racial and ethnic disparities in healthcare. J. Natl. Med. Assoc. 94, 666–668 (2002).
60. A. D. Racine, R. Kaestner, T. J. Joyce, G. J. Colman, Differential impact of recentMedicaid expansions by race and ethnicity. Pediatrics 108, 1135–1142 (2001).
61. H. Hoynes, D. W. Schanzenbach, D. Almond, Long-run impacts of childhood access tothe safety net. Am. Econ. Rev. 106, 903–934 (2016).
62. J. Currie, J. Voorheis, R. Walker, What Caused Racial Disparities in Particulate Expo-sure to Fall?: New Evidence from the Clean Air Act and Satellite-based Measures ofAir Quality (National Bureau of Economic Research, 2020).
63. S. Banzhaf, L. Ma, C. Timmins, Environmental justice: The economics of race, place,and pollution. J. Econ. Perspect. 33, 185–208 (2019).
64. J. Currie, Inequality at birth: Some causes and consequences. Am. Econ. Rev. 101, 1–22(2011).
65. Centers for Disease Control and Prevention (CDC), Documentation for Bridged-RaceVintage 2006 (July 1, 2000 - July 1, 2006) Postcensal Population Estimates for Calcu-lating Vital Rates. https://wonder.cdc.gov/wonder/help/populations/bridged-race/Estimates2000-06.html. Accessed 14 September 2021.
66. J. Banks, J. Currie, S. Krutikova, K. G. Salvanes, H. Schwandt, The evolution ofmortality inequality in 11 OECD countries: Introduction. Fisc. Stud. 42, 9–23(2021).
67. M. Barbieri et al., Data resource profile: The human mortality database (HMD). Int.J. Epidemiol. 44, 1549–1556 (2015).
68. E. E. Arriaga, Measuring and explaining the change in life expectancies. Demography21, 83–96 (1984).
Schwandt et al. PNAS | 9 of 9Inequality in mortality between Black and White Americans by age, place, and cause andin comparison to Europe, 1990 to 2018
https://doi.org/10.1073/pnas.2104684118
ECONOMIC
SCIENCE
S
Dow
nloa
ded
by g
uest
on
Feb
ruar
y 26
, 202
2