Embed Size (px)
Citation preview

INF526: Secure Systems Administration
SIEM and Intrusion Detection
Prof. Clifford Neuman
Lecture 125 April 2017OHE100C

Class Presentation Schedule4/5 Mohammed Alsubaie – SIEM and Intrusion Detection4/12 Vishnu Vadlamani - Network Monitoring/Attack Forensics4/19 Andrew Gronski - Accreditation and acceptance testing
1

Detecting Intrusions
• Visibility of artifacts from intrusions– Passive attacks
• Difficult to detect because technically no changes made.– But in some cases – evidence of connecting to a network
might be present.– Honeytokens
– Intrusions are really all Active attacks• Identifying Subversions• Identifying traffic that is indicative of an intrusion
– Best point of observation is outside affected system
2

Where Detection Occurs
• Events visible in the network– New network peer entities is evidence– Significant change in frequency or bandwidth is evidence
• Events on the Compromised System– Changes to system binaries are evidence of subversion– Changes to accounts and privileges are evidence– Changes to the running processes and CPU share are
evidence– Creation of new files are evidence
• The above are anomalies and an administrators role is to sort though them.
3

Events Visible in the Network• Network Monitoring uses a system to monitor a computer
network for abnormalities and notifies an administrator or other system components when an issue is identified.– Enterprise health monitoring
• Network Monitoring tools allow usto see the devices connected toour network and traffic betweenthem.
• Packet analyzers can capture network traffic for viewing through an event management system.
• Such data is useful for intrusion detection.
4

Network Monitoring and Secure SA• Secure administration of a network and systems requires
visibility of current activities and status of devices, and the ability to examine past activities. In particular:– Ensures Availability is maintained
• Ability to correct system issues, and to identify potential DoS attacks– Ensures Non-Repudiation
• Gives administrator a history of who did what, and when• While not directly involved in enforcement, it also assists in
ensuring other principles (Integrity, Confidentiality, Authentication, Authorization) have not been breached.– Can identify suspicious activity that may indicate a security
compromise.
5
Slide by Josh McCameyINF526 Summer 2016
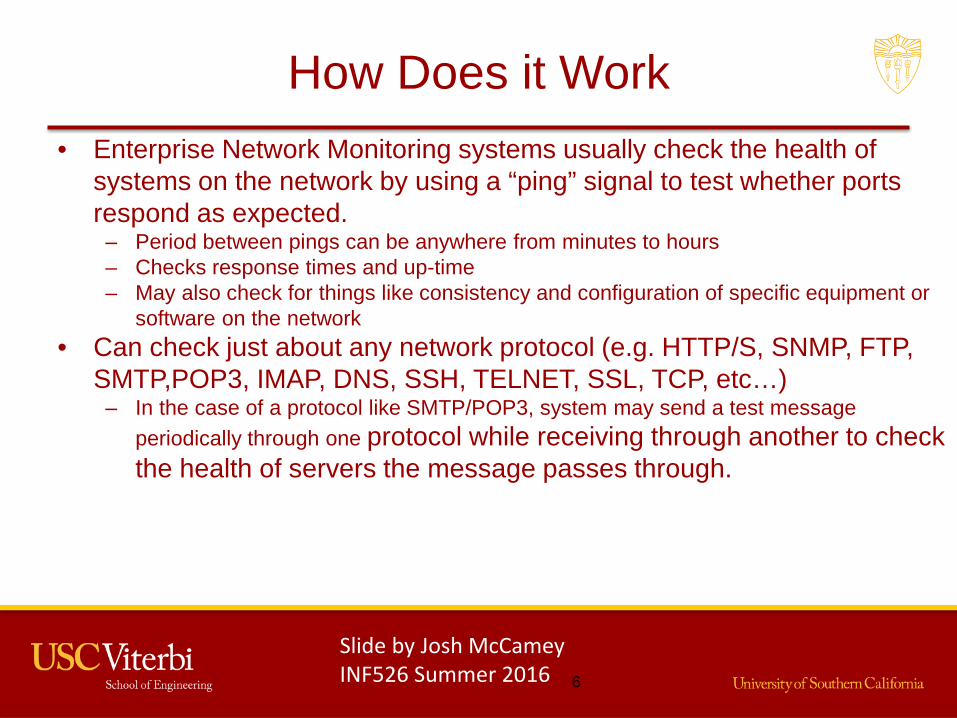
How Does it Work• Enterprise Network Monitoring systems usually check the health of
systems on the network by using a “ping” signal to test whether ports respond as expected.
– Period between pings can be anywhere from minutes to hours– Checks response times and up-time– May also check for things like consistency and configuration of specific equipment or
software on the network• Can check just about any network protocol (e.g. HTTP/S, SNMP, FTP,
SMTP,POP3, IMAP, DNS, SSH, TELNET, SSL, TCP, etc…)– In the case of a protocol like SMTP/POP3, system may send a test message
periodically through one protocol while receiving through another to check the health of servers the message passes through.
6
Slide by Josh McCameyINF526 Summer 2016

How Does it Work• A failure occurs when a test operation or “ping”
times out– When a failure is recorded the Network
Monitor produces an “action”– System can use any available means to
notify an administrator (e.g. e-mail, text,phone call, pop-up notification on localmachine, even an audible alarm)
• Advanced networks may have automaticfail-safes that off-load a server’s duty to therest of the network to make the failuretransparent to the user– This is critical for big companies/sites that can’t afford down-time.
7
Slide by Josh McCameyINF526 Summer 2016

How Does it Work
• Packet analyzers, on the other hand, capture packets going across an interface– Sometimes these are also called “packet sniffers”– Close relationship to forensics and intrusion detection– Can be used to determine the nature of connections and identify
malicious activity• Wide variety of visualization, recording and analysis
capabilities depending on thetool used• Packet analyzers and health monitors not
necessarily mutually exclusive– Many different tools, some can “do-it-all”, depending on your
definition of “all”
8
Slide by Josh McCameyINF526 Summer 2016

Common Tools(not a compressive list)
• ntop• Microsoft Message Analyzer• MRTG• PRTG• Nagios• OpenNMS• SolarWinds• Spiceworks IT Management• Advanced IP Scanner• Capsa• Fiddler
9
Slide by Josh McCameyINF526 Summer 2016
• NetworkMiner• Pandora FMS• Zenoss Core• The Dude• Splunk• Angry IP Scanner• Icinga• Total Network Monitor• NetXMS• Xymon• And… WIRESHARK

Microsoft Message Analyzer• Successor to Microsoft Network Monitor
– Free, 32-bit and 64-bit: Windows 7, Windows 8, Windows 8.1, Windows Server 2008 R2, Windows Server 2012, Windows Server 2012 R2, and Windows 10 clients
• Capture, display, and analyze protocol messaging traffic• Trace and assess system events and other messages from Windows
components• Main Features:
– Integrated “live” event and message capture at various system levels and endpoints– Parsing and validation of protocol messages and sequences– Automatic parsing of event messages described by ETW manifests– Summarized grid display – top level is “operations”, (requests matched with
responses)– User controlled “on the fly” grouping by message attributes– Ability to browse for logs of different types (.cap, .etl, .txt) and import them together– Automatic re-assembly and ability to render payloads– Ability to import text logs, parsing them into key element/value pairs– Support for “Trace Scenarios” (one or more message providers, filters, and views)
10
Slide by Josh McCameyINF526 Summer 2016

Microsoft Message Analyzer
11
Slide by Josh McCameyINF526 Summer 2016

Nagios Network Analyzer• Popular paid IT admin tool to monitor for configuration
issues, high load, etc.• Focused on high-level goals rather than low level packet
inspection– Netflow Analysis, Monitoring, and Bandwidth Utilization– Security and reliability monitoring and user notifications– Advanced visualization capabilities– Custom application monitoring– Bandwidth monitoring and threshold settings with alert capability– Advanced user management to allow for multi-tenancy
• Linux focused• Specialized versions for machines running in virtual
environments like VMWare
12
Slide by Josh McCameyINF526 Summer 2016

Nagios Network Analyzer
13
Slide by Josh McCameyINF526 Summer 2016

Open NMS• Free & open-source enterprise grade network monitoring & management tool• Runs on Linux/Win/Mac• “Network Management Application Platform”
– Made to be customized and have network monitoring solutions/applications built on top of it• Core feature set
– Java-based framework– API-extendable notification mechanism including SMTP, Slack & Mattermost, Jabber and XMPP,
Microblogs (i.e. Twitter)– Ticketing integration framework including Request Tracker, BMC Remedy, IBM Tivoli Service
Request Manager,– Atlassian JIRA, extensible ticketing API– Alarm forwarding to external applications for handling or analysis (ElasticSearch), “Northbound”
API and JMS,– AQMP integration– “Southbound integration” enables gathering of performance measurements and logging messages– from network applications and devices (test connections, check resource configurations, etc.)
14
Slide by Josh McCameyINF526 Summer 2016

Open NMS
15
Slide by Josh McCameyINF526 Summer 2016

NTopNG• Network traffic probe that shows network usage similar to Linux “top” command
– Full-featured network analysis tool, free & paid versions, Portable, made to run on any Unix platform (&Win x64)
– Uses a web server to provide a web browser interface– Sort network traffic according to many criteria including IP address, port, Layer 7 protocol (app
layer), throughput, and more– Show network traffic and IPv4/v6 active hosts.– Produce long-term reports about various network metrics such as throughput, application protocols– Top X talkers/listeners, top ASs, top Layer 7 applications– For each communication flow report network/application latency/round trip time (RTT), TCP stats
(retransmissions, packets OOO, packet lost), bytes/packets– Store on disk persistent traffic statistics in RRD format.– Geolocate hosts and display reports according to host location.– Discover application protocols by leveraging on nDPI, ntop’s DPI framework.– Characterise HTTP traffic by leveraging on characterisation services provided by Google and
HTTP Blacklist.– Show IP traffic distribution among the various protocols.– Analyse IP traffic and sort it according to the source/destination.– Display IP Traffic Subnet matrix (who’s talking to who?)– Report IP protocol usage sorted by protocol type.– Produce HTML5/AJAX network traffic statistics.
16
Slide by Josh McCameyINF526 Summer 2016

NTOP NG
17
Slide by Josh McCameyINF526 Summer 2016

Wireshark• World's foremost network protocol analyzer (self-claimed)
– - Deep inspection of hundreds of protocols, with more being added all the time– - Live capture and offline analysis– - Multi-platform: Runs on Windows, Linux, OS X, Solaris, FreeBSD, NetBSD, and many others– - Captured network data can be browsed via a GUI, or via the TTY-mode TShark utility– - Rich VoIP analysis– - Read/write many different capture file formats (too many to show here)– - Capture files compressed with gzip can be decompressed on the fly– - Live data can be read from Ethernet, IEEE 802.11, PPP/HDLC, ATM, Bluetooth, USB, Token
Ring, Frame Relay, FDDI, and more– - Decryption support for many protocols, including IPsec, ISAKMP, Kerberos, SNMPv3, SSL/TLS,
WEP, and WPA/WPA2– - Coloring rules can be applied to the packet list for quick, intuitive analysis– - Output can be exported to XML, PostScript®, CSV, or plain text
• - Standard for analyzing traffic for many industry and educational purposes– - Similar to tcpdump w/GUI
• - Paid add-ons (SteelCentral) can make more effective for large-scale monitoring
18
Slide by Josh McCameyINF526 Summer 2016

WireShark
19
Slide by Josh McCameyINF526 Summer 2016
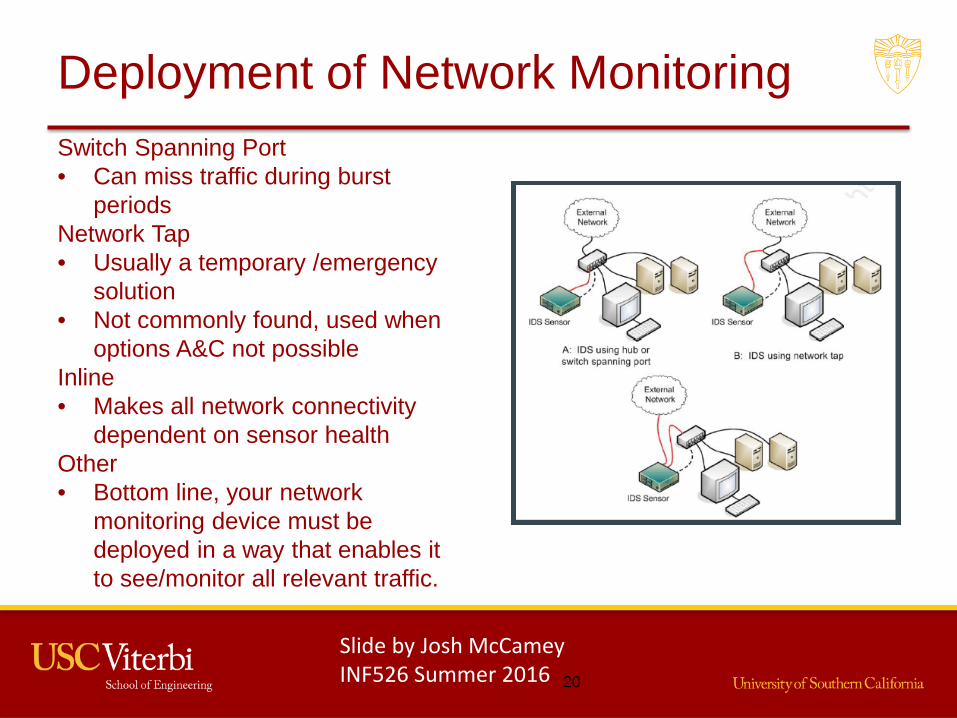
Deployment of Network MonitoringSwitch Spanning Port• Can miss traffic during burst
periodsNetwork Tap• Usually a temporary /emergency
solution• Not commonly found, used when
options A&C not possibleInline• Makes all network connectivity
dependent on sensor healthOther• Bottom line, your network
monitoring device must be deployed in a way that enables it to see/monitor all relevant traffic.
20
Slide by Josh McCameyINF526 Summer 2016
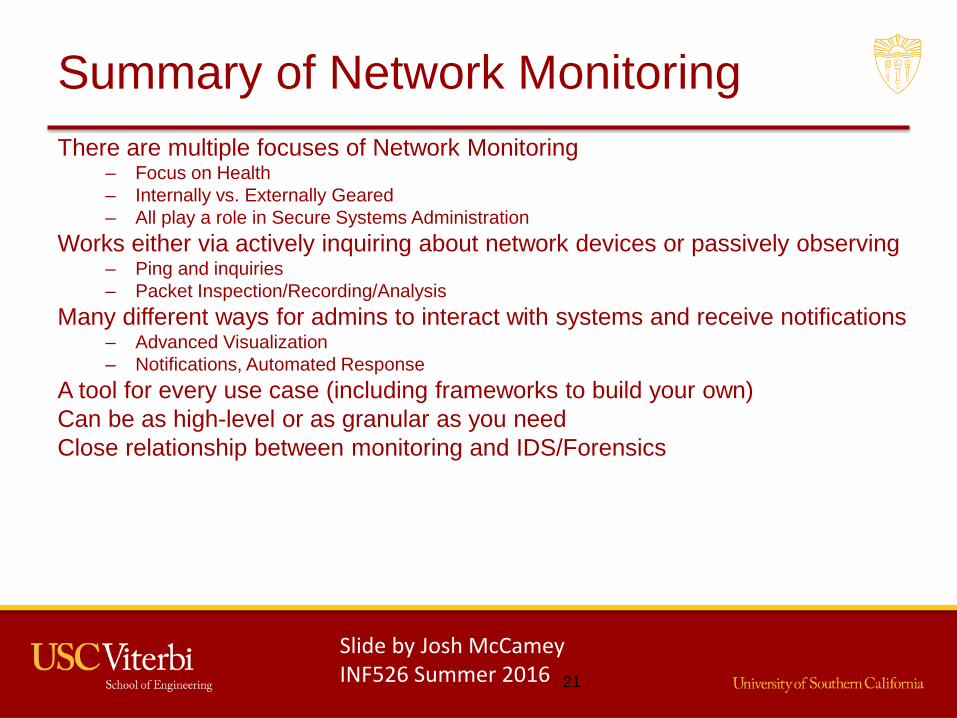
Summary of Network MonitoringThere are multiple focuses of Network Monitoring
– Focus on Health– Internally vs. Externally Geared– All play a role in Secure Systems Administration
Works either via actively inquiring about network devices or passively observing– Ping and inquiries– Packet Inspection/Recording/Analysis
Many different ways for admins to interact with systems and receive notifications– Advanced Visualization– Notifications, Automated Response
A tool for every use case (including frameworks to build your own)Can be as high-level or as granular as you needClose relationship between monitoring and IDS/Forensics
21
Slide by Josh McCameyINF526 Summer 2016

Intrusion Detection
• Signature Based– Specific characteristics of known attacks and attack tools
are maintained, and network based IDS’s scant traffic looking for these patterns.
– Host based IDS’s scan system looking for these patterns.– Administrator installs IDS and keeps signatures up-to-
date.• Anomaly Based
– In the examples from the previous slide many anomalous events will be normal or innocuous.
– Administrator must add to patters of normal events or biome overwhelmed with false positives.
22

Gathering Information
• Useful Reading:• SANS Institute InfoSec Reading Room - Logging and Monitoring to Detect Network
Intrusions and Compliance Violations in the Environment by Sunil Gupta.
• Data Sources– Syslog– SNARE agent– Dedicated monitor on host– Bro for network event data
• Collected by– An event collection system
• E.g. a SNARE Server
23

Application of NM to Intrusion Detection• An intrusion detection system (IDS) monitors network activity for
malicious behavior or policy violations– Clearly, network monitoring and intrusion detection go hand in hand
• Multiple ways to detect intrusions– Can use a unified application to analyze traffic and identify anomalies– Have a separate application analyze logs generated by a network monitor
• Many applications can provide this functionality– Later We’ll demonstrate using our “de facto standard” (self-proclaimed): Wireshark– Examples taken from “Intrusion Detection Using Wireshark” by S. Gupta and R.
Mamtora– (International Journal of Advanced Research in Computer Science and Software
Engineering, Volume 2, Issue 11,2012.)
24
Slide by Josh McCameyINF526 Summer 2016
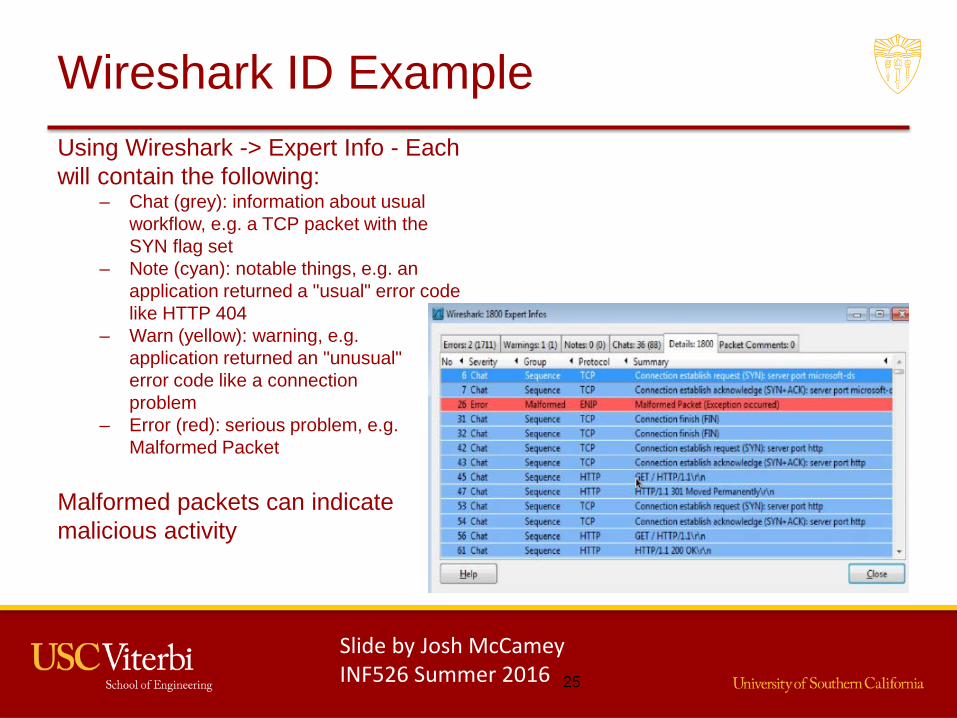
Wireshark ID ExampleUsing Wireshark -> Expert Info - Each will contain the following:
– Chat (grey): information about usual workflow, e.g. a TCP packet with the SYN flag set
– Note (cyan): notable things, e.g. an application returned a "usual" error code like HTTP 404
– Warn (yellow): warning, e.g. application returned an "unusual" error code like a connection problem
– Error (red): serious problem, e.g. Malformed Packet
Malformed packets can indicate malicious activity
25
Slide by Josh McCameyINF526 Summer 2016

Wireshark ID Example• Using Wireshark ->
Chats• TCP connections
should each have SYN, SYN+ACK, ACK sequence
• Sequence of SYNs could indicate DoS
26
Slide by Josh McCameyINF526 Summer 2016

Wireshark ID Example• Same thing can be
done with Wireshark -> Flow Graph
• Continuous barrage of SYNs on various ports with no other messages (i.e. ACK)
• indicates DoS
27
Slide by Josh McCameyINF526 Summer 2016

Wireshark ID Example• Using Wireshark -> Conversations• Shows all interaction between two
endpoints (e.g. two IP addresses)• Add a column to each row called
“conclusion” which contains either “normal” or “abnormal”. Set all values to “abnormal” and update to “normal” when behavior is verified (e.g. packet from A->B and B->A that is not equal to zero, which reflects a connection being established)
• Can apply any data mining technique such as association rule, classification, clustering, etc. to find rules that reflect connection legitimacy.
• Figure on bottom-right shows that if the port number is less than 1066 and packet sent is greater than 3,then all data sent is normal; otherwise, it’s abnormal.
28
Slide by Josh McCameyINF526 Summer 2016

Visualizing the Data
• Security Incident Event Management (SIEM)– Collects data from many sources
• Host, network, and application– Converts data into a common database format– Enables search and analysis of the collected data– Provide visualization tools that allow one to push down on
and query for statistics from its database of events.– Examples: Snort, many many commercial products
• Qradar, OSSIM, others
29

Filtering the Data
• Signature Based– Looking at known attacks
• Anomaly Based– How to define normal– Baseline for system– Baseline for network
• Log Analysis and Correlation– Categorize events (as authorized)– Drops from view of things to be monitoried
• Reduces false positives• Lets brainstorm on how to do this.
– Examples from your exercises?
30

Brainstorming: How and What• Unexpected Flows
– What might this indicate, Where might we see these– Filtering the expected
• Some events should only occur following specific administrative action.– Consider privileged operations on systems– What does root do
• Forking / creation of new processes• Logins• DNS Lookups• Access to specific files• Installations of software – new executables
31

Monitoring from the Outside
• If sensors on affected system, send data to SIEM as soon as possible.– Actions leading to a breach are moved off system before
breach compromises reporting.• Monitor from Host OS/Hypervisor
– Breach of guest does not affect such reporting.• Monitor network activity through appliance or
embedded device.– Requires compromise of separate device to subvert
reporting.
32

Taking Action
• The purpose of intrusion detection is to provide the administrator with actionable intelligence.– Actions are taken based on that insight.
• Actions– Shut down the affected systems– Restore to a known state– Block access from parts of the internet
• Some actions can be taken automatically– Simply closing a vulnerability might be too late.
33

IDS and SIEM
Mohammad AlSubaie
Outline
• Motivation• Intrusion Detection Systems
– Types– Detection Methods
• Security Information and Event Management– Features– Workflow

Motivation
• No system is 100% secure• We can’t prevent all break-ins• There will always be new holes, new attacks,
and new attackers• We need some way to cope

Defense in Depth
• Single defenses can and will fail• Instead, we need multiple layers of defense of
different designs and objectives

Network Defense in Depth
1
3456
2
87
1. Advance Threat Protectione.g. FireEye, Cisco/IronPort
2. Intrusion Detection Systemse.g. McAfee
3. Web Securitye.g. Fortinet
4. Email Securitye.g. Bluecoat, Cisco/IronPort
5. Forensics Analysise.g. RSA/NetWitness
6. Data Loss Prevention (DLP)e.g. TrendMicro
7. Next-Gen Firewallse.g. Palo Alto Networks
8. Security Event Monitoringe.g. HP/ArcSight

Intrusion Detection System
• A device or software application that monitors a network or systems for malicious activity or policy violations. [CIA violation]
• Types of Intrusion Detection Systems– Network-based IDSs– Host-based IDSs

Network-based IDS
• Deploying sensors at strategic locations – E.G., Packet sniffing via tcpdump at routers
• Inspecting network traffic – Watch for violations of protocols and unusual
connection patterns• Monitoring user activities
– Look into the data portions of the packets for malicious command sequences
• May be easily defeated by encryption – Data portions and some header information can be
encrypted

Network-based IDS
SYSTEM
Event stream
Packets Collector
Event Analyzer
Countermeasure
Sensor Sensor SensorSensor
Packet stream
Filtered packet stream
AlarmsPolicy
Configuration
Event Storage

Firewall versus Network IDS
• What is the difference between firewalls and network-based Intrusion Detection Systems?

Firewall vs. Network-based IDS
• What is the difference between firewalls and network-based Intrusion Detection Systems?
• Firewall– Active filtering– Fail-close
• Network-based IDS– Passive monitoring– Fail-open
FW
IDS

Host-based IDS
• Using OS auditing mechanisms– EventLog: Windows Event Logs, System, Security,
Application.– Netstat: Read information about network usage.– Health: Read information about CPU, Memory, and
Swap usage.– Ps: Read information about running processes
• Monitoring user activities– E.g. analyze shell command
• Monitoring execution of system programs

Host-based IDS
Actions
SYSTEM
Audit logs
Detector CountermeasureAlarms
Policy Configuration
Vulnerability Scanning
IDS detection Methods
• Knowledge-based
• Specification-based
• Behavior-based

Evaluation of IDS
• Accuracy• Completeness• Performance• Fault tolerance• Timeliness

Knowledge-based IDS
• High accuracy, but low in completeness
• Drawback: need regular update of knowledge (malware signatures)
• High performance with minimal processing power

Specification-based IDS
• Manually develop specifications that capture the legitimate system behavior. Any deviation from it is an intrusion.
• Pro: can avoid false-positives since the specification can capture all legitimate behavior.
• Con: hard to develop a complete and detailed specification.

Behavior-based IDS
• High in completeness, but low accuracy
• Detect intrusion by observing a deviation from the normal or expected behavior of the system or the users
• Can detect attempts to exploit new and unforeseen vulnerabilities (zero-day attacks)

Typical Corporation Environment
Internet
Web Server
DNS Server
Email Server
Remote User Router
Intrusion Prevention System
SwitchSwitch
EPO Server
DC Server
App Server
Database Server

Typical Corporation Environment
Internet
Web Server
DNS Server
Email Server
Remote User Router
Intrusion Prevention System
SwitchSwitch
EPO Server
DC Server
App Server
Database Server

Typical Corporation Environment
Internet
Web Server
DNS Server
Email Server
Remote User Router
Intrusion Prevention System
SwitchSwitch
EPO Server
DC Server
App Server
Database Server

Security Information and Event Management (SIEM)
• SIEM is a system combining Security Information Management (SIM) and Security Event Management (SEM).
• SEM deals with– Real-time monitoring– Correlation of events and threat intelligence– Notifications– Console views
• SIM deals with– Long-term storage– Analysis and reporting of log data

SIEM Features
* Source “ManageEngine” https://www.manageengine.com/products/eventlog/manageengine-siem-whitepaper.html
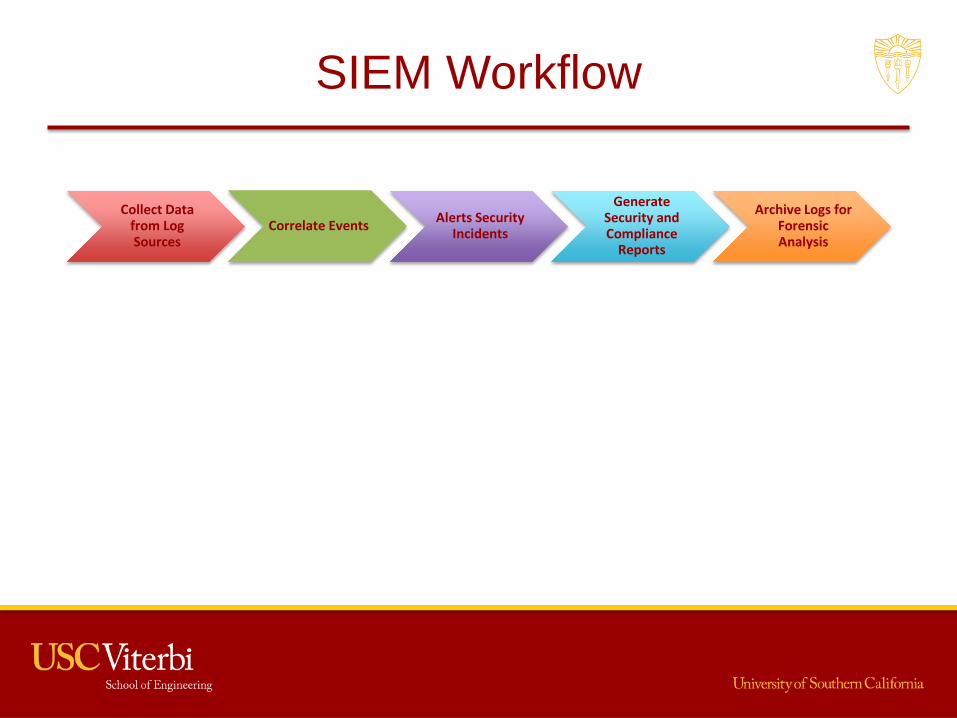
SIEM Workflow
Collect Data from Log Sources
Correlate Events Alerts Security Incidents
Generate Security and Compliance
Reports
Archive Logs for Forensic Analysis

SIEM Workflow
• Methods of collecting data from sources
• Aggregation: to gather data together as a whole in singular repository
• Normalization: to create consistent records by type and format
Collect Data from Log Sources
Correlate Events Alerts Security Incidents
Generate Security and Compliance
Reports
Archive Logs for Forensic Analysis
Data Source Data SourceCollector

Normalization
• Original log format from source 110:32, 12/3/2017, alsubaim, ad.corporate.com, error, failed login attempt
• Original log format from source 212:45, 3/23/2017, malicious code detected, host1.corporate.com, alsubaim
• Normalized logs10:32, 12/3/2017, alsubaim, ad.corporate.com, failed login attempt12:45, 23/3/2017, alsubaim, host1.corporate.com, malicious code detected

SIEM Workflow
Collect Data from Log Sources
Correlate Events Alerts Security Incidents
Generate Security and Compliance
Reports
Archive Logs for Forensic Analysis
• Link events to identify attacks• Event based:
– a single event identifies an attack• Rule based:
– If X + Y + Z then do A– If X repeated 3 times within an hour, then do Y
• Anomaly based:– If the traffic on port X exceeds the standard deviation of
historic traffic patterns, then there may be a problem

SIEM Workflow
Collect Data from Log Sources
Correlate Events Alerts Security Incidents
Generate Security and Compliance
Reports
Archive Logs for Forensic Analysis
• Severity
• Notification: upon identifying a threat, notifications are sent to the security administrators (SOC)
• Automated Response: the majority of SIEM tools can execute external scripts to react on identified threats. (Change to FW rules, issue a Remedy ticket)
Low Medium High Critical

Security Operations Center (SOC)

SIEM Workflow
Collect Data from Log Sources
Correlate Events Alerts Security Incidents
Generate Security and Compliance
Reports
Archive Logs for Forensic Analysis

SIEM Workflow
Collect Data from Log Sources
Correlate Events Alerts Security Incidents
Generate Security and Compliance
Reports
Archive Logs for Forensic Analysis
• Collected log data is stored for future forensic investigations.
• Not equivalent to Log Management Solutions

SIEM vs. LM
Functionality Security Information and Event Management Log Management
Log collection Security related logs All logs
Log pre-processing Parsing, normalization, categorization, and enrichment
Indexing, parsing, or none
Log retention Retain parsed and normalized data Retain raw log data
Reporting Security focused reporting Broad use reporting
Analysis Correlation, threat scoring, event prioritization
Full text analysis,tagging
Alerting and notification
Advanced security focused reporting
Simple alerting on all logs
Other features Incident management, analyst workflow, context analysis, etc.
High scalability of collection and storage

HP ArcSight (SIEM)

Why SIEM Implementation Fails?
• Lack of planning– No defined scope
• Faulty Deployment Strategies– Incoherent log management data collection– High volume of irrelevant data can overload the
system• Operational
– Lack of management oversight– Assume plug and play
Security is a process not a product

Thank You!Question?

Second Exercise - Criminal Enterprises
• Chosen because of differences in the high level principles.
– Not because I expect you to implement these kinds of systems in your future endeavors.– But you may be called upon to break some of these systems if later employed by government organizations.
• Your organization must:– Accept Bitcoin as payment (not really, but it must accept something that stands in for bitcoin)– Manage an inventory of stolen account identifiers with passwords– Control access to such information– Prevent collection of evidence or intelligence by third parties.– Note, do not deal in any illegal goods, but use dummy information to stand in for such goods. Also,
do not use terms associated with such illegals goods or information in communications, make up new names for this dummy information.
69

Teams for Second Exercise
• Group A– Enrolled: Srivastav, Binkulaib, Dmytrisin, Alsubaie,
Bubshait, Gronski– Advisors: haiboz, jaskaran, rajattan
• Group B– Enrolled: Guerrerobognoli, Li, Wright-Walker, Jackoski,
Vadlamani, Zhang– Advisors: sajmani, slakkadi, tosirisu, wang907
70