Embed Size (px)
Citation preview
Infant Nutrition Assessment: GROWTHBeth Ogata, MS, RD, CSPJoan Zerzan, MS, RDUW – [email protected] NUTR 526 – Fall 2012

Nutrition Screening and Assessment
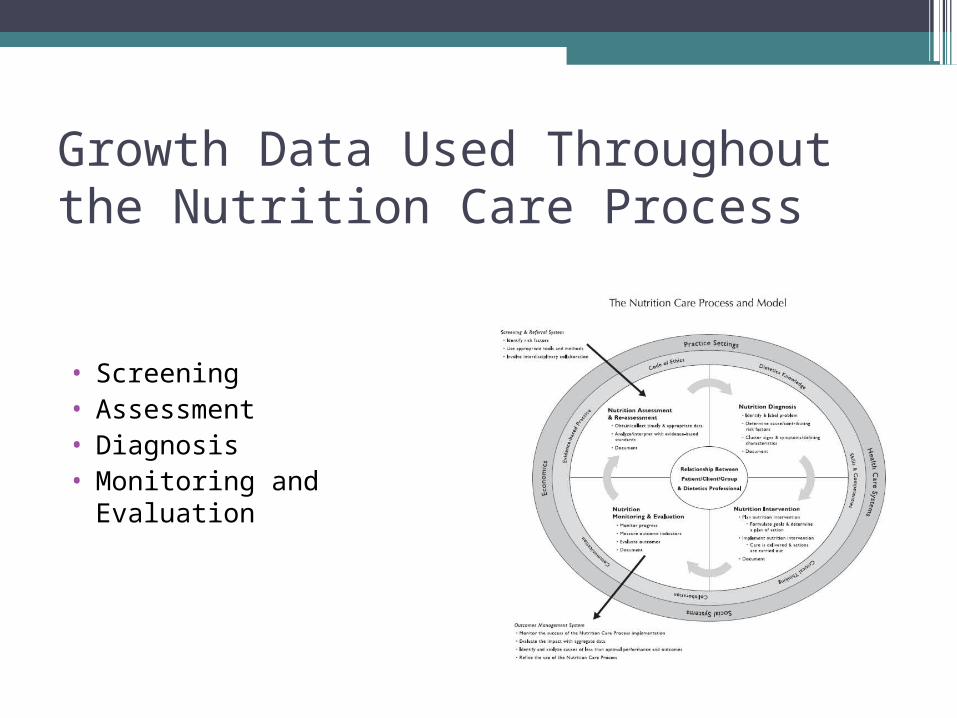
Growth Data Used Throughout the Nutrition Care Process
• Screening• Assessment• Diagnosis• Monitoring and Evaluation

NCP: Nutrition Screening•Definitions
▫Process of identifying characteristics known to be associated with nutrition problems (ASPEN, 1996)
▫Simplest level of nutritional care (level 1) (Baer et al, 1997)
•Purpose▫Identify individuals who appear to have or be
at risk for nutrition problems▫Identify individuals who require further
assessment or intervention
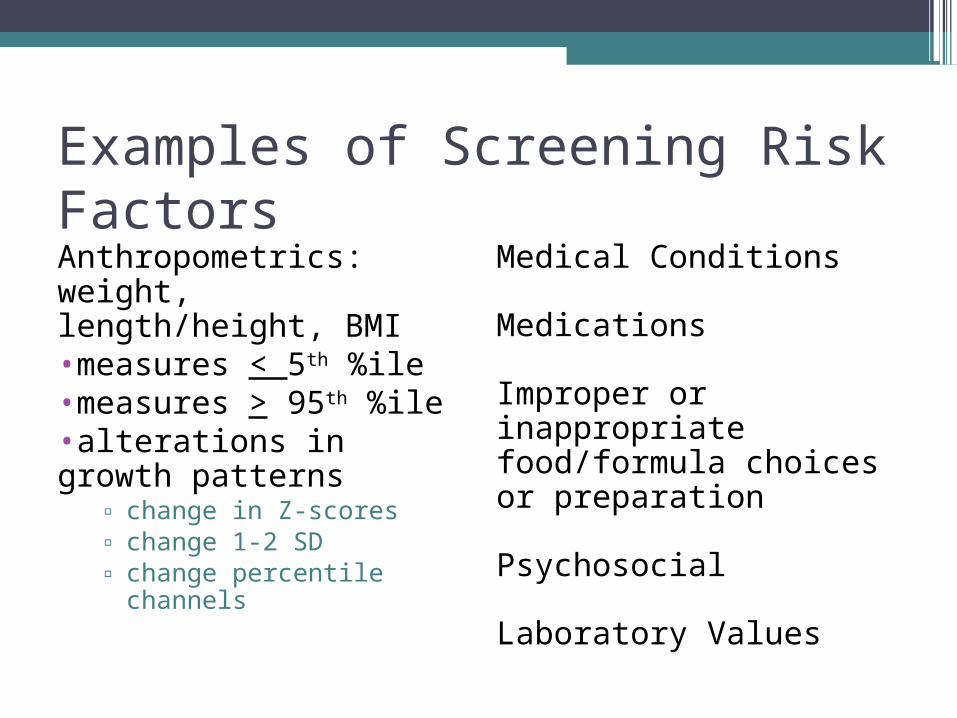
Examples of Screening Risk FactorsAnthropometrics: weight, length/height, BMI•measures < 5th %ile•measures > 95th %ile•alterations in growth patterns
▫ change in Z-scores▫ change 1-2 SD▫ change percentile
channels
Medical Conditions
Medications
Improper or inappropriate food/formula choices or preparation
Psychosocial
Laboratory Values
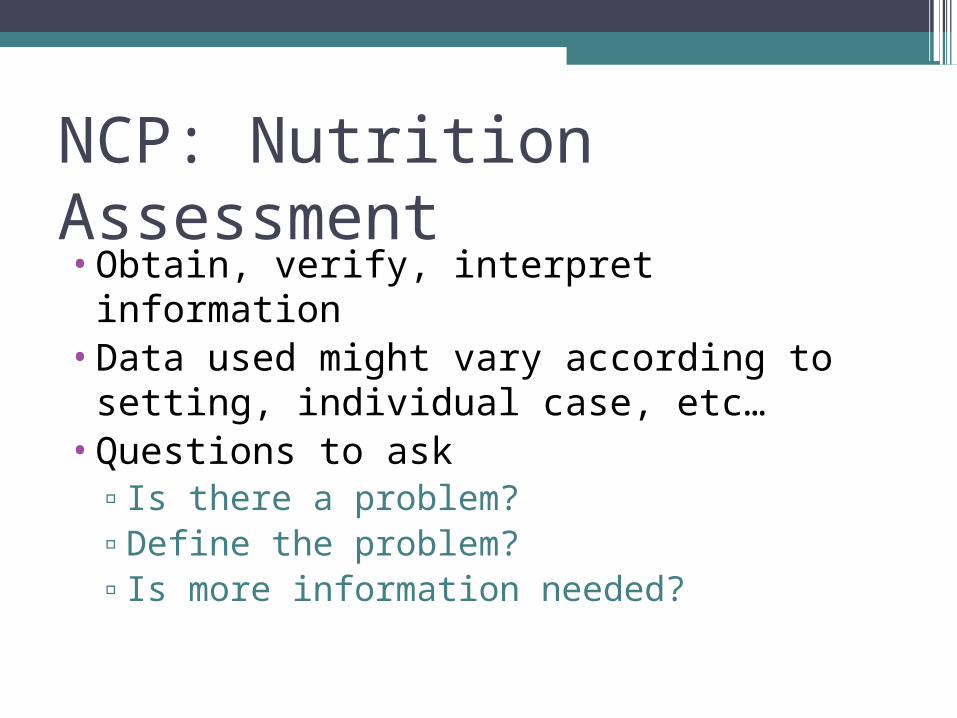
NCP: Nutrition Assessment•Obtain, verify, interpret information•Data used might vary according to
setting, individual case, etc…•Questions to ask
▫Is there a problem?▫Define the problem?▫Is more information needed?
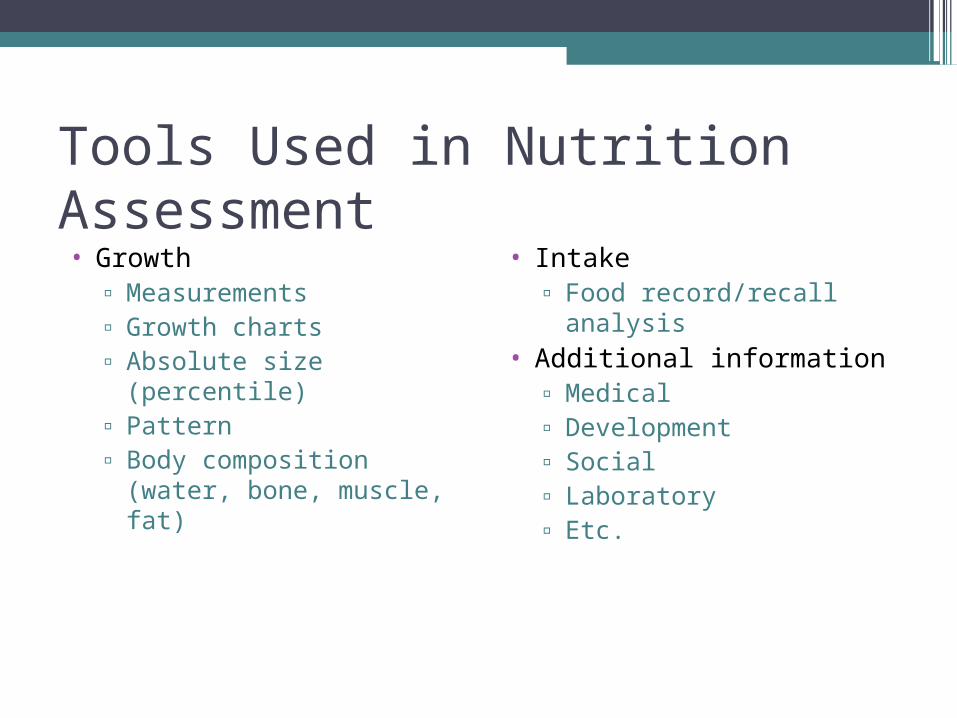
Tools Used in Nutrition Assessment• Growth
▫ Measurements▫ Growth charts▫ Absolute size (percentile)▫ Pattern▫ Body composition (water,
bone, muscle, fat)
• Intake▫ Food record/recall
analysis• Additional information
▫ Medical▫ Development▫ Social▫ Laboratory▫ Etc.
NCP: Nutrition Diagnosis
•Identification or labeling of problem that is within RD scope of practice to treat▫Examples:
Inadequate intake Inadequate growth
NCP: Intervention, Monitoring and Evaluation•Intervention
▫Etiology drives the intervention•Monitoring and Evaluation

PART 2 – Definition of Growth
Growth•Dynamic process • Increase in the physical size of the body as a
whole or any of its parts associated with increase in cell number and/or cell size
•Reflects changes in absolute size, mass, body composition
•A normal, healthy child grows at a genetically predetermined rate that can be compromised by imbalanced nutrient intake
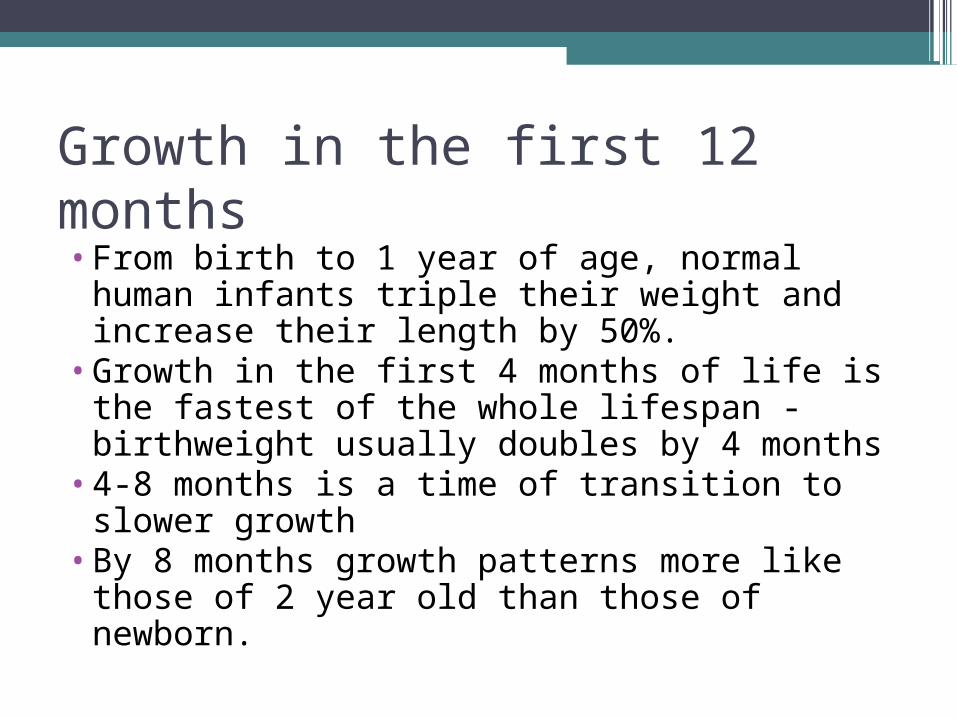
Growth in the first 12 months•From birth to 1 year of age, normal
human infants triple their weight and increase their length by 50%.
•Growth in the first 4 months of life is the fastest of the whole lifespan - birthweight usually doubles by 4 months
•4-8 months is a time of transition to slower growth
•By 8 months growth patterns more like those of 2 year old than those of newborn.
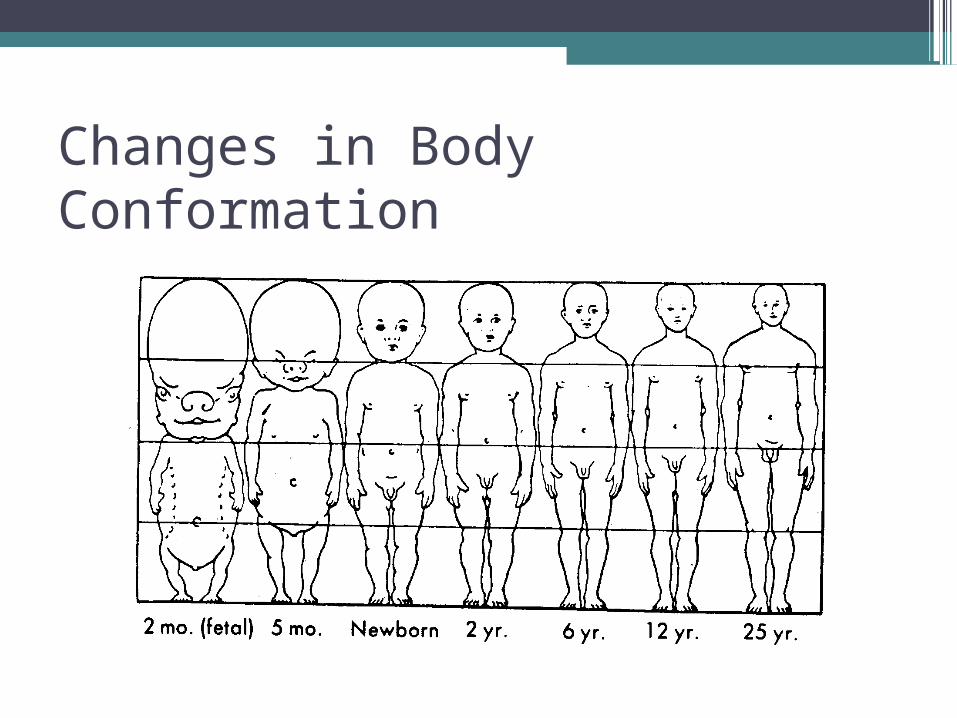
Changes in Body Conformation
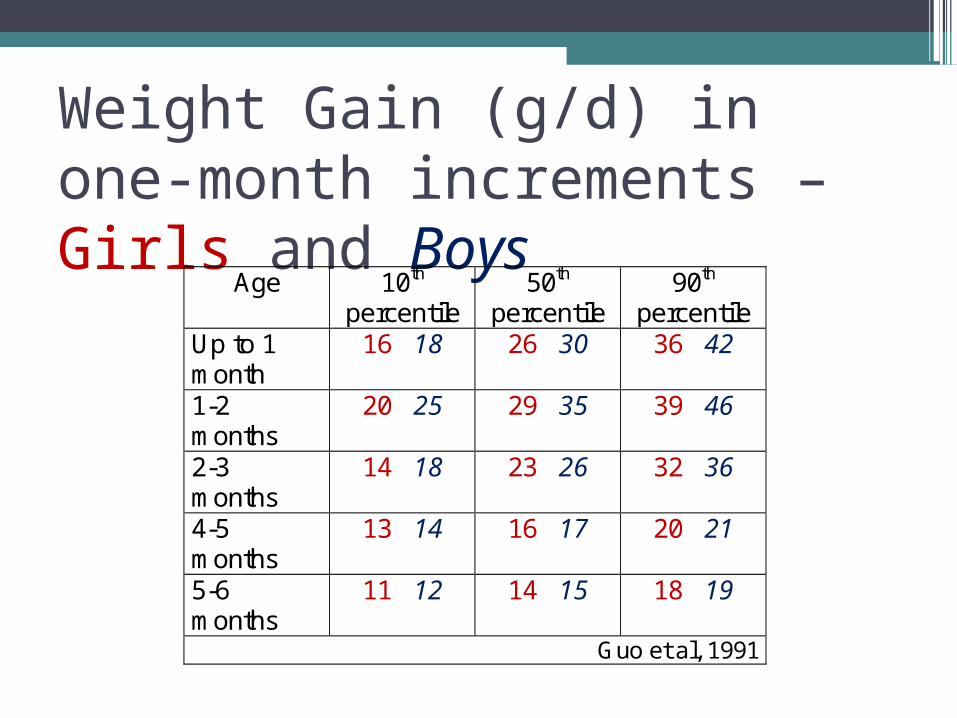
Weight Gain (g/d) in one-month increments – Girls and Boys
Age 10th percentile
50th percentile
90th percentile
Up to 1 month
16 18 26 30 36 42
1-2 months
20 25 29 35 39 46
2-3 months
14 18 23 26 32 36
4-5 months
13 14 16 17 20 21
5-6 months
11 12 14 15 18 19
Guo et al, 1991
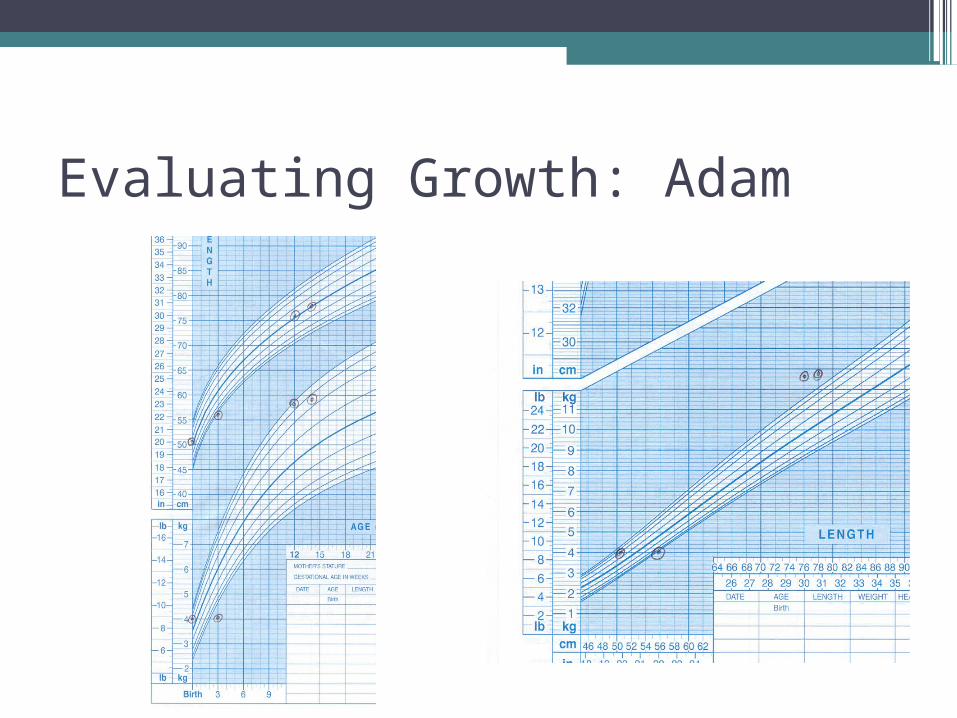
Evaluating Growth: Adam

Evaluating Growth: Adam, cont’d

Rates of weight gain: Breastfed vs. Formula-fed
• Rates of gain for breastfed and formula fed infants during early months of life generally have been found to be similar although some reports have demonstrated greater gains by breastfed infants and others have shown greater gains by formula fed infants▫ Dewey, Pediatrics, 1992;89:1035▫ Nelson, Early Human Development, 1989;19:223.▫ Cole, Acta Paediatr, 2002;91:1296.
PART 3: How growth is evaluated
Do parents understand growth charts?•Ben-Joseph E, et al. Do parents understand
growth charts? A national, internet-based study. Pediatrics. 2009; 124(4):1100-09.
•n=1000 parents (US)•Completed internet survey about
awareness of, knowledge of, and attitudes toward growth monitoring and ability to interpret growth data
•Survey at: http://kidshealth.org/misc/surveys/GrowthChartSurvey.pdf
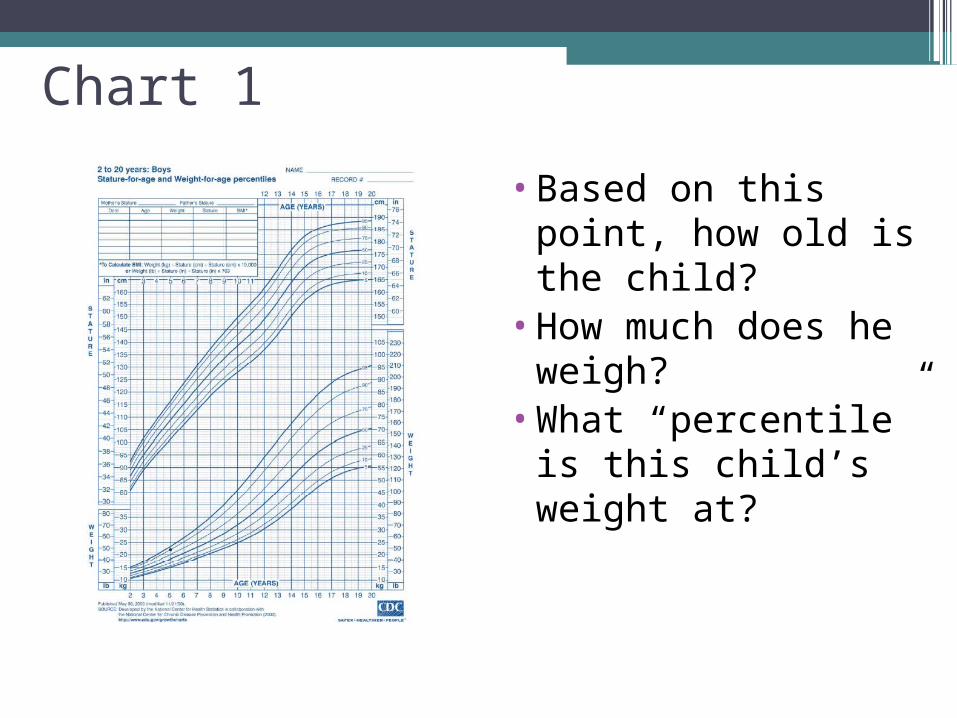
Chart 1
•Based on this point, how old is the child?
•How much does he weigh?
•What “percentile” is this child’s weight at?

Chart 1 - continued
• What does it mean that the child’s weight is at the 90th percentile?a. 90% of children are
heavierb. Child is heavier than
90% of othersc. Child is 90% of
recommended weightd. I am not suree. Other
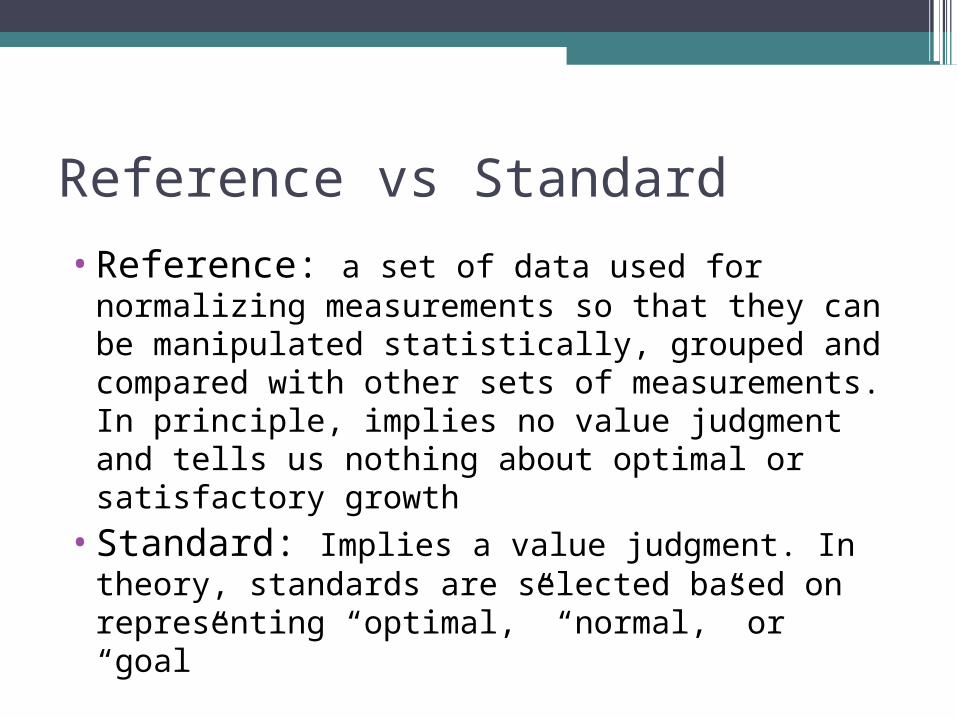
Reference vs Standard
•Reference: a set of data used for normalizing measurements so that they can be manipulated statistically, grouped and compared with other sets of measurements. In principle, implies no value judgment and tells us nothing about optimal or satisfactory growth
•Standard: Implies a value judgment. In theory, standards are selected based on representing “optimal,” “normal,” or “goal”
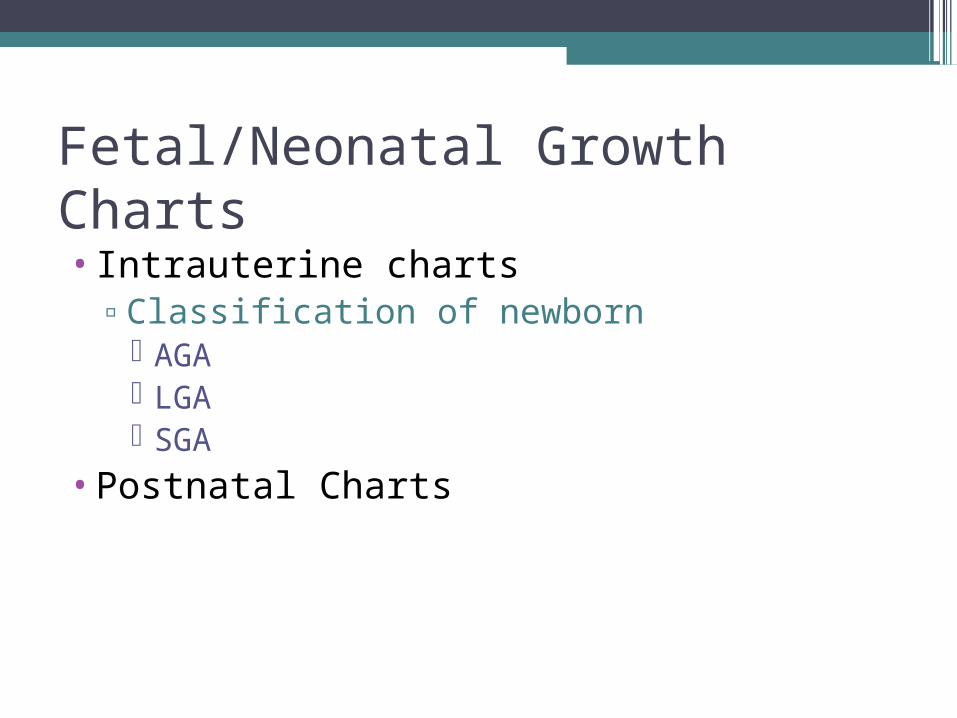
Fetal/Neonatal Growth Charts
•Intrauterine charts▫Classification of newborn
AGA LGA SGA
•Postnatal Charts
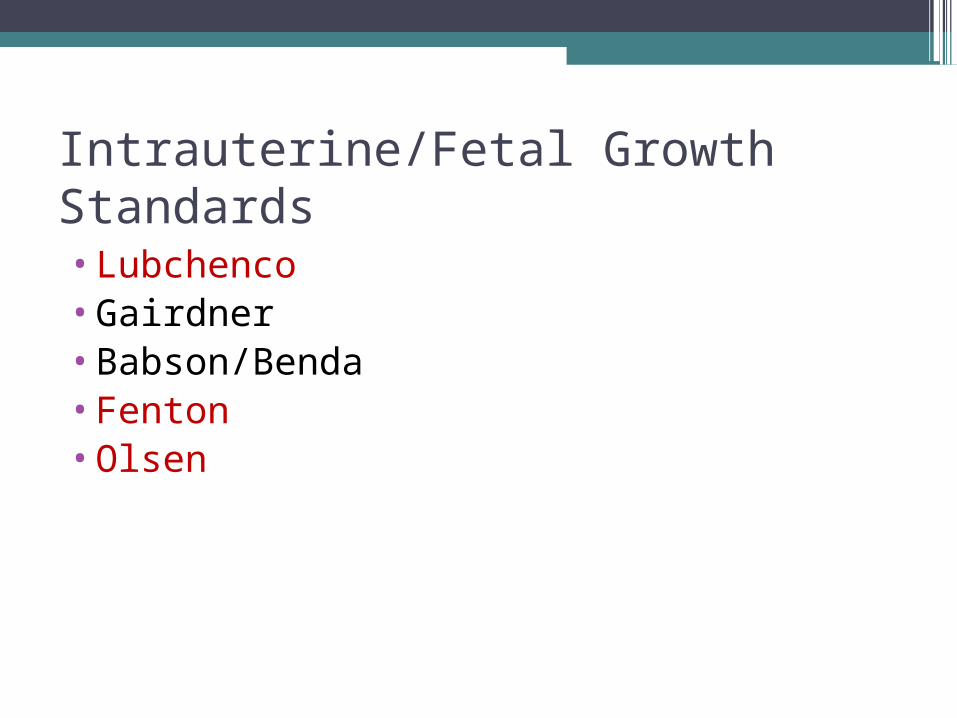
Intrauterine/Fetal Growth Standards•Lubchenco•Gairdner•Babson/Benda•Fenton•Olsen
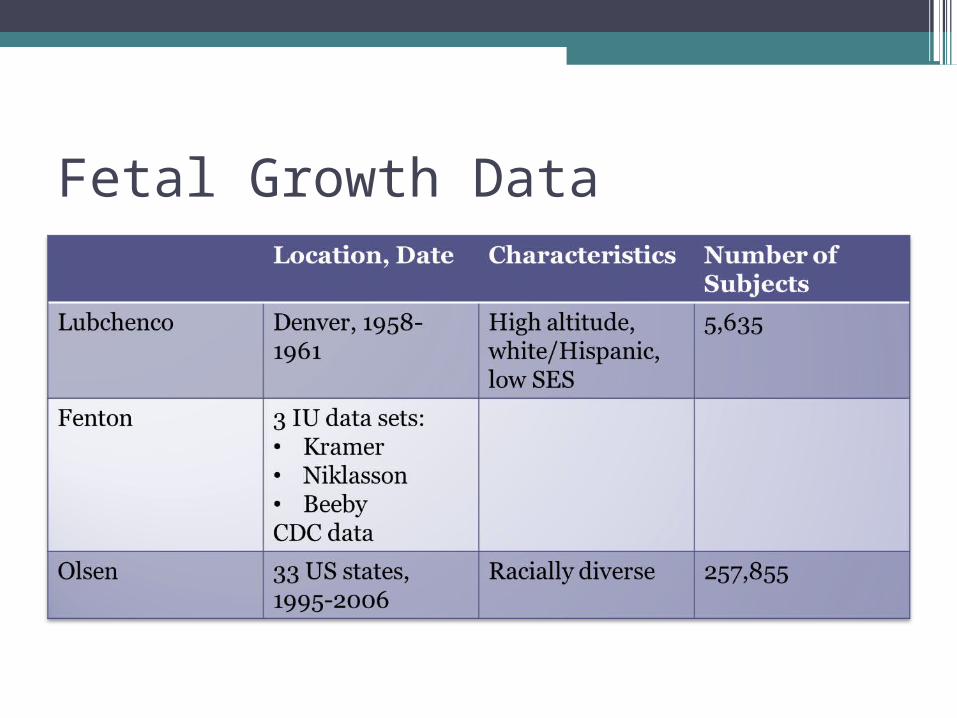
Fetal Growth Data

Fenton Chart
•Data Sets:▫Kramer, et al: 676,605 infants, 22-43 weeks▫Nicholson, et al: 376,000 Swedish infants
28-40 weeks▫Breeby, et al: OFC (N=29,090) and Length
(N=26,973), 22-40 weeks▫CDC Data
•Time period 1963-2001

Postnatal Growth Charts
•Accounts for initial weight loss•Dancis: Data 1948, very small sample size
in lowest weight group•Ehrenkranz: Pediatrics 1999:104:280
▫N=1660▫14-16 g/kg/d weight gain▫0.9 cm/week increase length▫0.35 cm/week increase OFC
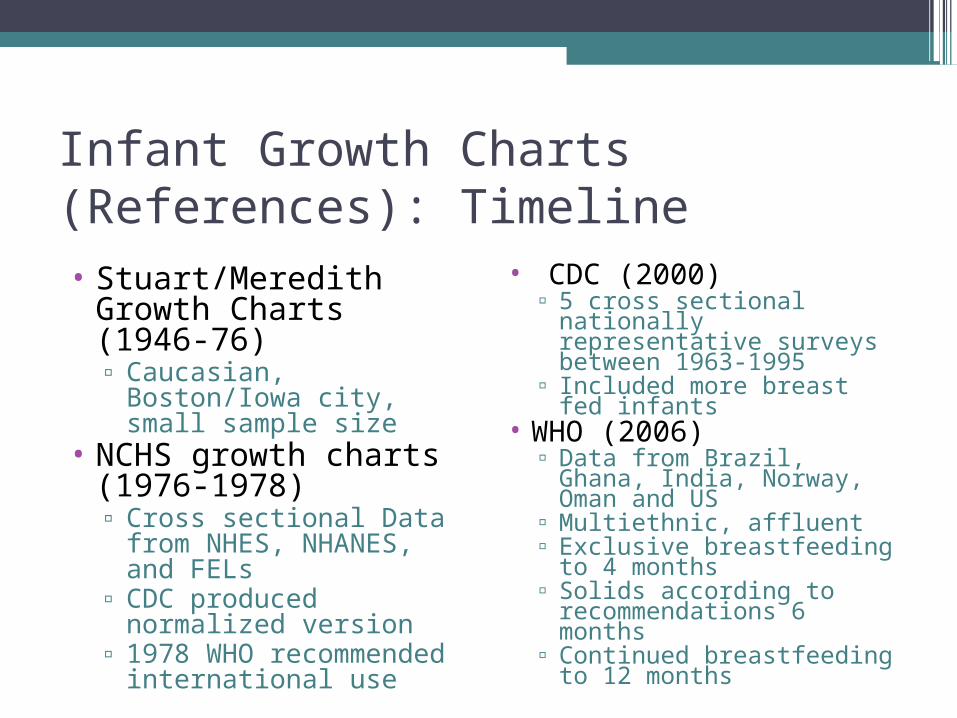
Infant Growth Charts (References): Timeline• Stuart/Meredith
Growth Charts (1946-76)▫ Caucasian, Boston/Iowa
city, small sample size• NCHS growth charts
(1976-1978)▫ Cross sectional Data
from NHES, NHANES, and FELs
▫ CDC produced normalized version
▫ 1978 WHO recommended international use
• CDC (2000)▫ 5 cross sectional
nationally representative surveys between 1963-1995
▫ Included more breast fed infants
• WHO (2006)▫ Data from Brazil, Ghana,
India, Norway, Oman and US
▫ Multiethnic, affluent▫ Exclusive breastfeeding to
4 months▫ Solids according to
recommendations 6 months
▫ Continued breastfeeding to 12 months
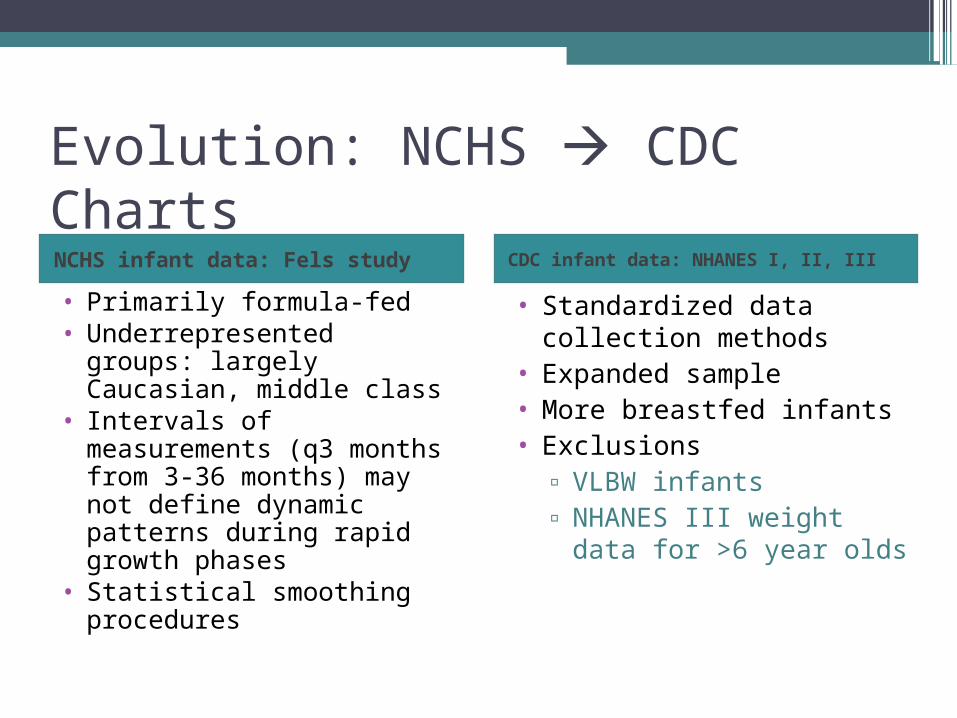
Evolution: NCHS CDC ChartsNCHS infant data: Fels study CDC infant data: NHANES I, II, III
• Primarily formula-fed• Underrepresented groups:
largely Caucasian, middle class
• Intervals of measurements (q3 months from 3-36 months) may not define dynamic patterns during rapid growth phases
• Statistical smoothing procedures
• Standardized data collection methods
• Expanded sample • More breastfed infants• Exclusions
▫ VLBW infants▫ NHANES III weight
data for >6 year olds
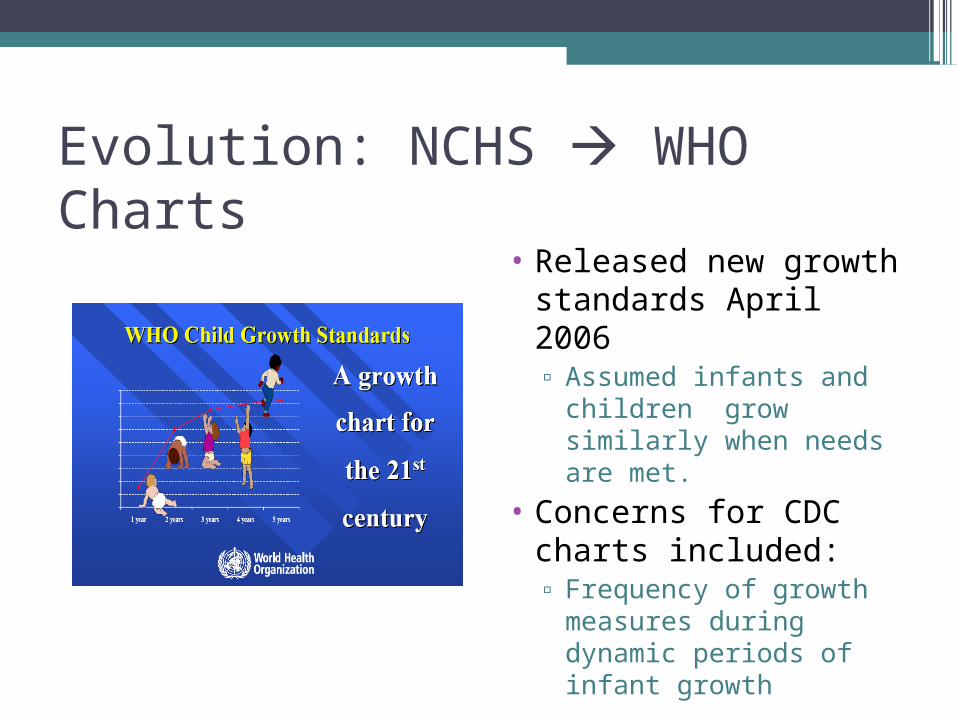
Evolution: NCHS WHO Charts
• Released new growth standards April 2006▫ Assumed infants and
children grow similarly when needs are met.
• Concerns for CDC charts included:▫ Frequency of growth
measures during dynamic periods of infant growth
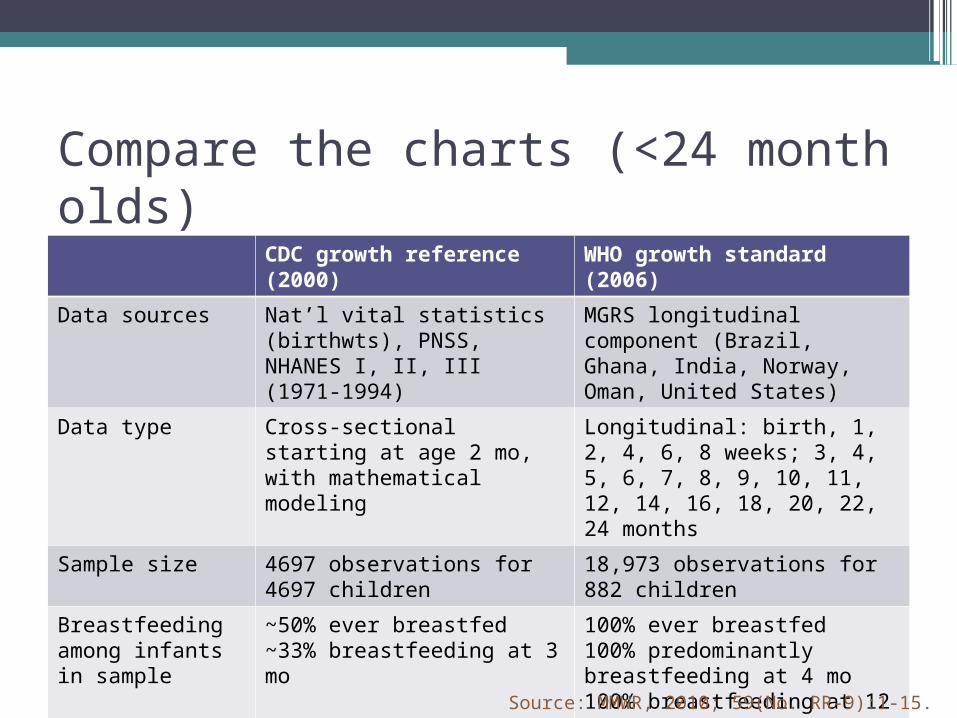
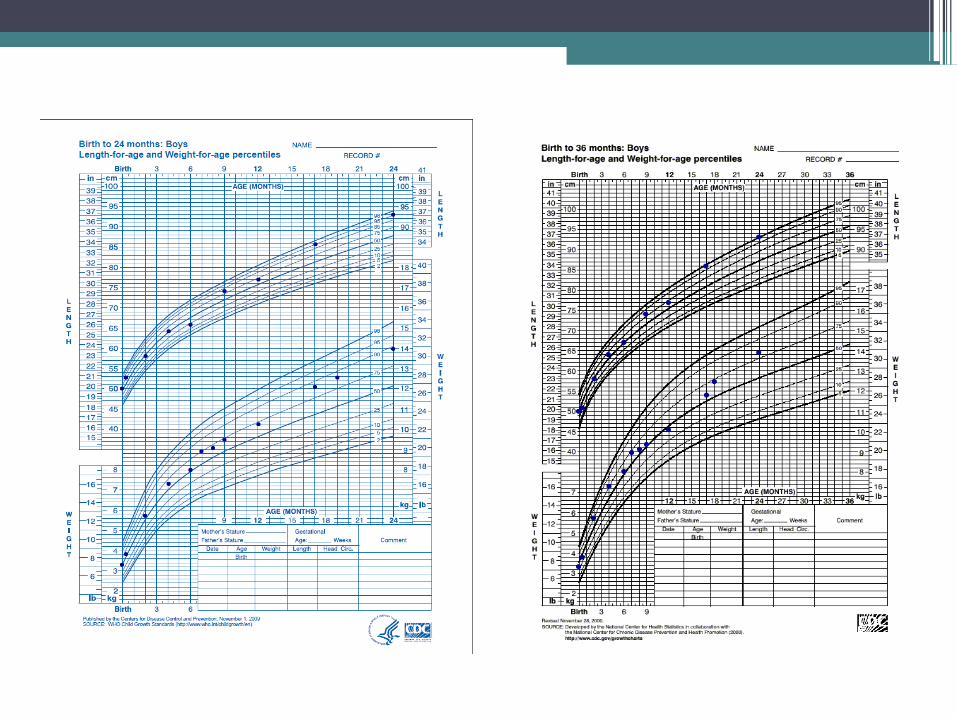
Compare the charts (<24 month olds)
CDC growth reference (2000)
WHO growth standard (2006)
Data sources Nat’l vital statistics (birthwts), PNSS, NHANES I, II, III (1971-1994)
MGRS longitudinal component (Brazil, Ghana, India, Norway, Oman, United States)
Data type Cross-sectional starting at age 2 mo, with mathematical modeling
Longitudinal: birth, 1, 2, 4, 6, 8 weeks; 3, 4, 5, 6, 7, 8, 9, 10, 11, 12, 14, 16, 18, 20, 22, 24 months
Sample size 4697 observations for 4697 children
18,973 observations for 882 children
Breastfeeding among infants in sample
~50% ever breastfed~33% breastfeeding at 3 mo
100% ever breastfed100% predominantly breastfeeding at 4 mo100% breastfeeding at 12 moComplementary foods introduced at mean age 5.4 mo
Source: MMWR, 2010; 59(No. RR-9):1-15.
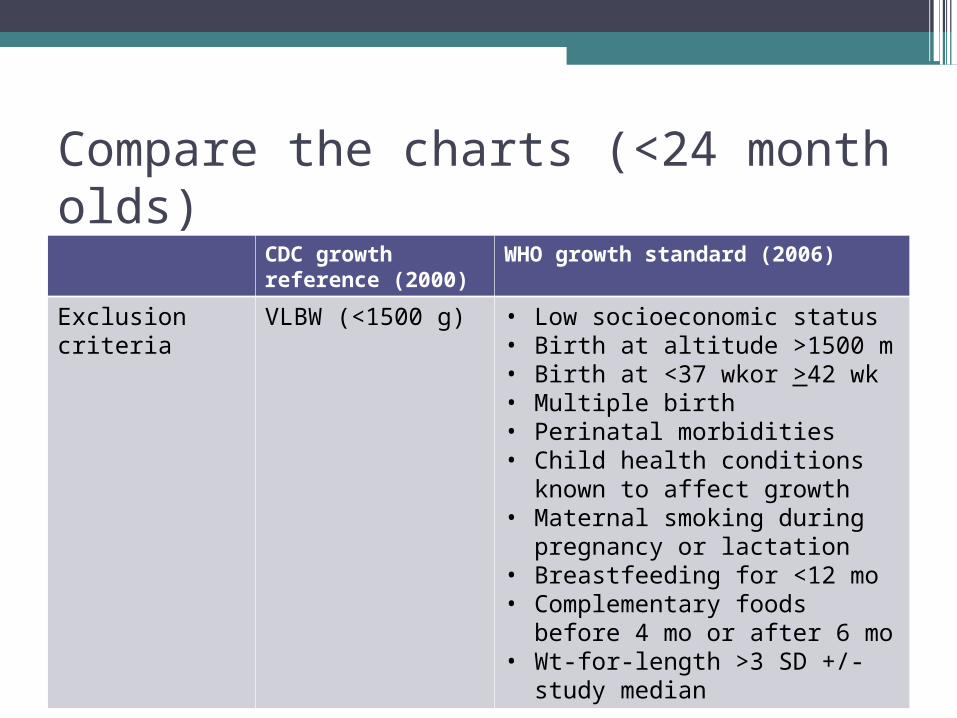
Compare the charts (<24 month olds)
CDC growth reference (2000)
WHO growth standard (2006)
Exclusion criteria
VLBW (<1500 g) • Low socioeconomic status• Birth at altitude >1500 m• Birth at <37 wkor >42 wk• Multiple birth• Perinatal morbidities• Child health conditions
known to affect growth• Maternal smoking during
pregnancy or lactation• Breastfeeding for <12 mo• Complementary foods before
4 mo or after 6 mo• Wt-for-length >3 SD +/-
study median
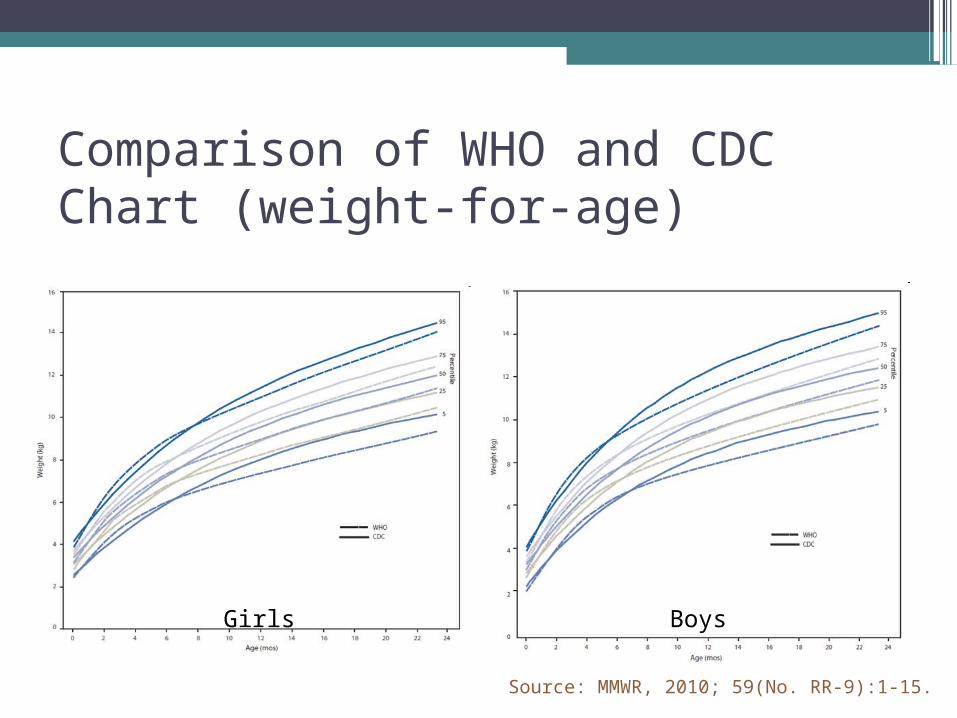
Comparison of WHO and CDC Chart (weight-for-age)
Girls Boys
Source: MMWR, 2010; 59(No. RR-9):1-15.
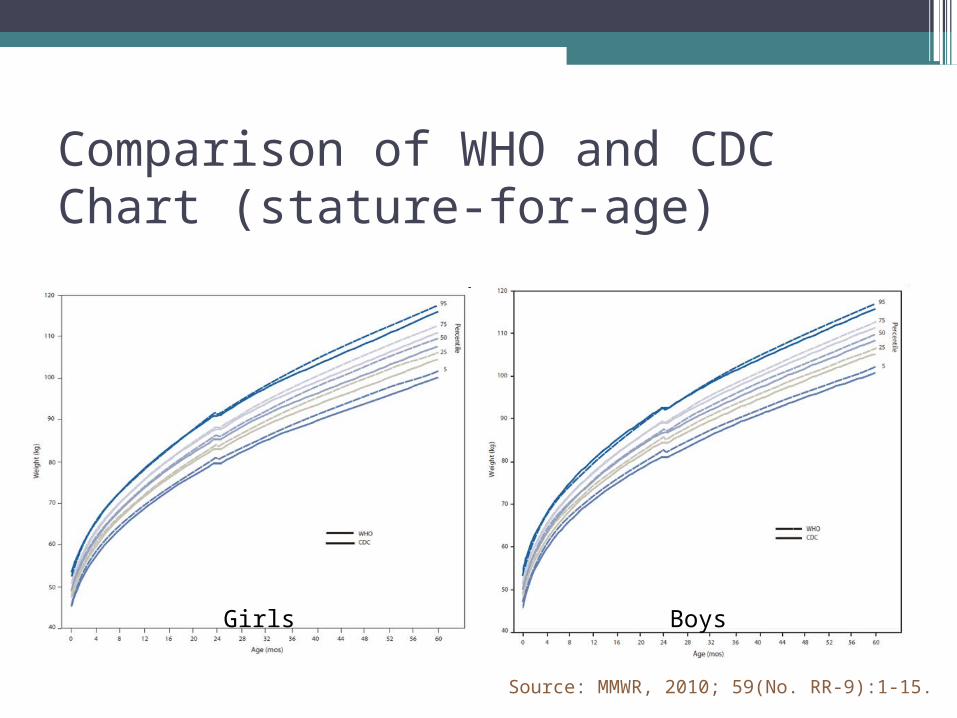
Comparison of WHO and CDC Chart (stature-for-age)
Girls Boys
Source: MMWR, 2010; 59(No. RR-9):1-15.
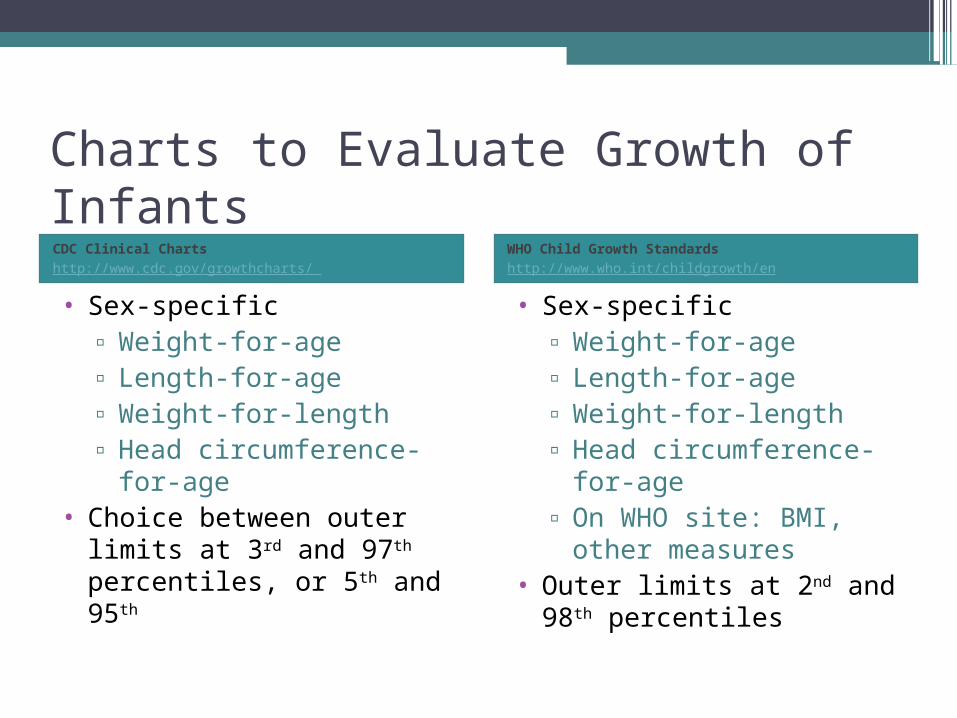
Charts to Evaluate Growth of InfantsCDC Clinical Chartshttp://www.cdc.gov/growthcharts/
WHO Child Growth Standardshttp://www.who.int/childgrowth/en
• Sex-specific▫ Weight-for-age▫ Length-for-age▫ Weight-for-length▫ Head circumference-for-
age• Choice between outer
limits at 3rd and 97th percentiles, or 5th and 95th
• Sex-specific▫ Weight-for-age▫ Length-for-age▫ Weight-for-length▫ Head circumference-for-
age▫ On WHO site: BMI,
other measures• Outer limits at 2nd and 98th
percentiles
Differences between WHO and CDC infant charts• WHO mean > CDC mean birth to 6 months• “Healthy breastfed infants track weight-for-age
along WHO but falter on CDC”• Cross at 6 months and WHO mean < 6 months• On the CDC chart, children appear heavier and
shorter• On the WHO chart, children appear taller• WHO charts:
▫Higher estimate of overweight▫Lower estimates of underweight,
undernutrition

CDC Recommendations for infant growth chartsExpert Panel (NIH, AAP) to review scientific evidence. Recommendations:•WHO charts from birth to 24 months•CDC charts for >24 months•As a screen, 2rd and 98th percentile on WHO corresponds to 5thand 95th on CDC•Clinicians should be aware that fewer individuals will be screened as “underweight” and more as “overweight” using WHO•For more, see http://www.cdc.gov/growthcharts
Controversies/Issues•Screen vs. assessment•Standard vs. reference•Typical vs. ideal growth•Environmental influence•Variety of diets may result in acceptable
growth and nutrition status•Normal population diversity
Plot individuals on both CDC and WHO. Does your assessment change? • Absolute size vs. pattern

Carl
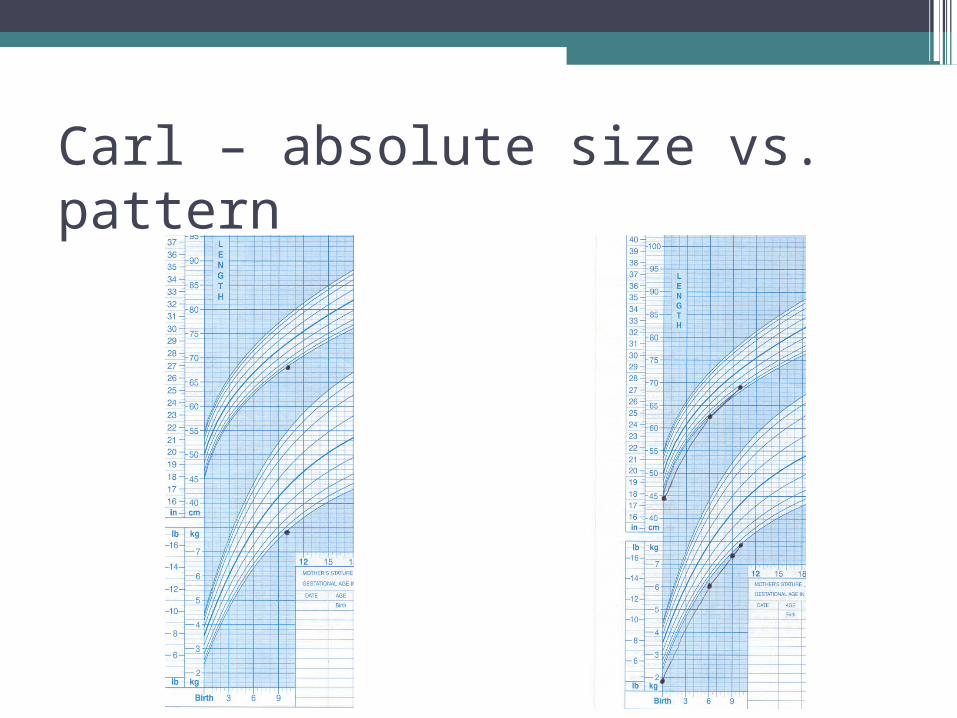
Carl – absolute size vs. pattern
PART 4: Problems with Growth• Underweight• Overweight• Failure to Grow• “Overfat”
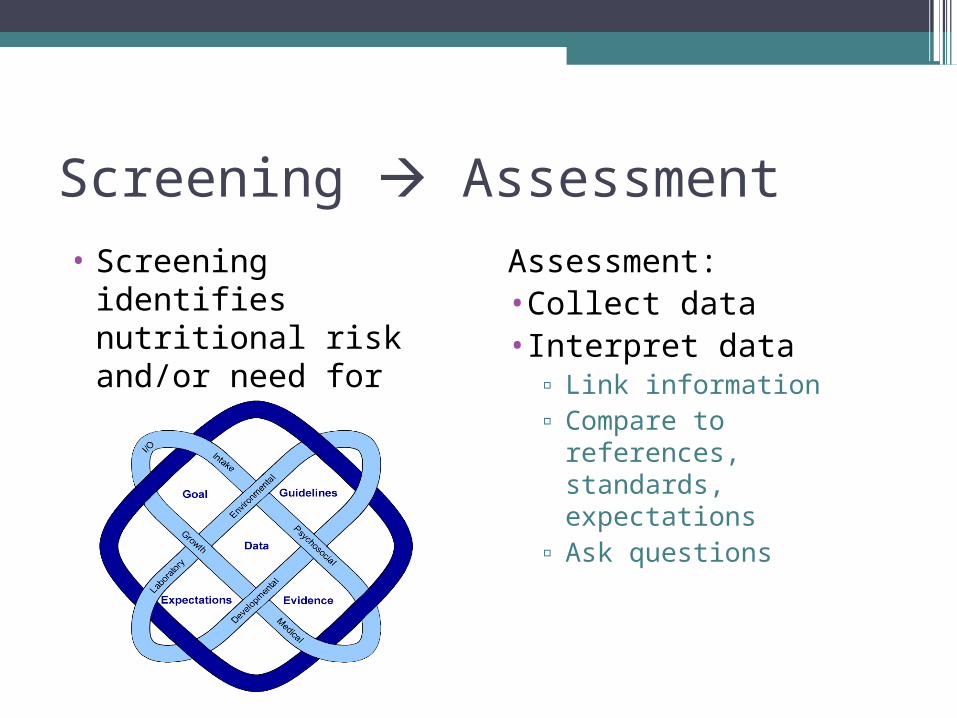
Screening Assessment• Screening identifies
nutritional risk and/or need for further assessment.
Assessment:•Collect data•Interpret data
▫ Link information▫ Compare to references,
standards, expectations▫ Ask questions
Interpretation: Asking Questions• Is there a problem?• Was there a problem?• Does information
make sense?• What are goals and
expectations?• What is etiology of the
problem?

Overweight
•Weight in infancy associated with weight in childhood▫Crossing percentiles (upward) in infancy is
associated with ↑d OR of childhood obesity (Taveras, 2011)
▫Children in upper tertile had higher risk of childhood obesity than children in lower tertile (Andersen, 2012)
•Appropriate screening tool, intervention not clear; Beth’s take-home message: keep feeding babies
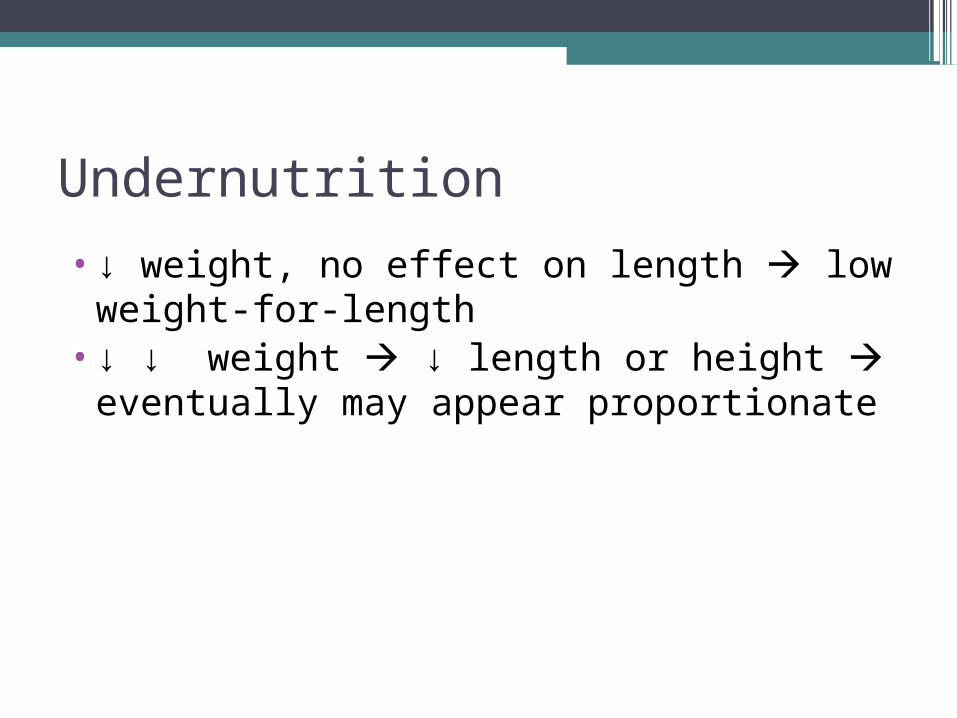
Undernutrition
•↓ weight, no effect on length low weight-for-length
•↓ ↓ weight ↓ length or height eventually may appear proportionate
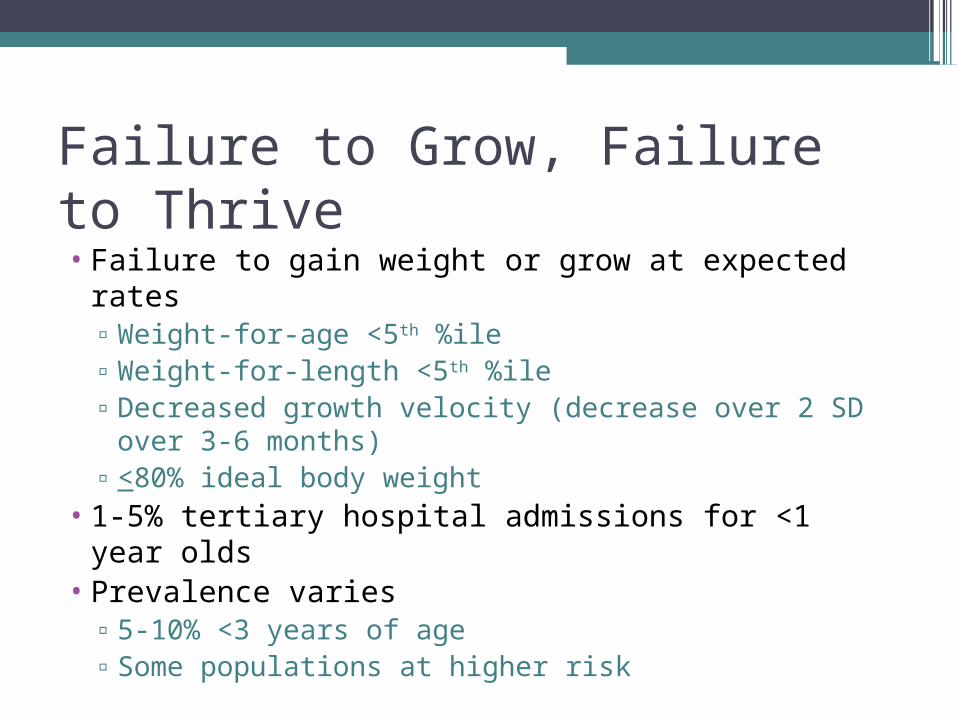
Failure to Grow, Failure to Thrive• Failure to gain weight or grow at expected rates
▫Weight-for-age <5th %ile▫Weight-for-length <5th %ile▫Decreased growth velocity (decrease over 2 SD
over 3-6 months)▫<80% ideal body weight
• 1-5% tertiary hospital admissions for <1 year olds
• Prevalence varies▫5-10% <3 years of age▫Some populations at higher risk
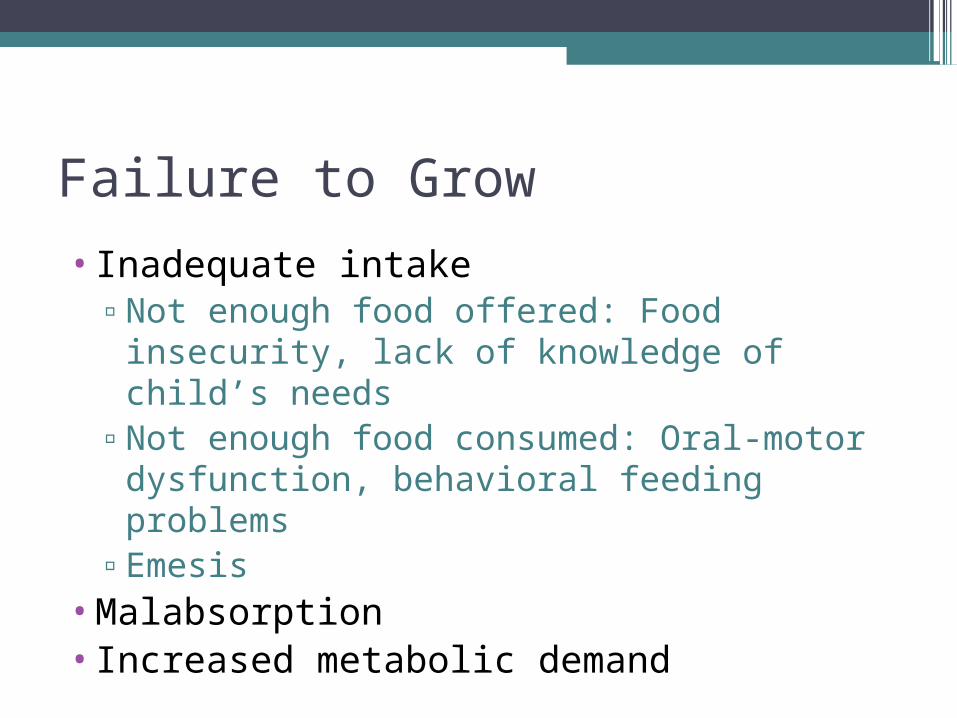
Failure to Grow
•Inadequate intake▫Not enough food offered: Food insecurity,
lack of knowledge of child’s needs▫Not enough food consumed: Oral-motor
dysfunction, behavioral feeding problems▫Emesis
•Malabsorption•Increased metabolic demand

Figure 5: Proposed algorithm[s] for identification and assessment of possible undernutrition in infancy [and childhood] (White, 2012)
Potential Pitfalls in Growth Assessment•Excuses•Assumptions•Faulty reasoning•Incorrect or
inaccurate information
•Not evidence-based
•Biased

Process
•Identify Problem or risk
•Identify Etiology•Determine intervention
•Monitor and Reevaluate


![John Zerzan - Futuro Primitivo (Edizioni Nautilus) [ITA]](https://img.pdfslide.net/doc/110x75/5571f99049795991698fe0ea/john-zerzan-futuro-primitivo-edizioni-nautilus-ita.jpg)

