Embed Size (px)
Citation preview
INFECTION PREVENTION AND CONTROL GUIDELINES
CRITICAL APPRAISAL TOOL KIT

TO PROMOTE AND PROTECT THE HEALTH OF CANADIANS THROUGH LEADERSHIP, PARTNERSHIP, INNOVATION AND ACTION IN PUBLIC HEALTH.
—Public Health Agency of Canada
Également disponible en français sous le titre : Lignes directrices pour la prévention et le contrôle des infections : Trousse d’outils de l’évaluation critique
To obtain additional information, please contact: Public Health Agency of Canada Address Locator 0900C2 Ottawa, ON K1A 0K9 Tel.: 613-957-2991 Toll free: 1-866-225-0709 Fax: 613-941-5366 TTY: 1-800-465-7735 E-mail: [email protected]
This publication can be made available in alternative formats upon request.
© Her Majesty the Queen in Right of Canada, as represented by the Minister of Health, 2014
Publication date: July 2014
This publication may be reproduced for personal or internal use only without permission provided the source is fully acknowledged.
Cat.: HP40-119/2014E-PDF ISBN: 978-1-100-24848-6 Pub.: 140182

The Public Health Agency of Canada (Agency) develops infection prevention and control guidelines to provide evidence-based recommendations that complement provincial/territorial public health efforts in monitoring, preventing, and controlling healthcare-associated infections. The purpose of this document, Critical Appraisal Tool Kit, is to provide a tool for evaluating the evidence base, which informs recommendations provided in the infection prevention and control guidelines series.
The Critical Appraisal Tool Kit was developed by a team of Agency staff and a Cochrane reviewer with expertise in methodology. This team reported to the Infection Prevention and Control Expert Working Group (formerly the Steering Committee on Infection Prevention and Control Guidelines). See Appendix C for list of members.
The information in this document was current at the time of publication. Research and revisions to keep pace with advances and/or changes in approach to critical appraisal may be necessary.

0 | Infection Prevention and Control Guidelines: Critical Appraisal Tool Kit
1 | Infection Prevention and Control Guidelines: Critical Appraisal Tool Kit
TABLE OF CONTENTS
Part 1: Instructions and Definitions .............................................................................................. 3
Part 2: Tools for Naming the Study Design, Evidence Grading and Writing Recommendations .. 7
Part 3: Critical Appraisal Tools .................................................................................................. 27
Critical Appraisal Tool Dictionary – Analytic Study ........................................................................ 28
Critical Appraisal Tool – Analytic Study ......................................................................................... 40
Critical Appraisal Tool Dictionary – Descriptive Study ................................................................... 44
Critical Appraisal Tool – Descriptive Study .................................................................................... 52
Critical Appraisal Tool Dictionary – Literature Review ................................................................... 54
Critical Appraisal Tool – Literature Review .................................................................................... 65
Appendix A: Glossary, Abbreviations and Common Statistical Tests ........................................ 69
Appendix B: Sample Evidence Summary Table with Recommendations................................... 79
Appendix C: Infection Prevention and Control Expert Working Group Members ...................... 82
Bibliography .............................................................................................................................. 84
List of Tables Table 1 – Definition of Terms Used to Evaluate Evidence ........................................................... 6
Table 2 – Analytic and Descriptive Study Designs .................................................................... 20
Table 3 – Relevant Content for an Evidence Summary Table ................................................... 24
Table 4 – Criteria for Rating Evidence on Which Recommendations are Based........................ 26
Table 5 – Summary of Common Statistical Tests ...................................................................... 77
Table 6 – Sample Evidence Summary Table with Recommendations ....................................... 79
List of Figures
Figure 1: Algorithm – Choosing the Appropriate Tool ................................................................10
Figure 2: Algorithm – Naming the Type of Analytic Study ..........................................................13
Figure 3: Algorithm – Naming the Type of Descriptive Study.....................................................16
Figure 4: Algorithm – Naming the Type of Literature Review.....................................................19

2 | Part 1: Instructions and Definitions

3 | Part 1: Instructions and Definitions
PART 1: INSTRUCTIONS AND DEFINITIONS
4 | Part 1: Instructions and Definitions
INTRODUCTION
This tool kit has been developed for the critical appraisal of scientific literature. A Guideline Development Group can utilize this tool kit to promote consistency in the appraisal of a body of evidence, grading the evidence and developing recommendations from them. Although this tool kit will also be useful for appraising background studies for the purposes of research, writing review articles and policy development, it does not provide instructions on how to conduct the literature review.
The tool kit consists of:
1. Evidence Grading System and definitions
2. Five sets of tools:
a) Tools for naming the study design (algorithms with legends)
b) Instructions for writing evidence summary tables and recommendations
c) Analytic Study Critical Appraisal Tool Dictionary and Critical Appraisal Tool
d) Descriptive Study Critical Appraisal Tool Dictionary and Critical Appraisal Tool
e) Literature Review Critical Appraisal Tool Dictionary and Critical Appraisal Tool
3. Sample of an evidence summary table with recommendations
Instructions to Reviewers
When reviewing research, questions are framed to help identify the literature needed, formulate arguments and make recommendations. For the purposes of guideline development, these are called Key Questions (see glossary). Prior to making decisions about including an identified study, read it through briefly to ascertain what was done. If more than one research question was addressed or multiple research methods were used, identify those aspects that are relevant to your Key Question. Note that one aspect of a study may be relevant to one Key Question, and a separate aspect relevant to a different Key Question, with different methods being used and different quality of methodology. A study that is used to support different conclusions needs to be re-read for each Key Question.
Although most of critical appraisal is based on reading the methods and results, the discussion and conclusion sections can be helpful for identifying other explanations for the results, biases, power, etc. However, as a reviewer, your conclusions about a study should be based on the methods and results and not on the author’s conclusions.
Once the literature has been identified, the studies will require critical appraisal. The purpose of this tool kit is to help identify if the evidence reviewed sufficiently demonstrates an association between exposure (e.g., interventions, risk factors, protective factors, or demographic factors) and outcome while ruling out other explanations for the outcome reported.
The steps to follow are:
1. Identify why you are reviewing the article. When you read the study, focus on methods and outcomes relevant to your Key Question. Many studies have primary and possibly secondary outcomes and you may only be interested in one of these, so focus on your area of interest.
5 | Part 1: Instructions and Definitions
2. Read the methods section of the study for an overview of the research methods used. If you are interested in different aspects of a study and different methods or study designs were used in those aspects, then you need to appraise each aspect separately. For example, a cross-sectional design might be used to identify prevalence while a case control design nested in a cohort study might be used to identify risk factors.
3. Name the study design, referring back to the methods used for the study. Working through the steps of the algorithms will help you identify the design and choose the appropriate Critical Appraisal Tool (CAT).
Naming the design and choosing the appropriate CAT will help ensure that you appraise limitations associated with that particular design.
For outbreak reports, use the algorithms to determine which design type applies.
If you have difficulty naming the study design, discuss with colleagues and choose the closest design in order to identify the most likely concerns to appraise.
Do not accept the author’s identification of the study design unless you agree.
4. Describe the study’s content (related to the Key Question) in the Evidence Summary Table.
Guidelines for identifying relevant content are provided.
Focus on the content that is relevant to the Key Question.
5. Critically appraise the study using the appropriate CAT.
There are three types of CATs, each with its own dictionary to guide you along this process. It is important to realize that these dictionaries do not provide a thorough explanation of all concepts or illustrate them with all possible examples. Therefore you, as a reviewer, will need to use judgment to interpret the criteria and apply them to the study under review and where uncertain, discuss with colleagues.
6. Add your critical appraisal results and comments to the last column of the Evidence Summary Table.
7. Summarize the nature of the studies and conclusions relevant to the Key Question to form the basis of recommendations. Conclusions about the quality of the evidence are generally made by group consensus rather than by individual decision. Depending on your purpose for doing the critical appraisal, it may be helpful to develop a narrative summary of the evidence and rationale for the rating assigned.
Critical appraisal can be time consuming as it requires attention to detail and experience in evaluating each critical appraisal item. Although the first few critical appraisals you conduct will take longer to complete, with experience and training, you will be able to critically appraise articles faster. Analytic studies tend to take more time to appraise than descriptive studies and complex or poorly written articles will generally take longer to appraise. Discussion with colleagues at various steps is helpful in conducting critical appraisals.
The purpose of critical appraisal is to assess study quality. This tool kit ranks studies as high, medium or low quality. The tool kit provides enough guidance to identify the issues to be discussed and leaves room for the reviewer’s discretion in applying critical appraisal criteria. There is no perfect study and critical appraisal is not an exact science.
6 | Part 1: Instructions and Definitions
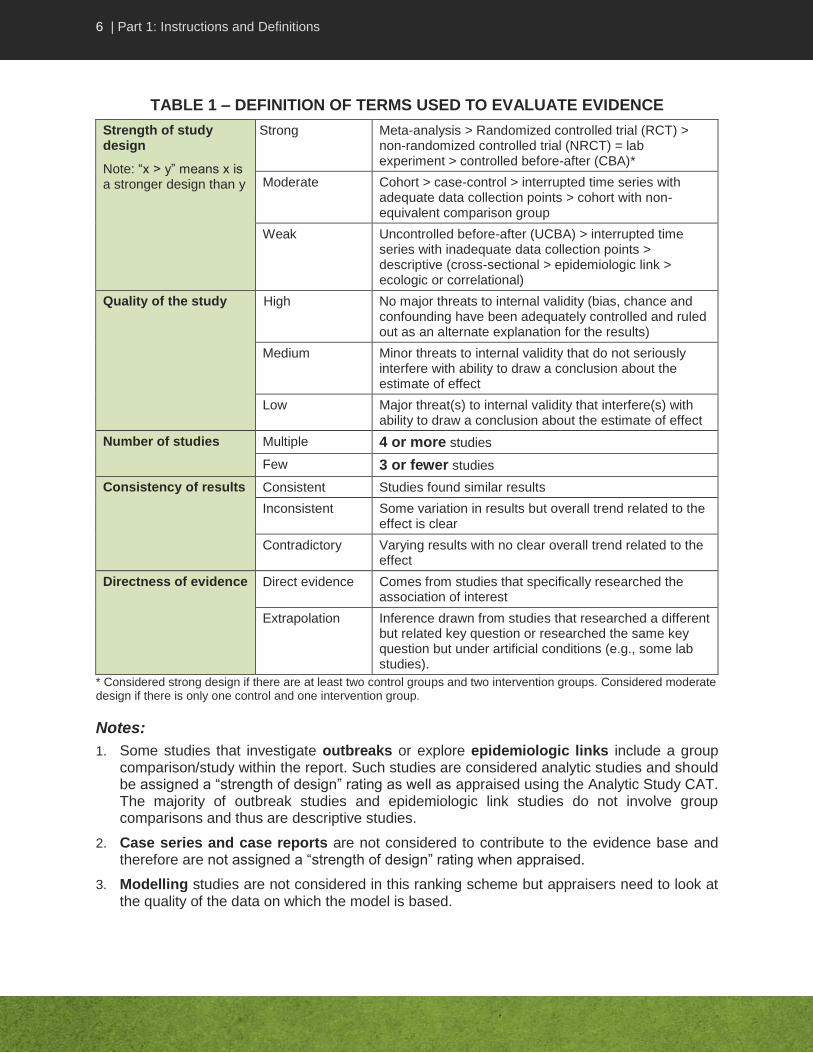
TABLE 1 – DEFINITION OF TERMS USED TO EVALUATE EVIDENCE
Strength of study design
Note: “x > y” means x is a stronger design than y
Strong Meta-analysis > Randomized controlled trial (RCT) > non-randomized controlled trial (NRCT) = lab experiment > controlled before-after (CBA)*
Moderate Cohort > case-control > interrupted time series with adequate data collection points > cohort with non-equivalent comparison group
Weak Uncontrolled before-after (UCBA) > interrupted time series with inadequate data collection points > descriptive (cross-sectional > epidemiologic link > ecologic or correlational)
Quality of the study High No major threats to internal validity (bias, chance and confounding have been adequately controlled and ruled out as an alternate explanation for the results)
Medium Minor threats to internal validity that do not seriously interfere with ability to draw a conclusion about the estimate of effect
Low Major threat(s) to internal validity that interfere(s) with ability to draw a conclusion about the estimate of effect
Number of studies Multiple 4 or more studies
Few 3 or fewer studies
Consistency of results Consistent Studies found similar results
Inconsistent Some variation in results but overall trend related to the effect is clear
Contradictory Varying results with no clear overall trend related to the effect
Directness of evidence Direct evidence Comes from studies that specifically researched the association of interest
Extrapolation Inference drawn from studies that researched a different but related key question or researched the same key question but under artificial conditions (e.g., some lab studies).
* Considered strong design if there are at least two control groups and two intervention groups. Considered moderate design if there is only one control and one intervention group.
Notes:
1. Some studies that investigate outbreaks or explore epidemiologic links include a group comparison/study within the report. Such studies are considered analytic studies and should be assigned a “strength of design” rating as well as appraised using the Analytic Study CAT. The majority of outbreak studies and epidemiologic link studies do not involve group comparisons and thus are descriptive studies.
2. Case series and case reports are not considered to contribute to the evidence base and therefore are not assigned a “strength of design” rating when appraised.
3. Modelling studies are not considered in this ranking scheme but appraisers need to look at the quality of the data on which the model is based.

7 | Part 2: Tools for Naming the Study Design, Evidence Grading and Writing Recommendations
PART 2: TOOLS FOR NAMING THE STUDY DESIGN, EVIDENCE GRADING AND WRITING RECOMMENDATIONS
8 | Part 2: Tools for Naming the Study Design, Evidence Grading and Writing Recommendations
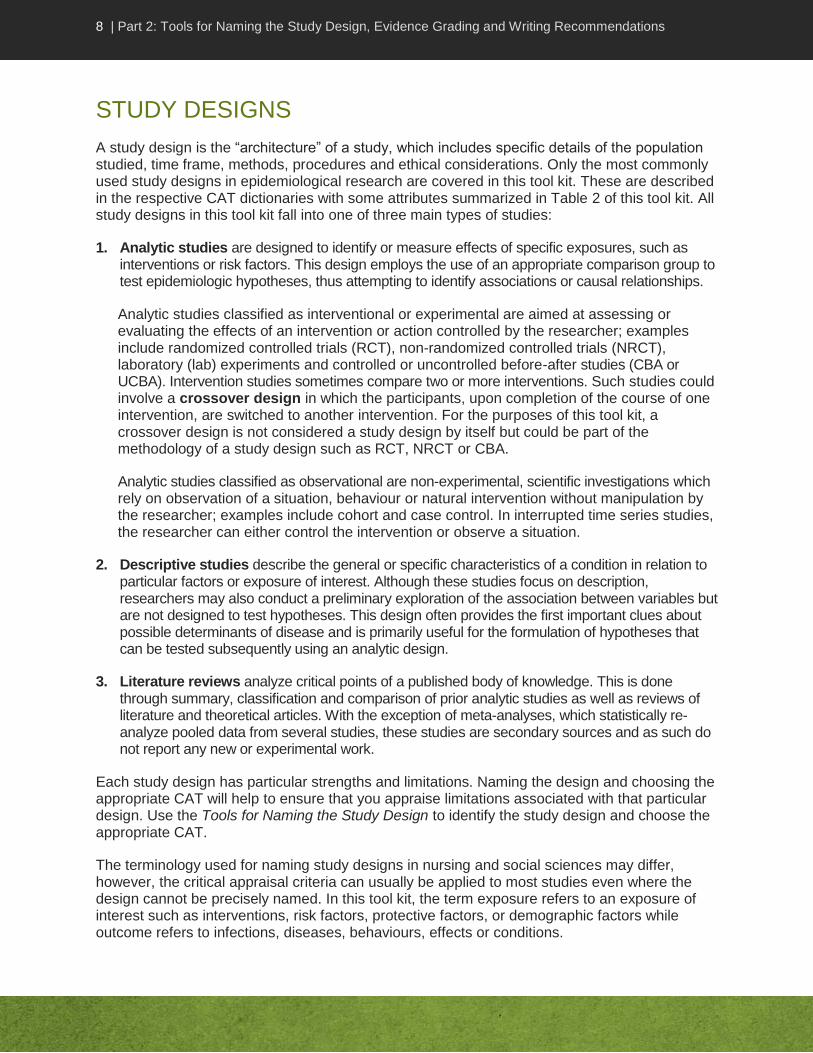
STUDY DESIGNS
A study design is the “architecture” of a study, which includes specific details of the population studied, time frame, methods, procedures and ethical considerations. Only the most commonly used study designs in epidemiological research are covered in this tool kit. These are described in the respective CAT dictionaries with some attributes summarized in Table 2 of this tool kit. All study designs in this tool kit fall into one of three main types of studies:
1. Analytic studies are designed to identify or measure effects of specific exposures, such as interventions or risk factors. This design employs the use of an appropriate comparison group to test epidemiologic hypotheses, thus attempting to identify associations or causal relationships.
Analytic studies classified as interventional or experimental are aimed at assessing or evaluating the effects of an intervention or action controlled by the researcher; examples include randomized controlled trials (RCT), non-randomized controlled trials (NRCT), laboratory (lab) experiments and controlled or uncontrolled before-after studies (CBA or UCBA). Intervention studies sometimes compare two or more interventions. Such studies could involve a crossover design in which the participants, upon completion of the course of one intervention, are switched to another intervention. For the purposes of this tool kit, a crossover design is not considered a study design by itself but could be part of the methodology of a study design such as RCT, NRCT or CBA.
Analytic studies classified as observational are non-experimental, scientific investigations which rely on observation of a situation, behaviour or natural intervention without manipulation by the researcher; examples include cohort and case control. In interrupted time series studies, the researcher can either control the intervention or observe a situation.
2. Descriptive studies describe the general or specific characteristics of a condition in relation to particular factors or exposure of interest. Although these studies focus on description, researchers may also conduct a preliminary exploration of the association between variables but are not designed to test hypotheses. This design often provides the first important clues about possible determinants of disease and is primarily useful for the formulation of hypotheses that can be tested subsequently using an analytic design.
3. Literature reviews analyze critical points of a published body of knowledge. This is done through summary, classification and comparison of prior analytic studies as well as reviews of literature and theoretical articles. With the exception of meta-analyses, which statistically re-analyze pooled data from several studies, these studies are secondary sources and as such do not report any new or experimental work.
Each study design has particular strengths and limitations. Naming the design and choosing the appropriate CAT will help to ensure that you appraise limitations associated with that particular design. Use the Tools for Naming the Study Design to identify the study design and choose the appropriate CAT.
The terminology used for naming study designs in nursing and social sciences may differ, however, the critical appraisal criteria can usually be applied to most studies even where the design cannot be precisely named. In this tool kit, the term exposure refers to an exposure of interest such as interventions, risk factors, protective factors, or demographic factors while outcome refers to infections, diseases, behaviours, effects or conditions.

9 | Part 2: Tools for Naming the Study Design, Evidence Grading and Writing Recommendations
These tools were not designed to appraise studies that assess performance of diagnostic tools (e.g., studies that assess specificity and sensitivity). Although the criteria may be applied to such studies, more appropriate tools may be available. Another type of study design not covered in this tool kit is mathematical modelling. Such studies utilize a mathematical form consisting of an equation and associated parameters to simulate a process, system or relationship. The equation is developed using primary or secondary data sources. In epidemiology, mathematical models are used to help explain or predict the outcome of disease transmission, interventions, treatments or risk factors.
10 | Part 2: Tools for Naming the Study Design, Evidence Grading and Writing Recommendations
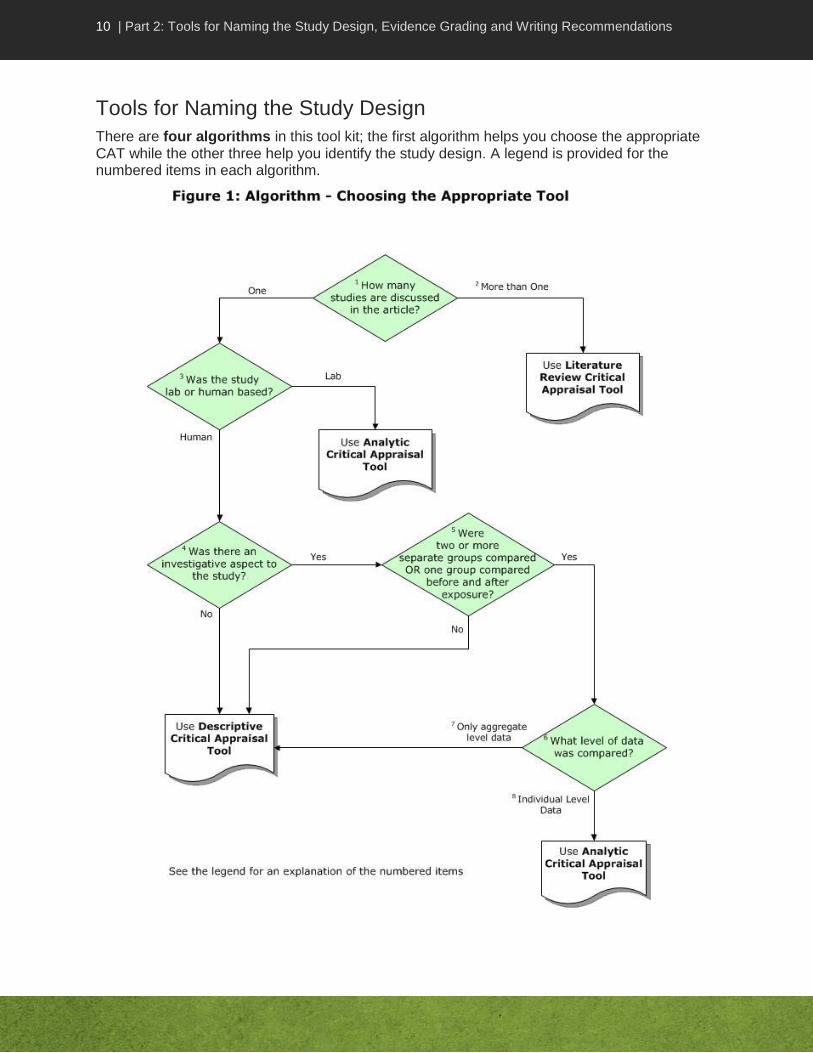
Tools for Naming the Study Design
There are four algorithms in this tool kit; the first algorithm helps you choose the appropriate CAT while the other three help you identify the study design. A legend is provided for the numbered items in each algorithm.

11 | Part 2: Tools for Naming the Study Design, Evidence Grading and Writing Recommendations
Legend for: Choosing the Appropriate Tool Algorithm
1. How many studies are discussed in the article? Critical appraisal of a single study is different from critical appraisal of a body of evidence (more than one study). Different tools are available to guide you in the critical appraisal process. To choose the right tool, first determine if the article you are reading is a report of a single study or a report of several studies.
2. More than one study. Literature reviews, literature summaries, systematic reviews, meta-analyses and guidelines are examples of articles that report on several studies at the same time. They should be appraised using the Literature Review CAT. Use the “Algorithm for Naming the Type of Literature Review” to identify the type of literature review.
3. Was the study lab or human based? Lab-based studies are generally controlled experiments and thus warrant use of the Analytic Study CAT. Using a lab-based technique or assay to provide information does not make it a lab study; for example, studies that report lab results such as molecular typing in the context of patient infections or contamination in an outbreak are not lab-based studies. Conversely, lab experiments may involve human participants in a lab or artificial setting.
4. Was there an investigative aspect to the study? The study may be limited to a description of incidence(s) or may involve investigating a link e.g., between cases or conditions.
5. Were two or more separate groups compared or one group compared before and after exposure? In an analytic study, there is a hypothesis being tested about the effects of an exposure in one group compared to a control group. Studies may assess exposures of interest (e.g., risk factors, interventions, protective or demographic factors) and/or outcomes (e.g., infections, diseases, behaviours, effects or conditions) in more than one group of interest.
In an intervention study (such as controlled trials), when two or more groups are compared in a study on the effects of an exposure, they are usually described as a control or comparison group and intervention or experimental group. Different terms are used in an observational study (e.g., case control or cohort) to assess risk or protective factors or natural interventions not manipulated by the researcher. In a case-control study, the two groups are cases and controls. In a cohort study, they are called the exposed and non-exposed groups.
In some studies, one group may be assessed pre-exposure and again post-exposure, or the pre-exposure and post-exposure group may consist of different individuals. In other studies, there may be several post-exposure assessment periods. Although there is only one group assessed at any one point in time, rather than two groups simultaneously, such studies should be considered as having a comparison between groups.
Outbreak/epidemiologic link investigations vary in the type of study design used. Studies that investigate epidemiologic links cannot automatically be classified as descriptive or analytic but have to be read carefully. The design type can only be assigned on an individual basis. When groups are compared in an outbreak investigation (such as in a cohort or case control study), it is considered an analytic study. Outbreak investigations with no group comparisons are considered descriptive studies.

12 | Part 2: Tools for Naming the Study Design, Evidence Grading and Writing Recommendations
Generally, descriptive studies do not have control or comparison groups although the analysis in cross-sectional studies may include a comparison of outcomes in individuals with specific factors of interest. If there is only one group assessed at one point in time, with no comparison group, use the “Algorithm for Naming the Type of Descriptive Study” to identify the study design and then appraise using the Descriptive Study Critical Appraisal Tool.
6. What level of data was compared? Level of data must be considered if there was a comparison between two separate groups, or before and after an event in the same group. To understand risk to an individual, one has to assess whether the outcome of interest occurred in the individuals exposed to the risk factor or intervention of interest. One must therefore distinguish between individual and aggregate level data.
7. Only aggregate level data. In an ecologic (or correlational) study, data are available for analysis only at the aggregate level and not at the level of the individual. It is not possible to match outcome and exposure in a particular individual. For example, surveillance results may be available to identify the number of influenza cases in a region, and vaccination data may be available regarding influenza vaccination coverage in the same region. In an ecologic study, one can analyze the rates at the group level but the data identifying whether individuals had either or both the exposure (e.g., influenza vaccination) or the outcome (e.g., influenza illness) are not available.
8. Individual level data. Studies that compare exposures and outcomes in individuals in two different groups are used to test hypotheses about associations between exposure and outcome. These are analytic studies. Use the “Algorithm for Naming the Type of Analytic Study” to identify the study design and then appraise using the Analytic Study Critical Appraisal Tool.
Lab-based studies are considered analytic studies.

13 | Part 2: Tools for Naming the Study Design, Evidence Grading and Writing Recommendations

14 | Part 2: Tools for Naming the Study Design, Evidence Grading and Writing Recommendations
Legend for: Naming the Type of Analytical Study Algorithm
1. Was the study lab or human based? Lab-based studies are generally controlled experiments, comparing outcomes under two or more different sets of conditions. Using a lab-based technique or assay to provide information does not make it a lab study; for example, studies that report lab results such as molecular typing in the context of patient infections or contamination in an outbreak are not lab-based studies. Conversely, lab experiments may involve human participants in a lab or artificial setting.
2. How were participants chosen? Based on outcome. The major distinction between case-control and other types of analytic studies is that in case-control studies, participants are selected into the study on the basis of outcome rather than exposure. For example, one might find patients with (case) and without (control) clinical influenza and compare them in terms of prior exposure to influenza vaccine. The source of the cases could be taken from a cohort (called a nested case control study). Focus your analysis on either the case control or cohort depending on your outcome of interest.
3. How were participants chosen? Based on natural exposure. In almost all analytic studies (except for case-control), participants are followed from exposure over time to see if they develop the outcome of interest. Further distinction between study designs is based on whether the exposure occurred naturally or not.
4. How were participants chosen? Based on deliberate exposure. Exposure did not occur naturally but was determined by the researcher.
Note that naming the study design is not influenced by whether participants were recruited in person or from a database such as surveillance database, registries or other. This is true regardless of whether participants were chosen by outcome, natural exposure or deliberate exposure.
5. How many groups were there and when were they assessed? It is important to identify if there was more than one group and more than one period of assessment in order to name the design.
6. One group assessed pre intervention and one group assessed post intervention. In an uncontrolled before-after design (UCBA), there is no concurrent control group. One group of participants received an intervention and results are compared before and after the intervention. The individuals in the post-intervention group may not be the same individuals as in the pre-intervention group. If they are the same, the data can be compared for each individual before and after the intervention. This improves the quality of the evidence but the design is still considered weak due to inadequacy of the control group.
7. Multiple different groups assessed over time before and after intervention/ exposure (interrupted time series or ITS): This is common with surveillance. To do appropriate trending statistics and be considered an adequate ITS, it is essential to have at least 3 baseline assessment data points and 3 post-intervention data points. It is also important to be able to identify a clear point in time at which the exposure (e.g., intervention, risk factor or other) occurred.

15 | Part 2: Tools for Naming the Study Design, Evidence Grading and Writing Recommendations
8. Intervention and control groups compared at baseline and post intervention. Intervention studies are further distinguished by whether or not participants were randomly allocated to being in the intervention and control group, and the nature of the assessment prior to the intervention. These are addressed next in 9, 10 and 11.
9. Was allocation to group random? Yes. In a randomized controlled trial (RCT), partici-pants are randomly assigned to groups by the researcher, e.g., by random number generation or a coin toss. Randomization allows for better control of unknown confounders. If the authors state that they randomly allocated to groups, call the study an RCT and assess the quality of the randomization according to the criteria in item 9 of the Analytic Study Critical Appraisal Tool.
10. Quasi-random allocation to group: In a non-randomized clinical trial (NRCT), participants are assigned to being in the intervention or control group in a systematic way that is not truly randomized, e.g., alternating between groups, or using birth years. Baseline assessment occurs at a single point in time.
11. Non-random allocation to group, baseline period of assessment: In a controlled before-after study (CBA), there is no random or quasi-random assignment to group. In general, participants are assigned as part of a natural grouping, e.g., they work together in the same geographic area. A CBA with two control and two intervention groups has better control of potential bias than a CBA with one control and one intervention group. One needs to consider the number of groups in order to distinguish a controlled before-after study (few groups) with a cluster randomized trial. In the latter, randomization occurs at the subgroup level (e.g., ward), but there are many subgroups in each of the intervention and control groups. In a CBA, there is also a period of baseline assessment, rather than baseline assessment occurring at a single point in time.
If after going through the algorithm, you are still uncertain about the study design, Table 2 may be helpful or discuss the study with your colleagues.
16 | Part 2: Tools for Naming the Study Design, Evidence Grading and Writing Recommendations

17 | Part 2: Tools for Naming the Study Design, Evidence Grading and Writing Recommendations
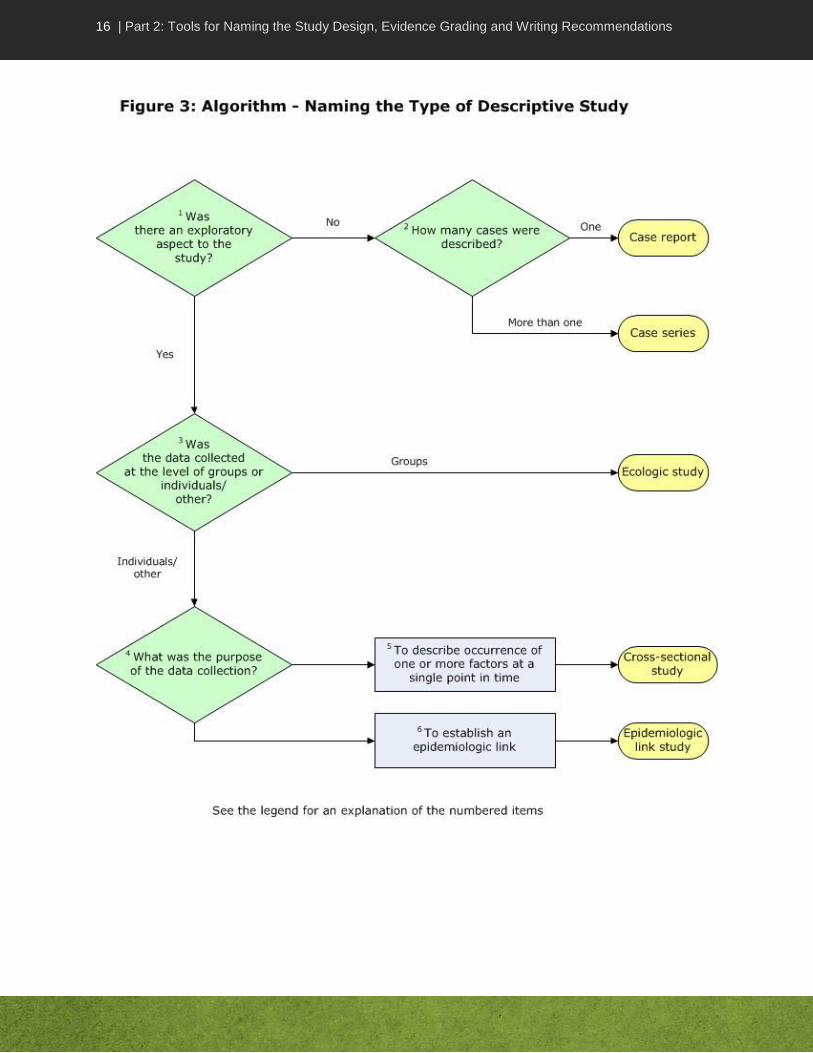
Legend for: Naming the Type of Descriptive Study Algorithm
Note: If it is unclear which study design it is (but it’s clearly not an analytic study), call it a descriptive study and use the descriptive tool to appraise it.
1. Was there an exploratory aspect to the study? The study may be limited to a description of incidence(s) or may involve investigating a link e.g., between cases or conditions. Exploratory aspects provide an additional dimension to descriptive studies.
2. How many cases were described? A case report is a detailed description of the experience of a single patient while a case series describes the experience of several patients with the same disease, exposure or characteristics.
3. Was the data collected at the level of groups or individuals? Level of data must be considered if there was a comparison between two separate groups, or before and after an event in the same group. To understand risk to an individual, one has to assess whether the outcome of interest occurred in the individuals exposed to the risk factor or intervention of interest. One must therefore distinguish between individual and aggregate level data. Data could be microbes, environmental factors, people, etc. Some studies, called ecologic (or correlational) studies, compare results for both exposure and outcome at the population or aggregate level, e.g., one can see if prevalence of antibiotic-resistant microorganisms in lab isolates increases as antibiotic consumption in the hospital increases. One does not know however if the outcome occurred in individuals exposed to the factor of interest. Individual level data are obtained for studies that compare exposures and outcomes in individuals in two different groups and used to test hypotheses about associations between exposure and outcome.
4. What was the purpose of data collection? The purpose of data collection could be one or more reasons such as describing occurring factors or establishing an epidemiologic link.
5. To describe occurrence of one or more factors at a single point in time.
A cross-sectional study describes the exposure and outcome of interest in individuals in a group at the same time; it provides a snapshot or profile at a given point in time. For example, individuals might be asked in a survey, if they had symptoms of a cold (outcome) in the week of the study and if they took Vitamin C (exposure) the same week. A cross-sectional study cannot always distinguish whether the exposure preceded the development of the outcome.
Cross-sectional studies which describe the number of individuals with the exposure (e.g., smoking habits) or outcome (e.g., infection) of interest at the point of time of the data collection are sometimes referred to as prevalence studies. Prevalence quantifies the proportion of individuals in a population who have the outcome or exposure of interest at a specific instance or period of time.
One must be careful to distinguish between a cross-sectional study and a retrospective cohort study. In all cohort studies, whether retrospective or prospective, outcomes are compared between those exposed and those not exposed to the factor of interest at the starting point of the study. Participants in both exposed and non-exposed groups are free of outcome at baseline and exposure occurred naturally (i.e., was not manipulated by the researcher).

18 | Part 2: Tools for Naming the Study Design, Evidence Grading and Writing Recommendations
A retrospective cohort study uses existing data sets (collected in the past) and follows participants forward in time from a pre-specified starting point to a pre-specified end point of time (which might also still be in the past, e.g., following participants from 2002 to 2005). A prospective cohort study collects data for the study, starting at the present (onset of the study) and going forward in time.
6. To establish an epidemiologic link. For purposes of this tool kit, epidemiologic link studies are a category of descriptive studies that consists of look-back, trace-back and contact investigations. Individuals in these studies are assessed for links (e.g., contact or microbial typing) to cases, contacts or conditions.
For outbreak investigations, the study design can only be assigned on an individual basis. Most outbreak studies do not include a group comparison; those that do are considered analytic studies, therefore refer to Figure 2 to identify the study design.

19 | Part 2: Tools for Naming the Study Design, Evidence Grading and Writing Recommendations
Legend for: Naming the Type of Literature Review Algorithm
1. Were results of individual studies and their critical appraisal clearly described? A narrative review does not provide information on the critical appraisal of the individual studies in the review but simply summarizes these studies and interprets the results. A systematic review provides details on critical appraisal process and results of the individual studies.
2. Were individual study data pooled and re-analyzed? The difference between a systematic review and a meta-analysis is that a meta-analysis quantitatively pools the data from the individual studies included in a systematic review.

20 | Part 2: Tools for Naming the Study Design, Evidence Grading and Writing Recommendations
TABLE 2 – ANALYTIC AND DESCRIPTIVE STUDY DESIGNS
Study designs presented in order of decreasing strength (as indicated in Table 1)
Study Design and Tool
Entry to Study, Groups
Baseline Assessment Conducted
Exposure* Comparison of
Outcomes
Randomized Controlled (or Clinical) Trial (RCT) Analytic
Recruited pre-intervention.
Assigned to control or intervention (experimental) group by a random allocation process (e.g. random number generation, coin toss).
Usually measured at a single point in time at entry into the study to assess degree to which outcome and other subject characteristics already exist.
Controlled by researcher.
Each individual is followed and assessed for outcomes, with results compared between groups.
Non-randomized Controlled (or Clinical) Trial (NRCT) Analytic
Recruited pre-intervention.
Assigned to control or intervention group.
Allocation is by a quasi-random process
(e.g., alternation).
Usually measured at a single point in time at entry into the study to assess degree to which outcome and other subject characteristics already exist.
Controlled by researcher.
Each individual is followed and assessed for outcomes, with results compared between groups.
Lab Experiment Analytic
Artificial situation
Control and experimental groups or lab conditions.
Yes Controlled by researcher.
Outcomes are assessed and compared between the control and experimental groups or conditions.
Controlled Before-After (CBA) Analytic
Recruited pre-intervention.
Assigned to control or intervention group.
Assignment is by a non-random process (e.g., natural grouping such as those who work in same unit)
Yes, there is a baseline period of assessment (not just a single point in time at entry)
Controlled by researcher.
Each individual is followed and assessed for outcomes, with results compared between groups.
Cohort
Analytic
Entry is based on having the exposure or not, prior to entry.
Groups are called exposed and non-exposed.
Yes, participants are known to be negative for outcome at start of study.
Exposure occurred naturally (not controlled by researcher).
Followed to see if outcome occurs.
Each individual is followed and assessed for outcomes, with results compared between exposed and non-exposed groups.

21 | Part 2: Tools for Naming the Study Design, Evidence Grading and Writing Recommendations
Study Design and Tool
Entry to Study, Groups
Baseline Assessment Conducted
Exposure* Comparison of
Outcomes
Case-Control
Analytic
Entry is based on having the outcome or not, prior to entry.
Groups are called cases if they have the outcome and controls if they do not.
Cases can often be taken from a cohort (nested case control) but selection of cases and controls are based on outcome rather than exposure.
None Exposures of interest and outcomes occurred naturally (not controlled by researcher).
Each individual is assessed for exposures, with results compared between cases and controls.
Interrupted Time Series (ITS)
Analytic
Different groups at different times e.g., surveillance
Each group likely has different individuals
Three separate data points before intervention are required for adequate analysis of trends to be done.
Exposure could be either naturally occurring or controlled by researcher.
There must be a clearly defined point in time when exposure or intervention occurred.
Exposures or outcomes are measured at the individual level but may be reported as aggregate.
Results are compared between time periods. Three separate data points after the intervention are also required.
Uncontrolled Before-After (UCBA)
Analytic
There is only one group at a time. The group is assessed at baseline, given the intervention, and reassessed after the intervention.
The same individuals may or may not be in the pre and post groups.
There is no concurrent control group, even if individuals ultimately serve as their own controls.
Yes Exposure could be naturally occurring but is usually controlled by researcher.
Results are compared between the two time periods.
22 | Part 2: Tools for Naming the Study Design, Evidence Grading and Writing Recommendations
Study Design and Tool
Entry to Study, Groups
Baseline Assessment Conducted
Exposure* Comparison of
Outcomes
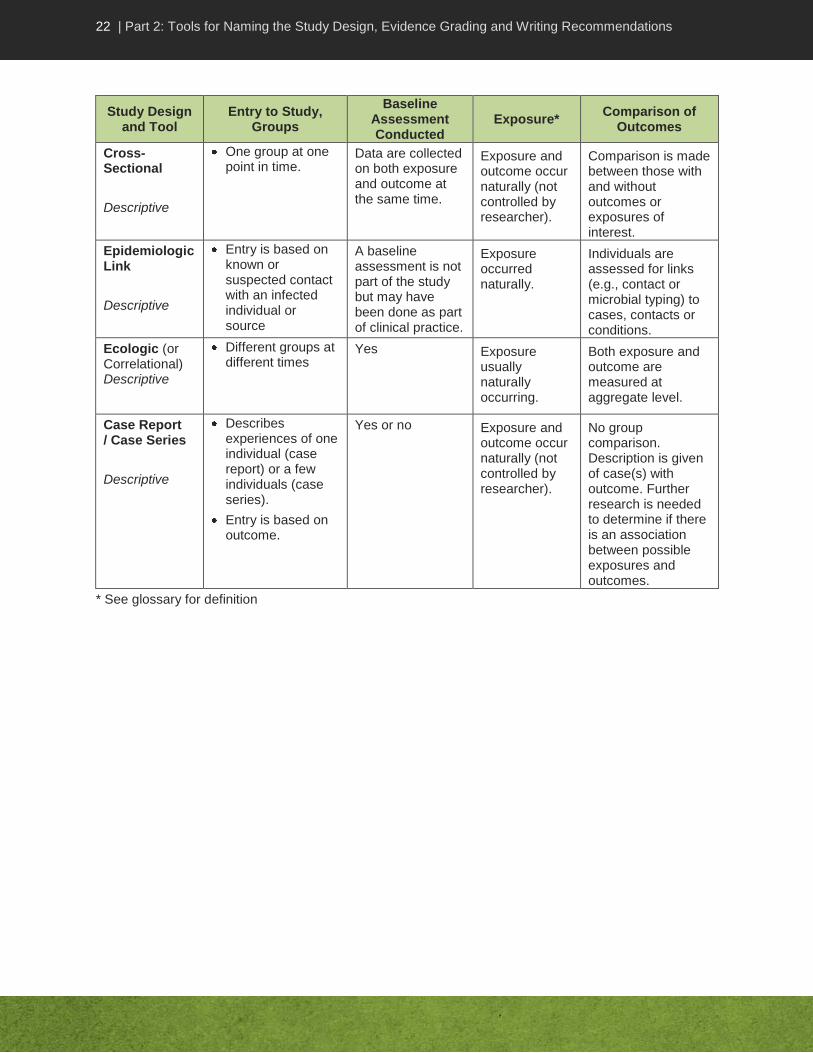
Cross-Sectional
Descriptive
One group at one point in time.
Data are collected on both exposure and outcome at the same time.
Exposure and outcome occur naturally (not controlled by researcher).
Comparison is made between those with and without outcomes or exposures of interest.
Epidemiologic Link
Descriptive
Entry is based on known or suspected contact with an infected individual or source
A baseline assessment is not part of the study but may have been done as part of clinical practice.
Exposure occurred naturally.
Individuals are assessed for links (e.g., contact or microbial typing) to cases, contacts or conditions.
Ecologic (or Correlational) Descriptive
Different groups at different times
Yes Exposure usually naturally occurring.
Both exposure and outcome are measured at aggregate level.
Case Report / Case Series
Descriptive
Describes experiences of one individual (case report) or a few individuals (case series).
Entry is based on outcome.
Yes or no Exposure and outcome occur naturally (not controlled by researcher).
No group comparison. Description is given of case(s) with outcome. Further research is needed to determine if there is an association between possible exposures and outcomes.
* See glossary for definition

23 | Part 2: Tools for Naming the Study Design, Evidence Grading and Writing Recommendations
Evidence Summary Table and Writing Recommendations
An Evidence Summary Table simplifies looking at the studies as a body of evidence for or against an argument related to the Key Question. At a glance, one can compare across studies, designs, sample sizes, interventions, similarity of participants and outcome measures. Relevant issues related to strengths and limitations of the study, summary of results relevant to the Key Question and conclusions are also provided. The Evidence Summary Table facilitates discussion of the strength of the evidence, issues identified in the critical appraisal, and recommendations.
In the guideline development process, two reviewers are needed to critically appraise each study. The reviewers assigned to a given Key Question and its related studies are responsible for populating the Evidence Summary Table with information related to the Key Question.
The rows in an Evidence Summary Table contain the information about the individual studies, while the columns reflect the type of detail to be included. Note that the second column in the sample Evidence Summary Table, shown in Appendix B, “Relevant Methods and Outcome Measures”, could be divided into two columns, depending on the amount of information to be included. Using landscape format, bullet points (not full sentences) and acceptable abbreviations promotes efficiency. Table 3 summarizes the content to consider adding to the Evidence Summary Table.
Note that the studies should be listed in the table in descending order of strength of design, with meta-analysis listed first and case reports last if included at all. The complete body of evidence (not just one study) should be reviewed and discussed with your colleagues before making a recommendation.
24 | Part 2: Tools for Naming the Study Design, Evidence Grading and Writing Recommendations
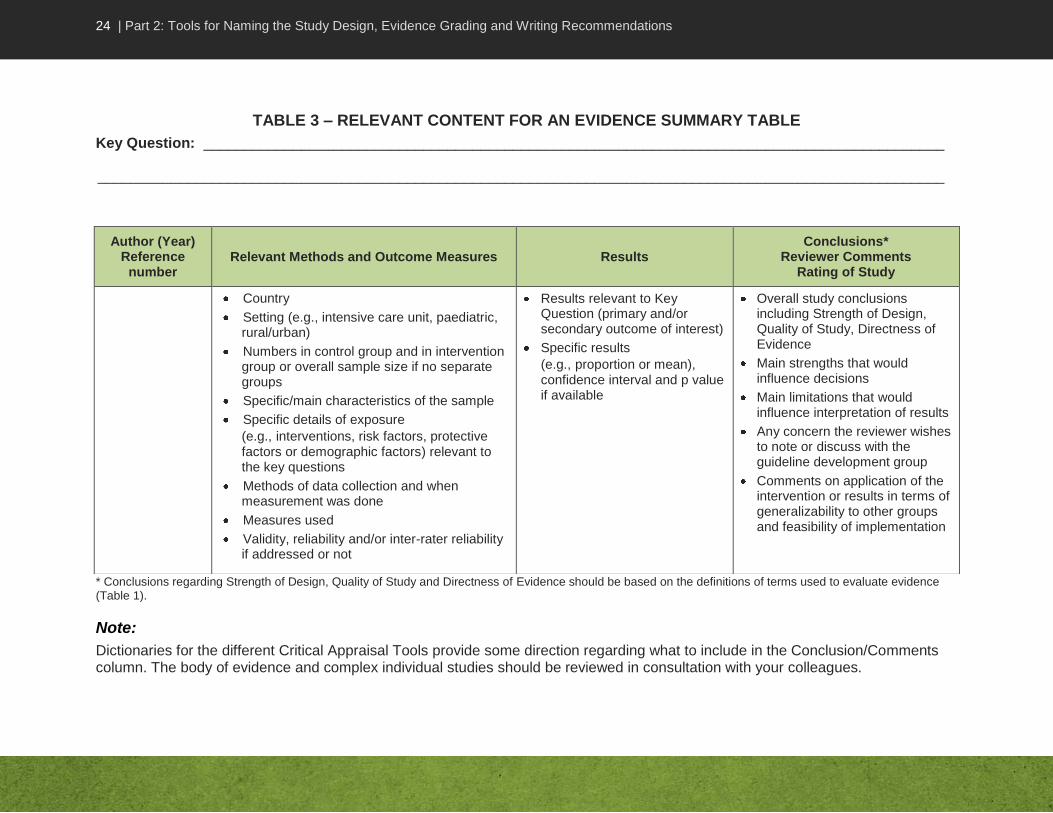
TABLE 3 – RELEVANT CONTENT FOR AN EVIDENCE SUMMARY TABLE
Key Question: ___________________________________________________________________________________________
________________________________________________________________________________________________________
* Conclusions regarding Strength of Design, Quality of Study and Directness of Evidence should be based on the definitions of terms used to evaluate evidence (Table 1).
Note:
Dictionaries for the different Critical Appraisal Tools provide some direction regarding what to include in the Conclusion/Comments column. The body of evidence and complex individual studies should be reviewed in consultation with your colleagues.
Author (Year) Reference
number Relevant Methods and Outcome Measures Results
Conclusions* Reviewer Comments
Rating of Study
Country
Setting (e.g., intensive care unit, paediatric, rural/urban)
Numbers in control group and in intervention group or overall sample size if no separate groups
Specific/main characteristics of the sample
Specific details of exposure
(e.g., interventions, risk factors, protective factors or demographic factors) relevant to the key questions
Methods of data collection and when measurement was done
Measures used
Validity, reliability and/or inter-rater reliability if addressed or not
Results relevant to Key Question (primary and/or secondary outcome of interest)
Specific results
(e.g., proportion or mean), confidence interval and p value if available
Overall study conclusions including Strength of Design, Quality of Study, Directness of Evidence
Main strengths that would influence decisions
Main limitations that would influence interpretation of results
Any concern the reviewer wishes to note or discuss with the guideline development group
Comments on application of the intervention or results in terms of generalizability to other groups and feasibility of implementation

25 | Part 2: Tools for Naming the Study Design, Evidence Grading and Writing Recommendations
Making a Recommendation
The Evidence Summary Table allows reviewers to see the magnitude and consistency of an effect across studies, and draw a conclusion. The next step depends on the purpose of doing the critical appraisal. For example, in guideline development this will be to make a recommendation for practice and to assign a grade of evidence to it. Table 4 summarizes the criteria for grading evidence using this tool kit.
In making recommendations, reviewers should ensure the recommendation is:
based on a valid conclusion drawn from the available evidence
stated in the active voice
Other aspects to consider are:
amount, quality and consistency of evidence
impact of the recommendation on practice and cost if implemented
feasibility of implementation
Notes Regarding Grading of Evidence:
1. When a recommendation is based on a regulation, no grading shall apply.
2. Grades are applied to the evidence and not to the recommendation.
3. The grade assigned to a systematic review will depend on the critical appraisal of all aspects of the evidence reported (strength of study design, quality of the study, number of studies included in the review, consistency of results among the studies and the directness of evidence). If the systematic review has been shown to be of high quality following the critical appraisal, use the results as evidence and apply a grade to the evidence. If the systematic review is shown to be of medium or low quality, careful consideration should be given to whether or not to use the results as evidence.
Summarizing the Evidence in a Text
Depending on the purpose of the critical appraisal, it may be helpful to provide a text summary of the evidence and rationale for the rating assigned. This should include the Key Question being addressed and relevant information related to:
number of studies included in the evidence summary
types of studies included (e.g., number of each design and strength)
summary statement of results (e.g., consistent or variable, trend or statistically significant, effect or no effect)
strength of evidence overall in support of a recommendation
issues to be considered in making a recommendation (e.g., if more literature should be sought, feasibility, costs, etc.)

26 | Part 2: Tools for Naming the Study Design, Evidence Grading and Writing Recommendations
TABLE 4 – CRITERIA FOR RATING EVIDENCE ON WHICH RECOMMENDATIONS ARE BASED
Grade of Evidence
Strength of
Evidence Grades Criteria
Strong
AI Direct evidence from meta-analysis or multiple strong design studies of high quality, with consistency of results
AII
Direct evidence from multiple strong design studies of medium quality with consistency of results
OR
At least one strong design study with support from multiple moderate design studies of high quality, with consistency of results
OR
At least one strong design study of medium quality with support from extrapolation from multiple strong-design studies of high quality, with consistency of results
Moderate
BI
Direct evidence from multiple moderate design studies of high quality with consistency of results
OR
Extrapolation from multiple strong design studies of high quality, with consistency of results
BII
Direct evidence from any combination of strong or moderate design studies of high/medium quality, with a clear trend but some inconsistency of results
OR
Extrapolation from multiple strong design studies of medium quality or moderate design studies of high/medium quality, with consistency of results
OR
One strong design study with support from multiple weak design studies of high/medium quality with consistency of results
Weak
CI
Direct evidence from multiple weak design studies of high/medium quality, with consistency of results
OR
Extrapolation from any combination of strong/moderate design studies of high/medium quality, with inconsistency of results
CII
Studies of low quality regardless of study design
OR
Contradictory results regardless of study design
OR
Case series/case reports
OR
Expert opinion

27 | Part 3: Critical Appraisal Tools
PART 3: CRITICAL APPRAISAL TOOLS

28 | Part 3: Critical Appraisal Tools—Analytic Study
CRITICAL APPRAISAL TOOL DICTIONARY – ANALYTIC STUDY
Introduction
The purpose of the Analytic Study Critical Appraisal Tool (CAT) is to help reviewers assess the usefulness of results from a single analytic study. This dictionary provides some background on how to conduct a critical appraisal of an analytic study and describes items in the tool for rating the quality of the study and its evidence. It is important to realize that this dictionary does not provide a thorough explanation of all concepts or illustrate these with all possible examples. Therefore the reviewer must use judgment in interpreting the criteria and applying them to the study under review.
The criteria here are applicable to all analytic studies. These studies may assess exposures of interest (e.g., risk factors, interventions, protective or demographic factors) and/or outcomes (e.g., infections, diseases, behaviours, effects or health conditions) in more than one group of interest. Additional clarification is provided when distinctions are relevant for a particular study design.
Use this tool to assess randomized controlled trials, non-randomized controlled trials, controlled before-after studies, lab-based studies, cohort studies, case-control studies, interrupted time series studies and uncontrolled before-after studies. A summary of some attributes of each study design can be found in Table 2, Part 2 of this tool kit. Mathematical modelling studies are not covered in this tool kit.
Critical Appraisal of the Validity of an Analytic Study
The main purpose of critical appraisal is to assess for internal validity and statistical conclusion validity. Internal validity refers to the extent to which it is possible to infer (conclude) that the exposure of interest is truly causing or influencing the outcome of interest and that the relationship between the two is not artificial or the effect of a different extraneous factor. Statistical conclusion validity means that there is in fact a relationship between the exposure and outcome that is not due to chance alone. If there is strong internal and statistical conclusion validity, there is strong evidence for the association of interest and one can then consider its applicability to other settings. If there is no evidence for an association, then it is pointless to discuss application of findings elsewhere.
Instructions
Start your critical appraisal by identifying the study design. If you are unable to identify the study design, discuss with your colleagues and choose the closest study design. Score each item on the tool as strong, moderate or weak, according to the criteria described here. Not all criteria will be applicable to all study designs. Unless otherwise specified, most or all of the applicable criteria listed for all ratings should be met for the item to get the identified rating. With some criteria for a “weak” rating, indicated by the phrase “any of the following”, the item should be rated as weak if even only one of the criteria has been met.
29 | Part 3: Critical Appraisal Tools—Analytic Study
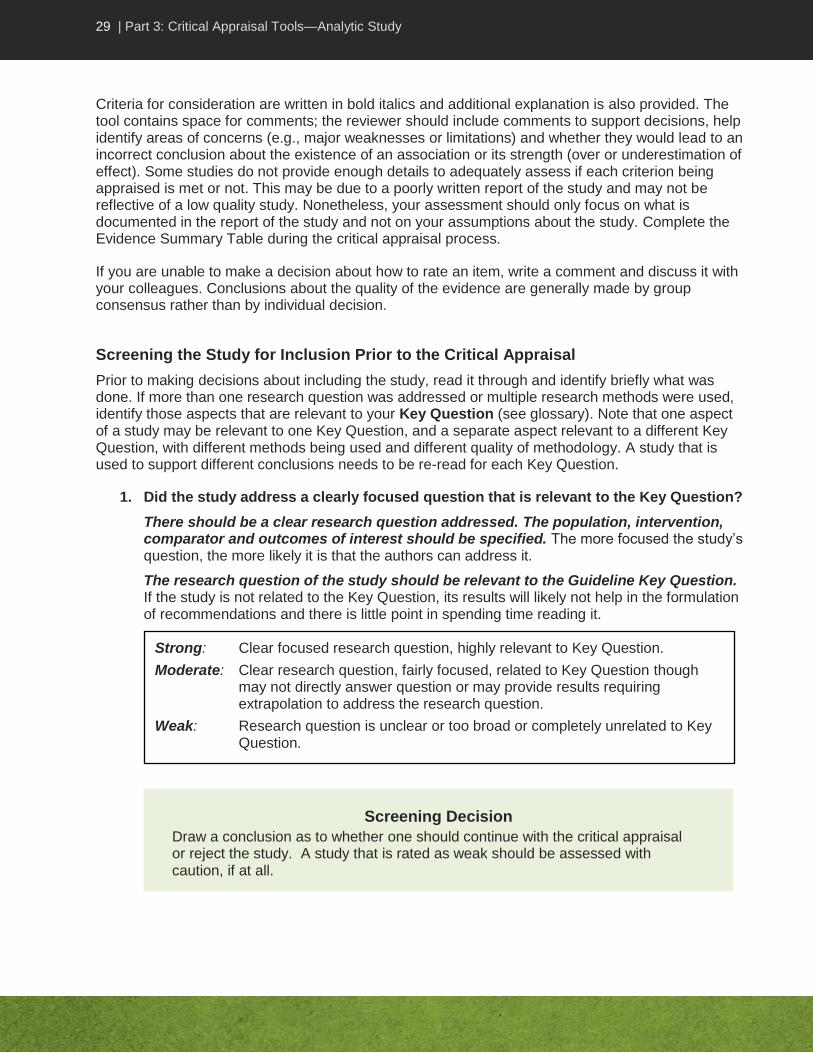
Criteria for consideration are written in bold italics and additional explanation is also provided. The tool contains space for comments; the reviewer should include comments to support decisions, help identify areas of concerns (e.g., major weaknesses or limitations) and whether they would lead to an incorrect conclusion about the existence of an association or its strength (over or underestimation of effect). Some studies do not provide enough details to adequately assess if each criterion being appraised is met or not. This may be due to a poorly written report of the study and may not be reflective of a low quality study. Nonetheless, your assessment should only focus on what is documented in the report of the study and not on your assumptions about the study. Complete the Evidence Summary Table during the critical appraisal process.
If you are unable to make a decision about how to rate an item, write a comment and discuss it with your colleagues. Conclusions about the quality of the evidence are generally made by group consensus rather than by individual decision.
Screening the Study for Inclusion Prior to the Critical Appraisal
Prior to making decisions about including the study, read it through and identify briefly what was done. If more than one research question was addressed or multiple research methods were used, identify those aspects that are relevant to your Key Question (see glossary). Note that one aspect of a study may be relevant to one Key Question, and a separate aspect relevant to a different Key Question, with different methods being used and different quality of methodology. A study that is used to support different conclusions needs to be re-read for each Key Question.
1. Did the study address a clearly focused question that is relevant to the Key Question?
There should be a clear research question addressed. The population, intervention, comparator and outcomes of interest should be specified. The more focused the study’s question, the more likely it is that the authors can address it.
The research question of the study should be relevant to the Guideline Key Question. If the study is not related to the Key Question, its results will likely not help in the formulation of recommendations and there is little point in spending time reading it.
Screening Decision
Draw a conclusion as to whether one should continue with the critical appraisal or reject the study. A study that is rated as weak should be assessed with caution, if at all.
Strong: Clear focused research question, highly relevant to Key Question.
Moderate: Clear research question, fairly focused, related to Key Question though may not directly answer question or may provide results requiring extrapolation to address the research question.
Weak: Research question is unclear or too broad or completely unrelated to Key Question.

30 | Part 3: Critical Appraisal Tools—Analytic Study
Assessment of Study Population (Sample) and Sampling Method
2. The individuals selected to participate in the study should be representative of the target population.
The sample must represent the target population if inferences drawn from the data are to be valid for that group. Multiple strategies (e.g., personal discussion, posters, and media campaigns) can be used to recruit participants from a variety of sources (e.g., hospital and community setting). Recruitment means inviting and encouraging potential participants to participate. However, selection means choosing the participants from those that are available. In addition, one should consider how the individuals were selected for inclusion in the database and whether all target groups would be included in the database used.
In some studies, recruitment is not applicable, for example, studies using existing databases or lab studies without human participants. In such studies, selection still needs to be considered. An appropriate administrative or other database that is likely to include the population of interest should be used for studies using databases. For a lab-based study with human participants, recruitment methods are relevant.
3. Adequacy of control of selection bias.
Selection bias occurs if there is a systematic error in identifying the study population, most specifically if there are systematic differences in the relationship between exposure and outcome in the control and intervention groups. Selection bias exists if the relationship between exposure and outcome is different in those who participate and those who could theoretically be eligible but do not participate. This discrepancy is only important if it could influence the association between exposure and outcome (e.g., individuals more likely to benefit from the intervention are also more likely to participate).
Strong: Multiple strategies used; recruited/selected from a variety of locations or groups; or the entire target population was included. Participants (or sample) clearly have the targeted characteristics or the appropriate administrative database was used.
Moderate: Participants were drawn from a single source that may have excluded members of the target population. Participants (or sample) seem to have the targeted characteristics.
Weak: Participants were self-referred or volunteers or it is not clear from the description if they (or the sample) have the characteristics targeted, or they clearly do not have the characteristics.
If critical appraisal is to be continued, name the study design (using the appropriate algorithm in Part 2), and complete the Evidence Summary
Table in addition to the CAT as you go through the review process.
31 | Part 3: Critical Appraisal Tools—Analytic Study
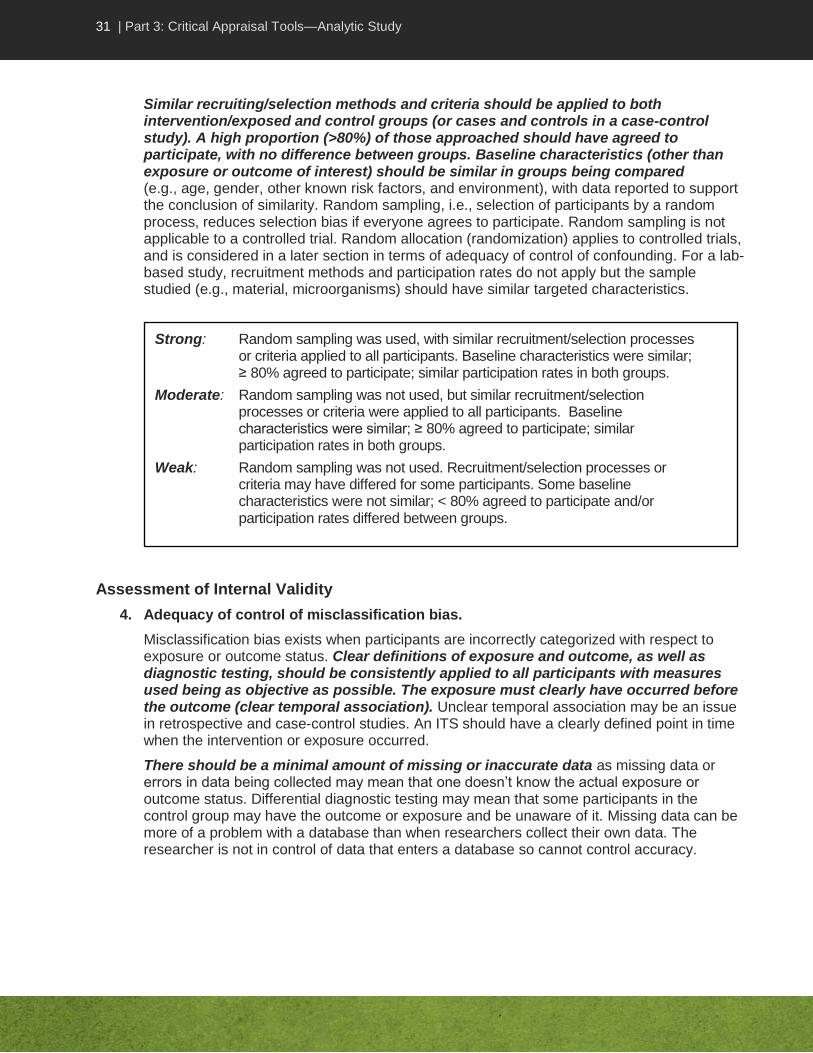
Similar recruiting/selection methods and criteria should be applied to both intervention/exposed and control groups (or cases and controls in a case-control study). A high proportion (>80%) of those approached should have agreed to participate, with no difference between groups. Baseline characteristics (other than exposure or outcome of interest) should be similar in groups being compared (e.g., age, gender, other known risk factors, and environment), with data reported to support the conclusion of similarity. Random sampling, i.e., selection of participants by a random process, reduces selection bias if everyone agrees to participate. Random sampling is not applicable to a controlled trial. Random allocation (randomization) applies to controlled trials, and is considered in a later section in terms of adequacy of control of confounding. For a lab-based study, recruitment methods and participation rates do not apply but the sample studied (e.g., material, microorganisms) should have similar targeted characteristics.
Assessment of Internal Validity
4. Adequacy of control of misclassification bias.
Misclassification bias exists when participants are incorrectly categorized with respect to exposure or outcome status. Clear definitions of exposure and outcome, as well as diagnostic testing, should be consistently applied to all participants with measures used being as objective as possible. The exposure must clearly have occurred before the outcome (clear temporal association). Unclear temporal association may be an issue in retrospective and case-control studies. An ITS should have a clearly defined point in time when the intervention or exposure occurred.
There should be a minimal amount of missing or inaccurate data as missing data or errors in data being collected may mean that one doesn’t know the actual exposure or outcome status. Differential diagnostic testing may mean that some participants in the control group may have the outcome or exposure and be unaware of it. Missing data can be more of a problem with a database than when researchers collect their own data. The researcher is not in control of data that enters a database so cannot control accuracy.
Strong: Random sampling was used, with similar recruitment/selection processes or criteria applied to all participants. Baseline characteristics were similar; ≥ 80% agreed to participate; similar participation rates in both groups.
Moderate: Random sampling was not used, but similar recruitment/selection processes or criteria were applied to all participants. Baseline characteristics were similar; ≥ 80% agreed to participate; similar participation rates in both groups.
Weak: Random sampling was not used. Recruitment/selection processes or criteria may have differed for some participants. Some baseline characteristics were not similar; < 80% agreed to participate and/or participation rates differed between groups.
32 | Part 3: Critical Appraisal Tools—Analytic Study
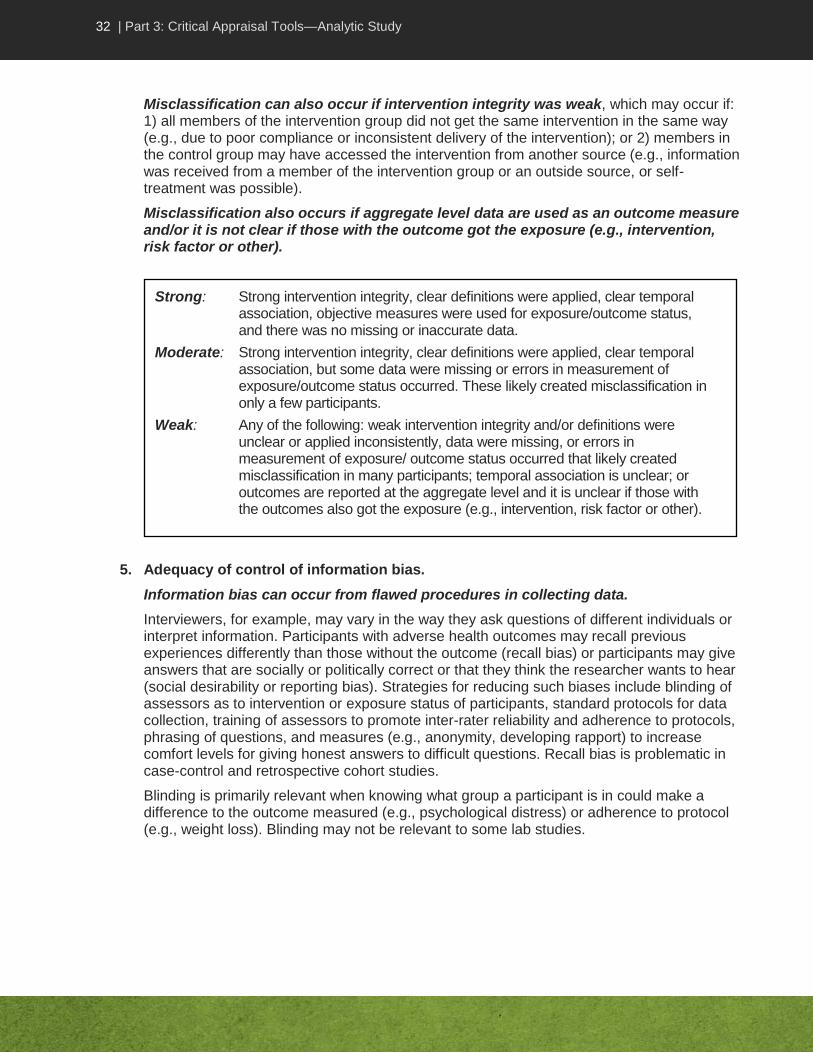
Misclassification can also occur if intervention integrity was weak, which may occur if: 1) all members of the intervention group did not get the same intervention in the same way (e.g., due to poor compliance or inconsistent delivery of the intervention); or 2) members in the control group may have accessed the intervention from another source (e.g., information was received from a member of the intervention group or an outside source, or self-treatment was possible).
Misclassification also occurs if aggregate level data are used as an outcome measure and/or it is not clear if those with the outcome got the exposure (e.g., intervention, risk factor or other).
5. Adequacy of control of information bias.
Information bias can occur from flawed procedures in collecting data.
Interviewers, for example, may vary in the way they ask questions of different individuals or interpret information. Participants with adverse health outcomes may recall previous experiences differently than those without the outcome (recall bias) or participants may give answers that are socially or politically correct or that they think the researcher wants to hear (social desirability or reporting bias). Strategies for reducing such biases include blinding of assessors as to intervention or exposure status of participants, standard protocols for data collection, training of assessors to promote inter-rater reliability and adherence to protocols, phrasing of questions, and measures (e.g., anonymity, developing rapport) to increase comfort levels for giving honest answers to difficult questions. Recall bias is problematic in case-control and retrospective cohort studies.
Blinding is primarily relevant when knowing what group a participant is in could make a difference to the outcome measured (e.g., psychological distress) or adherence to protocol (e.g., weight loss). Blinding may not be relevant to some lab studies.
Strong: Strong intervention integrity, clear definitions were applied, clear temporal association, objective measures were used for exposure/outcome status, and there was no missing or inaccurate data.
Moderate: Strong intervention integrity, clear definitions were applied, clear temporal association, but some data were missing or errors in measurement of exposure/outcome status occurred. These likely created misclassification in only a few participants.
Weak: Any of the following: weak intervention integrity and/or definitions were unclear or applied inconsistently, data were missing, or errors in measurement of exposure/ outcome status occurred that likely created misclassification in many participants; temporal association is unclear; or outcomes are reported at the aggregate level and it is unclear if those with the outcomes also got the exposure (e.g., intervention, risk factor or other).

33 | Part 3: Critical Appraisal Tools—Analytic Study
There is a distinction between data collection specific to the research study (e.g., interviews) versus routine clinical data collection (e.g., which is collected for the research study by chart review or from information obtained for clinical purposes). It is generally reasonable to assume that healthcare professionals such as physicians and nurses have received appropriate training for collecting routine clinical data such as histories, physicals and clinical lab specimens while lab personnel have received the appropriate training to process lab samples. The primary focus for the critical appraisal is on the data collection for the research study.
6. Validity and reliability of data collection instruments.
The instruments used to collect data should be valid and reliable. Instruments (e.g., interview guide, questionnaire, data extraction form, lab methods, etc.) should be distinguished from the data collection methods (e.g., interview, survey, chart review). Validity means that the instrument is measuring what it is designed to measure, while reliability means that it does so in a consistent way. Specific testing methods are available to assess validity and reliability of instruments, with highest confidence being placed in those with such testing.
Strong: Tools are known or were shown to be valid and reliable.
Moderate: There was no attempt to assess validity and reliability of tools but content validity can be assumed by the nature of the questions asked and the involvement of experts in development of the tools.
Weak: There was no attempt to assess validity and reliability and neither can be assumed.
Strong: Assessors were blinded as to participants’ group, were trained in data collection procedures, and clearly adhered to them. Strategies were used to minimize biases associated with data collection procedures, measures or phrasing of questions. Whether or not patients were blinded made no difference to data collected.
Moderate: Assessors were not blinded as to participants’ group, but were trained in data collection procedures and likely adhered to them. Strategies were used to reduce biases associated with data collection procedures, measures or phrasing of questions. Patients were not blinded and this might have made a difference to data collected.
Weak: Assessors were not blinded as to participants’ group, and it is not clear if they were trained in data collection procedures and/or adhered to them. It is unclear if strategies were sufficient to reduce response biases associated with data collection procedures, measures or phrasing of questions. Patients were not blinded and it clearly made a difference to the data collected.
34 | Part 3: Critical Appraisal Tools—Analytic Study
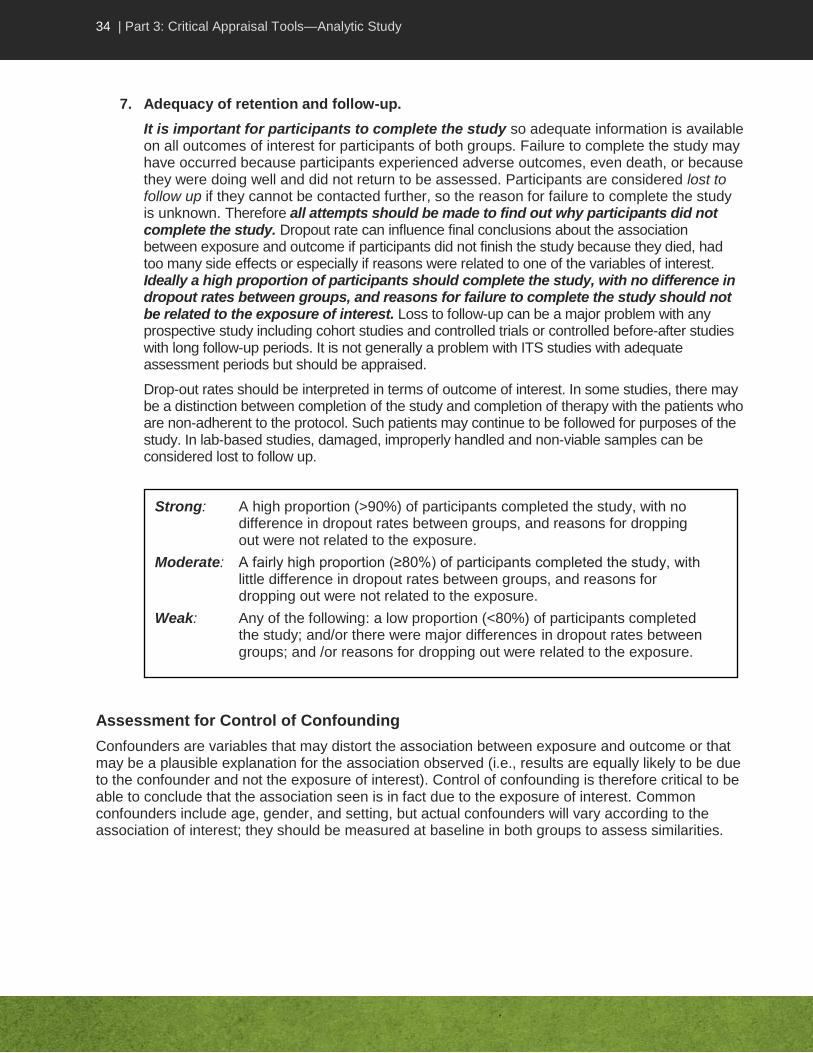
7. Adequacy of retention and follow-up.
It is important for participants to complete the study so adequate information is available on all outcomes of interest for participants of both groups. Failure to complete the study may have occurred because participants experienced adverse outcomes, even death, or because they were doing well and did not return to be assessed. Participants are considered lost to follow up if they cannot be contacted further, so the reason for failure to complete the study is unknown. Therefore all attempts should be made to find out why participants did not complete the study. Dropout rate can influence final conclusions about the association between exposure and outcome if participants did not finish the study because they died, had too many side effects or especially if reasons were related to one of the variables of interest. Ideally a high proportion of participants should complete the study, with no difference in dropout rates between groups, and reasons for failure to complete the study should not be related to the exposure of interest. Loss to follow-up can be a major problem with any prospective study including cohort studies and controlled trials or controlled before-after studies with long follow-up periods. It is not generally a problem with ITS studies with adequate assessment periods but should be appraised.
Drop-out rates should be interpreted in terms of outcome of interest. In some studies, there may be a distinction between completion of the study and completion of therapy with the patients who are non-adherent to the protocol. Such patients may continue to be followed for purposes of the study. In lab-based studies, damaged, improperly handled and non-viable samples can be considered lost to follow up.
Assessment for Control of Confounding
Confounders are variables that may distort the association between exposure and outcome or that may be a plausible explanation for the association observed (i.e., results are equally likely to be due to the confounder and not the exposure of interest). Control of confounding is therefore critical to be able to conclude that the association seen is in fact due to the exposure of interest. Common confounders include age, gender, and setting, but actual confounders will vary according to the association of interest; they should be measured at baseline in both groups to assess similarities.
Strong: A high proportion (>90%) of participants completed the study, with no difference in dropout rates between groups, and reasons for dropping out were not related to the exposure.
Moderate: A fairly high proportion (≥80%) of participants completed the study, with little difference in dropout rates between groups, and reasons for dropping out were not related to the exposure.
Weak: Any of the following: a low proportion (<80%) of participants completed the study; and/or there were major differences in dropout rates between groups; and /or reasons for dropping out were related to the exposure.
35 | Part 3: Critical Appraisal Tools—Analytic Study
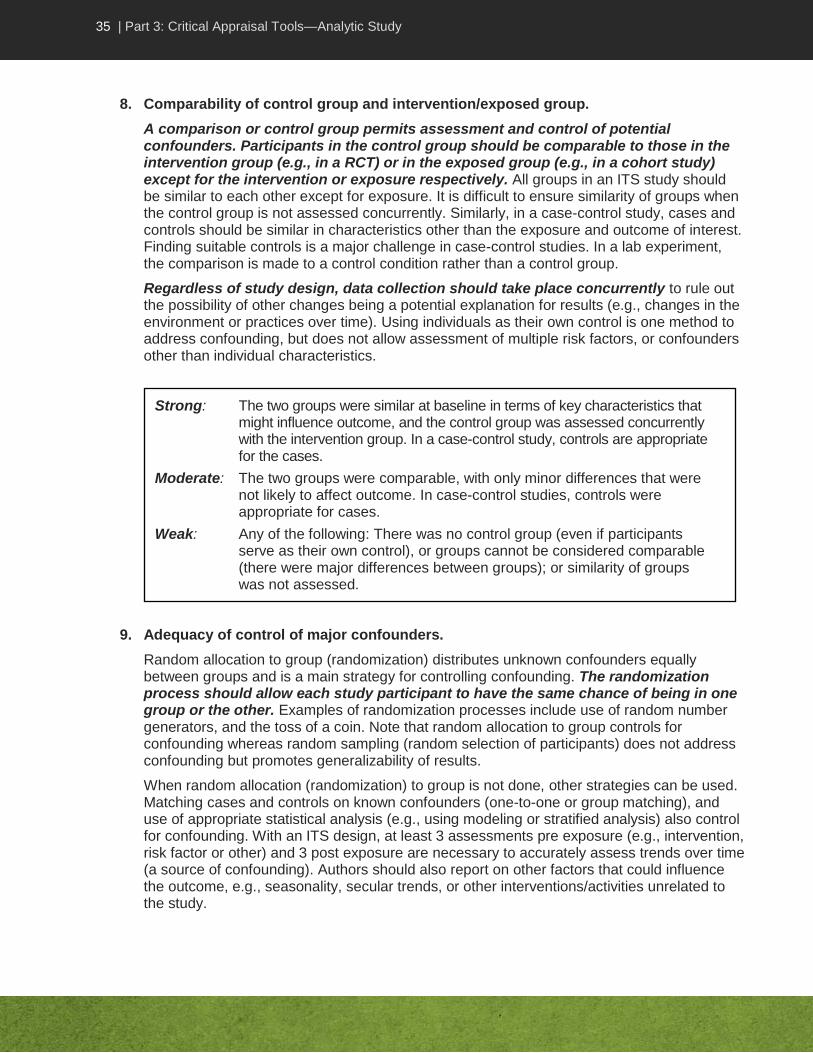
8. Comparability of control group and intervention/exposed group.
A comparison or control group permits assessment and control of potential confounders. Participants in the control group should be comparable to those in the intervention group (e.g., in a RCT) or in the exposed group (e.g., in a cohort study) except for the intervention or exposure respectively. All groups in an ITS study should be similar to each other except for exposure. It is difficult to ensure similarity of groups when the control group is not assessed concurrently. Similarly, in a case-control study, cases and controls should be similar in characteristics other than the exposure and outcome of interest. Finding suitable controls is a major challenge in case-control studies. In a lab experiment, the comparison is made to a control condition rather than a control group.
Regardless of study design, data collection should take place concurrently to rule out the possibility of other changes being a potential explanation for results (e.g., changes in the environment or practices over time). Using individuals as their own control is one method to address confounding, but does not allow assessment of multiple risk factors, or confounders other than individual characteristics.
9. Adequacy of control of major confounders.
Random allocation to group (randomization) distributes unknown confounders equally between groups and is a main strategy for controlling confounding. The randomization process should allow each study participant to have the same chance of being in one group or the other. Examples of randomization processes include use of random number generators, and the toss of a coin. Note that random allocation to group controls for confounding whereas random sampling (random selection of participants) does not address confounding but promotes generalizability of results.
When random allocation (randomization) to group is not done, other strategies can be used. Matching cases and controls on known confounders (one-to-one or group matching), and use of appropriate statistical analysis (e.g., using modeling or stratified analysis) also control for confounding. With an ITS design, at least 3 assessments pre exposure (e.g., intervention, risk factor or other) and 3 post exposure are necessary to accurately assess trends over time (a source of confounding). Authors should also report on other factors that could influence the outcome, e.g., seasonality, secular trends, or other interventions/activities unrelated to the study.
Strong: The two groups were similar at baseline in terms of key characteristics that might influence outcome, and the control group was assessed concurrently with the intervention group. In a case-control study, controls are appropriate for the cases.
Moderate: The two groups were comparable, with only minor differences that were not likely to affect outcome. In case-control studies, controls were appropriate for cases.
Weak: Any of the following: There was no control group (even if participants serve as their own control), or groups cannot be considered comparable (there were major differences between groups); or similarity of groups was not assessed.

36 | Part 3: Critical Appraisal Tools—Analytic Study
Although it is impossible to identify all confounders, researchers should identify main and likely confounders, assess their presence and control for them, regardless of design type. In lab experiments, random allocation does not apply regardless of whether or not there are human participants. Researchers control for potential confounders and adjust for them.
Ethics
10. Adequacy of ethical conduct.
Regardless of design, appropriate steps should have been taken to safeguard participants, especially vulnerable groups, from harm, exploitation, and coercion, and to protect their rights to self-determination, full disclosure, fair treatment, and privacy. Informed consent is one major strategy for protecting rights. Researchers who report their study was approved by an institutional ethics review board but report no other details will have had such details considered and approved. Note that the Tri-Council Policy Statement states that program evaluation and surveillance studies do not require ethical approval, but appropriate steps still need to be taken to safeguard participants and their rights. Public health inquiries such as look back or contact investigations do not require ethics approval. If studies are not conducted ethically, the information could be biased. It is also considered unethical to use results from such studies. Examples of adequate or sufficient details regarding ethical conduct associated with use of existing data include the removal of identifiers from data, obtaining permission of the custodian of the data and using a government or institutional database.
The ethics of research is also concerned with undue influence of sponsors or other stake-holders to direct the methods or reporting of outcomes so that only favourable conclusions are reached.
Strong: Research was approved by an appropriate ethics review board, or sufficient details are provided to indicate that ethical conduct was ensured. Research report was not influenced by a funding agency, sponsor or conflict of interest.
Moderate: Not applicable.
Weak: Insufficient details are provided to draw a conclusion regarding ethical conduct. The likelihood of the research report being influenced by a funding agency, sponsor or conflict of interest could not be ruled out.
Strong: There was randomization to groups using an appropriate process. If not, appropriate matching or statistical analysis or lab conditions adequately controlled for confounding. Major confounders were examined.
Moderate: There was systematic allocation to groups but not true randomization, or the process of randomization was unclear or inadequate, or there was no appropriate matching but statistical analysis adequately controlled for confounding or lab experimental conditions only partially controlled for confounding; and major confounders were examined.
Weak: There was no randomization to groups or appropriate matching; and statistical analysis or lab experimental conditions did not control for confounding and/or major confounders were not examined.
37 | Part 3: Critical Appraisal Tools—Analytic Study
Assessment of Analysis
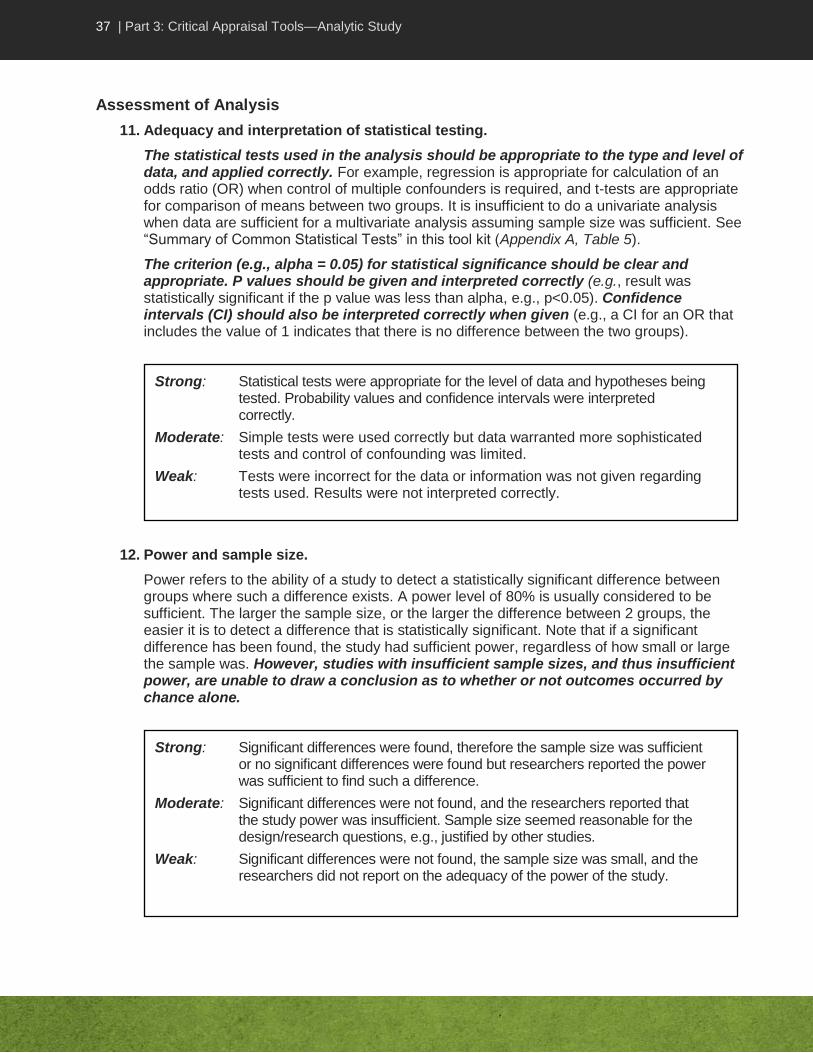
11. Adequacy and interpretation of statistical testing.
The statistical tests used in the analysis should be appropriate to the type and level of data, and applied correctly. For example, regression is appropriate for calculation of an odds ratio (OR) when control of multiple confounders is required, and t-tests are appropriate for comparison of means between two groups. It is insufficient to do a univariate analysis when data are sufficient for a multivariate analysis assuming sample size was sufficient. See “Summary of Common Statistical Tests” in this tool kit (Appendix A, Table 5).
The criterion (e.g., alpha = 0.05) for statistical significance should be clear and appropriate. P values should be given and interpreted correctly (e.g., result was statistically significant if the p value was less than alpha, e.g., p<0.05). Confidence intervals (CI) should also be interpreted correctly when given (e.g., a CI for an OR that includes the value of 1 indicates that there is no difference between the two groups).
12. Power and sample size.
Power refers to the ability of a study to detect a statistically significant difference between groups where such a difference exists. A power level of 80% is usually considered to be sufficient. The larger the sample size, or the larger the difference between 2 groups, the easier it is to detect a difference that is statistically significant. Note that if a significant difference has been found, the study had sufficient power, regardless of how small or large the sample was. However, studies with insufficient sample sizes, and thus insufficient power, are unable to draw a conclusion as to whether or not outcomes occurred by chance alone.
Strong: Significant differences were found, therefore the sample size was sufficient or no significant differences were found but researchers reported the power was sufficient to find such a difference.
Moderate: Significant differences were not found, and the researchers reported that the study power was insufficient. Sample size seemed reasonable for the design/research questions, e.g., justified by other studies.
Weak: Significant differences were not found, the sample size was small, and the researchers did not report on the adequacy of the power of the study.
Strong: Statistical tests were appropriate for the level of data and hypotheses being tested. Probability values and confidence intervals were interpreted correctly.
Moderate: Simple tests were used correctly but data warranted more sophisticated tests and control of confounding was limited.
Weak: Tests were incorrect for the data or information was not given regarding tests used. Results were not interpreted correctly.

38 | Part 3: Critical Appraisal Tools—Analytic Study
Assessment of Applicability
Assessing applicability (generalizability and feasibility) may not be relevant to all studies especially those assessing a risk factor. Evaluation for applicability does not affect decisions regarding the quality of the study. Reviewers may choose to assess applicability depending on their purpose for appraising the study. Interpretation of applicability criteria should be done in consultation with colleagues.
13. Can the results be generalized to the local population?
Data collection in one group may not be generalizable to other groups if there are major dissimilarities in the groups. Random sampling, sample selection from a diverse group, and ensuring the sample adequately represents other groups of interest all increase generalizability.
14. Feasibility of implementation
The feasibility of implementation of an intervention varies by setting and may depend on availability of resources (e.g., funds, suitable personnel, political will, and physical environment). One must also consider acceptability to patients, staff and other stakeholders.
Strong: The intervention studied is highly likely to be readily implemented in other settings.
Moderate: The intervention is somewhat likely to be readily implemented in other settings, or no intervention was studied but the exposure studied is very likely amenable to intervention that can be readily implemented.
Weak: The intervention is unlikely to be readily implemented in other settings, or no intervention was studied and the exposure studied is not very likely amenable to intervention that can be readily implemented.
Strong: Characteristics of the study population were very similar to the group to which one wishes to generalize results.
Moderate: Characteristics of the study population were somewhat similar to the group to which one wishes to generalize results.
Weak: Characteristics of the study population were not at all similar to the group to which one wishes to generalize results.
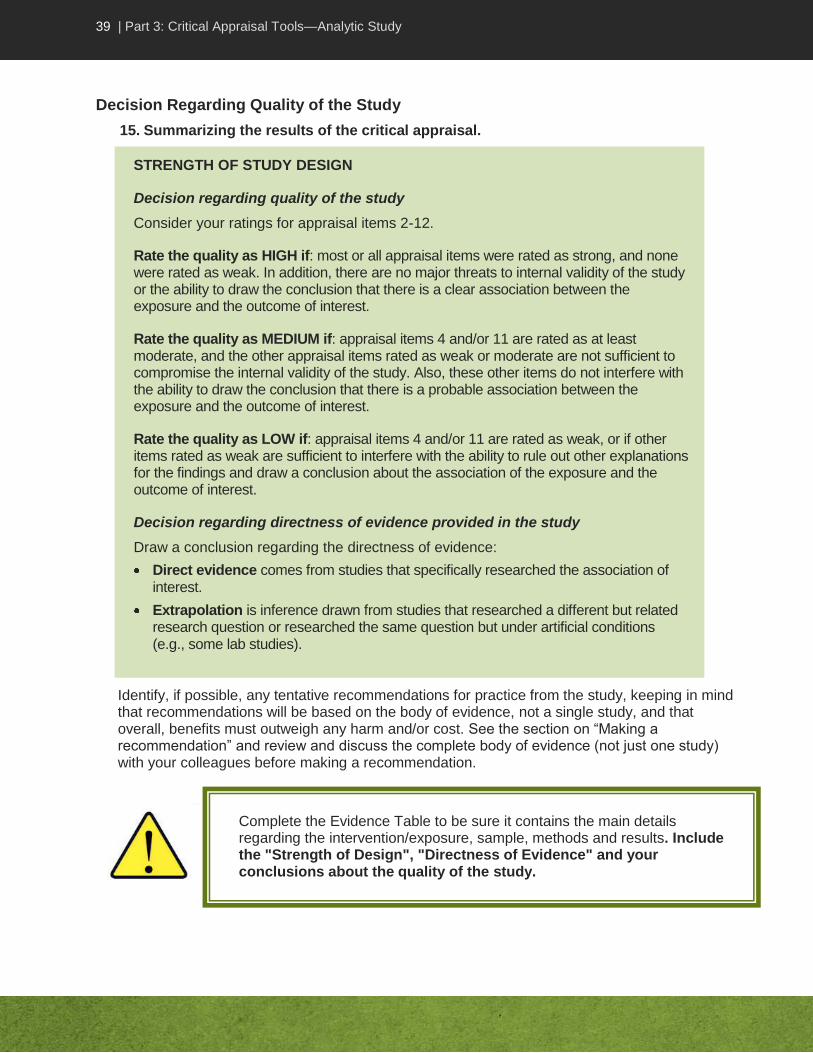
39 | Part 3: Critical Appraisal Tools—Analytic Study
Decision Regarding Quality of the Study
15. Summarizing the results of the critical appraisal.
Identify, if possible, any tentative recommendations for practice from the study, keeping in mind that recommendations will be based on the body of evidence, not a single study, and that overall, benefits must outweigh any harm and/or cost. See the section on “Making a recommendation” and review and discuss the complete body of evidence (not just one study) with your colleagues before making a recommendation.
STRENGTH OF STUDY DESIGN
Decision regarding quality of the study
Consider your ratings for appraisal items 2-12.
Rate the quality as HIGH if: most or all appraisal items were rated as strong, and none were rated as weak. In addition, there are no major threats to internal validity of the study or the ability to draw the conclusion that there is a clear association between the exposure and the outcome of interest.
Rate the quality as MEDIUM if: appraisal items 4 and/or 11 are rated as at least moderate, and the other appraisal items rated as weak or moderate are not sufficient to compromise the internal validity of the study. Also, these other items do not interfere with the ability to draw the conclusion that there is a probable association between the exposure and the outcome of interest.
Rate the quality as LOW if: appraisal items 4 and/or 11 are rated as weak, or if other items rated as weak are sufficient to interfere with the ability to rule out other explanations for the findings and draw a conclusion about the association of the exposure and the outcome of interest.
Decision regarding directness of evidence provided in the study
Draw a conclusion regarding the directness of evidence:
Direct evidence comes from studies that specifically researched the association of interest.
Extrapolation is inference drawn from studies that researched a different but related research question or researched the same question but under artificial conditions (e.g., some lab studies).
Complete the Evidence Table to be sure it contains the main details regarding the intervention/exposure, sample, methods and results. Include the "Strength of Design", "Directness of Evidence" and your conclusions about the quality of the study.
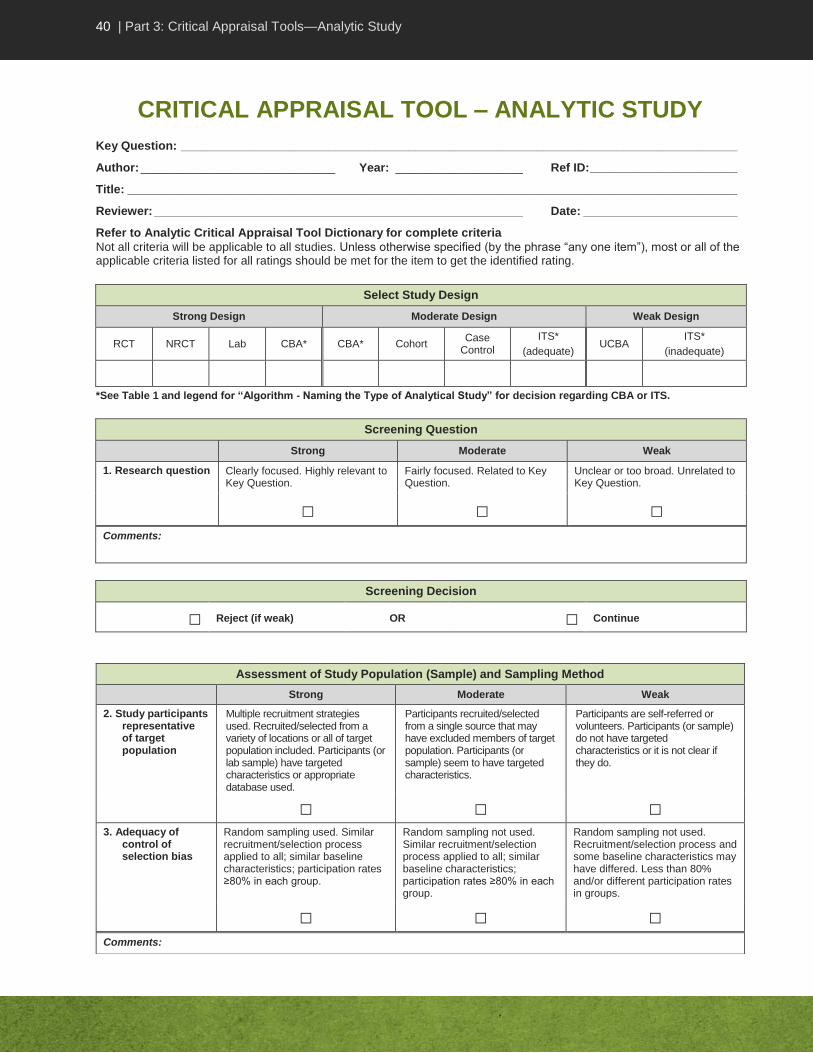
40 | Part 3: Critical Appraisal Tools—Analytic Study
CRITICAL APPRAISAL TOOL – ANALYTIC STUDY
Key Question: ___________________________________________________________________________________
Author: _____________________________ Year: ___________________ Ref ID: ______________________
Title: ___________________________________________________________________________________________
Reviewer: _______________________________________________________ Date: _______________________
Refer to Analytic Critical Appraisal Tool Dictionary for complete criteria
Not all criteria will be applicable to all studies. Unless otherwise specified (by the phrase “any one item”), most or all of the applicable criteria listed for all ratings should be met for the item to get the identified rating.
Select Study Design
Strong Design Moderate Design Weak Design
RCT NRCT Lab CBA* CBA* Cohort Case
Control
ITS*
(adequate) UCBA
ITS*
(inadequate)
*See Table 1 and legend for “Algorithm - Naming the Type of Analytical Study” for decision regarding CBA or ITS.
Screening Question
Strong Moderate Weak
1. Research question Clearly focused. Highly relevant to Key Question.
Fairly focused. Related to Key Question.
Unclear or too broad. Unrelated to Key Question.
□ □ □ Comments:
Screening Decision
□ Reject (if weak) OR □ Continue
Assessment of Study Population (Sample) and Sampling Method
Strong Moderate Weak
2. Study participants representative of target population
Multiple recruitment strategies used. Recruited/selected from a variety of locations or all of target population included. Participants (or lab sample) have targeted characteristics or appropriate database used.
Participants recruited/selected from a single source that may have excluded members of target population. Participants (or sample) seem to have targeted characteristics.
Participants are self-referred or volunteers. Participants (or sample) do not have targeted characteristics or it is not clear if they do.
□ □ □ 3. Adequacy of
control of selection bias
Random sampling used. Similar recruitment/selection process applied to all; similar baseline characteristics; participation rates ≥80% in each group.
Random sampling not used. Similar recruitment/selection process applied to all; similar baseline characteristics; participation rates ≥80% in each group.
Random sampling not used. Recruitment/selection process and some baseline characteristics may have differed. Less than 80% and/or different participation rates in groups.
□ □ □ Comments:

41 | Part 3: Critical Appraisal Tools—Analytic Study
Assessment of Internal Validity
Strong Moderate Weak
4. Adequacy of control of misclassification bias
Strong intervention integrity with clear definitions applied. Clear temporal association. Objective measures used for exposure/ outcome status. No missing or inaccurate data.
Strong intervention integrity with clear definitions. Clear temporal association. Some missing data or errors in measurement of exposure/outcome status likely created misclassification in only a few participants.
Any one item: weak intervention integrity with unclear definitions, missing data or errors in measurement of exposure / outcome status likely created misclassification in many participant; unclear temporal association; or outcomes reported at aggregate level and unclear if individuals had intervention.
□ □ □ 5. Adequacy of
control of information bias
Assessors blinded, trained in data collection and clearly adhered to procedures. Biases minimized with respect to data collection procedures and measures. Whether or not patients were blinded made no difference to data collected.
Assessors were not blinded but trained in data collection and likely adhered to procedures. Biases reduced with respect to data collection procedures and measures. Patients were not blinded and this might have made a difference to data collected.
Assessors were not blinded and unclear if trained in or adhered to data collection methods. Unclear if bias was sufficiently reduced. Patients were not blinded and it clearly made a difference to data collected.
□ □ □ 6. Validity and
reliability of data collection instruments
Tools are known or were shown to be valid and reliable.
No attempt to assess validity and reliability of tools. Content validity can be assumed based on questions asked and expert involvement.
No attempt to assess validity and reliability of tools. Neither can be assumed.
□ □ □ 7. Adequacy of
retention and follow-up
>90% of participants completed study. Similar dropout rates between groups with reasons unrelated to exposure.
≥80% of participants completed study. Little difference in dropout rates between groups with reasons unrelated to exposure.
Any one item: <80% of participants completed study; and/or major difference in dropout rates between groups; and/or dropout reasons were related to exposure.
□ □ □
Assessment for Control of Confounding
Strong Moderate Weak
8. Comparability of control group and intervention group
Groups were similar at baseline and assessed concurrently. Appropriate controls used in case-control study.
Groups were comparable at baseline with minor differences. Appropriate controls in case-controls study.
Any one item: no control group or major differences existed between groups; or similarity of groups was not assessed.
□ □ □ 9. Adequacy of
control of major confounders
Appropriate randomization to groups or appropriate matching / statistical analysis / lab conditions adequate for controlling confounding. Major confounders examined.
Unclear / inadequate randomization or inappropriate matching but statistical analysis adequately controlled for confounding or lab conditions only partially controlled for confounding. Major confounders examined.
No randomization to groups or appropriate matching. Statistical analysis or lab conditions did not control for confounding. Major confounders not examined.
□ □ □ Comments:
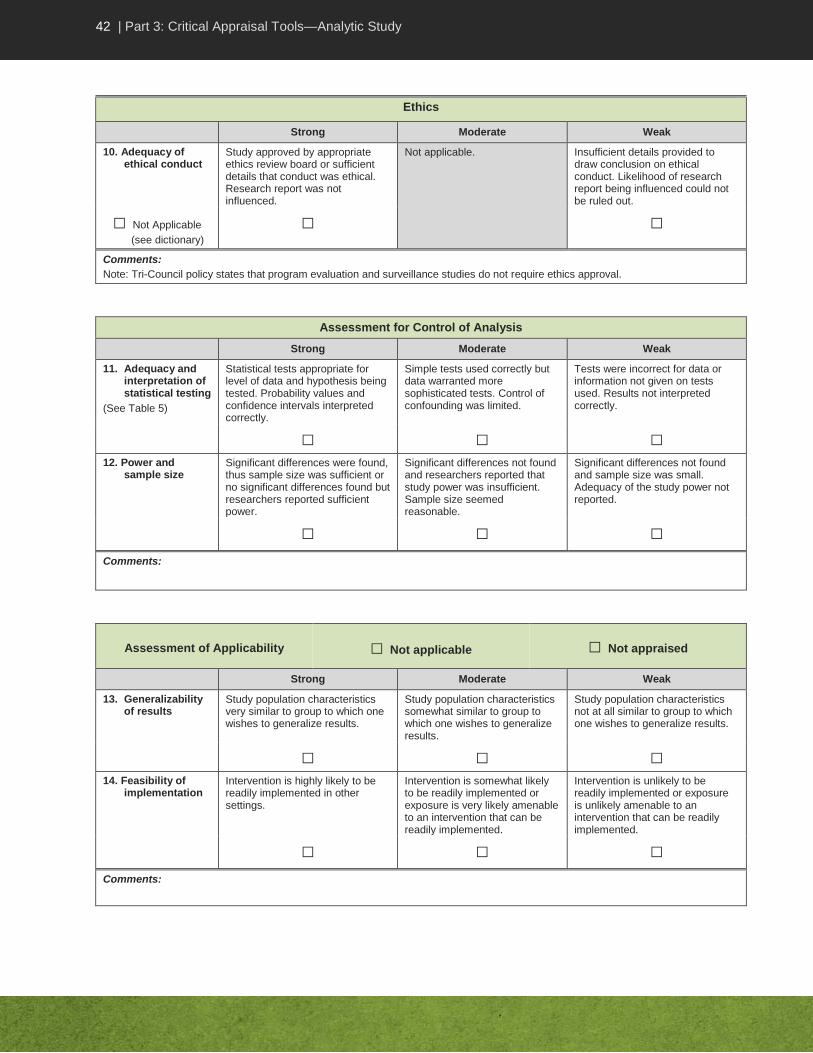
42 | Part 3: Critical Appraisal Tools—Analytic Study
Ethics
Strong Moderate Weak
10. Adequacy of ethical conduct
Study approved by appropriate ethics review board or sufficient details that conduct was ethical. Research report was not influenced.
Not applicable. Insufficient details provided to draw conclusion on ethical conduct. Likelihood of research report being influenced could not be ruled out.
□ Not Applicable
(see dictionary)
□ □
Comments:
Note: Tri-Council policy states that program evaluation and surveillance studies do not require ethics approval.
Assessment for Control of Analysis
Strong Moderate Weak
11. Adequacy and interpretation of statistical testing
(See Table 5)
Statistical tests appropriate for level of data and hypothesis being tested. Probability values and confidence intervals interpreted correctly.
Simple tests used correctly but data warranted more sophisticated tests. Control of confounding was limited.
Tests were incorrect for data or information not given on tests used. Results not interpreted correctly.
□ □ □ 12. Power and
sample size Significant differences were found, thus sample size was sufficient or no significant differences found but researchers reported sufficient power.
Significant differences not found and researchers reported that study power was insufficient. Sample size seemed reasonable.
Significant differences not found and sample size was small. Adequacy of the study power not reported.
□ □ □ Comments:
Assessment of Applicability □ Not applicable □ Not appraised
Strong Moderate Weak
13. Generalizability of results
Study population characteristics very similar to group to which one wishes to generalize results.
Study population characteristics somewhat similar to group to which one wishes to generalize results.
Study population characteristics not at all similar to group to which one wishes to generalize results.
□ □ □ 14. Feasibility of
implementation Intervention is highly likely to be readily implemented in other settings.
Intervention is somewhat likely to be readily implemented or exposure is very likely amenable to an intervention that can be readily implemented.
Intervention is unlikely to be readily implemented or exposure is unlikely amenable to an intervention that can be readily implemented.
□ □ □ Comments:
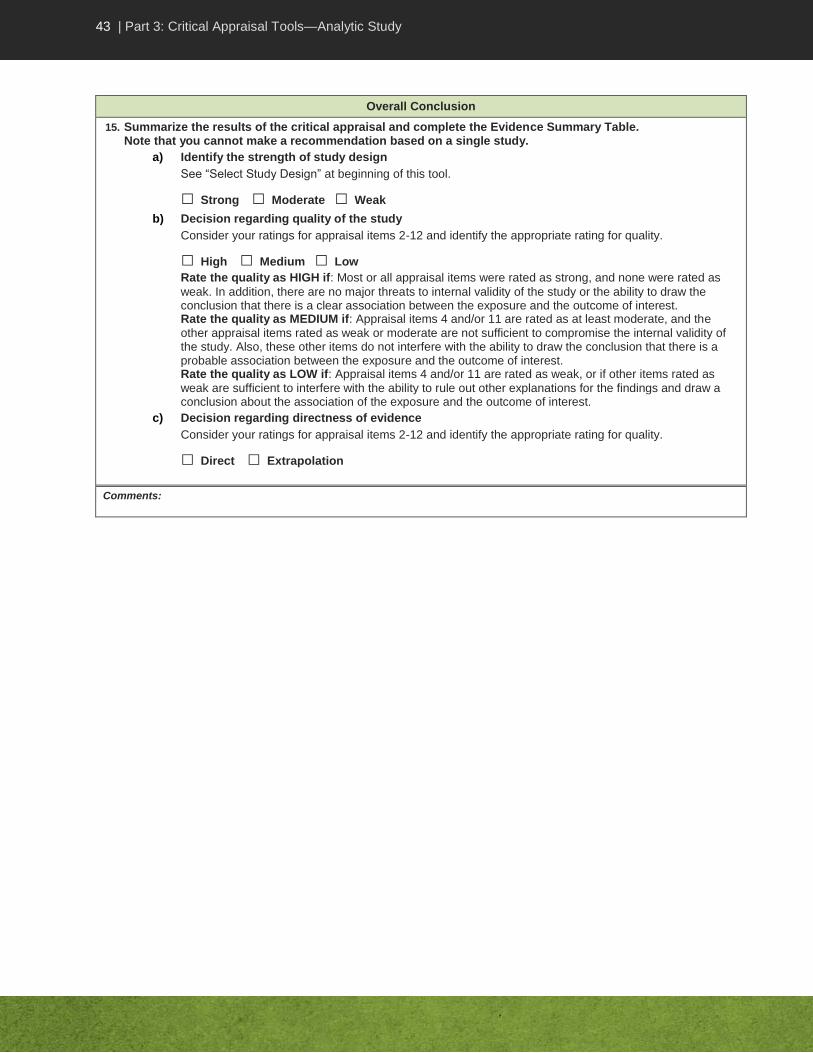
43 | Part 3: Critical Appraisal Tools—Analytic Study
Overall Conclusion
15. Summarize the results of the critical appraisal and complete the Evidence Summary Table. Note that you cannot make a recommendation based on a single study.
a) Identify the strength of study design
See “Select Study Design” at beginning of this tool.
□ Strong □ Moderate □ Weak
b) Decision regarding quality of the study
Consider your ratings for appraisal items 2-12 and identify the appropriate rating for quality.
□ High □ Medium □ Low
Rate the quality as HIGH if: Most or all appraisal items were rated as strong, and none were rated as
weak. In addition, there are no major threats to internal validity of the study or the ability to draw the conclusion that there is a clear association between the exposure and the outcome of interest. Rate the quality as MEDIUM if: Appraisal items 4 and/or 11 are rated as at least moderate, and the
other appraisal items rated as weak or moderate are not sufficient to compromise the internal validity of the study. Also, these other items do not interfere with the ability to draw the conclusion that there is a probable association between the exposure and the outcome of interest. Rate the quality as LOW if: Appraisal items 4 and/or 11 are rated as weak, or if other items rated as
weak are sufficient to interfere with the ability to rule out other explanations for the findings and draw a conclusion about the association of the exposure and the outcome of interest.
c) Decision regarding directness of evidence
Consider your ratings for appraisal items 2-12 and identify the appropriate rating for quality.
□ Direct □ Extrapolation
Comments:
44 | Part 3: Critical Appraisal Tools—Descriptive Study
CRITICAL APPRAISAL TOOL DICTIONARY – DESCRIPTIVE STUDY
Introduction
The purpose of the Descriptive Study Critical Appraisal Tool (CAT) is to help reviewers assess the usefulness of results from a single descriptive study. The purpose of this dictionary is to provide some background about the limitations of such studies, and to describe items in the tool to assist reviewers in rating the quality of the study. It is important to realize that this dictionary does not provide a thorough explanation of all concepts or illustrate these with all possible examples. Therefore the reviewer must use judgment in interpreting the criteria and applying them to the study under review.
The criteria here are applicable to all descriptive studies. Refer to legend for “Algorithm – Choosing the Appropriate Tool”, to be sure that the study is descriptive. These studies may assess exposures of interest (e.g., risk factors, interventions or protective factors) and/or outcomes of interest (e.g., infections, diseases, behaviours, effects or conditions).
Use this tool to assess cross-sectional studies, ecologic studies, epidemiologic link studies, and case reports/case series. Epidemiologic link studies include look-back, trace-back and contact investigations. In this tool kit, cross-sectional, ecologic and epidemiologic link studies are categorized as descriptive exploratory studies, and are appraised using the same set of criteria, found in sections A and B of the Descriptive Study CAT. Note that case reports/case series have a separate section in the CAT (parts A and C). Complete only the appropriate section for the study design you are appraising. A summary of some attributes of each study design can be found in Table 2 in this tool kit.
Critical Appraisal of the Validity of a Descriptive Study
The main purpose of a descriptive study is to describe the general or specific characteristics of a condition in relation to particular factors such as exposure of interest or outcomes. This can be helpful in identifying possible associations. Descriptive exploratory studies often explore as well as describe those associations. This helps to identify the associations that can be further examined in later research using more rigorous study designs to test hypotheses. Critical appraisal of the study helps a reader assess the validity or credibility of its conclusions. Descriptive studies are weak research designs and provide only limited evidence. They should not be used as the basis of a practice recommendation unless no other evidence is available. Case reports/case series provide only anecdotal evidence that may serve to inform expert opinion.
Instructions
Start your critical appraisal by identifying the study design. If you are unable to identify the study design, discuss with your colleagues and choose the closest study design. In the appropriate section of the tool, score each item as strong, moderate or weak, according to the criteria described here. Not all criteria will be applicable to all study designs. Unless otherwise specified, most or all of the applicable criteria listed for all ratings should be met for the item to get the identified rating. With some criteria for a “weak” rating, indicated by the phrase “any of the following”, the item should be rated as weak if even only one of the criteria has been met.

45 | Part 3: Critical Appraisal Tools—Descriptive Study
Criteria for consideration are written in bold italics; additional explanations are also provided in the dictionary. The tool contains space for comments; the reviewer should include comments to support decisions, help identify areas of concerns (e.g., major weaknesses or limitations) and whether they would have an impact on believing the authors’ conclusions. Some studies do not provide enough details to adequately assess if each criterion being appraised is met or not. This may be due to a poorly written report of the study and may not be reflective of a low quality study. Nonetheless, your assessment should only focus on what is documented in the study and not on your assumptions about the study. Complete the Evidence Summary Table during the critical appraisal process.
If you are unable to make a decision about how to rate an item, write a comment and discuss it with your colleagues. Conclusions about the quality of the evidence are generally made by group consensus rather than by individual decision.
A. Screening the Study for Inclusion Prior to the Critical Appraisal
All types of descriptive studies should be screened including descriptive exploratory studies and case reports/series. Prior to making decisions about including the study, read it through and identify briefly what was done. If more than one research question was addressed or multiple research methods used, identify those aspects that are relevant to your Key Question (see glossary). Note that one aspect of a study may be relevant to one Key Question, and a separate aspect relevant to a different Key Question, with different methods being used and different quality of methodology. A study that is used to support different conclusions needs to be re-read for each Key Question.
A1. Did the study address a clearly focused question that is relevant to the Key Question?
There should be a clear research question addressed. The population, intervention and outcomes of interest should be specified. The more focused the study’s question, the more likely it is that the authors can address it.
The research question of the study should be relevant to the Guideline Key Question. If the study is not related to the Key Question, its results will likely not help in the formulation of recommendations and there is little point in spending time reading it.
Strong: Clear focused research question, highly relevant to Key Question.
Moderate: Clear research question, fairly focused, related to Key Question though may not directly answer question or may provide results requiring extrapolation to address the research question.
Weak: Research question is unclear or too broad or completely unrelated to Key Question.
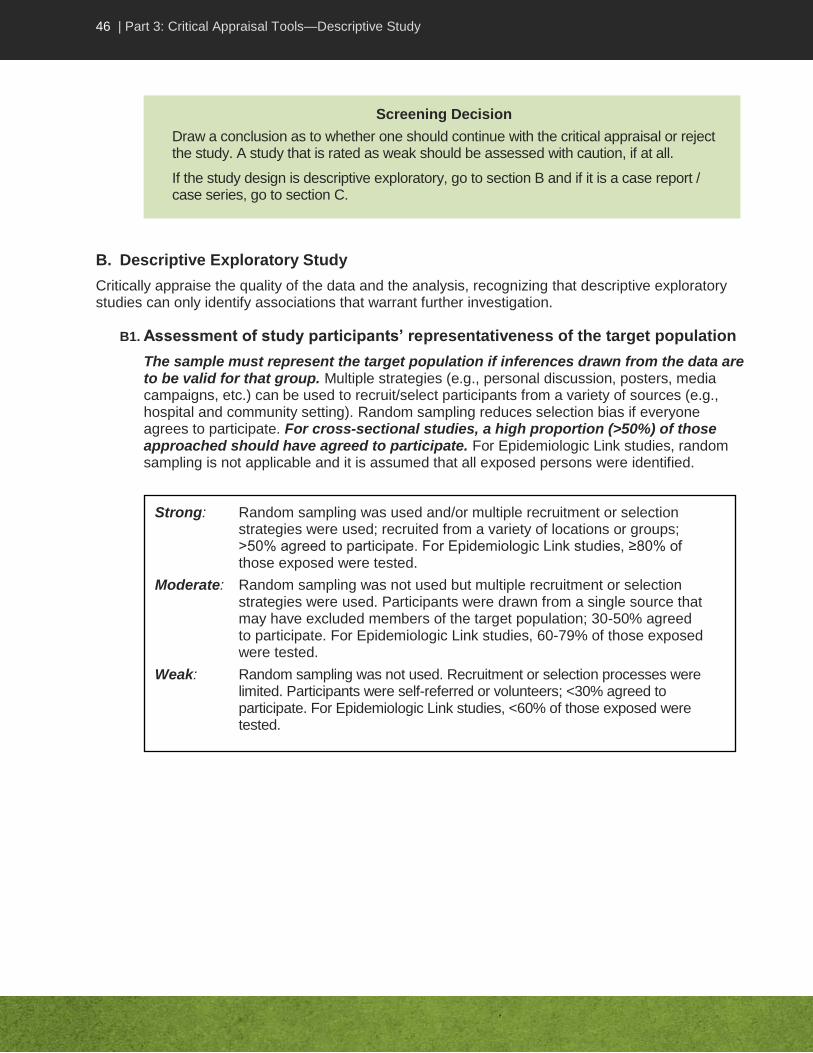
46 | Part 3: Critical Appraisal Tools—Descriptive Study
B. Descriptive Exploratory Study
Critically appraise the quality of the data and the analysis, recognizing that descriptive exploratory studies can only identify associations that warrant further investigation.
B1. Assessment of study participants’ representativeness of the target population
The sample must represent the target population if inferences drawn from the data are to be valid for that group. Multiple strategies (e.g., personal discussion, posters, media campaigns, etc.) can be used to recruit/select participants from a variety of sources (e.g., hospital and community setting). Random sampling reduces selection bias if everyone agrees to participate. For cross-sectional studies, a high proportion (>50%) of those approached should have agreed to participate. For Epidemiologic Link studies, random sampling is not applicable and it is assumed that all exposed persons were identified.
Strong: Random sampling was used and/or multiple recruitment or selection strategies were used; recruited from a variety of locations or groups; >50% agreed to participate. For Epidemiologic Link studies, ≥80% of those exposed were tested.
Moderate: Random sampling was not used but multiple recruitment or selection strategies were used. Participants were drawn from a single source that may have excluded members of the target population; 30-50% agreed to participate. For Epidemiologic Link studies, 60-79% of those exposed were tested.
Weak: Random sampling was not used. Recruitment or selection processes were limited. Participants were self-referred or volunteers; <30% agreed to participate. For Epidemiologic Link studies, <60% of those exposed were tested.
Screening Decision
Draw a conclusion as to whether one should continue with the critical appraisal or reject the study. A study that is rated as weak should be assessed with caution, if at all.
If the study design is descriptive exploratory, go to section B and if it is a case report / case series, go to section C.

47 | Part 3: Critical Appraisal Tools—Descriptive Study
B2. Assessment of data collection sources and methods
Clear definitions of factors of interest should be consistently applied to all participants, and measures should be as objective as possible. Data should be as complete and accurate as possible. Interviewers, for example, may vary in the way they ask questions of different individuals or interpret information. Participants with adverse health outcomes may recall previous experiences differently than those without the outcome (recall bias) or participants may give answers that are socially or politically correct or that they think the researcher wants to hear (social desirability or reporting bias). Strategies for reducing such biases include standard protocols for data collection, training of assessors to promote inter-rater reliability and adherence to protocols, phrasing of questions, and measures (e.g., anonymity, developing rapport) to increase comfort levels for giving honest answers to difficult questions. In addition, the exposure must clearly have occurred before the outcome (clear temporal association). The inability to clearly establish a temporal association is a major limitation of cross-sectional studies, but phrasing of questions may help.
The source of data used in the study impacts its validity and reliability and so needs to be considered. A common source of data is from surveillance, though data may also come from surveys. If an existing database is used, consider how people were entered into the database and how participants were selected from the database. Ecologic studies involve selection and not recruitment. For epidemiologic link studies, consider how thorough the database used was.
B3. Assessment of validity and reliability of data collection instrument
The instruments used to collect data should be valid and reliable. The instruments used to collect data (e.g., interview guide, questionnaire, data extraction form) should be distinguished from the data collection methods (e.g., interview, survey, chart review). Validity means that the instrument is measuring what it is designed to measure, while reliability means that it does so in a consistent way. Specific testing methods are available to assess validity and reliability of instruments, with highest confidence being placed in those with such testing. Standard laboratory protocol and testing can be assumed to be valid and reliable. It can also be assumed these were correctly implemented unless indicated by the researchers.
Strong: There were no missing data; assessors were trained in data collection procedures, and clearly adhered to them; strategies were used to minimize biases associated with data collection procedures, measures or phrasing of questions; clear temporal association.
Moderate: Minimal missing or inaccurate data; assessors were trained in data collection procedures and likely adhered to them; strategies were used to reduce biases associated with data collection procedures, measures or phrasing of questions; clear temporal association.
Weak: Any of the following: substantial data were missing or inaccurate; it is unclear if assessors were trained in data collection procedures and/or adhered to them; it is unclear if strategies were sufficient to reduce bias associated with data collection measures or phrasing of questions; or unclear temporal association.

48 | Part 3: Critical Appraisal Tools—Descriptive Study
B4. Adequacy of ethical conduct
Appropriate steps should be taken to safeguard participants, especially vulnerable groups, from harm, exploitation, and coercion and to protect their rights to self-determination, full disclosure, fair treatment and privacy. Informed consent is a main strategy for protecting rights. Researchers who report their study was approved by an institutional ethics review board but report no other details will have had such details considered and approved. Note that the Tri-Council Policy Statement states that program evaluation and surveillance studies do not require ethical approval, but appropriate steps still need to be taken to safeguard participants and their rights. Public health inquiries such as look back or contact investigations do not require ethics approval.
The ethics of research is also concerned with undue influence of sponsors or other stakeholders to direct the methods or reporting of outcomes so that only favourable conclusions are reached.
B5. Assessment of statistics
The main purpose of a cross-sectional study is to describe the occurrence of an exposure or outcome of interest (e.g., risk factor, disease, behaviour). The appropriate statistics to report are descriptive statistics (e.g., mean or median, proportion, rate) with confidence intervals. An odds ratio (OR) may be calculated to assess associations between variables, and chi-squared or Fisher’s Exact Test used to assess the statistical significance of the OR. Regression may be used to control confounding. Note however that since the study design itself is weak, conclusions drawn from statistically significant findings are limited, and control of confounding is not a major concern as further research is required anyway.
Strong: Research was approved by an appropriate ethics review board, or sufficient details were provided to indicate that ethical conduct was ensured. Research report was not influenced by a funding agency, sponsor or conflict of interest.
Moderate: Not applicable.
Weak: Insufficient details were provided to draw a conclusion regarding ethical conduct. The likelihood of the research report being influenced by a funding agency, sponsor or conflict of interest could not be ruled out.
Strong: Tools are known or were shown to be valid and reliable.
Moderate: There was no attempt to assess validity and reliability but content validity can be assumed by the nature of the questions asked and the involvement of experts in development of the tools.
Weak: There was no attempt to assess validity and reliability and neither can be assumed.

49 | Part 3: Critical Appraisal Tools—Descriptive Study
The main purpose of an ecologic study is to describe the occurrence of an exposure in relation to outcome of interest (e.g., risk factor, disease, behaviour). The appropriate statistics to report are correlation coefficients (e.g., Pearson’s r) but t-tests may also be relevant to examine differences in means. Regression is rarely used to control confounding. Note that since the study design itself is weak, conclusions drawn from statistically significant findings are limited and control of confounding is not a major concern as further research is required anyway.
The statistical tests used in the analysis should be appropriate to the type and level of data, and applied correctly (see “Summary of Common Statistical Tests” in Appendix A of the Tool Kit). If p values and confidence intervals are used, the criterion (e.g., alpha = 0.05) for statistical significance should be clear and appropriate. P values should be interpreted correctly (i.e., result was statistically significant if it was less than alpha, e.g., p<0.05). Confidence intervals (CI) should also be interpreted correctly when given. The values in the CI are all possible actual values of the point estimate. If they are all greater than 1, or all less than 1, they have the same direction of intervention or exposure effect. If some values are lower than 1 and some greater than 1 all within the same CI, the possible values of the point estimate could equally be a protective factor or a risk factor, or indicate an effective or an ineffective intervention. Such CIs indicate one cannot draw conclusions about the effect; possible causes include insufficient power, actual lack of effect or inadequate measurements.
Power in a cross-sectional study refers to the ability of a study to calculate from the sample an estimate of the factor of interest (e.g., prevalence) that is highly likely to reflect the true estimate in the population. Power in an ecologic study refers to the ability of a study to assess whether any association found is due to chance alone. Studies with insufficient sample size, and thus insufficient power, will report a wide CI and/or the values within the CI may indicate different directions of effect, limiting conclusions drawn. Note that representativeness of findings also depends on the representativeness of the sample.
If correlation coefficients are used, criteria for rating the magnitude of correlation as small, moderate and large should be explicit.
Strong: Statistics were appropriate for the level of data; the CI (if reported) was narrow with all values having the same direction of intervention or exposure effect; power was clearly adequate to draw inferences about the population; results (e.g., mean, proportion, OR) were interpreted correctly.
Moderate: Statistics were used correctly; the CI (if reported) was reasonable narrow with uncertain direction of intervention or exposure effect; power likely adequate to draw inferences about the population; results (e.g., mean, proportion, OR) were interpreted correctly.
Weak: Any of the following: statistics were incorrect for the data; the CI (if reported) was wide and power inadequate to draw inferences about the population, or the researchers did not report on the adequacy of the power of the study; or results (e.g., mean proportion, OR) were not interpreted correctly.
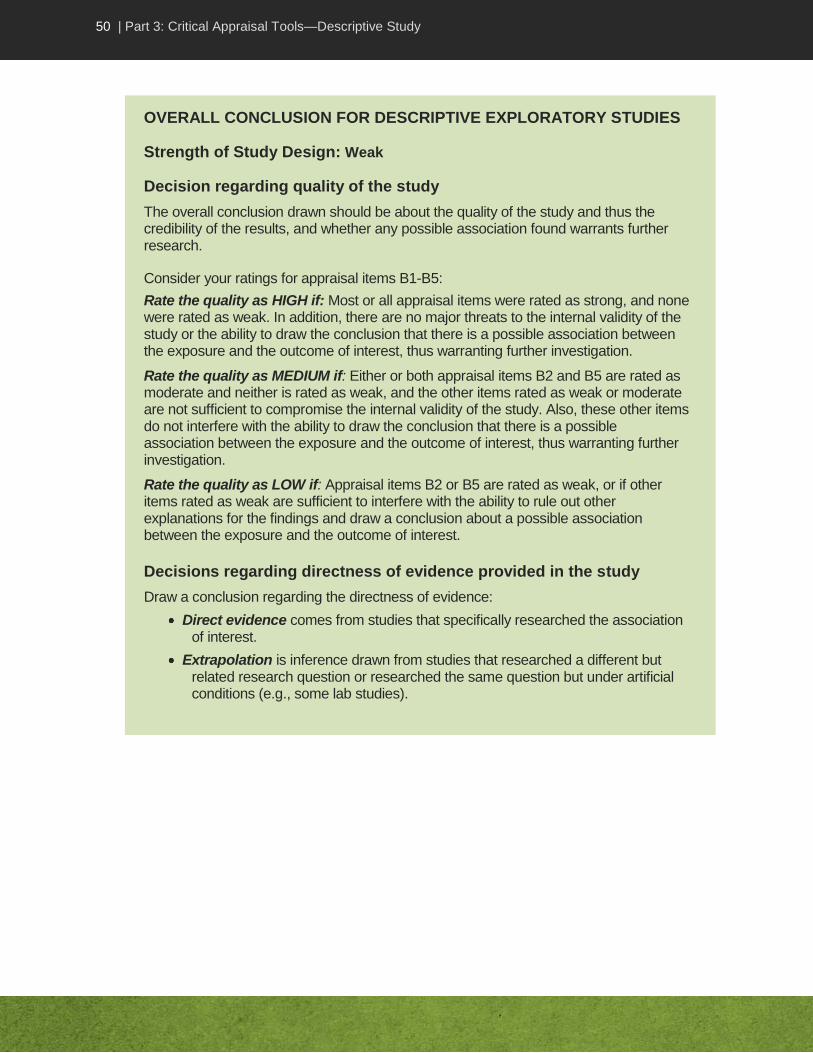
50 | Part 3: Critical Appraisal Tools—Descriptive Study
OVERALL CONCLUSION FOR DESCRIPTIVE EXPLORATORY STUDIES
Strength of Study Design: Weak
Decision regarding quality of the study
The overall conclusion drawn should be about the quality of the study and thus the credibility of the results, and whether any possible association found warrants further research.
Consider your ratings for appraisal items B1-B5:
Rate the quality as HIGH if: Most or all appraisal items were rated as strong, and none were rated as weak. In addition, there are no major threats to the internal validity of the study or the ability to draw the conclusion that there is a possible association between the exposure and the outcome of interest, thus warranting further investigation.
Rate the quality as MEDIUM if: Either or both appraisal items B2 and B5 are rated as moderate and neither is rated as weak, and the other items rated as weak or moderate are not sufficient to compromise the internal validity of the study. Also, these other items do not interfere with the ability to draw the conclusion that there is a possible association between the exposure and the outcome of interest, thus warranting further investigation.
Rate the quality as LOW if: Appraisal items B2 or B5 are rated as weak, or if other items rated as weak are sufficient to interfere with the ability to rule out other explanations for the findings and draw a conclusion about a possible association between the exposure and the outcome of interest.
Decisions regarding directness of evidence provided in the study
Draw a conclusion regarding the directness of evidence:
Direct evidence comes from studies that specifically researched the association of interest.
Extrapolation is inference drawn from studies that researched a different but related research question or researched the same question but under artificial conditions (e.g., some lab studies).
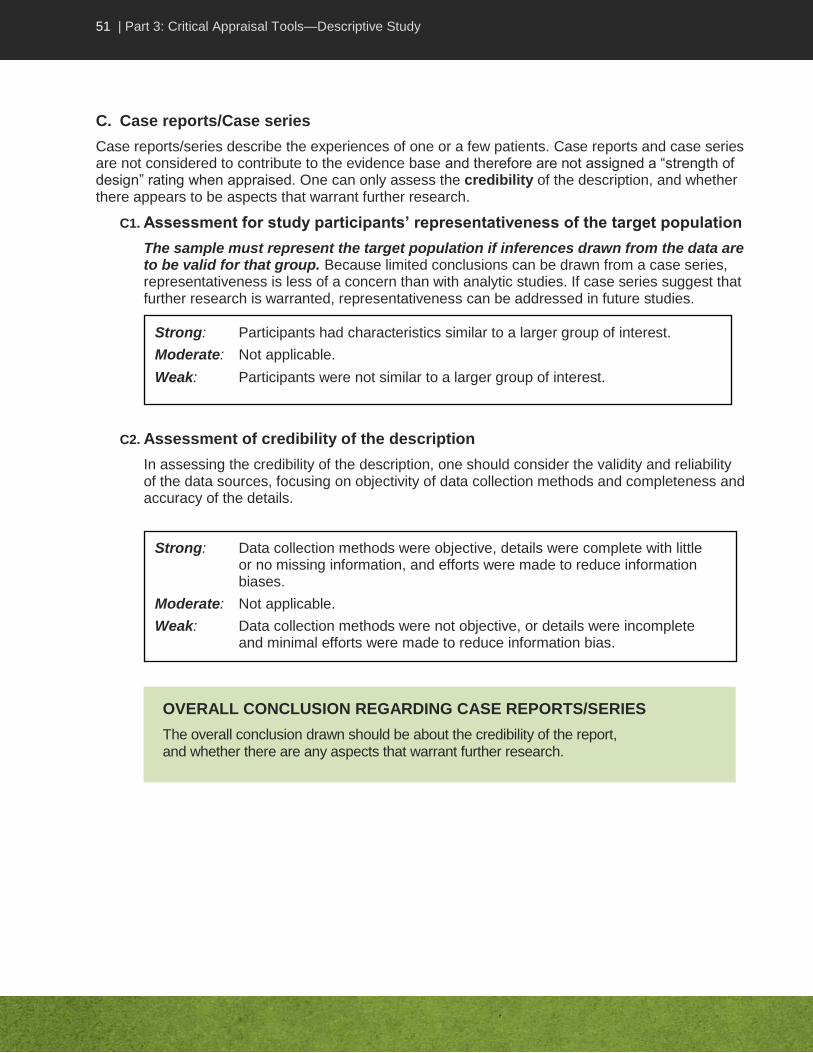
51 | Part 3: Critical Appraisal Tools—Descriptive Study
C. Case reports/Case series
Case reports/series describe the experiences of one or a few patients. Case reports and case series are not considered to contribute to the evidence base and therefore are not assigned a “strength of design” rating when appraised. One can only assess the credibility of the description, and whether there appears to be aspects that warrant further research.
C1. Assessment for study participants’ representativeness of the target population
The sample must represent the target population if inferences drawn from the data are to be valid for that group. Because limited conclusions can be drawn from a case series, representativeness is less of a concern than with analytic studies. If case series suggest that further research is warranted, representativeness can be addressed in future studies.
C2. Assessment of credibility of the description
In assessing the credibility of the description, one should consider the validity and reliability of the data sources, focusing on objectivity of data collection methods and completeness and accuracy of the details.
Strong: Data collection methods were objective, details were complete with little or no missing information, and efforts were made to reduce information biases.
Moderate: Not applicable.
Weak: Data collection methods were not objective, or details were incomplete and minimal efforts were made to reduce information bias.
OVERALL CONCLUSION REGARDING CASE REPORTS/SERIES
The overall conclusion drawn should be about the credibility of the report, and whether there are any aspects that warrant further research.
Strong: Participants had characteristics similar to a larger group of interest.
Moderate: Not applicable.
Weak: Participants were not similar to a larger group of interest.

52 | Part 3: Critical Appraisal Tools—Descriptive Study
CRITICAL APPRAISAL TOOL – DESCRIPTIVE STUDY Key Question: ___________________________________________________________________________________
Author: _____________________________ Year: ___________________ Ref ID: ______________________
Title: ___________________________________________________________________________________________
Reviewer: _______________________________________________________ Date: _______________________
Refer to Descriptive Critical Appraisal Tool Dictionary for complete criteria. Complete only the section for the type of study design being appraised. Unless otherwise specified (by the phrase “any one item”), most or all of the applicable
criteria listed for all ratings should be met for the item to get the identified rating.
A. Screening Question
Strong Moderate Weak
A1. Research question
Clearly focused. Highly relevant to Key Question.
Fairly focused. Related to Key Question.
Unclear or too broad. Unrelated to Key Question.
□ □ □ Comments:
Screening Decision
□ Reject (if weak) OR □ Continue
B. Descriptive Exploratory Study
Strong Moderate Weak
B1. Study participants representative of target population
Random sampling and/or multiple recruitment / selection from various locations or groups; >50% agreed to participate (or ≥80% of exposed were tested).
Random sampling not used but multiple recruitment/selection strategies used. Single source of participants; 30-50% agreed to participate (or 60-79% of exposed were tested).
Random sampling not used. Recruitment/selection processes limited. Participants were volunteers; <30% agreed to participate (or <60% of exposed were tested).
□ □ □ B2. Data collection
sources and methods
No missing data. Assessors trained and clearly adhered to procedures. Biases minimized with respect to data collection procedures and measures. Clear temporal association.
Minimal missing/inaccurate data. Assessors trained and likely adhered to procedures. Biases reduced with respect to data collection procedures and measures. Clear temporal association.
Any one item: substantial missing/ inaccurate data; unclear if assessors were trained; unclear if bias was reduced; or unclear temporal association.
□ □ □ B3. Data collection
instruments Tools known to be valid and reliable.
No attempt to assess validity and reliability of tools. Validity can be assumed based on questions asked and expertise of researchers.
No attempt to assess validity and reliability of tools; neither can these be assumed.
□ □ □

53 | Part 3: Critical Appraisal Tools—Descriptive Study
Overall Conclusion
a) *Strength of study design: Weak
b) Decision regarding quality of study:
Consider your ratings for appraisal items 2-12 and identify the appropriate rating for quality.
□ High □ Medium □ Low
Rate the quality as HIGH if: most/all items rated strong, no weak items. Also, there are no major threats to the internal validity of the study or the ability to draw the conclusion that there is a possible association between the exposure and the outcome of interest. Rate the quality as MEDIUM if: either or both B2 or B5 were rated as moderate and neither rated as weak; other items rated as weak or moderate are insufficient to compromise ability to draw conclusions regarding a possible association between the exposure and the outcome of interest. Rate the quality as LOW if: either B2 or B5 was rated as weak; or other items rated as weak are sufficient to interfere with the ability to rule out other explanations for the findings and draw conclusions regarding a possible association between the exposure and the outcome of interest.
c) Decision regarding directness of evidence
□ Direct □ Extrapolation
*As per Table 1
B4. Ethics
□ Not Applicable
(see dictionary)
Approved by appropriate ethics review board or content indicates ethical conduct was ensured. Research report was not influenced.
Not applicable. Insufficient details provided regarding ethical conduct. Likelihood of research report being influenced could not be ruled out.
□ □ B5. Statistics
(See Table 5) Assess CI if reported
Appropriate statistics used (descriptive). Narrow CI with all values having the same direction of effect. Clearly adequate power. Results interpreted correctly.
Appropriate statistics used. Reasonably narrow CI with uncertain direction of effect. Power likely adequate. Results interpreted correctly.
Any one item: statistics were incorrect for the data; CI was wide; power was inadequate; or results were not interpreted correctly.
□ □ □ Comments:
C. Case Series/Case Report
Strong Moderate Weak
C1. Study participants representative of target population
Participants had characteristics similar to the larger group of interest.
Not applicable Participants were not similar to the larger group of interest.
□ □ C2. Quality of
description Data collection methods were objective. Information bias reduced. Minimal missing information.
Not applicable Any one item: data collection methods were not objective, or details were incomplete and minimal efforts made to reduce information bias.
□ □ Conclusion:
Note: Write a statement about the credibility of the report and whether there appears to be aspects that warrant further research. A strength of study design and a quality rating cannot be assigned.
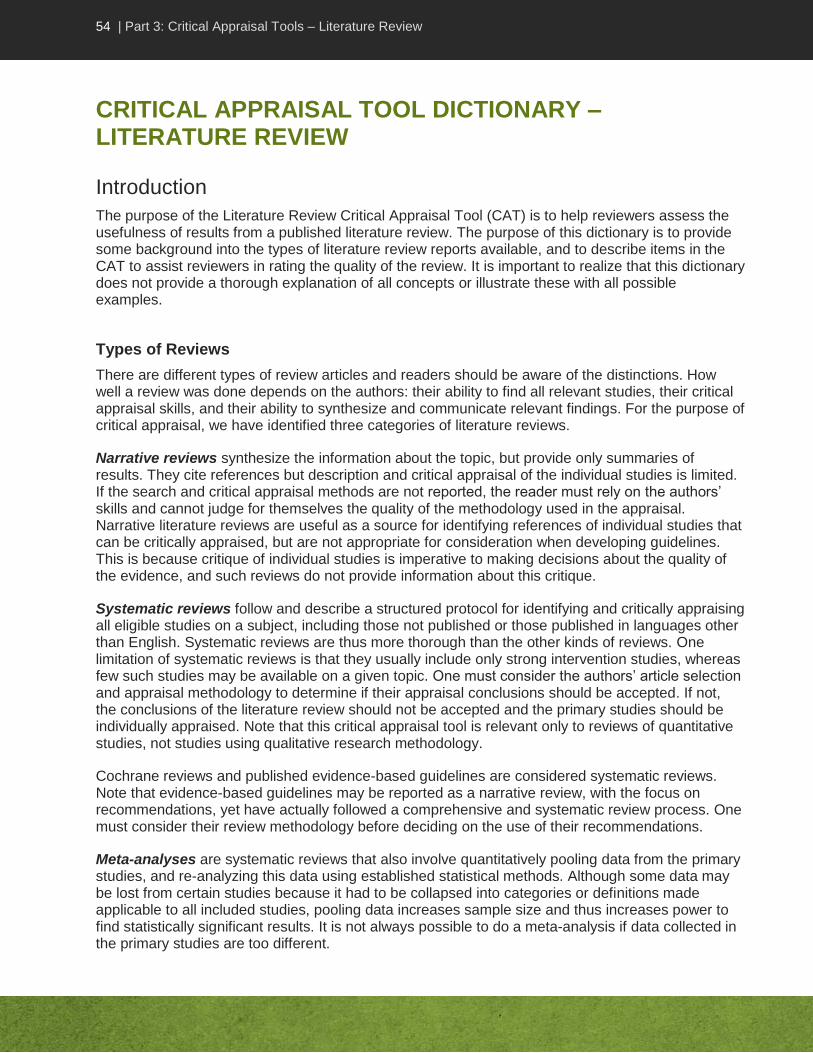
54 | Part 3: Critical Appraisal Tools – Literature Review
CRITICAL APPRAISAL TOOL DICTIONARY – LITERATURE REVIEW
Introduction
The purpose of the Literature Review Critical Appraisal Tool (CAT) is to help reviewers assess the usefulness of results from a published literature review. The purpose of this dictionary is to provide some background into the types of literature review reports available, and to describe items in the CAT to assist reviewers in rating the quality of the review. It is important to realize that this dictionary does not provide a thorough explanation of all concepts or illustrate these with all possible examples.
Types of Reviews
There are different types of review articles and readers should be aware of the distinctions. How well a review was done depends on the authors: their ability to find all relevant studies, their critical appraisal skills, and their ability to synthesize and communicate relevant findings. For the purpose of critical appraisal, we have identified three categories of literature reviews.
Narrative reviews synthesize the information about the topic, but provide only summaries of results. They cite references but description and critical appraisal of the individual studies is limited. If the search and critical appraisal methods are not reported, the reader must rely on the authors’ skills and cannot judge for themselves the quality of the methodology used in the appraisal. Narrative literature reviews are useful as a source for identifying references of individual studies that can be critically appraised, but are not appropriate for consideration when developing guidelines. This is because critique of individual studies is imperative to making decisions about the quality of the evidence, and such reviews do not provide information about this critique.
Systematic reviews follow and describe a structured protocol for identifying and critically appraising all eligible studies on a subject, including those not published or those published in languages other than English. Systematic reviews are thus more thorough than the other kinds of reviews. One limitation of systematic reviews is that they usually include only strong intervention studies, whereas few such studies may be available on a given topic. One must consider the authors’ article selection and appraisal methodology to determine if their appraisal conclusions should be accepted. If not, the conclusions of the literature review should not be accepted and the primary studies should be individually appraised. Note that this critical appraisal tool is relevant only to reviews of quantitative studies, not studies using qualitative research methodology.
Cochrane reviews and published evidence-based guidelines are considered systematic reviews. Note that evidence-based guidelines may be reported as a narrative review, with the focus on recommendations, yet have actually followed a comprehensive and systematic review process. One must consider their review methodology before deciding on the use of their recommendations.
Meta-analyses are systematic reviews that also involve quantitatively pooling data from the primary studies, and re-analyzing this data using established statistical methods. Although some data may be lost from certain studies because it had to be collapsed into categories or definitions made applicable to all included studies, pooling data increases sample size and thus increases power to find statistically significant results. It is not always possible to do a meta-analysis if data collected in the primary studies are too different.

55 | Part 3: Critical Appraisal Tools – Literature Review
Approaching a Literature Review Report
Literature reviews can be complex because they involve several studies and consequently have to be approached differently from other types of studies. It is helpful to first read the abstract to get an overview of the purpose and main results of the report. However, it is important to read the methods and results sections since the abstract may not be complete or accurate.
Most reports follow a similar structure and begin with a brief background and rationale as to the problem; the objectives are then identified. Methods are described; descriptions are usually brief in a narrative review, detailed in a systematic review and vary in other reports. Results may be reported by theme or by study or both. Reports usually end with conclusions and recommendations. While structures are similar for all reports, level of detail varies and actual section headers may differ. Scanning the article before reading it helps the reader identify the structure and major headings of the report, which facilitates finding the appropriate section(s) to concentrate on to answer the questions raised in the CAT.
With the exception of meta-analyses, which are strong study designs, a strength of study design is not assigned to literature reviews. This is because literature reviews are not primary research studies but a summary of findings from several research studies.
Instructions
Start your critical appraisal by identifying the study design. If you are unable to identify the study design, discuss the review with your colleagues and choose the closest study design. Score each item on the tool as strong, moderate or weak, according to the criteria described here. Not all criteria will be applicable to all study designs. Unless otherwise specified, most or all of the applicable criteria listed for all ratings should be met for the item to get the identified rating. With some criteria for a “weak” rating, indicated by the phrase “any of the following”, the item should be rated as weak if even only one of the criteria has been met.
Criteria for consideration are written in bold italics; additional explanations are also provided. Some studies do not provide enough details to adequately assess if each criterion being appraised is met or not. This may be due to a poorly written report of the study and may not be reflective of a low quality study. Nonetheless, your assessment should only focus on what is documented in the study and not on your assumptions about the study.
The tool contains space for comments; the reviewer should include comments to support decisions, help identify areas of concerns (e.g., major weaknesses or limitations) and whether they would lead to incorrect conclusions about the existence of an association or its strength (over or under estimation of effect).
If you are unable to make a decision about how to rate an item, write a comment and discuss the item with your colleagues. Conclusions about the quality of the evidence are generally made by group consensus rather than by individual decision.
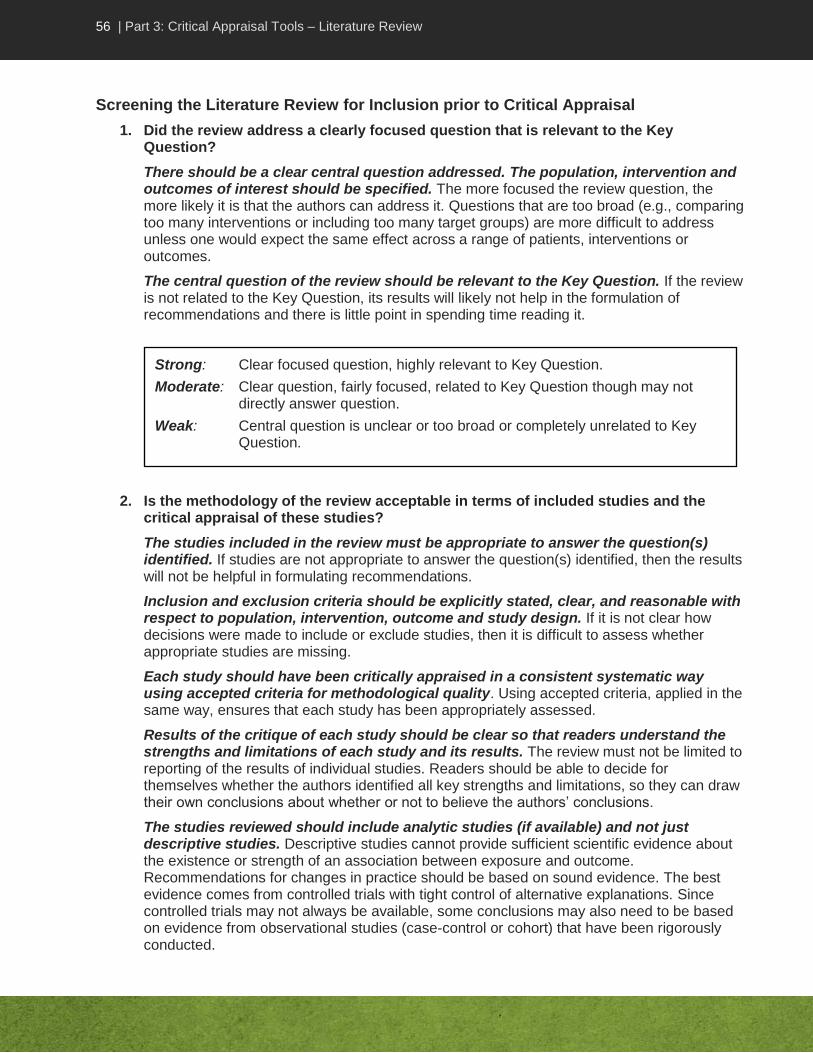
56 | Part 3: Critical Appraisal Tools – Literature Review
Screening the Literature Review for Inclusion prior to Critical Appraisal
1. Did the review address a clearly focused question that is relevant to the Key Question?
There should be a clear central question addressed. The population, intervention and outcomes of interest should be specified. The more focused the review question, the more likely it is that the authors can address it. Questions that are too broad (e.g., comparing too many interventions or including too many target groups) are more difficult to address unless one would expect the same effect across a range of patients, interventions or outcomes.
The central question of the review should be relevant to the Key Question. If the review is not related to the Key Question, its results will likely not help in the formulation of recommendations and there is little point in spending time reading it.
2. Is the methodology of the review acceptable in terms of included studies and the critical appraisal of these studies?
The studies included in the review must be appropriate to answer the question(s) identified. If studies are not appropriate to answer the question(s) identified, then the results will not be helpful in formulating recommendations.
Inclusion and exclusion criteria should be explicitly stated, clear, and reasonable with respect to population, intervention, outcome and study design. If it is not clear how decisions were made to include or exclude studies, then it is difficult to assess whether appropriate studies are missing.
Each study should have been critically appraised in a consistent systematic way using accepted criteria for methodological quality. Using accepted criteria, applied in the same way, ensures that each study has been appropriately assessed.
Results of the critique of each study should be clear so that readers understand the strengths and limitations of each study and its results. The review must not be limited to reporting of the results of individual studies. Readers should be able to decide for themselves whether the authors identified all key strengths and limitations, so they can draw their own conclusions about whether or not to believe the authors’ conclusions.
The studies reviewed should include analytic studies (if available) and not just descriptive studies. Descriptive studies cannot provide sufficient scientific evidence about the existence or strength of an association between exposure and outcome. Recommendations for changes in practice should be based on sound evidence. The best evidence comes from controlled trials with tight control of alternative explanations. Since controlled trials may not always be available, some conclusions may also need to be based on evidence from observational studies (case-control or cohort) that have been rigorously conducted.
Strong: Clear focused question, highly relevant to Key Question.
Moderate: Clear question, fairly focused, related to Key Question though may not directly answer question.
Weak: Central question is unclear or too broad or completely unrelated to Key Question.

57 | Part 3: Critical Appraisal Tools – Literature Review
Assessment of Methodology
3. Did the authors conduct a comprehensive search for relevant articles?
The authors should perform comprehensive searches in several databases using several search terms. Extensive literature searches provide a comprehensive and balanced (reflecting both positive and negative results) range of studies for inclusion. Searches must go beyond MEDLINE as this database represents a fraction of the total number of journals published worldwide. Because of inconsistencies in the way articles are indexed in databases, several search terms need to be included in a search strategy to ensure that the majority of relevant articles have been found.
The reviewers should search for non-English language studies. Useful studies are published in other languages and should be included. The reviewers should obtain relevant articles referred to in other included studies. Searches should include review of bibliographies of included studies for additional references missed in the database searches.
The reviewers should search for grey literature (e.g., government reports) and unpublished studies. The search should have included unpublished studies, because of publication bias (tendency toward publishing only studies with favourable results). This can be done by contacting researchers directly. Researchers and unpublished studies can also be identified through abstracts, conference proceedings, professional associations, pharmaceutical companies, etc.
Strong: Studies relevant to Key Question included. Analytic studies included. Clear inclusion criteria identified. Studies were appraised in a consistent systematic way using accepted criteria and showing clear results.
Moderate: Studies relevant to Key Question included. Analytic studies included. Inclusion criteria or criteria for critical appraisal may not be clearly identified. Results of critiquing each study were clear.
Weak: Any of the following: studies relevant to Key Question not included; analytic studies not included; inclusion criteria are not clearly identified; or did not report results of critical appraisal of each study.
SCREENING DECISION
Draw a conclusion as to whether to continue with the critical appraisal or reject the review.
If the review article is rated weak for appraisal item 2, then stop the critical appraisal and do not complete the Evidence Summary Table for the literature review as a whole. Instead, identify studies that are relevant to the Key Question and appraise the actual studies individually, using the Analytic Study Critical Appraisal Tool.
If item 2 is moderate or strong but item 1 is weak, then consider carefully the value of continuing.

58 | Part 3: Critical Appraisal Tools – Literature Review
4. How rigorous was the review process?
Only studies meeting inclusion criteria should be included based on independent review by more than one appraiser. Reviews should exclude all studies found in the search that did not meet the predetermined inclusion criteria, e.g. those that did not address the key question or use an acceptable study design.
More than one appraiser should review each study, using the same criteria, with good agreement on critical appraisal results. Since critical appraisal can become a somewhat subjective process, it is desirable that two independent assessors appraise the articles using the same criteria and reach similar conclusions.
For meta-analyses, data should be independently extracted by two reviewers using a standardized form specially developed and tested for the study. Differences in extracted data should be discussed and resolved by consensus.
5. If the results have been combined in a meta-analysis, was it reasonable to do so?
The results of each individual study should be included so that the readers can judge for themselves that the combined result adequately represents the true picture shown by the individual result. A test should be done to ensure studies were combinable (e.g., Chi-squared test for homogeneity). The studies combined should not differ considerably in population, interventions, comparisons made or outcomes measured.
Significant heterogeneity is not desirable and a visual assessment of the forest plot for the amount of variation between results of individual studies should show some consistency in the direction of the results (homogeneity). If heterogeneity exists, a random effects model should be used and/or the clinical appropriateness of combining the studies as well as possible sources of heterogeneity should be addressed by the authors.
The pooled estimate should be correctly interpreted using appropriate summary statistic (e.g., odds ratio, relative risk, etc.) for the type of data (see “Summary of Common Statistical Tests” in Appendix A).
Strong: Only studies meeting inclusion criteria were included and more than one appraiser screened and critically appraised each study using same criteria with good agreement.
Moderate: Applied criteria for inclusion and critical appraisal but did not use more than one appraiser or unclear what criteria were.
Weak: Did not use (or not clear if used) inclusion and critical appraisal criteria.
Strong: Comprehensive search of several databases and sources, bibliographies, non-English language literature, grey/unpublished literature.
Moderate: Comprehensive search of the databases, including non-English language literature. May or may not have searched bibliographies or looked for grey/unpublished literature.
Weak: Limited search in terms of databases and non-English literature. Did not look for grey/unpublished literature.

59 | Part 3: Critical Appraisal Tools – Literature Review
Assessment of Study Results
6. Were the results clearly described and interpreted in a meaningful way?
Note: For critical appraisal of a meta-analysis, skip this item and appraise results using item 7.
The statistical significance of the result should be interpreted correctly. Criteria for significance should be clear, and results interpreted according to accepted standards. If confidence intervals were reported, the decision about whether or not to use this intervention should be the same whether the actual value (e.g., in a clinical setting) is at the upper or lower confidence limit of the result.
The effect size should be clinically meaningful. This is open to judgment and will vary according to the topic and context.
METHODOLOGY DECISION
Draw a conclusion as to strength of the review methodology.
Weak review methodology:
If item 4 is weak, stop appraising the literature review and do not add to the Evidence Summary Table.
If Items 3 and/or 5 are weak, then consider carefully the value of continuing. If critical appraisal is discontinued, identify studies in the literature review that are relevant to the Key Question and appraise them individually using the appropriate Critical Appraisal Tool.
Moderate or strong review methodology:
If items 3-5 are moderate or strong, then continue with appraisal.
Strong: Combined studies did not differ considerably in population, intervention used and outcomes measured. Minimal heterogeneity exists between individual study results. Appropriate summary statistics used.
Moderate: Combined studies did not differ considerably in population, intervention used and outcomes measured. Significant heterogeneity exists but was adequately addressed by authors. Reported summary statistics seem reasonable.
Weak: Combined studies differed considerably in population or in intervention used or in outcomes measured. Significant heterogeneity exists and was not addressed. Summary statistics do not seem reasonable.

60 | Part 3: Critical Appraisal Tools – Literature Review
As no meta-analysis was done, the results from across studies should be described in terms of being similar or dissimilar. As no single summary measure is available in these circumstances, it is helpful to have a description of the range of results and any trend displayed (e.g., if results are conflicting, if all have a positive effect or negative effect, if effect is strong or variable). A reasonable explanation for any variation of the results is offered.
7. For meta-analyses: Assessment of magnitude and precision of treatment effect
Common methods used to report results of meta-analysis include odds ratio or relative risk (if outcome is dichotomous e.g. disease versus no disease) and mean differences (if outcome is continuous e.g. blood pressure measurement). An RR of greater than 1 indicates the outcome is greater in the exposed group than in the non-exposed group (i.e., increased risk), while an RR of less than 1 indicates the outcome is lower in the exposed group than in the non-exposed group (i.e., reduced risk). A ratio of 1 indicates no difference in outcome (i.e., risk is likely the same in both exposed and non-exposed groups). An OR is an estimate of the RR and is interpreted in the same way in terms of risk, even though it actually assesses the odds of exposure in those with the outcome and not risk of outcome in those who have been exposed.
Odds ratio and relative risk reported in a meta-analysis should be accompanied by confidence intervals (CI). The width of the confidence interval (CI) indicates the precision of the estimate. As the width of the interval increases, the precision of the estimate decreases. The decision about whether or not to use the intervention (e.g., in a clinical setting) should be the same whether the actual value is at the upper or lower confidence limit of the result.
The forest plot should show small differences of treatment effect size between studies with good overlap of the CI of the point estimates in the studies. Greater weights are given to results from larger studies that provide more information as they are likely to be closer to the true effect. An overall treatment effect is calculated as a weighted average of the individual summary statistics. A CI of 95 or 99% should be reported.
Meta-analysis with insufficient power generally shows an extreme beneficial treatment effect. In such cases, a careful appraisal should be undertaken. The total number of participants/interventions pooled (sample size) has more impact on the power of the study than the total number of studies pooled, therefore pooling large primary studies is beneficial.
Strong: Correct interpretation of statistical significance and confidence interval or reasonable summary of trend, and gives reasonable interpretation of potential impact on patients (e.g., is clinically meaningful, reason for variation).
Moderate: Correct interpretation of statistical significance and confidence interval or reasonable summary of trend, but did not discuss if clinically meaningful or reasons for variation.
Weak: Did not correctly interpret the results.
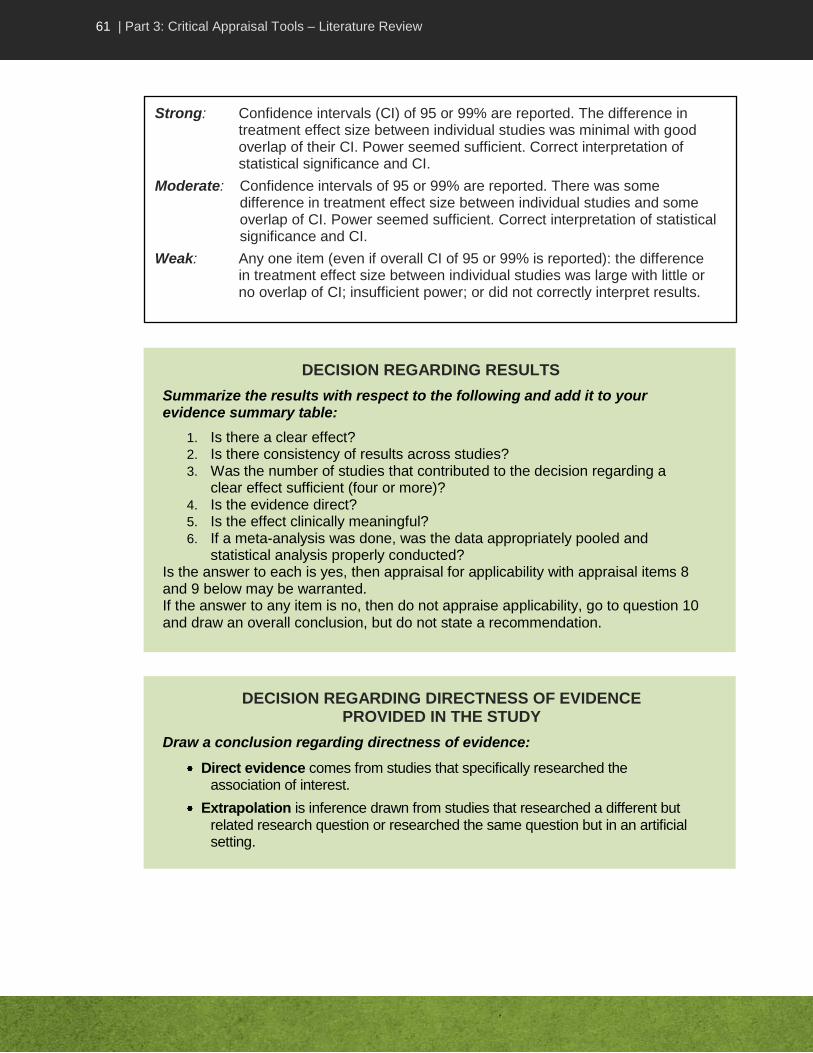
61 | Part 3: Critical Appraisal Tools – Literature Review
DECISION REGARDING RESULTS
Summarize the results with respect to the following and add it to your evidence summary table:
1. Is there a clear effect? 2. Is there consistency of results across studies? 3. Was the number of studies that contributed to the decision regarding a
clear effect sufficient (four or more)? 4. Is the evidence direct? 5. Is the effect clinically meaningful? 6. If a meta-analysis was done, was the data appropriately pooled and
statistical analysis properly conducted? Is the answer to each is yes, then appraisal for applicability with appraisal items 8 and 9 below may be warranted. If the answer to any item is no, then do not appraise applicability, go to question 10 and draw an overall conclusion, but do not state a recommendation.
Strong: Confidence intervals (CI) of 95 or 99% are reported. The difference in treatment effect size between individual studies was minimal with good overlap of their CI. Power seemed sufficient. Correct interpretation of statistical significance and CI.
Moderate: Confidence intervals of 95 or 99% are reported. There was some difference in treatment effect size between individual studies and some overlap of CI. Power seemed sufficient. Correct interpretation of statistical significance and CI.
Weak: Any one item (even if overall CI of 95 or 99% is reported): the difference in treatment effect size between individual studies was large with little or no overlap of CI; insufficient power; or did not correctly interpret results.
DECISION REGARDING DIRECTNESS OF EVIDENCE PROVIDED IN THE STUDY
Draw a conclusion regarding directness of evidence:
Direct evidence comes from studies that specifically researched the association of interest.
Extrapolation is inference drawn from studies that researched a different but related research question or researched the same question but in an artificial setting.
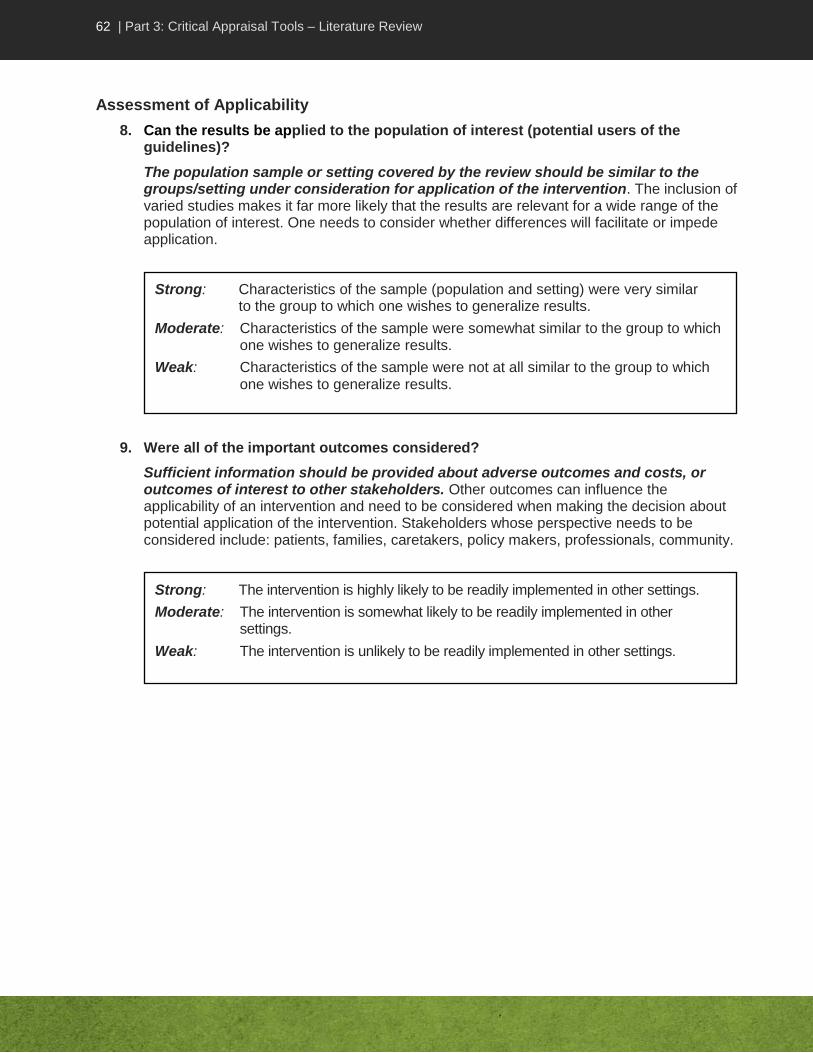
62 | Part 3: Critical Appraisal Tools – Literature Review
Assessment of Applicability
8. Can the results be applied to the population of interest (potential users of the guidelines)?
The population sample or setting covered by the review should be similar to the groups/setting under consideration for application of the intervention. The inclusion of varied studies makes it far more likely that the results are relevant for a wide range of the population of interest. One needs to consider whether differences will facilitate or impede application.
9. Were all of the important outcomes considered?
Sufficient information should be provided about adverse outcomes and costs, or outcomes of interest to other stakeholders. Other outcomes can influence the applicability of an intervention and need to be considered when making the decision about potential application of the intervention. Stakeholders whose perspective needs to be considered include: patients, families, caretakers, policy makers, professionals, community.
Strong: Characteristics of the sample (population and setting) were very similar to the group to which one wishes to generalize results.
Moderate: Characteristics of the sample were somewhat similar to the group to which one wishes to generalize results.
Weak: Characteristics of the sample were not at all similar to the group to which one wishes to generalize results.
Strong: The intervention is highly likely to be readily implemented in other settings.
Moderate: The intervention is somewhat likely to be readily implemented in other settings.
Weak: The intervention is unlikely to be readily implemented in other settings.

63 | Part 3: Critical Appraisal Tools – Literature Review
Overall Conclusion (for all reviews including meta-analysis)
10. What conclusion can be drawn based on the evidence contained in the review?
Note: If the critical appraisal of the literature review was not completed due to rejection at the screening or methodology stage, or if the evidence in the review article is insufficient to make a recommendation, this should be indicated in the tool and no further conclusions drawn.
If the study was not rejected at screening or due to weak review methods, and there was sufficient evidence to make a recommendation, then a final conclusion is drawn based on the results of the review. A high quality systematic review provides a good assessment of evidence at the time the review was written. The results need to be considered in the context of studies which would have been conducted since the time of the literature search done by the reviewers.
Note that conclusions will vary according to the quality of the review methods as well as the actual results of the studies included. Complete the Evidence Summary Table and draw overall conclusions using the guideline below.
OVERALL CONCLUSION
Strength of study design (applicable to meta-analyses only): Strong
Systematic and narrative reviews: No rating
Decision regarding quality of the study
The overall conclusion drawn should be about the quality (rigour) of the review methods as well as the quality of the research studies included in the literature review, and thus the credibility of the body of evidence covered by the literature review. Before making recommendations based on the literature review, you should consider whether there was a clear association found between exposure and outcome, and the samples in the studies covered by the literature review are similar to the group to which results are to be generalized. Consider your ratings for methodology and decision regarding results:
Rate the quality as HIGH if: Decision regarding methodology was strong and the overall conclusion drawn about the association between the exposure and outcome of interest came from 4 or more studies of strong design and high quality.
Rate the quality as MEDIUM if: Review methods were rated as moderate, or methods were rated as strong but fewer than 4 studies contributed to the overall conclusion, or the included studies were not strong designs and high quality.
Any literature review of weak methods should be considered as low quality and should have been rejected from further appraisal.

64 | Part 3: Critical Appraisal Tools – Literature Review
High quality systematic reviews would have already had in depth critical appraisal of the evidence from relevant studies so you do not have to review each study yourself.
COMPLETION OF EVIDENCE TABLE
If there was sufficient evidence to make a recommendation and the results were applicable to the population of interest: Summarize the following, and add to the Evidence Summary Table (use the definitions for evaluating evidence):
a) The overall conclusion and results regarding effect b) The number of studies of each design strength and the quality of the
systematic literature review e.g., 5 strong-design studies; 3 of high quality, and 2 of medium quality).
c) The consistency of results d) The directness of evidence
Consider the results of the literature review in the context of other available literature.
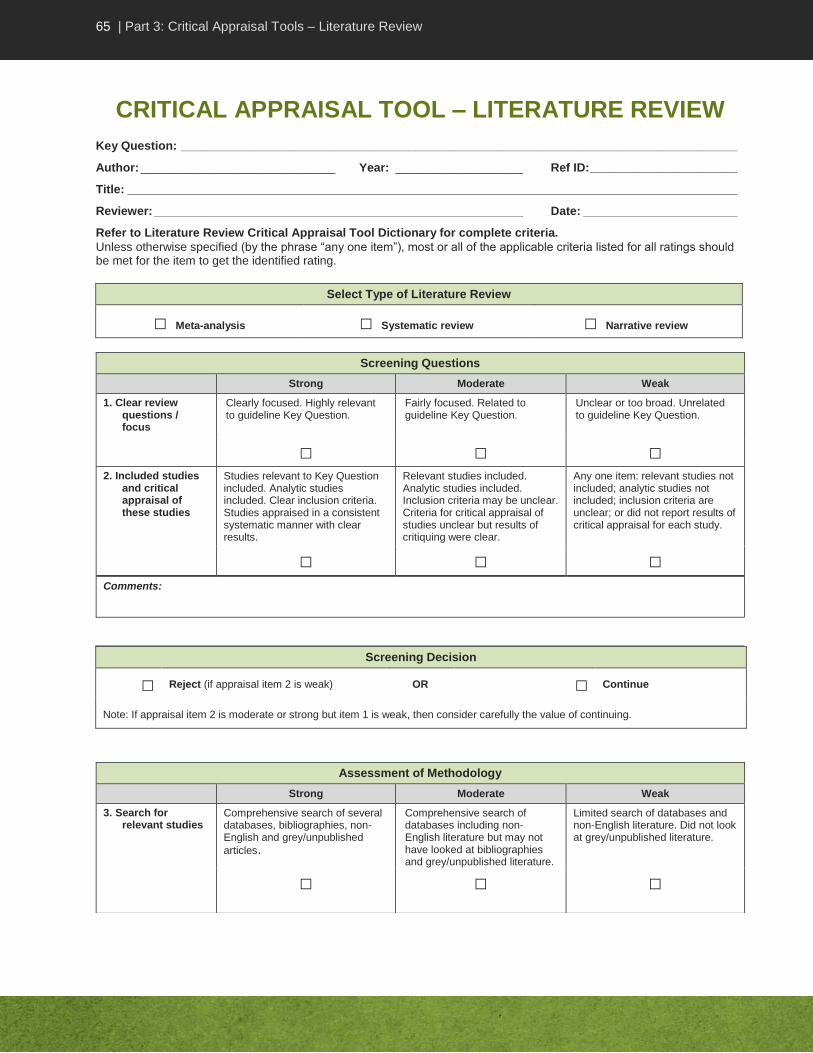
65 | Part 3: Critical Appraisal Tools – Literature Review
CRITICAL APPRAISAL TOOL – LITERATURE REVIEW
Key Question: ___________________________________________________________________________________
Author: _____________________________ Year: ___________________ Ref ID: ______________________
Title: ___________________________________________________________________________________________
Reviewer: _______________________________________________________ Date: _______________________
Refer to Literature Review Critical Appraisal Tool Dictionary for complete criteria.
Unless otherwise specified (by the phrase “any one item”), most or all of the applicable criteria listed for all ratings should be met for the item to get the identified rating.
Select Type of Literature Review
□ Meta-analysis □ Systematic review □ Narrative review
Screening Decision
□ Reject (if appraisal item 2 is weak) OR □ Continue
Note: If appraisal item 2 is moderate or strong but item 1 is weak, then consider carefully the value of continuing.
Screening Questions
Strong Moderate Weak
1. Clear review questions / focus
Clearly focused. Highly relevant to guideline Key Question.
Fairly focused. Related to guideline Key Question.
Unclear or too broad. Unrelated to guideline Key Question.
□ □ □ 2. Included studies
and critical appraisal of these studies
Studies relevant to Key Question included. Analytic studies included. Clear inclusion criteria. Studies appraised in a consistent systematic manner with clear results.
Relevant studies included. Analytic studies included. Inclusion criteria may be unclear. Criteria for critical appraisal of studies unclear but results of critiquing were clear.
Any one item: relevant studies not included; analytic studies not included; inclusion criteria are unclear; or did not report results of critical appraisal for each study.
□ □ □ Comments:
Assessment of Methodology
Strong Moderate Weak
3. Search for relevant studies
Comprehensive search of several databases, bibliographies, non-English and grey/unpublished
articles.
Comprehensive search of databases including non-English literature but may not have looked at bibliographies and grey/unpublished literature.
Limited search of databases and non-English literature. Did not look at grey/unpublished literature.
□ □ □
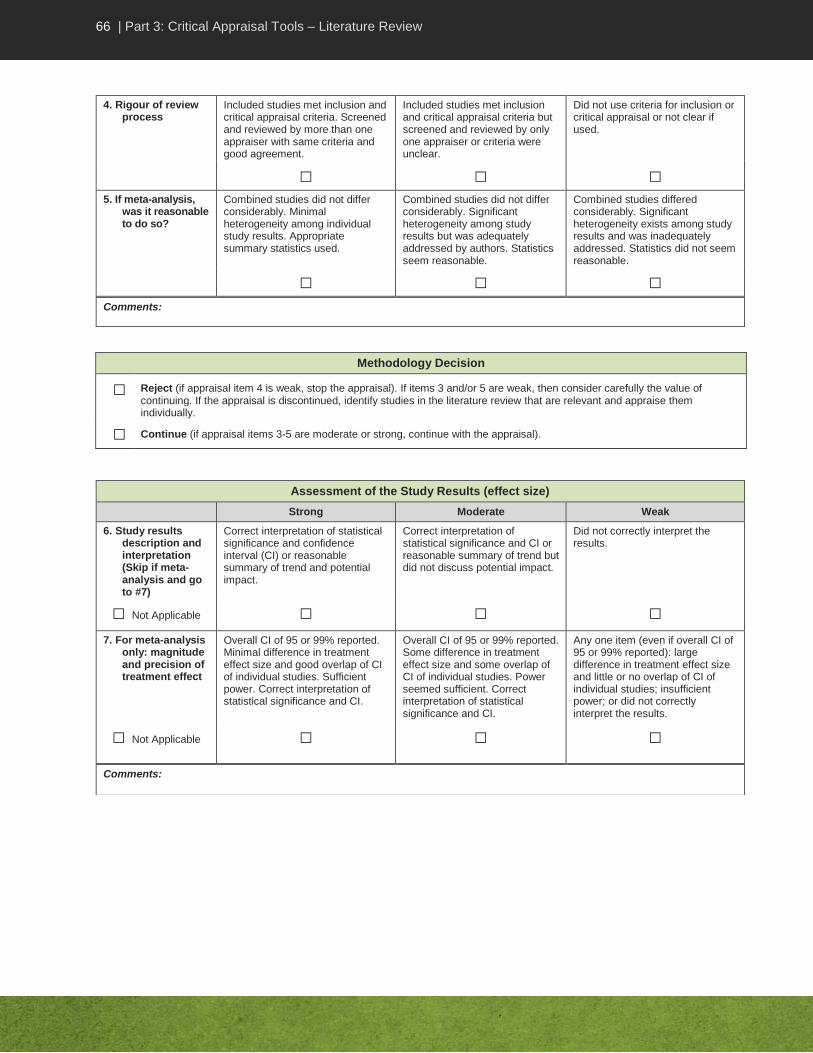
66 | Part 3: Critical Appraisal Tools – Literature Review
Methodology Decision
□ Reject (if appraisal item 4 is weak, stop the appraisal). If items 3 and/or 5 are weak, then consider carefully the value of continuing. If the appraisal is discontinued, identify studies in the literature review that are relevant and appraise them individually.
□ Continue (if appraisal items 3-5 are moderate or strong, continue with the appraisal).
4. Rigour of review process
Included studies met inclusion and critical appraisal criteria. Screened and reviewed by more than one appraiser with same criteria and good agreement.
Included studies met inclusion and critical appraisal criteria but screened and reviewed by only one appraiser or criteria were unclear.
Did not use criteria for inclusion or critical appraisal or not clear if used.
□ □ □ 5. If meta-analysis,
was it reasonable to do so?
Combined studies did not differ considerably. Minimal heterogeneity among individual study results. Appropriate summary statistics used.
Combined studies did not differ considerably. Significant heterogeneity among study results but was adequately addressed by authors. Statistics seem reasonable.
Combined studies differed considerably. Significant heterogeneity exists among study results and was inadequately addressed. Statistics did not seem reasonable.
□ □ □ Comments:
Assessment of the Study Results (effect size)
Strong Moderate Weak
6. Study results description and interpretation (Skip if meta-analysis and go to #7)
Correct interpretation of statistical significance and confidence interval (CI) or reasonable summary of trend and potential impact.
Correct interpretation of statistical significance and CI or reasonable summary of trend but did not discuss potential impact.
Did not correctly interpret the results.
□ Not Applicable □ □ □ 7. For meta-analysis
only: magnitude and precision of treatment effect
Overall CI of 95 or 99% reported. Minimal difference in treatment effect size and good overlap of CI of individual studies. Sufficient power. Correct interpretation of statistical significance and CI.
Overall CI of 95 or 99% reported. Some difference in treatment effect size and some overlap of CI of individual studies. Power seemed sufficient. Correct interpretation of statistical significance and CI.
Any one item (even if overall CI of 95 or 99% reported): large difference in treatment effect size and little or no overlap of CI of individual studies; insufficient power; or did not correctly interpret the results.
□ Not Applicable
□ □ □
Comments:

67 | Part 3: Critical Appraisal Tools – Literature Review
Decision Regarding Results
Draw a conclusion as to whether there is sufficient evidence to make a recommendation for action:
a) Is there a clear effect? □ Yes □ No
b) Is there consistency of results across studies? □ Yes □ No
c) Was the number of studies that contributed to the decision regarding a clear effect sufficient (four or more)?
□ Yes □ No
d) Is the evidence direct? □ Yes □ No
e) Is the effect clinically meaningful? □ Yes □ No
f) If meta-analysis, were data appropriately pooled and statistical analysis properly conducted?
□ Yes □ No
If the answer to each is YES, then appraisal for applicability with appraisal items 8 and 9 may be warranted.
If the answer to any item is NO, then do not appraise items 8 and 9, go to appraisal item 10 and draw an overall conclusion, do not state a recommendation.
Decision regarding directness of evidence provided in the study
Draw a conclusion regarding directness of evidence:
□ Direct evidence comes from studies that specifically researched the association of interest.
□ Extrapolation is the inference drawn from studies that researched a different but related research question or researched the same question but in an artificial setting.
Assessment of Applicability
Strong Moderate Weak
8. Application of results to population of interest
Sample population and setting very similar to that of population of
interest.
Sample population and setting somewhat similar to that of population of interest.
Sample population and setting not similar to that of population of interest.
□ □ □ 9. Applicability
based on important outcomes (e.g., costs, stakeholder perspectives)
Intervention is highly likely to be readily implemented in other settings.
Intervention is somewhat likely to be readily implemented in other settings.
Intervention is unlikely to be readily implemented in other settings.
□ □ □
Comments:
Include major weaknesses or limitations (e.g., important inconsistency of results, high probability of reporting bias, uncertainty about directness of evidence).

68 | Part 3: Critical Appraisal Tools – Literature Review
Overall Conclusion and Evidence Summary Table
10. Can a conclusion be drawn based on the evidence? □ Yes □ No
If NO and unable to use the literature review as a whole, check the reason and appraise individual studies.
Rejected at screening
Weak review
methods
Insufficient evidence to make a recommendation
□ □ □
If yes and there was sufficient evidence to make a recommendation and the results were applicable to the population of interest complete the following:
Strength of study design (applicable to meta-analyses only): Strong
Systematic and narrative reviews: No Rating
Decision regarding quality of study
The overall conclusion drawn should be about the quality (rigour) of the review methods as well as the quality of the research studies included in the literature review, and thus the credibility of the body of evidence covered by the literature review. Before making recommendations based on the literature review, one should consider whether a clear association was found between exposure and outcome, and the samples in the studies covered by the literature review are similar to the group to whom one wishes to generalize results.
Consider your ratings for methodology and decision regarding results:
□ Rate the quality as HIGH if: Decision regarding methodology was strong and the overall conclusion drawn about the association between the exposure and outcome of interest came from at least 4 or more studies of strong design and high quality.
□ Rate the quality as MEDIUM if: Review methods were rated as moderate, or methods were rated as strong but fewer than 4 studies contributed to the overall conclusion, or the included studies were not strong designs and high quality.
Any literature review of weak methods should be considered as low quality and should have been rejected from further appraisal.
Make a recommendation:
Comments:
Completion of Evidence Table
If there was sufficient evidence to make a recommendation and the results were applicable to the population of interest:
Summarize the following, and add to the Evidence Summary Table (use the definitions for evaluating evidence)
a) The overall conclusion and results regarding effect
b) The number of studies of each design strength and the quality of the systematic literature review (e.g., 5 strong-design studies: 3 of high quality and 2 of medium quality).
c) The consistency of results
d) The directness of evidence
Consider the results of the literature review in the context of other available literature.
High quality systematic reviews would have already had in depth critical appraisal of the evidence from relevant studies so you do not have to review each study yourself.
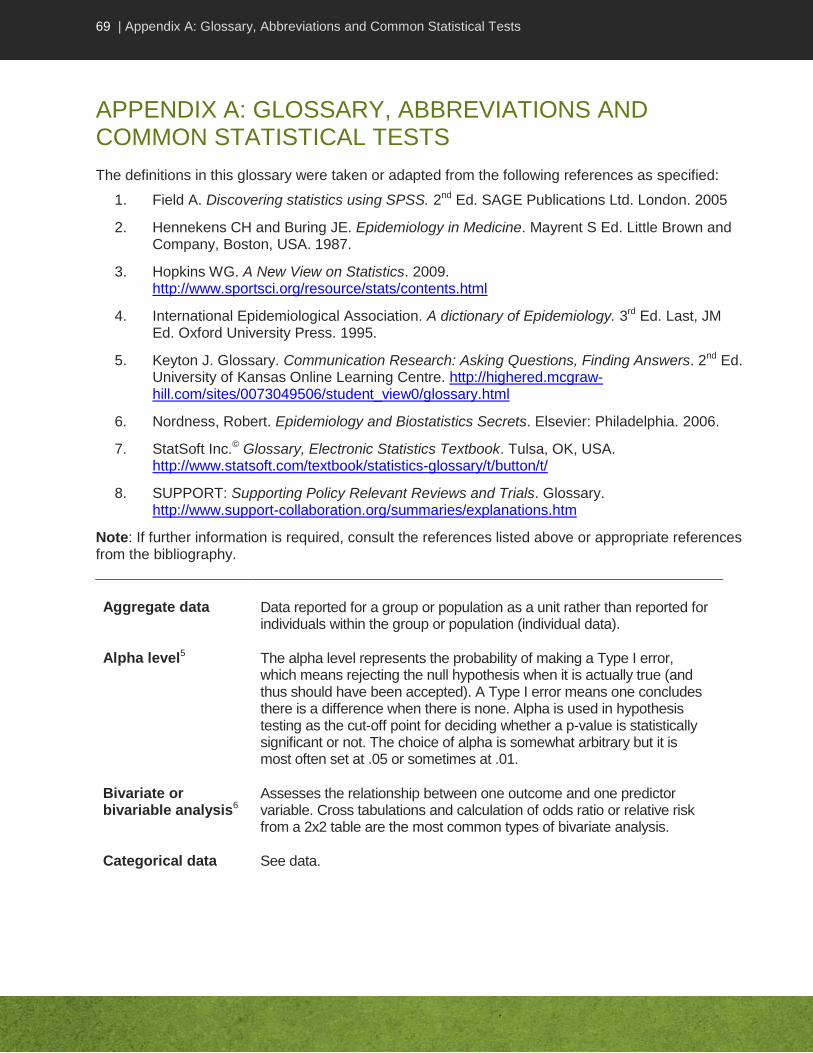
69 | Appendix A: Glossary, Abbreviations and Common Statistical Tests
APPENDIX A: GLOSSARY, ABBREVIATIONS AND COMMON STATISTICAL TESTS
The definitions in this glossary were taken or adapted from the following references as specified:
1. Field A. Discovering statistics using SPSS. 2nd Ed. SAGE Publications Ltd. London. 2005
2. Hennekens CH and Buring JE. Epidemiology in Medicine. Mayrent S Ed. Little Brown and Company, Boston, USA. 1987.
3. Hopkins WG. A New View on Statistics. 2009. http://www.sportsci.org/resource/stats/contents.html
4. International Epidemiological Association. A dictionary of Epidemiology. 3rd Ed. Last, JM Ed. Oxford University Press. 1995.
5. Keyton J. Glossary. Communication Research: Asking Questions, Finding Answers. 2nd Ed. University of Kansas Online Learning Centre. http://highered.mcgraw-hill.com/sites/0073049506/student_view0/glossary.html
6. Nordness, Robert. Epidemiology and Biostatistics Secrets. Elsevier: Philadelphia. 2006.
7. StatSoft Inc.© Glossary, Electronic Statistics Textbook. Tulsa, OK, USA. http://www.statsoft.com/textbook/statistics-glossary/t/button/t/
8. SUPPORT: Supporting Policy Relevant Reviews and Trials. Glossary. http://www.support-collaboration.org/summaries/explanations.htm
Note: If further information is required, consult the references listed above or appropriate references from the bibliography.
Aggregate data Data reported for a group or population as a unit rather than reported for individuals within the group or population (individual data).
Alpha level5 The alpha level represents the probability of making a Type I error, which means rejecting the null hypothesis when it is actually true (and thus should have been accepted). A Type I error means one concludes there is a difference when there is none. Alpha is used in hypothesis testing as the cut-off point for deciding whether a p-value is statistically significant or not. The choice of alpha is somewhat arbitrary but it is most often set at .05 or sometimes at .01.
Bivariate or bivariable analysis6
Assesses the relationship between one outcome and one predictor variable. Cross tabulations and calculation of odds ratio or relative risk from a 2x2 table are the most common types of bivariate analysis.
Categorical data See data.

70 | Appendix A: Glossary, Abbreviations and Common Statistical Tests
Central tendency5 Term applied to any of several measures that summarize a distribution of scores (or set of values). Mean, median, and mode are common measures of central tendency; this one number acts as a summary of all the values of one variable.
Cohort study4,8 An observational study in which a defined group of persons is followed or traced over a period of time. The outcomes are compared between exposed and non-exposed subjects (or between subjects exposed at different levels) to a particular intervention or other factor of interest. A prospective cohort study assembles participants and follows them into the future. A retrospective cohort study identifies subjects from past records and follows them from a pre-specified starting point to the present or to the end of a pre-specified data collection period.
Confidence interval (CI)4
The computed interval with a given probability (e.g. 95% or 99%) that the true value of a variable such as a mean, proportion or rate is contained within the interval. Where confidence intervals are narrow, the estimate of the value of the parameter is said to be more precise. The greater the variation in the sample, the wider the CI will be. The upper and lower boundaries of the CI are called the confidence limits. The width of the CI is related to the difference between the confidence limits.
Confounding4 Distortion of the relationship between an exposure and an outcome by the effects of a different factor. Confounding in epidemiology results in a mixing of the effects of the exposure on the outcome with effects of other factors on the outcome. To be a confounder, the factor has to be associated with both the exposure and the outcome and not be on the causal chain.
Crossover design4 A type of intervention study comparing two or more interventions (or one intervention to none) in which the participants, upon completion of the course of one intervention, are switched to the other intervention. A criticism of this design is that effects of the first treatment may carry over into the period when the second is given.
Data3 Data refers to groups of information that represent the qualitative or quantitative attributes of a variable. Typically, they are a collection of numbers, characters, images or other output from devices that measure or collect information. Variables with numbers as values are called numerical variables or numerical data; those with names or labels as values, but without order or ranking are nominal variables or nominal data. Variables with names or labels as values that have an obvious order or hierarchy are ordinal variables or ordinal data. Nominal and ordinal data that are grouped into categories are also called categorical data. Numerical data with equal intervals is called interval data if there is no meaningful zero point, and ratio data if there is a meaningful zero point.
Dichotomous variable2
In statistics, a dichotomous variable refers to a variable where only two events are possible (e.g., dead or alive).
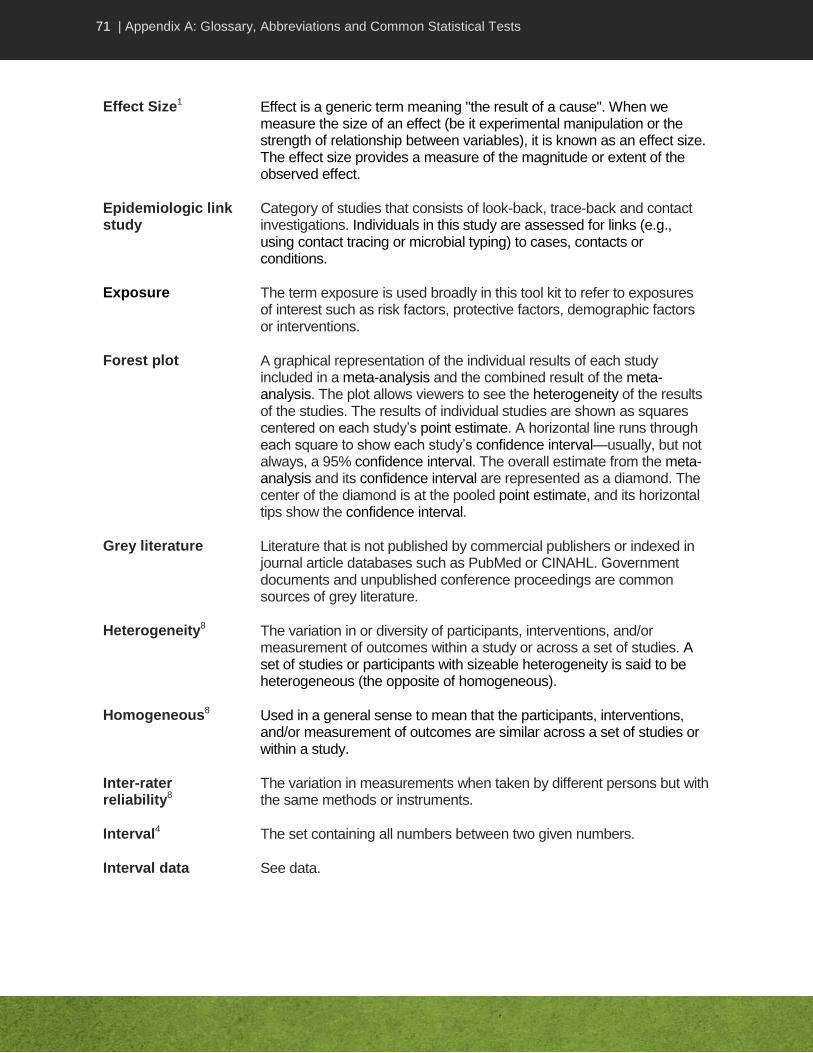
71 | Appendix A: Glossary, Abbreviations and Common Statistical Tests
Effect Size1 Effect is a generic term meaning "the result of a cause". When we measure the size of an effect (be it experimental manipulation or the strength of relationship between variables), it is known as an effect size. The effect size provides a measure of the magnitude or extent of the observed effect.
Epidemiologic link study
Category of studies that consists of look-back, trace-back and contact investigations. Individuals in this study are assessed for links (e.g., using contact tracing or microbial typing) to cases, contacts or conditions.
Exposure The term exposure is used broadly in this tool kit to refer to exposures of interest such as risk factors, protective factors, demographic factors or interventions.
Forest plot A graphical representation of the individual results of each study included in a meta-analysis and the combined result of the meta-analysis. The plot allows viewers to see the heterogeneity of the results of the studies. The results of individual studies are shown as squares centered on each study’s point estimate. A horizontal line runs through each square to show each study’s confidence interval—usually, but not always, a 95% confidence interval. The overall estimate from the meta-analysis and its confidence interval are represented as a diamond. The center of the diamond is at the pooled point estimate, and its horizontal tips show the confidence interval.
Grey literature Literature that is not published by commercial publishers or indexed in journal article databases such as PubMed or CINAHL. Government documents and unpublished conference proceedings are common sources of grey literature.
Heterogeneity8 The variation in or diversity of participants, interventions, and/or measurement of outcomes within a study or across a set of studies. A set of studies or participants with sizeable heterogeneity is said to be heterogeneous (the opposite of homogeneous).
Homogeneous8 Used in a general sense to mean that the participants, interventions, and/or measurement of outcomes are similar across a set of studies or within a study.
Inter-rater reliability8
The variation in measurements when taken by different persons but with the same methods or instruments.
Interval4 The set containing all numbers between two given numbers.
Interval data See data.

72 | Appendix A: Glossary, Abbreviations and Common Statistical Tests
Intervention study2 A study involving the comparison of the outcomes between two or more groups that are deliberately subjected to an intervention (usually of treatment but sometimes of a preventive measure, such as vaccination) to test a hypothesis.
Key question4 A question focusing on a fundamental issue to be addressed by the critical appraisal. In guideline development, a series of structured key questions are needed to clearly identify the content of the guideline based on its defined scope and objectives.
Linear Regression3 A form of regression analysis that models an outcome as a function of one or more factors. The outcome variable is a continuous variable. Simple linear regression models a single predictor variable or risk factor, while multiple linear regression models multiple predictor variables or risk factors.
Logistic regression8
A form of regression analysis that models an individual's odds of disease or some other outcome as a function of one or more risk factors or predictor variables. The outcome variable is dichotomous, i.e., has one of two possible outcomes, such as dead or alive.
Matching6 Selecting cases and controls (or individuals for intervention and control groups) so that they are similar in the characteristics being matched, such as age, sex or occupation. With individual (1 to 1) matching, each case or individual in the intervention group has a control who has the same characteristics. With group matching, the proportion of controls with a given characteristic is the same as the proportion of cases with that characteristic but they were not selected 1 to 1.
Multivariable analysis6
Assesses the relationship between one outcome and several predictor factors or variables. Regression (e.g., multiple or logistic), survival analysis and ANOVA are the most common types of multivariable analysis.
Multivariate analysis
Assesses the relationship between multiple outcomes and multiple predictors. Discriminant function analysis and MANOVA are examples of multivariate analysis.
Nominal data See data.
Null hypothesis3,4 In simplest terms, the null hypothesis states that the results observed in a study, experiment, or test are no different from what might have occurred as a result of the operation of chance alone.
Numerical variable See data.
Observational study2
A type of study in which individuals are observed or certain outcomes are measured. The intervention or risk factor occurred naturally and there is no attempt to affect the outcome.

73 | Appendix A: Glossary, Abbreviations and Common Statistical Tests
Odds ratio (OR)7 The ratio of the odds of an event in one group to the odds of the event in another group. There are different types of odds ratios and different formulae. The most commonly used OR, used especially in case-control studies, is calculated by dividing the odds of exposure in the group with the outcome (cases) by the odds of exposure in the group without the outcome (control). An odds ratio of 1 indicates no difference between comparison groups. An OR that is less than 1 indicates that the association between exposure and outcome is lower in cases compared to controls; while an OR greater than 1 indicates that the association between exposure and outcome is higher in cases compared to controls. The OR is an estimate of the relative risk (RR) but may overestimate the risk. However, when the risk is small, the OR will be very similar to the RR.
Ordinal variable See data.
Outcome The term outcome is used broadly in this tool kit to refer to results of interest such as infections, diseases, behaviours, effects or conditions.
Parameter4 In epidemiology and statistics, this is a measurable characteristic of a population that is often estimated by a statistic e.g., mean, standard deviation, odds ratio, etc.
Participants See study participants.
Pearson’s r4 A measure of association that indicates the degree to which two continuous variables have a linear relationship (correlation). It is the most widely used type of correlation coefficient. The coefficient of correlation can vary from +1 (indicating a perfect positive relationship), through zero (indicating the absence of a relationship), to -1 (indicating a perfect negative relationship). Generally, correlation coefficients between .00 and .30 are considered weak, those between .30 and .70 are moderate and coefficients between .70 and 1.00 are considered high. However, this rule should always be qualified by the circumstances. Note that correlation does not indicate a cause-and-effect relationship.
Population (in sampling)4,8
The whole collection of units/people from which a sample may be drawn. Populations may be defined by any characteristic e.g., geography, age group, certain diseases, institutions, records or events. The sample is intended to give results that are representative of the whole population.
Power4 The probability of demonstrating a statistically significant association if one exists. The power of a study is determined by the magnitude of the effect, the variability in the population/sample and sample size.

74 | Appendix A: Glossary, Abbreviations and Common Statistical Tests
P-value4 The probability that a test statistic would be as extreme as or more extreme than observed if the null hypothesis were true. It is a statement of the probability that the difference observed could have occurred by chance if the groups were really alike (under the null hypothesis).
Quasi-random allocation8
Methods of allocating people to groups in a trial that are not random, but were intended to produce similar groups. Quasi-random methods include: allocation by the person's date of birth, by the day of the week or month of the year, by a person's medical record number, or just allocating every alternate person.
Randomization (random allocation)3.8
The process of randomly allocating participants into one of the groups of a controlled trial. The two components to randomization are the generation of a random sequence, and its implementation. The probability for being entered into one group should be equal to the probability of being entered into the other group. Ideally the implementation is done in such a way that those entering participants into a study are not aware of the sequence (concealment of allocation). The purpose is to equally distribute unknown confounders between groups.
Random sampling4,5,8
Selection of study participants by a random process, so that the probability of being selected is equal for all potential participants. Although this does not directly address confounding, it promotes generalizability of results.
Ratio4 One count relative to another. Rate, proportion and percentage are examples of the most commonly used ratios.
Ratio data See data.
Relative risk8 or Risk ratio
The ratio of risk in two groups. In intervention studies, it is the ratio of the risk in the intervention/exposed group relative to the risk in the control/non-exposed group. A relative risk (RR) or risk ratio of 1 indicates no difference between comparison groups. An RR that is less than 1 indicates that the exposure reduced the risk of that outcome, while an RR of greater than 1 indicates the exposure increased the risk of that outcome.
Reliability4 The degree to which the results obtained by a measurement or procedure can be replicated, showing the level of consistency or repeatability. Lack of reliability may arise from the instruments of measurement, variation between or within observers, or instability of the attribute being measured.
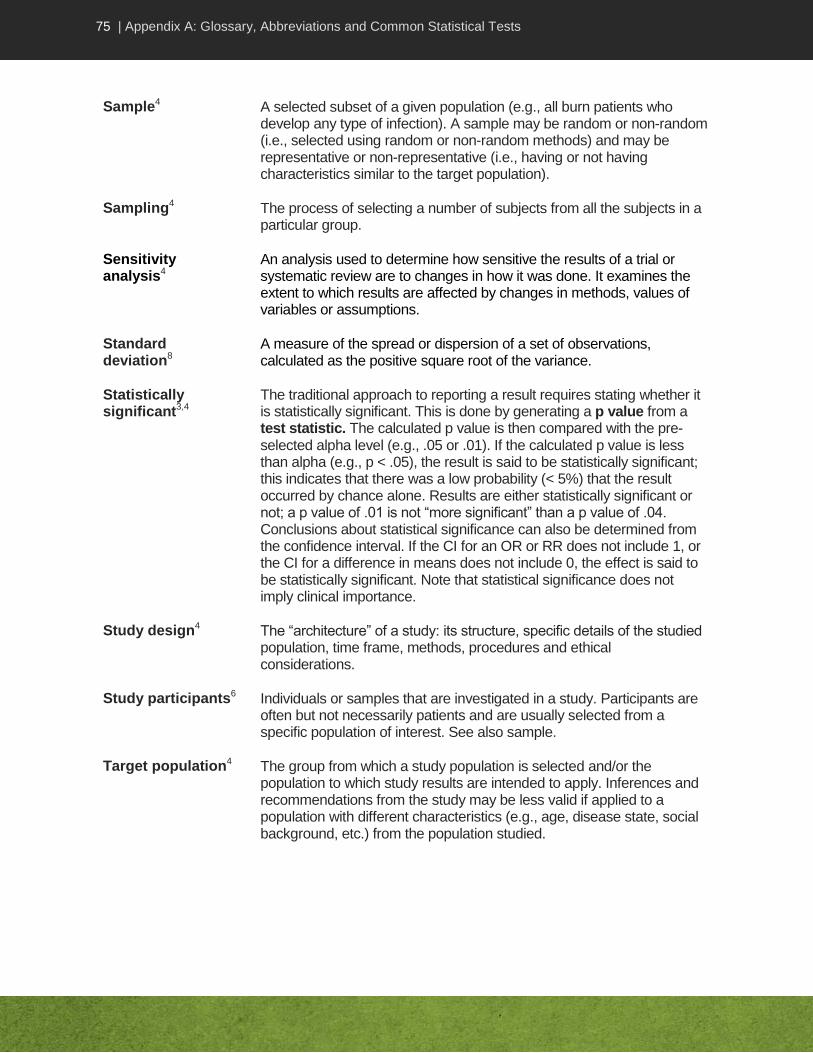
75 | Appendix A: Glossary, Abbreviations and Common Statistical Tests
Sample4 A selected subset of a given population (e.g., all burn patients who develop any type of infection). A sample may be random or non-random (i.e., selected using random or non-random methods) and may be representative or non-representative (i.e., having or not having characteristics similar to the target population).
Sampling4 The process of selecting a number of subjects from all the subjects in a particular group.
Sensitivity analysis4
An analysis used to determine how sensitive the results of a trial or systematic review are to changes in how it was done. It examines the extent to which results are affected by changes in methods, values of variables or assumptions.
Standard deviation8
A measure of the spread or dispersion of a set of observations, calculated as the positive square root of the variance.
Statistically significant3,4
The traditional approach to reporting a result requires stating whether it is statistically significant. This is done by generating a p value from a test statistic. The calculated p value is then compared with the pre-selected alpha level (e.g., .05 or .01). If the calculated p value is less than alpha (e.g., p < .05), the result is said to be statistically significant; this indicates that there was a low probability (< 5%) that the result occurred by chance alone. Results are either statistically significant or not; a p value of .01 is not “more significant” than a p value of .04. Conclusions about statistical significance can also be determined from the confidence interval. If the CI for an OR or RR does not include 1, or the CI for a difference in means does not include 0, the effect is said to be statistically significant. Note that statistical significance does not imply clinical importance.
Study design4 The “architecture” of a study: its structure, specific details of the studied population, time frame, methods, procedures and ethical considerations.
Study participants6 Individuals or samples that are investigated in a study. Participants are often but not necessarily patients and are usually selected from a specific population of interest. See also sample.
Target population4 The group from which a study population is selected and/or the population to which study results are intended to apply. Inferences and recommendations from the study may be less valid if applied to a population with different characteristics (e.g., age, disease state, social background, etc.) from the population studied.

76 | Appendix A: Glossary, Abbreviations and Common Statistical Tests
T-test7 The t-test is the most commonly used method to evaluate the differences in means between two groups. The unpaired t-test is used if measurements are independent (e.g., blood pressure of patients who were given a drug vs. a control group who received a placebo) whereas a paired t-test is used if measurements are dependent (e.g., blood pressure of patients "before" vs. "after" they received a drug). Theoretically, the t-test can be used even if the sample sizes are very small (e.g., as small as 10), as long as the variables are approximately normally distributed and the variation of scores in the two groups are not reliably different.
Univariate or univariable analysis6
Describes the occurrence of a single factor or variable, for example, describing age or sex or smoking patterns. The variable may have a number of categories (e.g., never smoked, recently quit, currently smokes < 1 pack per day, or currently smokes > 1pack per day) or be a continuous variable (e.g., age).
Validity4,8 The validity of an instrument is an expression of the degree to which the instrument/procedure measures what it was designed to measure. The internal validity of a study is the degree to which the results of the study are likely to be true and free of bias (systematic errors). The external validity of a study is the extent to which the results of the study can be generalized to other populations or settings.
List of Abbreviations
CAT Critical appraisal tool
CBA Controlled before-after
CI Confidence interval
ITS Interrupted time series
NRCT Non-randomized controlled trial
OR Odds ratio
RCT Randomized controlled trial
RR Relative risk
UCBA Uncontrolled before-after

77 | Appendix A: Glossary, Abbreviations and Common Statistical Tests
TABLE 5 – SUMMARY OF COMMON STATISTICAL TESTS
In order to assess whether an appropriate statistical test was used, one must first identify the type of data involved and the number of exposure (predictor) variables of interest. The most commonly used tests are summarized here.
Test Number
of Variables
Type of Data Description of Statistics
Descriptive Statistics
Mean and standard deviation (SD)
1 Interval or ratio Used to analyse central tendencies and dispersion. The standard deviation describes the spread or dispersion of values around the mean, with 95% of values within ±2.6 SD and 99.7% within ±3 SD.
Relative risk (RR) 2 Dichotomous Used to measure the risk of outcome in exposed group relative to non-exposed group. It can only be used in cohort or intervention studies.
Odds ratio (OR) 2 Dichotomous Used to measure the odds of exposure in cases relative to controls. Also used to estimate RR. It can be used in any kind of study.
Medians,
interquartile range (IQR)
1 Ordinal, Interval or ratio
Used to analyse central tendencies. The median is used if interval or ratio data are skewed. The median is the value that divides the group into two equal groups: 50% of the values fall below the median. The IQR represents the middle 50% of the values.
Correlational Statistics
Cohen’s kappa or weighted kappa
>1 Nominal or ordinal
Used to assess inter-rater reliability. A weighted kappa is used if there are multiple users and multiple outcomes.
Pearson’s r >1 Interval/ratio Used as a measure of the correlation between two continuous variables.
Inferential Statistics
Chi-squared (X2) or
Fisher’s Exact Test (FET)
>1 Categorical Used to measure the discrepancy between observed and expected frequency distribution. Chi-squared is an estimate of FET. Both test the differences between frequencies, proportions, odds ratio or relative risk. McNemar chi-squared is used for matched data.
Logistic regression, if no time factor
Cox proportional hazards, if time
factor
>1 Outcome: Dichotomous
Predictors: categorical or continuous
Logistic regression is used for predicting the probability of occurrence of an event by fitting data to a logistic curve. It estimates the odds ratio for each predictor of interest, while controlling for the effects of other predictor variables in the model. Conditional logistic regression is used for matched data.
Cox model gives a hazard ratio which is an estimate of RR at a specific unit in time. The Cox model can also be used to compare times to event.

78 | Appendix A: Glossary, Abbreviations and Common Statistical Tests
Test Number
of Variables
Type of Data Description of Statistics
Descriptive Statistics
T-test or paired t-test
ANOVA (Analysis of Variance)
2 (t-test)
≥2 (ANOVA)
Outcome: continuous
Predictors: categorical
Used to measure differences in means between two groups. The t-test is used if measurements are independent while the paired t-test is used if measurements are dependent. ANOVA is used to compare more than 2 means.
Multiple linear regression (MLR)
ANCOVA (Analysis of Covariance)
>1 Outcome: continuous
Predictors: categorical or continuous
Used to predict an outcome as a function of two or more factors.
ANCOVA is a variation of MLR whereby categorical variables are treated so as to allow assessment of individual categories.
Note:
Predictors can be any exposure of interest. See glossary for definitions. Refer to a statistics or epidemiology reference (provided in glossary and bibliography) if needed.

79 | Appendix B: Sample Evidence Summary Table with Recommendations
APPENDIX B: SAMPLE EVIDENCE SUMMARY TABLE WITH RECOMMENDATIONS
TABLE 6 – SAMPLE EVIDENCE SUMMARY TABLE WITH RECOMMENDATIONS
Key Question: Is alcohol-based hand rub (ABHR) effective for hand hygiene in healthcare settings?
Author (Year)
Reference Number
Relevant Methods and Outcome Measures
Results
Conclusions
Reviewer Comments
Rating of Study
Picheansathian (2004)
#13369
Well-conducted (high quality) systematic review
Identified multiple other studies not included here, with consistent results re reduction of microbial load with ABHR (different concentrations) in comparison to other solutions and on increasing compliance with hand hygiene.
Multiple studies of strong design and high quality
Larson (2001)
#8144
1 group: 2% CHG wash
2nd
group: ABHR (61% ethanol)
Measured skin condition and skin microbiology.
2 ICUs
50 volunteers (different types of HCWs)
10 working days, recorded HH and pt contact, validated diaries and HH techniques
Cultures at baseline, day 1, end of weeks 2 and 4
No significant differences in log reduction between two groups but bacterial counts did decrease significantly from baseline in both groups
ABHR took significantly less time than CHG
Skin improvements in skin condition in ABHR group
50% reduction in material costs for ABHR group
RCT
Strong design High quality
Conclusion is that ABHR is not better than HW with antiseptic soap for CFU count but has other advantages
They did not compare ABHR to HW with plain soap
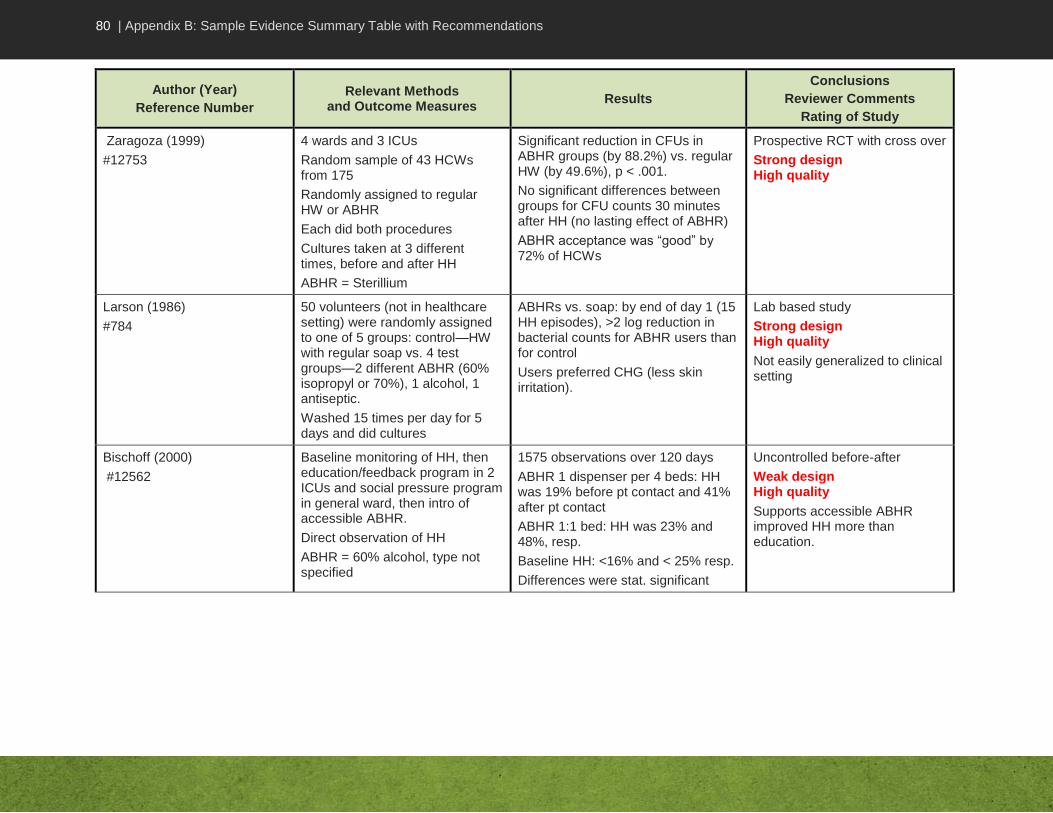
80 | Appendix B: Sample Evidence Summary Table with Recommendations
Author (Year)
Reference Number
Relevant Methods and Outcome Measures
Results
Conclusions
Reviewer Comments
Rating of Study
Zaragoza (1999)
#12753
4 wards and 3 ICUs
Random sample of 43 HCWs from 175
Randomly assigned to regular HW or ABHR
Each did both procedures
Cultures taken at 3 different times, before and after HH
ABHR = Sterillium
Significant reduction in CFUs in ABHR groups (by 88.2%) vs. regular HW (by 49.6%), p < .001.
No significant differences between groups for CFU counts 30 minutes after HH (no lasting effect of ABHR)
ABHR acceptance was “good” by 72% of HCWs
Prospective RCT with cross over
Strong design High quality
Larson (1986)
#784
50 volunteers (not in healthcare setting) were randomly assigned to one of 5 groups: control—HW with regular soap vs. 4 test groups—2 different ABHR (60% isopropyl or 70%), 1 alcohol, 1 antiseptic.
Washed 15 times per day for 5 days and did cultures
ABHRs vs. soap: by end of day 1 (15 HH episodes), >2 log reduction in bacterial counts for ABHR users than for control
Users preferred CHG (less skin irritation).
Lab based study
Strong design High quality
Not easily generalized to clinical setting
Bischoff (2000)
#12562
Baseline monitoring of HH, then education/feedback program in 2 ICUs and social pressure program in general ward, then intro of accessible ABHR.
Direct observation of HH
ABHR = 60% alcohol, type not specified
1575 observations over 120 days
ABHR 1 dispenser per 4 beds: HH was 19% before pt contact and 41% after pt contact
ABHR 1:1 bed: HH was 23% and 48%, resp.
Baseline HH: <16% and < 25% resp.
Differences were stat. significant
Uncontrolled before-after
Weak design High quality
Supports accessible ABHR improved HH more than education.
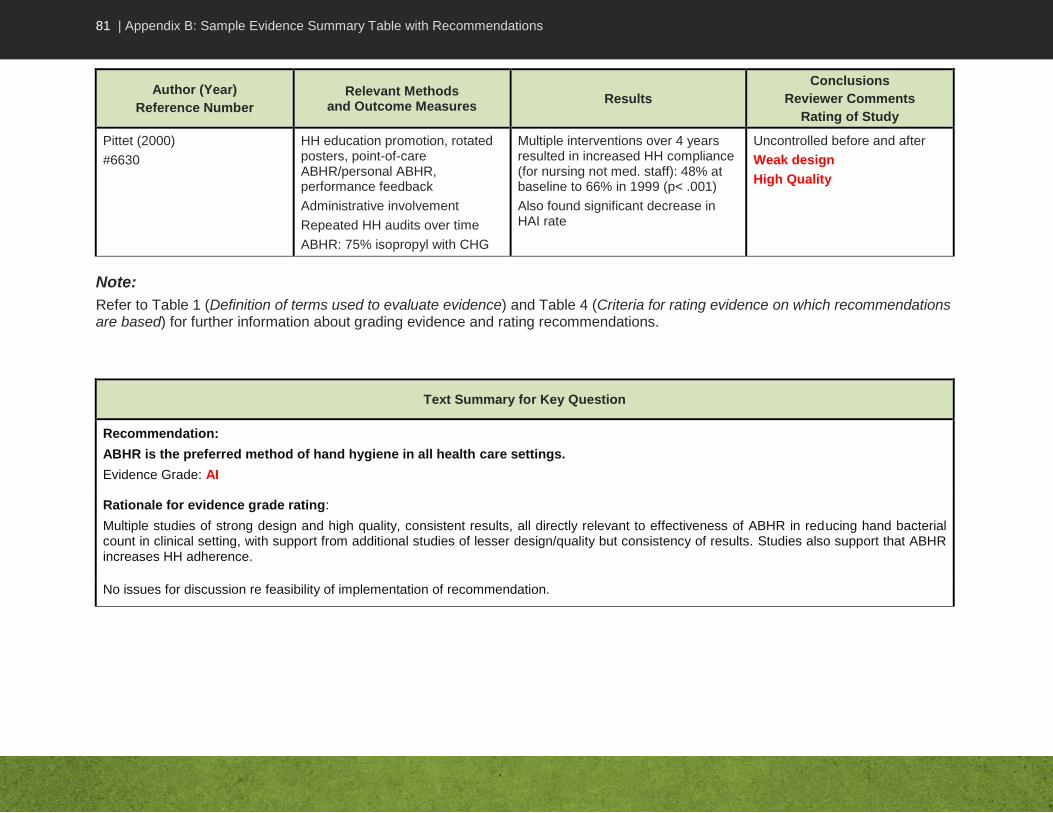
81 | Appendix B: Sample Evidence Summary Table with Recommendations
Author (Year)
Reference Number
Relevant Methods and Outcome Measures
Results
Conclusions
Reviewer Comments
Rating of Study
Pittet (2000)
#6630
HH education promotion, rotated posters, point-of-care ABHR/personal ABHR, performance feedback
Administrative involvement
Repeated HH audits over time
ABHR: 75% isopropyl with CHG
Multiple interventions over 4 years resulted in increased HH compliance (for nursing not med. staff): 48% at baseline to 66% in 1999 (p< .001)
Also found significant decrease in HAI rate
Uncontrolled before and after
Weak design
High Quality
Note:
Refer to Table 1 (Definition of terms used to evaluate evidence) and Table 4 (Criteria for rating evidence on which recommendations are based) for further information about grading evidence and rating recommendations.
Text Summary for Key Question
Recommendation:
ABHR is the preferred method of hand hygiene in all health care settings.
Evidence Grade: AI
Rationale for evidence grade rating:
Multiple studies of strong design and high quality, consistent results, all directly relevant to effectiveness of ABHR in reducing hand bacterial count in clinical setting, with support from additional studies of lesser design/quality but consistency of results. Studies also support that ABHR increases HH adherence.
No issues for discussion re feasibility of implementation of recommendation.

82 | Appendix C: Infection Prevention and Control Expert Working Group Members
APPENDIX C: INFECTION PREVENTION AND CONTROL EXPERT WORKING GROUP MEMBERS
Members of the Infection Prevention and Control Expert Working Group during the development of this document (formerly called the Steering Committee on Infection Prevention and Control Guidelines): Dr. Donna Moralejo, Professor, Memorial University School of Nursing, St. John’s,
Newfoundland and Labrador (Project Lead)
Dr. Lynn Johnston, Professor of Medicine, QEII Health Science Centre, Halifax, Nova Scotia (Chair)
Sandra Boivin BSc, Agente de planification, programmation et de recherche, Direction de la Santé Publique des Laurentides, St-Jérôme, Québec
Nan Cleator RN, National Practice Consultant, VON Canada, Huntsville, Ontario
Brenda Dyck BSN CIC, Program Director, Infection Prevention and Control Program, Winnipeg Regional Health Authority, Winnipeg, Manitoba
Dr. John Embil, Director, Infection Control Unit, Health Sciences Centre, Winnipeg, Manitoba
Karin Fluet RN BScN CIC, Executive Director, IPC Edmonton Zone and standards and projects, Alberta Health Services, Edmonton, Alberta
Dr. Bonnie Henry, Physician Epidemiologist & Assistant Professor, School of Population & Public Health, University of British Columbia, BC Centre for Disease Control, Vancouver, British Columbia
Dany Larivée BSc, Infection Control Coordinator, Montfort Hospital, Ottawa, Ontario
Mary LeBlanc RN BN CIC, Tyne Valley, Prince Edward Island
Dr. Anne Matlow, Director of Infection Control, Hospital for Sick Children, Toronto, Ontario
Dr. Dorothy Moore, Division of Infectious Diseases, Montreal Children's Hospital, Montreal, Quebec
Filomena Pietrangelo BScN, Manager-Prevention Sector, Occupational Health and Safety, McGill University Health Centre, Montreal, Quebec
JoAnne Seglie RN COHN-S, Occupational Health Manager, University of Alberta Campus, Office of Environment Health/Safety, Edmonton, Alberta
Dr. Pierre St-Antoine, Health Science Centre, Centre Hospitalier de l’Université de Montréal, Hôpital Notre-Dame, Microbiologie, Montréal, Québec
Dr. Geoff Taylor, University of Alberta Hospital, Department of Medicine, Division of Infectious Diseases, Edmonton, Alberta
Dr. Mary Vearncombe, Medical Director, Infection Prevention & Control, Sunnybrook Health Sciences Centre, Toronto, Ontario

83 | Appendix C: Infection Prevention and Control Expert Working Group Members
The following individuals represented the Public Health Agency of Canada:
Toju Ogunremi BSc MSc, Senior Research Analyst (PHAC Project Lead)
Frédéric Bergeron RN BScN, Nurse Consultant
Katherine Defalco RN BScN CIC, Nurse Consultant
Kathleen Dunn RN BScN MN, Manager
Jennifer Kruse RN BScN, Nurse Consultant
Laurie O’Neil RN BN, Nurse Consultant
Shirley Paton MN RN, Senior Technical Advisor
Christine Weir RN BNSc MS CIC, Nurse Epidemiologist
Dr. Tom Wong MPH FRCPC, Director

84 | Bibliography
Bibliography
1. AGREE Collaboration. Development and validation of an international appraisal instrument for assessing the quality of clinical practice guidelines: the Agree project. Quality and Safety in Health Care 2003;12:18-23.
2. Akobeng AK. Evidence based child health 3. Understanding systematic reviews and meta-analysis. Archives of Disease in Childhood 2005;90:845-8.
3. Atkins D, Briss PA, et al. Systems for grading the quality of evidence and the strength of recommendations II: Pilot study of a new system. BioMed Central Health Services Research 2005, 5:25.
4. Bhandari M, Swiontkowski MF, Einhorn TA, Tornetta P, Schemitsch E, Leece P, Wright JG. Interobserver agreement in the application of levels of evidence to scientific papers in the American volume of the journal of bone and joint surgery. J Bone Joint Surg (Am) 2004; 86: 1717-1720.
5. Campbell F, Dickinson HO, Cook JV, Beyer FR, Eccles M, Mason JM. Methods underpinning national clinical guidelines for hypertension: describing the evidence shortfall. BMC Health Serv.Res. 2006;6:47.
6. CIHR, NSERC and SSHRC. Tri- Council Policy Statement: Ethical Conduct for Research involving Humans. Section 1A, Research Requiring Ethics Review; Article 1.1. 1998 (with 2000, 2002 and 2005 amendments). http://www.pre.ethics.gc.ca/policy-politique/tcps-eptc/docs/TCPS%20October%202005_E.pdf
7. The Cochrane Collaboration. Cochrane handbook for systematic reviews of interventions. http://www.cochrane.org/training/cochrane-handbook
8. Ebell MH, Siwek J, Weiss BD, Woolf SH, Susman JL, Ewigman B, et al. Simplifying the language of evidence to improve patient care: Strength of recommendation taxonomy (SORT): a patient-centered approach to grading evidence in medical literature. J.Fam.Pract. 2004 Feb;53(2):111-120.
9. Flather MD, Farkouh ME, et al. Strength and limitations of meta-analysis: larger studies may be more reliable. Controlled Clinical trials 1997;18:568-79.
10. Guyatt G, Gutterman D, Baumann MH, Addrizzo-Harris D, Hylek EM, Phillips B, et al. Grading strength of recommendations and quality of evidence in clinical guidelines: Report from an American college of chest physicians task force.[see comment]. Chest 2006 Jan;129(1):174-181.
11. Harbour R, Miller J, SIGN. A new system for grading recommendations in evidence based guidelines. British Medical Journal 2001;323:334-6.
12. Higgins JPT, Thompson SG, Deeks JJ, Altman DG. Measuring inconsistency in meta analyses. BMJ. 2003;327:557-60.
13. Jackson D, Walters E. Criteria for the systematic review of health promotion and public health interventions. Health Promot Int. 2005;20:367-374.
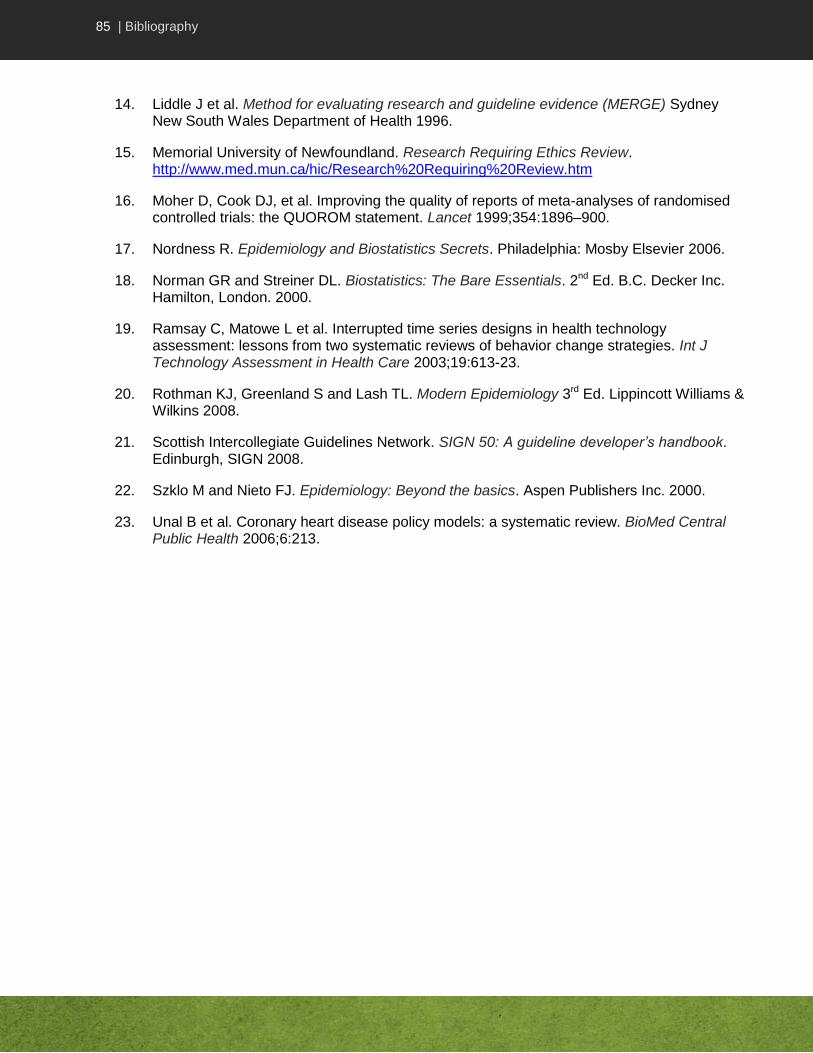
85 | Bibliography
14. Liddle J et al. Method for evaluating research and guideline evidence (MERGE) Sydney New South Wales Department of Health 1996.
15. Memorial University of Newfoundland. Research Requiring Ethics Review. http://www.med.mun.ca/hic/Research%20Requiring%20Review.htm
16. Moher D, Cook DJ, et al. Improving the quality of reports of meta-analyses of randomised controlled trials: the QUOROM statement. Lancet 1999;354:1896–900.
17. Nordness R. Epidemiology and Biostatistics Secrets. Philadelphia: Mosby Elsevier 2006.
18. Norman GR and Streiner DL. Biostatistics: The Bare Essentials. 2nd Ed. B.C. Decker Inc. Hamilton, London. 2000.
19. Ramsay C, Matowe L et al. Interrupted time series designs in health technology assessment: lessons from two systematic reviews of behavior change strategies. Int J Technology Assessment in Health Care 2003;19:613-23.
20. Rothman KJ, Greenland S and Lash TL. Modern Epidemiology 3rd Ed. Lippincott Williams & Wilkins 2008.
21. Scottish Intercollegiate Guidelines Network. SIGN 50: A guideline developer’s handbook. Edinburgh, SIGN 2008.
22. Szklo M and Nieto FJ. Epidemiology: Beyond the basics. Aspen Publishers Inc. 2000.
23. Unal B et al. Coronary heart disease policy models: a systematic review. BioMed Central Public Health 2006;6:213.


![Reward & Appraisals[1]](https://img.pdfslide.net/doc/110x75/577d214d1a28ab4e1e94eb28/reward-appraisals1.jpg)