Embed Size (px)
Citation preview
East Tennessee State UniversityDigital Commons @ East Tennessee State University
Undergraduate Honors Theses Student Works
5-2013
Infectious Disease: An agent-based simulation.Iqra AhmadEast Tennessee State University
Follow this and additional works at: https://dc.etsu.edu/honors
Part of the Biology Commons
This Honors Thesis - Open Access is brought to you for free and open access by the Student Works at Digital Commons @ East Tennessee StateUniversity. It has been accepted for inclusion in Undergraduate Honors Theses by an authorized administrator of Digital Commons @ East TennesseeState University. For more information, please contact [email protected].
Recommended CitationAhmad, Iqra, "Infectious Disease: An agent-based simulation." (2013). Undergraduate Honors Theses. Paper 91. https://dc.etsu.edu/honors/91

Infectious Disease: An agent-‐based simulation Honors Thesis
Iqra Ahmad
The Honors College
Honors-‐in-‐Discipline: Biology
April 25, 2013
____________________________ Dr. Istvan Karsai (Faculty Mentor) ____________________________ Dr. Lev Yampolsky (Faculty Reader) ____________________________ Dr. Aruna Kilaru (Faculty Reader)

Table of Contents:
Abstract Page 2
Introduction Page 3
Materials and Methods Page 5
Results Page 10
Discussion and Future Page 24
Acknowledgments Page 27
References Page 28

Abstract:
One of the primary reasons for studying infectious diseases is to improve control
and ultimately eradicate the infection from the population (Keeling 2008). An agent base
model was designed to observe the spread of disease and the effect of vaccination using
the program known as StarLogo- TNG. Experiments were designed, not having a
particular disease in mind, and simulations were run to determine the effects of different
variables on the vaccination process of a certain population. Goals included observation
of how infections spread and how vaccination plays a role in various situations such as,
root of the infection, population size, number of providers for vaccination, and the
longevity of vaccination.

Introduction:
The Oxford Dictionary (Oxford, 2003) defines disease as “a condition of the
body, or of some part or organ of the body, in which its functions are disturbed or
deranged; a morbid physical condition; a departure from the state of health, especially
when caused by structural change.” Disease can be either infectious or noninfectious.
Infectious disease has the potential to be passed between individuals, whereas
noninfectious diseases are those that develop over an individual’s lifespan. The primary risk factor for catching an infectious disease is the presence of
infection in the local population. The infecting pathogen can be either a microparasite or
a macroparasite (Boots, 2004). The progress of an infectious microparasitic disease is
defined qualitatively in terms of the level of pathogen within the host, which in turn is
determined by the growth rate of the pathogen and the interaction between the pathogen
and the host’s immune response.
When trying to understand the spread of an infectious disease through a
population, many different factors are important (Eames, 2007). One of the primary
reasons for studying infectious disease is to improve control and ultimately to eradicate
the infection from the population. Models can be highly effective tools in this approach,
allowing us to optimize the use of limited resources or simply target measures more
efficiently. Models have been proven to have great predictive power at the population
scale and over relatively short periods of time. They have two distinct roles— prediction
and understanding, which are related to the model properties of accuracy and
transparency.

The practice of vaccination began with Edward Jenner in 1796 who developed a
vaccine against smallpox, which remains the only disease to date that that has been
eradicated worldwide (Anderson, 1992). Vaccination acts by stimulating a host immune
response, such that immunized individuals are protected against infection. It is generally
applied prophylactically to a large proportion of the population, so as to greatly reduce
the number of susceptible individuals (Rand, 1997).
In the current study, a model was designed using the program known as StarLogo-
TNG. One of the goals for developing this program was to observe how infection spreads.
Another goal was to notice how vaccination plays a role in different situations and
different types of populations. Many factors were taken into consideration and observed
during this experiment. Some of these included the root of the infection, the population,
the number of providers that were able to cure and vaccinate, and the amount of time an
individual was vaccinated. It was predicted that if the infectors were in a specific closed
area, rather than spread randomly, it would take a longer time to eradiate the infection.
Thus, in turn, it was predicted that as the population grows, it would also take a longer
time period to cure the infection and vaccinate the population. It was hypothesized that
the higher the number of doctors and the longer the vaccinations lasts, the faster
individuals are cured and vaccinated.

Materials and Methods:
Program Used
StarLogo TNG: A modeling system created by Michigan Institute of Technology
was used. This was downloaded from http://education.mit.edu/projects/starlogo-tng.
StarLogo is an agent-based simulation language developed by Mitchel Resnick, Eric
Klopfer, and others at MIT Media Lab and MIT Teacher Education Program in
Massachusetts. It is an extension of the Logo programming language, a dialect of Lisp.
Designed for education, StarLogo can be used by students to model the behavior of
decentralized systems. The programming is done with graphical programming blocks
instead of text-base commands. This innovation adds a powerful visual component to the
otherwise abstract process of programming. The programming blocks are arranged by
color based on their function, which enables students to associate semantically similar
programming blocks with each other. Procedures are made from blocks that are snapped
together, forming a visual chunk, which helps students chunk the goals of the procedures
in their mental models of the program (Klopfer, 2007). This is shown in the figure below.
Figure 1. Blocks arranged by color in the StarLogo TNG program http://education.mit.edu/projects/starlogo-tng.
StarLogo TNG spatially organizes block programs into breed drawers, which
affords an object-oriented style of programming. It is a 3D representation of the agent
world which provides the ability to model new kinds of physical phenomena, and allows

students to take the perspective of an individual agent in the environment, which helps
them bridge the description of individual behaviors with system level outcomes.
The program was downloaded onto a laptop (MacBook 2.4GHz Intel Core 2 Duo
P8600). Next, using StarLogo TNG and the blocks technique, a model was built.
Model:
A model was designed in which the population consisted of 200 uninfected
individuals, 5 infectors, and 5 doctors. Every individual is programmed to have random
movement. The doctors are set in a specific area of the plane and they are restricted from
leaving that area (Figure 2). When a yellow uninfected individual collided with an
infector, the yellow individual got infected, represented by a color change from yellow to
red. This is how the spread of the disease begins. A collision process was set up using the
block system that helps with the spreading of the infection. If a red infected individual
collided with a yellow uninfected individual, the yellow individual, having become
infected, will turn red. Once an individual is infected, they are programmed to go towards
the doctors to be cured and then vaccinated, simultaneously infecting other individuals on
their way. This set up was used as the control. This simulation was run for a time of 200
years, for 15 times to average out the affect of random fluctuations. 200 years of
simulation time is chosen in order to have the simulation run for an amount of time where
change can be observed. The control set up is shown in Figure 2.
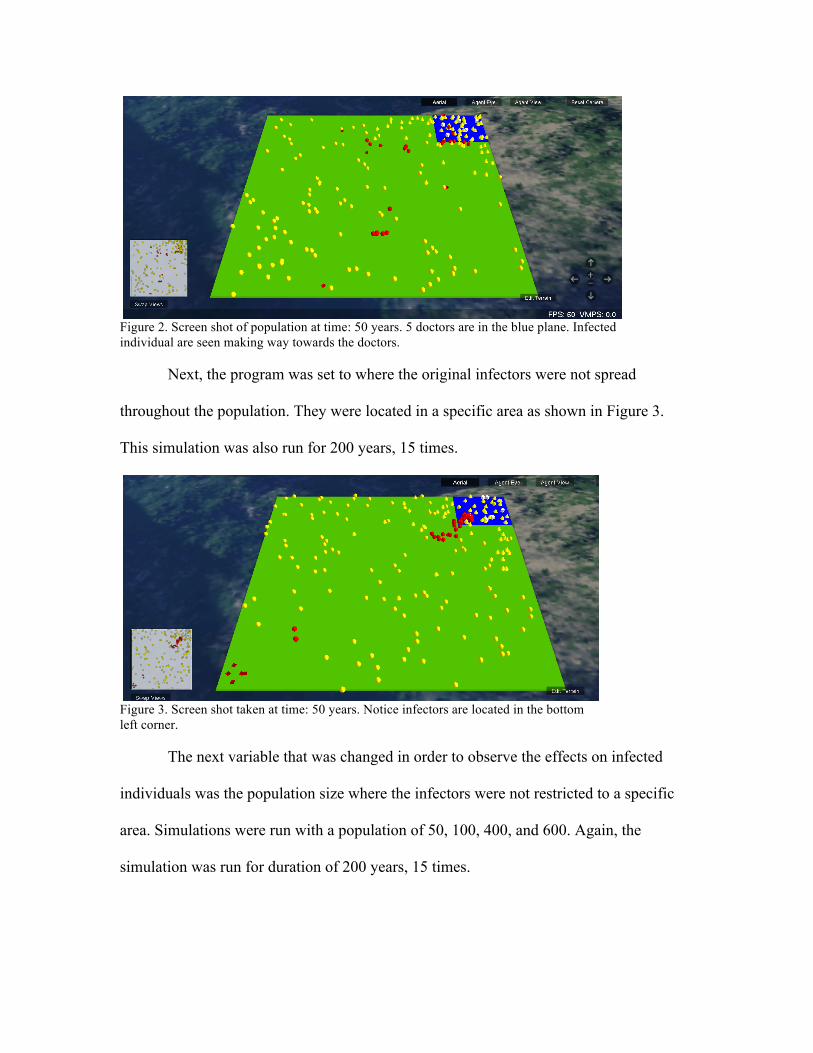
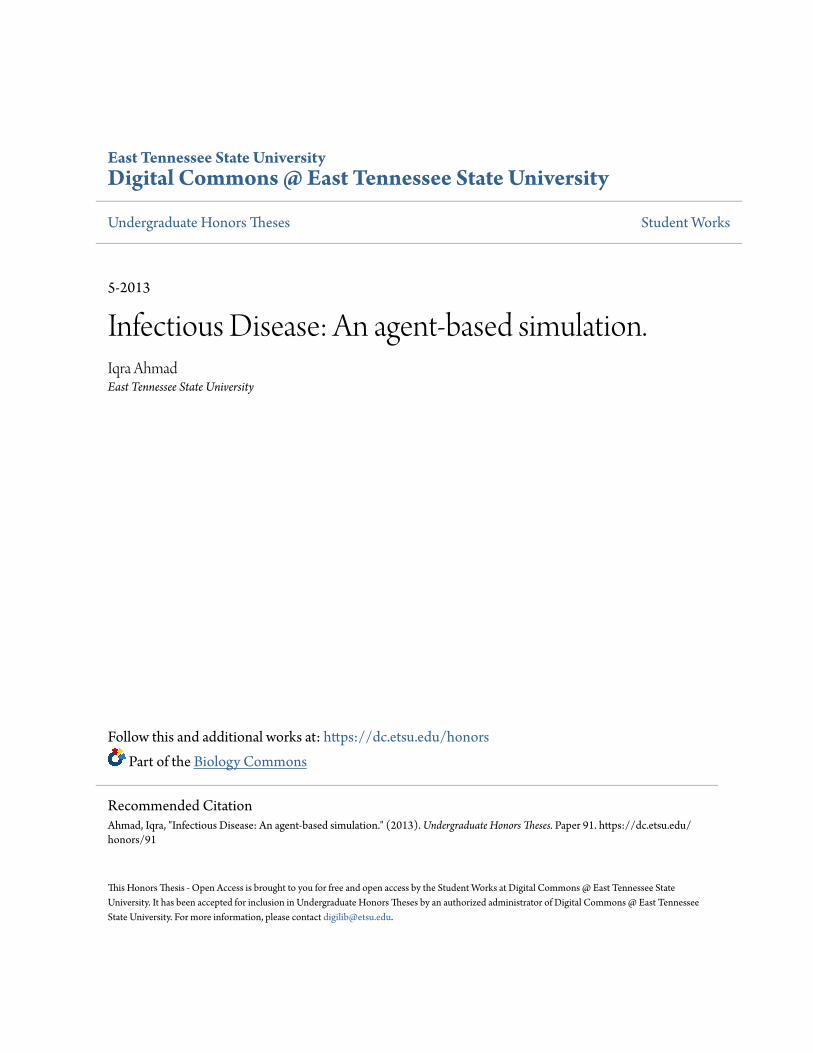
Figure 2. Screen shot of population at time: 50 years. 5 doctors are in the blue plane. Infected individual are seen making way towards the doctors. Next, the program was set to where the original infectors were not spread
throughout the population. They were located in a specific area as shown in Figure 3.
This simulation was also run for 200 years, 15 times.
Figure 3. Screen shot taken at time: 50 years. Notice infectors are located in the bottom left corner. The next variable that was changed in order to observe the effects on infected
individuals was the population size where the infectors were not restricted to a specific
area. Simulations were run with a population of 50, 100, 400, and 600. Again, the
simulation was run for duration of 200 years, 15 times.
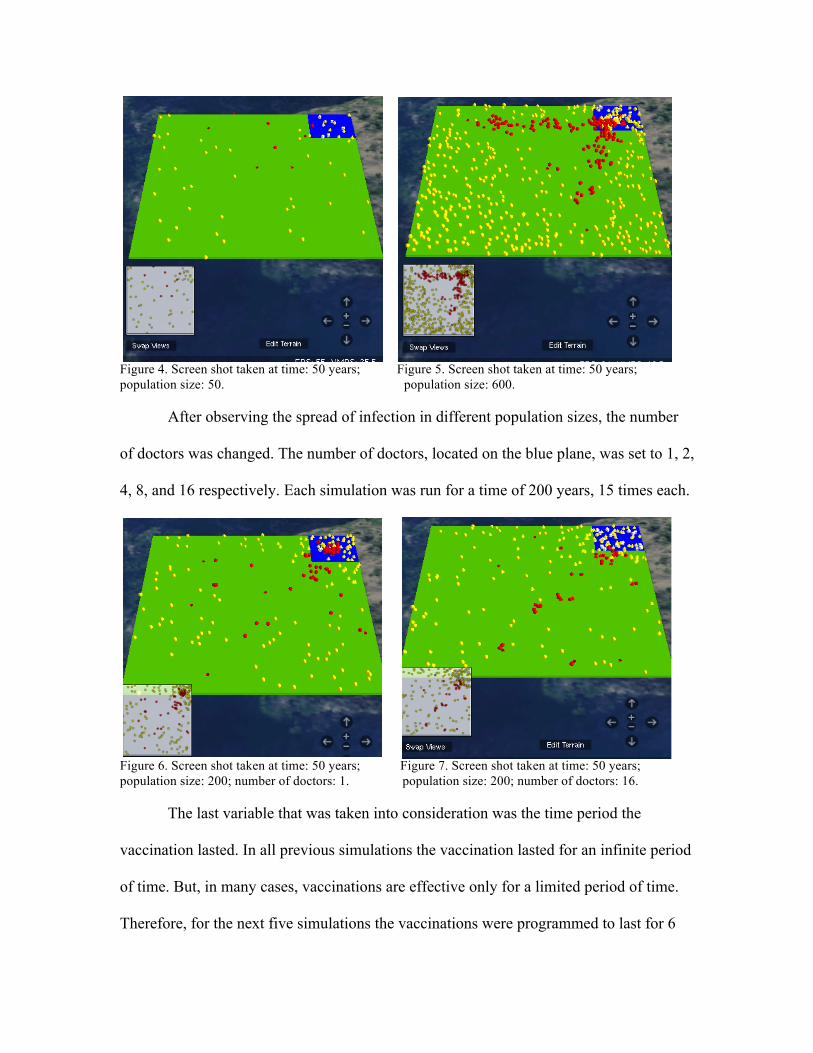
Figure 4. Screen shot taken at time: 50 years; Figure 5. Screen shot taken at time: 50 years; population size: 50. population size: 600. After observing the spread of infection in different population sizes, the number
of doctors was changed. The number of doctors, located on the blue plane, was set to 1, 2,
4, 8, and 16 respectively. Each simulation was run for a time of 200 years, 15 times each.
Figure 6. Screen shot taken at time: 50 years; Figure 7. Screen shot taken at time: 50 years; population size: 200; number of doctors: 1. population size: 200; number of doctors: 16. The last variable that was taken into consideration was the time period the
vaccination lasted. In all previous simulations the vaccination lasted for an infinite period
of time. But, in many cases, vaccinations are effective only for a limited period of time.
Therefore, for the next five simulations the vaccinations were programmed to last for 6
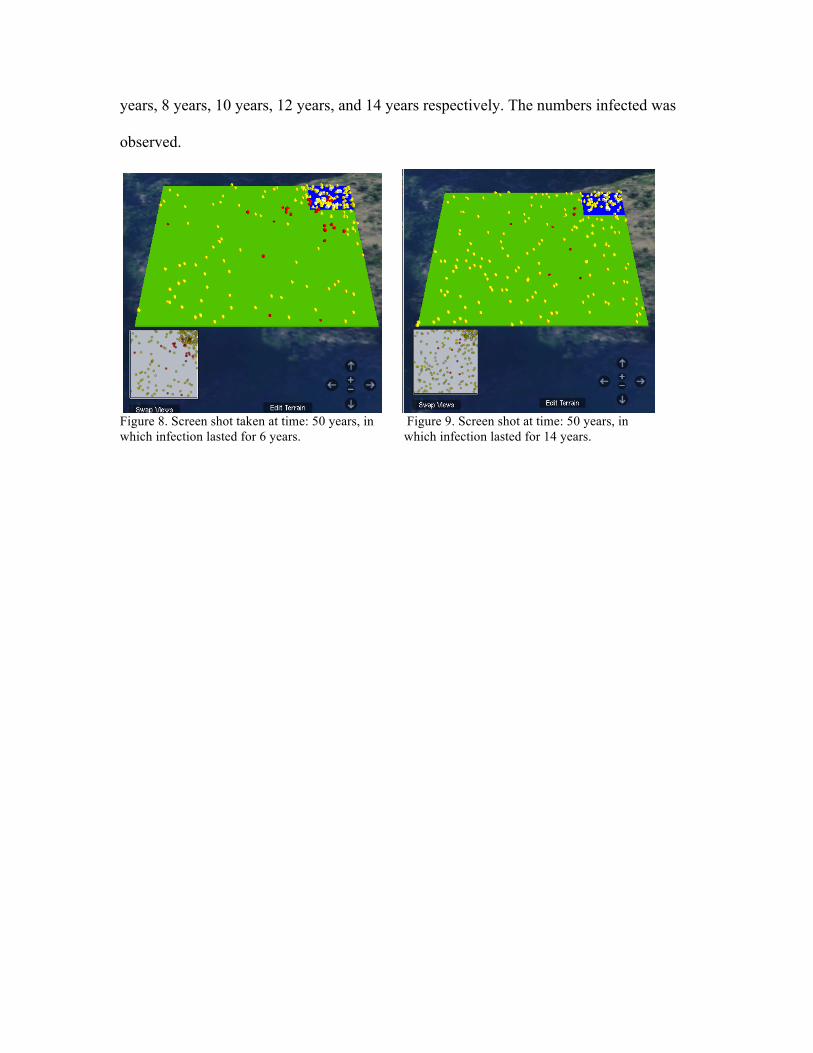
years, 8 years, 10 years, 12 years, and 14 years respectively. The numbers infected was
observed.
Figure 8. Screen shot taken at time: 50 years, in Figure 9. Screen shot at time: 50 years, in which infection lasted for 6 years. which infection lasted for 14 years.
Results:
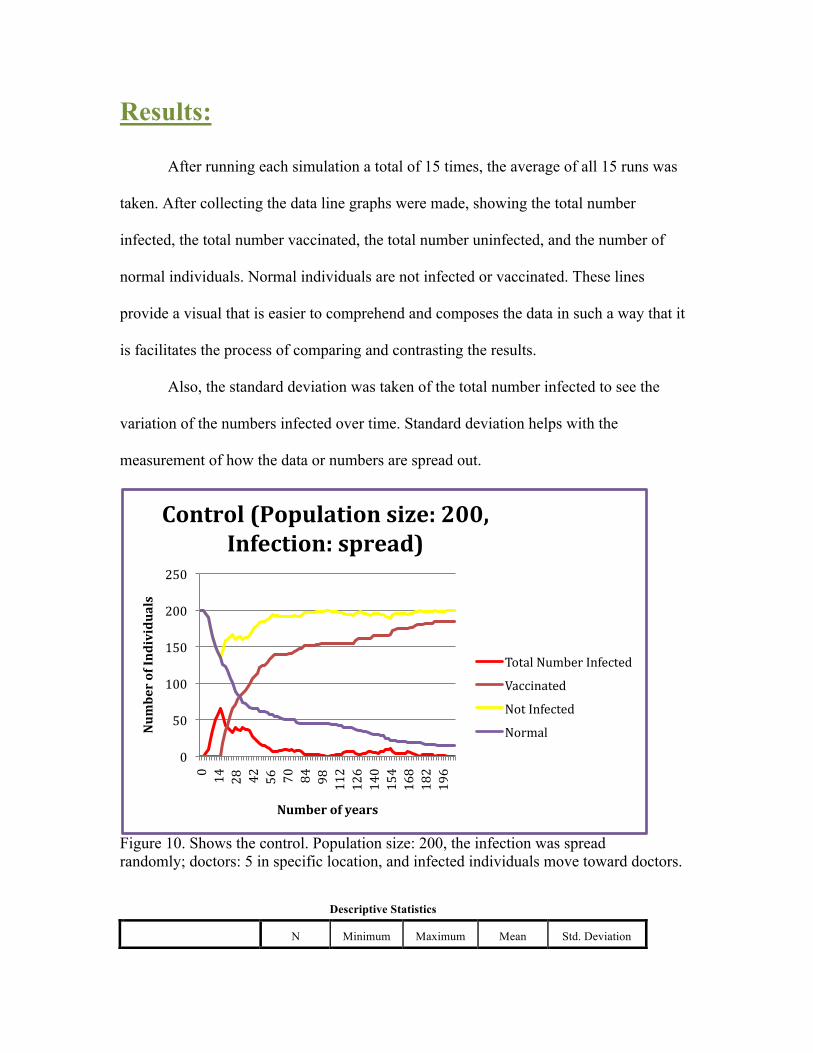
After running each simulation a total of 15 times, the average of all 15 runs was
taken. After collecting the data line graphs were made, showing the total number
infected, the total number vaccinated, the total number uninfected, and the number of
normal individuals. Normal individuals are not infected or vaccinated. These lines
provide a visual that is easier to comprehend and composes the data in such a way that it
is facilitates the process of comparing and contrasting the results.
Also, the standard deviation was taken of the total number infected to see the
variation of the numbers infected over time. Standard deviation helps with the
measurement of how the data or numbers are spread out.
Figure 10. Shows the control. Population size: 200, the infection was spread randomly; doctors: 5 in specific location, and infected individuals move toward doctors.
0
50
100
150
200
250
0 14
28
42
56
70
84
98
112
126
140
154
168
182
196
Number of Individuals
Number of years
Control (Population size: 200, Infection: spread)
Total Number Infected
Vaccinated
Not Infected
Normal
Descriptive Statistics
N Minimum Maximum Mean Std. Deviation
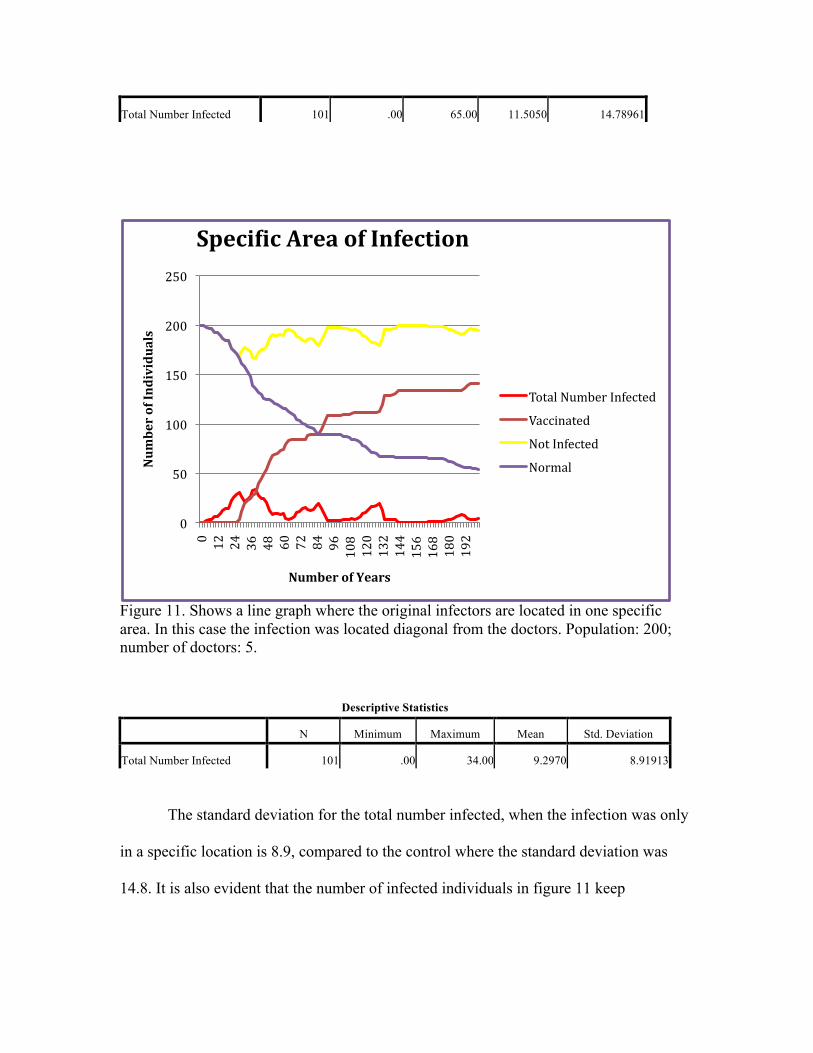
Figure 11. Shows a line graph where the original infectors are located in one specific area. In this case the infection was located diagonal from the doctors. Population: 200; number of doctors: 5.
Descriptive Statistics
N Minimum Maximum Mean Std. Deviation
Total Number Infected 101 .00 34.00 9.2970 8.91913
The standard deviation for the total number infected, when the infection was only
in a specific location is 8.9, compared to the control where the standard deviation was
14.8. It is also evident that the number of infected individuals in figure 11 keep
0
50
100
150
200
250
0 12
24
36
48
60
72
84
96
108
120
132
144
156
168
180
192
Number of Individuals
Number of Years
SpeciPic Area of Infection
Total Number Infected
Vaccinated
Not Infected
Normal
Total Number Infected 101 .00 65.00 11.5050 14.78961
reappearing, therefore suggesting that it may be harder to eradicate the spread of an
infection if it starts from a specific location.
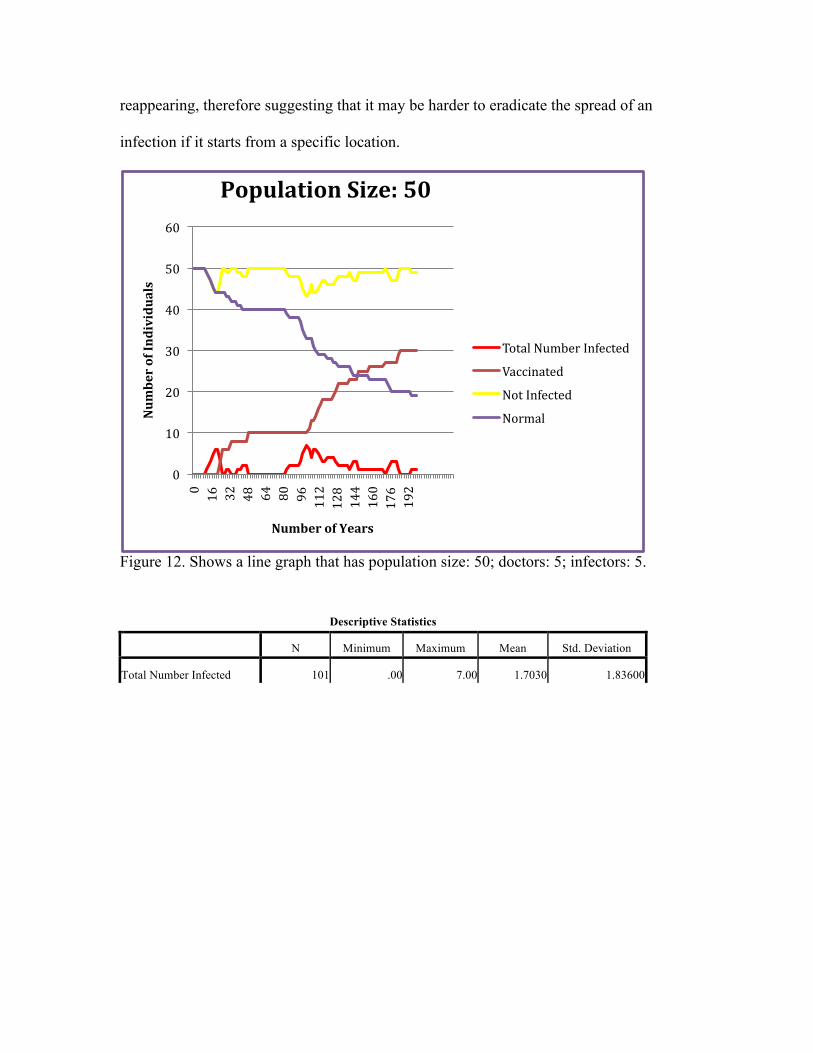
Figure 12. Shows a line graph that has population size: 50; doctors: 5; infectors: 5.
Descriptive Statistics
N Minimum Maximum Mean Std. Deviation
Total Number Infected 101 .00 7.00 1.7030 1.83600
0
10
20
30
40
50
60
0 16
32
48
64
80
96
112
128
144
160
176
192
Number of Individuals
Number of Years
Population Size: 50
Total Number Infected
Vaccinated
Not Infected
Normal
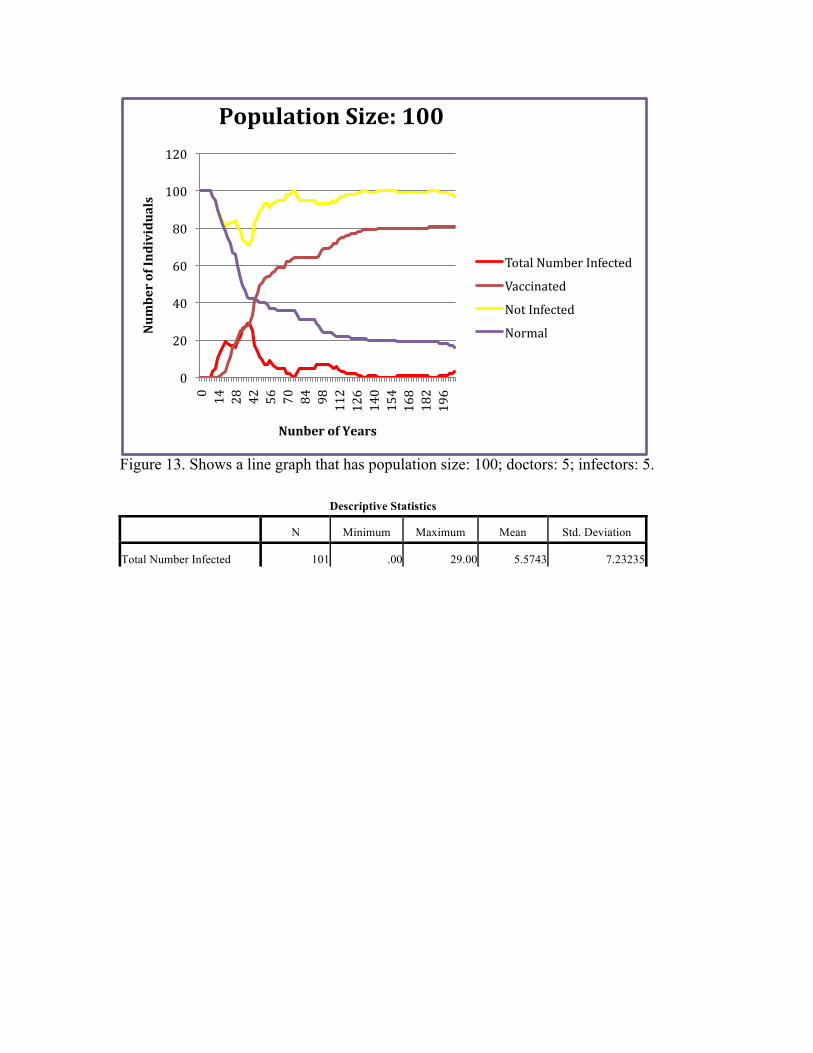
Figure 13. Shows a line graph that has population size: 100; doctors: 5; infectors: 5.
Descriptive Statistics
N Minimum Maximum Mean Std. Deviation
Total Number Infected 101 .00 29.00 5.5743 7.23235
0
20
40
60
80
100
120
0 14
28
42
56
70
84
98
112
126
140
154
168
182
196
Number of Individuals
Nunber of Years
Population Size: 100
Total Number Infected
Vaccinated
Not Infected
Normal
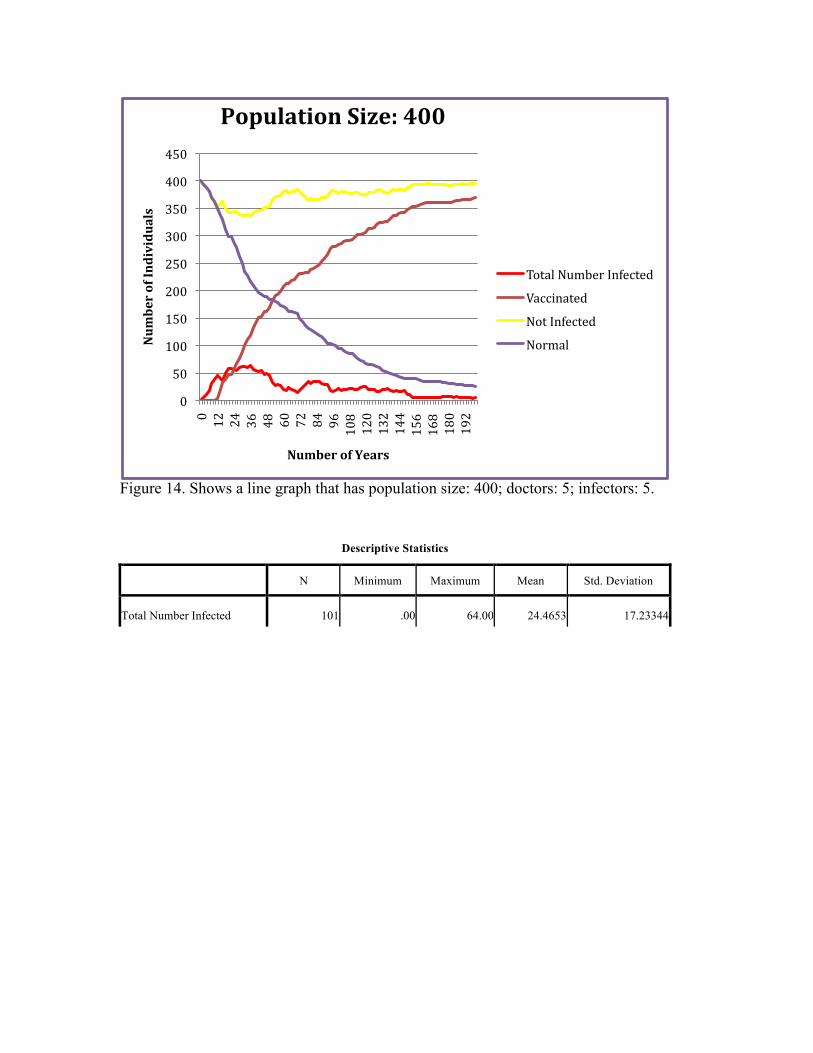
Figure 14. Shows a line graph that has population size: 400; doctors: 5; infectors: 5.
Descriptive Statistics
N Minimum Maximum Mean Std. Deviation
Total Number Infected 101 .00 64.00 24.4653 17.23344
0
50
100
150
200
250
300
350
400
450
0 12
24
36
48
60
72
84
96
108
120
132
144
156
168
180
192
Number of Individuals
Number of Years
Population Size: 400
Total Number Infected
Vaccinated
Not Infected
Normal
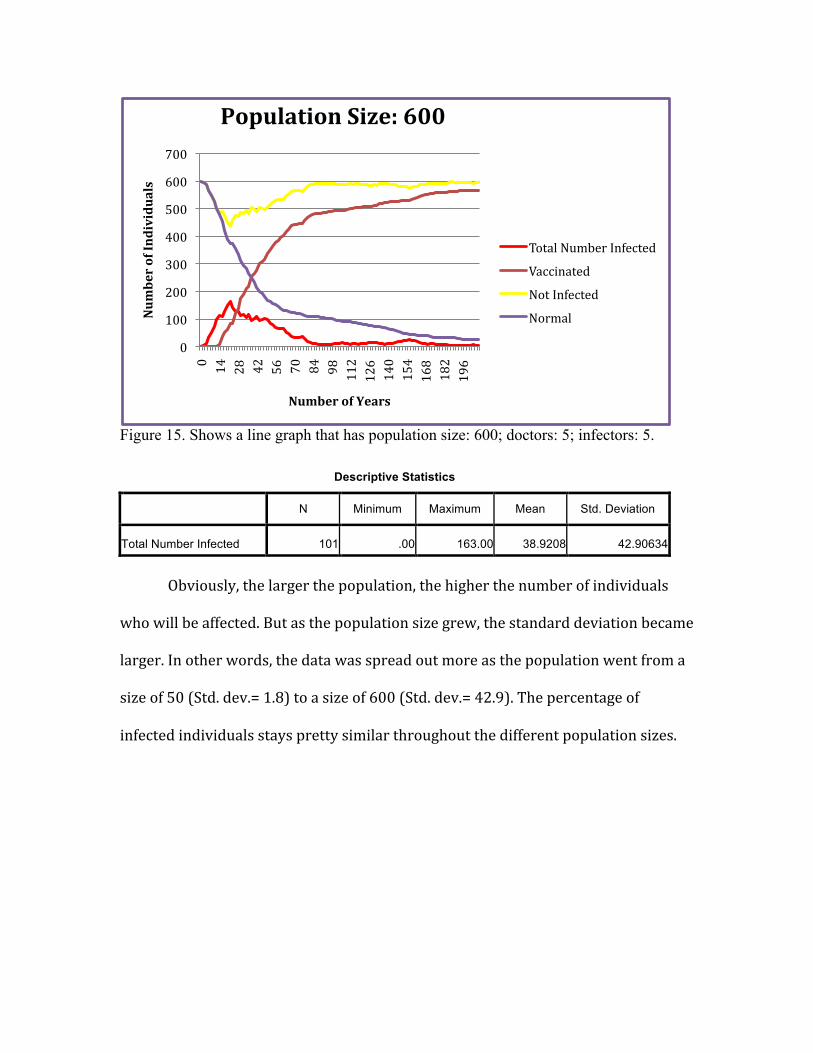
Figure 15. Shows a line graph that has population size: 600; doctors: 5; infectors: 5.
Descriptive Statistics
N Minimum Maximum Mean Std. Deviation
Total Number Infected 101 .00 163.00 38.9208 42.90634
Obviously, the larger the population, the higher the number of individuals
who will be affected. But as the population size grew, the standard deviation became
larger. In other words, the data was spread out more as the population went from a
size of 50 (Std. dev.= 1.8) to a size of 600 (Std. dev.= 42.9). The percentage of
infected individuals stays pretty similar throughout the different population sizes.
0
100
200
300
400
500
600
700
0 14
28
42
56
70
84
98
112
126
140
154
168
182
196
Number of Individuals
Number of Years
Population Size: 600
Total Number Infected
Vaccinated
Not Infected
Normal
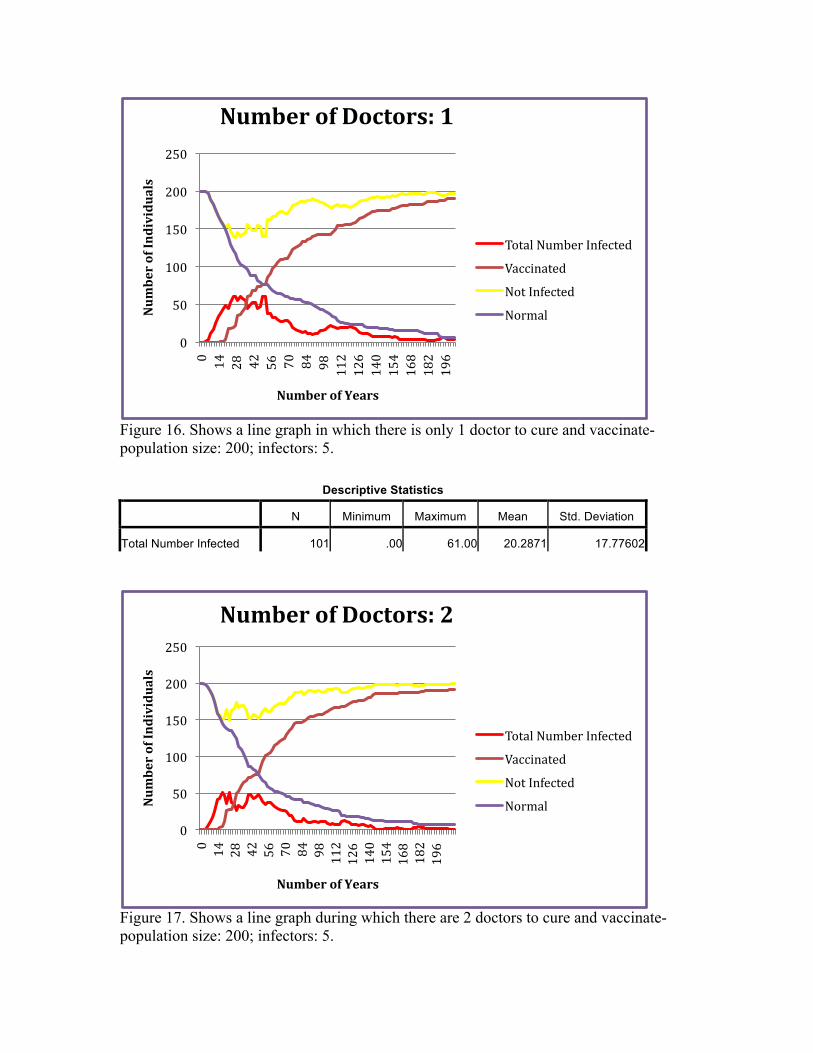
Figure 16. Shows a line graph in which there is only 1 doctor to cure and vaccinate- population size: 200; infectors: 5.
Descriptive Statistics
N Minimum Maximum Mean Std. Deviation
Total Number Infected 101 .00 61.00 20.2871 17.77602
Figure 17. Shows a line graph during which there are 2 doctors to cure and vaccinate- population size: 200; infectors: 5.
0
50
100
150
200
250
0 14
28
42
56
70
84
98
112
126
140
154
168
182
196
Number of Individuals
Number of Years
Number of Doctors: 1
Total Number Infected
Vaccinated
Not Infected
Normal
0
50
100
150
200
250
0 14
28
42
56
70
84
98
112
126
140
154
168
182
196
Number of Individuals
Number of Years
Number of Doctors: 2
Total Number Infected
Vaccinated
Not Infected
Normal
Descriptive Statistics
N Minimum Maximum Mean Std. Deviation
Total Number Infected 101 .00 51.00 15.7921 15.47664
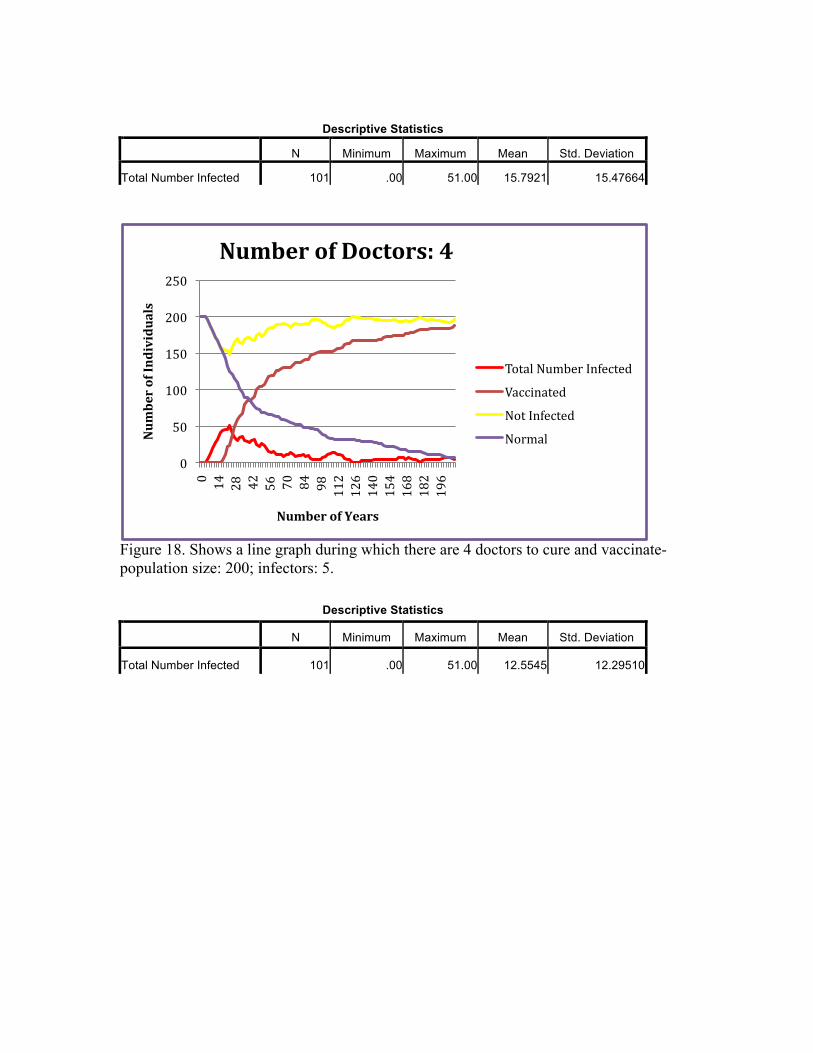
Figure 18. Shows a line graph during which there are 4 doctors to cure and vaccinate- population size: 200; infectors: 5.
Descriptive Statistics
N Minimum Maximum Mean Std. Deviation
Total Number Infected 101 .00 51.00 12.5545 12.29510
0
50
100
150
200
250
0 14
28
42
56
70
84
98
112
126
140
154
168
182
196
Number of Individuals
Number of Years
Number of Doctors: 4
Total Number Infected
Vaccinated
Not Infected
Normal
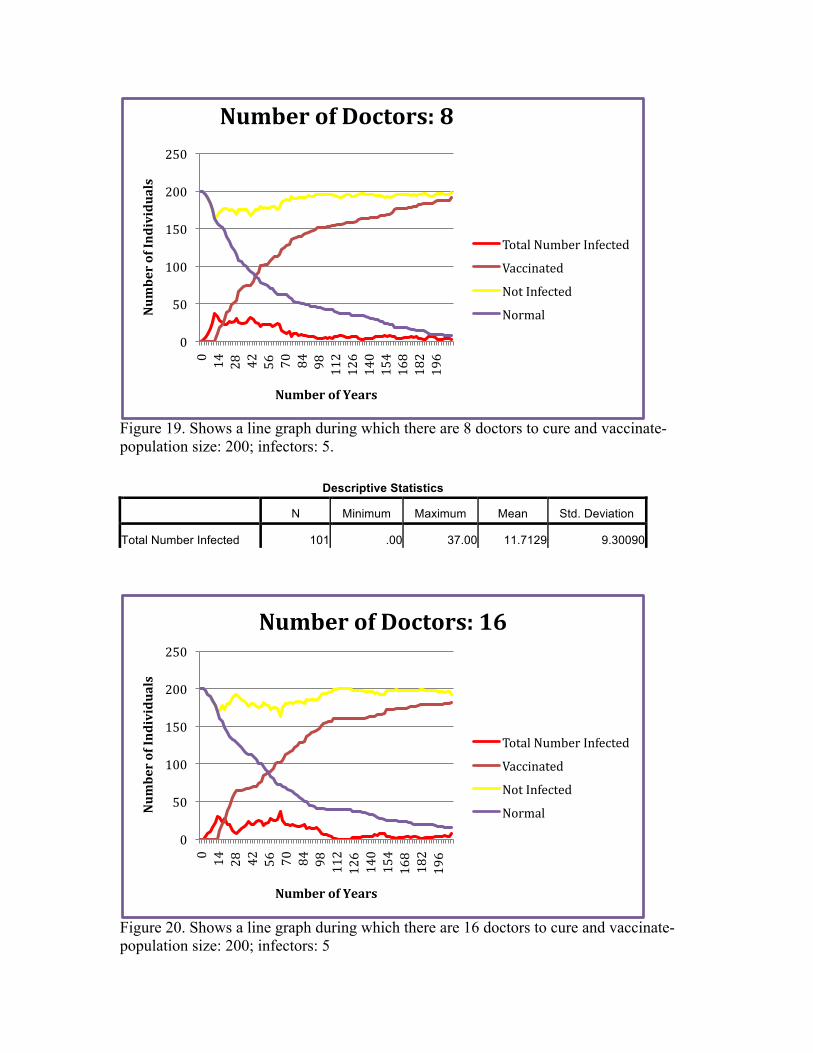
Figure 19. Shows a line graph during which there are 8 doctors to cure and vaccinate- population size: 200; infectors: 5.
Descriptive Statistics
N Minimum Maximum Mean Std. Deviation
Total Number Infected 101 .00 37.00 11.7129 9.30090
Figure 20. Shows a line graph during which there are 16 doctors to cure and vaccinate- population size: 200; infectors: 5
0
50
100
150
200
250
0 14
28
42
56
70
84
98
112
126
140
154
168
182
196
Number of Individuals
Number of Years
Number of Doctors: 8
Total Number Infected
Vaccinated
Not Infected
Normal
0
50
100
150
200
250
0 14
28
42
56
70
84
98
112
126
140
154
168
182
196
Number of Individuals
Number of Years
Number of Doctors: 16
Total Number Infected
Vaccinated
Not Infected
Normal
Descriptive Statistics
N Minimum Maximum Mean Std. Deviation
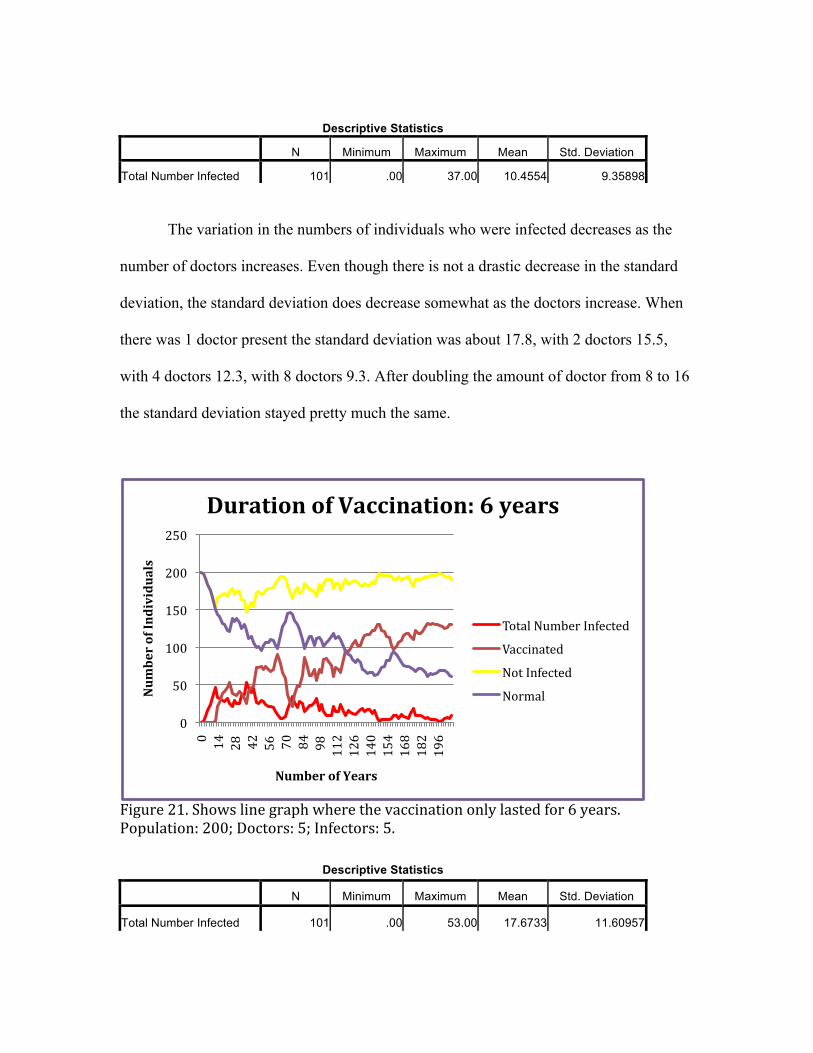
Total Number Infected 101 .00 37.00 10.4554 9.35898
The variation in the numbers of individuals who were infected decreases as the
number of doctors increases. Even though there is not a drastic decrease in the standard
deviation, the standard deviation does decrease somewhat as the doctors increase. When
there was 1 doctor present the standard deviation was about 17.8, with 2 doctors 15.5,
with 4 doctors 12.3, with 8 doctors 9.3. After doubling the amount of doctor from 8 to 16
the standard deviation stayed pretty much the same.
Figure 21. Shows line graph where the vaccination only lasted for 6 years. Population: 200; Doctors: 5; Infectors: 5.
Descriptive Statistics
N Minimum Maximum Mean Std. Deviation
Total Number Infected 101 .00 53.00 17.6733 11.60957
0
50
100
150
200
250
0 14
28
42
56
70
84
98
112
126
140
154
168
182
196
Number of Individuals
Number of Years
Duration of Vaccination: 6 years
Total Number Infected
Vaccinated
Not Infected
Normal
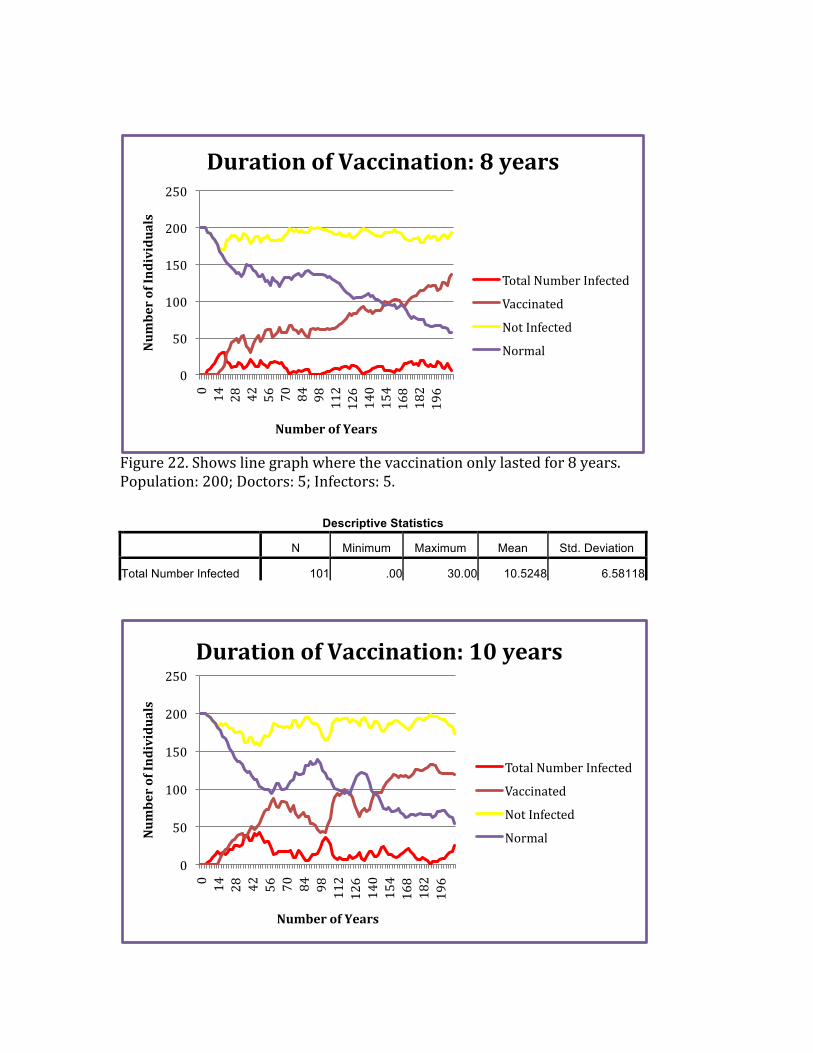
Figure 22. Shows line graph where the vaccination only lasted for 8 years. Population: 200; Doctors: 5; Infectors: 5.
Descriptive Statistics
N Minimum Maximum Mean Std. Deviation
Total Number Infected 101 .00 30.00 10.5248 6.58118
0
50
100
150
200
250 0 14
28
42
56
70
84
98
112
126
140
154
168
182
196
Number of Individuals
Number of Years
Duration of Vaccination: 8 years
Total Number Infected
Vaccinated
Not Infected
Normal
0
50
100
150
200
250
0 14
28
42
56
70
84
98
112
126
140
154
168
182
196
Number of Individuals
Number of Years
Duration of Vaccination: 10 years
Total Number Infected
Vaccinated
Not Infected
Normal
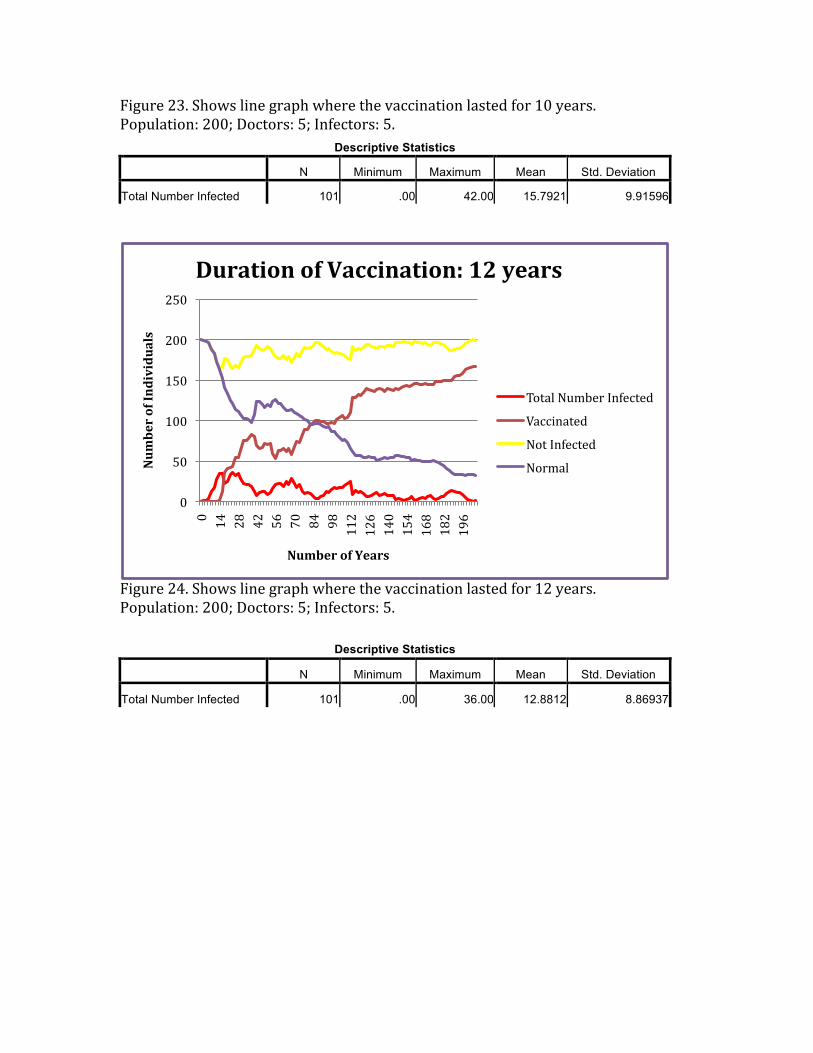
Figure 23. Shows line graph where the vaccination lasted for 10 years. Population: 200; Doctors: 5; Infectors: 5.
Descriptive Statistics
N Minimum Maximum Mean Std. Deviation
Total Number Infected 101 .00 42.00 15.7921 9.91596
Figure 24. Shows line graph where the vaccination lasted for 12 years. Population: 200; Doctors: 5; Infectors: 5.
Descriptive Statistics
N Minimum Maximum Mean Std. Deviation
Total Number Infected 101 .00 36.00 12.8812 8.86937
0
50
100
150
200
250
0 14
28
42
56
70
84
98
112
126
140
154
168
182
196
Number of Individuals
Number of Years
Duration of Vaccination: 12 years
Total Number Infected
Vaccinated
Not Infected
Normal
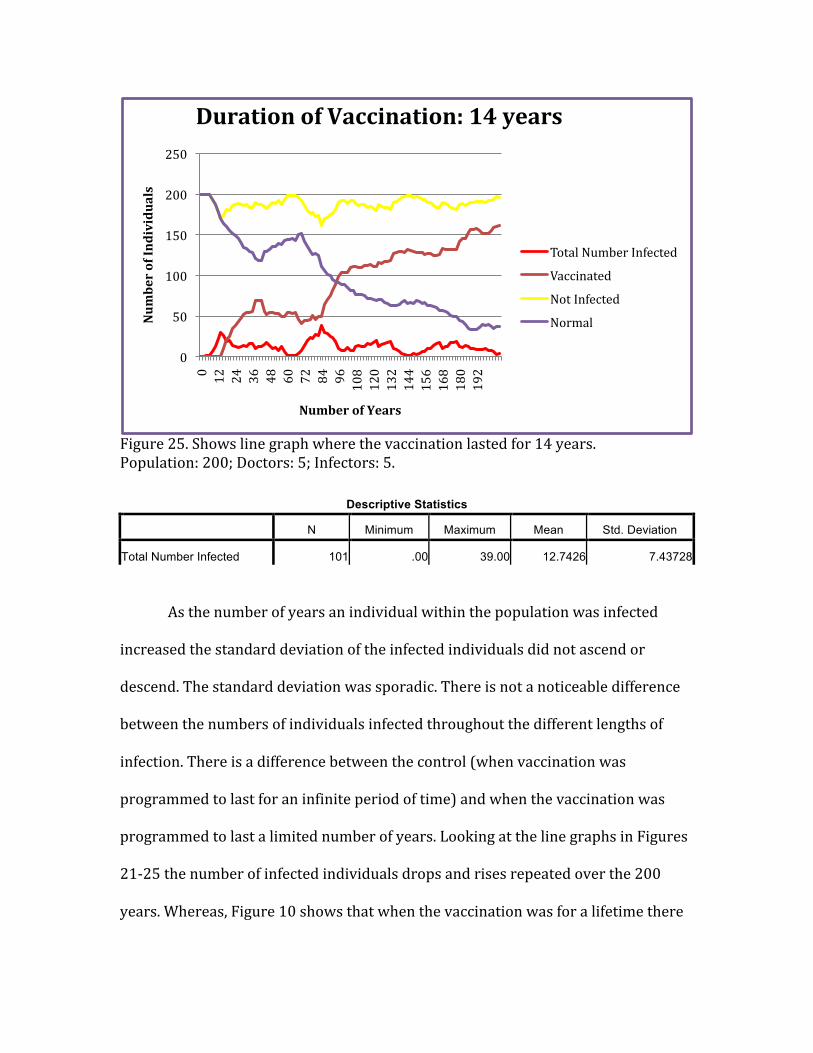
Figure 25. Shows line graph where the vaccination lasted for 14 years. Population: 200; Doctors: 5; Infectors: 5.
Descriptive Statistics
N Minimum Maximum Mean Std. Deviation
Total Number Infected 101 .00 39.00 12.7426 7.43728
As the number of years an individual within the population was infected
increased the standard deviation of the infected individuals did not ascend or
descend. The standard deviation was sporadic. There is not a noticeable difference
between the numbers of individuals infected throughout the different lengths of
infection. There is a difference between the control (when vaccination was
programmed to last for an infinite period of time) and when the vaccination was
programmed to last a limited number of years. Looking at the line graphs in Figures
21-‐25 the number of infected individuals drops and rises repeated over the 200
years. Whereas, Figure 10 shows that when the vaccination was for a lifetime there
0
50
100
150
200
250
0 12
24
36
48
60
72
84
96
108
120
132
144
156
168
180
192
Number of Individuals
Number of Years
Duration of Vaccination: 14 years
Total Number Infected
Vaccinated
Not Infected
Normal

was an increase in the number of individuals infected and then a continuous
decrease in the number of individuals after 40 years.

Discussion and Future:
Although vaccination offers a very powerful method of disease control, there are
many associated difficulties and challenges. In general, vaccines are not a hundred
percent effective, and therefore, at times only a proportion of vaccinated individuals were
protected. Comparing figures 10 and 11, it is evident that when the infectors are located
in a specific area, it is harder to eradicate the infection. It is almost as if the infection
comes in waves. This proves the hypothesis correct. When infectors are in a specific area,
once the normal individual gets infected, they spread the infection by colliding on their
way to the doctors. This cycle is repetitive. There is also a decrease in the number of
individuals getting vaccinated over time when the infection is in one specific location.
A prediction was made that, if the number of doctors remained the same, the more
the population grew, and the longer it would take to eradicate an infection. At least, the
percentage of infected individuals would be less in the population with fewer people,
because the ratio of individuals to doctors would be higher. The prediction is not
necessarily true. In these experiments, it was shown that the ratio does not, in fact, have
much effect. As long as individuals make a point to go to the doctors (represented by
them colliding with one another), they will be vaccinated.
As predicted, there is a steady trend showing that as the number of doctors
increases, there is a concomitant decrease in the number of infected individuals, and an
increase in the number of individuals getting vaccinated. A model programmed with 1
doctor as compared to a model programmed with 2 or 4 doctors does not show much of a
difference. But, when compared with a model programmed to have sixteen doctors, there
is a noticeable impact. According to the last hypothesis the longer the vaccinations lasts,
the faster individuals are cured and vaccinated. Though, this is not always the case, as can
be seen in figures 21, 22, 23,14, and 25. The difference between each vaccination time
frame is only 2 years. A larger gap between years of vaccination might have given
different results. For example, in comparing data from figures 21-25 to figure 10, which
is the control with an undefined vaccination time, there is a noticeable difference in both
the number of infected individuals and the number of individuals being vaccinated.
These simulations provide a basic understanding of how the StarLogo program
can be beneficial. One of the accomplished goals was the observation of how infection
spreads throughout a population. Another observation was the way in which vaccination
plays a role in different situations and different types of populations. Influential factors
such as the root of the infection, population size, the number of providers to cure and
vaccinate, and the amount of time the vaccination lasted were all taken under
consideration and observed during this experiment. There are numerous additional
aspects that can be analyzed and altered to further explore different situations of cause
and effect as relates to the spread of infectious diseases. A few examples of these types of
alterations and additions might be programming death and reproduction.
Important to note is the fact that there are times in which reactive vaccination may
prove to be too slow to prevent a large outbreak, and therefore, in many situations, would
require alternative control measures. These alternative control measures are impossible
to do on a model-based program like StarLogo- TNG.
In contextualizing the results of the study there are larger implications not only of
the results of this one specific study, but also of programs such as StarLogo. Infectious
diseases are not only a threat to one person, but to entire groups of people, animals, and

species. In cases where there are massive outbreaks of infectious disease, programs and
models can prove to be a helpful tool. Models have recently been an essential part of
research on infectious diseases such as, Staphlococcus aureus and AIDS which is a global
disease (Why We Model, 2009). Communities not only nationwide, but all over the world
can use models to prevent a future disaster in the realm of health care.

Acknowledgments:
I would like to thank the people at MIT who developed StarLogo for their
program, which I used to run multiple simulations. I would like to thank the East
Tennessee State University Honors College for all the support I have gotten during my
past four years, while I was obtaining my undergraduate degree. I would also like to
thank my faculty mentor, Dr. Istvan Karsai, for helping me through the process of
researching and writing my thesis. Many thanks to Dr. Kilaru and Dr. Yampolsky for
taking the time and reading my thesis. During my research experience I had the special
opportunity to present twice at the Boland Undergraduate symposium, Quillen College of
Medicine Summer Symposium, and at “Posters at the State Capital” in Nashville. For
this, I would like to extend additional thanks to those who made it possible for me to
share my work and findings with the public.

References:
Anderson, R.M., 1992. Infectious Diseases of Humans. Oxford University Press, Oxford.
Rand, D.A., et al., 1997. Correlation Models for Childhood Epidemics. Proc. R. Soc.
London B, 1149-1156.
Boots, M., et al. 2004. Large shifts in pathogen virulence relate to host population
structure. Science 842-844.
Klopfer, Eric. 2007. StarLogo TNG- Making game and simulation development
accessible to students and teachers. Michigan Institute of Technology Press.
Eames, K.T.D., 2008. Modeling disease spread through random and regular contacts in
clustered population. Theoretical Population Biology.
Keeling, J.M. et al. 2008. Modeling Infectious Diseases in Human and Animals.
Princeton University Press 235-302.
. N.p.. StarLogo- TNG, Massachusetts Institute of Technology, Web. 28 Apr 2013.
<http://education.mit.edu/projects/starlogo-tng>.
Why We Model Infectious Disease, Year of Science. N.p., n.d. Web. 29 Apr 2013. <
http://publish.aibs.org/mt-tb.cgi/5495>.