Embed Size (px)
Citation preview

Inferential Statistics

lNormal Curve
• Specific bell-shaped curve that is p f punimodal, symmetric, and defined mathematically.
Ubi i– Ubiquitous– Helps clarify the probability of particular
eventsevents– Let’s see an example with a coin toss

f f lBasis of Inferential Statistics
1. The approximate shape of the normal curve is everywhere.
2 The bell shape of the normal curve may 2. The bell shape of the normal curve may be translated into percentages (standardization).( )
3. A distribution of means produces a bell-shaped curve even if the original distribution of individual scores is not distribution of individual scores is not bell-shaped, as long as the means are from sufficiently large samples (central li i h )limit theorem)

l d bSample Size and Distributions

d dStandardization
• Comparing z scores:– Statistics ExamStatistics Exam
• Mean = 78, SD = 6, Your Score = 88• z = 1.67
– Cognition Exam• Mean = 76, SD = 5, Your Score = 85• z = 1.8

Transforming z scores into Transforming z scores into Percentiles
d lGuinness and Normal Curves
• 1900s: W.S. Gosset hired for quality controlq y– Brewing and bottling both
require a precise amount of q pyeast
– Can’t test every bottle and every barrel• Need a sample!

l hCentral Limit Theorem
• A distribution of sample means approaches a normal curve as the ppsample size increases.– Even when the original distribution of Even when the original distribution of
scores is not normally distributed!

Sampling Distribution of Means
• A distribution composed of many means that are calculated from all fpossible samples of a given size, all taken from the same population.f p p– Less variability than the actual scores.
– Why does this distribution have less variability?y

Sampling Distribution of Means
• We cannot use the standard deviation for this distributionfor this distribution.
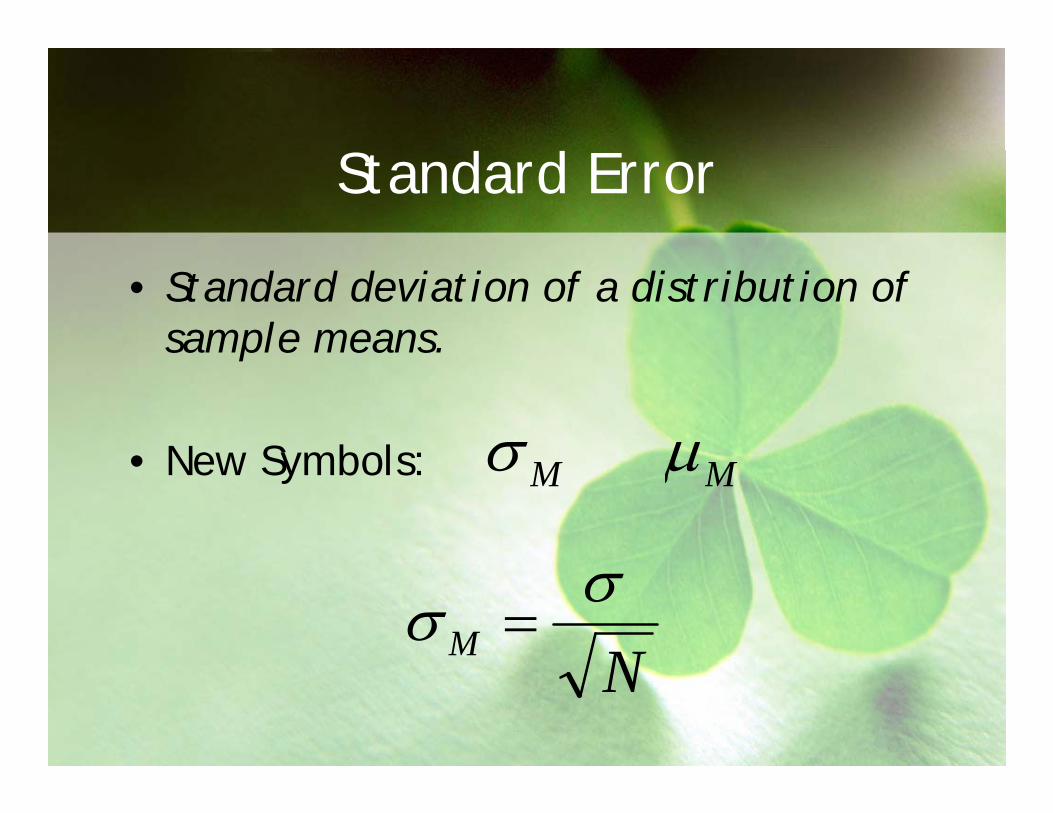
d dStandard Error
• Standard deviation of a distribution of sample means.p
• New Symbols: σ μ• New Symbols: Mσ Mμ
NMσσ =N
kQuick Review
1. As sample size increases, the mean of the sampling distribution of means p gapproaches the mean of the population of individual scoresp p
kQuick Review
2. The standard error is smaller than the standard deviation and as sample size pincreases, standard error decreases.

kQuick Review
3. The shape of the distribution of means will approximate normal if the ppdistribution of the population of individual scores is normal or if the size of each sample that comprises it is sufficiently large, at least 30.y g ,
– Central Limit Theorem
kBack to z Scores
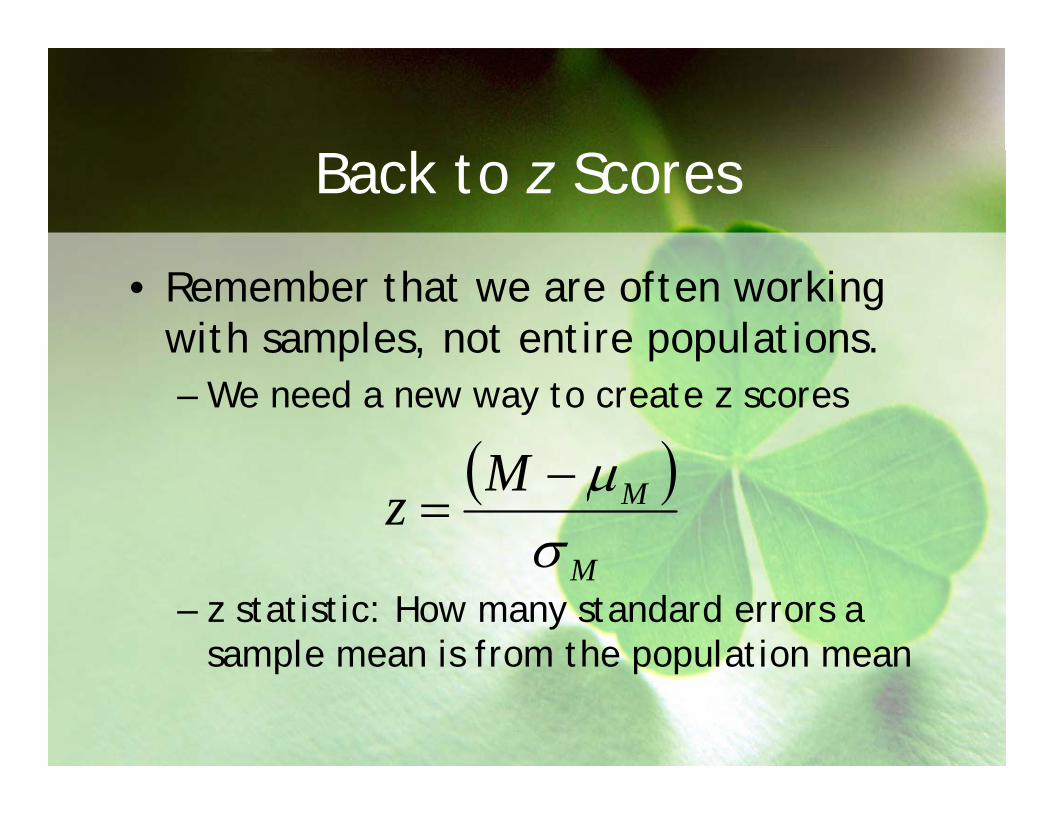
• Remember that we are often working with samples, not entire populations.p , p p– We need a new way to create z scores
( )M( )M
MMzσμ−
=
– z statistic: How many standard errors a sample mean is from the population mean
Mσ
sample mean is from the population mean
l lA Practical Example
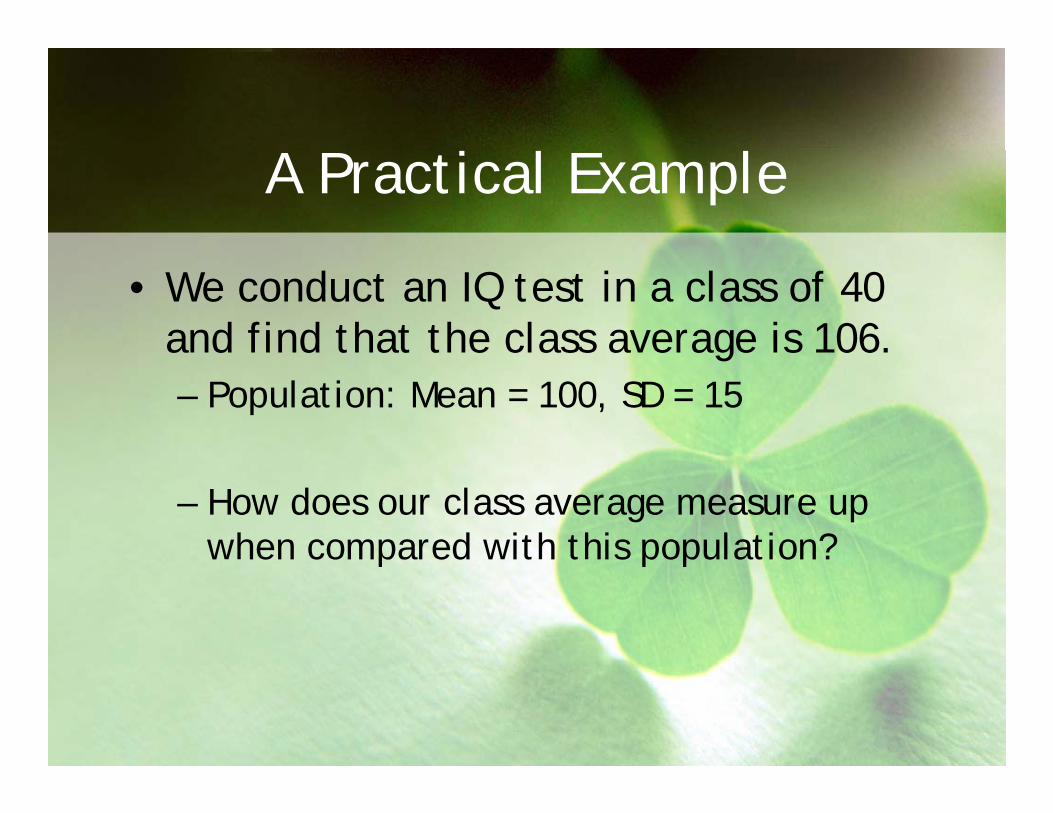
• We conduct an IQ test in a class of 40 and find that the class average is 106.g– Population: Mean = 100, SD = 15
– How does our class average measure up when compared with this population?p p p

l lA Practical Example
( )MMz μ−=
Mσ
100100== μμM
372.2325615
4015
====NMσσ
325.640N

l lA Practical Example
( ) ( ) 532100106−− MM μ( ) ( ) 53.2372.2
===M
Mzσμ
To convert this z statistic to a percentage To convert this z statistic to a percentage, consult a z table (at the back of the book)