Embed Size (px)
Citation preview

Inferring the effective TOR-dependentnetwork: a computational study in yeastMohammadi et al.
Mohammadi et al. BMC Systems Biology 2013, 7:84http://www.biomedcentral.com/1752-0509/7/84

Mohammadi et al. BMC Systems Biology 2013, 7:84http://www.biomedcentral.com/1752-0509/7/84
RESEARCH ARTICLE Open Access
Inferring the effective TOR-dependentnetwork: a computational study in yeastShahin Mohammadi1*, Shankar Subramaniam2 and Ananth Grama1
Abstract
Background: Calorie restriction (CR) is one of the most conserved non-genetic interventions that extendshealthspan in evolutionarily distant species, ranging from yeast to mammals. The target of rapamycin (TOR) has beenshown to play a key role in mediating healthspan extension in response to CR by integrating different signals thatmonitor nutrient-availability and orchestrating various components of cellular machinery in response. Both geneticand pharmacological interventions that inhibit the TOR pathway exhibit a similar phenotype, which is not furtheramplified by CR.
Results: In this paper, we present the first comprehensive, computationally derived map of TOR downstreameffectors, with the objective of discovering key lifespan mediators, their crosstalk, and high-level organization. Weadopt a systematic approach for tracing information flow from the TOR complex and use it to identify relevantsignaling elements. By constructing a high-level functional map of TOR downstream effectors, we show that ourapproach is not only capable of recapturing previously known pathways, but also suggests potential targets for futurestudies.Information flow scores provide an aggregate ranking of relevance of proteins with respect to the TOR signalingpathway. These rankings must be normalized for degree bias, appropriately interpreted, and mapped to associatedroles in pathways. We propose a novel statistical framework for integrating information flow scores, the set ofdifferentially expressed genes in response to rapamycin treatment, and the transcriptional regulatory network. We usethis framework to identify the most relevant transcription factors in mediating the observed transcriptional response,and to construct the effective response network of the TOR pathway. This network is hypothesized to mediate life-spanextension in response to TOR inhibition.
Conclusions: Our approach, unlike experimental methods, is not limited to specific aspects of cellular response.Rather, it predicts transcriptional changes and post-translational modifications in response to TOR inhibition. Theconstructed effective response network greatly enhances understanding of the mechanisms underlying the agingprocess and helps in identifying new targets for further investigation of anti-aging regimes. It also allows us to identifypotential network biomarkers for diagnosis and prognosis of age-related pathologies.
Keywords: Target of rapamycin (TOR), Yeast aging, Interactome, Information flow analysis, Effective response network
BackgroundCellular aging is a multi-factorial complex phenotype,characterized by the accumulation of damaged cellularcomponents over the organism’s life-span [1]. The pro-gression of aging depends on both the increasing rate ofdamage to DNA, RNA, proteins, and cellular organelles,as well as the gradual decline of cellular defense mecha-nisms against stress. This can ultimately lead to a dysfunc-tional cell with a higher risk factor for disease.
*Correspondence: [email protected] of Computer Science, Purdue University, West Lafayette, Indiana,USAFull list of author information is available at the end of the article
Limiting caloric intake without causing malnutrition,also known as calorie restriction (CR), is one of themost conserved non-genetic interventions, which extendslife-span in evolutionarily distant species ranging fromyeast to mammals [1-3]. Inhibition of the nutrient-sensingpathways, using either genetic or pharmacological inter-vention, also results in a similar phenotype [1,2]. Moreimportantly, increased lifespan is accompanied by anincreased healthspan, which delays both the progressionand the increasing risk-factor for a wide range of age-related diseases, including cancers [4-7], cardiovasculardisease [8-11], and multiple neurodegenerative disorders[12-17]. The extent to which these pathologies share
© 2013 Mohammadi et al.; licensee BioMed Central Ltd. This is an Open Access article distributed under the terms of the CreativeCommons Attribution License (http://creativecommons.org/licenses/by/2.0), which permits unrestricted use, distribution, andreproduction in any medium, provided the original work is properly cited.
Mohammadi et al. BMC Systems Biology 2013, 7:84 Page 2 of 17http://www.biomedcentral.com/1752-0509/7/84
their underlying biology is a topic of active investiga-tion. Emerging evidence, however, supports the hypoth-esis that large classes of age-related diseases are drivenby similar underlying mechanisms [18]. Understandingand controlling these mechanisms, therefore, constitutecritical aspects of preventing or delaying the onset ofage-related pathologies. Motivated by these observations,considerable effort has been invested in understanding thedownstream effectors of the nutrient-sensing pathwaysthat orchestrate CR-mediated life-span extension.
The budding yeast, Saccharomyces cerevisiae, has beenused extensively as a model organism in aging research,due to its rapid growth and ease of manipulation [3,19].Having two different aging paradigms – replicative life-span (RLS), defined as “the number of buds a mothercell can produce before senescence occurs”, and chrono-logical life-span (CLS), defined as “the duration of viabil-ity after entering the stationary-phase”, yeast provides aunique opportunity for modeling both proliferating andpost-mitotic cells. Understanding the underlying mecha-nisms driving RLS and CLS can ultimately be used to shedlight on the progression of cancers and neurodegenerativediseases, respectively.
Yeast cells are typically cultured in growth media con-taining 2% glucose. Reducing glucose concentration to0.5% or less is one of the best characterized CR regi-mens in yeast, which increases both CLS and RLS [20-22].The target of rapamycin (TOR) has been shown to playa key role in mediating the observed life-span exten-sion in response to CR [23]. TOR is a serine/threonineprotein kinase, which belongs to the conserved familyof PI3K-related kinases (PIKKs). It was first identifiedusing genetic studies in yeast while searching for mutantsthat confer rapamycin-resistance [24]. It was later discov-ered that TOR protein kinases, encoded by TOR1 andTOR2 genes in yeast, form two structurally and func-tionally distinct multiprotein complexes [25-28]. TORComplex 1 (TORC1) is rapamycin-sensitive and con-sists of both TOR proteins, TOR1 and TOR2, togetherwith KOG1, LST8, and TCO89. On the other hand,TOR Complex 2 (TORC2) does not contain TOR1, isnot inhibited by rapamycin, and contains AVO1, AVO2,AVO3, LST8, BIT2, and BIT61. These two complexescorrespond to two separate branches of the TOR sig-naling network, controlling the spatial and temporalaspects of cell growth, respectively, which are conservedfrom yeast to humans [28]. Interestingly, TORC1 alsohas a critical role in aging and age-related patholo-gies [29,30]. Many of the known oncoproteins act asupstream activators of TORC1, while several tumorsuppressor proteins inhibit its activity [31,32]. From asystems point of view, TORC1 acts as a hub that inte-grates various nutrient and stress-related signals and
regulates a variety of cellular responses [33-35]. Inhibit-ing TOR signaling using rapamycin provides a uniqueopportunity to identify its downstream effectors. How-ever, these targets may be regulated in different ways,including, but not limited to, transcription regulation,translational control, and post-translational modifica-tions. Capturing various changes that happen duringrapamycin treatment, in order to create a comprehen-sive systems view of the cellular response, is a complextask.
In this paper, we propose a complementary, compu-tational approach to reconstruct a comprehensive mapof TOR downstream effectors. We develop a systematicapproach to couple random walk techniques with rigorousstatistical models, integrate different datasets, and iden-tify key targets in calorie restriction that are mediatedby TOR pathway. Using GO enrichment analysis of highscoring nodes, we show that information flow analysisnot only identifies previously known targets of TORC1,but also predicts new functional roles for further studies.We cross-validate our results with transcriptome profileof yeast in response to rapamycin treatment and showthat our method can accurately predict transcriptionalchanges in response to TORC1 inhibition. Informationflow scores provide an aggregate ranking of proteins, withrespect to their relevance to the TOR signaling path-way, and are highly susceptible to degree bias. To remedythis and to elucidate the roles of underlying signalingelements, we propose a novel statistical framework forintegrating information flow scores, data on regulatoryrelationships, and the expression profile in response torapamycin treatment.
Using our framework, we identify the most relevanttranscription factors and construct the effective responsenetwork of TOR, which is responsible for the observedtranscriptional changes due to TOR inhibition. Ourapproach, unlike experimental methods, is not limited tospecific aspects of cellular response. Rather, it predictstranscriptional changes, as well as post-translational mod-ifications in response to TOR signaling. The resultinginteraction map greatly enhances our understanding ofthe mechanisms underlying the aging process and helpsidentify novel targets for further investigation of anti-aging regimes. It also reveals potential network biomark-ers for diagnoses and prognoses of age-related pathologiesand identifies mechanisms for control of cellular agingprocesses through multi-targeted and combinatorial ther-apies [36,37].
Results and discussionComputing information flow scores from TORC1Given the yeast interactome, constructed using the pro-cedure detailed in Methods Section and illustrated in

Mohammadi et al. BMC Systems Biology 2013, 7:84 Page 3 of 17http://www.biomedcentral.com/1752-0509/7/84
Figure 1, we compute information flow scores using ran-dom walks initiated at selected nodes in the interactome.These nodes comprise members of the TORC1 complex,each of which propagates a unit flow (normalized to 0.2for each of the five member proteins). We use a dis-crete random-walk process in which, at each step, everyprotein aggregates incoming signals and distributes themequally among outgoing neighbors. The final informationflow scores are computed as the steady-state distributionof the random-walk process. One of the key parametersin the random-walk process, which controls the depth ofpropagation, is called the restart-probability. This is theprobability that a random walker continues the walk (asopposed to teleporting to a node chosen from among aset of preferred nodes). In order to give all nodes in theinteractome a chance of being visited, we use the relation-ship between restart probability and the mean depth ofrandom-walks by setting parameter α to be equal to d
1+d ,where d is the diameter of the interactome. For the yeastinteractome, we determine the diameter to be equal to 6and set α = 6
7 ∼ 0.85, correspondingly (please see theMethods section for details of information flow compu-tations). Figure 2 illustrates the distribution of computed
information flow scores, starting from TORC1, as a func-tion of node distance from TORC1. It is evident from thefigure that computed scores are functions of both dis-tance from source nodes, as well as multiplicity of pathsbetween source and sink nodes. This can be verified fromthe overlapping tails of distributions for nodes at differ-ent distances, as well as the varied distribution of scoresamong nodes at the same distance from TORC1. The finallist of computed information flow scores is available fordownload as Additional file 1.
Node rankings from the random walk process are sus-ceptible to degree-bias, favoring high-degree nodes. Toremedy this bias and to gain a detailed mechanistic under-standing of the roles of various proteins (and associatedsignaling elements), random walk methods need to becoupled with appropriate statistical tests. A key contri-bution of our work is the development of such a test,which yields a fine-grained understanding of key path-ways involved in orchestrating cellular response to TORinhibition. To the best of our knowledge, this work rep-resents the first application of information flow meth-ods for reconstructing the effective response network ofTORC1.
Figure 1 Network integration process. Example of the network integration process around Sch9p. Protein-protein interactions (PPI) andpost-translational modifications (PTM) were extracted from BioGRID dataset.
Mohammadi et al. BMC Systems Biology 2013, 7:84 Page 4 of 17http://www.biomedcentral.com/1752-0509/7/84
1 2 3 4 5 6 70
0.05
0.1
0.15
0.2
0.25
0.3
0.35
0.4
0.45
0.5
−log10(information flow)
Fra
ctio
n of
nod
es a
t sim
ilar
dist
ance
Distance=1,score=1.5e−03±2.1e−03Distance=2,score=1.2e−04±1.9e−04Distance=3,score=3.1e−05±3.8e−05Distance=4,score=4.6e−06±2.0e−06
Figure 2 Distribution of random-walk scores. Information flow versus node distance from TORC1, showing that random-walk scores are afunction of distance, as well as multiplicity of paths.
Constructing a high-level functional map of TORdownstream effectorsTORC1 is not only regulated by the quality and thequantity of both carbon and nitrogen sources [34,38-40],but also by noxious stressors, such as caffeine [41,42].In response, TORC1 coordinately orchestrates variousaspects of cellular machinery to mediate cell growth[32,40]. This includes autophagy [43], stress response[42,44], and protein synthesis (by regulating ribosomebiogenesis [45], translation initiation [46], and nutrientuptake [47,48]).
In order to systematically identify the functional aspectsrelevant to TOR signaling, we first rank the proteins inthe yeast interactome based on their information flowscores from the TORC1 complex. Given this ranked list,we aim to identify functional terms that are highly over-represented among top-ranked proteins. Gene Ontology(GO) [49] enrichment analysis has been used extensivelyfor this purpose. We employ GOrilla [50] to find theoptimal cut for each GO term, together with its exact min-imum hypergeometric (mHG) p-value. Next, we enforcea threshold of p-value ≤ 10−3 to identify the signifi-cant terms. The complete list of enriched terms for eachbranch of GO is available for download as Additionalfiles 2.
GO provides a hierarchical vocabulary to annotate bio-logical processes (BP), molecular functions (MF), andcellular components (CC). This hierarchical structure,
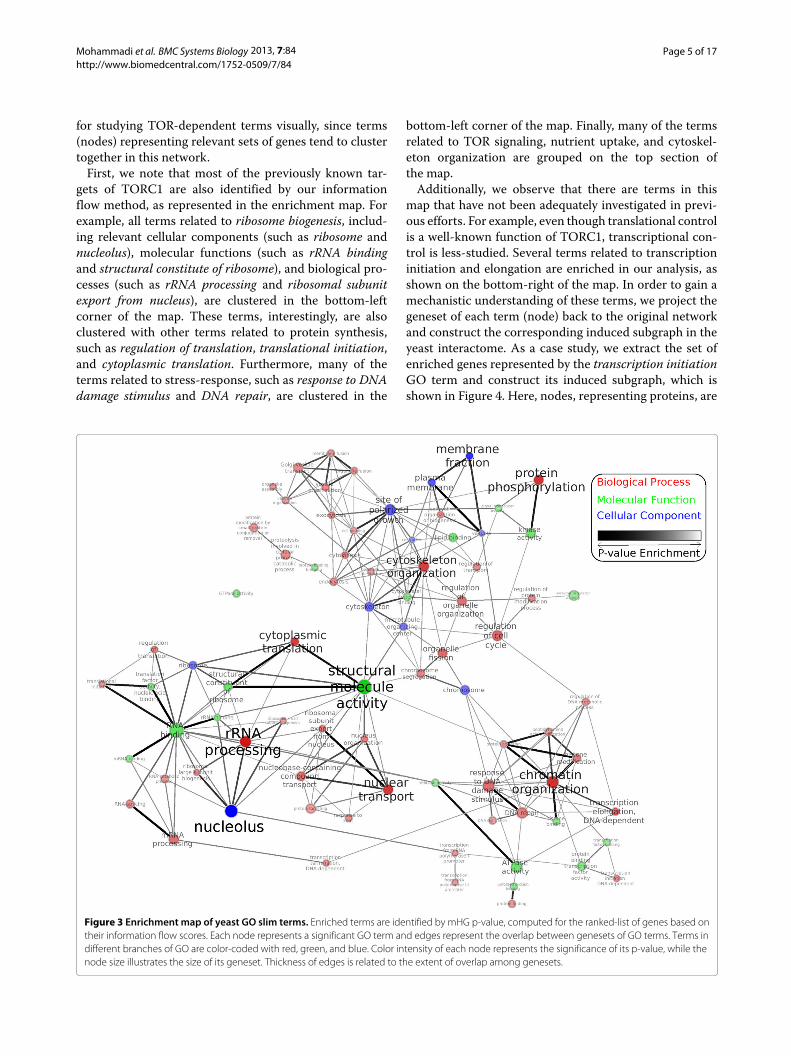
represented using a directed acyclic graph (DAG), intro-duces an inherent dependency among the significantterms identified by GO enrichment analysis. Furthermore,seemingly independent terms under different branches ofGO may be used to annotate the same set of genes. Toprovide a compact, non-redundant representation of thesignificant terms in our experiment, we follow a two-stepprocess. First, we extract the subset of enriched termsthat are marked by the Saccharomyces Genome Database(SGD) [51] as GO slim. Yeast GO slim is a compact sub-set of the entire GO, selected by SGD curators, which isnecessary and sufficient to describe different aspects ofyeast cellular biology. Next, we use EnrichmentMap (EM)[52], a recent Cytoscape [53] plugin, to construct the net-work (map) of the enriched terms. In this network, unlikethe original interactome, each node represents a signifi-cant GO slim term and each weighted edge indicates theextent of overlap between genesets of their correspond-ing terms. We use a custom visualization style to illustratevarious network properties. GO terms under BP, MF, andCC branches are color-coded red, green, and blue, respec-tively. The p-value of each term determines the opacityof both the node and its label; the bolder a term appears,the more significant its enrichment score. Finally, the totalnumber of enriched genes for each GO term is shownusing the size of the corresponding node. The final map,which is shown in Figure 3, is available for download asAdditional file 3. This map provides unique opportunities
Mohammadi et al. BMC Systems Biology 2013, 7:84 Page 5 of 17http://www.biomedcentral.com/1752-0509/7/84
for studying TOR-dependent terms visually, since terms(nodes) representing relevant sets of genes tend to clustertogether in this network.
First, we note that most of the previously known tar-gets of TORC1 are also identified by our informationflow method, as represented in the enrichment map. Forexample, all terms related to ribosome biogenesis, includ-ing relevant cellular components (such as ribosome andnucleolus), molecular functions (such as rRNA bindingand structural constitute of ribosome), and biological pro-cesses (such as rRNA processing and ribosomal subunitexport from nucleus), are clustered in the bottom-leftcorner of the map. These terms, interestingly, are alsoclustered with other terms related to protein synthesis,such as regulation of translation, translational initiation,and cytoplasmic translation. Furthermore, many of theterms related to stress-response, such as response to DNAdamage stimulus and DNA repair, are clustered in the
bottom-left corner of the map. Finally, many of the termsrelated to TOR signaling, nutrient uptake, and cytoskel-eton organization are grouped on the top section ofthe map.
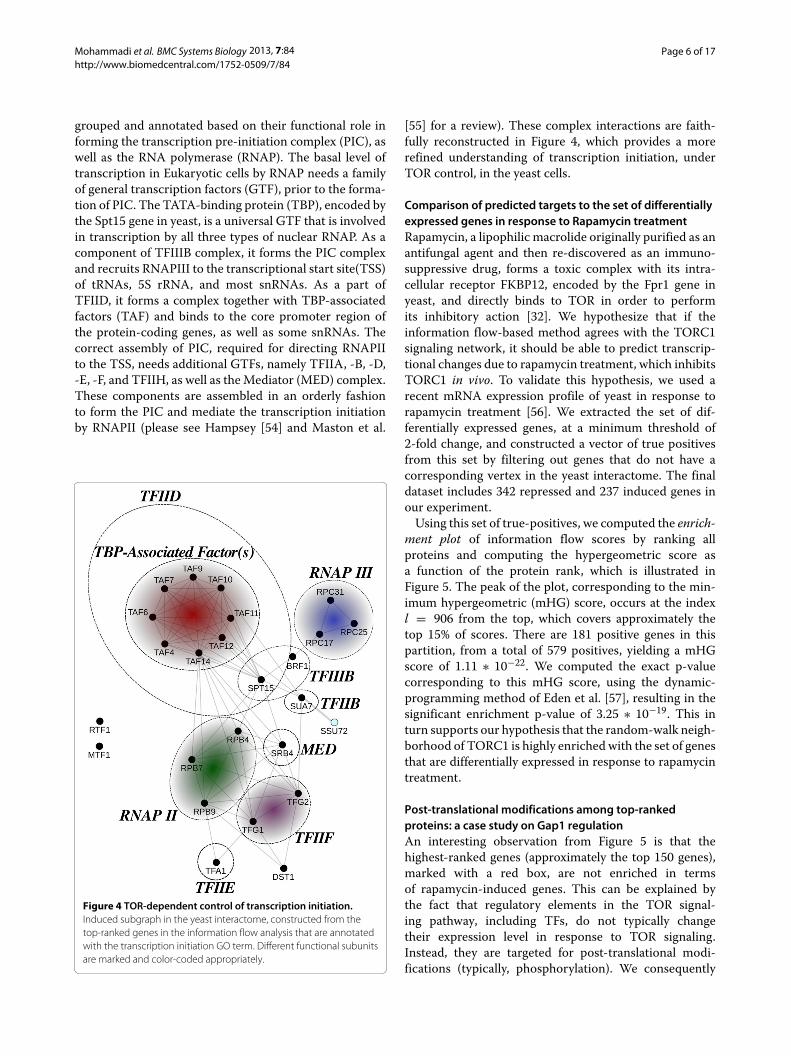
Additionally, we observe that there are terms in thismap that have not been adequately investigated in previ-ous efforts. For example, even though translational controlis a well-known function of TORC1, transcriptional con-trol is less-studied. Several terms related to transcriptioninitiation and elongation are enriched in our analysis, asshown on the bottom-right of the map. In order to gain amechanistic understanding of these terms, we project thegeneset of each term (node) back to the original networkand construct the corresponding induced subgraph in theyeast interactome. As a case study, we extract the set ofenriched genes represented by the transcription initiationGO term and construct its induced subgraph, which isshown in Figure 4. Here, nodes, representing proteins, are
Figure 3 Enrichment map of yeast GO slim terms. Enriched terms are identified by mHG p-value, computed for the ranked-list of genes based ontheir information flow scores. Each node represents a significant GO term and edges represent the overlap between genesets of GO terms. Terms indifferent branches of GO are color-coded with red, green, and blue. Color intensity of each node represents the significance of its p-value, while thenode size illustrates the size of its geneset. Thickness of edges is related to the extent of overlap among genesets.
Mohammadi et al. BMC Systems Biology 2013, 7:84 Page 6 of 17http://www.biomedcentral.com/1752-0509/7/84
grouped and annotated based on their functional role informing the transcription pre-initiation complex (PIC), aswell as the RNA polymerase (RNAP). The basal level oftranscription in Eukaryotic cells by RNAP needs a familyof general transcription factors (GTF), prior to the forma-tion of PIC. The TATA-binding protein (TBP), encoded bythe Spt15 gene in yeast, is a universal GTF that is involvedin transcription by all three types of nuclear RNAP. As acomponent of TFIIIB complex, it forms the PIC complexand recruits RNAPIII to the transcriptional start site(TSS)of tRNAs, 5S rRNA, and most snRNAs. As a part ofTFIID, it forms a complex together with TBP-associatedfactors (TAF) and binds to the core promoter region ofthe protein-coding genes, as well as some snRNAs. Thecorrect assembly of PIC, required for directing RNAPIIto the TSS, needs additional GTFs, namely TFIIA, -B, -D,-E, -F, and TFIIH, as well as the Mediator (MED) complex.These components are assembled in an orderly fashionto form the PIC and mediate the transcription initiationby RNAPII (please see Hampsey [54] and Maston et al.
Figure 4 TOR-dependent control of transcription initiation.Induced subgraph in the yeast interactome, constructed from thetop-ranked genes in the information flow analysis that are annotatedwith the transcription initiation GO term. Different functional subunitsare marked and color-coded appropriately.
[55] for a review). These complex interactions are faith-fully reconstructed in Figure 4, which provides a morerefined understanding of transcription initiation, underTOR control, in the yeast cells.
Comparison of predicted targets to the set of differentiallyexpressed genes in response to Rapamycin treatmentRapamycin, a lipophilic macrolide originally purified as anantifungal agent and then re-discovered as an immuno-suppressive drug, forms a toxic complex with its intra-cellular receptor FKBP12, encoded by the Fpr1 gene inyeast, and directly binds to TOR in order to performits inhibitory action [32]. We hypothesize that if theinformation flow-based method agrees with the TORC1signaling network, it should be able to predict transcrip-tional changes due to rapamycin treatment, which inhibitsTORC1 in vivo. To validate this hypothesis, we used arecent mRNA expression profile of yeast in response torapamycin treatment [56]. We extracted the set of dif-ferentially expressed genes, at a minimum threshold of2-fold change, and constructed a vector of true positivesfrom this set by filtering out genes that do not have acorresponding vertex in the yeast interactome. The finaldataset includes 342 repressed and 237 induced genes inour experiment.
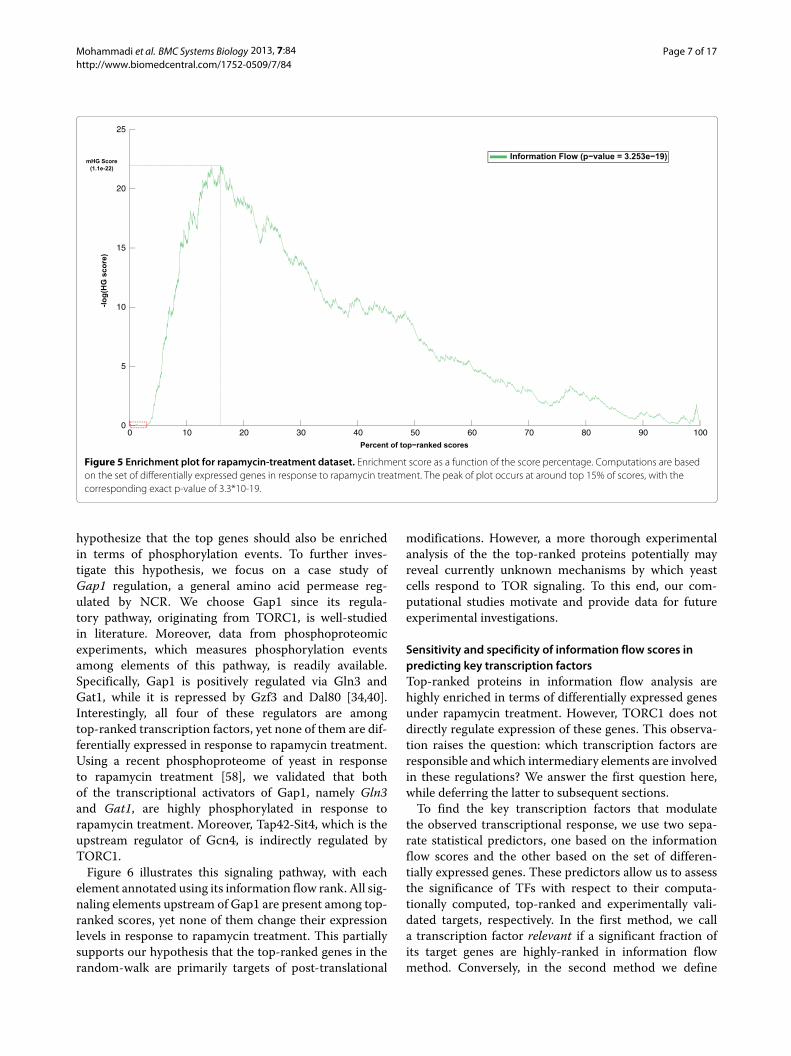
Using this set of true-positives, we computed the enrich-ment plot of information flow scores by ranking allproteins and computing the hypergeometric score asa function of the protein rank, which is illustrated inFigure 5. The peak of the plot, corresponding to the min-imum hypergeometric (mHG) score, occurs at the indexl = 906 from the top, which covers approximately thetop 15% of scores. There are 181 positive genes in thispartition, from a total of 579 positives, yielding a mHGscore of 1.11 ∗ 10−22. We computed the exact p-valuecorresponding to this mHG score, using the dynamic-programming method of Eden et al. [57], resulting in thesignificant enrichment p-value of 3.25 ∗ 10−19. This inturn supports our hypothesis that the random-walk neigh-borhood of TORC1 is highly enriched with the set of genesthat are differentially expressed in response to rapamycintreatment.
Post-translational modifications among top-rankedproteins: a case study on Gap1 regulationAn interesting observation from Figure 5 is that thehighest-ranked genes (approximately the top 150 genes),marked with a red box, are not enriched in termsof rapamycin-induced genes. This can be explained bythe fact that regulatory elements in the TOR signal-ing pathway, including TFs, do not typically changetheir expression level in response to TOR signaling.Instead, they are targeted for post-translational modi-fications (typically, phosphorylation). We consequently
Mohammadi et al. BMC Systems Biology 2013, 7:84 Page 7 of 17http://www.biomedcentral.com/1752-0509/7/84
25
20
15
10
5
00 10 20 30 40 50 60 70 80 90 100
Figure 5 Enrichment plot for rapamycin-treatment dataset. Enrichment score as a function of the score percentage. Computations are basedon the set of differentially expressed genes in response to rapamycin treatment. The peak of plot occurs at around top 15% of scores, with thecorresponding exact p-value of 3.3*10-19.
hypothesize that the top genes should also be enrichedin terms of phosphorylation events. To further inves-tigate this hypothesis, we focus on a case study ofGap1 regulation, a general amino acid permease reg-ulated by NCR. We choose Gap1 since its regula-tory pathway, originating from TORC1, is well-studiedin literature. Moreover, data from phosphoproteomicexperiments, which measures phosphorylation eventsamong elements of this pathway, is readily available.Specifically, Gap1 is positively regulated via Gln3 andGat1, while it is repressed by Gzf3 and Dal80 [34,40].Interestingly, all four of these regulators are amongtop-ranked transcription factors, yet none of them are dif-ferentially expressed in response to rapamycin treatment.Using a recent phosphoproteome of yeast in responseto rapamycin treatment [58], we validated that bothof the transcriptional activators of Gap1, namely Gln3and Gat1, are highly phosphorylated in response torapamycin treatment. Moreover, Tap42-Sit4, which is theupstream regulator of Gcn4, is indirectly regulated byTORC1.
Figure 6 illustrates this signaling pathway, with eachelement annotated using its information flow rank. All sig-naling elements upstream of Gap1 are present among top-ranked scores, yet none of them change their expressionlevels in response to rapamycin treatment. This partiallysupports our hypothesis that the top-ranked genes in therandom-walk are primarily targets of post-translational
modifications. However, a more thorough experimentalanalysis of the the top-ranked proteins potentially mayreveal currently unknown mechanisms by which yeastcells respond to TOR signaling. To this end, our com-putational studies motivate and provide data for futureexperimental investigations.
Sensitivity and specificity of information flow scores inpredicting key transcription factorsTop-ranked proteins in information flow analysis arehighly enriched in terms of differentially expressed genesunder rapamycin treatment. However, TORC1 does notdirectly regulate expression of these genes. This observa-tion raises the question: which transcription factors areresponsible and which intermediary elements are involvedin these regulations? We answer the first question here,while deferring the latter to subsequent sections.
To find the key transcription factors that modulatethe observed transcriptional response, we use two sepa-rate statistical predictors, one based on the informationflow scores and the other based on the set of differen-tially expressed genes. These predictors allow us to assessthe significance of TFs with respect to their computa-tionally computed, top-ranked and experimentally vali-dated targets, respectively. In the first method, we calla transcription factor relevant if a significant fraction ofits target genes are highly-ranked in information flowmethod. Conversely, in the second method we define

Mohammadi et al. BMC Systems Biology 2013, 7:84 Page 8 of 17http://www.biomedcentral.com/1752-0509/7/84
Figure 6 TORC1-dependent regulation of Gap1. The schematicdiagram is based on literature evidence for the known interactions.Each node in the signaling pathway is annotated with the rank of itsinformation flow score from TORC1 and colored with its functionalclassification. Yellow nodes represent kinase associated proteins, rednodes are transcription factors, and blue node (Sit4) is a phosphatase.The rest of nodes have a default color of grey. Ranking of nodesbased on their information flow scores coincides with our priorknowledge on the structure of this pathway. Top/bottom rankednodes are discriminated using the computed cutoff value (l) based ondifferentially expressed genes. The “?” indicates an unknownunderlying mechanism, yet to be discovered, that connects TORC1 tothe rest of transcription factors.
the relevance in terms of the portion of its differentiallyexpressed targets (please see Equations 6-8 for details).
We use p-value(X = kT ) and p-value(Y = kP) andapply a cutoff value of ε = 0.01 to identify significant p-values computed for computational and experimental pre-dictions, respectively. At this threshold, we compute thesensitivity and specificity of information flow methods as0.2245 and 0.9846, respectively. The observed high speci-ficity value suggests that if targets of a given TF are not
differentially expressed, with high probability, our compu-tational model also reports it as a negative (it will not havesignificant number of top-ranked targets). In other words,transcription factors that are identified as significant usinginformation flow scores are highly precise. On the otherhand, the lower sensitivity score implies that even if a TFhas many differentially expressed targets, our computa-tional method may miss it. From this, we can concludethat transcription factors that have significant numbersof top-ranked targets are high-confidence candidate(s) asdownstream effectors of TORC1. However, there are caseswhere we may miss relevant transcription factors witha significant number of differentially expressed genes bythis approach. In the next section, we propose a statisti-cal framework to integrate information flow scores andexpression profiles to reliably identify the most relevantsubset of transcription factors that are involved in medi-ating the transcriptional response to TOR inhibition, andconsequently construct the effective response network ofTORC1.
Identifying the most relevant transcription factorsWe now seek to integrate experimental measurementsfrom rapamycin treatment, information flow scores, andthe transcription regulatory network into a unified frame-work to identify the most relevant transcription factors.To this end, we introduce the notion of relevance score.Let random variable Z denote the number of top-rankedpositive targets, and kTP denote the number of top-rankedpositive targets of a given TF. We define the relevancescore as − log(p-value(Z = kTP)). The relevance scoreassesses both positivity and rank of the targets for agiven TF (please see Equation 10 for details). Using thisapproach, we identify 17 TFs with high relevance scores,which are hypothesized to be responsible for the tran-scriptional changes in a TORC1-dependent manner. Thecomplete list of computed statistics for all transcriptionfactors is summarized in Additional file 4.
The top five transcription factors are listed in Table 1.Among these top-ranked, high confidence, transcrip-tion factors, Sfp1, Gln3, and Gcn4 are well-documenteddownstream effectors of TORC1 [48,59-61] (please seeZaman et al. [34], Smets et al. [40], and Loewith and Hall[32] for a more comprehensive review). Sfp1 is a stress-and nutrient-sensitive regulator of cell growth, respon-sible for mediating the expression of genes involved inribosome biogenesis, such as RP genes and RiBi factors[62,63]. TORC1 mediates Sfp1-related genes by phos-phorylating Sfp1 and regulating its nuclear localization[59]. Gln3, a GATA-family transcription factor, positivelyregulates the expression of nitrogen catabolite repres-sion (NCR)-sensitive genes [60,64]. TORC1-dependentregulation of Gln3 is mediated by promoting its associ-ation with its cytoplasmic anchor protein Ure2 [32,65].
Mohammadi et al. BMC Systems Biology 2013, 7:84 Page 9 of 17http://www.biomedcentral.com/1752-0509/7/84
Table 1 Top-ranked transcription factors with highconfidence scores
TF ORF TF name TF rank TF confidence
YLR403W SFP1 22 43.5048
YER040W GLN3 148 57.7734
YML007W YAP1 618 24.3672
YEL009C GCN4 638 4.822
YHR084W STE12 825 2.9668
Gcn4 is a nutrient-responsive transcription factor, whichis activated upon amino acid starvation [66]. TORC1regulates Gcn4 by mediating its translation level in aeIF2α-dependent manner [32]. Interestingly, Steffen et al.[61] also proposed a critical role for Gcn4 in mediatinglife-span in yeast.
However, to the best of our knowledge, Ste12 andYap1 have not been previously positioned downstreamof TORC1. Ste12 is best known as a downstream tar-get of mitogen-activated protein kinase (MAPK) sig-naling cascade and is responsible for regulating genesinvolved in mating or pseudohyphal/invasive growth [67].Rutherford et al. [68] show that over-expression of theammonium permease Mep2 induces the transcription ofknown targets of Ste12. A more recent study by Santoset al. [69] additionally positions TORC1 downstream ofMep2, which, taken together with the link between Mep2-Ste12, suggests Ste12 as a potential downstream effectorof TORC1. Yap1 is an AP-1 family transcription factorrequired for inducing oxidative [70,71] and carbon [72]stress responses, the latter is proposed to be independentof TORC1. Additionally, Yap1 expression has been shownto increase significantly during replicative aging [73]. Ithas been suggested that spermidine, a conserved longevityfactor [74], mediates macroautophagy in a Yap1 and Gcn4dependent manner [75]. Finally, there is a diverse set ofage-related functions associated with Yap1, many of whichare also attributed to TORC1. These observations sug-gest Yap1 as a potential candidate downstream effector ofTORC1.
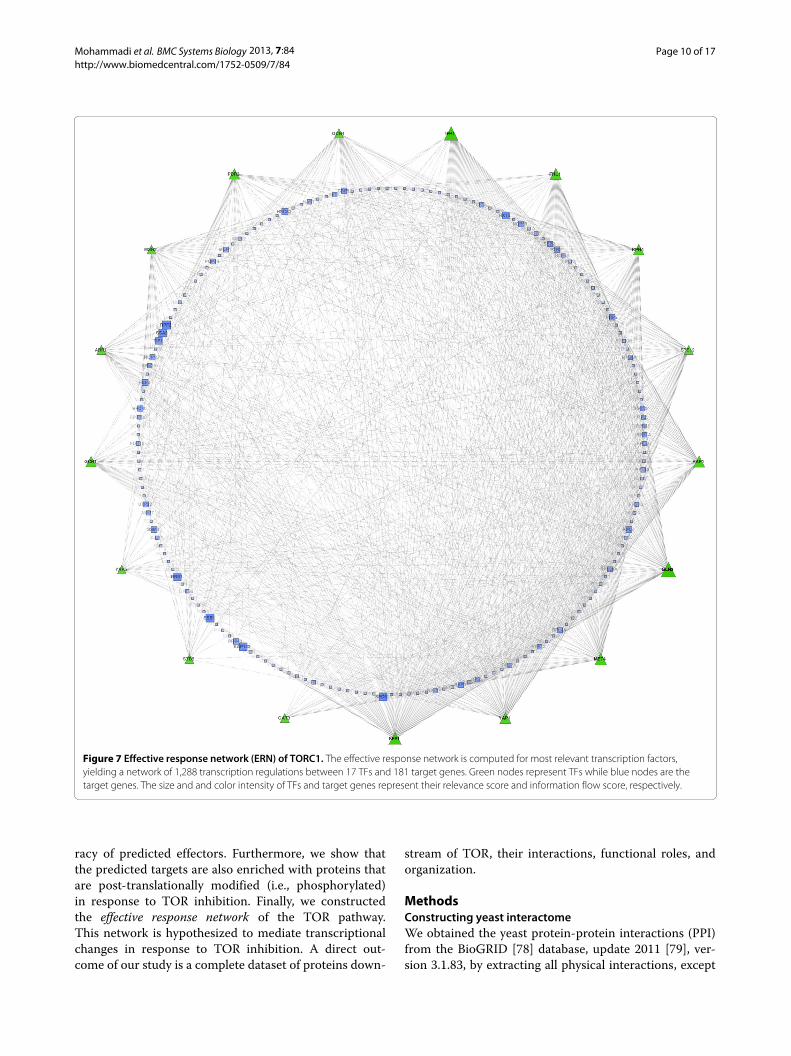
Constructing the effective response network of TORC1To uncover the regulatory mechanisms that mediate theresponse to TOR inhibition, we construct the effectiveresponse network (ERN) of TORC1, which is illustratedin Figure 7 and is available for download as Additionalfile 5. Node attributes for this network are available fordownload separately as Additional file 6. This networkconsists of the most relevant TFs, together with their top-ranked positive targets, with a total of 1,288 regulatoryinteractions between 17 transcription factors and 181target genes.
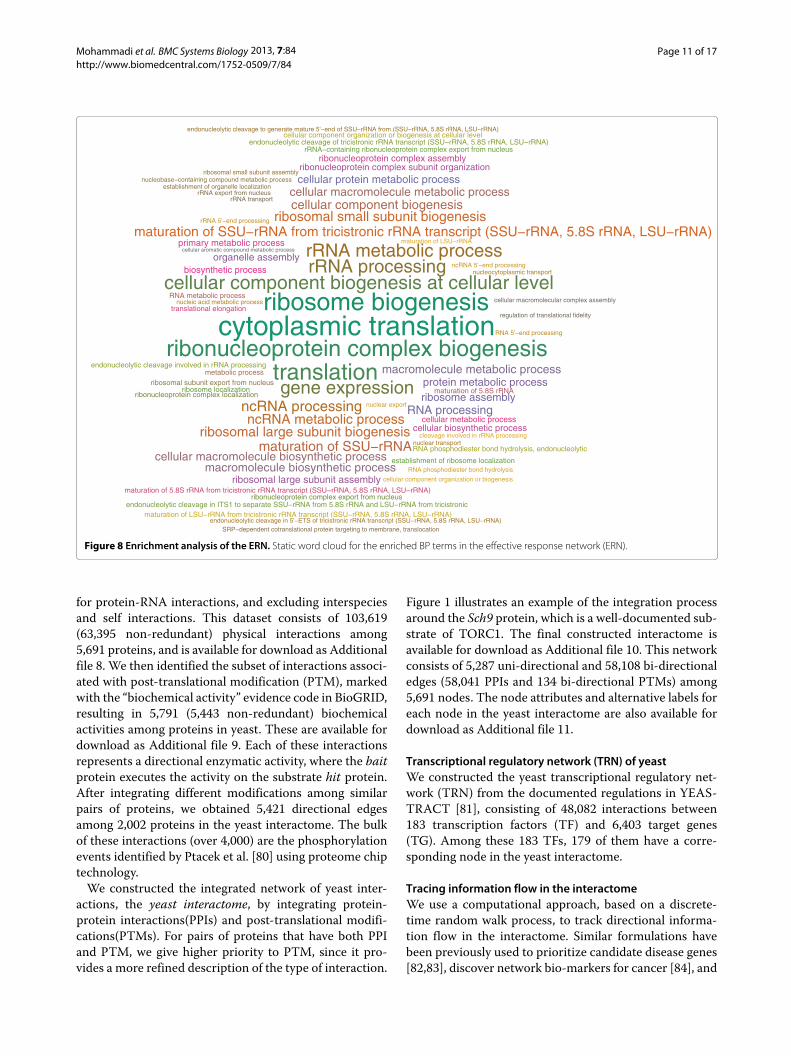
In order to better understand the functional roles ofthe predicted targets, we use FIDEA [76] to identifyenriched GO terms under the biological process (BP)branch. Figure 8 illustrates the static word cloud ofthe enriched terms, as generated by FIDEA, the com-plete list of which is available for download as Addi-tional file 7. Unlike the enrichment map of TORC1,which spans a variety of different functions, targets inthe effective response network (ERN) are almost exclu-sively involved in ribosome biogenesis and the cellulartranslation process. Ribosome biogenesis is one of themost energy-consuming tasks in the cell that is directlylinked to the rate of translation and is required for cellgrowth [77]. Calorie restriction, or alternatively inhibitingTORC1 by Rapamycin treatment, is known to coordi-nately regulate this process via a complex set of path-ways involving transcription factors Ifh1, Sfp1, Fhl1, andRap1 [77]. Interestingly, all four of these transcriptionfactors are identified by our method among the top 6TFs with the highest relevance scores (together withGcn3 and Met4). The effective response network pro-vides a refined view of how yeast cells re-wire variousaspects of ribosome biogenesis in order to modulate cellgrowth. This network can be used to gain a detailedunderstanding of the regulatory mechanisms that areresponsible for TOR-dependent transcriptional changesin yeast.
ConclusionsUnderstanding various processes associated with aginghas important implications for the diagnosis, prog-nosis, and treatment of age-related pathologies. Cur-rent methods for constructing aging pathways rely ondetailed experiments that study cellular response to care-fully controlled signals. This process is expensive, time-consuming, and typically restricted to specific aspects ofcellular response. In this study, we presented a comple-mentary, computational approach that aims to constructdetailed aging pathways using the yeast interactome byinitiating random walks at proteins that are key play-ers in the aging process (the target of rapamycin orTOR, in this study). At the heart of our method is arigorous statistical and computational framework thatidentifies significant effector proteins and provides infor-mation about the specific mechanisms associated withthem.
We present comprehensive validation of our computa-tional results through GO enrichment studies and man-ual curation to show that our method identifies mostof the known proteins downstream from TOR, whileidentifying several new proteins for future experimentalinvestigations. Additionally, we showed that informationflow scores faithfully predict transcriptional changes inresponse to rapamycin-treatment, which validates accu-
Mohammadi et al. BMC Systems Biology 2013, 7:84 Page 10 of 17http://www.biomedcentral.com/1752-0509/7/84
Figure 7 Effective response network (ERN) of TORC1. The effective response network is computed for most relevant transcription factors,yielding a network of 1,288 transcription regulations between 17 TFs and 181 target genes. Green nodes represent TFs while blue nodes are thetarget genes. The size and and color intensity of TFs and target genes represent their relevance score and information flow score, respectively.
racy of predicted effectors. Furthermore, we show thatthe predicted targets are also enriched with proteins thatare post-translationally modified (i.e., phosphorylated)in response to TOR inhibition. Finally, we constructedthe effective response network of the TOR pathway.This network is hypothesized to mediate transcriptionalchanges in response to TOR inhibition. A direct out-come of our study is a complete dataset of proteins down-
stream of TOR, their interactions, functional roles, andorganization.
MethodsConstructing yeast interactomeWe obtained the yeast protein-protein interactions (PPI)from the BioGRID [78] database, update 2011 [79], ver-sion 3.1.83, by extracting all physical interactions, except
Mohammadi et al. BMC Systems Biology 2013, 7:84 Page 11 of 17http://www.biomedcentral.com/1752-0509/7/84
cytoplasmic translationribosome biogenesis
ribonucleoprotein complex biogenesistranslation
cellular component biogenesis at cellular level
gene expression
rRNA processingrRNA metabolic process
ncRNA processingncRNA metabolic process
maturation of SSU−rRNA from tricistronic rRNA transcript (SSU−rRNA, 5.8S rRNA, LSU−rRNA)ribosomal small subunit biogenesis
ribosomal large subunit biogenesismaturation of SSU−rRNA
cellular component biogenesiscellular macromolecule metabolic process
cellular macromolecule biosynthetic processmacromolecule biosynthetic process
macromolecule metabolic process
RNA processing
cellular protein metabolic process
ribosome assemblyprotein metabolic process
organelle assembly
ribosomal large subunit assembly
ribonucleoprotein complex subunit organization
cellular biosynthetic process
ribonucleoprotein complex assembly
primary metabolic process
biosynthetic process
cellular metabolic process
translational elongation
maturation of 5.8S rRNA from tricistronic rRNA transcript (SSU−rRNA, 5.8S rRNA, LSU−rRNA)
maturation of 5.8S rRNA
RNA metabolic process
metabolic processribosomal subunit export from nucleus
ribonucleoprotein complex localization
ribonucleoprotein complex export from nucleus
ribosome localization
establishment of ribosome localization
rRNA−containing ribonucleoprotein complex export from nucleus
endonucleolytic cleavage in ITS1 to separate SSU−rRNA from 5.8S rRNA and LSU−rRNA from tricistronic
endonucleolytic cleavage of tricistronic rRNA transcript (SSU−rRNA, 5.8S rRNA, LSU−rRNA)
endonucleolytic cleavage involved in rRNA processing
RNA phosphodiester bond hydrolysis, endonucleolytic
cellular component organization or biogenesis at cellular level
maturation of LSU−rRNA from tricistronic rRNA transcript (SSU−rRNA, 5.8S rRNA, LSU−rRNA)
cellular component organization or biogenesis
maturation of LSU−rRNA
cleavage involved in rRNA processing
RNA phosphodiester bond hydrolysis
nuclear export
ncRNA 5'−end processing
rRNA 5'−end processing
RNA 5'−end processing
nucleic acid metabolic process
nucleocytoplasmic transport
nuclear transport
endonucleolytic cleavage in 5'−ETS of tricistronic rRNA transcript (SSU−rRNA, 5.8S rRNA, LSU−rRNA)
endonucleolytic cleavage to generate mature 5'−end of SSU−rRNA from (SSU−rRNA, 5.8S rRNA, LSU−rRNA)
ribosomal small subunit assemblynucleobase−containing compound metabolic process
establishment of organelle localization
SRP−dependent cotranslational protein targeting to membrane, translocation
rRNA export from nucleusrRNA transport
regulation of translational fidelity
cellular macromolecular complex assembly
cellular aromatic compound metabolic process
Figure 8 Enrichment analysis of the ERN. Static word cloud for the enriched BP terms in the effective response network (ERN).
for protein-RNA interactions, and excluding interspeciesand self interactions. This dataset consists of 103,619(63,395 non-redundant) physical interactions among5,691 proteins, and is available for download as Additionalfile 8. We then identified the subset of interactions associ-ated with post-translational modification (PTM), markedwith the “biochemical activity” evidence code in BioGRID,resulting in 5,791 (5,443 non-redundant) biochemicalactivities among proteins in yeast. These are available fordownload as Additional file 9. Each of these interactionsrepresents a directional enzymatic activity, where the baitprotein executes the activity on the substrate hit protein.After integrating different modifications among similarpairs of proteins, we obtained 5,421 directional edgesamong 2,002 proteins in the yeast interactome. The bulkof these interactions (over 4,000) are the phosphorylationevents identified by Ptacek et al. [80] using proteome chiptechnology.
We constructed the integrated network of yeast inter-actions, the yeast interactome, by integrating protein-protein interactions(PPIs) and post-translational modifi-cations(PTMs). For pairs of proteins that have both PPIand PTM, we give higher priority to PTM, since it pro-vides a more refined description of the type of interaction.
Figure 1 illustrates an example of the integration processaround the Sch9 protein, which is a well-documented sub-strate of TORC1. The final constructed interactome isavailable for download as Additional file 10. This networkconsists of 5,287 uni-directional and 58,108 bi-directionaledges (58,041 PPIs and 134 bi-directional PTMs) among5,691 nodes. The node attributes and alternative labels foreach node in the yeast interactome are also available fordownload as Additional file 11.
Transcriptional regulatory network (TRN) of yeastWe constructed the yeast transcriptional regulatory net-work (TRN) from the documented regulations in YEAS-TRACT [81], consisting of 48,082 interactions between183 transcription factors (TF) and 6,403 target genes(TG). Among these 183 TFs, 179 of them have a corre-sponding node in the yeast interactome.
Tracing information flow in the interactomeWe use a computational approach, based on a discrete-time random walk process, to track directional informa-tion flow in the interactome. Similar formulations havebeen previously used to prioritize candidate disease genes[82,83], discover network bio-markers for cancer [84], and
Mohammadi et al. BMC Systems Biology 2013, 7:84 Page 12 of 17http://www.biomedcentral.com/1752-0509/7/84
identify protein complexes [85,86]. Additionally, there isa known correspondence between random-walk methodson undirected graphs and formulations based on circuitnetwork models [87]. Our formulation takes into accountboth network distances, as well as multiplicity of pathsbetween pairs of proteins. It also benefits from usingedge directions (when available) to discriminate betweenupstream regulators and downstream effectors.
Let G = (V , E) be a mixed graph, having both directedand undirected edges. Each node in V corresponds to aprotein and edge (u, v) ∈ E iff protein u interacts withprotein v in the integrated network. Graph G can be repre-sented using its adjacency matrix A, where Aij = 1, if nodei has a directed edge to node j, and is 0 otherwise. Undi-rected edges are replaced by a pair of directed edges ineach direction. A random walk on G, initiated from vertexv, is defined as a sequence of transitions among vertices,starting from v. At each step, the random walker randomlychooses the next vertex from among the neighbors of thecurrent node. The sequence of visited vertices generatedby this random process is a Markov chain, since the choiceof next vertex depends only on the current node. We canrepresent the transition matrix of this Markov process asa column-stochastic matrix, P, where pij = Pr(St+1 =vi|St = vj), and random variable St represents the state ofthe random walk at the time step t.
Random walk with restart (RWR) is a modified Markovchain in which, at each step, a random walker has thechoice of either continuing along its path, with probabilityα, or jump (teleport) back to the initial vertex, with prob-ability 1 − α. Given the transition matrix of the originalrandom walk process, P, the transition matrix of the mod-ified chain, M, can be computed as M = αP+(1−α)ev1T ,where ev is a stochastic vector of size n having zeroseverywhere, except at index v, and 1 is a vector of allones. The stationary distribution of the modified chain,πv(α), defines the portion of time spent on each nodein an infinite random walk with restart initiated at nodev, with parameter α. This stationary distribution can becomputed as follows:
πv(α) = Mπv(α)
= (αP + (1 − α)ev1T )πv(α)(1)
Enforcing a unit norm on the dominant eigenvector toensure its stochastic property, ‖ πv(α) ‖1= 1Tπv = 1, wewill have the following iterative form:
πv(α) = αPπv(α) + (1 − α)ev, (2)
which is a special case of the personalized PageRank[88-91], with preference vector ev. Alternatively, we can
compute πv directly by solving the following linearsystem:
πv(α) = (1 − α)(I − αP)−1︸ ︷︷ ︸
Q
ev, (3)
where the right-multiplication with ev simply selects col-umn v of the matrix Q. The factor 1 − α can be viewedas the decay factor of the signal; the higher the parameterα, the further the signal can propagate. Let us denote byrandom variable R the number of hops taken by randomwalker before it jumps back to source node v. Then, R fol-lows a geometric distribution with probability of success(1 − α) and the expected (mean) length of paths taken byrandom walker can be computed as E(R) = α
1−α. In other
words, if we let α = d1+d , for a given value of d, we expect
the average length of paths taken by such a random walk tobe equivalent to d, thus we call d the depth of the randomwalk.
Cross-validating information flow scores with the set ofdifferentially expressed genes in response to TORinhibitionGiven the list of gene products ranked by their informa-tion flow scores, we want to assess the enrichment ofdifferentially expressed genes, in response to rapamycintreatment, among top-ranked proteins.
The classical approach to this problem is to select a pre-defined cutoff on ranks, denoted by l, which separates thetop-ranked genes (target set) from the rest (backgroundset), and then compute the enrichment p-value usingthe hypergeometric distribution. Let us denote the totalnumber of gene products by N and the total number ofdifferentially expressed genes (true positives) by A. Usinga similar notation as Eden et al. [57], we encode theseannotations using a binary vector, λ = λ1, λ2, . . . λN ∈{0, 1}N , having exactly A ones and N − A zeros. Let therandom variable T denote the number of positive genesin the target set, if we distribute genes randomly. In thisformulation, the hypergeometric p-value is defined as:
p-value(T = bl(λ)) = Prob(bl(λ) ≤ T)
= HGT(bl(λ)|N , A, l)
=min(A,l)∑
t=bl(λ)
C(A, t)C(N − A, l − t)C(N , l)
,
(4)
where HGT is the tail of hypergeometric distribution, andbl(λ) = ∑l
i=1 λi, is the number of observed positives inthe target set. The drawback of this approach is that weneed a predefined cutoff value, l. To remedy this, Edenet al. [57] propose a two-step method for computing theexact enrichment p-value, called mHG p-value, without
Mohammadi et al. BMC Systems Biology 2013, 7:84 Page 13 of 17http://www.biomedcentral.com/1752-0509/7/84
the need for a predefined cutoff value of l. In the firststep of this process, we identify an optimal cut, over allpossible cuts, which minimizes the hypergeometric score.The value computed in this manner is called the minimumhypergeometric (mHG) score, and is defined as:
mHG(λ) = min1≤l≤N HGT(bl(λ)|N , A, l) (5)
Next, we use a dynamic programming (DP) method tocompute the exact p-value of the observed mHG score, inthe state space of all possible λ vectors with size N hav-ing exactly A ones (please refer to Eden et al. [57] foralgorithmic details, and Eden [92] for an efficient imple-mentation). We adopt this strategy to cross-validate ourresults with the transcriptome profile of yeast cells inresponse to rapamycin treatment. We subsequently definethe enrichment plot, which illustrates the absolute value ofthe logarithm of the HG score as a function of cutoff per-centage. The minimum hypergeometric (mHG) score canbe viewed as the peak of this plot, and the correspond-ing exact p-value can be computed for this peak using theaforementioned DP algorithm.
Assessing the sensitivity and the specificity of informationflow scoresGiven an optimal cutoff length l (computed for differ-entially expressed genes in response to TOR inhibition),which partitions nodes into top/bottom ranked proteins,together with a transcription factor (TF) of interest, pi,we are interested in assessing the importance of pi inmediating the observed transcriptional response. In otherwords, given that pi has a significant number of top-ranked targets, how confident are we that it will also havea significant number of differentially expressed targets?Conversely, if pi has many differentially expressed targets,how likely is it to see its targets among top-ranked genes?
Let us denote the total number of targets of TF pi byk, and the number of its positive (differentially expressed)and top-ranked (in information flow) targets by kP andkT , respectively. Let the random variable X be the numberof top-ranked targets, if we were uniformly distributing ktargets of pi among all genes in the yeast interactome. Sim-ilarly, let Y be the number of positive targets of pi, if wedistribute positive targets uniformly. Then, we can com-pute the following p-values for top-ranked and positivetargets, respectively:
p-value(X = kT ) = Prob(kT ≤ X)
= HGT(kT |N , l, k)
=min(l,k)∑
x=kT
C(l, x)C(N − l, k − x)
C(N , k)
(6)
p-value(Y = kP) = Prob(kP ≤ Y )
= HGT(kP|N , A, k)
=min(A,k)∑
y=kP
C(A, y)C(N − A, k − y)C(N , k)
(7)
After correcting for multiple hypothesis testing usingBonferroni method, we use a given threshold value of ε
and define the sensitivity and specificity for the entire setof transcription factors as:
sensitivity = Prob(p-value(X = kT )
≤ ε|p-value(Y = kP) ≤ ε)
specificity = Prob(ε < p-value(X = kT )|ε< p-value(Y = kP))
(8)
The motivation behind our approach is that the set oftranscription factors with a significant number of differ-entially expressed targets provides us with an experimen-tally validated set of key factors, whereas transcriptionfactors that have a significant number of top-ranked tar-gets act as computational predictions for identifying themost relevant TFs. Let TP be the number of identifiedtrue positives, P be the total number of positives, andFN be the number of false negatives. The sensitivity of amethod, defined as TP
P = TPTP+FN , measures the fraction
of positive instances (transcription factors having a signif-icant number of differentially expressed targets) that arealso predicted using the information flow method (com-putational predictions). Conversely, let TN be the numberof true negatives identified by the method and N be thetotal number of negatives. Specificity, formally defined asTNN = TN
TN+FP , corresponds to the fraction of irrelevantTFs, computed based on the experimental dataset, that arealso identified as irrelevant by our computational predic-tions. These two measures are closely related to type I andII errors as follows:
Type I error(α) = False-positive-rate(FPR)
= 1 − specificityType II error(β) = False-negative-rate(FNR)
= 1 − sensitivity
(9)
Integrating computational predictions with experimentaldatasetsGiven the set of differentially expressed genes in responseto rapamycin treatment, the computed information flowscores, and the transcriptional regulatory network (TRN)of yeast, we aim to construct an integrative statisti-cal framework to identify the most relevant transcrip-tion factors with respect to mediating the transcriptional
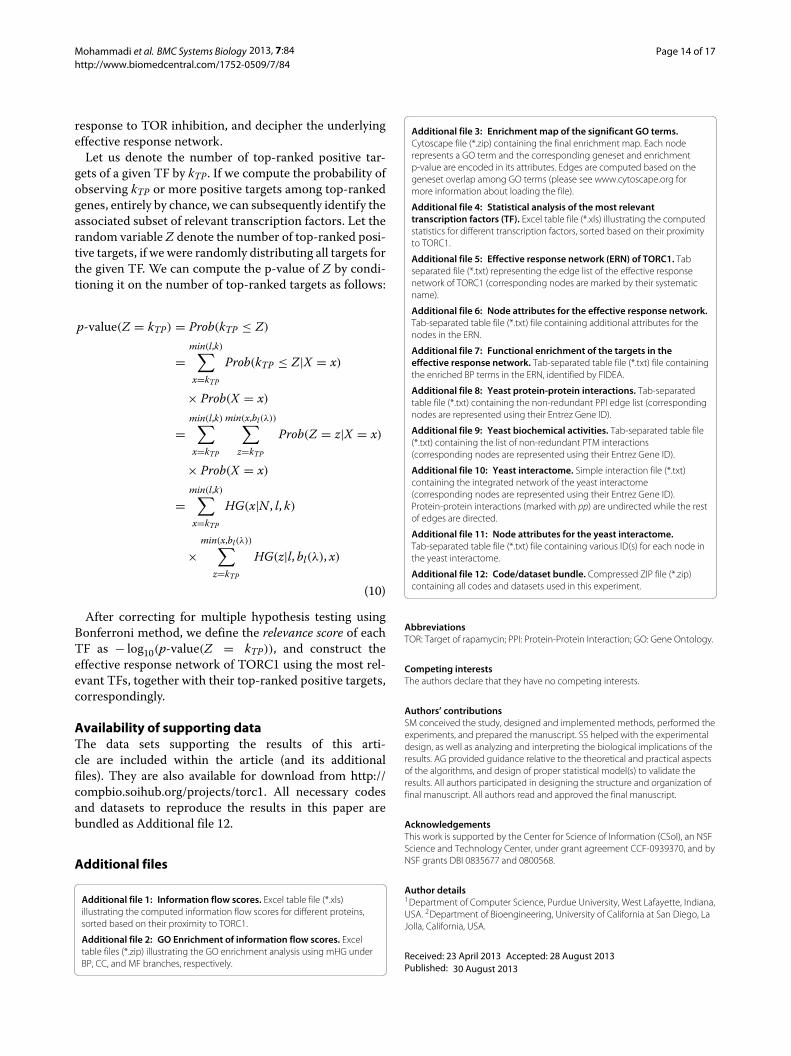
Mohammadi et al. BMC Systems Biology 2013, 7:84 Page 14 of 17http://www.biomedcentral.com/1752-0509/7/84
response to TOR inhibition, and decipher the underlyingeffective response network.
Let us denote the number of top-ranked positive tar-gets of a given TF by kTP. If we compute the probability ofobserving kTP or more positive targets among top-rankedgenes, entirely by chance, we can subsequently identify theassociated subset of relevant transcription factors. Let therandom variable Z denote the number of top-ranked posi-tive targets, if we were randomly distributing all targets forthe given TF. We can compute the p-value of Z by condi-tioning it on the number of top-ranked targets as follows:
p-value(Z = kTP) = Prob(kTP ≤ Z)
=min(l,k)∑
x=kTP
Prob(kTP ≤ Z|X = x)
× Prob(X = x)
=min(l,k)∑
x=kTP
min(x,bl(λ))∑
z=kTP
Prob(Z = z|X = x)
× Prob(X = x)
=min(l,k)∑
x=kTP
HG(x|N , l, k)
×min(x,bl(λ))∑
z=kTP
HG(z|l, bl(λ), x)
(10)
After correcting for multiple hypothesis testing usingBonferroni method, we define the relevance score of eachTF as − log10(p-value(Z = kTP)), and construct theeffective response network of TORC1 using the most rel-evant TFs, together with their top-ranked positive targets,correspondingly.
Availability of supporting dataThe data sets supporting the results of this arti-cle are included within the article (and its additionalfiles). They are also available for download from http://compbio.soihub.org/projects/torc1. All necessary codesand datasets to reproduce the results in this paper arebundled as Additional file 12.
Additional files
Additional file 1: Information flow scores. Excel table file (*.xls)illustrating the computed information flow scores for different proteins,sorted based on their proximity to TORC1.
Additional file 2: GO Enrichment of information flow scores. Exceltable files (*.zip) illustrating the GO enrichment analysis using mHG underBP, CC, and MF branches, respectively.
Additional file 3: Enrichment map of the significant GO terms.Cytoscape file (*.zip) containing the final enrichment map. Each noderepresents a GO term and the corresponding geneset and enrichmentp-value are encoded in its attributes. Edges are computed based on thegeneset overlap among GO terms (please see www.cytoscape.org formore information about loading the file).
Additional file 4: Statistical analysis of the most relevanttranscription factors (TF). Excel table file (*.xls) illustrating the computedstatistics for different transcription factors, sorted based on their proximityto TORC1.
Additional file 5: Effective response network (ERN) of TORC1. Tabseparated file (*.txt) representing the edge list of the effective responsenetwork of TORC1 (corresponding nodes are marked by their systematicname).
Additional file 6: Node attributes for the effective response network.Tab-separated table file (*.txt) file containing additional attributes for thenodes in the ERN.
Additional file 7: Functional enrichment of the targets in theeffective response network. Tab-separated table file (*.txt) file containingthe enriched BP terms in the ERN, identified by FIDEA.
Additional file 8: Yeast protein-protein interactions. Tab-separatedtable file (*.txt) containing the non-redundant PPI edge list (correspondingnodes are represented using their Entrez Gene ID).
Additional file 9: Yeast biochemical activities. Tab-separated table file(*.txt) containing the list of non-redundant PTM interactions(corresponding nodes are represented using their Entrez Gene ID).
Additional file 10: Yeast interactome. Simple interaction file (*.txt)containing the integrated network of the yeast interactome(corresponding nodes are represented using their Entrez Gene ID).Protein-protein interactions (marked with pp) are undirected while the restof edges are directed.
Additional file 11: Node attributes for the yeast interactome.Tab-separated table file (*.txt) file containing various ID(s) for each node inthe yeast interactome.
Additional file 12: Code/dataset bundle. Compressed ZIP file (*.zip)containing all codes and datasets used in this experiment.
AbbreviationsTOR: Target of rapamycin; PPI: Protein-Protein Interaction; GO: Gene Ontology.
Competing interestsThe authors declare that they have no competing interests.
Authors’ contributionsSM conceived the study, designed and implemented methods, performed theexperiments, and prepared the manuscript. SS helped with the experimentaldesign, as well as analyzing and interpreting the biological implications of theresults. AG provided guidance relative to the theoretical and practical aspectsof the algorithms, and design of proper statistical model(s) to validate theresults. All authors participated in designing the structure and organization offinal manuscript. All authors read and approved the final manuscript.
AcknowledgementsThis work is supported by the Center for Science of Information (CSoI), an NSFScience and Technology Center, under grant agreement CCF-0939370, and byNSF grants DBI 0835677 and 0800568.
Author details1Department of Computer Science, Purdue University, West Lafayette, Indiana,USA. 2Department of Bioengineering, University of California at San Diego, LaJolla, California, USA.
Received: 23 April 2013 Accepted: 28 August 2013Published: 30 August 2013

Mohammadi et al. BMC Systems Biology 2013, 7:84 Page 15 of 17http://www.biomedcentral.com/1752-0509/7/84
References1. Fontana L, Partridge L, Longo VD: Extending healthy life span–from
yeast to humans. Science (New York, N.Y.) 2010, 328(5976):321–326.2. Bishop NA, Guarente L: Genetic links between diet and lifespan:
shared mechanisms from yeast to humans. Nat Rev Genet 2007,8(11):835–844.
3. Kaeberlein M: Lessons on longevity from budding yeast. Nature 2010,464(7288):513–519.
4. Campisi J: Aging, cellular senescence, and cancer. Annu Rev Physiol2013, 75:685–705.
5. Provinciali M, Cardelli M, Marchegiani F, Pierpaoli E: Impact of cellularsenescence in aging and cancer. Curr Pharm Des 2013, 19(9):1699–709.
6. Colman RJ, Anderson RM, Johnson SC, Kastman EK, Kosmatka KJ, BeasleyTM, Allison DB, Cruzen C, Simmons HA, Kemnitz JW, Weindruch R: Caloricrestriction delays disease onset and mortality in rhesus monkeys.Science (New York, N.Y.) 2009, 325(5937):201–204.
7. Finkel T, Serrano M, Blasco MA: The common biology of cancer andageing. Nature 2007, 448(7155):767–774.
8. North BJ, Sinclair DA: The intersection between aging andcardiovascular disease. Circ Res 2012, 110(8):1097–108.
9. Leritz EC, McGlinchey RE, Kellison I, Rudolph JL, Milberg WP:Cardiovascular disease risk factors and cognition in the elderly. CurrCardiovasc Risk Rep 2011, 5(5):407–412.
10. Cruzen C, Colman RJ: Effects of caloric restriction on cardiovascularaging in non-human primates and humans. Clin Geriatr Med 2009,25(4):733–43, ix–x.
11. Mattson MP, Wan R: Beneficial effects of intermittent fasting andcaloric restriction on the cardiovascular and cerebrovascularsystems. J Nutr Biochem 2005, 16(3):129–137.
12. Collier TJ, Kanaan NM, Kordower JH: Ageing as a primary risk factor forParkinson’s disease: evidence from studies of non-human primates.Nat Rev Neurosci 2011, 12(6):359–366.
13. Dartigues JF, Féart C: Risk factors for Alzheimer disease: aging beyondage? Neurology 2011, 77(3):206–207.
14. Duan W, Ross CA: Potential therapeutic targets forneurodegenerative diseases: lessons learned from calorierestriction. Curr Drug Targets 2010, 11(10):1281–1292.
15. Noorbakhsh F, Overall CM, Power C: Deciphering complex mechanismsin neurodegenerative diseases: the advent of systems biology.Trends Neurosci 2009, 32(2):88–100.
16. Maswood N, Young J, Tilmont E, Zhang Z, Gash DM, Gerhardt GA,Grondin R, Roth GS, Mattison J, Lane MA, Carson RE, Cohen RM, MoutonPR, Quigley C, Mattson MP, Ingram DK: Caloric restriction increasesneurotrophic factor levels and attenuates neurochemical andbehavioral deficits in a primate model of Parkinson’s disease. ProcNatl Acad Sci USA 2004, 101(52):18171–18176.
17. Wu P, Shen Q, Dong S, Xu Z, Tsien JZ, Hu Y: Calorie restrictionameliorates neurodegenerative phenotypes in forebrain-specificpresenilin-1 and presenilin-2 double knockout mice. Neurobiol Aging2008, 29(10):1502–1511.
18. Campisi J, Andersen JK, Kapahi P, Melov S: Cellular senescence: a linkbetween cancer and age-related degenerative disease? Semin CancerBiol 2011, 21(6):354–359.
19. Kaeberlein M, Burtner CR, Kennedy BK: Recent developments in yeastaging. PLoS Genet 2007, 3(5):e84.
20. Lin SJ, Defossez PA, Guarente L: Requirement of NAD and SIR2 forlife-span extension by calorie restriction in Saccharomycescerevisiae. Science (New York, N.Y.) 2000, 289(5487):2126–2128.
21. Kaeberlein M, Kirkland KT, Fields S, Kennedy BK: Sir2-independent lifespan extension by calorie restriction in yeast. PLoS Biol 2004, 2(9):E296.
22. Smith DL, McClure JM, Matecic M, Smith JS: Calorie restriction extendsthe chronological lifespan of Saccharomyces cerevisiaeindependently of the Sirtuins. Aging cell 2007, 6(5):649–662.
23. Kaeberlein M, Powers RW, Steffen KK, Westman EA, Hu D, Dang N, Kerr EO,Kirkland KT, Fields S, Kennedy BK: Regulation of yeast replicative lifespan by TOR and Sch9 in response to nutrients. Science (New York,N.Y.) 2005, 310(5751):1193–1196.
24. Heitman J, Movva NR, Hall MN: Targets for cell cycle arrest by theimmunosuppressant rapamycin in yeast. Science (New York, N.Y.) 1991,253(5022):905–909.
25. Loewith R, Jacinto E, Wullschleger S, Lorberg A, Crespo JL, Bonenfant D,Oppliger W, Jenoe P, Hall MN: Two TOR complexes, only one of whichis rapamycin sensitive, have distinct roles in cell growth control. MolCell 2002, 10(3):457–468.
26. Wedaman KP, Reinke A, Anderson S, Yates J, McCaffery JM,Powers T: Tor kinases are in distinct membrane-associated proteincomplexes in Saccharomyces cerevisiae. Mol Biol Cell 2003,14(3):1204–1220.
27. Reinke A, Anderson S, McCaffery JM, Yates J, Aronova S, Chu S, FaircloughS, Iverson C, Wedaman KP, Powers T: TOR complex 1 includes a novelcomponent, Tco89p (YPL180w), and cooperates with Ssd1p tomaintain cellular integrity in Saccharomyces cerevisiae. J Biol Chem2004, 279(15):14752–14762.
28. Wullschleger S, Loewith R, Hall MN: TOR signaling in growth andmetabolism. Cell 2006, 124(3):471–484.
29. Kapahi P, Chen D, Rogers AN, Katewa SD, Li PWL, Thomas EL, Kockel L:With TOR, less is more: a key role for the conserved nutrient-sensingTOR pathway in aging. Cell Metab 2010, 11(6):453–465.
30. McCormick MA, Tsai SY, Kennedy BK: TOR and ageing: a complexpathway for a complex process. Philos Trans R Soc Lond B Biol Sci 2011,366(1561):17–27.
31. De Virgilio C, Loewith R: Cell growth control: little eukaryotes makebig contributions. Oncogene 2006, 25(48):6392–6415.
32. Loewith R, Hall MN: Target of rapamycin (TOR) in nutrient signalingand growth control. Genetics 2011, 189(4):1177–1201.
33. De Virgilio C, Loewith R: The TOR signalling network from yeast toman. Int J Biochem Cell Biol 2006, 38(9):1476–1481.
34. Zaman S, Lippman SI, Zhao X, Broach JR: How Saccharomyces respondsto nutrients. Annu Rev Genet 2008, 42:27–81.
35. Wei Y, Zheng XFS: Nutritional control of cell growth via TOR signalingin budding yeast. Methods Mol Biol (Clifton, N.J.) 2011, 759:307–319.
36. Le Couteur DG, McLachlan AJ, Quinn RJ, Simpson SJ, de Cabo R: Agingbiology and novel targets for drug discovery. J Gerontol A Biol Sci MedSci 2012, 67(2):168–174.
37. Naylor RM, Baker DJ, van Deursen JM: Senescent cells: a noveltherapeutic target for aging and age-related diseases. Clin PharmacolTher 2013, 93:105–116.
38. Binda M, Péli-Gulli MP, Bonfils G, Panchaud N, Urban J, Sturgill TW,Loewith R, De Virgilio C: The Vam6 GEF controls TORC1 by activatingthe EGO complex. Mol Cell 2009, 35(5):563–573.
39. Neklesa TK, Davis RW: A genome-wide screen for regulators of TORC1in response to amino acid starvation reveals a conserved Npr2/3complex. PLoS Genet 2009, 5(6):e1000515.
40. Smets B, Ghillebert R, De Snijder P, Binda M, Swinnen E, De Virgilio C,Winderickx J: Life in the midst of scarcity: adaptations to nutrientavailability in Saccharomyces cerevisiae. Curr Genet 2010, 56:1–32.
41. Kuranda K, Leberre V, Sokol S, Palamarczyk G, François J: Investigatingthe caffeine effects in the yeast Saccharomyces cerevisiae bringsnew insights into the connection between TOR , PKC and Ras/cAMPsignalling pathways. Mol Microbiol 2006, 61(5):1147–1166.
42. Wanke V, Cameroni E, Uotila A, Piccolis M, Urban J, Loewith R, De VirgilioC: Caffeine extends yeast lifespan by targeting TORC1. Mol Microbiol2008, 69:277–285.
43. Chang YY, Juhász G, Goraksha-Hicks P, Arsham AM, Mallin DR, Muller LK,Neufeld TP: Nutrient-dependent regulation of autophagy throughthe target of rapamycin pathway. Biochem Soc Trans 2009,37(Pt 1):232–236.
44. Gasch AP, Werner-Washburne M: The genomics of yeast responses toenvironmental stress and starvation. Funct Integr Genomics 2002,2(4–5):181–192.
45. Jorgensen P, Rupes I, Sharom JR, Schneper L, Broach JR, Tyers M: Adynamic transcriptional network communicates growth potentialto ribosome synthesis and critical cell size. Genes Dev 2004,18(20):2491–2505.
46. Barbet NC, Schneider U, Helliwell SB, Stansfield I, Tuite MF, Hall MN: TORcontrols translation initiation and early G1 progression in yeast. MolBiol Cell 1996, 7:25–42.
47. Schmidt A, Beck T, Koller A, Kunz J, Hall MN: The TOR nutrient signallingpathway phosphorylates NPR1 and inhibits turnover of thetryptophan permease. EMBO J 1998, 17(23):6924–6931.
Mohammadi et al. BMC Systems Biology 2013, 7:84 Page 16 of 17http://www.biomedcentral.com/1752-0509/7/84
48. Beck T, Hall MN: The TOR signalling pathway controls nuclearlocalization of nutrient-regulated transcription factors. Nature 1999,402(6762):689–692.
49. Ashburner M, Ball CA, Blake JA, Botstein D, Butler H, Cherry JM, Davis AP,Dolinski K, Dwight SS, Eppig JT, Harris MA, Hill DP, Issel-Tarver L, KasarskisA, Lewis S, Matese JC, Richardson JE, Ringwald M, Rubin GM, Sherlock G:Gene ontology: tool for the unification of biology. The GeneOntology Consortium. Nat Genet 2000, 25:25–29.
50. Eden E, Navon R, Steinfeld I, Lipson D, Yakhini Z: GOrilla: a tool fordiscovery and visualization of enriched GO terms in ranked genelists. BMC Bioinformatics 2009, 10:48.
51. Cherry JM, Hong EL, Amundsen C, Balakrishnan R, Binkley G, Chan ET,Christie KR, Costanzo MC, Dwight SS, Engel SR, Fisk DG, Hirschman JE, HitzBC, Karra K, Krieger CJ, Miyasato SR, Nash RS, Park J, Skrzypek MS, SimisonM, Weng S, Wong ED: Saccharomyces Genome Database: thegenomics resource of budding yeast. Nucleic Acids Res 2012,40(Database issue):D700–D705.
52. Merico D, Isserlin R, Stueker O, Emili A, Bader GD: Enrichment map: anetwork-based method for gene-set enrichment visualization andinterpretation. PloS one 2010, 5(11):e13984.
53. Smoot ME, Ono K, Ruscheinski J, Wang PL, Ideker T: Cytoscape 2.8: newfeatures for data integration and network visualization.Bioinformatics (Oxford, England) 2011, 27(3):431–432.
54. Hampsey M: Molecular genetics of the RNA polymerase II generaltranscriptional machinery. Microbiol Mol Biol Rev 1998, 62(2):465–503.
55. Maston GA, Evans SK, Green MR: Transcriptional regulatory elementsin the human genome. Annu Rev Genomics Hum Genet 2006, 7:29–59.
56. Fournier ML, Paulson A, Pavelka N, Mosley AL, Gaudenz K, Bradford WD,Glynn E, Li H, Sardiu ME, Fleharty B, Seidel C, Florens L, Washburn MP:Delayed correlation of mRNA and protein expression inrapamycin-treated cells and a role for Ggc1 in cellular sensitivity torapamycin. Mol Cell Proteomics 2010, 9(2):271–284.
57. Eden E, Lipson D, Yogev S, Yakhini Z: Discovering motifs in ranked listsof DNA sequences. PLoS Comput Biol 2007, 3(3):e39.
58. Huber A, Bodenmiller B, Uotila A, Stahl M, Wanka S, Gerrits B, Aebersold R,Loewith R: Characterization of the rapamycin-sensitivephosphoproteome reveals that Sch9 is a central coordinator ofprotein synthesis. Genes Dev 2009, 23(16):1929–1943.
59. Lempiäinen H, Uotila A, Urban J, Dohnal I, Ammerer G, Loewith R, ShoreD: Sfp1 interaction with TORC1 and Mrs6 reveals feedbackregulation on TOR signaling. Mol cell 2009, 33(6):704–716.
60. Bertram PG, Choi JH, Carvalho J, Ai W, Zeng C, Chan TF, Zheng XF:Tripartite regulation of Gln3p by TOR , Ure2p, and phosphatases.J Biol Chem 2000, 275(46):35727–35733.
61. Steffen KK, MacKay VL, Kerr EO, Tsuchiya M, Hu D, Fox LA, Dang N,Johnston ED, Oakes JA, Tchao BN, Pak DN, Fields S, Kennedy BK,Kaeberlein M: Yeast life span extension by depletion of 60sribosomal subunits is mediated by Gcn4. Cell 2008, 133(2):292–302.
62. Jorgensen P, Nishikawa JL, Breitkreutz BJ, Tyers M: Systematicidentification of pathways that couple cell growth and division inyeast. Science (New York, N.Y.) 2002, 297(5580):395–400.
63. Marion RM, Regev A, Segal E, Barash Y, Koller D, Friedman N, O’Shea EK:Sfp1 is a stress- and nutrient-sensitive regulator of ribosomalprotein gene expression. Proc Natl Acad Sci U S A 2004,101(40):14315–14322.
64. Courchesne WE, Magasanik B: Regulation of nitrogen assimilation inSaccharomyces cerevisiae: roles of the URE2 and GLN3 genes.J Bacteriol 1988, 170(2):708–713.
65. Urban J, Soulard A, Huber A, Lippman S, Mukhopadhyay D, Deloche O,Wanke V, Anrather D, Ammerer G, Riezman H, Broach JR, De Virgilio C, HallMN, Loewith R: Sch9 is a major target of TORC1 in Saccharomycescerevisiae. Mol cell 2007, 26(5):663–674.
66. Hinnebusch AG: Translational regulation of GCN4 and the generalamino acid control of yeast. Annu Rev Microbiol 2005, 59:407–450.
67. Madhani HD, Fink GR: Combinatorial control required for thespecificity of yeast MAPK signaling. Science (New York, N.Y.) 1997,275(5304):1314–1317.
68. Rutherford JC, Chua G, Hughes T, Cardenas ME, Heitman J: AMep2-dependent transcriptional profile links permease function togene expression during pseudohyphal growth in Saccharomycescerevisiae. Mol Biol Cell 2008, 19(7):3028–3039.
69. Santos J, MJa Sousa, Leão C: Ammonium is toxic for aging yeast cells,inducing death and shortening of the chronological lifespan. PloSone 2012, 7(5):e37090.
70. Stephen DW, Rivers SL, Jamieson DJ: The role of the YAP1 and YAP2genes in the regulation of the adaptive oxidative stress responsesof Saccharomyces cerevisiae. Mol Microbiol 1995, 16(3):415–423.
71. Temple MD, Perrone GG, Dawes IW: Complex cellular responses toreactive oxygen species. Trends Cell Biol 2005, 15(6):319–326.
72. Wiatrowski HA, Carlson M: Yap1 accumulates in the nucleus inresponse to carbon stress in Saccharomyces cerevisiae. Eukaryot Cell2003, 2:19–26.
73. Yiu G, McCord A, Wise A, Jindal R, Hardee J, Kuo A, Shimogawa MY,Cahoon L, Wu M, Kloke J, Hardin J, Mays Hoopes LL: Pathways change inexpression during replicative aging in Saccharomyces cerevisiae.J Gerontol A Biol Sci Med Sci 2008, 63:21–34.
74. Eisenberg T, Knauer H, Schauer A, Büttner S, Ruckenstuhl C,Carmona-Gutierrez D, Ring J, Schroeder S, Magnes C, Antonacci L, Fussi H,Deszcz L, Hartl R, Schraml E, Criollo A, Megalou E, Weiskopf D, Laun P,Heeren G, Breitenbach M, Grubeck-Loebenstein B, Herker E, Fahrenkrog B,Fröhlich KU, Sinner F, Tavernarakis N, Minois N, Kroemer G, Madeo F:Induction of autophagy by spermidine promotes longevity. Nat CellBiol 2009, 11(11):1305–1314.
75. Teixeira MC, Cabrito TR, Hanif ZM, Vargas RC, Tenreiro S, Sá-Correia I:Yeast response and tolerance to polyamine toxicity involving thedrug : H+ antiporter Qdr3 and the transcription factors Yap1 andGcn4. Microbiology 2011, 157(Pt 4):945–956.
76. D’Andrea D, Grassi L, Mazzapioda M, Tramontano A: FIDEA: a server for thefunctional interpretation of differential expression analysis; 2013.http://www.nar.oxfordjournals.org/cgi/doi/10.1093/nar/gkt516
77. Lempiäinen H, Shore D: Growth control and ribosome biogenesis. CurrOpin Cell Biol 2009, 21(6):855–863. http://www.ncbi.nlm.nih.gov/pubmed/19796927
78. Stark C, Breitkreutz BJ, Reguly T, Boucher L, Breitkreutz A, Tyers M:BioGRID: a general repository for interaction datasets. Nucleic AcidsRes 2006, 34(Database issue):D535–D539.
79. Stark C, Breitkreutz BJ, Chatr-Aryamontri A, Boucher L, Oughtred R,Livstone MS, Nixon J, Van Auken K, Wang X, Shi X, Reguly T, Rust JM,Winter A, Dolinski K, Tyers M: The BioGRID interaction database: 2011update. Nucleic Acids Res 2011, 39(Database issue):D698–D704.
80. Ptacek J, Devgan G, Michaud G, Zhu H, Zhu X, Fasolo J, Guo H, Jona G,Breitkreutz A, Sopko R, McCartney RR, Schmidt MC, Rachidi N, Lee SJ, MahAS, Meng L, Stark MJR, Stern DF, De Virgilio C, Tyers M, Andrews B,Gerstein M, Schweitzer B, Predki PF, Snyder M: Global analysis ofprotein phosphorylation in yeast. Nature 2005, 438(7068):679–684.
81. Abdulrehman D, Monteiro PT, Teixeira MC, Mira NP, Lourenço AB, dosSantos, S C, Cabrito TR, Francisco AP, Madeira SC, Aires RS, Oliveira AL,Sá-Correia I, Freitas AT: YEASTRACT: providing a programmatic accessto curated transcriptional regulatory associations in Saccharomycescerevisiae through a web services interface. Nucleic Acids Res 2011,39(Database issue):D136–D140.
82. Köhler S, Bauer S, Horn D, Robinson PN: Walking the interactome forprioritization of candidate disease genes. Am J Hum Genet 2008,82(4):949–958.
83. Navlakha S, Kingsford C: The power of protein interactionnetworks for associating genes with diseases. Bioinformatics 2010,26(8):1057–1063.
84. Nibbe RK, Koyutürk M, Chance MR: An integrative -omics approach toidentify functional sub-networks in human colorectal cancer. PLoSComput Biol 2010, 6:e1000639.
85. Macropol K, Can T, Singh AK: RRW: repeated random walks ongenome-scale protein networks for local cluster discovery. BMCBioinformatics 2009, 10:283.
86. Maruyama O, Chihara A: NWE: Node-weighted expansion for proteincomplex prediction using random walk distances. Proteome Sci 2011,9(Suppl 1):S14.
87. Doyle P, Snell L: Random walks and electric networks. Carus mathematicalmonographs. Washington: DC: Mathematical Association of America;1984.
88. Brin S, Page L: The anatomy of a large-scale hypertextual Web searchengine. Comput Netw ISDN Syst 1998, 30(1–7):107–117.

Mohammadi et al. BMC Systems Biology 2013, 7:84 Page 17 of 17http://www.biomedcentral.com/1752-0509/7/84
89. Page L, Brin S, Motwani R, Winograd T: The PageRank citation ranking:bringing order to the web. Technical Report 1999-66, Stanford InfoLab1999.
90. Jeh G, Widom J: Scaling personalized web search. Technical Report2002–12, Stanford InfoLab 2002.
91. Haveliwala TH: Proceedings of the 11th International Conference onWorld Wide Web, WWW ’02. 2002:517–526.
92. Eden E: Discovering motifs in ranked lists of DNA sequences. PhDthesis. Technion - Israel Institute of Technology 2007.
doi:10.1186/1752-0509-7-84Cite this article as: Mohammadi et al.: Inferring the effective TOR-dependentnetwork: a computational study in yeast. BMC Systems Biology 2013 7:84.
Submit your next manuscript to BioMed Centraland take full advantage of:
• Convenient online submission
• Thorough peer review
• No space constraints or color figure charges
• Immediate publication on acceptance
• Inclusion in PubMed, CAS, Scopus and Google Scholar
• Research which is freely available for redistribution
Submit your manuscript at www.biomedcentral.com/submit


![Target of Rapamycin Signaling in Plant Stress …Update on Target of Rapamycin Signaling in Plant Stress Responses Target of Rapamycin Signaling in Plant Stress Responses1[OPEN] Liwen](https://img.pdfslide.net/doc/110x75/5f05e4b57e708231d4153f1e/target-of-rapamycin-signaling-in-plant-stress-update-on-target-of-rapamycin-signaling.jpg)


![Salicylic Acid-Dependent Plant Stress Signaling via ... · Salicylic Acid-Dependent Plant Stress Signaling via Mitochondrial Succinate Dehydrogenase1[OPEN] Katharina Belt, Shaobai](https://img.pdfslide.net/doc/110x75/5c9a845b09d3f2a06c8bfc9a/salicylic-acid-dependent-plant-stress-signaling-via-salicylic-acid-dependent.jpg)