Embed Size (px)
Citation preview


INFICON Q3 2007Earnings Conference
October 18, 2007

3
Safe Harbor StatementThis presentation contains forward-looking statements that reflect Management’s current views and estimates. The forward-looking statements involve certain risks and uncertainties that could cause actual results to differ materially from those contained in the forward-looking statements. These forward-looking statements address, among other things, our strategic objectives, trends in vacuum technology and in the industries that employ vacuum instrumentation and the anticipated effects of these trends on our business.
The Company undertakes no obligation to publicly update or revise any forward-looking statements, whether as a result of new information, future events or otherwise.

Lukas WinklerPresident& Chief Executive Officer

5
Steady progress in two key areas- Improving internal operations- Expanding our business
Revenues rose 7% to USD 58.2 million- Increase despite slowdown in a key market
Net income rose excluding one-time, non-cash charge- Impact of corporate tax rate change in Germany
Q307 – Solid Execution Continues

6
Semiconductor and Vacuum CoatingSales increased on a year-over-year basis
Orders from end-users for whole suite of in Situsensors and FabGuard process analysis software - Stiletto Scanning-Laser Particle Detector
- Newly introduced Sion RF Detector
Growing U.S. market share in leak detectors
- Good leak detector sales to new fabs
- Replacement orders also strong

7
Growth in OEM business- Increased sales of advanced sensors and vacuum gauges - Expect expanding demand for advanced
process control products
Vacuum coating OEM business contributed to solid 3Q- Maxtek acquisition added new thin film products and customers
Business in China accelerating – taking market share from major competitors for crystals
Growing concern for energy efficiency creating opportunities in solar panel manufacturing
Semiconductor and Vacuum Coating

8
Refrigeration and Air ConditioningSales remain at high level after record 2Q07- Rapid ramp-up by air conditioning manufacturers in China
benefiting INFICON- First sales to auto manufacturer in China for airbag testing
INFICON leak detectors the premier products for RACquality testing and aftermarket service
Sales to RAC and automotive customers in U.S. also remained strong
9
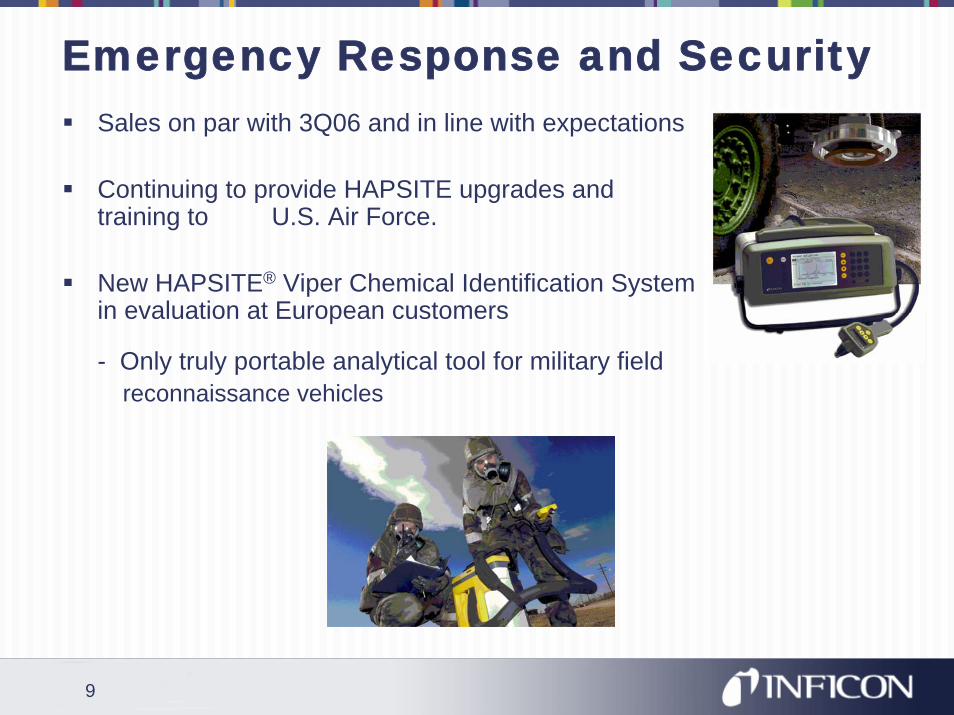
Emergency Response and SecuritySales on par with 3Q06 and in line with expectations
Continuing to provide HAPSITE upgrades and training to U.S. Air Force.
New HAPSITE® Viper Chemical Identification System in evaluation at European customers
- Only truly portable analytical tool for military fieldreconnaissance vehicles

10
General Vacuum Processes3Q a very robust quarter
- Unaffected by typical “summer lull” in Europe
Sales channels include private label partners and directsales to industrial OEMs and distributors
Increasingly diverse customer base contributing to goodresults
INFICON and other vacuum gauges manufactured for private label partners
Peter Maier
Vice President
& Chief Financial Officer
12
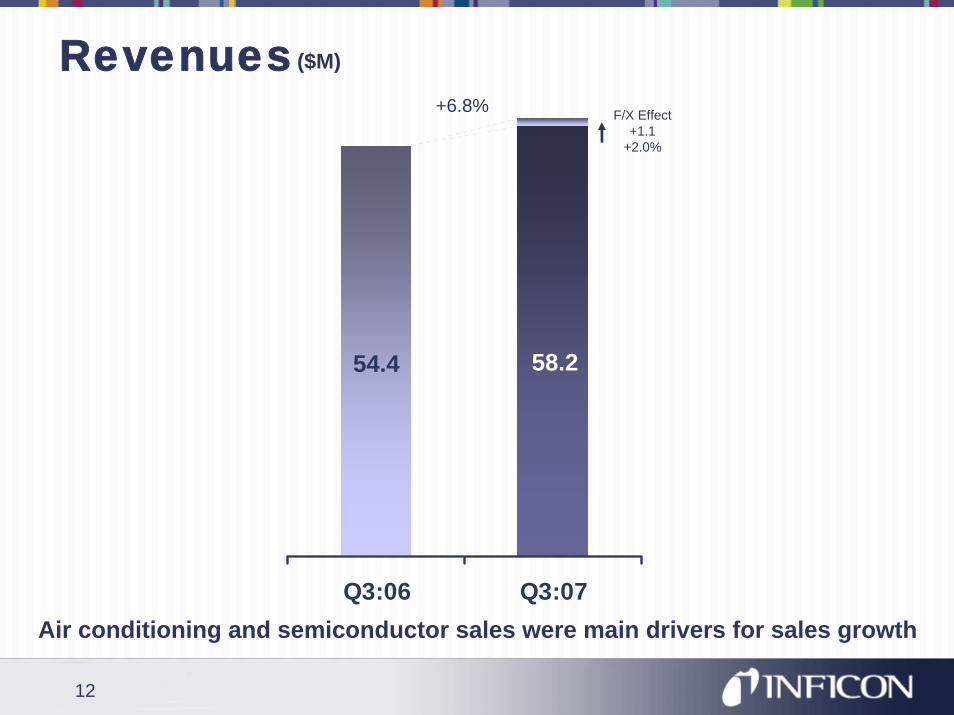
Q3:06 Q3:07
+6.8%
Air conditioning and semiconductor sales were main drivers for sales growth
F/X Effect+1.1
+2.0%
Revenues ($M)
54.4 58.2

13
Revenue by MarketSemiconductor and Vacuum Coating
Increased demand from semiconductor device makers and OEMs for leak detectors, process control instruments & software and vacuum gauges
32.5%32.5%21.1
19.5
Q3:06 Q3:07
+8.2%
35.8% 36.3%
($M)

14
Revenue by MarketRefrigeration and Air Conditioning
7.1
9.6
Q3:06 Q3:07
+35.2%
16.5%
13.1%
Significantly higher sales to air conditioning manufacturers in Asia and higher sales to the automotive industry in Europe and North America
($M)

15
Revenue by MarketGeneral Vacuum Processes
24.524.0
Q3:06 Q3:07
-2.0%
41.3%45.0%
Slightly lower demand from private label partners partially offset by sales to new customers, industrial OEMs and distributors
($M)
16
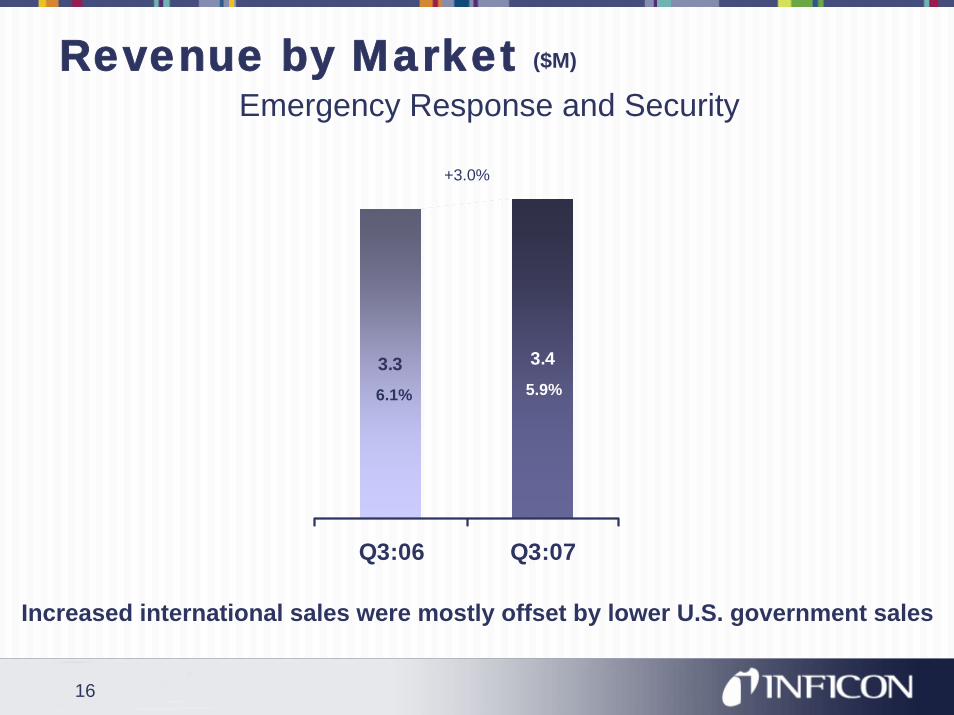
Revenue by MarketEmergency Response and Security
+3.0%
Increased international sales were mostly offset by lower U.S. government sales
3.43.3
Q3:06 Q3:07
5.9%6.1%
($M)

17
Geographic Revenue Breakdown
11.713.4
Q3:06 Q3:07
North America
21.5%23.0%
+14.2%
17.419.0
Q3:06 Q3:07
Asia-Pacific
31.9%32.7%
+9.3%
24.625.0
Q3:06 Q3:07
Europe
45.3%43.0%
+1.4%
Growth driven primarily by North America and Asia-Pacific
($M)

18
Gross Profit Margin
46.546.6
Q3:06 Q3:07
+7bps
(in %)
Improved mfg. overhead cost absorption, improved mix and a one-time charge in 2006,partially offset by price pressure and temporarily higher warranty costs
19
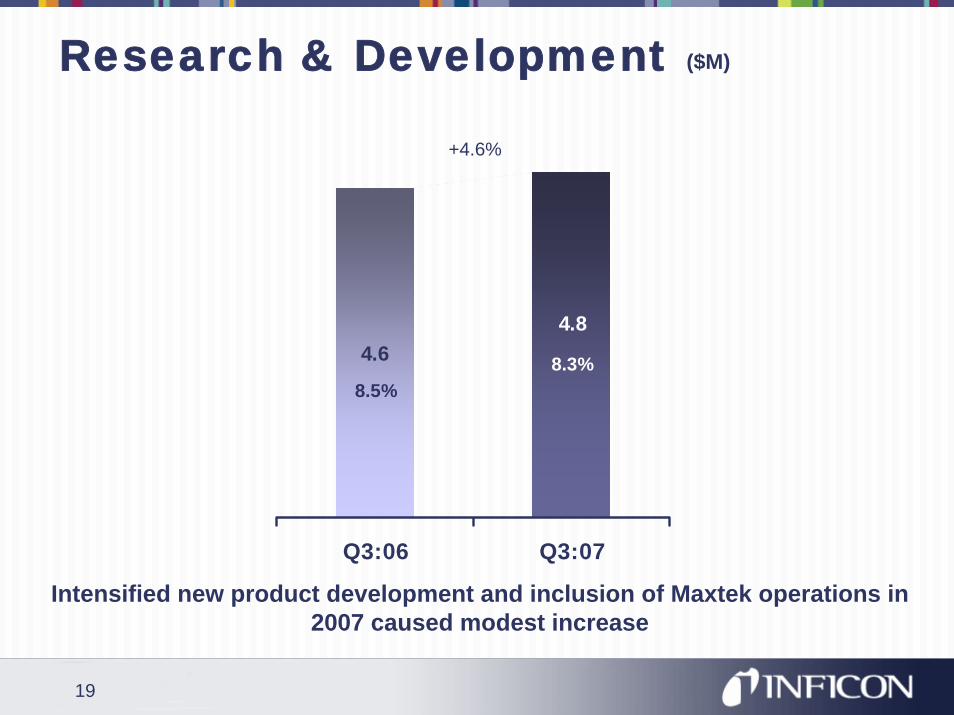
Research & Development
4.64.8
Q3:06 Q3:07
+4.6%
8.5%8.3%
Intensified new product development and inclusion of Maxtek operations in 2007 caused modest increase
($M)

20
Selling, General & Administrative
13.514.0
Q3:06 Q3:07
+3.9%
24.8%24.1%
Improved operational leverage despite increased investment in personnel and infrastructure in Asia to support growth and the inclusion of the Maxtek business this year
($M)
21
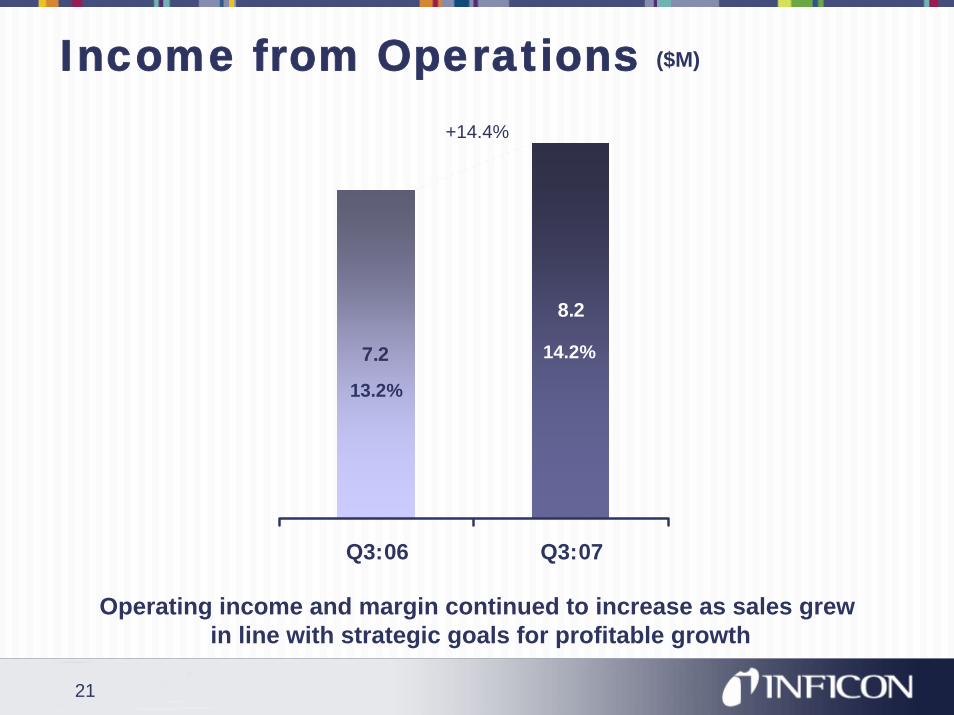
Income from Operations
7.2
8.2
Q3:06 Q3:07
+14.4%
13.2%
14.2%
Operating income and margin continued to increase as sales grewin line with strategic goals for profitable growth
($M)

22
Interest andOther Income/(Expense)
294 257
Q3:06 Q3:07
-37
Interest Income on cash down slightly on lower avg. cash balance this yearIncrease in Other Expense due to foreign currency exchange losses this year
572
-112
Q3:06 Q3:07
-684
Interest Income Other Income / (Expense)
($Tsnd)

23
Income Tax Provision
1.2
2.22.2
Q3:06 Q3:07
+60.1%
26.6%26.9%
Higher taxes driven by impact of one-time, non-cash charge for corporate tax reform on German subsidiary. Otherwise avg. effective tax rate unchanged.
14.8%
3.541.4%
($M)
24
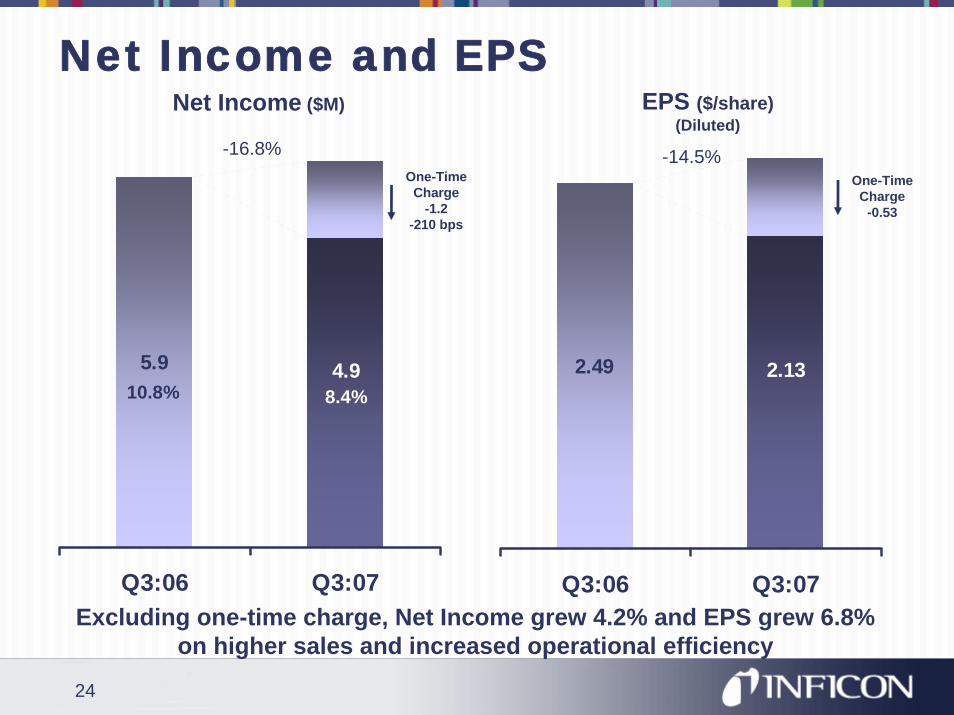
Net Income and EPS
5.9 4.9
Q3:06 Q3:07
-16.8%
10.8% 8.4%
Excluding one-time charge, Net Income grew 4.2% and EPS grew 6.8%on higher sales and increased operational efficiency
2.49 2.13
Q3:06 Q3:07
-14.5%
Net Income ($M) EPS ($/share)(Diluted)
One-TimeCharge
-1.2-210 bps
One-TimeCharge
-0.53
25
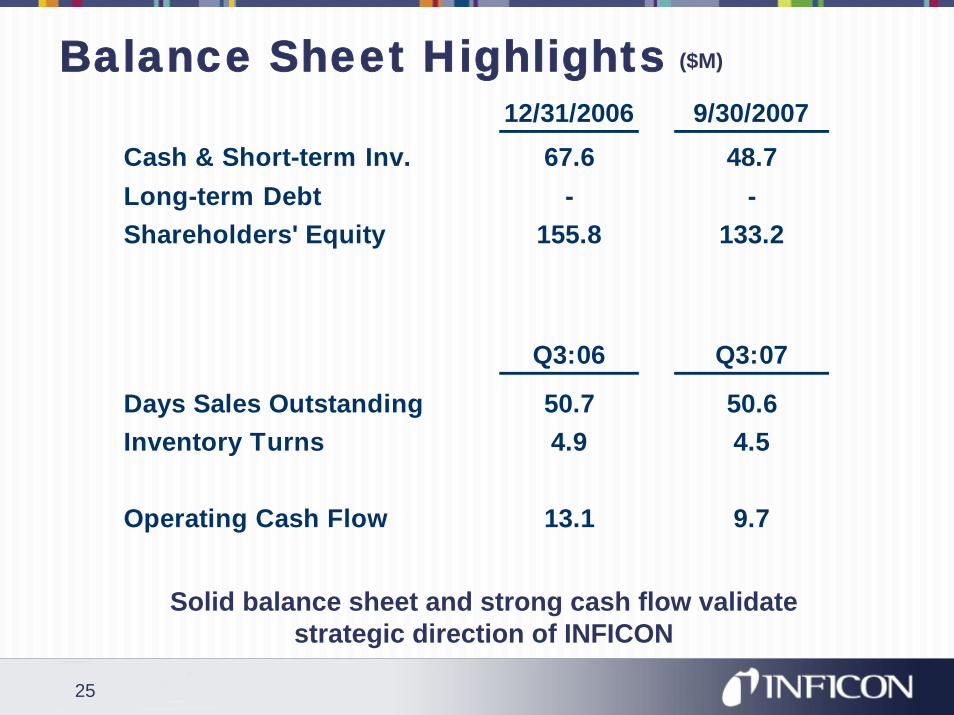
Balance Sheet Highlights
Solid balance sheet and strong cash flow validate strategic direction of INFICON
12/31/2006 9/30/2007Cash & Short-term Inv. 67.6 48.7Long-term Debt - -Shareholders' Equity 155.8 133.2
Q3:06 Q3:07
Days Sales Outstanding 50.7 50.6Inventory Turns 4.9 4.5
Operating Cash Flow 13.1 9.7
($M)

26
Returning Cash to ShareholdersShare buy-back: up to 10% of registered shares during 2007
• 210’855 shares (8.95%) repurchased to date
• MCHF 42.4 spent to date
• CHF 200.88 average price paid per share
• 2’169’929 shares outstanding on 9/30/2007
• 24’732 shares remain available for repurchase

27
Full Year 2007 GuidanceWe are on track to reach our financial targets for this year
Sales Growth Target: close to 10%
Operating Margin Target : ~ 14%

28
Full Year 2008 Guidance
Sales TargetMUSD 250 – 260
Operating Margin Target14.5 – 15.5%
Market Assumptions and Sales Drivers:Generally favorable global economic conditions
Moderate Semiconductor &Vacuum Coating markets growth combined with market share gains
Modest growth of RAC market combined with market share gains
Moderate growth of General Vacuum Processes markets and new customers
Mostly stable sales to emergency response market with upside opportunity
Cost Plans:Significant investments to continue to strengthen INFICON technology
Additional investments in sales and marketing infrastructure to support growth