Embed Size (px)
Citation preview

CFA Institute
Inflation Accounting and Public Policy around the World: Part Two: Adjustment of CorporateTax Policies for Inflation in Six CountriesAuthor(s): David HaleSource: Financial Analysts Journal, Vol. 34, No. 6 (Nov. - Dec., 1978), pp. 28-40Published by: CFA InstituteStable URL: http://www.jstor.org/stable/4478190 .
Accessed: 17/06/2014 21:11
Your use of the JSTOR archive indicates your acceptance of the Terms & Conditions of Use, available at .http://www.jstor.org/page/info/about/policies/terms.jsp
.JSTOR is a not-for-profit service that helps scholars, researchers, and students discover, use, and build upon a wide range ofcontent in a trusted digital archive. We use information technology and tools to increase productivity and facilitate new formsof scholarship. For more information about JSTOR, please contact [email protected].
.
CFA Institute is collaborating with JSTOR to digitize, preserve and extend access to Financial AnalystsJournal.
http://www.jstor.org
This content downloaded from 194.29.185.209 on Tue, 17 Jun 2014 21:11:51 PMAll use subject to JSTOR Terms and Conditions

by David Hale
Inflation Accounting and Public Policy Around the World
Part Two: Adjustment of Corporate Tax Policies for Inflation in Six Countries
It is now widely recognized that inflation distorts corporate taxation. Governments' approaches to coping with these distortions have differed from country to country. In the U.S., for example, use of LIFO accounting for reporting and tax purposes has enabled companies to dampen some of the worst effects of inflation; prior to 1975, practically all other industrial countries required FIFO accounting, which created tremendous liquidity problems for business. On the other hand, the U.S. has lagged in the area of tax incentives for investment.
Britain has instituted extremely generous tax incentives, including 100 per cent first-year depreciation on new investment in plant and equipment. Unfortunately, these measures came too late to reverse mounting business conservatism. British business investment has continued to fall in the face of weak demand; the government's expansive monetary policy, intended to produce a takeoff in industrial development, has ended up fueling a real estate boom instead.
Since 1975, American corporations have begun to adopt financial policies almost as conservative as those prevalent in Britain. U.S. firms are now emphasizing liquidity rebuilding and balance sheet strength, rather than expansion of plant and equipment. If U.S. tax laws continue to aggravate the problems introduced by inflation, the U.S. too
could settle into a long period of permanently slower growth, with a highly conservative business sector providing funds for further expansion of consumption. .
ART ONE of this article reviewed worldwide developments in inflation accounting during the 1970s. Part Two looks at the changes in
tax and price control policy that have accompanied these accounting developments.
THE UNITED STATES
According to reported profit figures, American in- dustry enjoyed a robust decade in 1965-75. Despite a year of recession in 1970, reported profits of non- financial corporations increased from $63.4 to $102.3 billion. But this was also a decade of acceler- ating inflation, and factoring in adjustments for the effects of changing prices on inventory and deprecia- tion gives a much less sanguine profit picture. Con- sider, for example, what happened to profits in 1974-the peak year of the decade.
As Table I shows, reported 1974 profits were $102.9 billion, up from $92.7 billion in 1973. But $40.4 billion of this total represented inflation-in- duced holding gains, which businesses had to rein- vest in order to finance the rising price of new inven- tory. These dollars were not available for distribu- tion to shareholders. Industry also experienced a three billion dollar shortfall in depreciation adjust- ments. In the decade prior to 1974, depreciation re- ported for tax purposes had always been sufficient to cover the cost of replacing depreciated assets; by 1974, constantly rising price levels had outstripped
David Hale, an Economist with Kemper Financial Services, Inc., Chicago, is also a member of the Finan- cial Accounting Standards Board's Task Force on the Conceptual Framework for Financial A ccounting and Reporting.
28 O FINANCIAL ANALYSTS JOURNAL / NOVEMBER-DECEMBER 1978
This content downloaded from 194.29.185.209 on Tue, 17 Jun 2014 21:11:51 PMAll use subject to JSTOR Terms and Conditions
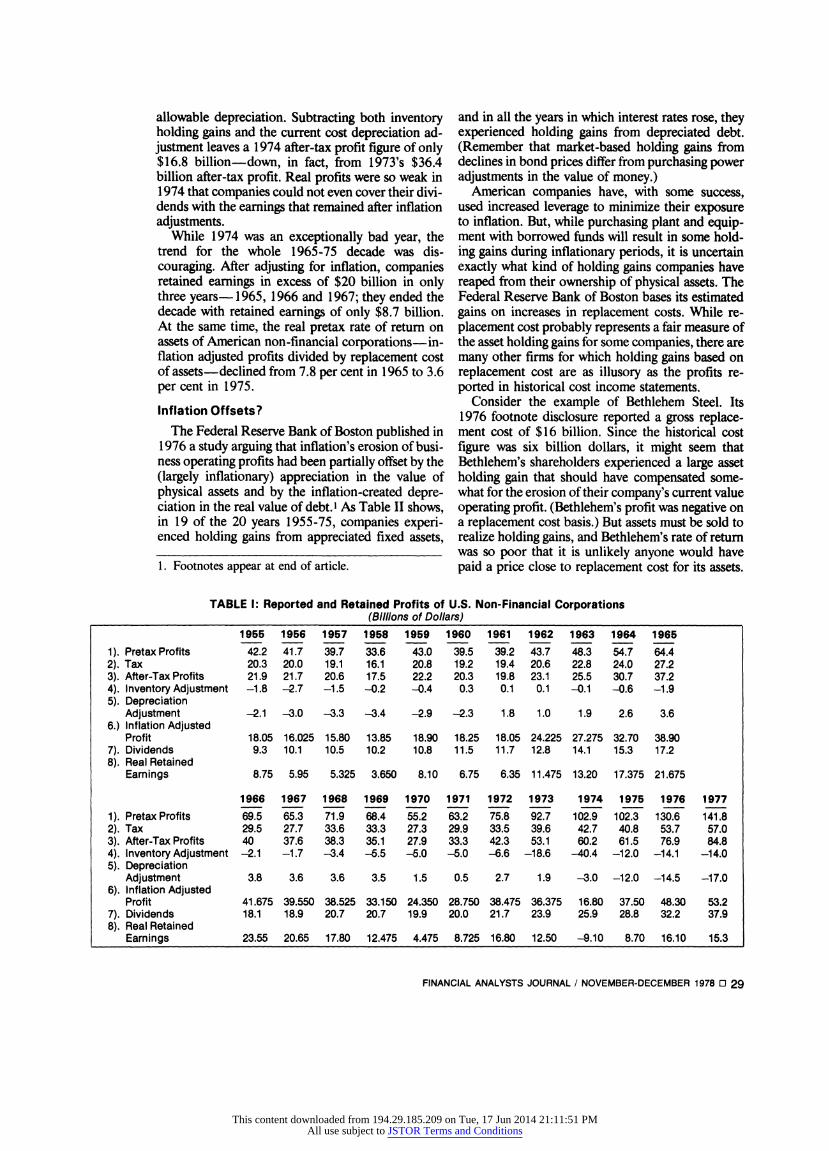
allowable depreciation. Subtracting both inventory holding gains and the current cost depreciation ad- justment leaves a 1974 after-tax profit figure of only $16.8 billion-down, in fact, from 1973's $36.4 billion after-tax profit. Real profits were so weak in 1974 that companies could not even cover their divi- dends with the earnings that remained after inflation adjustments.
While 1974 was an exceptionally bad year, the trend for the whole 1965-75 decade was dis- couraging. After adjusting for inflation, companies retained earnings in excess of $20 billion in only three years- 1965, 1966 and 1967; they ended the decade with retained earnings of only $8.7 billion. At the same time, the real pretax rate of return on assets of American non-financial corporations-in- flation adjusted profits divided by replacement cost of assets-declined from 7.8 per cent in 1965 to 3.6 per cent in 1975.
Inflation Offsets?
The Federal Reserve Bank of Boston published in 1976 a study arguing that inflation's erosion of busi- ness operating profits had been partially offset by the (largely inflationary) appreciation in the value of physical assets and by the inflation-created depre- ciation in the real value of debt.' As Table II shows, in 19 of the 20 years 1955-75, companies experi- enced holding gains from appreciated fixed assets,
and in all the years in which interest rates rose, they experienced holding gains from depreciated debt. (Remember that market-based holding gains from declines in bond prices differ from purchasing power adjustments in the value of money.)
American companies have, with some success, used increased leverage to minimize their exposure to inflation. But, while purchasing plant and equip- ment with borrowed funds will result in some hold- ing gains during inflationary periods, it is uncertain exactly what kind of holding gains companies have reaped from their ownership of physical assets. The Federal Reserve Bank of Boston bases its estimated gains on increases in replacement costs. While re- placement cost probably represents a fair measure of the asset holding gains for some companies, there are many other firms for which holding gains based on replacement cost are as illusory as the profits re- ported in historical cost income statements.
Consider the example of Bethlehem Steel. Its 1976 footnote disclosure reported a gross replace- ment cost of $16 billion. Since the historical cost figure was six billion dollars, it might seem that Bethlehem's shareholders experienced a large asset holding gain that should have compensated some- what for the erosion of their company's current value operating profit. (Bethlehem's profit was negative on a replacement cost basis.) But assets must be sold to realize holding gains, and Bethlehem's rate of return was so poor that it is unlikely anyone would have paid a price close to replacement cost for its assets. 1. Footnotes appear at end of article.
TABLE 1: Reported and Retained Profits of U.S. Non-Financial Corporations (Billions of Dollars)
1955 1956 1957 1958 1959 1960 1961 1962 1963 1964 1965
1). Pretax Profits 42.2 41.7 39.7 33.6 43.0 39.5 39.2 43.7 48.3 54.7 64.4 2). Tax 20.3 20.0 19.1 16.1 20.8 19.2 19.4 20.6 22.8 24.0 27.2 3). After-Tax Profits 21.9 21.7 20.6 17.5 22.2 20.3 19.8 23.1 25.5 30.7 37.2 4). Inventory Adjustment -1.8 -2.7 -1.5 -0.2 -0.4 0.3 0.1 0.1 -0.1 -0.6 -1.9 5). Depreciation
Adjustment -2.1 -3.0 -3.3 -3.4 -2.9 -2.3 1.8 1.0 1.9 2.6 3.6 6.) Inflation Adjusted
Profit 18.05 16.025 15.80 13.85 18.90 18.25 18.05 24.225 27.275 32.70 38.90 7). Dividends 9.3 10.1 10.5 10.2 10.8 11.5 11.7 12.8 14.1 15.3 17.2 8). Real Retained
Earnings 8.75 5.95 5.325 3.650 8.10 6.75 6.35 11.475 13.20 17.375 21.675
1966 1967 1968 1969 1970 1971 1972 1973 1974 1975 1976 1977
1). Pretax Profits 69.5 65.3 71.9 68.4 55.2 63.2 75.8 92.7 102.9 102.3 130.6 141.8 2). Tax 29.5 27.7 33.6 33.3 27.3 29.9 33.5 39.6 42.7 40.8 53.7 57.0 3). After-Tax Profits 40 37.6 38.3 35.1 27.9 33.3 42.3 53.1 60.2 61.5 76.9 84.8 4). Inventory Adjustment -2.1 -1.7 -3.4 -5.5 -5.0 -5.0 -.6 -18.6 -40.4 -12.0 -14.1 -14.0 5). Depreciation
Adjustment 3.8 3.6 3.6 3.5 1.5 0.5 2.7 1.9 -3.0 -12.0 -14.5 -17.0 6). Inflation Adjusted
Profit 41.675 39.550 38.525 33.150 24.350 28.750 38.475 36.375 16.80 37.50 48.30 53.2 7). Dividends 18.1 18.9 20.7 20.7 19.9 20.0 21.7 23.9 25.9 28.8 32.2 37.9 8). Real Retained
Earnings 23.55 20.65 17.80 12.475 4.475 8.725 16.80 12.50 -9.10 8.70 16.10 15.3
FINANCIAL ANALYSTS JOURNAL / NOVEMBER-DECEMBER 1978 O 29
This content downloaded from 194.29.185.209 on Tue, 17 Jun 2014 21:11:51 PMAll use subject to JSTOR Terms and Conditions

In the Sandilands system of current value account- ing, a company such as Bethlehem would probably be forced to carry many of its assets on the balance sheet at some estimate of market price (scrap value) or present value (discounted future cash flow still possible from the assets). Until Bethlehem's real profitability improves, the replacement cost of the assets would clearly exceed their current value.2
Bethlehem Steel is an extreme example, but it is fairly typical. Although, with the stock market cur- rently in the midst of a takeover boom, companies can fetch prices as high as or higher than their assets' replacement cost, and their shareholders experience real holding gains, those holding gains are not a function of the general inflation rate. Rather than being a true reflection of historical cost asset values multiplied by a price index, they reflect the com- pany's ability to maintain or improve earnings in the face of inflation.
If a company's profitability is low because it can- not pass costs forward, if discount rates remain high in the face of economic stagnation, the present value of its assets could be substantially less than their re- placement cost, or even their historical cost. In 1977, Bethlehem Steel, it should be remembered, wrote off millions of dollars of historical cost asset values-not written-up replacement cost values. In Britain three years ago, the accounting profession feared that the introduction of current value ac- counting would force them to mark assets down to scrap value or present value because of British in-
dustry's low operating profits and the 16 per cent long-term interest rate prevailing in the bond market.
Inflation may change the way companies measure return, and the way investors make tradeoffs be- tween risk, income and growth. But, except in peri- ods of hyperinflation, which destroys all non-barter standards of value, inflation cannot change the underlying basis of the company's real worth- earning power and profitability. Judging from the performance of stock prices over the last decade, in- vestors would seem to realize this fact.
The performance of real profits explains the poor behavior of the stock market. Nominal profits have grown steadily, and the average return on share- holders' equity for the S&P 500 has held constant at about 12 per cent (fluctuating between 10 per cent at business cycle bottoms and 14 per cent at peaks). But inflation has eroded the quality of real profits and forced companies to reduce dividend payout ratios from an average level of 55 per cent 10 years ago to only 40 to 42 per cent today, diminishing the attractiveness of equities.
U.S. Business and Inflation Policy
As damaging as inflation has been to American stock prices during the 1970s, the U.S. corporate sector remains, on the whole, better placed to cope with inflation than the corporate sectors of other in- dustrial countries. Because the U.S. dismantled price controls in 1974, while other industrial countries
TABLE l1: Current Value Profit and Holding Gains of U.S. Companies
Holding Gains Holding Gains on on Total
Operating Profit Real Assets Net Liabilities Profits
1955 38.2 13.2 2.2 53.6 1956 36.1 17.7 4.5 58.3 1957 35.0 9.3 -2.2 42.1 1958 30.1 4.5 3.9 38.5 1959 39.7 3.7 4.4 47.8
1960 37.4 -0.8 -5.4 31.2 1961 37.4 1.7 1.7 40.8 1962 44.9 0.9 -2.7 43.1 1963 50.0 3.0 1.5 54.5 1964 56.7 3.3 -1.3 58.7
1965 66.1 8.7 4.0 78.8 1966 71.2 12.1 3.6 86.9 1967 67.2 17.8 8.2 93.8 1968 72.1 23.5 -15.5 80.1 1969 66.4 36.8 42.0 145.2
1970 51.6 31.4 -8.6 74.4 1971 58.7 29.3 -10.2 77.8 1972 72.0 31.9 -0.9 103.0 1973 76.0 70.3 19.6 165.9 1974 59.6 133.8 -0.9 192.5
1975 72.5 82.5 -15.8 139.2
30 0 FINANCIAL ANALYSTS JOURNAL / NOVEMBER-DECEMBER 1978
This content downloaded from 194.29.185.209 on Tue, 17 Jun 2014 21:11:51 PMAll use subject to JSTOR Terms and Conditions

continued them, American companies had an easier time passing cost increases forward and improving profitability during the economic recovery of 1975-76. The U.S. has also allowed LIFO ac- counting for both financial and tax reporting since the 1940s. When high inflation in 1974 led to mush- rooming inventory profits, American corporations were able to reduce their tax liabilities and protect working capital by switching from FIFO to LIFO. Prior to 1975, practically all other countries re- quired FIFO accounting for both tax and financial reporting-a situation that created tremendous li- quidity problems for their corporate sectors.
The U.S. corporate sector is perhaps most at a dis- advantage in the area of depreciation allowed for tax purposes. Underdepreciation represents the major inflation accounting problem remaining to be solved by American business and government. Eisen- hower's introduction of accelerated depreciation during the mid- 1 950s, and Kennedy's allowance of a one-third reduction in asset lives for tax purposes, permitted a decade of lifted corporate cash flow, stimulated investment and comfortably adequate de- preciation coverage. But the Nixon Administration's further shortening of asset lives proved inadequate to cope with the rapidly accelerating inflation of the mid- 1 970s. The modest depreciation adjustment surplus of the early 1 970s has become today a deficit of $17 billion. This deficit will continue to grow unless the inflation rate declines or tax depreciation laws are again modified.3
BRITAIN
Table III outlines the plight of British corporations over the past decade. While nominal rates of return on assets in British industry have remained about constant in the 16 to 18 per cent range, as Table IV shows, real rates dropped from 1 1.2 per cent in 1965 to 3.3. per cent in 1976.4
Because of low profitability and uncertainties caused by both inflation and constant U-turns in
government economic policy, British industry has adhered to extremely conservative financial prac- tices. Instead of borrowing in depreciated currency to purchase real assets, as American companies did in the 1960s, British companies have tended to avoid leverage. (See Table V.) They have run large financial surpluses in most years since 1950 and, as Table VI shows, have relied much less on external financing than companies in other major industrial countries. As Christopher Johnson commented in The Anatomy of U.K. Finance, the relatively strong balance sheets of British companies reflect economic weakness, rather than strength:
"The industrial and commercial company sector [of Britain] was in financial surplus for 14 out of the 18 years from 1952 to 1969, and its deficit in the other four years was trifling. In other words, British industry, unlike its counterparts in other more dynamic economies, generated enough cash flow to finance a somewhat inadequate level of capital spending, and was in most cases not pre- pared to take the risk of moving deeper into debt in order to finance additional investment, which might fail to achieve its proper rate of return be- cause of poor industrial performance."5 In 1972, Heath's government introduced 100 per
cent first-year depreciation on new investment in plant and equipment as part of its dash for growth. It represented one more of a long line of special invest- ment incentives provided by successive British gov- ernments to improve the country's economic perfor- mance. But so deep rooted were the economic prob- lems of Britain by that time that not even 100 per cent first-year depreciation could trigger a sustained recovery in capital spending. Cautious even in the best of times, company managements saw little in the economic background of Britain and the world to make them more confident: Inflation was running at high levels, price controls had been imposed and it was widely believed that the government's growth plans would collapse when the country's balance of
TABLE Ill: Income of British Industrial and Commercial Companies (Millions of Pounds)
1966 1967 1968 1969 1970 1971 1972 1973 1974 1975 1976
Gross U.K. Trading Profits 4,951 4,964 5,642 6,155 6,446 7,185 8,164 10,051 11,512 11,455 14,555 Less Stock Appreciation -297 -145 -485 -82 -888 -832 -1,066 -2,553 -4,941 -4,140 -5,300 Corrected U.K. Trading Profits 4,654 4,819 5,157 5,573 5,558 6,353 7,098 7,498 6,571 7,315 9,255 Plus Rent & Non-Trading Income 363 377 456 504 513 525 642 1,057 1,353 1,353 1,668 Less Depreciation
(Current Value) -1,288 -1,388 -1,428 -1,575 -1,788 -2,050 -2,316 -2,688 -3,322 -4,438 -5,653 Corrected Net U.K. Income 3,729 3,808 4,185 4,501 4,283 4,828 5,424 5,867 4,602 4,230 5,270 Less Dividends 1,509 1,463 1,434 1,554 1,378 1,530 1,524 1,638 1,469 1,608 1,895
Interest 896 912 1,036 1,187 1,268 1,286 1,474 2,328 3,303 3,272 3,735 U.K. Taxes 964 1,028 1,341 1,528 1,322 1,156 1,431 2,065 1,164 962 1,116
Total Deductions 3,369 3,403 3,811 4,269 3,968 3,972 4,429 6,031 5,936 5,842 6,746 Real Retained Profits 360 405 374 232 315 856 995 -164 -1,334 -1,612 -1,476
FINANCIAL ANALYSTS JOURNAL / NOVEMBER-DECEMBER 1978 O 31
This content downloaded from 194.29.185.209 on Tue, 17 Jun 2014 21:11:51 PMAll use subject to JSTOR Terms and Conditions

payments began to deteriorate. Thirty years of stop- go economic policies had made the business com- munity skeptical and risk-averse; companies refused to spend.
By 1974, Britain faced the worst financial and
economic crisis of its postwar history. With inflation running at high double digit levels, inventory hold- ing gains' share of total profits had risen from the 1972 level of 14 per cent to almost 44 per cent. Because of Britain's traditional FIFO-based fiscal
TABLE IV: Rates of Return on British Companies' Assets (All Companies and Industrial and Commercial Companies Based on National Accounts Data)
(Per Cent)
All Companies Industrial and Commercial Companies At replacement costs At replacement costs
Before After Before After providing providing providing providing
At historical for stock for stock At historical for stock for stock costs appreciation appreciation costs appreciation appreciation
1960 17.5 15.7 12.2 18.8 13.5 13.2 1961 15.3 14.3 10.5 16.4 11.9 11.4 1962 13.8 13.2 9.6 14.9 10.8 10.4 1963 14.9 12.1 10.4 16.0 11.8 11.3 1964 15.2 11.3 10.6 16.7 12.5 11.7
1965 14.5 10.7 10.0 16.0 11.9 11.2 1966 12.7 9.3 8.5 14.3 10.6 9.8 1967 12.0 9.1 8.7 13.5 10.3 10.0 1968 13.0 9.7 8.6 14.7 11.0 9.9 1969 12.9 9.5 8.2 14.8 11.0 9.7
1970 12.2 8.6 6.9 14.1 10.1 8.3 1971 12.8 8.6 7.2 14.6 10.0 8.5 1972 13.2 8.5 6.9 15.5 10.2 8.5 1973 15.0 9.1 5.8 17.6 10.8 7.4 1974 13.7 7.3 2.3 17.3 9.6 4.3
1975 11.1 4.8 1.4 14.6 6.8 3.2 1976 12.5 5.0 1.5 16.3 7.0 3.3
TABLE V: British Corporate Sector Sources and Uses of Funds (Billions of Pounds)
1960 1961-65 1966-70 1971-75
Internal Source of Funds Retained Profit 2,545 3,575 3,090 6,595 Capital Transfers 15 10 350 405
Total 2,560 3,585 3,440 7,000
Uses of Funds Capital Investment 1,650 2,080 2,750 5,050 Inventory 685 480 805 2,775
Total 2,335 2,560 3,555 7,825 Expenditures/Sources 0.91 0.71 1.03 1.12
TABLE VI: Self-Financing Ratios of Industrial and Commercial Companies* 1970 1971 1972 1973 1974 1975
U.K. 81 102 112 95 72 96 U.S. 73 79 78 72 72 106 Japan 50 58 45 39 36 Germany 66 71 76 68 Francet 59 64 72 75
*Self-financing ratio = undistributed income, including depreciation and income from abroad, plus capital transfers, as a percentage of capital expenditure, including stock appreciation.
tNot commercial companies. Source: Anatomy of U.K. Finance. (See footnote 5.)
32 El FINANCIAL ANALYSTS JOURNAL / NOVEMBER-DECEMBER 1978
This content downloaded from 194.29.185.209 on Tue, 17 Jun 2014 21:11:51 PMAll use subject to JSTOR Terms and Conditions

accounting system, these gains were fully taxable, and companies were stripped of funds that should have been reinvested in working captial. British in- dustry found itself caught in a vicious liquidity squeeze, the stock market lost nearly two-thirds of its value, and the corporate bankruptcy rate threatened to rise dramatically when tax payments became due.
Rather than risk a complete collapse (and ul- timate nationalization) of the private sector, the Chancellor of the Exchequer decided to give com- panies tax relief on inventory profits. British com- panies were allowed to subtract from their taxable income an amount approximately equal to the dif- ference between the value of their inventory on the first day of the fiscal year and the last. (It made no difference whether the change in the value of the in- ventory reflected an increase in volume or price.) So generous was this relief measure that the corporate sector returned to financial surplus within 18 months, while the London stock market doubled during the first six weeks of 1975.
The British government has still not given up on its ambition to encourage more investment in indus- try. It has extended the generous 100 per cent first- year depreciation allowance and continued the tax deferral scheme for inventory profits, with two mod- ifications. In his April 1978 budget message, the Chancellor of the Exchequer exempted companies from any tax liability for inventory profits accumu- lated during the 1974-75 period and placed a six- year limit on future inventory profit relief. He also emphasized that the deferral scheme was only an in- terim solution to the problem of inventory profits and would be replaced when the accounting profes- sion developed an adequate system of inflation ac- counting.
Despite its reputation for punitive left-wing tax policies, Britian has today one of the most inflation adjusted business tax systems in the industrial world. As a result, British companies pay little in the way of mainstream corporation income tax. Their accounts show the official 52 per cent corporate tax rate, but most of this represents provisions for deferred tax payments that would become due only if companies stopped investing or ran inventories down. With de- ferred taxes on British balance sheets climbing into the billions of pounds- in some companies, exceed- ing equity-the British accounting profession has recently decided that companies should no longer even provide for deferred taxes unless they are likely to pay them in the foreseeable future. This action will, at a stroke, improve the earnings of British companies by an average of 36 per cent and increase asset values by 17 per cent.6
In 1976, the government also introduced inflation
adjustments into the price control code. Companies are now permitted to subtract a large portion of their inventory holding gains when computing allowable profit margins and to multiply their historical cost depreciation by 1.4. The 1976 document an- nouncing the new price code stated very clearly the government's commitment to improved profitability:
"The Report by Sir Francis Sandilands demon- strated that in a period of inflation, the apparent profits indicated by company accounts drawn up on a historical basis may conceal the fact that the firm is not making sufficient money even to replace the assets it has consumed. In the com- pany sector the real rate of return (i.e., at replace- ment cost after deduction for stock appreciation) is very low and has fallen over the decade from 1965 from around 10 per cent to around two per cent."7 Although manufacturing investment has begun to
pick up with the recent recovery in the British econ- omy, in real terms it remains below its 1974 level and is unlikely to accelerate dramatically in the near future. While the growth rate of the world's economies remains low, demand will continue in- adequate to justify heavy capital spending. The bal- ance of payments cushion provided by North Sea Oil will permit some reflation, but with British industry now so uncompetitive, much of the demand resulting from fiscal stimulus will flow to imports. Britian's generous tax incentives would have been more effec- tive at encouraging investment 15 years ago, when the world economy was expanding and industry had strong markets to absorb its output. With demand now weak, tax incentives alone cannot persuade companies to invest.
Composition of Wealth
The economic trends that have reinforced the tra- ditional conservatism of British corporate manage- ments have also caused a revolution in the way Brit- ish individuals hold wealth. As can be seen in Table VII, corporate securities as a share of total house- hold worth in Britain have shrunk from 18.4 per cent in 1966 to 8.7 per cent in 1976. Dwellings as a share of total worth, on the other hand, have in- creased from 33.3 to over 50 per cent during the same period. Much of this is due to the Bank of En- gland's expansive monetary policy of the early 1970s; intended to produce the long-sought takeoff in industrial investment, it ended up fueling a real estate boom instead. Now Britain provides an even more striking example than the United States of the extent to which the household sector has come to rely on real estate as a vehicle for protecting capital from inflation.8
Britain's tax system has also contributed to the
FINANCIAL ANALYSTS JOURNAL / NOVEMBER-DECEMBER 1978 OJ 33
This content downloaded from 194.29.185.209 on Tue, 17 Jun 2014 21:11:51 PMAll use subject to JSTOR Terms and Conditions

change. Although British companies have been given every conceivable tax excuse to invest, their managements are given no incentives to work hard. Marginal tax rates on earned income and on invest- ment income run as high as 83 and 98 per cent, re- spectively. To be sure, pension plans, insurance pro- grams and company perks enjoy many loopholes (high marginal tax systems breathe through their loopholes), but individuals still regard the tax system as a disincentive to private accumulation of capital and entrepreneurship.
British government has recently begun to extend to small investors some of the same favorable tax treatment it has hitherto provided corporations. The April
- 1978 budget contained a number of generous
tax provisions for small business, capital gains and investment income. The first 1000 pounds ($1800) of capital gains will henceforth be tax-free, while the next 4000 pounds will be taxed at only a 15 per cent
rate. The threshold at which dividend income be- comes taxable is also to be indexed for inflation. These new tax provisions by no means compensate for the effects of inflation on real capital gains and income, but they are a step in the right direction and will improve the environment in Britain for individ- ual accumulation of wealth.
Same Course for U.S.?
The economic problems of Britain and the United States have very different historical origins, but in- flation has introduced some interesting similarities. As Table VIII shows, American households now have a larger share of their total worth invested in dwellings and a smaller share invested in equities than was the case 10 years ago. Dwellings as a share of total worth in the U.S. have increased from 28 per cent in 1967 to 34 per cent in 1976.9 Corporate se- curities, by contrast, have shrunk from 31 per cent of
TABLE VIl: British Household Wealth (Billions of Pounds)
1966 1967 1968 1969 1970 1971 1972 1973 1974 1975 1976 Liquid Assets 18.2 19.2 19.9 20.3 21.4 23.2 26.2 30.1 33.5 34.8 37.4 Building Securities 5.8 6.9 7.7 8.6 10.1 12.0 14.2 16.3 18.4 22.5 26.1 Corporate Shares 19.4 24.1 30.8 26.6 25.0 34.1 41.2 28.9 14.8 22.1 25.9 Gov't Securities 3.4 3.4 3.0 3.0 2.5 4.1 3.3 3.6 2.5 5.4 7.0 Pension, Insurance 14.6 16.2 18.1 18.8 20.4 24.3 28.1 28.1 25.2 32.2 37.1 Other 8.8 8.7 8.4 8.6 8.6 8.7 8.8 9.3 10.9 12.1 13.4
Total Financial Assets 70.2 78.5 87.9 85.9 88.0 106.4 121.8 116.3 105.3 133.9 146.9 Dwellings 35.0 38.1 42.3 45.6 49.9 58.8 81.9 110.5 113.5 125.3 149.8
Total Worth 105.2 116.6 130.3 131.5 137.9 165.2 203.7 226.8 218.8 259.9 296.7
Shares/Total Worth 18.4% 20.7% 23.6% 20.2% 18.1% 20.6% 20.2% 12.7% 6.8% 8.5% 8.7% Dwellings/Total Worth 33.3% 32.7% 32.5% 34.7% 36.2% 35.6% 40.2% 48.7% 51.9% 48.2% 50.4% Gov't Securities/
Total Worth 3.2% 2.9% 2.3% 2.3% 1.8% 2.5% 1.6% 1.6% 1.1% 2.1% 2.4% Liquid Assets & Building
Securities/Total Worth 22.8% 22.4% 21.2% 22% 22.8% 21.3% 19.8% 20.5% 23.7% 22% 21.4%
TABLE Vil: U.S. Household Wealth (Billions of Dollars)
1967 1968 1969 1970 1971 1972 1973 1974 1975 1976
Liquid Assets 438.6 480.5 492.2 544.7 621.5 707.0 787.5 850.5 942.3 1,059.0 Corporate Stock 730.6 869.0 755.1 737.5 843.0 929.0 676.3 436.3 575.0 708.9 U.S. Gov't Securities 96.3 102.6 113.5 105.2 95.1 94.8 112.3 126.0 141.7 141.2 Other Securities 99.9 105.8 127.3 135.2 145.9 158.5 171.6 199.9 210.3 223.9 Insurance, Pension 326.6 356.8 372.7 400.6 446.2 502.4 501.3 501.2 577.3 655.1
Total Financial Assets 1,692.0 1,914.7 1,860.9 1,923.6 2,151.7 2,391.7 2,248.9 2,113.8 2,446.6 2,788.1 Dwellings (market) 663.6 754.7 816.6 850.0 882.5 976.8 1,097.8 1,244.2 1,349.3 1,460.4
Total Worth 2,355.6 2,669.4 2,677.5 2,773.6 3,034.2 3,368.5 3,346.7 3,358.0 3,795.9 4,248.5
Shares/Total Worth 31% 32.5% 28% 26.6% 27.8% 27.5% 20% 13% 15% 16.7% Dwellings/Total Worth 28.2% 28.3% 30.5% 30.6% 29% 29% 32.8% 37% 35.5% 34.4% Gov't Securities/
Total Worth 4% 3.8% 4.8% 3.8% 3.1% 2.8% 3.4% 3.8% 3.7% 3.3% Liquid Assets/
Total Worth 18.6% 18% 18.3% 19.6% 20.5% 23.3% 23.5% 25.3% 24.8% 25%
34 E FINANCIAL ANALYSTS JOURNAL / NOVEMBER-DECEMBER 1978
This content downloaded from 194.29.185.209 on Tue, 17 Jun 2014 21:11:51 PMAll use subject to JSTOR Terms and Conditions

total worth to 16.7 per cent over the same period. The magnitude of the swing is not as great as in Brit- ain, but the direction is the same; holding gains on personal real estate have become the household sec- tor's primary vehicle for protecting capital from in- flation.
The housing boom in the U.S. during 1976 and 1977 conformed to the usual contours of the busi- ness cycle; it helped to fuel the intermediate stage of the recovery as borrowers took advantage of the fi- nancial system's ample liquidity and low interest rates. But, as in Britain earlier in the decade, the American real estate boom has been prolonged and strengthened by an expansive monetary policy and
the refusal of the corporate sector to invest at any rate greatly exceeding internal cash flow.
Since 1975, American corporations have begun to adopt financial policies almost as conservative as those prevalent in Britain during most of the postwar period. U.S. firms are now emphasizing liquidity re- building and balance sheet strength, rather than ex- pansion of plant and equipment. As Table IX shows, the ratio of capital expenditures to internal funds was only 1.23 in 1977, and 66 per cent of the growth in business liabilities was matched by an increase in financial assets. In fact, by 1975 the ratio of financial asset growth to liabilities had reached its highest level since 1950.
TABLE IX: U.S. Financial Ratios (Flow of Funds) Non-Financial Corporations
(Billions of Dollars) Change Change Fi- Change Change Liquid
Internal Capital Expenditures/ Financial Change nancial Assets/ Liquid Assets/Fi- Funds Expenditures Internal Funds Assets Liabilities Liabilities Assets nancial Assets
1950-54 20.6 26.9 1.31 7.1 11.9 0.60 1.72 0.24 1955-59 30.5 34.04 1.12 9.94 16.5 0.60 1.64 0.17 1960-64 41.2 42.9 1.04 10.9 18.6 0.59 1.76 0.16 1965 56.1 61.9 1.10 20.2 34.7 0.58 2.6 0.13 1966 60.5 76.0 1.26 12.6 36.4 0.35 -.7 -.29 1967 61.3 72.6 1.18 16.8 32.0 0.53 4.8 0.28 1968 62.3 77.2 1.24 28.7 52.1 0.55 8.0 0.28 1969 61.7 84.3 1.37 28.3 56.7 0.50 2.3 0.08 1970 58.9 80.3 1.36 15.6 45.5 0.34 2.3 0.15 1971 68.6 86.0 1.25 28.6 58.5 0.49 7.7 0.27 1972 80.8 100.3 1.24 36.2 72.2 0.50 9.0 0.25 1973 83.8 123.3 1.47 39.3 96.9 0.41 6.7 0.17 1974 75.7 134.7 1.78 28.9 105.0 0.28 2.1 0.07 1975 107.8 98.6 0.91 33.7 40.6 0.83 17.8 0.53 1976 125.8 140.3 1.12 56.9 87.7 0.65 19.6 0.34 1977 136.4 168.4 1.23 79.5 121.1 0.66 20.5 0.26
TABLE X: Borrowing (U.S. flow of funds) (Billions of Dollars)
Borrowing Ratio
Household Sector Non-Financial Household/ Total Home Mortgages (% of total) Corporations N.F.C.
1950-54 12.1 7.3 (60%) 11.9 1.02 1955-59 16.9 10.8 (64%) 16.5 1.02 1960-64 23.5 14.3 (61%) 18.6 1.26 1965 31.4 17.1 (54%) 34.7 0.90 1966 23.9 13.4 (56%) 36.4 0.66 1967 26.7 13.4 (50%) 32.0 0.83 1968 36.1 17.1 (47%) 52.1 0.68 1969 31.9 18.5 (58%) 56.7 0.56 1970 24.1 14.1 (59%) 45.5 0.53 1971 48.7 27.0 (55%) 58.5 0.83 1072 72.3 41.6 (59%) 72.2 1.00 1973 75.8 47.1 (62%) 96.9 0.78 1974 49.0 35.4 (72%) 105.0 0.47 1975 51.2 38.0 (74%) 40.6 1.26 1976 96.3 61.2 (63%) 87.7 1.10 1977 135.6 86.8 (64%) 121.1 1.12
FINANCIAL ANALYSTS JOURNAL / NOVEMBER-DECEMBER 1978 cl 35
This content downloaded from 194.29.185.209 on Tue, 17 Jun 2014 21:11:51 PMAll use subject to JSTOR Terms and Conditions

With business so cautious, the great expansion in borrowing has come from the government and con- sumer sectors. The ratio of household borrowing to non-financial corporate borrowing was higher in 1975 than at any other time during the past decade (see Table X). And, as one might expect after a peri- od of inflation, much of this borrowing was financed through mortages monetizing the holding gains pro- duced by real estate appreciation.
If, despite strong demand, capital spending re- mains cautious because of low profitability and busi- ness conservatism, the American economy's con- sumption bias will gradually become self-reinforc- ing. Industry will become less capital-intensive and more labor-intensive. Employment will increase as firms substitute people and hours worked for ma- chinery and new factories. The growth rate of pro- ductivity will erode, with adverse long-term conse- quences for profitability and international competi- tiveness. Borrowing will remain dominated by confi- dent consumers and stimulative government, rather than business. In time, capacity will become inade- quate to satisfy the demand created by fiscal and monetary stimuli, supply constraints will intensify inflationary pressures, and each new burst of fiscal stimulus aimed at maintaining full employment will lead to a surge of imports triggering currency weak- ness, more inflation, higher interest rates and further erosion of business confidence-ad infinitum.
The 1974-75 worldwide recession was the deepest of the postwar period. As there is still ample unused capacity elsewhere, it is too soon to say that the American business caution of the past two years marks the start of a long-term trend similar to Brit- ain's. But the danger is clearly present. If American capital spending continues modest, and if U.S. tax laws continue to aggravate the depreciation prob- lem, the U.S. could settle into a long period of per- manently slower growth, with a highly conservative business sector providing funds for further expan- sion in government and consumer borrowing.
CANADA
Although less severe, the inflation problems of Canadian companies are in many ways similar to those British companies faced prior to 1974. Canada has price controls; it does not permit the use of LIFO accounting and, while a number of special in- vestment incentives aim to encourage capital spend- ing, tax depreciation is not adequate to cover the re- placement cost of assets.
Although the Canadian government has no im- mediate plans to permit LIFO accounting, it did in 1977 introduce a special inventory tax credit for companies. Firms can now subtract from their tax- able income an amount equal to three per cent of the
opening value of their inventory. As with British companies, it makes no difference whether an in- crease in the value of the inventory reflects volume or price.
While welcomed by the business community, this measure is still only an interim solution to the work- ing capital problems created by inflation. The On- tario Committee on Inflation Accounting estimates that the credit will return only $350 million of the $900 million that Canada's FIFO based tax system collected on inventory profits last year. The scheme is also more beneficial for certain industries than others: The Committee estimates that merchandising companies will get back 58 per cent of their invento- ry profits, while general manufacturing companies will recoup only 36 per cent of them. Hence the On- tario group calls the three per cent inventory deduc- tion "a rough form of justice."10
Inadequate as the inventory tax relief may be, it does allow Canadian companies to enjoy the best of both worlds. FIFO accounting remains in effect for reporting to shareholders, so shareholders' profits continue to be boosted by inventory holding gains. But the deduction allows companies partial tax relief on these profits. And the gains are not obscured by special provisions for deferred tax payments.
As can be seen from Charts A and B, inflation has had the same general effect on Canadian companies as it has had on American companies. Real rates of return have declined, dividend payout ratios have shrunk, and share multiples have been eroded. The Canadian corporate sector needs more tax relief than it has so far received; but relief will have to wait until the government's budget deficit is smaller and until the accounting profession is prepared to accept the use of LIFO accounting. In the meantime, Canada has provided some inflation provisions for individuals by indexing personal deductions and ex- empting from all tax the first $2000 of dividend and interest income.
AUSTRALIA
Australia, too, has price controls and does not allow LIFO accounting for either tax or financial report- ing. While the depreciation code offers attractive in- vestment incentives, especially for energy-related development, it is not sufficiently generous to close the growing gap in the manufacturing sector between the historical and replacement cost of assets. In fact, Australia's largest company, Broken Hill Proprie- tary (steel, oil, mining) makes a special replacement cost depreciation adjustment beyond that permitted by the tax system. In 1977, this adjustment reduced historical cost profit by 63 per cent-from $172.1 million to $64.8 million.
Because of the working capital problems created
36 E FINANCIAL ANALYSTS JOURNAL / NOVEMBER-DECEMBER 1978
This content downloaded from 194.29.185.209 on Tue, 17 Jun 2014 21:11:51 PMAll use subject to JSTOR Terms and Conditions

Chart A: Dividend Payout Ratios on Reported and Adjusted Earnings, 1971-75 (279 Large Canadian Non-Financial Companies)
163%
110%
91% 92%
64% SAverage 57% Dividend
???? ----- - -Payout 48% Ratio
ooe~~~~~11" ~~~~41% in 1965 35% 34%
1971 1972 1973 1974 1975
|////| Unadjusted Earnings
Adjusted Earnings
by the use of FIFO, the Australian government was forced to introduce tax relief for inventory profits in 1976. The Trading Stock Valuation Adjustment (TSVA) allows companies to subtract from their tax- able income an amount equal to 50 per cent of the difference between the opening value of inventory and that value multiplied by the goods component of the Consumer Price Index. As in Canada, the deduc- tion provides only a crude form of relief from the effects of inflation on working capital. All com- panies with inventory benefit, but the measure ob- viously favors those with large opening inventories or high inventory to income ratios. Furthermore, its reliance on the goods component of the Consumer Price Index tends to overcompensate those com-
panies whose inventory prices rise less than the general index and penalize those whose inventory prices rise more.11 But Australian companies, like Canadian companies, can continue to report inflated FIFO profits to their shareholders while still receiv- ing some tax relief on inventory gains.
Australia's 1977 budget contained no further in- flation adjustments for business despite the Mathews Inflation Accounting Committee's recommendation that taxation be based on current cost accounting. Apparently, Australia's conservative government did not want to appear too pro-business at a time when it was asking the trade unions for wage restraints. In- stead, it symbolically increased the official corporate tax rate (from 42.5 to 46 per cent) while providing
FINANCIAL ANALYSTS JOURNAL / NOVEMBER-DECEMBER 1978 O 37
This content downloaded from 194.29.185.209 on Tue, 17 Jun 2014 21:11:51 PMAll use subject to JSTOR Terms and Conditions

Chart B: Inflation and Stock Prices - Comparison of Canadian Share Values with Reported and Adjusted Corporate Profits, 1971-1975
(279 Large Canadian Non-Financial Companies)
Corporate Profits Share Values* (Billions of Dollars) (Billions of Dollars)
5.0-
4.0- 80.0 Reported
3.0- 60.0
__~~~~~~~~_ ~~Share
2.0 - 40.0
Ad sted 1.0- Profits 20.0
I I I I I 1971 1972 1973 1974 1975
*Share values represent outstanding shares multiplied by average share prices. Source: Bossons, Impact of Inflation, Table 62.
special inventory and depreciation allowances that reduced the effective tax rate. It has taken a back- door approach to adjusting business taxes for infla- tion.
HOLLAND
Although the Dutch have previously allowed infla- tion accounting only for financial reporting, they are now giving serious consideration to proposals for far-reaching inflation adjustment of the tax system. The proposals were developed by a special govern- ment-appointed committee working under the chair- manship of Professor H.J. Hofstra, a former Socialist Minister of Finance.
The Hofstra program combines a mixture of dif-
ferent inflation accounting methods. It would adjust depreciation and cost of sales charges for inflation in order to reduce taxable profits. But the adjustment would be based on a single price index, rather than on a variety of indexes and valuation methods tied to individual assets; Hofstra feared that multiple index- es would prove too confusing and unwieldy. Like the proposals of the Hyde Committee in Britain and the inflation accounting committee in New Zealand, the Hofstra program recognizes the distinction between inflation gains accruing to providers of borrowed capital and those accruing to providers of equity capital: Assets funded by debt would not be eligible for inflation correction. Equity owners would, how- ever, benefit from an adjustment for the effects of in-
38 0 FINANCIAL ANALYSTS JOURNAL / NOVEMBER-DECEMBER 1978
This content downloaded from 194.29.185.209 on Tue, 17 Jun 2014 21:11:51 PMAll use subject to JSTOR Terms and Conditions

flation on the real value of retained earnings. Its proposals for tax treatment of interest income
and expense perhaps constitute the most revolution- ary part of the Hofstra program. To reduce the effect of inflation on interest payment taxes, it would, at two per cent inflation, make 20 per cent of interest income tax exempt; at six to eight per cent inflation, one-half of interest income would be tax exempt; and at 15 per cent inflation, three-quarters of inter- est income would be free from tax. The system would work in reverse for those paying interest: At two per cent inflation, only 80 per cent of the in- terest payments would qualify for tax deductions; at six to eight per cent, half would qualify, and so on.
If accepted by the government, the Hofstra pro- posals would be introduced over a five-year period, giving the economy and financial system time to ad- just. It is estimated that the scheme would cost the Dutch Treasury $270 to $320 million in foregone business taxes during the first year. But these losses are expected to be recouped by 1983, through the elimination of many existing loopholes.
Dutch industry has generally responded favorably to the Hofstra proposals, but there is strong opposi- tion building among real estate interests. They con- tend that the reduction in tax benefits for interest ex- pense would trigger a sharp rise in mortgage repay- ments and cause a slump in the housing market. The initial response of the Amsterdam Stock Exchange was a mark down in shares of mortgage bankers.'2 It will take the Dutch parliament some time to explore all the intricacies of the Hofstra recommendations. Meanwhile, the government is pressing for a set of interim inflation adjustments in the tax system that would reduce taxable earnings by three per cent in- itially and, ultimately, by an amount corresponding to one or 1.5 per cent of a firm's equity. This does not constitute tax inflation accounting in the formal sense, but it does improve cash flow and business li- quidity.
The Dutch inflation rate has declined from 10 per cent in 1975 to only 5.5 per cent recently, so the need for indexation of the tax system is less pressing than it was earlier. There has also been a change of government in Holland since the Hofstra committee was appointed, and the new administration is likely to be less responsive to many of the Hofstra pro- posals. But Holland now faces the problem that Brit- ain may well have to contend with at the end of the next decade: Its large reserves of natural gas are starting to run out. Without the export cushion pro- vided by gas sales, Holland will have to depend more on its export of manufactured goods. It needs to re- generate its industrial base, and tax changes of one kind or another will probably be enacted to en- courage more investment in the manufacturing sec- tor.
BRAZIL
Over the past decade, Brazil has had the unusual and happy experience of a strong economy and buoyant stock market, despite high inflation. During the late 1960s and early 1970s, it achieved levels of real growth comparable to those enjoyed by Japan, not- withstanding an inflation rate averaging 40 per cent.
TABLE Xi: Brazil's Economic Performance Average Annual Growth Rates
1950-60 1960-73 1965-73 Gross National Product 6.2% 6.6% 9.0%
(Constant Prices) Gross Domestic Investment 7.4% 8.5% 13.6%
(Constant Prices) Retail Price Index N.A. 39.7% 22.9%
The Brazilian government had imposed a system of inflation indexation after the 1964 revolution. At that time the inflation rate was running in excess of 100 per cent, tax collection had broken down and the financial system was in chaos. Fearful that an at- tempt to reduce inflation drastically would plunge the economy into recession, the new government decided instead to neutralize it by introducing monetary correction. Since then, inflation indexes have been regularly applied to company accounts, government bonds, bank deposits, rents, loans, pen- sions and other financial obligations. In order to keep Brazilian exports competitive, the Cruzeiro is also devalued on a crawling peg basis.
Corporate taxes are adjusted for the effect of infla- tion on both asset replacement costs and working capital requirements. Fixed assets are annually re- valued by the wholesale price index and deprecia- tion charged on the revalued basis rather than on historical cost. Companies credit the surplus to a re- serve, and match it by an increase in either the num- ber of company shares outstanding or their nominal worth. Stock dividends created by this process are added to the original cost of the investment and are free of tax. Companies also adjust working capital by the wholesale price index and transfer any gain from net liability exposure to reserves. If the working capital adjustment produces a loss, taxable profits are reduced.
Several changes have been made in the system since its introduction in the 1960s. Some items not originally indexed, such as pre-paid expenses, are now included in the adjustments. The government also decided, in 1977, to adjust financial statements by the index used to correct government bonds, rather than by the wholesale price index. Despite these changes, the basic approach of single indexa- tion for inflation has remained intact. Chile, in fact, recently adopted the system in the hope of coping with its stubbornly high inflation rate.
FINANCIAL ANALYSTS JOURNAL / NOVEMBER-DECEMBER 1978 Ol 39
This content downloaded from 194.29.185.209 on Tue, 17 Jun 2014 21:11:51 PMAll use subject to JSTOR Terms and Conditions

IMPLICATIONS FOR THE U.S.
It is difficult to compare inflation adjustments in personal tax systems around the world because of the special circumstances affecting loopholes and national tax paying habits. Marginal income tax rates are high in Britain and other northern Euro- pean countries because their populations have a history of respect for civic institutions and tax law. No such traditions exist in southern Europe or Latin America, and governments in that region have to rely more on sales taxes than on income taxes. What might appear to be a pro-investment tax policy in some countries is therefore a function of historical accident or necessity, rather than purposeful design.
A review of tax policies in other countries does, however, suggest that the U.S. has lagged in provid- ing tax recognition of the effects of inflation on divi- dends and capital gains. There are no capital gains taxes in Australia and Germany. The maximum tax rates on capital gains in other industrial countries are all less than those prevailing in the U.S. The ma- jority of European countries, moreover, have taken action to reduce double taxation of dividends. While the U.S. has, admittedly, been generous with its tax treatment of mortgage interest, this has only biased the financial system in favor of real estate investment at the expense of equity investment. Home owner- ship is an important and worthwhile political objec- tive, but so is equity capital formation. The U.S. tax system-particularly, as we pointed out earlier, in the area of depreciation allowance-penalizes capital formation.
A few years ago, it was commonly believed that the U.S. government would adjust the tax system for inflation only after financial statements had been corrected. While comprehensive and far-reaching inflation adjustments probably would require a new accounting system, the experience of other countries has demonstrated that it is possible to introduce sig- nificant piecemeal tax adjustments independent of comprehensive accounting reform. These adjust- ments can take the form of shorter write-off periods for assets, inventory profit relief, capital gains allowances, investment tax credits, higher thresholds for dividend taxation, etc. In fact, such back-door adjustments for inflation may actually be preferable to wholesale tax reform because they are more ac- ceptable politically. It is difficult for most Congress- men to defend across-the-board reductions in cor- porate tax rates; it is much easier for them to support investment tax credits or depreciation changes, which often have a similar effect on cash flow. The first resembles a giveaway, the other can be sold as a direct incentive to produce jobs.
Inflation accounting proposals in other countries often led, or at least complemented, public policy changes that aimed to compensate business for the effects of rising prices. But what ultimately pushed governments in Britain, Canada, Australia and elsewhere into accepting major tax and price control changes was simple necessity: Governments had to reduce effective corporate tax rates in order to im-
prove profitability and restore liquidity, or else risk high unemployment and industrial stagnation. New forms of accounting merely dramatized or quantified the impact of inflation on real profits. What has hap- pened in foreign countries also applies to the United States: Inflation accounting can play an instructive role by illustrating the nature of the tax changes business requires, but it cannot materially influence public policy until the government feels strong pres- sure to improve the environment for capital forma- tion, investment and growth. a
Footnotes 1. Richard W. Kopcke, "Current Accounting Practices
and Proposals for Reform," New England Econom- ic Raview, September-October 1976.
2. Writing down the assets would reduce depreciation charges and improve reported profits in subsequent years, but the net effect on shareholders would still be negative.
3. Dr. George Terborgh of the Machinery and Allied Products Institute argues that the $17 billion depre- ciation adjustment in 1977 was too conservative because the Commerce Department computed it on a straight line rather than accelerated basis. If ac- celerated methods were to be used in computing the adjustment, Dr. Terborgh contends it would have been $21.5 billion. In July of 1978, the Commerce Department reestimated the deflator for business in- vestment in the national income accounts and reduced the current cost depreciation adjustment for 1977 to $14.7 billion. The Department maintains that its earlier estimates of price increases for busi- ness equipment and structures were too high.
4. Estimates of the Department of Trade and Industry, 1977.
5. Christopher Johnson, Anatomy of U.K. Finance 1970-75 (London: Financial Times, 1976).
6. "Crisis Point for the P/E Ratio," Financial Times (London), 3 April 1978.
7. Report of the Price Commission (London: Her Ma- jesty's Stationery Office, 1976).
8. Adriene Gleeson, "The Private Investor Grows in Wisdom," Financial Times (London), 8 February 1978.
9. The British household balance sheet comes from data supplied by the Royal Commission on the Distribu- tion of Income and Wealth. The American household balance sheet was constructed from data from the Federal Reserve Flow of Funds Account and from es- timates of the value of aggregate household equity in homes from the Goldman Sachs monthly economic publication Pocket Chartroom.
10. Michael Alexander, Report of the Ontario Commit- tee on Inflation Accounting (Toronto: Ontario Government Bookshop, 1977).
11. "Green Light for the Private Sector" (Meares and Philips, stock brokers, Sydney, Australia, August 1976).
12 "Dutch Inflation Accounting," The Economist (London), 1lMarch 1978.
Editor's Note: We neglected to acknowledge that Table I of Part One of this article, "Inflation Accounting in the 1 970s" (in the September/October Journal), was reproduced from an article by George Lent, "Adjustment of Taxable Profits for Inflation," International Mone- tary Fund Staff Papers, November 1975.
This content downloaded from 194.29.185.209 on Tue, 17 Jun 2014 21:11:51 PMAll use subject to JSTOR Terms and Conditions