Embed Size (px)
Citation preview
Iran. Econ. Rev. Vol.18, No.1, 2014.
Inflation and Money supply growth in Iran: Empirical Evidences from Cointegration and Causality
Sedigheh Atrkar Roshan
Received: 2012/08/11 Accepted: 2013/04/16
Abstract
nflation has been one of the main economic problems over the last three decades in Iran. This paper investigates the growth of money
supply (in terms of M1 and M2) and price nexus for Iran, through the cointegration and causality techniques. The main purpose of this paper is to determine whether inflation in Iran has been caused by excessive monetary expansion over this period, or whether the money supply has merely been passive in the inflationary process. It covers the seasonal data from 1988 to 2010. The Johansen cointegration test results suggest that the variables are not cointegrated. The findings also indicate that there is a bidirectional relationship between money supply (in terms of M1 and M2) and price level (in terms of CPI and WPI) during the period under study. These findings are consistent with the view that in a high inflationary economy, inflation does have a feedback effect on money supply growth and this generates a self-sustaining inflationary process. Keywords: Money Supply, Inflation, Causality, Cointegration, Iran.
1-Introduction
Over the past three decades, inflation has been one of the major problems of the world economy, particularly the economies of developing world. Inflation not only affects the life of individuals, institutions and business activities, but also affects the performance of the governments and makes difficult for them to plan for the future. Among the devastating effects of the rise of price level is the redistribution of wealth in favor of the property owners and to the detriment of the rights of people with fixed salaries. Increased uncertainty and the shortening of the decision making time
Assistant Professor; Department of Economic University of Alzahra Tehran, Iran.
I
132/ Inflation and Money supply growth in Iran: Empirical Evidences…
horizon, and decreasing long-term investment as a consequence could be categorized as other effects. The uncertainty of inflation causes the uncertainty of real value of future nominal payments. This affects the efficiency and proper allocation of resources and economic activities, (Holland, 1993). As according to Fisher, (1993) a growing body of evidence suggests that inflation leads to lower economic growth. Inflation, particularly if it is prolonged and unrestrained, not only hinders the economic prospect of a country, but also increases social injustice and it can put economic development and political stability ultimately at risk. As Khan and Senhadji (2000) examined this relationship separately for industrial and developing countries and suggest that “the threshold level of inflation above which, inflation significantly slows growth is estimated at 1 -3 percent for industrial countries and 7 -11 percent for developing countries”.
So due to these destructive effects, inflation control is one of the objectives of macroeconomic policies, which has always been emphasized by economists. In this regard, one of the goals of the governments is usually to maintain macroeconomic and price stability and prevent excessive fluctuations of prices. Dealing with inflation and its control requires analyzing the determinants of inflation and their policy implications. Incidentally, the determination of the causal pattern between money supply and price level has important implication for policy maker choice of appropriate policies. If the level of prices is linked to the money stock in the long-run, the central bank can then conduct a more effective monetary policy. This means that the money holdings may be the significant indicator of the monetary policy restrictiveness and may support forecasting of the future development of inflationary processes. In other words, if causality result for monetarist view (i.e. money supply Granger causes aggregate prices) is stable, monetary policy will be the effective price stability instrument. Otherwise, the uses of contractionary monetary policy to combat inflation will detriment the economic development in a country.
The main purpose of this paper is to determine whether inflation in Iran has been caused by excessive monetary expansion over the period 1988 to 2010, or whether the money supply has merely been passive in the inflationary process. An analysis of this nature is important for
Iran. Econ. Rev. Vol.18, No. 1, 2014. /133 monetary policy since it provides some guidance in determining the long-run causes of inflation in Iran. Hence, it is of utmost importance for this study to investigate the causal relationship between money supply and aggregate prices.
The rest of the paper is organized as follows; Section two presents an overview of the theoretical literature of the subject. The next section considers the general trend of inflation in Iran's economy, whilst the fourth section reviews the empirical literature. The following part, gives a brief outline of the data, model and econometric techniques used in this study. The sixth section present empirical results. Finally, the last section deals with the conclusions that are drawn. 2- Theoretical Framework:
Various theories and views have attempted to explain the causes of inflation and provide appropriate solutions to deal with it. Based on quantity theory of money, inflation is purely a monetary phenomenon, and is created by the expansion of money supply, in excess of demand. In other words, the increase in the general price level in the economy is the result of a high rate of expansion of money supply. According to these economists, increasing in money supply leads to inflation in the long run and will have no effect on growth of a product. This implied that the direction of causality should run from money supply to aggregate prices. Therefore contraction monetary policy is introduced as an appropriate tool to fight inflation. Quantity theory of money has been formulated by Fisher's exchange equation and the equation of Cambridge, proposed by economists of Cambridge University.
A. Fisher's exchange equation:
Irving Fisher presented his analysis through equation of exchange:
MV= PY (1)
Where , M is the total volume of money reserves, V, velocity of money , P, general price level, and Y is real income. According to this theory, with the assumption that velocity and output are constant (at least in the short
134/ Inflation and Money supply growth in Iran: Empirical Evidences…
term), when the quantity of money increase (e.g. X percent), then prices will increase proportionally (X percent).
The money supply is determined outside of the system, namely it is exogenous, income velocity of money is independent of the other variables. Under these assumptions the equation of exchange can be written as the theory of price determination. The equation can be written into price equation as :
Y
MVP
B. Cambridge equation:
Is proposed by the economists at Cambridge University and its mathematical form is:
)2( M = k P y
The economists of Cambridge school have adopted the same assumptions of Fishers' model (about constant production level and velocity). Accordingly, any change in the money stock will lead to proportional change in the general price level.
However, the Quantity theory encountered heavy criticism from Keynesians, which can be summarized in the following points: Keynes argued that the velocity is extremely unstable and that it might passively adapt to independent changes in the other variables. For example, in above equation, the impact of any change in “M” might be absorbed by an offsetting change in “V” and hence would not be transmitted to “P”. Keynes maintains that only if production and employment are fixed at full capacity would monetary- induced changes in spending manifest themselves on prices .If the economy was operating at less than full employment changes in spending would affect output and employment rather than prices. According to this theory,” inflation is a monetary phenomenon in the long run”. This means that the continuous growth of the money supply will cause inflation. On the other hand, the high rate of inflation will not continue for a longtime without money growth.
The structuralists’school of thought has challenged the monetarists view too. They argued that the excessive money supply is a consequence rather than cause of inflation, particularly in less developed economies. According
Iran. Econ. Rev. Vol.18, No. 1, 2014. /135 to structuralists’ school, the root cause of inflation is the structural bottlenecks in the development process (Masih and Masih, 1998)a. Under this view, the causal relationship between money supply and aggregate prices is expected to run from aggregate prices to money supply.
Although theoretically it is possible to distinguish between statements of monetarist and fundamentalists, but doing so is somehow difficult, because both inflation outlook is associated with high rates of money growth. On the other hand, as Friedman (1977) argued, inflation leads to inflation uncertainty and that inflation uncertainty adversely affects economic activity. Thus, in his view, there is no long-run trade-off between inflation and unemployment (the Phillips curve) instead, there could be a positive relationship between inflation and unemployment given that inflation and inflation uncertainty may adversely affect economic growth and raise unemployment. Ball (1992) later derived Friedman’s views formally in an asymmetric repeated information game where the public faces uncertainty about the monetary authority. As a whole, for an understanding of the inflationary process in the developing countries, the theme of the relevant literature is that, inflation in the large run is mainly determined by the growth rate of the money supply.
In order to solve the mentioned theoretical conflict, researchers have conducted numerous empirical studies in both developed & developing countries on the direction of causality between money supply and the general price level. The following section provides an overview of these studies.
3- A Review of Empirical Literature
Despite the fact that the causal relationship between inflation, and money growth, has been investigated in the literature over the recent decades, previous empirical studies have produced mixed results. Harberger (1963) presented a regression equation for determining the factors affecting inflation in Chile .To justify the cost posh view he added the wage variable to the model and then concluded that, it has not increased the explanatory power of the regression. Vogel (1974) following Harberger investigated the effects of changes in the money supply on the general price level in 16 countries of Latin America. Based on these results, an increase in the growth rate of the money supply causes the inflation increase at the same rate. Aghevli and Khan (1978) in an article entitled “budget deficit and inflation
136/ Inflation and Money supply growth in Iran: Empirical Evidences…
process in developing countries” studied the causal relationship between money supply and prices for several countries. Their results indicated a bidirectional causal relationship between the relevant variables. By providing a dynamic model they attempted to explain the inflationary process in these countries.
Lee and Lai (1983) examined causality between money, prices and income for Singapore. Their findings showed a bidirectional causal relationship between money and income, and also a unidirectional causality from money to prices. Abdullah and Yusop (1996) used quarterly data from 1970 to 1992 to analyze the causal relationship between growth rate of money supply and inflation rate in Malaysia. They discovered a unidirectional causality runs from money supply to inflation rate. Results of the studies of Bengali et al (1999) indicated the direction of causality from money supply to prices in Pakistan. Masih and Masih (1998)a employed the Granger causality test, modified Sims causality test and vector error-correction modelling (VECM) approach to examine the causality direction between money supply and aggregate prices in a number of Southeast Asia economies. Their findings are implied that money supply (M1 and M2) Granger causes aggregate prices in countries like Malaysia.
In another study by Abbas and Hussain (2007) conducted a study to find causal relationship between money and prices in Pakistan. Unlike Bengali (1999), their research findings, show a bidirectional relationship between the two variables. Lahura (2010) in his paper provided an empirical evaluation of the relevance of monetary aggregates in the conduct of monetary policy in Peru. Based on recursive analysis of vector error correction models, they found that M3 is the only monetary aggregate that helps forecast inflation in Peru and therefore can be useful in monetary policy. In this study, no clear evidence about the usefulness of any other narrower monetary aggregate either as a potential monetary policy instrument or as an information variable was found. Asongu, (2013), examined the real effects of monetary policy using a series of estimation techniques in inflation-chaotic African countries for the period 1987-2010. By using VARs technique within the frameworks of VECMs and Granger causality models, the long-run and short-run effects respectively were estimated in this study. His results show that, 1- Monetary policy variables affect prices in the long-run but not in the short-run. 2-
Iran. Econ. Rev. Vol.18, No. 1, 2014. /137 Monetary policy variables influence output in the short-term but not in the long-term.
In Iran, the relationship between liquidity and inflation was investigated in a number of studies. While in others, the effect of cost factors on inflation and exchange rates was considered. Regarding the causes of inflation in Iran these studies generally emphasized on the effects of monetary factors, cost and structural factors. In contrast, only small number of studies investigated causality relationship between money supply and inflation in Iran, which mostly covered years before 1380 (2001) and have not achieved a similar results. I
Kazerooni and Asghari (2002) tested the inflation in Iran by using Johansen-Josilius cointegration method. Their results showed that inflation and money growth are cointegrated, and one percent increase in money growth leads to 0.9% increase in inflation in the long term. Hence, the hypothesis of the existence of one to one relationship between the above variables could not be rejected, this itself, increases the validity of monetarists proposition.
Sahraiean and Zibaei (2004) investigated the causal relationship between money supply and prices of agricultural products in the period of 1961 to 2000 (1340 to 1379 Iranian calendar) using Granger causality test. Their results showed that wholesale agricultural products index and money supply have a bilateral causal relationship. However, in case of retail agricultural products and money supply, the direction of causality is from money supply to prices. Abbasnejhad and Tashkini (2005) identified the factors affecting inflation in the Iranian economy over the 1338 -1380 period in their research, by applying Auto Regressive Distributed Lag (ARDL) method and Johansen-Josilius method. The results indicated that, liquidity variable after import price index and gross domestic product, has the second most significant impact on the consumer price index. They concluded that, inflation is not purely a monetary phenomenon in the Iranian economy and real factors are also effective in this phenomenon. In a study conducted by Tayebnia (2005), he investigated the relationship between inflation and appropriate monetary model by using Harberger model for the period of (Iranian calendar of) 1340 to 1370 for Iran. He came to the conclusion that despite the direct and significant relationship between money stock and inflation, a one by one relationship
138/ Inflation and Money supply growth in Iran: Empirical Evidences…
between these two variables could not be accepted. The causal relationship analysis between money supply and prices also implied an absence of this link between these two variables In Iran. Accordingly, monetary theory did not fully explain the behavior of prices in the country and the correlation statistics between money supply growth and inflation could not be interpreted as the reason of any causal relationship. Bidgoli and Bajelan (2008) used an auto regressive conditional heteroskedasticity model to test the quantity theory of money in the periods of 1340 – 1384. Their results indicated that although there is not a one to one relationship between liquidity and inflation, but there is a statistically significant relationship between these two variables. Hadian and Parsa (2008), investigated the impact of liquidity change in Irans’ inflation over the 1961- 2005 period. Using ARDL technique, they found that a one percent increase in liquidity in period of for instance “t” lead to 0.42 percent increase in the same period, 0.19 percent in the period of t+1, and 0.27 percent in the period of t+2. Tayebnia and Mollaie (2010), also investigated the link between money and inflation in Iran. By applying a VECM model, their findings indicated that the money variables are the most important factor in explaining inflation in Iran. However, their results show that there is not a one to one relationship between money supply and inflation in Iran.
Despite the fact that the causal relations between inflation, and money
growth, have been studied in the literature, previous empirical studies have produced mixed results, and remain inconclusive on the nature and direction of such links. In other words, the causal nature of these relationships is known to exhibit considerable variation across countries, and there is a call for more empirical investigation for specific cases. The choice of Iran is justified on the grounds that the country experienced severe episodes of high inflation in recent decades and especially recent years. Inflation in Iran
The study period was coincided with the increase in liquidity, and significant growth of consumer price index (CPI).
Iran. Econ. Rev. Vol.18, No. 1, 2014. /139
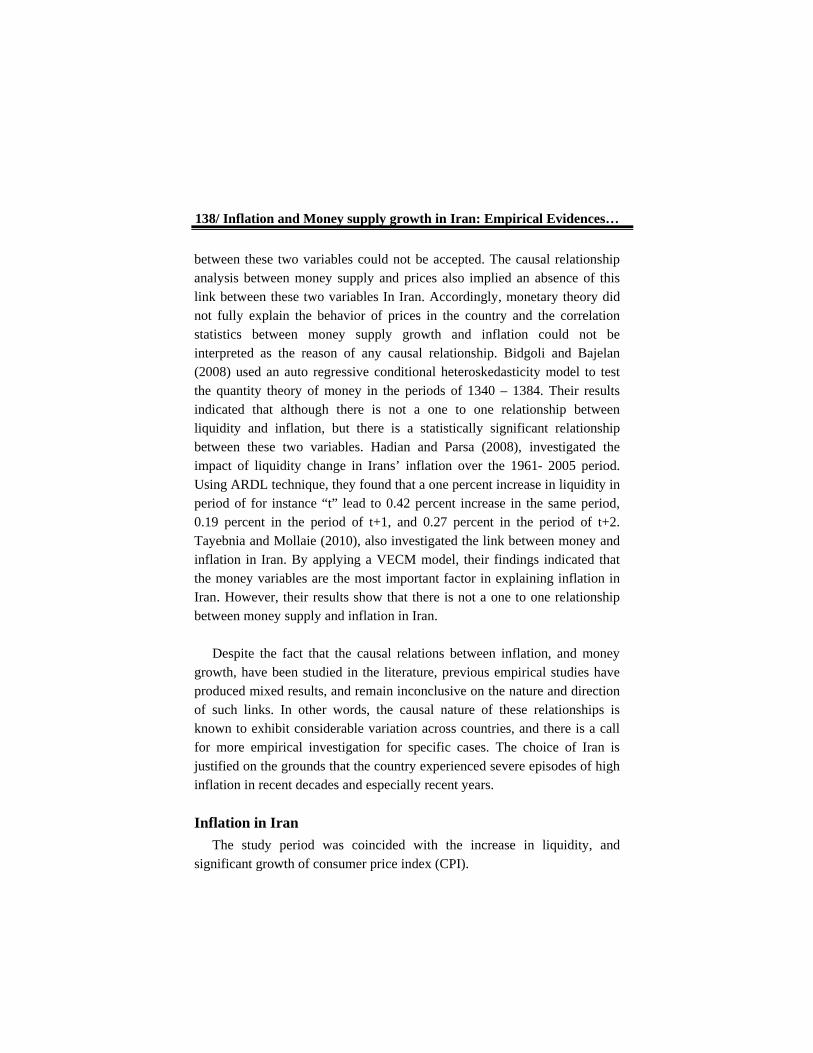
Figure 1: GrowthR of M1, CPI, and WPI Based on CBI (Central Bank of Iran) data, over the period under study,
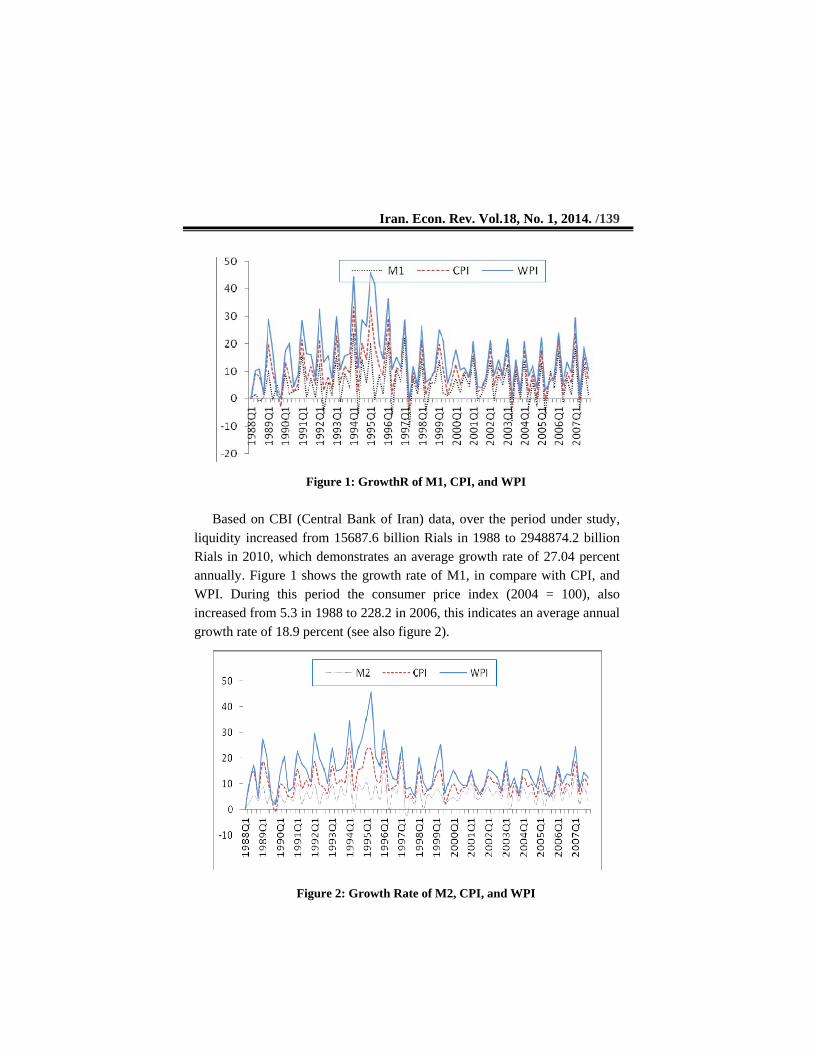
liquidity increased from 15687.6 billion Rials in 1988 to 2948874.2 billion Rials in 2010, which demonstrates an average growth rate of 27.04 percent annually. Figure 1 shows the growth rate of M1, in compare with CPI, and WPI. During this period the consumer price index (2004 = 100), also increased from 5.3 in 1988 to 228.2 in 2006, this indicates an average annual growth rate of 18.9 percent (see also figure 2).
Figure 2: Growth Rate of M2, CPI, and WPI
140/ Inflation and Money supply growth in Iran: Empirical Evidences…
Model, Econometric Techniques and Data
Since the causality test can be performed in various ways, stationary and non-stationary variables and relation of probable integration between them is an important factor that affects the selection of appropriate technique. The model was estimated in this paper, is a function of macroeconomic variables. On the other hand, there is a tendency in most macroeconomic time series that move together in the same direction. Therefore, to avoid spurious regressions the formal investigation starts with examining the stochastic properties of the variables used in the analysis. In other words, since first step in the empirical analysis is performing unit root tests and determining the order of integration of the relevant variables, using Eviews programme the time series properties of data and the order of integration is investigated for stationarity. To this end, the Augmented Dickey-Fuller (ADF) tests are carried out on the time series. Besides, since the relevant time series may contain a structural break, the ADF tests may be biased by not rejecting the null hypothesis of a unit root. The second unit root test statistics which are examined before causality tests is the Phillips and Perron (1988) test.
Usually, in order to investigate the causality between macroeconomic variables, Granger’s causality test is used to evaluate causal relationship between variables. In causality tests, the question is, whether it can be said that changes in X causes changes in Y or vice versa or, is there a feedback relationship between them? This analysis suggests that if the past values of time series variable (Yt) can significantly predict the values of Xt +1 (compared with the case in which, that values are not used), then it can be said that Y is a Granger cause of X and vice versa.
k
i
k
itttttt uxyy
1 111 (3)
In Granger causality test, a vector autoregressive (VAR) model is estimated as in equation 3. Furthermore, lag length K is arbitrary in this test, (although, the test is very sensitive to the choice of the lag length). Based on Geweke (1984) the validity and reliability of this test is depend on VAR model degree and stationary of dependent variables. Granger (1986) argued that, the test would not be valid, if the variables are cointegrated. Also, if the variables are integrated of order one I(1), but not cointegrated, a VAR model
Iran. Econ. Rev. Vol.18, No. 1, 2014. /141 is made on the first differenced variables and the model is then estimated. Secondly, the lag length is not arbitrary, i.e., the choice of lag length in Granger causality test is very sensitive, and the various lag length would often lead to different results. As, based on Cheng and Lai (1997), If the lag order used is less than the optimal lag, the regression estimates will be biased and the residuals will be serially correlated. If the order of lags used exceeds the optimal lag length, the power of the test is likely to be reduced. Several studies conducted by economists, e.g. Hwang et al (1991), Cheng and Lai (1997) show that causality test with Hsiao have strong and reliable results than other methods that the lag length is determined arbitrary.
Therefore, to overcome these problem, Hsiao (1981) provided a systematic auto regressive method for selecting the appropriate lag length. He adopted the minimum Final Prediction Error (FPE) proposed by Akaike (1969), and suggested a two step procedure. His synthesis allows determination of the optimal lag length for each of the variables employed in the Granger test on the criterion of minimum FPE, and thus avoids ambiguity in the arbitrary choice of the lags. In other words, the advantage of using FPE is that it balances the risk of the bias from choosing a lower lag against the risk of an increased variance when a higher order is chosen. Additionally it does not constrain the lag to be the same and is equivalent to applying an F test with varying significance levels. We hence rely on the sequential approach of Hsiao (1979, 1982) to test for Granger causality, which in particular circumvents problems associated with lag length selection. This procedure has been applied in e.g. Hsiao (1979, 1982) and Gries, et al (2008). Hsiao provided a two step procedure including:
First, a series of auto regressive models is estimated, and the dependent variable is regressed on its own lagged value. The estimated regression at this stage is as follows:
m
ittit BB
111 (4)
In which “i" is from 1 to m and represents the lag length. To find the optimum number of lags that minimize Final Prediction Error, FPE(m), the corresponding FPE is calculated using;
142/ Inflation and Money supply growth in Iran: Empirical Evidences…
TmSSEmT
mTmFPE /)(
1
1)( *
T is sample size, m* is the lag length that minimizes FPE , "m" is the
optimum number of lags when (B) is regressed against its own lags, and SSE is the associated sum of squared residuals. Where m* is determined, to find out the optimal number of lags, the following regression equation is estimated in the next step:
*
12
11
m
it
n
jjtjtit AyBB
At this stage B is treated as a controlled variable with the optimum number of lags chosen from the first stage. A is treated as a manipulated variable with the varying order of lags. This step is used to find the number of lags that minimize FPE (m*, n).
TnmSSEmT
mTnmFPE /).(
1
1)( *
*
**
where n is the order of lags on A, the optimum value of n, is chosen to
minimize FPE(m*,n). This procedure concludes that, , causes Bt, if, FPE(m*).>FPE(m*,n) vice versa. By repeating the same procedure for the equation when the At is the dependent variable can be detected.
In the light of the above discussions, following Hsiao procedure various equations as the same as the equations of 7 to 11 with different lags are estimated.
k
itttt GMCGM
11111 11 (8)
k
it
L
iittittt GCPlGMCGM
12
1222 11 (9)
Iran. Econ. Rev. Vol.18, No. 1, 2014. /143
N
iatitatat GCPlCGCPl
1
(10)
M
it
N
ittittt GCPlGMCGCPl
14
11444 1 (11)
Where M1 is money supply (definition of narrow money), and CPI is consumer price index. The same equations are then estimated for M2 (definition of broad money) and WPI (wholesale price index) as dependent variables too. All the variables in terms of growth rate are included in the model. Furthermore, after above procedures and following, Bahmani-Oskooee et al (1991) the direction of causality, i.e. whether positive or negative, and a further test of causality using F statistic are also investigated in this research. "F" test provides a further consistency check on causality and an additional test of findings. So following these economists the F test is calculated as;
FSSE SSE n
SSE T m nc u
u
( ) /
/ ( )1
where T, m and n have the same meaning as before, SSEc is the sum of the squares of residuals in the constrained (restricted) equation and SSEu is the counterpart in the unrestricted equation. It is worth mentioning that, Bahmani-Oskooee et al (1991) utilized a modified Granger methodology and examined the causal relationship between export growth and economic growth by following Hsiao’s Granger- Akaike synthesis in their research. In the final stages in this research, to determine positive or negative relationship between the dependent and independent variables, e.g. the sign
of the sum of the coefficients
L
ittGCPI
111 for the case of CPI causing
M1, and
M
ittGM
112 1 for the case of M1 causing CPI is calculated.
The data used in this study are quarterly data for the period of 1988 to 2010. Statistics of money (in terms of narrow and broad money, M1, M2 respectively), consumer price index (CPI, 2005 = 100) and the wholesale price index (WPI, 2005 = 100) collected from International Monetary Fund (IMF) Statistics. Finally, the relevant data in growth form were included in the model.
144/ Inflation and Money supply growth in Iran: Empirical Evidences…
Empirical results and analysis of the findings:
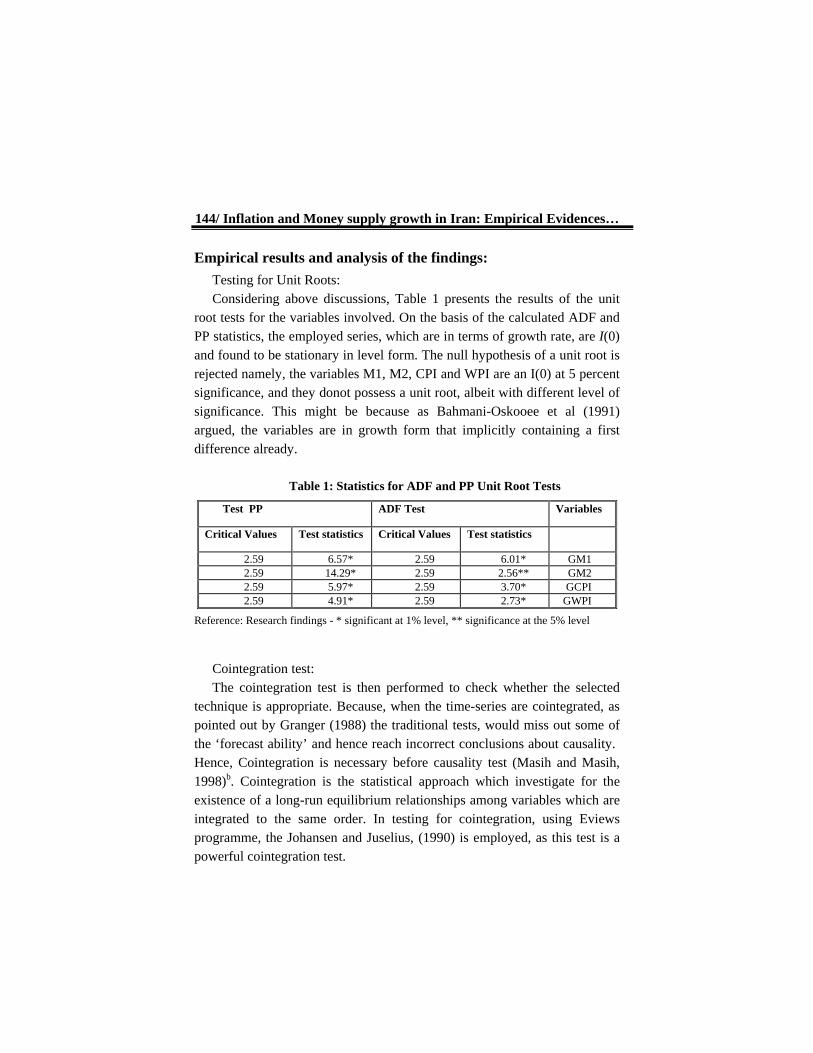
Testing for Unit Roots: Considering above discussions, Table 1 presents the results of the unit
root tests for the variables involved. On the basis of the calculated ADF and PP statistics, the employed series, which are in terms of growth rate, are I(0) and found to be stationary in level form. The null hypothesis of a unit root is rejected namely, the variables M1, M2, CPI and WPI are an I(0) at 5 percent significance, and they donot possess a unit root, albeit with different level of significance. This might be because as Bahmani-Oskooee et al (1991) argued, the variables are in growth form that implicitly containing a first difference already.
Table 1: Statistics for ADF and PP Unit Root Tests
Test PP ADF Test Variables
Critical Values Test statistics Critical Values Test statistics
2.59 6.57* 2.59 6.01* GM1 2.59 14.29* 2.59 2.56** GM2 2.59 5.97* 2.59 3.70* GCPI 2.59 4.91* 2.59 2.73* GWPI
Reference: Research findings - * significant at 1% level, ** significance at the 5% level
Cointegration test: The cointegration test is then performed to check whether the selected
technique is appropriate. Because, when the time-series are cointegrated, as pointed out by Granger (1988) the traditional tests, would miss out some of the ‘forecast ability’ and hence reach incorrect conclusions about causality. Hence, Cointegration is necessary before causality test (Masih and Masih, 1998)b. Cointegration is the statistical approach which investigate for the existence of a long-run equilibrium relationships among variables which are integrated to the same order. In testing for cointegration, using Eviews programme, the Johansen and Juselius, (1990) is employed, as this test is a powerful cointegration test.
Iran. Econ. Rev. Vol.18, No. 1, 2014. /145
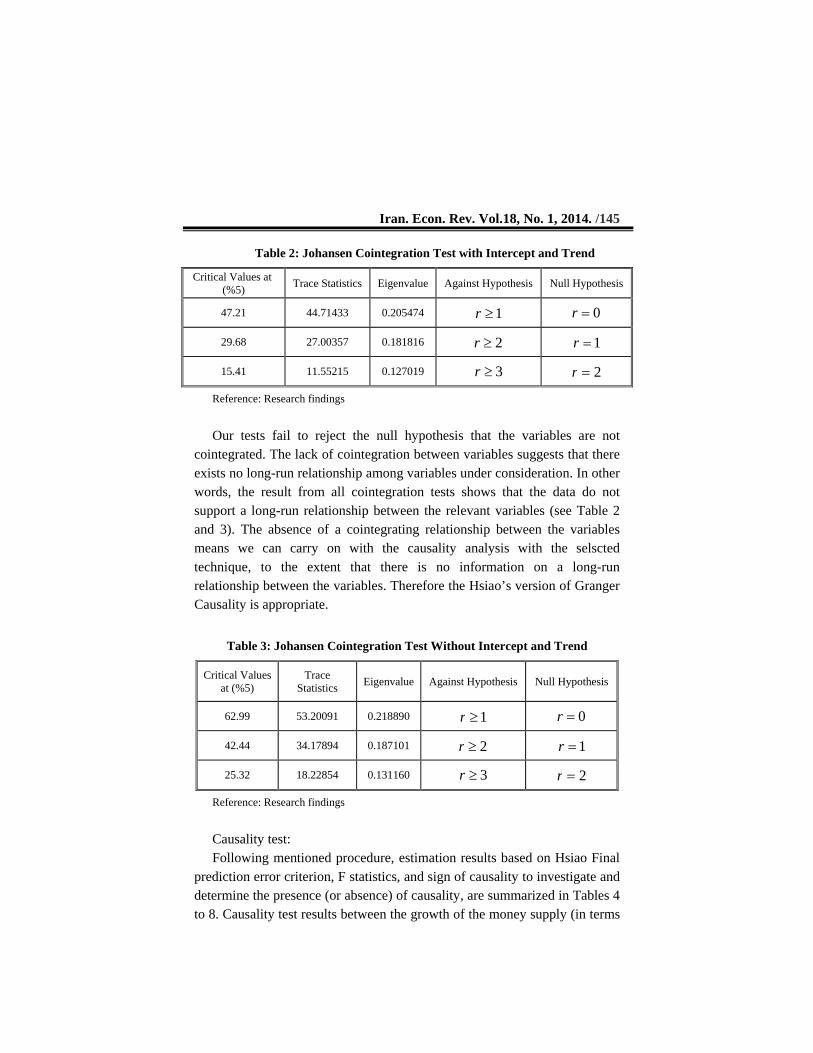
Table 2: Johansen Cointegration Test with Intercept and Trend
Critical Values at (%5)
Trace Statistics Eigenvalue Against Hypothesis Null Hypothesis
47.21 44.71433 0.205474 1r 0r
29.68 27.00357 0.181816 2r 1r
15.41 11.55215 0.127019 3r 2r
Reference: Research findings
Our tests fail to reject the null hypothesis that the variables are not
cointegrated. The lack of cointegration between variables suggests that there exists no long-run relationship among variables under consideration. In other words, the result from all cointegration tests shows that the data do not support a long-run relationship between the relevant variables (see Table 2 and 3). The absence of a cointegrating relationship between the variables means we can carry on with the causality analysis with the selscted technique, to the extent that there is no information on a long-run relationship between the variables. Therefore the Hsiao’s version of Granger Causality is appropriate.
Table 3: Johansen Cointegration Test Without Intercept and Trend
Critical Values at (%5)
Trace Statistics
Eigenvalue Against Hypothesis Null Hypothesis
62.99 53.20091 0.218890 1r 0r
42.44 34.17894 0.187101 2r 1r
25.32 18.22854 0.131160 3r 2r
Reference: Research findings
Causality test: Following mentioned procedure, estimation results based on Hsiao Final
prediction error criterion, F statistics, and sign of causality to investigate and determine the presence (or absence) of causality, are summarized in Tables 4 to 8. Causality test results between the growth of the money supply (in terms
146/ Inflation and Money supply growth in Iran: Empirical Evidences…
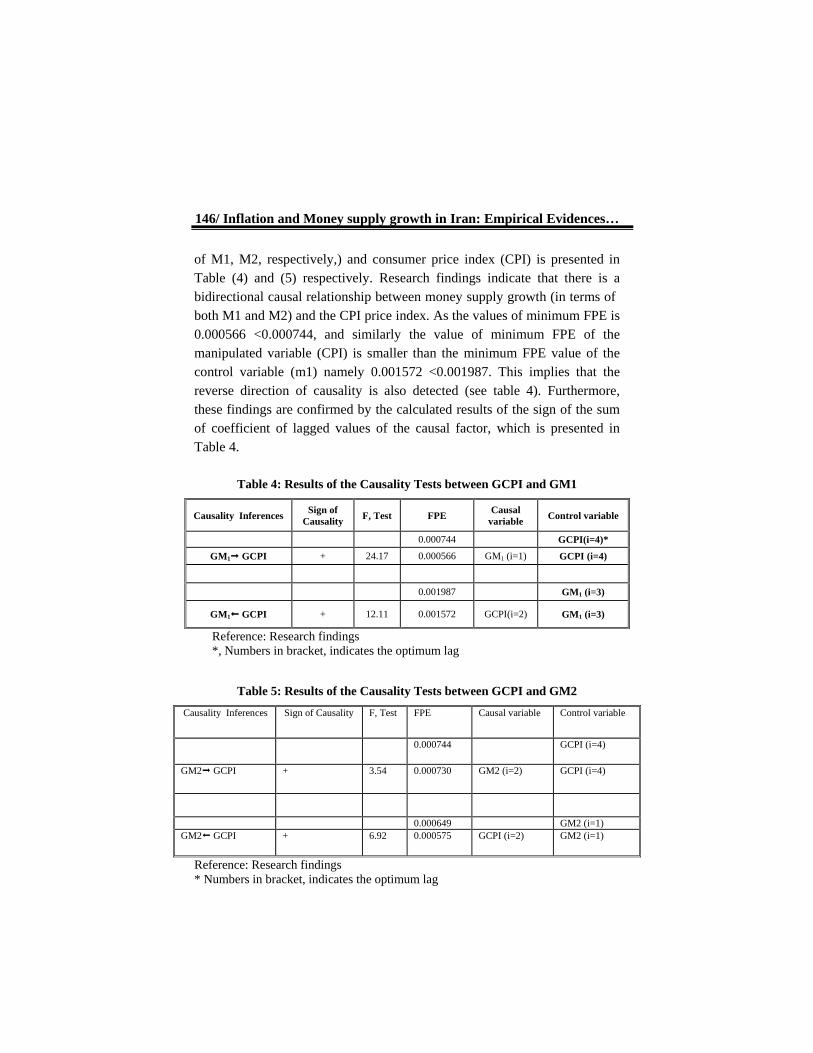
of M1, M2, respectively,) and consumer price index (CPI) is presented in Table (4) and (5) respectively. Research findings indicate that there is a bidirectional causal relationship between money supply growth (in terms of both M1 and M2) and the CPI price index. As the values of minimum FPE is 0.000566 <0.000744, and similarly the value of minimum FPE of the manipulated variable (CPI) is smaller than the minimum FPE value of the control variable (m1) namely 0.001572 <0.001987. This implies that the reverse direction of causality is also detected (see table 4). Furthermore, these findings are confirmed by the calculated results of the sign of the sum of coefficient of lagged values of the causal factor, which is presented in Table 4.
Table 4: Results of the Causality Tests between GCPI and GM1
Causality Inferences Sign of
Causality F, Test FPE
Causal variable
Control variable
0.000744 GCPI(i=4)*
GM1 GCPI + 24.17 0.000566 GM1 (i=1) GCPI (i=4)
0.001987 GM1 (i=3)
GM1 GCPI + 12.11 0.001572 GCPI(i=2) GM1 (i=3)
Reference: Research findings *, Numbers in bracket, indicates the optimum lag
Table 5: Results of the Causality Tests between GCPI and GM2
Causality Inferences Sign of Causality F, Test FPE Causal variable Control variable
0.000744 GCPI (i=4)
GM2 GCPI + 3.54 0.000730 GM2 (i=2) GCPI (i=4)
0.000649 GM2 (i=1) GM2 GCPI + 6.92 0.000575 GCPI (i=2) GM2 (i=1)
Reference: Research findings * Numbers in bracket, indicates the optimum lag
Iran. Econ. Rev. Vol.18, No. 1, 2014. /147
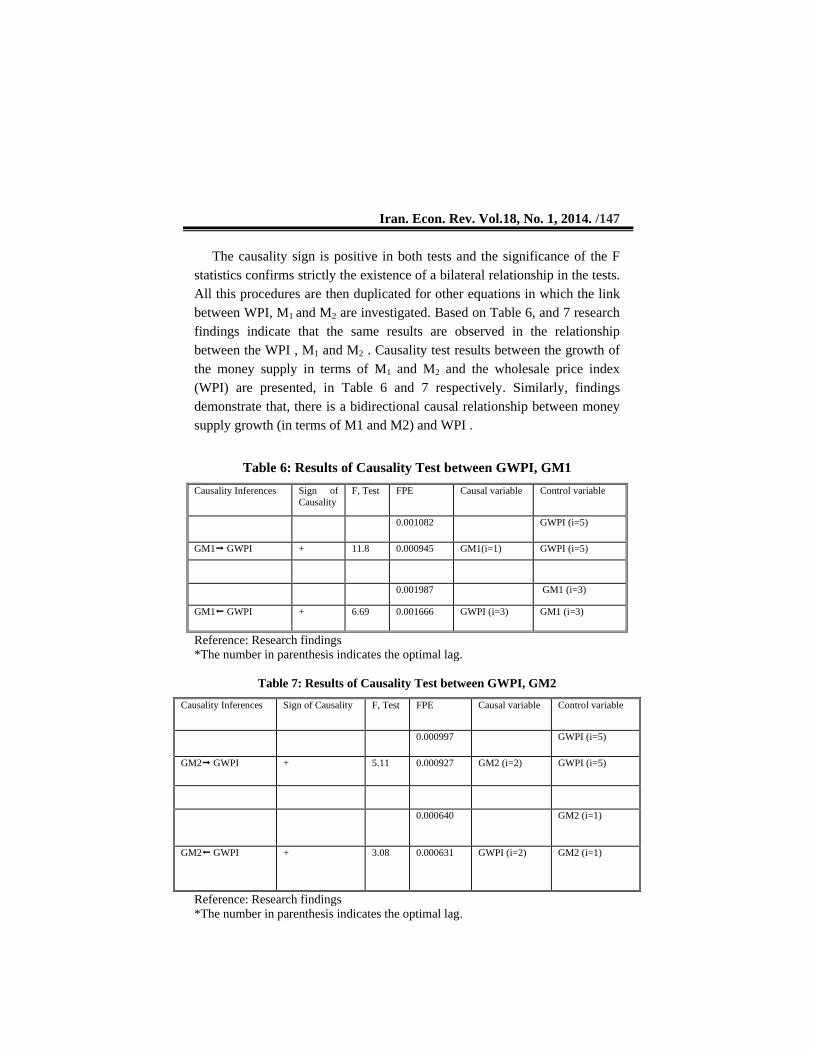
The causality sign is positive in both tests and the significance of the F statistics confirms strictly the existence of a bilateral relationship in the tests. All this procedures are then duplicated for other equations in which the link between WPI, M1 and M2 are investigated. Based on Table 6, and 7 research findings indicate that the same results are observed in the relationship between the WPI , M1 and M2 . Causality test results between the growth of the money supply in terms of M1 and M2 and the wholesale price index (WPI) are presented, in Table 6 and 7 respectively. Similarly, findings demonstrate that, there is a bidirectional causal relationship between money supply growth (in terms of M1 and M2) and WPI .
Table 6: Results of Causality Test between GWPI, GM1
Causality Inferences Sign of Causality
F, Test FPE Causal variable Control variable
0.001082 GWPI (i=5)
GM1 GWPI + 11.8 0.000945 GM1(i=1) GWPI (i=5)
0.001987 GM1 (i=3)
GM1 GWPI + 6.69 0.001666 GWPI (i=3) GM1 (i=3)
Reference: Research findings *The number in parenthesis indicates the optimal lag.
Table 7: Results of Causality Test between GWPI, GM2
Causality Inferences Sign of Causality F, Test FPE Causal variable Control variable
0.000997 GWPI (i=5)
GM2 GWPI + 5.11 0.000927 GM2 (i=2) GWPI (i=5)
0.000640 GM2 (i=1)
GM2 GWPI + 3.08 0.000631 GWPI (i=2) GM2 (i=1)
Reference: Research findings *The number in parenthesis indicates the optimal lag.
148/ Inflation and Money supply growth in Iran: Empirical Evidences…
According to Table (6) the results indicate that between (WPI) and the M1, mutual relationships exist. As, based on the first part of the table (6) comparing the values of the FPE shows that 0.000927< .000997 and in the next section 0.000631< 0.000640 . This indicates that there is a bilateral relationship between the relevant variables. Furthermore, positive sign of causality in both tests, and the outcome of computed F statistics emphasizes research findings. Based on Table 7, the same results are also observed in relationship between the WPI and the definition of broad money M2 .
Therefore, the causal relationship between money supply and price provides evidence of bilateral causality indicating that monetary expansion increase and is also increased by inflation in Iran. Based on the present research findings, although causality is not confirmed unilateral from growth of the money supply to inflation, however, the viewpoint of many economists concerning the impact of money on inflation has not been rejected too. These results are consistent with the findings of similar studies e.g. Sahrayyan and Zibaei (2004), which concluded a mutual causal relationship between money supply and prices of agricultural products. Findings of a study conducted by the Ministry of Economy and Finance (2002) show that the main roots of inflation has to be find in structural problems of production sectors, structural deficit in the trade balance, structural deficit in the government budget. These factors facilitated the inflation in Iran with an increasing trend in recent years. Therefore, the findings of this research are consistent with this viewpoint that in an economy with high inflation, inflation has a feedback effect on the growth of the money supply and this helps to create a self-sustaining inflationary process. In fact, as Hossain, (2009) argued, non monetary factors affects, originating from both the demand side and the supply side cannot lead to a self sustaining inflation without monetary accommodation. One strand of the money growth-inflation literature, however suggest that budget deficit and money growth are closely related in developing countries.
Summary and Conclusions:
This paper aimed at investigating the growth of money supply (in terms of M1 and M2) and price nexus (CPI, and WPI) for Iran through the cointegration and causality techniques from 1988 to 2010. To do so, using
Iran. Econ. Rev. Vol.18, No. 1, 2014. /149 Johansen-Juselius methods the long run equilibrium relationship between relevant variables were examined. It then employed Hsiao technique to examine this relationship, since Granger causality test is very sensitive to the choice of the optimal lag length.
The findings of this paper show a lack of integration vectors in Johansen cointegration test. The causality test results also indicate a bidirectional causal relationship between money supply growth (in terms of M1 and M2) and (CPI). These links were also detected when wholesale price index (WPI) relationship with money supply growth was investigated. In other words, the causal relationship between money supply and price provides evidence of bilateral causality indicating that monetary expansion increase and is also increased by inflation in Iran. These findings are consistent with the view that in a high inflation economy, inflation does have a feedback effect on money supply growth and this generates self sustaining inflationary process.
References
1- Abbas, K and Husain, F, (2007), Money, Income, and Prices In Pakistan: A Bi-Variate And Tri-Variate Causality, MPRA Paper No. 4892, PP 54-66. 2- Aghevli, Bijan and Mohsin S. Khan, (1978) "Government Deficits and The Inflationary Process In Developing Countries," IMF Staff Papers. Vol. 25, Pp. 383-416. 3- Akaike, H. (1969), "Fitting Autoregressive Models For Prediction", Annual Of The Institute Of Statistical Mathematics, Vol. 21, PP 243- 247. 4- Asongu , S. A. (2013, ) Does Money Matter in Africa? New Empirics on Long- and Short-run Effects of Monetary Policy on Output and Prices , African Governance and Development Institute, (AGDI) Working Paper , WP/13/005. 5- Bahmani- Oskooee, M. And Mohtadi, H, and Shabsigh, G, (1991), "Exports, Growth And Causality In Ldcs: A Re-Examination", Journal Of Development Economics, Vol. 36, PP405- 415. 6- http://prd.moc.gov.ir/Report/611/bakhshe 3.htm - _ftnref20Bahmani-Oskooee,Mohsen. (1995),”Source Of Inflation In Post –Revolutionary Iran”, International Economic Journal , Volume 9,Number 2, Summer 7- Bengali, K., A., Khan And Sadaqat, M., (1999), “Money, Income, Prices And Causality: The Pakistani Experience, Journal Of Developing Area, 33 (4): Summer, 503-14.
150/ Inflation and Money supply growth in Iran: Empirical Evidences…
8- Cagan, P. (1956) “The Monetary Dynamics of Hyperinflation” In Studies In The Quantity Theory Of Money. University Of Chicago Press; Chicago, 25–117. 9- Cheng, B. S. And Lai, T.W (1997), an Investigation Of Co-Integration And Causality Between Energy Consumption And Economic Activity In Taiwan, Energy Economics, No 19, PP 435-444. 10- Dickey, D. A And Fuller, W. A.,(1981), “ Likelihood Ratio Statistics For Autoregressive Time Series” , Econometrica, 49, PP 1057-1072. 11- Fisher Stanley, (1993), “The Role of Macroeconomic Factors In Growth”, Journal Of Monetary, Economics 32:485-512. 12- Friedman, M (1963), Inflation: Causes And Consequences, New York: Asia Publishing House. 13- Geweke, J. (1984), Inference and Causality In Economic Time Series Models, Handbook Of Econometrics, Vol. 2 Amsterdam: North Holland. 14- Granger, C.W.J. (1986), “Developments Of The Study In Cointegrated Variables”, Oxford Bulletin Of Economics And Statistics, 48,213-28. 15- Granger, C.W.J., (1988), Some Recent Developments In A Concept Of Causality, Journal Of Econometrics, 39, 199-211. 16- Gries Thomas, Krieger Tim And Meierrieks, Danie (2009) Ausal Linkages Between Domestic Terrorism And Economic Growth , Working Paper Series, No. 2009-02 17- Gries, T., Kraft, M. And Meierrieks, D. (2008) Linkages Between Financial Deepening, Trade Openness And Economic Development: Causality Evidence From Sub-Saharan Africa. CIE Working Paper 2008-08. University Of Paderborn. 18- Hadian, A., Parsa, H., (2008), “Estimation Of The Impact Of Lagged Change In Liquidity On Inflation Level Of Iranian Economy”, Quarterly Journal Of Iranian Economic Research, 36, Autumn, .1-16. 19- http://prd.moc.gov.ir/Report/611/bakhshe 3.htm - _ftnref1Harberger.A (1963),”The Dynamics Of Inflation In Chile”In Measurment In Economics (ED.) C.F. Christ, Stanford University Press, Stanford ,. 20- Holland,S (1993), Uncertain Effects Of Money And The Link Between The Inflation Rate And Inflation Uncertainty” Economic Inquiry, PP 39-51. 21- Hossain, A. A. (2009), Central Banking and Monetary Policy in the Asia-Pacific, Edward Elgar Pub.
Iran. Econ. Rev. Vol.18, No. 1, 2014. /151 22- Hsiao, C (1981), Autoregressive Modeling and, Money – Income Causality Detection”, Journal of Monetary Economics, PP 85-106. 23- Hsiao, M. C. W. (1987), "Tests of Causality and Exogeneity Between Exports And Economic Growth: The Case Of The Asian Nics", Journal Of Economic Development, Vol. 12, PP 143-159. 24- Hwang , Dennis-B-K, Gun Burel, (1991), The Causal Relationship Between Energy And GNP, The Case Of Taiwan Province Of China, Journal Of Energy And Development, Vol. 16, PP 219-26. 25- Johansen, S and Juselius, K. (1990), Maximum Likelihood Estimation And Inference On Cointegration- With Application To The Demand For Money, Oxford Economic Bulletin, State 52. 26- Kazerooni, A., And Asghari, B., (2002), The Study Of Classical Model Of Inflation In Iran, Cointegration Test, Iranian Journal Of Trade Studies, 23, 97-138. 27- Khan, Mohsin S. and Abdelhak S. Senhadji (2000) ‘Threshold Effects in the Relationship Between Inflation and Growth’. IMF Working Paper00/110. Washington: International Monetary Fund. 28- Lahura, L. (2010), Monetary Aggregates And Monetary Policy: An Empirical Assessment For Peru, Banco Central De Reserva Del Perú, DT. No. 019 29- Lee, S And Li,. W (1983), Money, Income, And Prices And Their Lead Lag Relationship In Singapore, Singapore Economic Review” , 28 April, PP 73-87. 30- Masih, A. M. M And Masih, R. (1998)B, Temporal Causality And The Dynamic Intractions Among Economic Activity Within A Multivariate Cointegration System: Evidence From Singapore And Korea, Weltwirtschaftliches Archive, 131 PP 265-85. 31- Masih, A. M. M. & Masih, R. (1998) A. Does Money Cause Prices, Or The Other Way Around? Multi-Country Econometric Evidence Including Error-Correction Modeling From South-East Asia. Journal of Economic Studies, 25 (3), 138-160. 32- Ministry Of Commerce, (2002), Inflation Analysis In Iran, With Emphasize On The Year 2002, Planning An D Economic Studies, Office For Economic Studies, Tehran 33- Phillips, R., and Perron, P (1988), Testing For A Unit Root In Time Series Regression, Biometrika, June, PP 335-46.
152/ Inflation and Money supply growth in Iran: Empirical Evidences…
34- Sahraiean, M., Zibayeem M., (2004), Causal Relationship Between Money Supply And The Price Level Of Iran’s ,Agriculture Products, Agriculture Economics And Development, 47, 29-56. 35- Tashkini, A., Abbasnejad, H., (2005), Is Inflation A Monetqary Phenomena In Iran? Journal of Economic Research, 67(1), 181- 212. 36- Tayebnia A., (2005), Inflation Theories, A Look At Inflation Process In Iran, Tehran Jehad University 37- Troy Thick, J.A., (1983), Inflation, A Guide To Recent Economic Crisis, Translated By Azimi, H, And Ghafarzadeh, H, Amir Kabir Co. Tehran. 38- http://prd.moc.gov.ir/Report/611/bakhshe 3.htm - _ftnref2 Vogel, Robert (1974), The Dynamics Of Inflation Latin America”,1950-1969,The American Economic Review, March.