Embed Size (px)
Citation preview
Inflation Pressures at Less-Than- Maximum Tire Loads
John W. Daws, Ph.D., P.E.
Daws Engineering, LLC 4535 W. Marcus Dr. Phoenix, AZ 85083
Presented at the September 2009
Meeting of the Tire Society
2
J.W. Daws
Inflation Pressures at Less-Than-Maximum Tire Loads
REFERENCE: J.W. Daws, “Inflation Pressures at Less-Than-Maximum Tire Loads,” submitted for presentation at the
2009 Tire Society Meeting, and for consideration for publication in the journal Tire Science and Technology.
ABSTRACT: One of the most important parameters to be established for tire operation, whether on a new vehicle
being designed by a vehicle manufacturer or on a plus-size fitment, is the recommended cold inflation pressure for the
tire. The tire carries a maximum inflation pressure label, but operation at lower loads and pressures is generally
beneficial for overall vehicle performance. Recommended inflation pressures have historically been provided by tire
standards organizations in the form of tables of load versus pressure or in the form of simple mathematical models.
This paper reviews these models, and develops a new formulation based on a tire stiffness model. It is shown that the
stiffness model predicts higher inflation pressure requirements at lower-than-maximum loading conditions than some
of the models in use in the industry.
KEYWORDS: Inflation pressure, stiffness model
Tire pressure selection in instances where the tire loads are lower than the maximum load allowed
can be done by numerous methods. However, the selection of a correct inflation pressure is critical
to the successful operation of the tire. It is well-known that operation of a tire at higher than
required pressures may cause uneven tread wear, degrade vehicle ride and comfort, and increase
susceptibility to impact damage. Operating the tire at lower than required pressures may also cause
uneven tread wear, but can potentially lead to fatigue breakdown of the tire’s internal structure
resulting in tread separation or other structural failure. Lower-than-optimal operating pressures
also decrease fuel economy. Obviously, inflation pressure at a given load has been shown to affect
a tire’s deflection, contact footprint pressure distribution, and hysteretic heat generation. The
correct setting of the cold inflation pressure is therefore critical to achieving the design intent of the
tire in the field. For vehicles being fitted with the Original Equipment (OE) tire, the recommended
operating pressure is listed on the placard.
3
The normal methods employed for arriving at the correct inflation pressure are by interpolation in
tables published by tire regulatory bodies, like the Tire & Rim Association (T&RA), or by
computation using methods published by those same regulatory bodies. This paper will survey the
computational procedures as they are currently published for passenger and light truck tires, along
with a newly-developed method. An analysis of the results of such computations will be presented
along with the impact on tire deflection.
Tire Pressure Determination
The placard pressure indicated on a vehicle is supposed to provide the optimal inflation pressure
for the OE tires on any vehicle. This value will generally be higher than the minimum pressure
required to support the maximum load on a given axle of the vehicle and lower than the tire’s
maximum inflation pressure rating. The inflation pressure on the vehicle placard is generally the
result of significant performance testing on the part of the vehicle manufacturer along with the tire
manufacturer. Tire makers, on the other hand, typically subject tires to a standard set of proprietary
tests which field return experience has shown to provide adequate screening for development
purposes. There are many instances, however, where tire inflation pressure must be determined in
the absence of significant testing. This is especially true when tires are fitted to a vehicle that are a
different size than those supplied as OE.
There are several approaches to determining the correct operating pressure for a vehicle’s tires.
The first is to find the tire listed in tabulated pressure-versus-load tables such as those published by
the T&RA in annual Yearbooks. Tire manufacturers normally distribute these tables to tire sellers
for their use. Using these tables requires locating the pressure in the table where the tire’s load
capacity exceeds one-half of the Gross Axle Weight Rating (GAWR) of the vehicle for the
particular axle (the front and rear axle GAWRs will likely be different). Note that, if passenger
tires are used on a multi-purpose vehicle (MPV), the tire load must be increased by 10% to
conform to Department of Transportation (DOT) requirements. This approach will generally be
followed by vehicle manufacturers when selecting an appropriate tire size and minimum inflation
pressure for a given vehicle. The pressure finally adopted for the placard may likely be higher than
the minimum inflation pressure in order deal with maximum vehicle speed or to optimize handling,
rolling resistance, or a number of other vehicle performances. The same values found in yearbook
4
tables can be obtained mathematically using the Engineering Design Information (EDI) formulae
that underlie those tabulations, or formulae provided by organizations like the European Tyre and
Rim Technical Organisation (ETRTO). These formulations are supposedly based on the deflection
at the maximum load for any pressure being the same as that of the tire at the maximum load,
maximum pressure condition. The pressure is then given by:
where MaxLoad is the maximum load indicated on the tire sidewall, MaxPressure is the pressure
used to determine the maximum load, and n is equal to a constant (assuming vehicle speeds less
than 160 kph (100 mph)). Note that MaxPressure is not necessarily equal to the maximum pressure
on the tire sidewall (this is discussed below). There are numerous values of the exponent n in
common use in the tire industry today.
The T&RA has historically stated that the maximum load on a tire being designed to operate at a
certain maximum inflation pressure could be stated as:
The empirical origins of this form, where G represents a constant function of tire geometry, have
been covered in detail by S. Padula [1]. The first formula adopted by the T&RA in 1928
established a value for n as 0.585. At that time, pressure at lower-than-maximum loads was
obtained simply as a ratio, or using Equation 1 with n = 1. At some point in time, Equation 2 was
deemed to apply to any pressure; the pressure-load relationship at lesser loads was then obtained by
dividing the load at any pressure by the maximum load, resulting in elimination of the G term and
yielding Equation 1. A value of 0.5 was adopted for P-metric tires in the 1970’s. A perusal of a
recent edition of the T&RA’s EDI guide shows that the value of n is 0.7 for light truck radial tires,
0.585 for flotation tires (and bias tires), and various other values for truck tires depending upon the
type and aspect ratio. Since the beginning of 2006, the T&RA has been working on harmonizing
its standards with other international organizations like the ETRTO. For passenger car tires
standardized after January 1, 2006, the value of n in Equation 1 is 0.8 for tires with Load Index (LI)
less than 100, and 0.65 for tires with LI greater than 100.
[1]
[2]
5
This makes the computation of inflation pressure simple, but tires standardized by the T&RA prior
to the beginning of 2006 still reflect pressure values in yearbook tables developed with the older
rules. This does not seem to be either consistent or physically sound, since the load a tire can carry
is proportional to its inflation pressure and its internal volume. Tires having the same internal
volume and the same maximum inflation pressure should require the same inflation at lower-than-
maximum loads. However, yearbooks have pressures tabulated for reduced load operation, and
these values were generated based on the values of n in use at the time the given tire size was first
entered into the document.
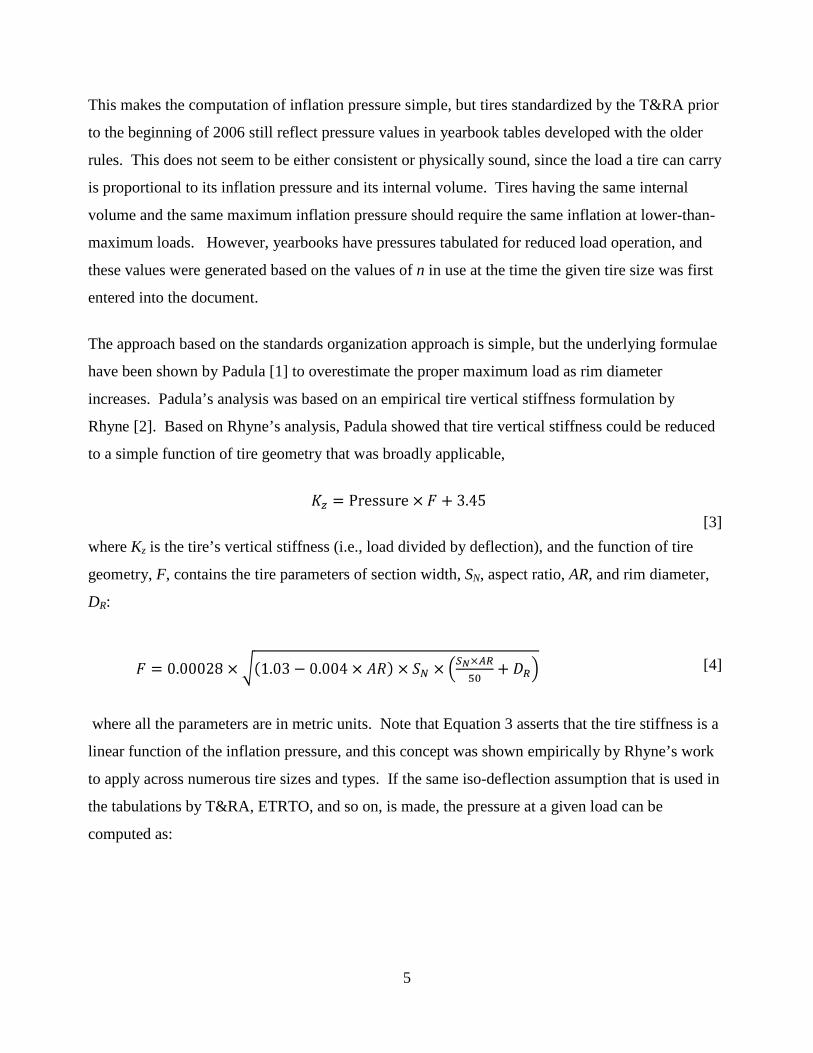
The approach based on the standards organization approach is simple, but the underlying formulae
have been shown by Padula [1] to overestimate the proper maximum load as rim diameter
increases. Padula’s analysis was based on an empirical tire vertical stiffness formulation by
Rhyne [2]. Based on Rhyne’s analysis, Padula showed that tire vertical stiffness could be reduced
to a simple function of tire geometry that was broadly applicable,
where Kz is the tire’s vertical stiffness (i.e., load divided by deflection), and the function of tire
geometry, F, contains the tire parameters of section width, SN, aspect ratio, AR, and rim diameter,
DR:
where all the parameters are in metric units. Note that Equation 3 asserts that the tire stiffness is a
linear function of the inflation pressure, and this concept was shown empirically by Rhyne’s work
to apply across numerous tire sizes and types. If the same iso-deflection assumption that is used in
the tabulations by T&RA, ETRTO, and so on, is made, the pressure at a given load can be
computed as:
[3]
[4]
6
Obviously, all the computational approaches above will yield slightly different values, especially
since there is a wide range of values for the coefficient n in Equation 1. Of interest is the fact that
the stiffness formulation described above was developed from data taken from a large number of
tires of different sizes and types. The stiffness data therefore can be interpreted to be a
representation of how tires actually behave at less-than-maximum inflation pressures rather than
how the maximum-inflation models of load capacity might predict that they work. The deflection
of the tire is one of the more significant operating parameters in terms of the tire’s resistance to
long-term fatigue breakdown, since deflection generates strain in the skim rubber at the belt edge.
If the tire is over-deflected, i.e., deflected more than it would be if it were loaded to its maximum
load and operated at its maximum inflation pressure, then the tire may incur strains beyond those
envisioned by its developers. These strains are more likely to arise in the critical belt-edge area of
a steel-belted radial tire where they can contribute to heat-related issues including increased rolling
resistance and the development of tread separation.
A sample calculation can best illustrate the principle. Consider a P235/75R15 standard load tire.
This tire has a T&RA maximum load of 920 kg (2028 lbs) at a maximum inflation pressure of
240 kPa (35 psi). Using Equation 3, the tire stiffness at the maximum load, maximum inflation
pressure condition is 27.3 kg/mm, and the deflection at this condition is 33.7 mm. When such a tire
is used on a multipurpose passenger vehicle (MPV) having a Gross Axle Weight Rating (GAWR)
of 1315 kg (2900 lbs), the load applied to the tire for pressure rating purposes will be half the
GAWR, or 658 kg (1450 lbs), and this value will be increased by 10% to conform to the rating
standards of the DOT for passenger tires used on MPVs. Therefore, the required tire capacity will
be 723 kg (1595 lbs). The vehicle placard for this particular vehicle lists the cold inflation pressure
for the tire as 180 kPa (26 psi). Consulting the T&RA tables for this tire, the rated load at 180 kPa
is given as 795 kg. Since the rated load capacity of 795 kg at 180 kPa is greater than the required
capacity of 723 kg, one would assume that the tire will be operated at a deflection that is smaller
than its maximum deflection, i.e., in an under-deflected state (the tire has excess capacity).
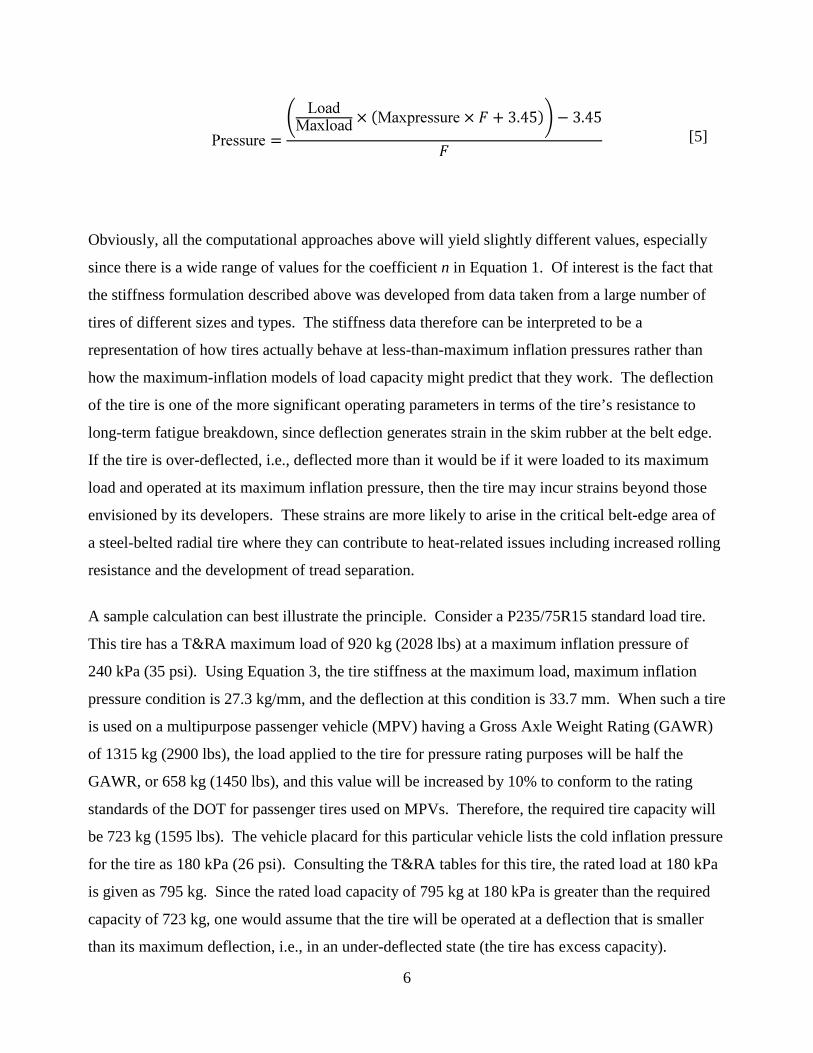
[5]
7
However, the tire stiffness at 180 kPa (26 psi) given by Equation 3 is 21.2 kg/mm. At the required
load of 723 kg, the deflection of the tire would be 34.2 mm, which is larger than the deflection at
the maximum load, maximum pressure condition (33.7 mm). In short, if the load applied to the tire
were 723 kg, the tire will be slightly over-deflected, so the inflation pressure of 180 kPa (26 psi) is
slightly below that required to maintain the iso-deflection state (that state where the deflection of
the tire is just equal to its deflection at the maximum load, maximum pressure condition). Since a
properly-maintained tire will have the benefit of the DOT’s 10% safety margin (i.e., at GAWR, the
actual load is only 658 kg), the bulk of the tires operated in this condition will still be running in an
underdeflected state. However, lack of tire pressure maintenance, severe vehicle loading
conditions, and other field experience issues could have a more severe effect on the tire in this
application than in one where the expected tire deflection is well below the maximum.
Comparison of the Various Models
In order to compare the pressure prediction of the various models, it is interesting to recast them
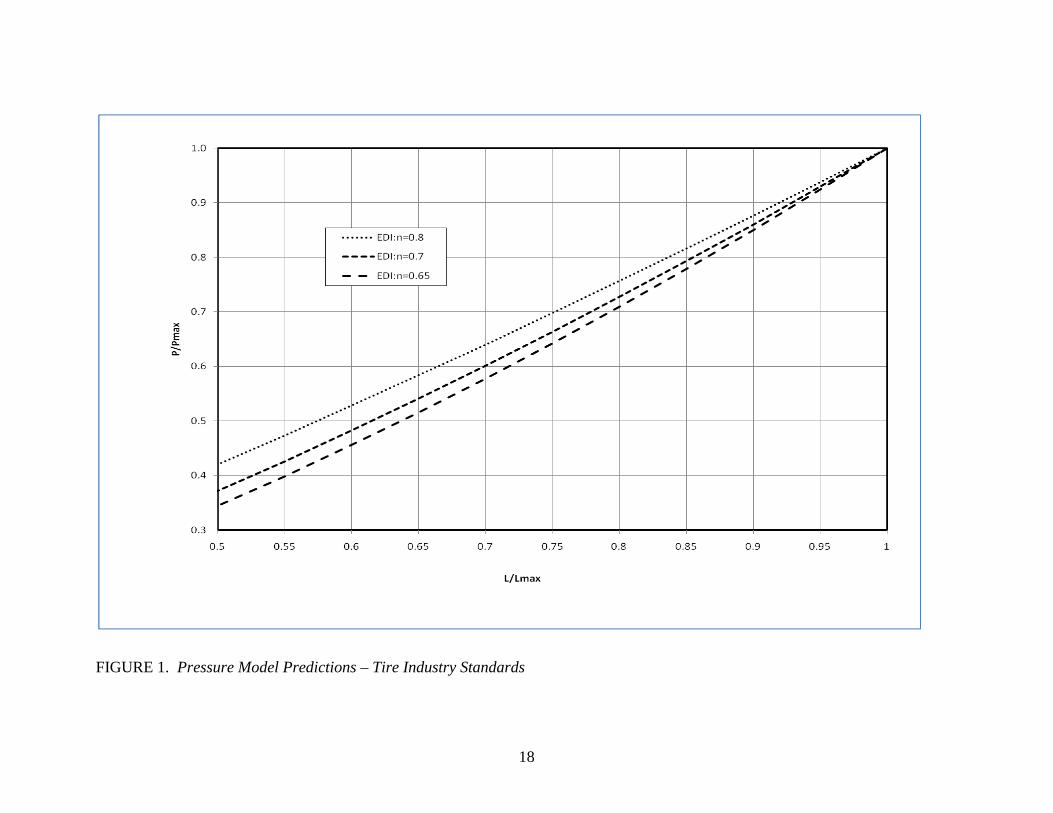
into a ratio format. That is, Equation 1 becomes
Equation 6 can be plotted for various values of n to see the influence of the various models on the
pressure prediction. Figure 1 shows this relationship plotted for values of n equal to 0.65, 0.7, and
0.8. Note that the pressure ratio required to support any given load ratio increases as the value of n
increases. For example, if a certain tire is required to support 75% of its maximum load, the
pressure required would be 64.2% of the maximum inflation pressure for n = 0.65, 66.3% for
n = 0.7, and 69.8% for n = 0.8. Again, there does not appear to be any significantly compelling
reason to believe that the required inflation pressure could range between 64.2% and 69.8% of
maximum inflation pressure for the same physical load on the same tire. Nor is there any
compelling physical reason to believe tires of the same size (or more correctly, internal volume)
governed by different standards organizations, would have substantially different pressure
requirements to support less-than-maximum loads.
[6]
8
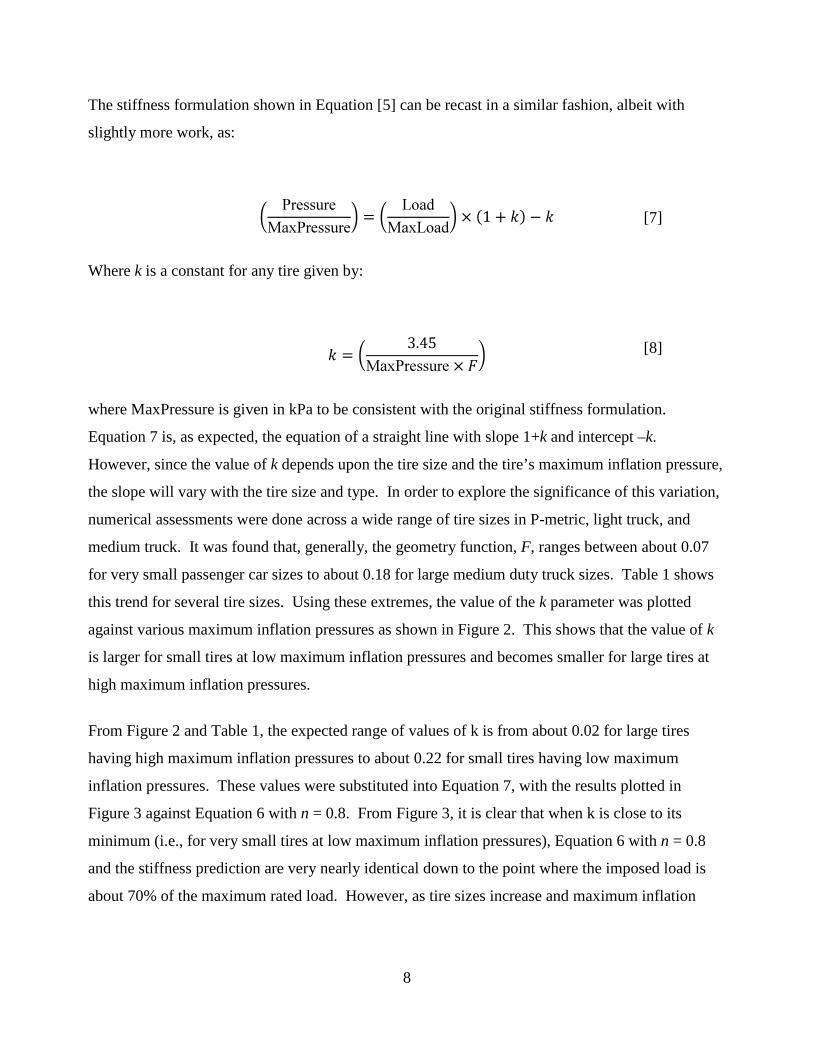
The stiffness formulation shown in Equation [5] can be recast in a similar fashion, albeit with
slightly more work, as:
Where k is a constant for any tire given by:
where MaxPressure is given in kPa to be consistent with the original stiffness formulation.
Equation 7 is, as expected, the equation of a straight line with slope 1+k and intercept –k.
However, since the value of k depends upon the tire size and the tire’s maximum inflation pressure,
the slope will vary with the tire size and type. In order to explore the significance of this variation,
numerical assessments were done across a wide range of tire sizes in P-metric, light truck, and
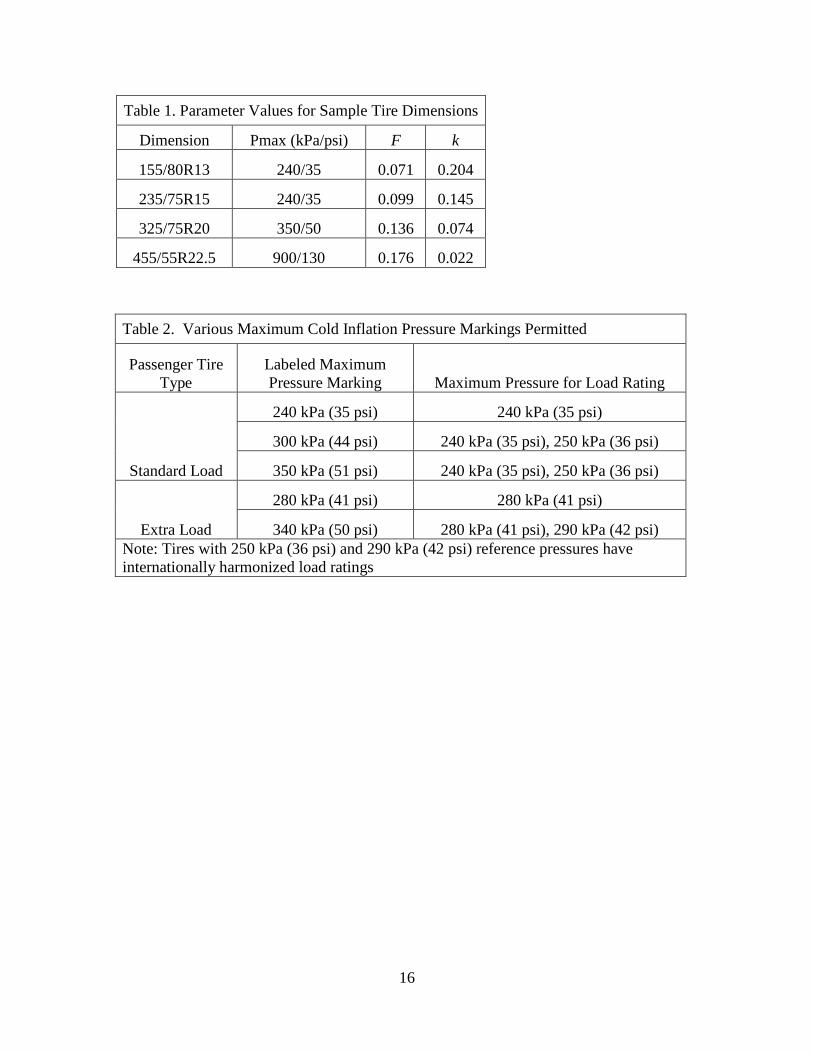
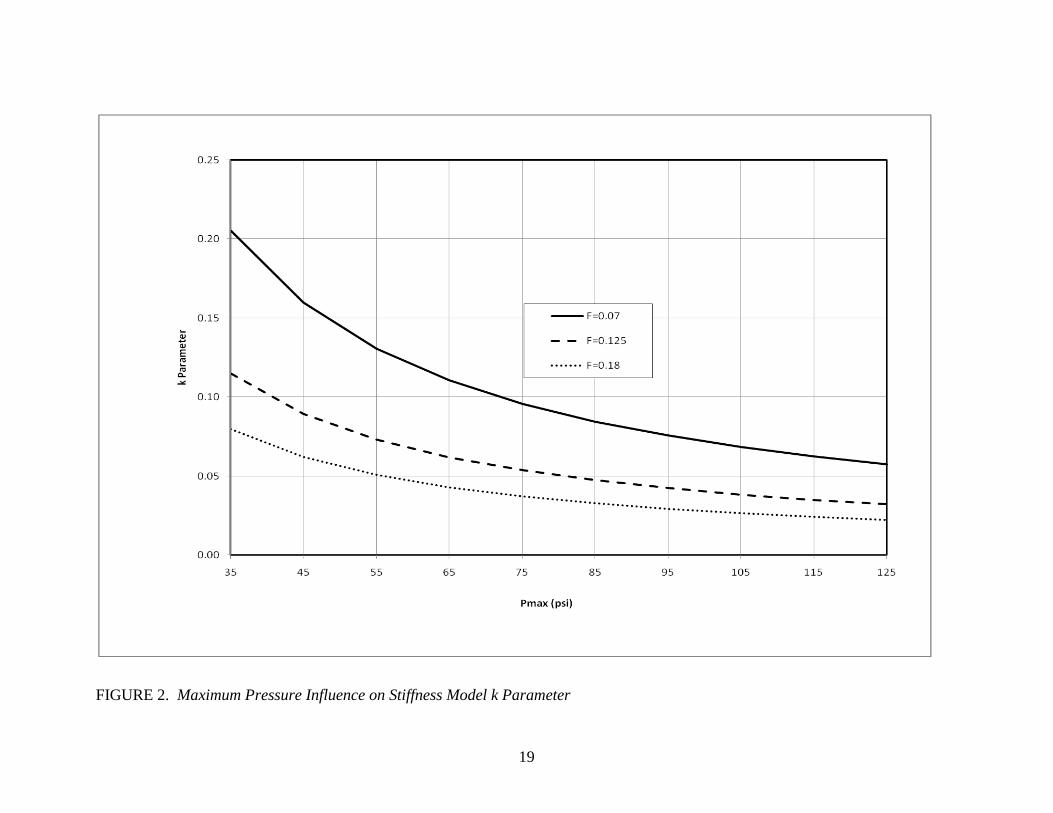
medium truck. It was found that, generally, the geometry function, F, ranges between about 0.07
for very small passenger car sizes to about 0.18 for large medium duty truck sizes. Table 1 shows
this trend for several tire sizes. Using these extremes, the value of the k parameter was plotted
against various maximum inflation pressures as shown in Figure 2. This shows that the value of k
is larger for small tires at low maximum inflation pressures and becomes smaller for large tires at
high maximum inflation pressures.
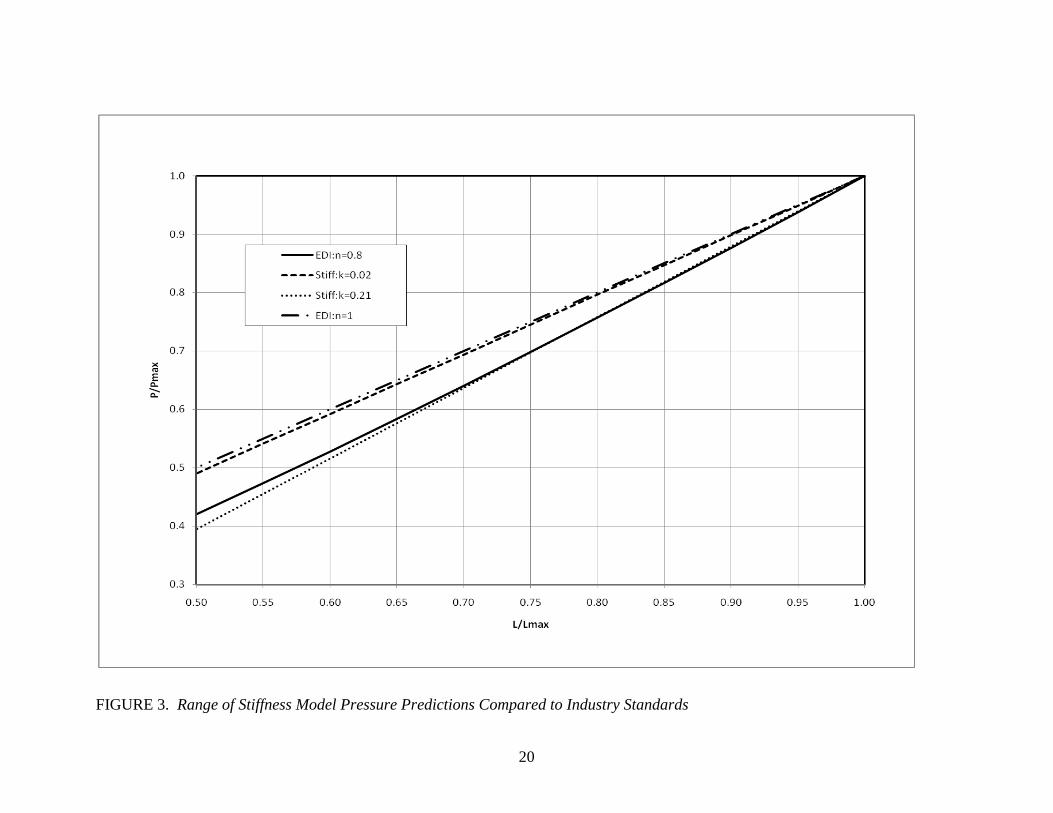
From Figure 2 and Table 1, the expected range of values of k is from about 0.02 for large tires
having high maximum inflation pressures to about 0.22 for small tires having low maximum
inflation pressures. These values were substituted into Equation 7, with the results plotted in
Figure 3 against Equation 6 with n = 0.8. From Figure 3, it is clear that when k is close to its
minimum (i.e., for very small tires at low maximum inflation pressures), Equation 6 with n = 0.8
and the stiffness prediction are very nearly identical down to the point where the imposed load is
about 70% of the maximum rated load. However, as tire sizes increase and maximum inflation
[7]
[8]
9
pressures increase, the stiffness prediction moves away from n = 0.8 line. In fact, for large size
tires at high pressures, the stiffness prediction approaches:
which is Equation 6 with n = 1 (this line is also shown on Figure 3). Figure 3 shows that inflation
pressures required at less than maximum loading predicted by the stiffness formulation will
generally lie between that predicted by the n = 0.8 relationship and the pure ratio relationship given
by Equation 9 (n = 1).
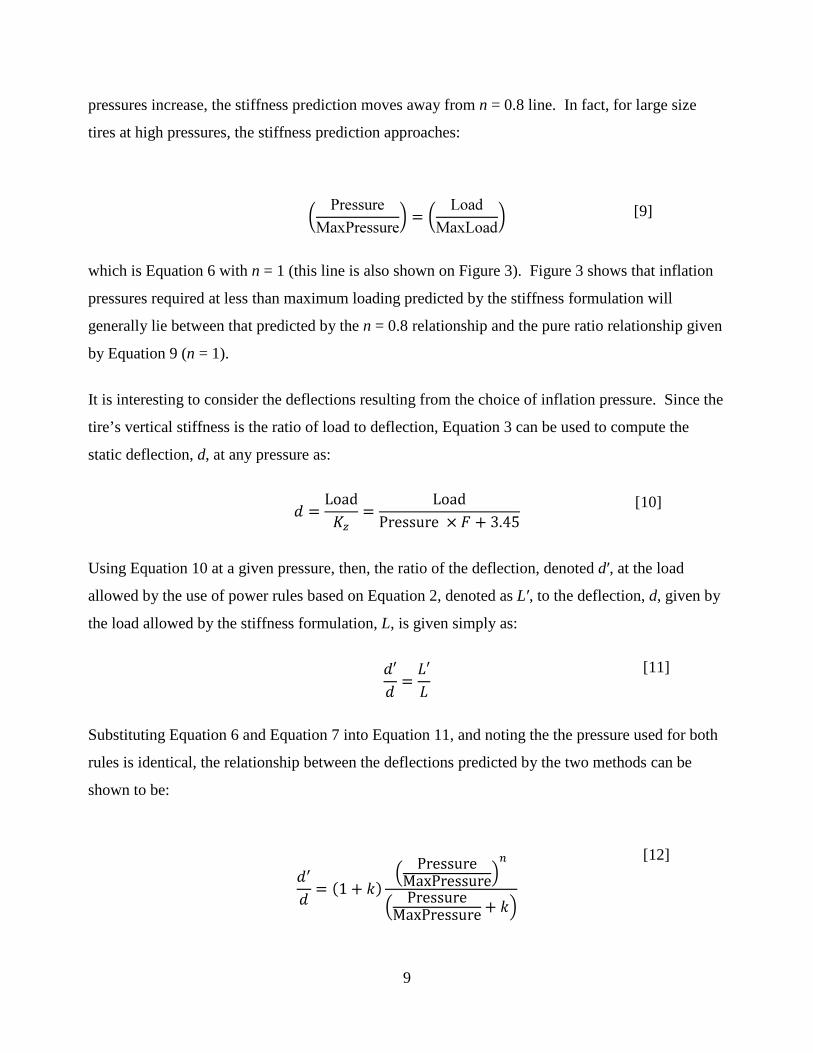
It is interesting to consider the deflections resulting from the choice of inflation pressure. Since the
tire’s vertical stiffness is the ratio of load to deflection, Equation 3 can be used to compute the
static deflection, d, at any pressure as:
Using Equation 10 at a given pressure, then, the ratio of the deflection, denoted d′, at the load
allowed by the use of power rules based on Equation 2, denoted as L′, to the deflection, d, given by
the load allowed by the stiffness formulation, L, is given simply as:
Substituting Equation 6 and Equation 7 into Equation 11, and noting the the pressure used for both
rules is identical, the relationship between the deflections predicted by the two methods can be
shown to be:
[9]
[10]
[11]
[12]
10
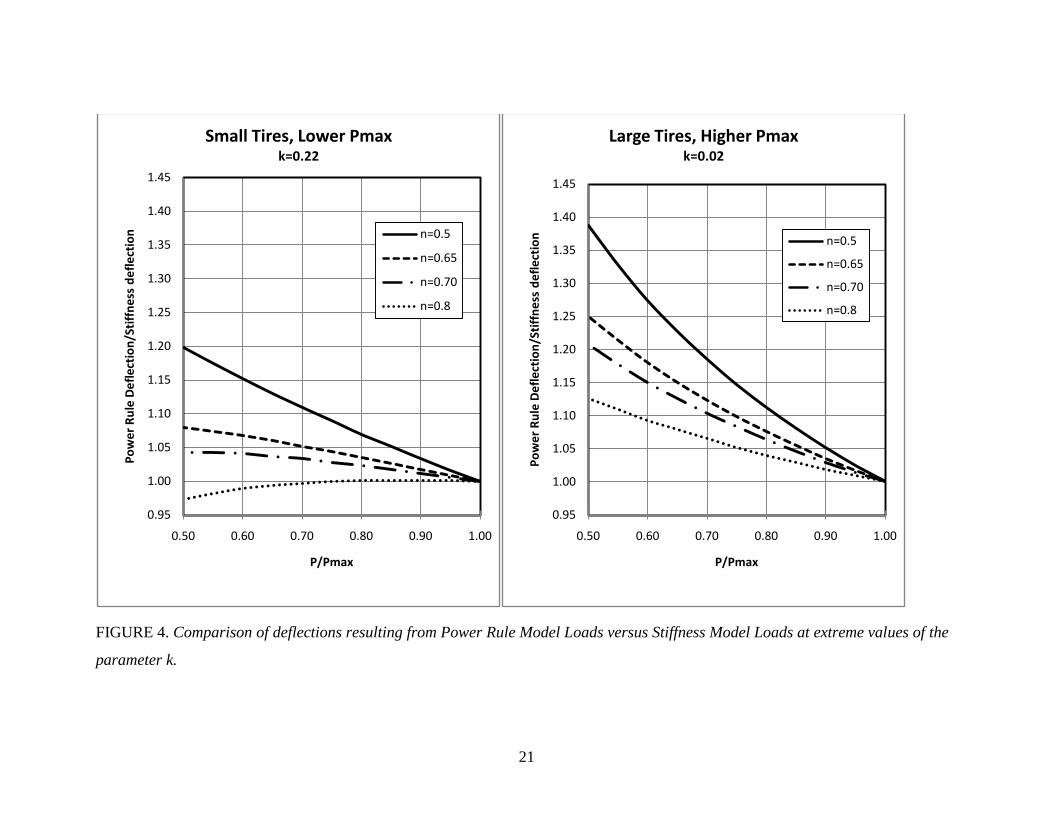
The relation given by Equation 12 is shown graphically in Figure 4 for various values of the power
rule exponent n from Equation 3. The graph on the left has k = 0.22, so it applies to very small tire
and rim combinations at low maximum inflation pressure. The graph on the right has k = 0.02, so it
applies to large tires at high maximum inflation pressures. Positive values of the ratio d′/d indicate
that at a given pressure, the deflection resulting from allowable loads generated by formulations
like Equation 3 is larger than that obtained when allowable loads are generated using the stiffness
formulation. In other words, the loads allowed by the power rule type formulations are higher at a
given pressure than those allowed by the stiffness formulation. The exception is that for n = 0.8,
when the inflation pressure is less than about 70% of the maximum inflation pressure, the stiffness
formulation allows slightly higher loads. This is essentially the same result noted in the discussion
of Figure 3. The size of the overdeflections predicted by Equation 12 are somewhat disturbing.
For example, when inflated to 70% of the maximum pressure, the load allowed by using Equation 3
with a value of n = 0.65 would create a deflection 5% to 12% larger than the tire’s maximum
deflection at its maximum load and maximum pressure condition, depending upon the size of the
tire and its maximum inflation pressure.
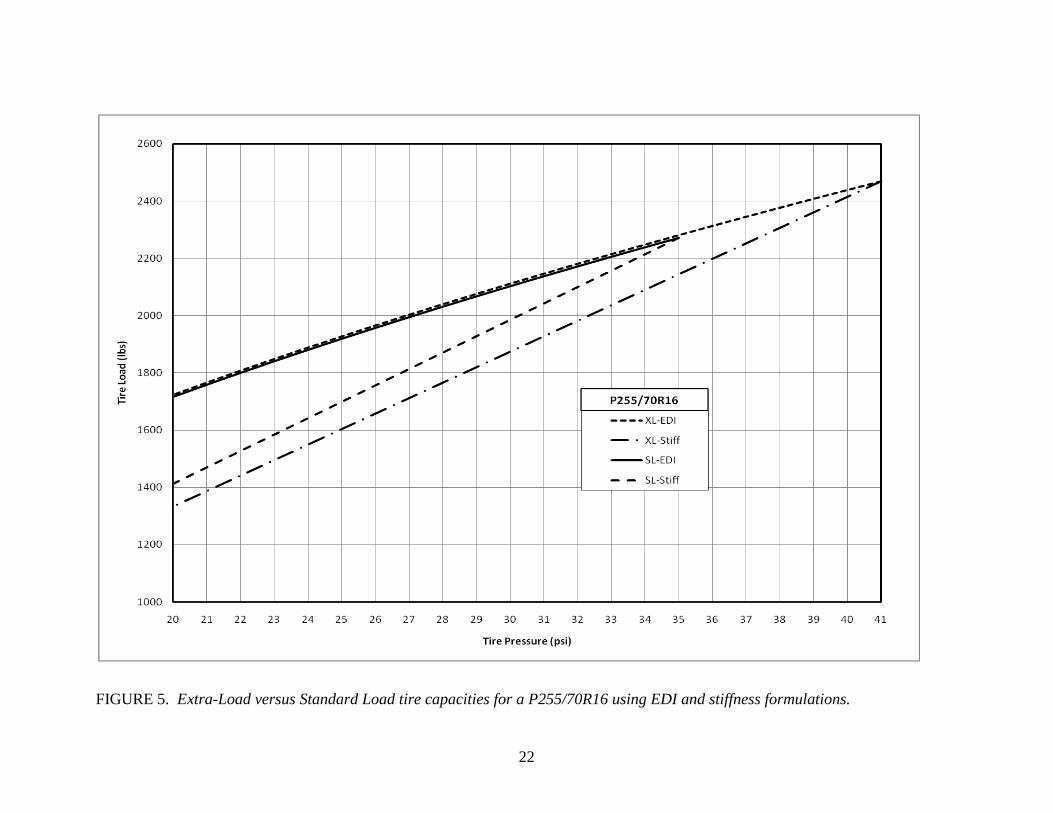
In the special case of Extra Load tires, the increased maximum load capacity is developed from the
EDI curves either by increasing the LI by 4 for tires with LI values less than 100, or by extending
the load-pressure curve to the required higher pressure. For example, on a P255/70R16 tire, the
Standard Load version has a maximum rated load capacity of 1030 kg (2271 lbs) at 240 kPa
(35 psi), while the Extra Load version’s maximum rated load capacity is 1120 kg (2469 lbs) at
280 kPa (41 psi). As shown in Figure 5, the EDI curve for the Extra Load tire follows that of the
Standard Load tire and then continues from 240 kPa (35 psi) to 280 kPa (41 psi). Using the
stiffness formulation for pressure suggests that the Extra Load tire requires more pressure at any
given load than the Standard Load tire because the stiffness model always starts at the maximum
load and maximum pressure point. The stiffness curves for the Standard and Extra Load versions
of the tire are also shown on Figure 4. This result is not entirely satisfactory, and it is due to the
selection of the maximum load capacity of the Extra Load tire. If the tire stiffness has a linear
relationship with pressure, then at the same maximum deflection (recall that all the models are iso-
deflection types), the load must vary linearly with pressure as well. Use of a stiffness-type model
will yield a lower load capacity ( and a correspondingly higher pressure requirement) for an Extra
11
Load tire relative to the Standard Load tire it is based on, given the current definition of the
maximum load and maximum pressure for Extra Load type tires.
Discussion
The selection of an inflation pressure for tire operation at less than maximum loads is critical to the
success of the tire in that service. Models of the form of Equation 2 were originally developed, as
discussed by Padula [1], from empirical relationships governing the selection of a tire’s maximum
load capacity at some maximum inflation pressure. As Padula noted, in the early days of the
T&RA, tire inflation pressure at less-than-maximum load conditions was obtained by using
Equation 9, and the move to forms of Equation 1 was not clearly explained in the record. What is
of interest for the modern radial tire at this point is that it has been shown that the stiffness of the
tire is linear with pressure, at least in the range of “normal” operating pressures. Establishment of
the linearity of stiffness with pressure suggests that the relationship between inflation pressure and
load should follow a linear relationship for a given tire even if the maximum load capacity is
related in a non-linear fashion to the maximum inflation pressure across many tires of the same
type.
Equation 2 represents an empirically-developed relationship between the maximum load and the
maximum pressure, and is essentially a function of the volume of the tire. Since the relationship
was developed empirically, it is not clear that the same relationship would be useful to describe the
relationship between less than maximum loads and corresponding inflation pressures for a given
tire. Indeed, if this were a regression problem, it is clear that the value of maximum inflation
pressure does not have significant variation for a given type of tire (i.e., passenger car tires), and
therefore would appear as a constant to any regression algorithm. From this perspective, it does not
seem that models like Equation 1 would be valid, since they were derived from an empirical model
where pressure was essentially a constant. On the other hand, the stiffness methodology presented
here was developed from an empirical model representing load versus pressure across a range of
pressures.
It is also intuitive that, similar tire sizes at similar partial loads should require similar inflation
pressures, regardless of the standards organization that is responsible for the tire. Hence, different
12
values of n in Equation 1 across different standards organizations do not seem consistent with the
physical reality that the load capacity of a tire is related to its volume and its internal pressure.
Further, the stiffness-based formulation for less-than-maximum load conditions suggests that all of
the power rule type formulations yield pressures that are too low for the load in question. The
relationship in Equation 1 with n equal to 0.8 appears to provide appropriate minimum inflation
pressure for small tires at low maximum inflation pressures. In today’s market, most passenger car
tires fit on 15-inch diameter rims and larger, at a maximum inflation pressure of 240 kPa (35 psi)
for standard load tires. These tires (along with all light truck tires at maximum inflation pressures
of 340 kPa (50 psi) and higher, as well as all medium duty truck tires) would require higher
inflation pressures, as defined by the stiffness model, than would be indicated by the use of power
law rules.
In all these discussions, of course, “maximum inflation pressure” is taken to be the pressure at
which the tire develops its maximum load capacity. For most tires, this is the maximum pressure
shown on the tire’s sidewall. However, for passenger car tires, there are many types of tires that
are labeled with a higher maximum inflation pressure that the pressure at which the tire develops its
maximum load capacity. Table 2 summarizes these types of labeling.
The appropriate inflation pressure for a tire operating at a lower-than-maximum load condition can
be computed from the stiffness relationship derived in this paper. Alternatively, the simple model
shown in Equation 9, while indicating a higher pressure than the stiffness model, would provide a
safe value that is easily computed in the field.
Conclusions
1. Tire pressure required to support partial loads is predicted by the stiffness model to vary
linearly with the load.
2. Power rule models, having n equal to or less than 0.8, put forward by tire standards
organizations and indicated in tabulated values in annual yearbook publications may not
provide adequate inflation pressure for certain tires at partial load conditions.
3. Adequate inflation pressure is essential to prevent overdeflected operation of a tire so that it
can deliver its intended performances over the lifetime evisioned by the manufacturer.
13
4. The stiffness model formulation provides a conservative, but computationally intensive,
method of developing the proper inflation pressure for operation at less than maximum
loads.
5. The simple ratio method given by Equation 9 provides a slightly more conservative, but
computationally simpler, method of developing a safe operating pressure for tires operating
at less than maximum loads.
14
References
[1] Padula, S.M., “Tire Load Capacity”, The Pneumatic Tire, ed. By Gent, A.N., and Walter, J.D.,
Published by the National Highway Traffic Safety Administration, DOT Contract DTNH22-02-P-
07210, Aug. 2005, Chapter 5, pp. 186-205.
[2] Rhyne, T.B, “Development of a Vertical Stiffness Relationship for Belted Radial Tires,” Tire
Science and Technology, TSTCA, Vol. 33, No. 3, July-September 2005, pp. 136-155.
15
List of Tables
TABLE 1 – Parameter Values for Sample Tire Dimensions
TABLE 2 – Various Maximum Cold Inflation Pressure Markings Permitted
16
Table 1. Parameter Values for Sample Tire Dimensions
Dimension Pmax (kPa/psi) F k
155/80R13 240/35 0.071 0.204
235/75R15 240/35 0.099 0.145
325/75R20 350/50 0.136 0.074
455/55R22.5 900/130 0.176 0.022
Table 2. Various Maximum Cold Inflation Pressure Markings Permitted
Passenger Tire Type
Labeled Maximum Pressure Marking Maximum Pressure for Load Rating
Standard Load
240 kPa (35 psi) 240 kPa (35 psi)
300 kPa (44 psi) 240 kPa (35 psi), 250 kPa (36 psi)
350 kPa (51 psi) 240 kPa (35 psi), 250 kPa (36 psi)
Extra Load
280 kPa (41 psi) 280 kPa (41 psi)
340 kPa (50 psi) 280 kPa (41 psi), 290 kPa (42 psi) Note: Tires with 250 kPa (36 psi) and 290 kPa (42 psi) reference pressures have internationally harmonized load ratings
17
List of Figures
FIGURE 1. Pressure Model Predictions – Tire Industry Standards
FIGURE 2. Maximum Pressure Influence on Stiffness Model k Parameter
FIGURE 3. Range of Stiffness Model Pressure Predictions Compared to Industry Standards
FIGURE 4. Comparison of deflection resulting from Power Rule Model Loads versus Stiffness
Model Loads at extreme values of the parameter k.
FIGURE 5. Extra-Load versus Standard Load tire capacities for a P255/70R16 using EDI and
stiffness formulations.
18
FIGURE 1. Pressure Model Predictions – Tire Industry Standards
19
FIGURE 2. Maximum Pressure Influence on Stiffness Model k Parameter
20
FIGURE 3. Range of Stiffness Model Pressure Predictions Compared to Industry Standards
21
FIGURE 4. Comparison of deflections resulting from Power Rule Model Loads versus Stiffness Model Loads at extreme values of the
parameter k.
0.95
1.00
1.05
1.10
1.15
1.20
1.25
1.30
1.35
1.40
1.45
0.50 0.60 0.70 0.80 0.90 1.00
Pow
er R
ule
Def
lect
ion/
Stiff
ness
def
lect
ion
P/Pmax
Small Tires, Lower Pmaxk=0.22
n=0.5
n=0.65
n=0.70
n=0.8
0.95
1.00
1.05
1.10
1.15
1.20
1.25
1.30
1.35
1.40
1.45
0.50 0.60 0.70 0.80 0.90 1.00Po
wer
Rul
e D
efle
ctio
n/St
iffne
ss d
efle
ctio
n
P/Pmax
Large Tires, Higher Pmaxk=0.02
n=0.5
n=0.65
n=0.70
n=0.8
22
FIGURE 5. Extra-Load versus Standard Load tire capacities for a P255/70R16 using EDI and stiffness formulations.