Embed Size (px)
Citation preview
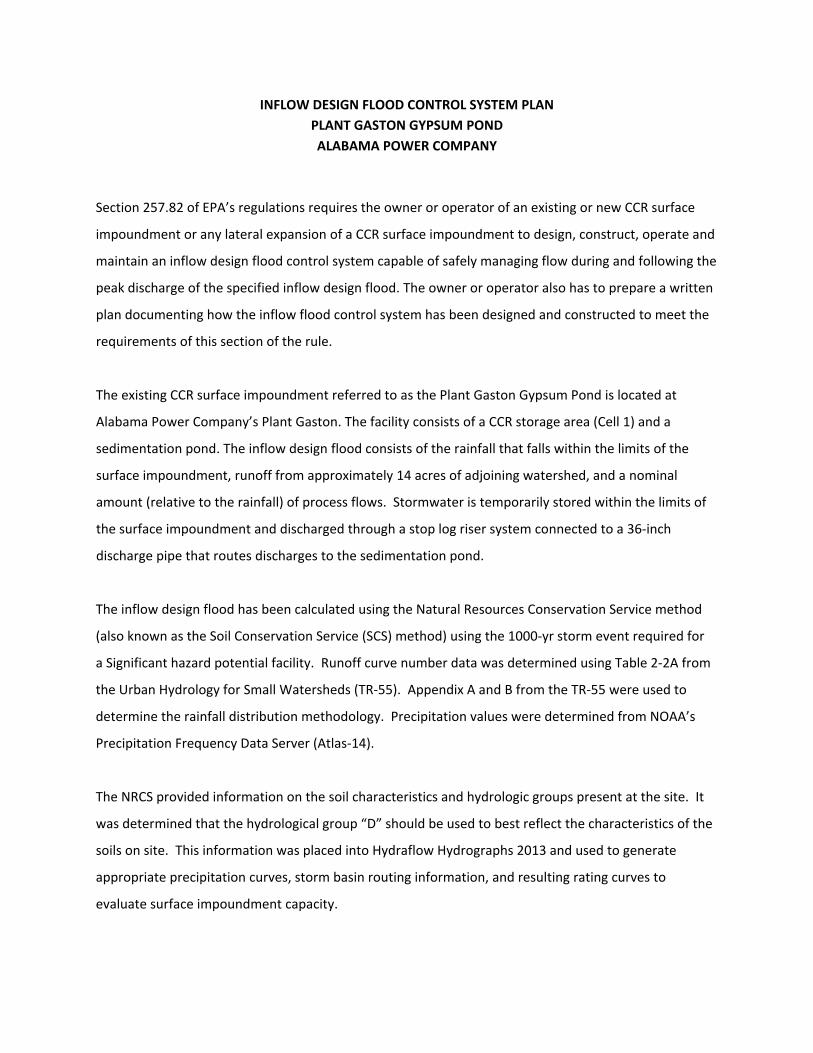
INFLOW DESIGN FLOOD CONTROL SYSTEM PLAN
PLANT GASTON GYPSUM POND
ALABAMA POWER COMPANY
Section 257.82 of EPA’s regulations requires the owner or operator of an existing or new CCR surface
impoundment or any lateral expansion of a CCR surface impoundment to design, construct, operate and
maintain an inflow design flood control system capable of safely managing flow during and following the
peak discharge of the specified inflow design flood. The owner or operator also has to prepare a written
plan documenting how the inflow flood control system has been designed and constructed to meet the
requirements of this section of the rule.
The existing CCR surface impoundment referred to as the Plant Gaston Gypsum Pond is located at
Alabama Power Company’s Plant Gaston. The facility consists of a CCR storage area (Cell 1) and a
sedimentation pond. The inflow design flood consists of the rainfall that falls within the limits of the
surface impoundment, runoff from approximately 14 acres of adjoining watershed, and a nominal
amount (relative to the rainfall) of process flows. Stormwater is temporarily stored within the limits of
the surface impoundment and discharged through a stop log riser system connected to a 36‐inch
discharge pipe that routes discharges to the sedimentation pond.
The inflow design flood has been calculated using the Natural Resources Conservation Service method
(also known as the Soil Conservation Service (SCS) method) using the 1000‐yr storm event required for
a Significant hazard potential facility. Runoff curve number data was determined using Table 2‐2A from
the Urban Hydrology for Small Watersheds (TR‐55). Appendix A and B from the TR‐55 were used to
determine the rainfall distribution methodology. Precipitation values were determined from NOAA’s
Precipitation Frequency Data Server (Atlas‐14).
The NRCS provided information on the soil characteristics and hydrologic groups present at the site. It
was determined that the hydrological group “D” should be used to best reflect the characteristics of the
soils on site. This information was placed into Hydraflow Hydrographs 2013 and used to generate
appropriate precipitation curves, storm basin routing information, and resulting rating curves to
evaluate surface impoundment capacity.
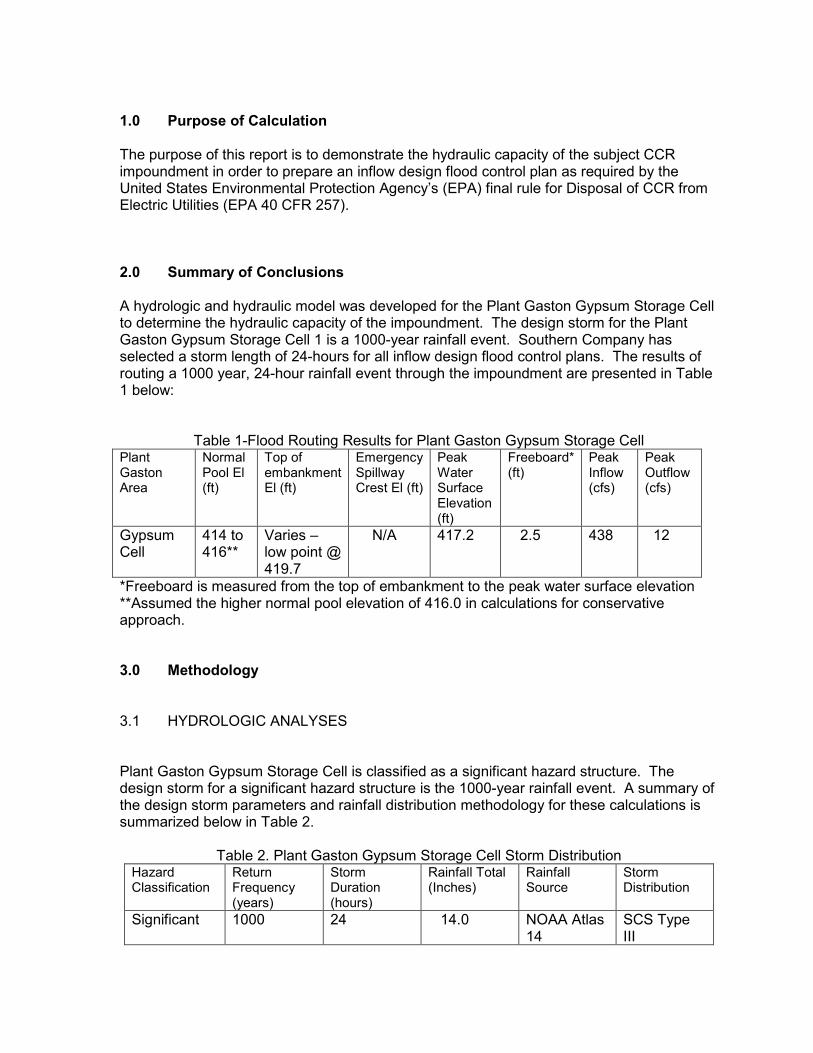
1.0 Purpose of Calculation The purpose of this report is to demonstrate the hydraulic capacity of the subject CCR impoundment in order to prepare an inflow design flood control plan as required by the United States Environmental Protection Agency’s (EPA) final rule for Disposal of CCR from Electric Utilities (EPA 40 CFR 257). 2.0 Summary of Conclusions A hydrologic and hydraulic model was developed for the Plant Gaston Gypsum Storage Cell to determine the hydraulic capacity of the impoundment. The design storm for the Plant Gaston Gypsum Storage Cell 1 is a 1000-year rainfall event. Southern Company has selected a storm length of 24-hours for all inflow design flood control plans. The results of routing a 1000 year, 24-hour rainfall event through the impoundment are presented in Table 1 below:
Table 1-Flood Routing Results for Plant Gaston Gypsum Storage Cell Plant Gaston Area
Normal Pool El (ft)
Top of embankment El (ft)
Emergency Spillway Crest El (ft)
Peak Water Surface Elevation (ft)
Freeboard* (ft)
Peak Inflow (cfs)
Peak Outflow (cfs)
Gypsum Cell
414 to 416**
Varies – low point @ 419.7
N/A 417.2 2.5 438 12
*Freeboard is measured from the top of embankment to the peak water surface elevation **Assumed the higher normal pool elevation of 416.0 in calculations for conservative approach. 3.0 Methodology 3.1 HYDROLOGIC ANALYSES Plant Gaston Gypsum Storage Cell is classified as a significant hazard structure. The design storm for a significant hazard structure is the 1000-year rainfall event. A summary of the design storm parameters and rainfall distribution methodology for these calculations is summarized below in Table 2.
Table 2. Plant Gaston Gypsum Storage Cell Storm Distribution Hazard Classification
Return Frequency (years)
Storm Duration (hours)
Rainfall Total (Inches)
Rainfall Source
Storm Distribution
Significant 1000 24 14.0 NOAA Atlas 14
SCS Type III
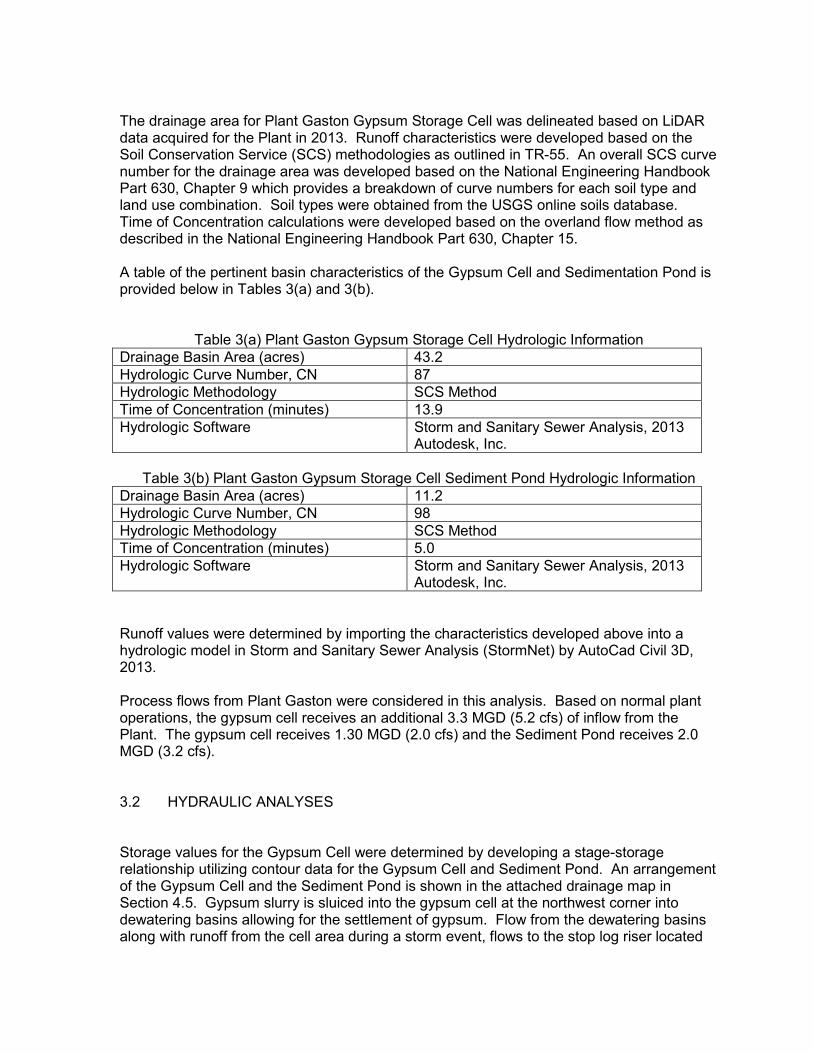
The drainage area for Plant Gaston Gypsum Storage Cell was delineated based on LiDAR data acquired for the Plant in 2013. Runoff characteristics were developed based on the Soil Conservation Service (SCS) methodologies as outlined in TR-55. An overall SCS curve number for the drainage area was developed based on the National Engineering Handbook Part 630, Chapter 9 which provides a breakdown of curve numbers for each soil type and land use combination. Soil types were obtained from the USGS online soils database. Time of Concentration calculations were developed based on the overland flow method as described in the National Engineering Handbook Part 630, Chapter 15. A table of the pertinent basin characteristics of the Gypsum Cell and Sedimentation Pond is provided below in Tables 3(a) and 3(b).
Table 3(a) Plant Gaston Gypsum Storage Cell Hydrologic Information
Drainage Basin Area (acres) 43.2
Hydrologic Curve Number, CN 87
Hydrologic Methodology SCS Method
Time of Concentration (minutes) 13.9
Hydrologic Software Storm and Sanitary Sewer Analysis, 2013 Autodesk, Inc.
Table 3(b) Plant Gaston Gypsum Storage Cell Sediment Pond Hydrologic Information
Drainage Basin Area (acres) 11.2
Hydrologic Curve Number, CN 98
Hydrologic Methodology SCS Method
Time of Concentration (minutes) 5.0
Hydrologic Software Storm and Sanitary Sewer Analysis, 2013 Autodesk, Inc.
Runoff values were determined by importing the characteristics developed above into a hydrologic model in Storm and Sanitary Sewer Analysis (StormNet) by AutoCad Civil 3D, 2013. Process flows from Plant Gaston were considered in this analysis. Based on normal plant operations, the gypsum cell receives an additional 3.3 MGD (5.2 cfs) of inflow from the Plant. The gypsum cell receives 1.30 MGD (2.0 cfs) and the Sediment Pond receives 2.0 MGD (3.2 cfs).
3.2 HYDRAULIC ANALYSES Storage values for the Gypsum Cell were determined by developing a stage-storage relationship utilizing contour data for the Gypsum Cell and Sediment Pond. An arrangement of the Gypsum Cell and the Sediment Pond is shown in the attached drainage map in Section 4.5. Gypsum slurry is sluiced into the gypsum cell at the northwest corner into dewatering basins allowing for the settlement of gypsum. Flow from the dewatering basins along with runoff from the cell area during a storm event, flows to the stop log riser located
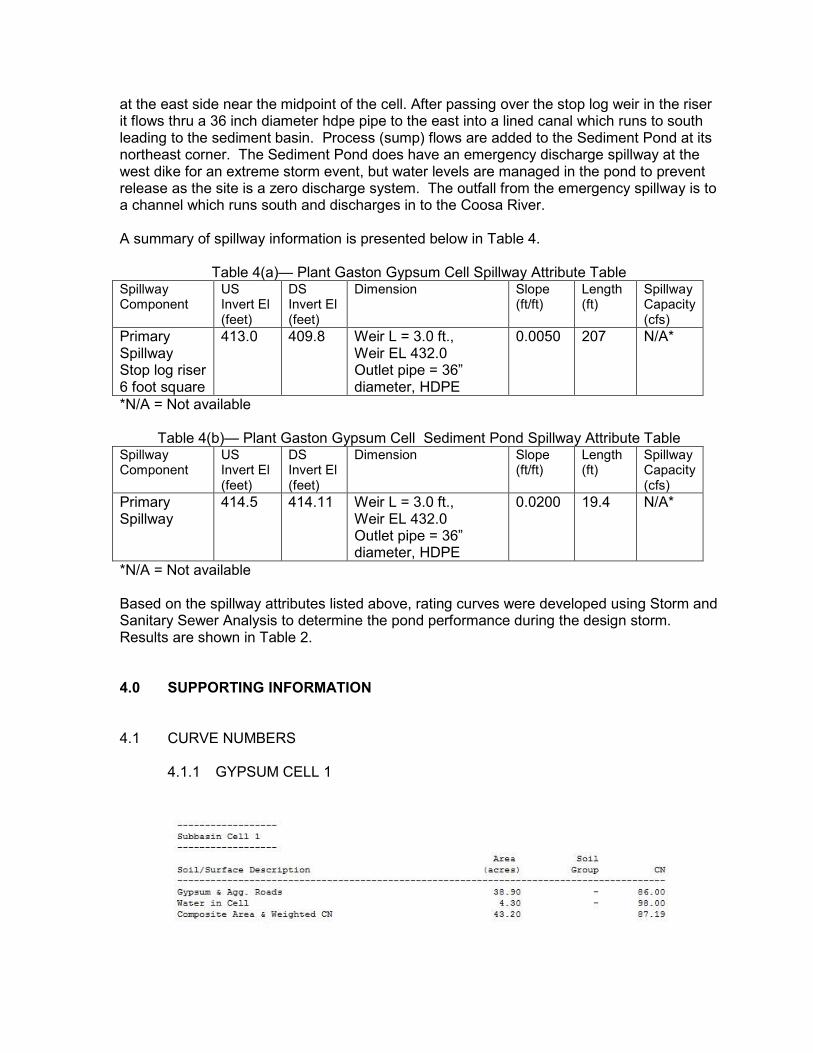
at the east side near the midpoint of the cell. After passing over the stop log weir in the riser it flows thru a 36 inch diameter hdpe pipe to the east into a lined canal which runs to south leading to the sediment basin. Process (sump) flows are added to the Sediment Pond at its northeast corner. The Sediment Pond does have an emergency discharge spillway at the west dike for an extreme storm event, but water levels are managed in the pond to prevent release as the site is a zero discharge system. The outfall from the emergency spillway is to a channel which runs south and discharges in to the Coosa River. A summary of spillway information is presented below in Table 4.
Table 4(a)— Plant Gaston Gypsum Cell Spillway Attribute Table Spillway Component
US Invert El (feet)
DS Invert El (feet)
Dimension Slope (ft/ft)
Length (ft)
Spillway Capacity (cfs)
Primary Spillway Stop log riser 6 foot square
413.0 409.8 Weir L = 3.0 ft., Weir EL 432.0 Outlet pipe = 36” diameter, HDPE
0.0050 207 N/A*
*N/A = Not available
Table 4(b)— Plant Gaston Gypsum Cell Sediment Pond Spillway Attribute Table Spillway Component
US Invert El (feet)
DS Invert El (feet)
Dimension Slope (ft/ft)
Length (ft)
Spillway Capacity (cfs)
Primary Spillway
414.5 414.11 Weir L = 3.0 ft., Weir EL 432.0 Outlet pipe = 36” diameter, HDPE
0.0200 19.4 N/A*
*N/A = Not available Based on the spillway attributes listed above, rating curves were developed using Storm and Sanitary Sewer Analysis to determine the pond performance during the design storm. Results are shown in Table 2. 4.0 SUPPORTING INFORMATION
4.1 CURVE NUMBERS 4.1.1 GYPSUM CELL 1
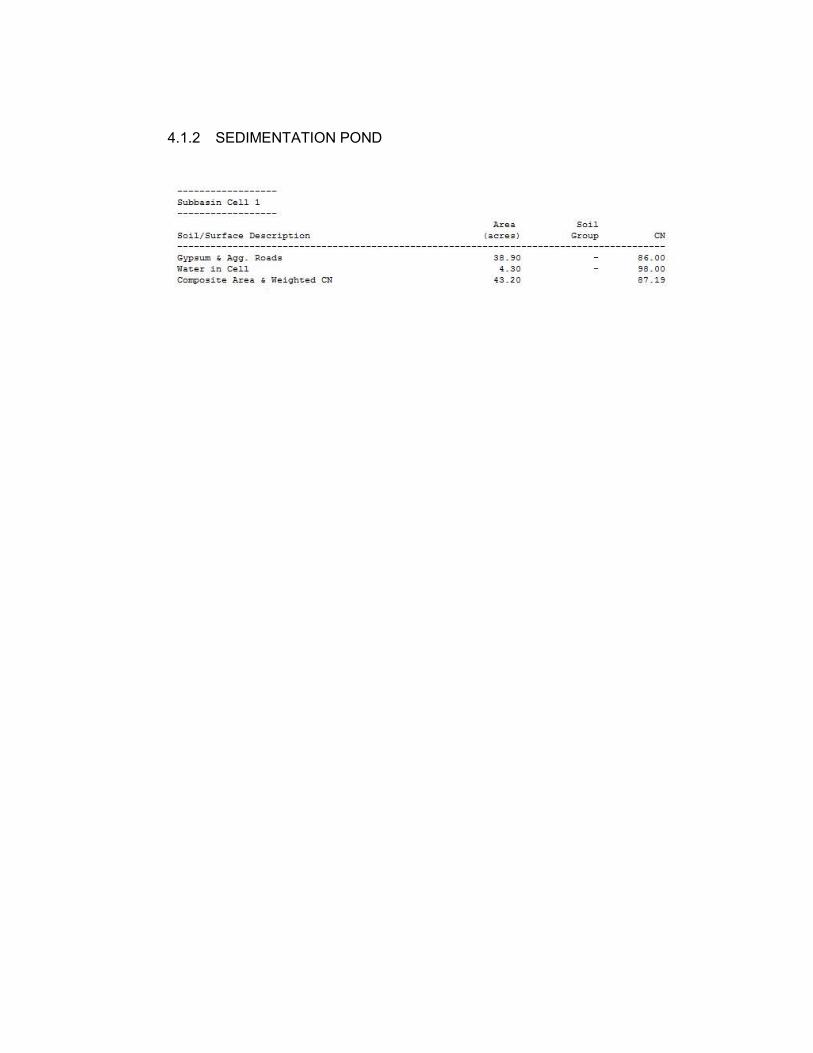
4.1.2 SEDIMENTATION POND
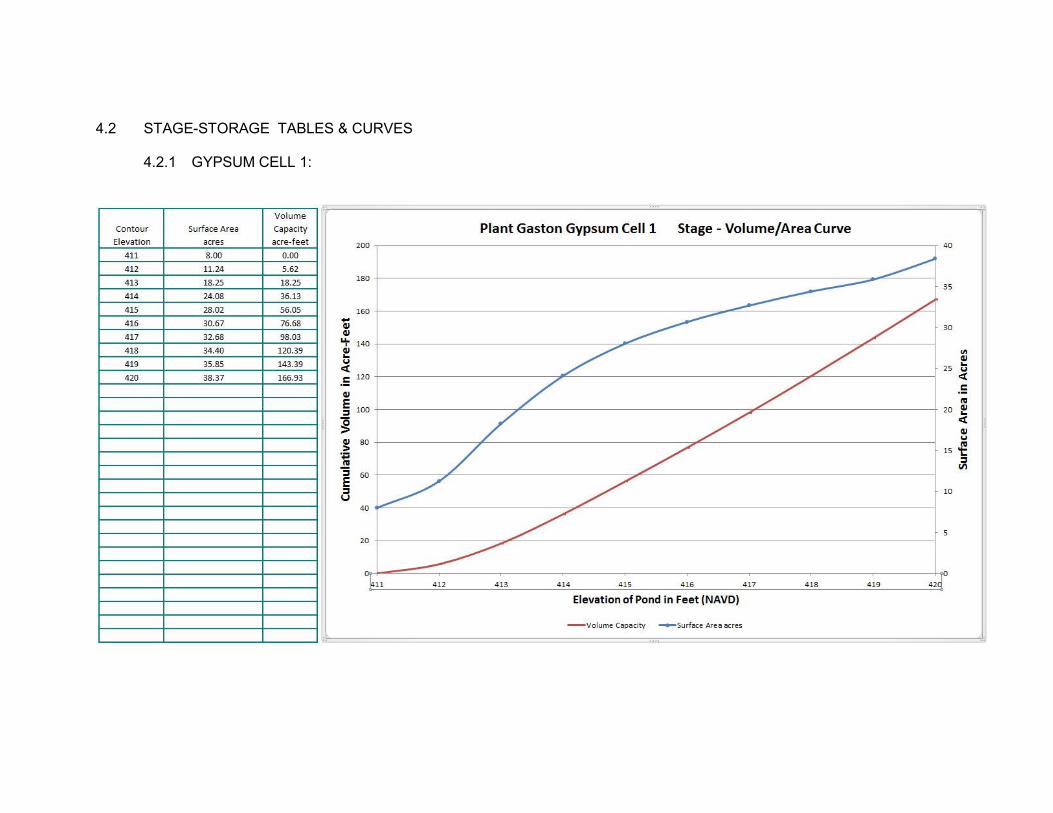
4.2 STAGE-STORAGE TABLES & CURVES 4.2.1 GYPSUM CELL 1:
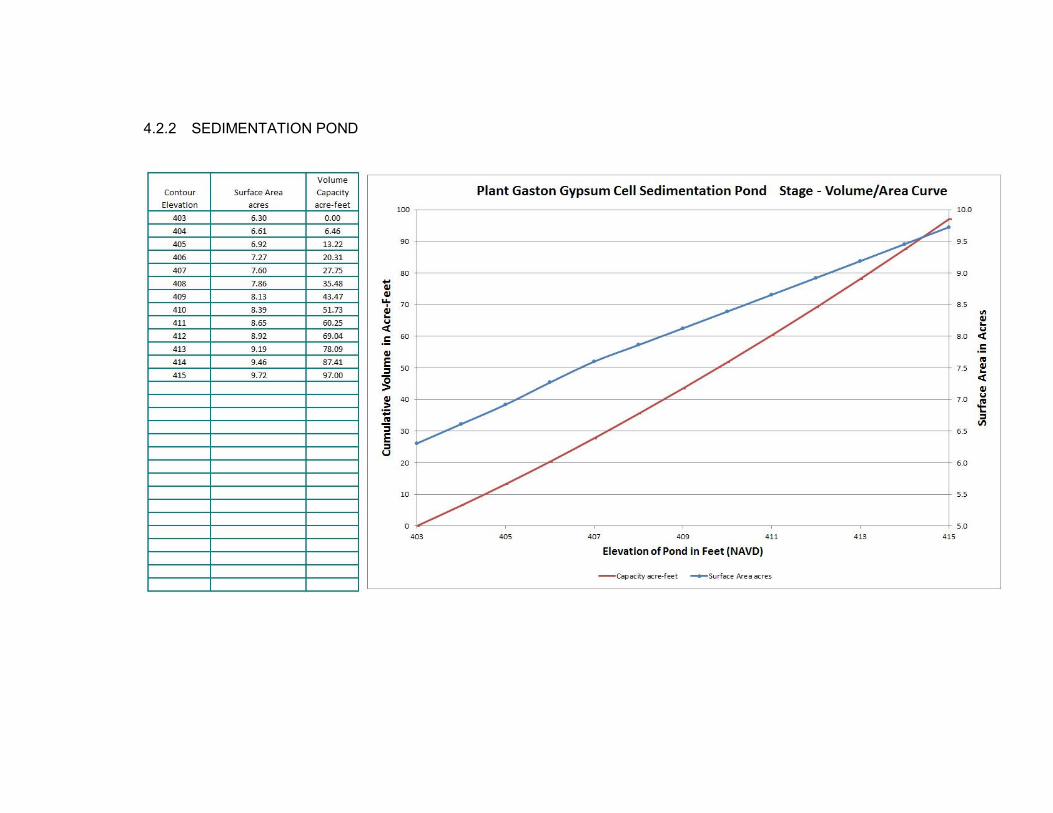
4.2.2 SEDIMENTATION POND
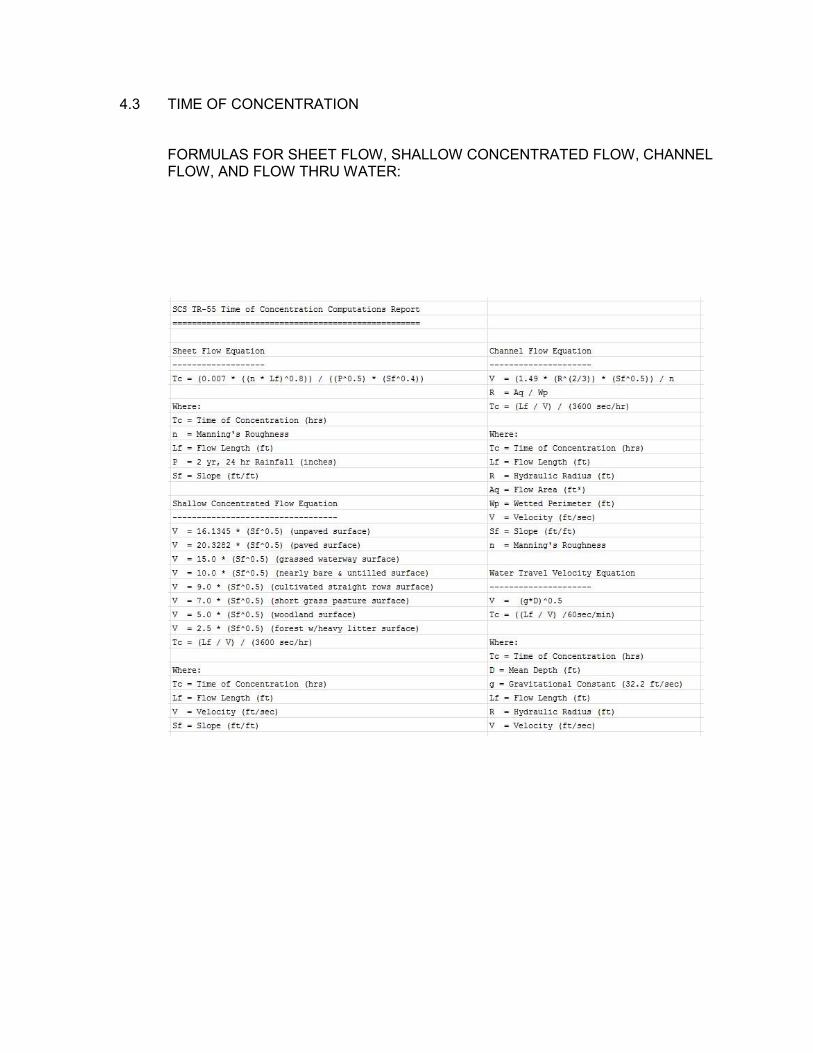
4.3 TIME OF CONCENTRATION FORMULAS FOR SHEET FLOW, SHALLOW CONCENTRATED FLOW, CHANNEL FLOW, AND FLOW THRU WATER:
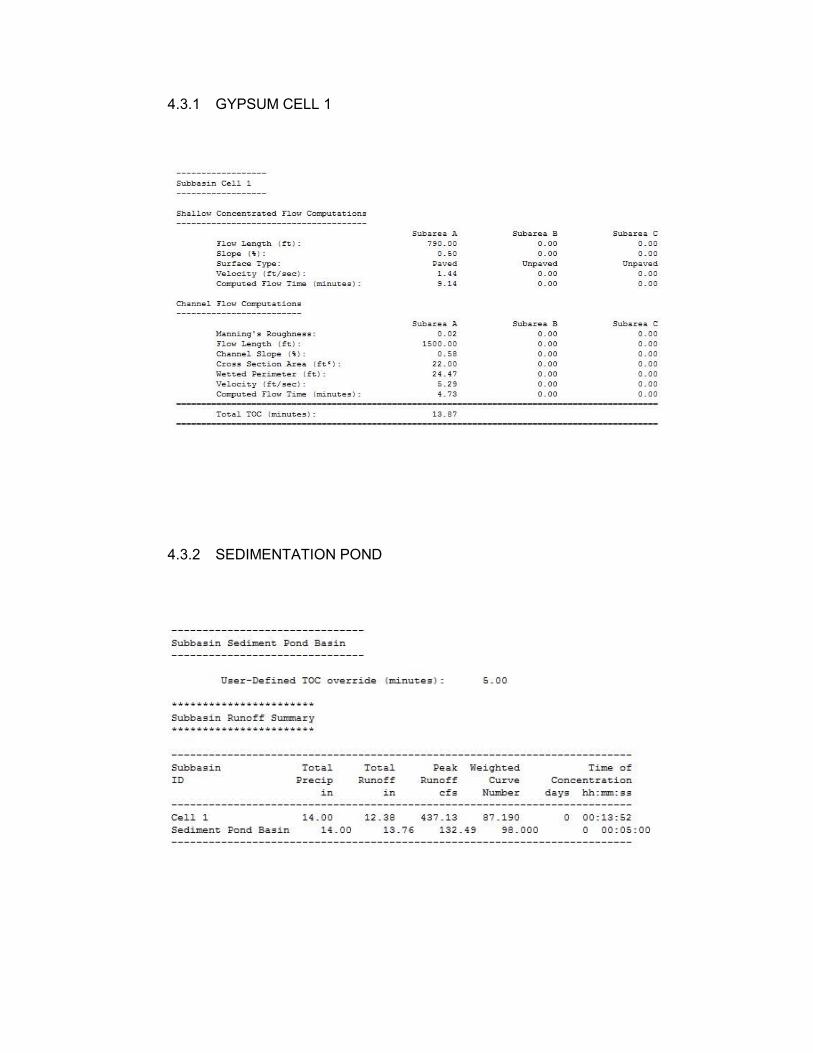
4.3.1 GYPSUM CELL 1
4.3.2 SEDIMENTATION POND
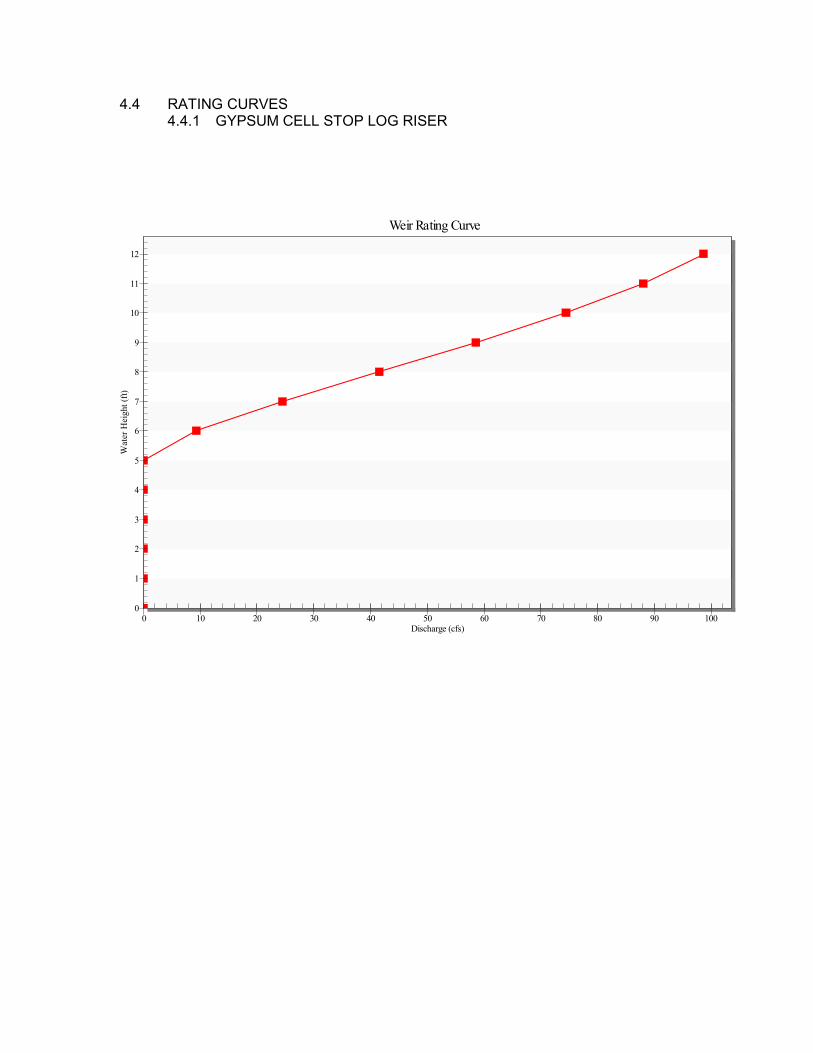
4.4 RATING CURVES 4.4.1 GYPSUM CELL STOP LOG RISER
0
1
2
3
4
5
6
7
8
9
10
11
12
0 10 20 30 40 50 60 70 80 90 100
Weir Rating Curve
Water Height (ft)
Discharge (cfs)
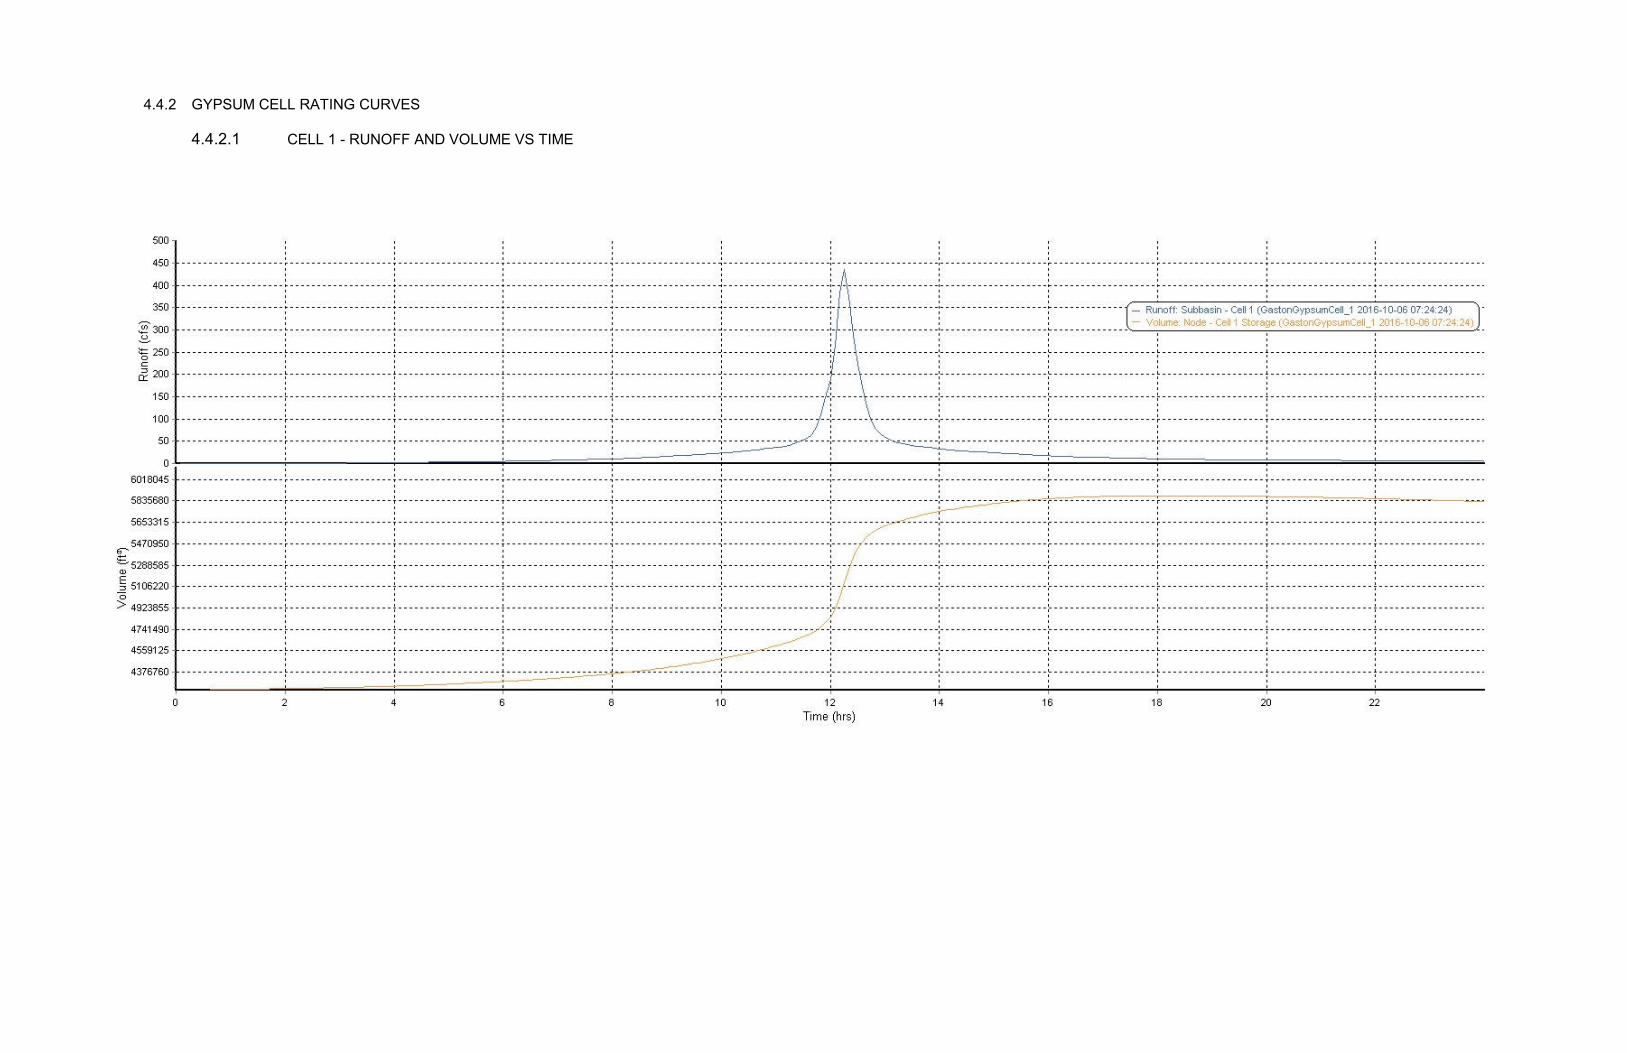
4.4.2 GYPSUM CELL RATING CURVES
4.4.2.1 CELL 1 - RUNOFF AND VOLUME VS TIME
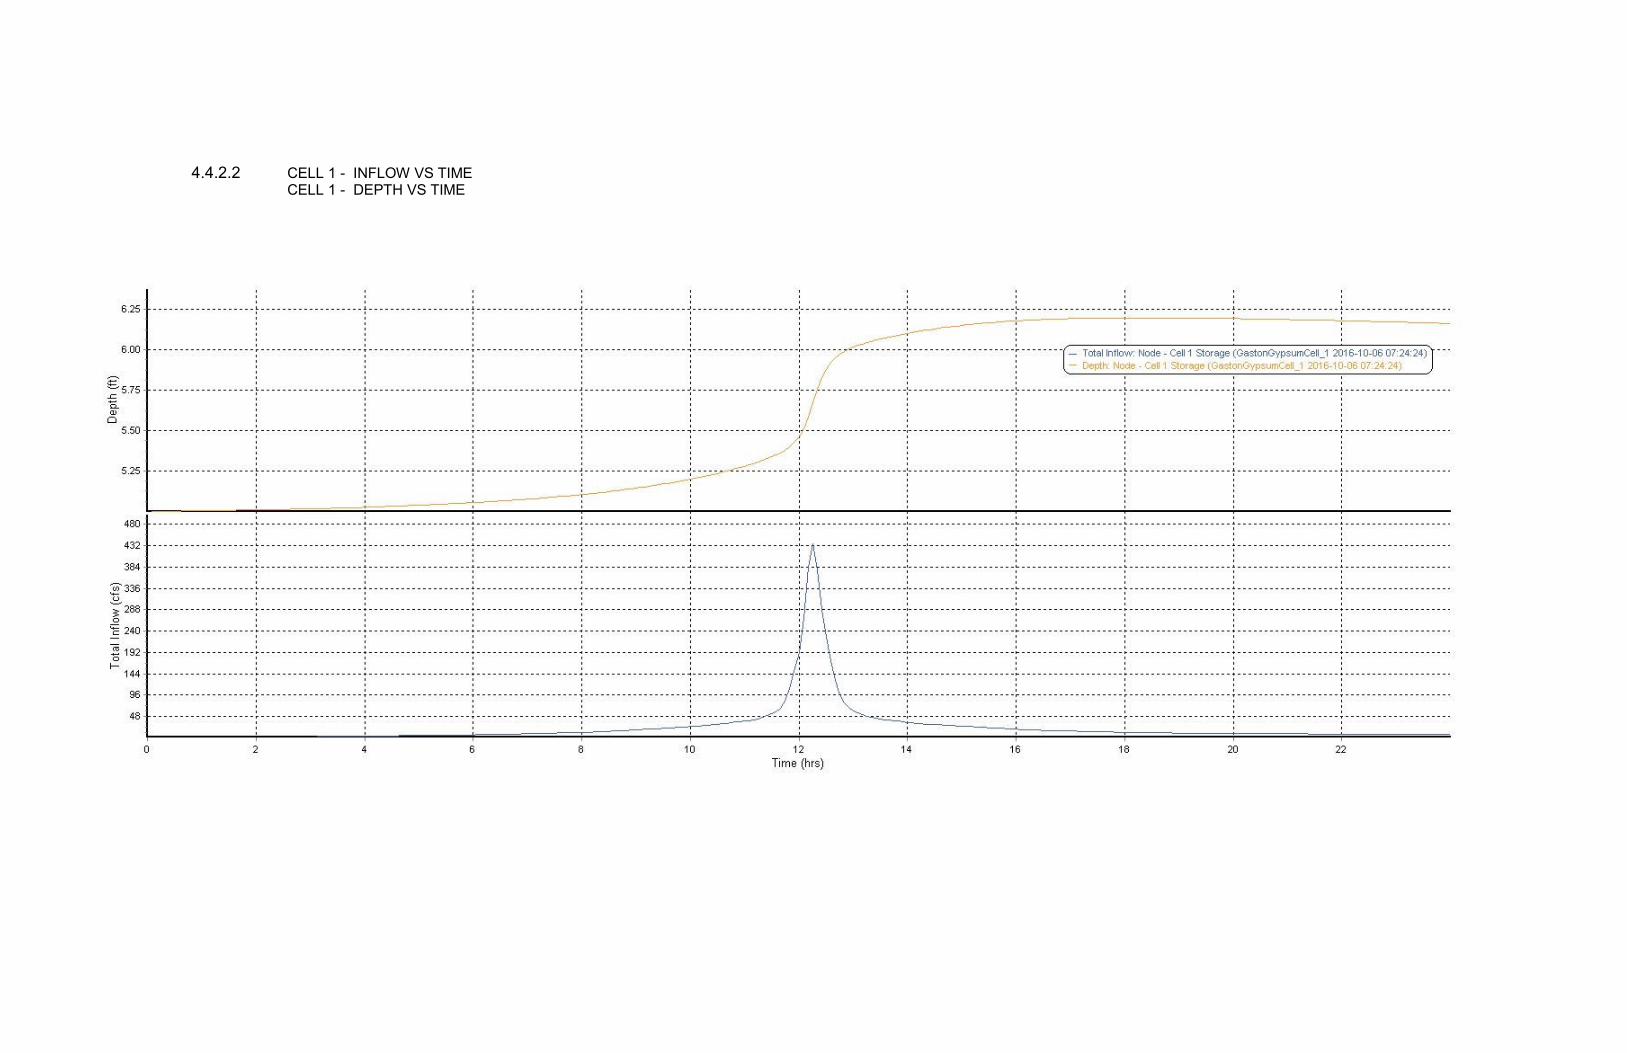
4.4.2.2 CELL 1 - INFLOW VS TIME CELL 1 - DEPTH VS TIME
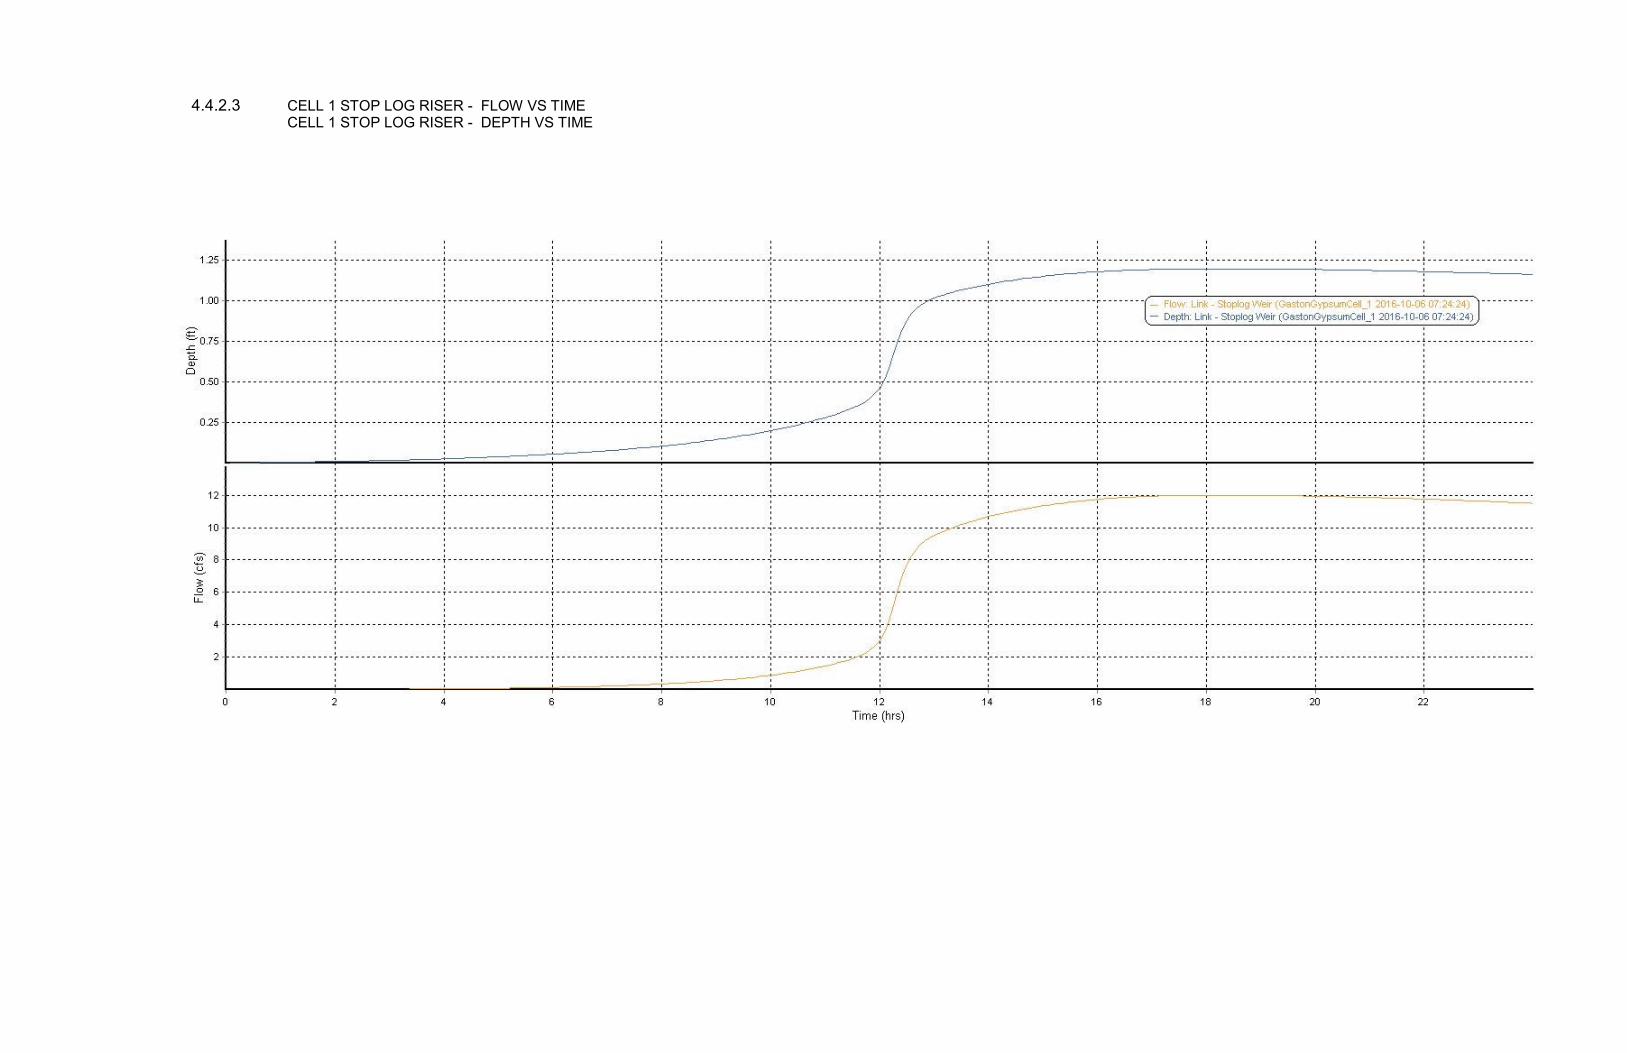
4.4.2.3 CELL 1 STOP LOG RISER - FLOW VS TIME CELL 1 STOP LOG RISER - DEPTH VS TIME
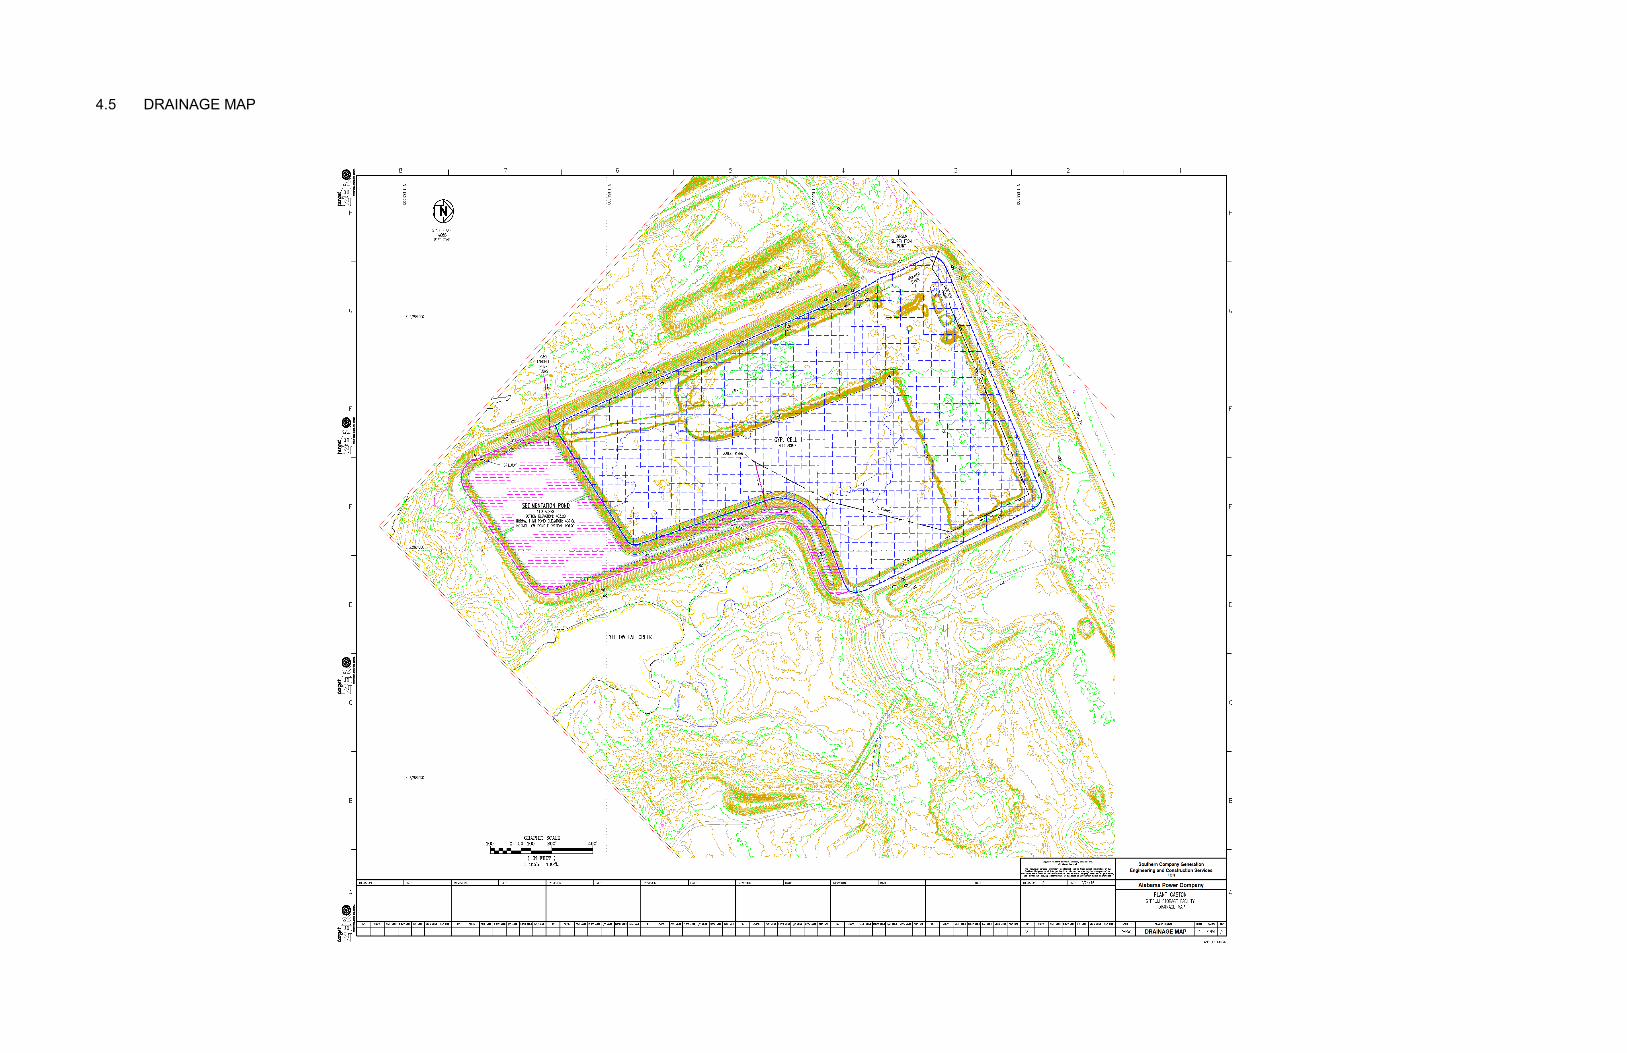
4.5 DRAINAGE MAP