Embed Size (px)
Citation preview

Heliyon 5 (2019) e02311
Contents lists available at ScienceDirect
Heliyon
journal homepage: www.heliyon.com
Influence of abrasives and graphite on processing and properties of sinteredmetallic friction materials
B. P�erez b, J. Echeberria a,b,*
a Ceit, Manuel Lardizabal 15, 20018, Donostia/San Sebastian, Spainb Universidad de Navarra, Tecnun, Manuel Lardizabal 13, 20018, Donostia/San Sebastian, Spain
A R T I C L E I N F O
Keywords:Materials science
* Corresponding author.E-mail address: [email protected] (J. Echeber
https://doi.org/10.1016/j.heliyon.2019.e02311Received 7 February 2019; Received in revised for2405-8440/© 2019 Published by Elsevier Ltd. This
A B S T R A C T
In this study, the influence of abrasives (size and morphology) and graphite on the processing and properties offriction materials were investigated. Friction materials based on bronze matrix, graphite as solid lubricant anddifferent abrasives (silica, mullite and zircon) were prepared following two routes. On the one hand, following thetraditional P/M technology (pressing-sintering) and on the other hand, using an alternative P/M route, whichconsists on sintering a powder blend free deposited in a mold and subsequently cold pressing. Sinterability,microstructure and physical-mechanical properties of the processed friction materials have been studied. Tribo-logical and wear tests were carried out on a pin-on-disc system at different loads and sliding speeds using samplesof 20 mm in diameter. Results show that the influence of abrasives size is especially relevant in the alternative P/M route, where materials including fine abrasives present unsuitable properties. Graphite also plays an importantrole on tribological behavior, in this work it has been found that friction materials with 4 wt.% graphite havebetter tribological properties than those with 2 wt.% graphite, despite having lower density and mechanicalresistance.
1. Introduction
Sintered metallic friction materials are a smart choice for heavy-dutyapplications, like high-speed train brakes or industrial machineryclutches. Currently, there are two main production processes for thesesystems, namely press sintering (conventional method) and sprinklesintering method [1]. In the first one, a powder blend is compacted andthen, lining green compacts are attached to steel plate and sintered. Onthe other hand, the sprinkle process is especially useful in the case ofclutch discs with large diameter and with friction layer less than 1 mm inthickness. It has the advantage of not requiring any expensive compac-tion tooling. In this process, the powder blend is free deposited in steelplates and sintered in a conveyor belt furnace with liquid phase. Subse-quently, because linings are more porous than in press sintering method,sintered components must be pressed to increase the density and reducethe porosity. Secondary operations are usually required in both processesto achieved smooth surface and close dimensional tolerances [2].
The performance of the brakes and clutches is mainly controlled bythe composition and microstructure of the lining material [3, 4]. Thesematerials contain several components and each one plays a different rolein friction performance. Principal components are metallic matrix,
ria).
m 23 July 2019; Accepted 12 Auis an open access article under t
abrasives and solid lubricants. Generally, sintered metallic friction ma-terials are classified intro two families according to the matrix material,namely copper-based and iron-based materials [5]. Copper-based frictionmaterials are extensively used in friction devices due to their excellentthermal conductivity and wear resistance [3, 6, 7, 8, 9]. Abrasives areusually added to enhance the frictional response of Cu-based materials.The most common abrasives are hard minerals such as silica, alumina,zircon, silicon carbide and numerous oxides of common metals. Abra-sives' effectiveness is highly dependent on morphology, size and fracturetoughness of the particles. Information about the effect of abrasives onproperties of Cu-based friction material is limited. K.H. Cho et al [10] andE. Lee et al. [11] have studied the size effect of zircon and silica particleson friction characteristics of non-metallic brake lining materials. Theyobserved that brake linings with small zircon particles has poor frictionstability and large oscillation of the friction coefficient with considerablelining wear, while those with coarse zircon particles showed excellentfriction stability and a lower wear rate. Contrary, materials with silicahave little difference in the wear rate regardless silica particles size. Thisis due to the low fracture toughness of silica particles, which leads to sizereduction of coarse particles during sliding. The effect of mullite incopper base composite has been studied by V. Jain et al. [2] and they
gust 2019he CC BY-NC-ND license (http://creativecommons.org/licenses/by-nc-nd/4.0/).
B. P�erez, J. Echeberria Heliyon 5 (2019) e02311
found that composite which contains mullite and graphite has stablefriction coefficient and negligible wear loss. T. Ram Prabhu et al. [12]have reported similar results, materials with large particles of mulliteshowed better brake performance than those with silica particles due tothe greater elastic modulus of mullite.
On the other hand, solid lubricants such as graphite or metal sul-phides are required to improve wear resistance [8]. Owing to the lamellarstructure and softness of these particles, a solid lubricant film that re-duces friction is formed at the contact surface during sliding. Differenttypes of graphite has different properties, for instance graphite in theflake form can improve the lubrication properties, while graphite in thegranular form is able to dissipate the heat generated during braking moreeffectively [13]. However, the addition of graphite to friction materialleads to a reduction in mechanical resistance [14]. It is of high impor-tance to find the adequate quantity of graphite to get excellent lubrica-tion properties without reducing friction forces, which are responsible forbraking effectiveness.
This work is focused on the influence of particle size and morphologyof silica, mullite and zircon, as well as graphite content and type (naturaland synthetic) on the processing and properties of copper-based frictionmaterials.
2. Materials and methods
2.1. Samples preparation
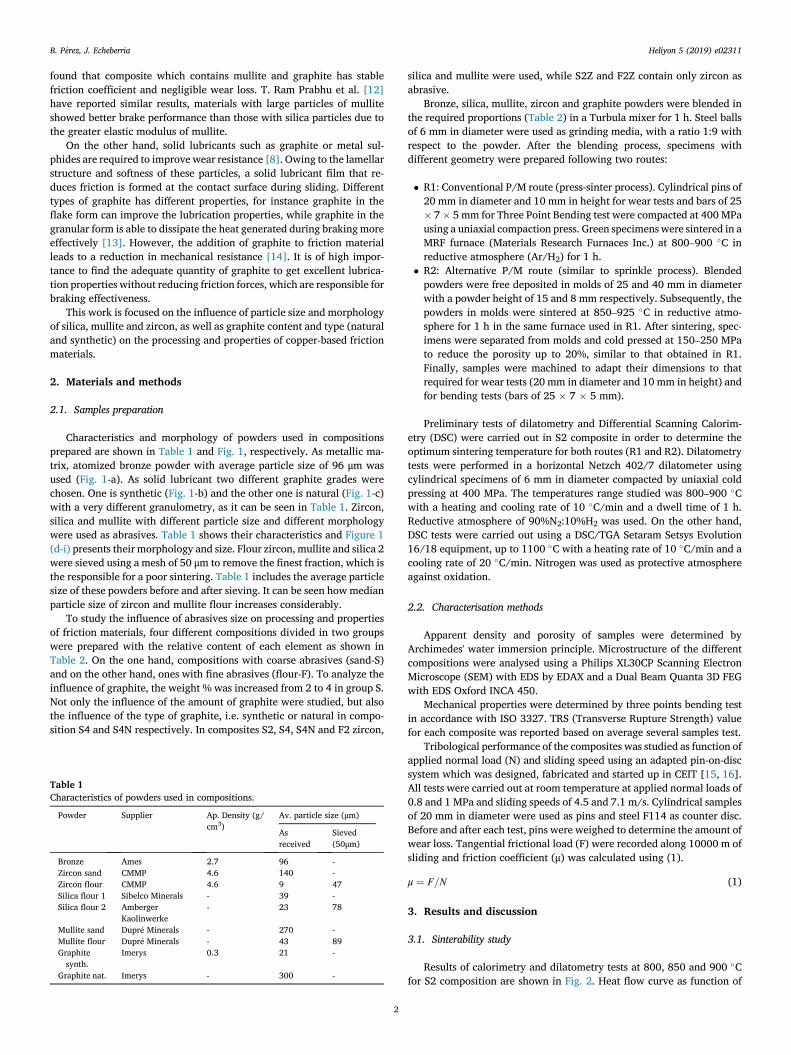
Characteristics and morphology of powders used in compositionsprepared are shown in Table 1 and Fig. 1, respectively. As metallic ma-trix, atomized bronze powder with average particle size of 96 μm wasused (Fig. 1-a). As solid lubricant two different graphite grades werechosen. One is synthetic (Fig. 1-b) and the other one is natural (Fig. 1-c)with a very different granulometry, as it can be seen in Table 1. Zircon,silica and mullite with different particle size and different morphologywere used as abrasives. Table 1 shows their characteristics and Figure 1(d-i) presents their morphology and size. Flour zircon, mullite and silica 2were sieved using a mesh of 50 μm to remove the finest fraction, which isthe responsible for a poor sintering. Table 1 includes the average particlesize of these powders before and after sieving. It can be seen howmedianparticle size of zircon and mullite flour increases considerably.
To study the influence of abrasives size on processing and propertiesof friction materials, four different compositions divided in two groupswere prepared with the relative content of each element as shown inTable 2. On the one hand, compositions with coarse abrasives (sand-S)and on the other hand, ones with fine abrasives (flour-F). To analyze theinfluence of graphite, the weight % was increased from 2 to 4 in group S.Not only the influence of the amount of graphite were studied, but alsothe influence of the type of graphite, i.e. synthetic or natural in compo-sition S4 and S4N respectively. In composites S2, S4, S4N and F2 zircon,
Table 1Characteristics of powders used in compositions.
Powder Supplier Ap. Density (g/cm3)
Av. particle size (μm)
Asreceived
Sieved(50μm)
Bronze Ames 2.7 96 -Zircon sand CMMP 4.6 140 -Zircon flour CMMP 4.6 9 47Silica flour 1 Sibelco Minerals - 39 -Silica flour 2 Amberger
Kaolinwerke- 23 78
Mullite sand Dupr�e Minerals - 270 -Mullite flour Dupr�e Minerals - 43 89Graphitesynth.
Imerys 0.3 21 -
Graphite nat. Imerys - 300 -
2
silica and mullite were used, while S2Z and F2Z contain only zircon asabrasive.
Bronze, silica, mullite, zircon and graphite powders were blended inthe required proportions (Table 2) in a Turbula mixer for 1 h. Steel ballsof 6 mm in diameter were used as grinding media, with a ratio 1:9 withrespect to the powder. After the blending process, specimens withdifferent geometry were prepared following two routes:
� R1: Conventional P/M route (press-sinter process). Cylindrical pins of20 mm in diameter and 10 mm in height for wear tests and bars of 25� 7� 5 mm for Three Point Bending test were compacted at 400 MPausing a uniaxial compaction press. Green specimenswere sintered in aMRF furnace (Materials Research Furnaces Inc.) at 800–900 �C inreductive atmosphere (Ar/H2) for 1 h.
� R2: Alternative P/M route (similar to sprinkle process). Blendedpowders were free deposited in molds of 25 and 40 mm in diameterwith a powder height of 15 and 8 mm respectively. Subsequently, thepowders in molds were sintered at 850–925 �C in reductive atmo-sphere for 1 h in the same furnace used in R1. After sintering, spec-imens were separated from molds and cold pressed at 150–250 MPato reduce the porosity up to 20%, similar to that obtained in R1.Finally, samples were machined to adapt their dimensions to thatrequired for wear tests (20 mm in diameter and 10 mm in height) andfor bending tests (bars of 25 � 7 � 5 mm).
Preliminary tests of dilatometry and Differential Scanning Calorim-etry (DSC) were carried out in S2 composite in order to determine theoptimum sintering temperature for both routes (R1 and R2). Dilatometrytests were performed in a horizontal Netzch 402/7 dilatometer usingcylindrical specimens of 6 mm in diameter compacted by uniaxial coldpressing at 400 MPa. The temperatures range studied was 800–900 �Cwith a heating and cooling rate of 10 �C/min and a dwell time of 1 h.Reductive atmosphere of 90%N2:10%H2 was used. On the other hand,DSC tests were carried out using a DSC/TGA Setaram Setsys Evolution16/18 equipment, up to 1100 �C with a heating rate of 10 �C/min and acooling rate of 20 �C/min. Nitrogen was used as protective atmosphereagainst oxidation.
2.2. Characterisation methods
Apparent density and porosity of samples were determined byArchimedes' water immersion principle. Microstructure of the differentcompositions were analysed using a Philips XL30CP Scanning ElectronMicroscope (SEM) with EDS by EDAX and a Dual Beam Quanta 3D FEGwith EDS Oxford INCA 450.
Mechanical properties were determined by three points bending testin accordance with ISO 3327. TRS (Transverse Rupture Strength) valuefor each composite was reported based on average several samples test.
Tribological performance of the composites was studied as function ofapplied normal load (N) and sliding speed using an adapted pin-on-discsystem which was designed, fabricated and started up in CEIT [15, 16].All tests were carried out at room temperature at applied normal loads of0.8 and 1 MPa and sliding speeds of 4.5 and 7.1 m/s. Cylindrical samplesof 20 mm in diameter were used as pins and steel F114 as counter disc.Before and after each test, pins were weighed to determine the amount ofwear loss. Tangential frictional load (F) were recorded along 10000 m ofsliding and friction coefficient (μ) was calculated using (1).
μ ¼ F=N (1)
3. Results and discussion
3.1. Sinterability study
Results of calorimetry and dilatometry tests at 800, 850 and 900 �Cfor S2 composition are shown in Fig. 2. Heat flow curve as function of
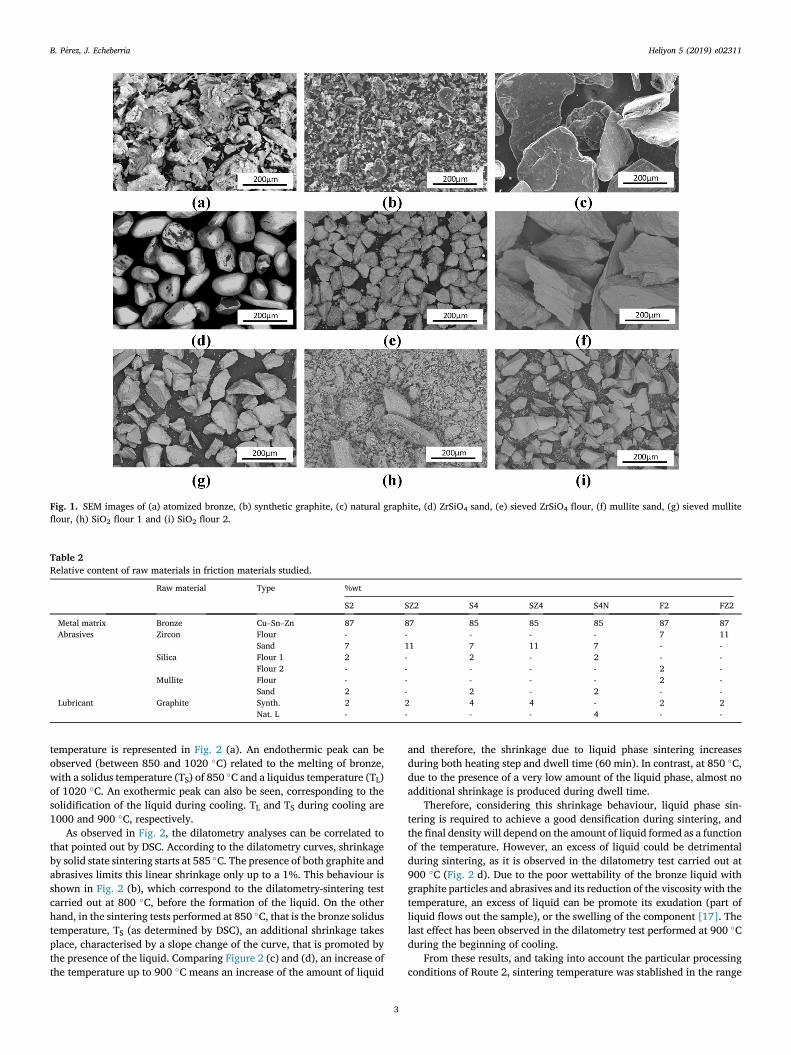
Fig. 1. SEM images of (a) atomized bronze, (b) synthetic graphite, (c) natural graphite, (d) ZrSiO4 sand, (e) sieved ZrSiO4 flour, (f) mullite sand, (g) sieved mulliteflour, (h) SiO2 flour 1 and (i) SiO2 flour 2.
Table 2Relative content of raw materials in friction materials studied.
Raw material Type %wt
S2 SZ2 S4 SZ4 S4N F2 FZ2
Metal matrix Bronze Cu–Sn–Zn 87 87 85 85 85 87 87Abrasives Zircon Flour - - - - - 7 11
Sand 7 11 7 11 7 - -Silica Flour 1 2 - 2 - 2 - -
Flour 2 - - - - - 2 -Mullite Flour - - - - - 2 -
Sand 2 - 2 - 2 - -Lubricant Graphite Synth. 2 2 4 4 - 2 2
Nat. L - - - - 4 - -
B. P�erez, J. Echeberria Heliyon 5 (2019) e02311
temperature is represented in Fig. 2 (a). An endothermic peak can beobserved (between 850 and 1020 �C) related to the melting of bronze,with a solidus temperature (TS) of 850 �C and a liquidus temperature (TL)of 1020 �C. An exothermic peak can also be seen, corresponding to thesolidification of the liquid during cooling. TL and TS during cooling are1000 and 900 �C, respectively.
As observed in Fig. 2, the dilatometry analyses can be correlated tothat pointed out by DSC. According to the dilatometry curves, shrinkageby solid state sintering starts at 585 �C. The presence of both graphite andabrasives limits this linear shrinkage only up to a 1%. This behaviour isshown in Fig. 2 (b), which correspond to the dilatometry-sintering testcarried out at 800 �C, before the formation of the liquid. On the otherhand, in the sintering tests performed at 850 �C, that is the bronze solidustemperature, TS (as determined by DSC), an additional shrinkage takesplace, characterised by a slope change of the curve, that is promoted bythe presence of the liquid. Comparing Figure 2 (c) and (d), an increase ofthe temperature up to 900 �C means an increase of the amount of liquid
3
and therefore, the shrinkage due to liquid phase sintering increasesduring both heating step and dwell time (60 min). In contrast, at 850 �C,due to the presence of a very low amount of the liquid phase, almost noadditional shrinkage is produced during dwell time.
Therefore, considering this shrinkage behaviour, liquid phase sin-tering is required to achieve a good densification during sintering, andthe final density will depend on the amount of liquid formed as a functionof the temperature. However, an excess of liquid could be detrimentalduring sintering, as it is observed in the dilatometry test carried out at900 �C (Fig. 2 d). Due to the poor wettability of the bronze liquid withgraphite particles and abrasives and its reduction of the viscosity with thetemperature, an excess of liquid can be promote its exudation (part ofliquid flows out the sample), or the swelling of the component [17]. Thelast effect has been observed in the dilatometry test performed at 900 �Cduring the beginning of cooling.
From these results, and taking into account the particular processingconditions of Route 2, sintering temperature was stablished in the range
(a) (b)
(c) (d)
-0,5
0,0
0,5
1,0
1,5
100 300 500 700 900 1100
(wolftaeH
mW
/m0)
T (°C)
Hea�ng
Cooling
1020°C850°C
0
200
400
600
800
-4%
-3%
-2%
-1%
0%
1%
2%
0 30 60 90 120 150 180
T (°
C)o L/Ld
t (min)
587°C
800°C
0
200
400
600
800
-4%
-3%
-2%
-1%
0%
1%
2%
0 30 60 90 120 150 180T
(°C)oL/Ld
t (min)
850°C
587°C
0
200
400
600
800
-4%
-3%
-2%
-1%
0%
1%
2%
0 30 60 90 120 150
T (°
C)oL/Ldt (min)
850°C
587°C
900°C
Swelling duringcooling
Fig. 2. (a) DSC curve of S2 material, (b) dilatometry up to 800 �C, (c) 850 �C and (d) 900 �C curves for S2 material processing by route 1.
B. P�erez, J. Echeberria Heliyon 5 (2019) e02311
of 850–900 �C. Nevertheless, sintering behavior of the different com-positions is strongly dependent on processing conditions used in eachroute. Therefore, it is of high importance to perform sintering tests tosamples processed following both routes and determine the appropriatesintering conditions for each one.
First sintering tests on green preforms were carried out with S2composition (the same used for DSC and dilatometry experiments) pro-cessed according to Route 1. The results obtained are shown in Table 3. Inaccordance with results obtained in dilatometry tests (Figure 2 b-d),shrinkage of sample does not take place until the appearance of liquidphase at 850 �C. However, at 900 �C, the quantity of liquid seems to beexcessive, since part of it exudes due to its low wettability with abrasivesand graphite particles.
As observed in Table 3, mechanical resistance (TRS) increases withsintering temperature. This suggests that, although before bronze TS (850�C) density and porosity values are similar to that of green sample, theprocess of particles bonding takes place, providing sample with strength.As expected, the highest mechanical resistance (TRS) is obtained at 850�C, when liquid phase begins to appear. It enhances particles bonding andactivates the sintering process getting a more strengthened matrixstructure.
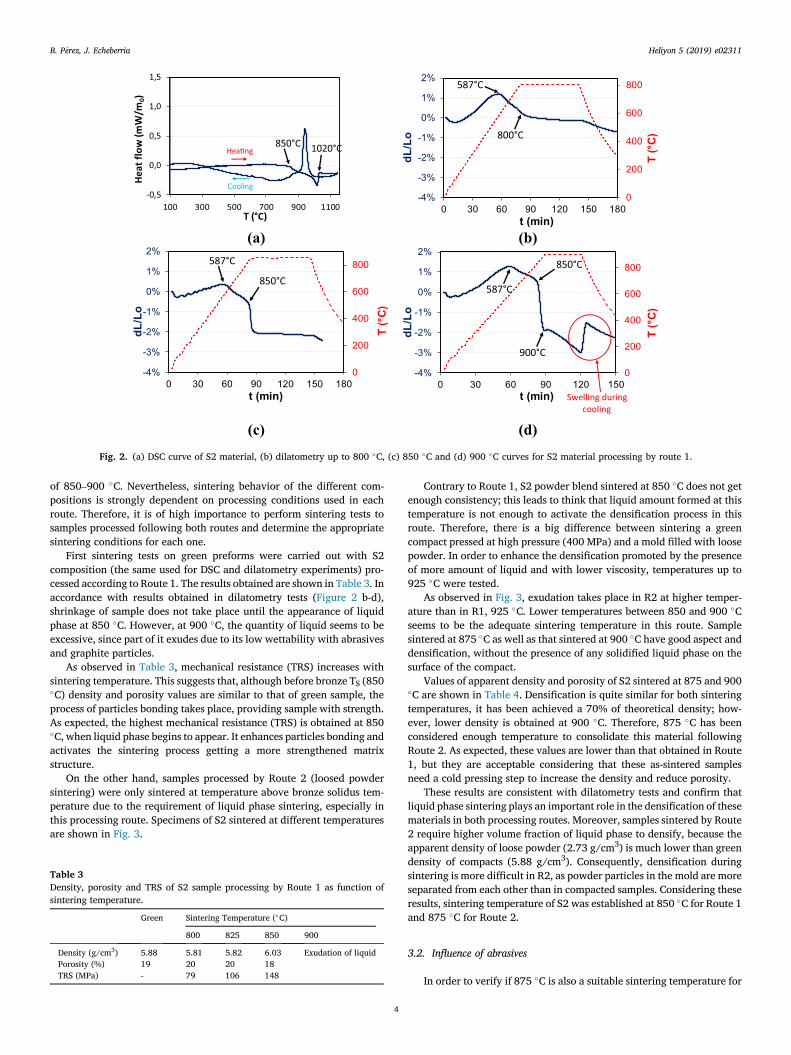
On the other hand, samples processed by Route 2 (loosed powdersintering) were only sintered at temperature above bronze solidus tem-perature due to the requirement of liquid phase sintering, especially inthis processing route. Specimens of S2 sintered at different temperaturesare shown in Fig. 3.
Table 3Density, porosity and TRS of S2 sample processing by Route 1 as function ofsintering temperature.
Green Sintering Temperature (�C)
800 825 850 900
Density (g/cm3) 5.88 5.81 5.82 6.03 Exudation of liquidPorosity (%) 19 20 20 18TRS (MPa) - 79 106 148
4
Contrary to Route 1, S2 powder blend sintered at 850 �C does not getenough consistency; this leads to think that liquid amount formed at thistemperature is not enough to activate the densification process in thisroute. Therefore, there is a big difference between sintering a greencompact pressed at high pressure (400 MPa) and a mold filled with loosepowder. In order to enhance the densification promoted by the presenceof more amount of liquid and with lower viscosity, temperatures up to925 �C were tested.
As observed in Fig. 3, exudation takes place in R2 at higher temper-ature than in R1, 925 �C. Lower temperatures between 850 and 900 �Cseems to be the adequate sintering temperature in this route. Samplesintered at 875 �C as well as that sintered at 900 �C have good aspect anddensification, without the presence of any solidified liquid phase on thesurface of the compact.
Values of apparent density and porosity of S2 sintered at 875 and 900�C are shown in Table 4. Densification is quite similar for both sinteringtemperatures, it has been achieved a 70% of theoretical density; how-ever, lower density is obtained at 900 �C. Therefore, 875 �C has beenconsidered enough temperature to consolidate this material followingRoute 2. As expected, these values are lower than that obtained in Route1, but they are acceptable considering that these as-sintered samplesneed a cold pressing step to increase the density and reduce porosity.
These results are consistent with dilatometry tests and confirm thatliquid phase sintering plays an important role in the densification of thesematerials in both processing routes. Moreover, samples sintered by Route2 require higher volume fraction of liquid phase to densify, because theapparent density of loose powder (2.73 g/cm3) is much lower than greendensity of compacts (5.88 g/cm3). Consequently, densification duringsintering is more difficult in R2, as powder particles in the mold are moreseparated from each other than in compacted samples. Considering theseresults, sintering temperature of S2 was established at 850 �C for Route 1and 875 �C for Route 2.
3.2. Influence of abrasives
In order to verify if 875 �C is also a suitable sintering temperature for
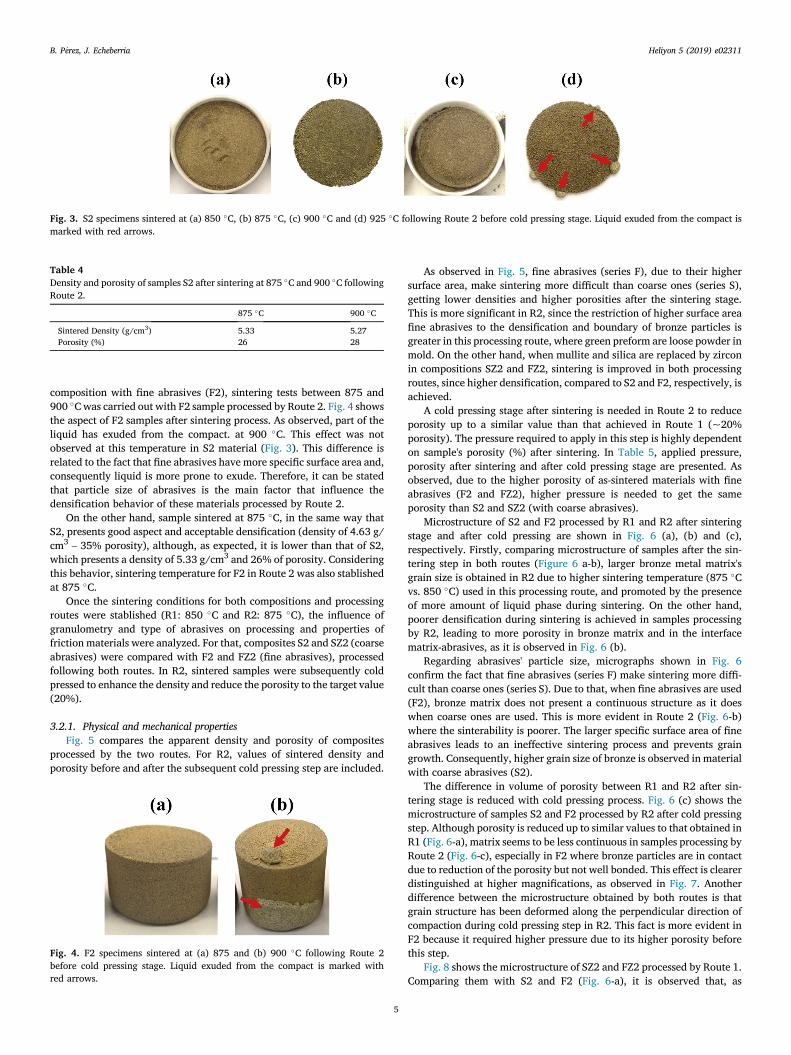
Fig. 3. S2 specimens sintered at (a) 850 �C, (b) 875 �C, (c) 900 �C and (d) 925 �C following Route 2 before cold pressing stage. Liquid exuded from the compact ismarked with red arrows.
Table 4Density and porosity of samples S2 after sintering at 875 �C and 900 �C followingRoute 2.
875 �C 900 �C
Sintered Density (g/cm3) 5.33 5.27Porosity (%) 26 28
B. P�erez, J. Echeberria Heliyon 5 (2019) e02311
composition with fine abrasives (F2), sintering tests between 875 and900 �Cwas carried out with F2 sample processed by Route 2. Fig. 4 showsthe aspect of F2 samples after sintering process. As observed, part of theliquid has exuded from the compact. at 900 �C. This effect was notobserved at this temperature in S2 material (Fig. 3). This difference isrelated to the fact that fine abrasives have more specific surface area and,consequently liquid is more prone to exude. Therefore, it can be statedthat particle size of abrasives is the main factor that influence thedensification behavior of these materials processed by Route 2.
On the other hand, sample sintered at 875 �C, in the same way thatS2, presents good aspect and acceptable densification (density of 4.63 g/cm3
– 35% porosity), although, as expected, it is lower than that of S2,which presents a density of 5.33 g/cm3 and 26% of porosity. Consideringthis behavior, sintering temperature for F2 in Route 2 was also stablishedat 875 �C.
Once the sintering conditions for both compositions and processingroutes were stablished (R1: 850 �C and R2: 875 �C), the influence ofgranulometry and type of abrasives on processing and properties offriction materials were analyzed. For that, composites S2 and SZ2 (coarseabrasives) were compared with F2 and FZ2 (fine abrasives), processedfollowing both routes. In R2, sintered samples were subsequently coldpressed to enhance the density and reduce the porosity to the target value(20%).
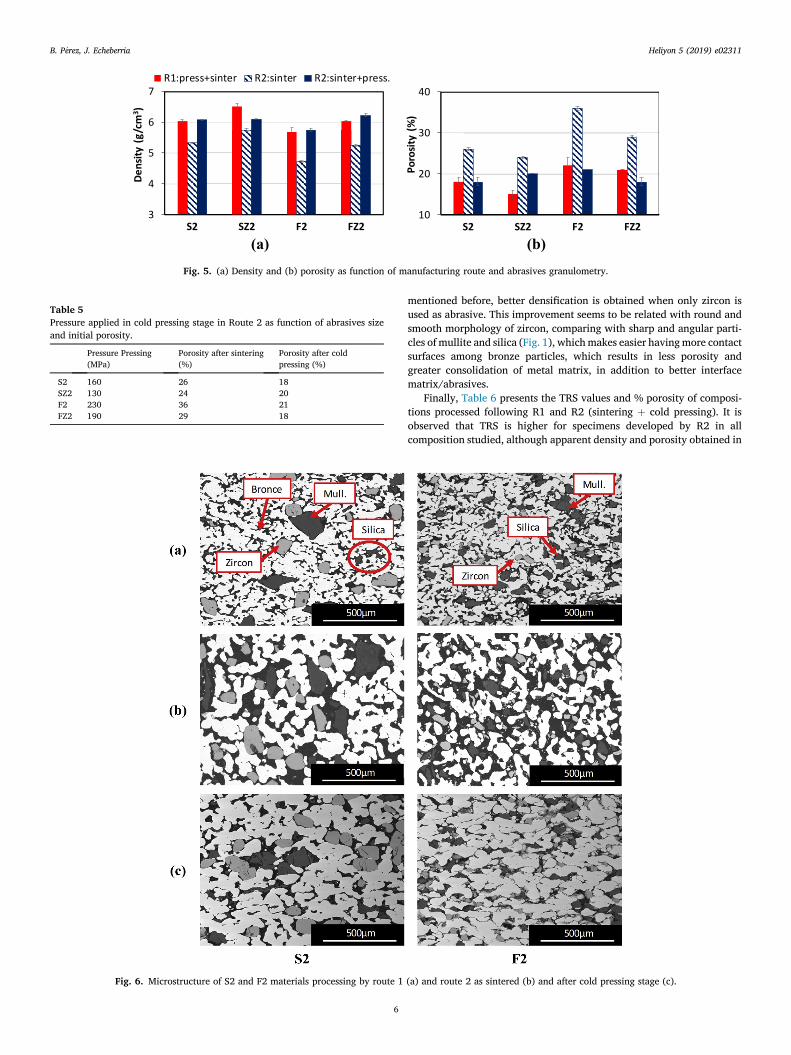
3.2.1. Physical and mechanical propertiesFig. 5 compares the apparent density and porosity of composites
processed by the two routes. For R2, values of sintered density andporosity before and after the subsequent cold pressing step are included.
Fig. 4. F2 specimens sintered at (a) 875 and (b) 900 �C following Route 2before cold pressing stage. Liquid exuded from the compact is marked withred arrows.
5
As observed in Fig. 5, fine abrasives (series F), due to their highersurface area, make sintering more difficult than coarse ones (series S),getting lower densities and higher porosities after the sintering stage.This is more significant in R2, since the restriction of higher surface areafine abrasives to the densification and boundary of bronze particles isgreater in this processing route, where green preform are loose powder inmold. On the other hand, when mullite and silica are replaced by zirconin compositions SZ2 and FZ2, sintering is improved in both processingroutes, since higher densification, compared to S2 and F2, respectively, isachieved.
A cold pressing stage after sintering is needed in Route 2 to reduceporosity up to a similar value than that achieved in Route 1 (~20%porosity). The pressure required to apply in this step is highly dependenton sample's porosity (%) after sintering. In Table 5, applied pressure,porosity after sintering and after cold pressing stage are presented. Asobserved, due to the higher porosity of as-sintered materials with fineabrasives (F2 and FZ2), higher pressure is needed to get the sameporosity than S2 and SZ2 (with coarse abrasives).
Microstructure of S2 and F2 processed by R1 and R2 after sinteringstage and after cold pressing are shown in Fig. 6 (a), (b) and (c),respectively. Firstly, comparing microstructure of samples after the sin-tering step in both routes (Figure 6 a-b), larger bronze metal matrix'sgrain size is obtained in R2 due to higher sintering temperature (875 �Cvs. 850 �C) used in this processing route, and promoted by the presenceof more amount of liquid phase during sintering. On the other hand,poorer densification during sintering is achieved in samples processingby R2, leading to more porosity in bronze matrix and in the interfacematrix-abrasives, as it is observed in Fig. 6 (b).
Regarding abrasives' particle size, micrographs shown in Fig. 6confirm the fact that fine abrasives (series F) make sintering more diffi-cult than coarse ones (series S). Due to that, when fine abrasives are used(F2), bronze matrix does not present a continuous structure as it doeswhen coarse ones are used. This is more evident in Route 2 (Fig. 6-b)where the sinterability is poorer. The larger specific surface area of fineabrasives leads to an ineffective sintering process and prevents graingrowth. Consequently, higher grain size of bronze is observed in materialwith coarse abrasives (S2).
The difference in volume of porosity between R1 and R2 after sin-tering stage is reduced with cold pressing process. Fig. 6 (c) shows themicrostructure of samples S2 and F2 processed by R2 after cold pressingstep. Although porosity is reduced up to similar values to that obtained inR1 (Fig. 6-a), matrix seems to be less continuous in samples processing byRoute 2 (Fig. 6-c), especially in F2 where bronze particles are in contactdue to reduction of the porosity but not well bonded. This effect is clearerdistinguished at higher magnifications, as observed in Fig. 7. Anotherdifference between the microstructure obtained by both routes is thatgrain structure has been deformed along the perpendicular direction ofcompaction during cold pressing step in R2. This fact is more evident inF2 because it required higher pressure due to its higher porosity beforethis step.
Fig. 8 shows the microstructure of SZ2 and FZ2 processed by Route 1.Comparing them with S2 and F2 (Fig. 6-a), it is observed that, as
(a) (b)
3
4
5
6
7
S2 SZ2 F2 FZ2
mc/g(ytisneD
3 )
R1:press+sinter R2:sinter R2:sinter+press.
10
20
30
40
S2 SZ2 F2 FZ2
)%(
ytisoroP
Fig. 5. (a) Density and (b) porosity as function of manufacturing route and abrasives granulometry.
Table 5Pressure applied in cold pressing stage in Route 2 as function of abrasives sizeand initial porosity.
Pressure Pressing(MPa)
Porosity after sintering(%)
Porosity after coldpressing (%)
S2 160 26 18SZ2 130 24 20F2 230 36 21FZ2 190 29 18
Fig. 6. Microstructure of S2 and F2 materials processing by route 1
B. P�erez, J. Echeberria Heliyon 5 (2019) e02311
6
mentioned before, better densification is obtained when only zircon isused as abrasive. This improvement seems to be related with round andsmooth morphology of zircon, comparing with sharp and angular parti-cles of mullite and silica (Fig. 1), whichmakes easier havingmore contactsurfaces among bronze particles, which results in less porosity andgreater consolidation of metal matrix, in addition to better interfacematrix/abrasives.
Finally, Table 6 presents the TRS values and % porosity of composi-tions processed following R1 and R2 (sintering þ cold pressing). It isobserved that TRS is higher for specimens developed by R2 in allcomposition studied, although apparent density and porosity obtained in
(a) and route 2 as sintered (b) and after cold pressing stage (c).
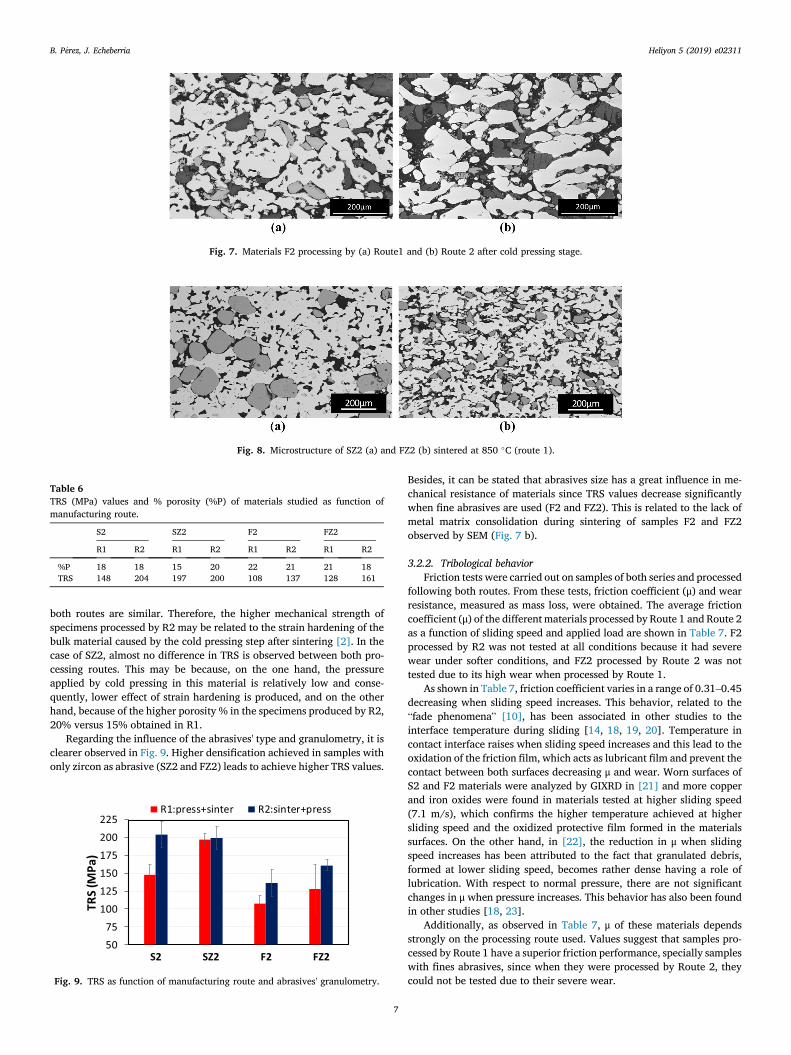
Fig. 7. Materials F2 processing by (a) Route1 and (b) Route 2 after cold pressing stage.
Fig. 8. Microstructure of SZ2 (a) and FZ2 (b) sintered at 850 �C (route 1).
Table 6TRS (MPa) values and % porosity (%P) of materials studied as function ofmanufacturing route.
S2 SZ2 F2 FZ2
R1 R2 R1 R2 R1 R2 R1 R2
%P 18 18 15 20 22 21 21 18TRS 148 204 197 200 108 137 128 161
B. P�erez, J. Echeberria Heliyon 5 (2019) e02311
both routes are similar. Therefore, the higher mechanical strength ofspecimens processed by R2 may be related to the strain hardening of thebulk material caused by the cold pressing step after sintering [2]. In thecase of SZ2, almost no difference in TRS is observed between both pro-cessing routes. This may be because, on the one hand, the pressureapplied by cold pressing in this material is relatively low and conse-quently, lower effect of strain hardening is produced, and on the otherhand, because of the higher porosity % in the specimens produced by R2,20% versus 15% obtained in R1.
Regarding the influence of the abrasives' type and granulometry, it isclearer observed in Fig. 9. Higher densification achieved in samples withonly zircon as abrasive (SZ2 and FZ2) leads to achieve higher TRS values.
5075
100125150175200225
S2 SZ2 F2 FZ2
)aPM(
SRT
R1:press+sinter R2:sinter+press
Fig. 9. TRS as function of manufacturing route and abrasives' granulometry.
7
Besides, it can be stated that abrasives size has a great influence in me-chanical resistance of materials since TRS values decrease significantlywhen fine abrasives are used (F2 and FZ2). This is related to the lack ofmetal matrix consolidation during sintering of samples F2 and FZ2observed by SEM (Fig. 7 b).
3.2.2. Tribological behaviorFriction tests were carried out on samples of both series and processed
following both routes. From these tests, friction coefficient (μ) and wearresistance, measured as mass loss, were obtained. The average frictioncoefficient (μ) of the different materials processed by Route 1 and Route 2as a function of sliding speed and applied load are shown in Table 7. F2processed by R2 was not tested at all conditions because it had severewear under softer conditions, and FZ2 processed by Route 2 was nottested due to its high wear when processed by Route 1.
As shown in Table 7, friction coefficient varies in a range of 0.31–0.45decreasing when sliding speed increases. This behavior, related to the“fade phenomena” [10], has been associated in other studies to theinterface temperature during sliding [14, 18, 19, 20]. Temperature incontact interface raises when sliding speed increases and this lead to theoxidation of the friction film, which acts as lubricant film and prevent thecontact between both surfaces decreasing μ and wear. Worn surfaces ofS2 and F2 materials were analyzed by GIXRD in [21] and more copperand iron oxides were found in materials tested at higher sliding speed(7.1 m/s), which confirms the higher temperature achieved at highersliding speed and the oxidized protective film formed in the materialssurfaces. On the other hand, in [22], the reduction in μ when slidingspeed increases has been attributed to the fact that granulated debris,formed at lower sliding speed, becomes rather dense having a role oflubrication. With respect to normal pressure, there are not significantchanges in μ when pressure increases. This behavior has also been foundin other studies [18, 23].
Additionally, as observed in Table 7, μ of these materials dependsstrongly on the processing route used. Values suggest that samples pro-cessed by Route 1 have a superior friction performance, specially sampleswith fines abrasives, since when they were processed by Route 2, theycould not be tested due to their severe wear.

Table 7Average friction coefficient (μ) of composites developed following Route 1 (R1) and Route 2 (R2).
ROUTE 1 ROUTE 2
4.5 m/s 7.1 m/s 4.5 m/s 7.1 m/s
0.8MPa 1MPa 0.8MPa 1MPa 0.8MPa 1MPa 0.8MPa 1MPa
S2 0.40 0.42 0.32 0.34 0.41 0.45 0.36 0.36SZ2 0.38 0.38 0.33 0.31 0.44 0.42 0.34 0.35F2 0.41 0.42 0.34 0.36 0.48* - - -FZ2 0.43* 0.48* - - - - - -
* Incomplete test. (-) Test were not carried out.
B. P�erez, J. Echeberria Heliyon 5 (2019) e02311
Regarding the nature/morphology of abrasives and comparing S2 andSZ2 (coarse abrasives) processed by R1, it can be pointed out that μ ismore stable when using only zircon as abrasive (SZ2). This could bebecause SZ2 presents higher densification than S2 that lead to a smoothfriction surface. However, comparing F2 and FZ2, it is observed that inthis series (fine abrasives) using only zircon (FZ2) is detrimental forfriction performance of the material, although higher densification andTRS are obtained in FZ2. This is related to the fact that flour zircon usedin FZ2 is the finest abrasive powder used in this work (D10: 1μm), whilethe finest particles (D10) of mullite and silica used in F2 are of 50 and 36μm, respectively. Due to the weaker bond of fine particles with matrix,the finer abrasives are, the higher is the probability of their removal frommatrix. Some of these removed abrasive particles might be trapped in theinterface acting as a third body and increasing the wear of material.Therefore, not only the nature/morphology of the abrasive influences thefriction performance of these materials, but also their granulometry.
With respect to abrasives' granulometry, depending on the differenceof particle size, it has more or less influence on the tribological behavior.
(a)
(b)
05
101520253035404550
S2 SZ2 F2 FZ2
)%(ssoLssa
M
v=4.5m/s
05
101520253035404550
S2 SZ2 F2
)%(ssoLssa
M
v=4.5m/s
Fig. 10. Effect of abrasives' granulometry and processing in wea
8
In the case of F2 and S2 processed by R1, similar friction behavior hasbeen found, despite of less densification of F2. Nevertheless, verydifferent behavior is observed between SZ2 and FZ2 (Table 7). Asmention before, FZ2 could not be tested under any conditions due tosevere wear of samples related to the much finer zircon used in FZ2 thanin SZ2.
Turning now to friction performance of materials processing by Route2 (Table 7), materials with coarse abrasives (S2 and SZ2) show similarvalues of friction coefficient and both materials have slightly higher μvalues than that of samples produced by Route 1. These differences couldbe related to the strained surface with the subsequent residual stressesgenerated by the cold pressing step used in R2, which promote higherfriction forces [2].
Abrasives' granulometry has even more influence in the tribologicalbehavior of materials processed by R2. Densification achieved after sin-tering of materials with fine abrasives (F2 and FZ2) is very low and,although cold pressing step increases density, bonding of bronze particlesis not enough, as observed in Figure 6 (b,c). The lack of effective metallic
05
101520253035404550
S2 SZ2 F2
Mas
s Los
s (%
)
v=7.1m/s
05
101520253035404550
S2 SZ2
Mas
s Los
s (%
)
v=7.1m/s
r loss of materials prepared by Route 1 (a) and Route 2 (b).

(a) (b)
3
4
5
6
7
S2 S4 SZ2 SZ4
.pAytisneD
mc/g(3 )
R1:press+sinter R2:sinter R2:sinter+press
05
10152025303540
S2 S4 SZ2 SZ4
ytisoroP(%
)
Fig. 11. Influence of %weight of graphite in apparent density (a) and porosity (b) of samples with three abrasives (S) and only zircon (SZ).
Fig. 12. Microestructure of S2 (A) and S4 (B–C) as sintered by Route 2. (C) has high contrast to visualize graphite particles in samples S4.
Table 8Pressure applied in cold pressing stage in Route 2 as function of graphite %wt.
Heightreduction(mm)
PressurePressing (MPa)
Porosity aftersintering (%)
Porosity after coldpressing (%)
S2 4.0 160 30 � 0 21 � 1S4 6.1 160 37 � 0 20 � 1SZ2 3.1 133 27 � 0 22 � 0SZ4 4.7 140 33 � 1 20 � 1
20
60
100
140
180
220
260
S2 S4 SZ2 SZ4
)aPM(
SRT
R1:press+sinter R2:sinter+press
Fig. 13. TRS as function of %graphite.
B. P�erez, J. Echeberria Heliyon 5 (2019) e02311
matrix structure, in addition to the fact that fine abrasives are weakerheld in metallic matrix, makes easier to pull out abrasive particle duringsliding leading to great mass losses.
The analysis of the wear values (Fig. 10), measured as mass loss (%)during friction test, also reveals higher differences between the tribo-logical behavior of materials processing by the two routes. Regarding theparameters of the wear tests (velocity and pressure), it can be pointed outthat when sliding speed increase, wear loss decreases for both processingroutes. As mentioned before, this may be related to the increase of theinterface temperature with the increase of sliding speed. Consequently,loose particles of debris, generated during sliding, are deformed alongsliding direction producing an smooth oxidized layer that cover wornsurface of composite and acts as lubricant decreasing both μ and wear
9
[14]. Regarding pressure applied, as expected, the wear loss slightly in-creases in all specimens when pressure raises, owing to higher contactarea between composite and counter-disc. Materials with fine abrasives(F2 and FZ2) are more sensitive to pressure's effect.
Materials with coarse abrasives (S2 and SZ2) processed by both routesexhibit similar wear resistance, despite composition with only zircon asabrasive (SZ2) has higher densification and TRS.
Comparing the values of wear loss measured in both series (S and F)
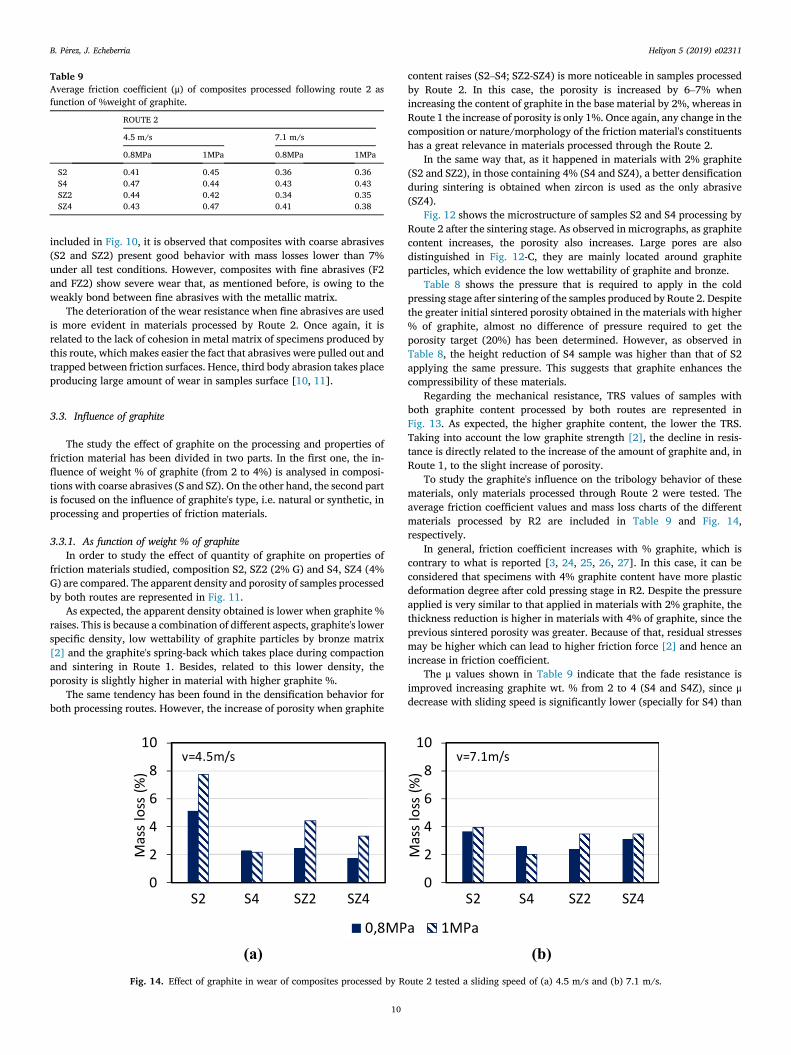
Table 9Average friction coefficient (μ) of composites processed following route 2 asfunction of %weight of graphite.
ROUTE 2
4.5 m/s 7.1 m/s
0.8MPa 1MPa 0.8MPa 1MPa
S2 0.41 0.45 0.36 0.36S4 0.47 0.44 0.43 0.43SZ2 0.44 0.42 0.34 0.35SZ4 0.43 0.47 0.41 0.38
B. P�erez, J. Echeberria Heliyon 5 (2019) e02311
included in Fig. 10, it is observed that composites with coarse abrasives(S2 and SZ2) present good behavior with mass losses lower than 7%under all test conditions. However, composites with fine abrasives (F2and FZ2) show severe wear that, as mentioned before, is owing to theweakly bond between fine abrasives with the metallic matrix.
The deterioration of the wear resistance when fine abrasives are usedis more evident in materials processed by Route 2. Once again, it isrelated to the lack of cohesion in metal matrix of specimens produced bythis route, which makes easier the fact that abrasives were pulled out andtrapped between friction surfaces. Hence, third body abrasion takes placeproducing large amount of wear in samples surface [10, 11].
3.3. Influence of graphite
The study the effect of graphite on the processing and properties offriction material has been divided in two parts. In the first one, the in-fluence of weight % of graphite (from 2 to 4%) is analysed in composi-tions with coarse abrasives (S and SZ). On the other hand, the second partis focused on the influence of graphite's type, i.e. natural or synthetic, inprocessing and properties of friction materials.
3.3.1. As function of weight % of graphiteIn order to study the effect of quantity of graphite on properties of
friction materials studied, composition S2, SZ2 (2% G) and S4, SZ4 (4%G) are compared. The apparent density and porosity of samples processedby both routes are represented in Fig. 11.
As expected, the apparent density obtained is lower when graphite %raises. This is because a combination of different aspects, graphite's lowerspecific density, low wettability of graphite particles by bronze matrix[2] and the graphite's spring-back which takes place during compactionand sintering in Route 1. Besides, related to this lower density, theporosity is slightly higher in material with higher graphite %.
The same tendency has been found in the densification behavior forboth processing routes. However, the increase of porosity when graphite
(a)
0
2
4
6
8
10
S2 S4 SZ2 SZ4
)%(ssolssa
M
v=4.5m/s
0,8MP
Fig. 14. Effect of graphite in wear of composites processed by R
10
content raises (S2–S4; SZ2-SZ4) is more noticeable in samples processedby Route 2. In this case, the porosity is increased by 6–7% whenincreasing the content of graphite in the base material by 2%, whereas inRoute 1 the increase of porosity is only 1%. Once again, any change in thecomposition or nature/morphology of the friction material's constituentshas a great relevance in materials processed through the Route 2.
In the same way that, as it happened in materials with 2% graphite(S2 and SZ2), in those containing 4% (S4 and SZ4), a better densificationduring sintering is obtained when zircon is used as the only abrasive(SZ4).
Fig. 12 shows the microstructure of samples S2 and S4 processing byRoute 2 after the sintering stage. As observed in micrographs, as graphitecontent increases, the porosity also increases. Large pores are alsodistinguished in Fig. 12-C, they are mainly located around graphiteparticles, which evidence the low wettability of graphite and bronze.
Table 8 shows the pressure that is required to apply in the coldpressing stage after sintering of the samples produced by Route 2. Despitethe greater initial sintered porosity obtained in the materials with higher% of graphite, almost no difference of pressure required to get theporosity target (20%) has been determined. However, as observed inTable 8, the height reduction of S4 sample was higher than that of S2applying the same pressure. This suggests that graphite enhances thecompressibility of these materials.
Regarding the mechanical resistance, TRS values of samples withboth graphite content processed by both routes are represented inFig. 13. As expected, the higher graphite content, the lower the TRS.Taking into account the low graphite strength [2], the decline in resis-tance is directly related to the increase of the amount of graphite and, inRoute 1, to the slight increase of porosity.
To study the graphite's influence on the tribology behavior of thesematerials, only materials processed through Route 2 were tested. Theaverage friction coefficient values and mass loss charts of the differentmaterials processed by R2 are included in Table 9 and Fig. 14,respectively.
In general, friction coefficient increases with % graphite, which iscontrary to what is reported [3, 24, 25, 26, 27]. In this case, it can beconsidered that specimens with 4% graphite content have more plasticdeformation degree after cold pressing stage in R2. Despite the pressureapplied is very similar to that applied in materials with 2% graphite, thethickness reduction is higher in materials with 4% of graphite, since theprevious sintered porosity was greater. Because of that, residual stressesmay be higher which can lead to higher friction force [2] and hence anincrease in friction coefficient.
The μ values shown in Table 9 indicate that the fade resistance isimproved increasing graphite wt. % from 2 to 4 (S4 and S4Z), since μdecrease with sliding speed is significantly lower (specially for S4) than
(b)
0
2
4
6
8
10
S2 S4 SZ2 SZ4
Mas
s los
s (%
)
v=7.1m/s
a 1MPa
oute 2 tested a sliding speed of (a) 4.5 m/s and (b) 7.1 m/s.
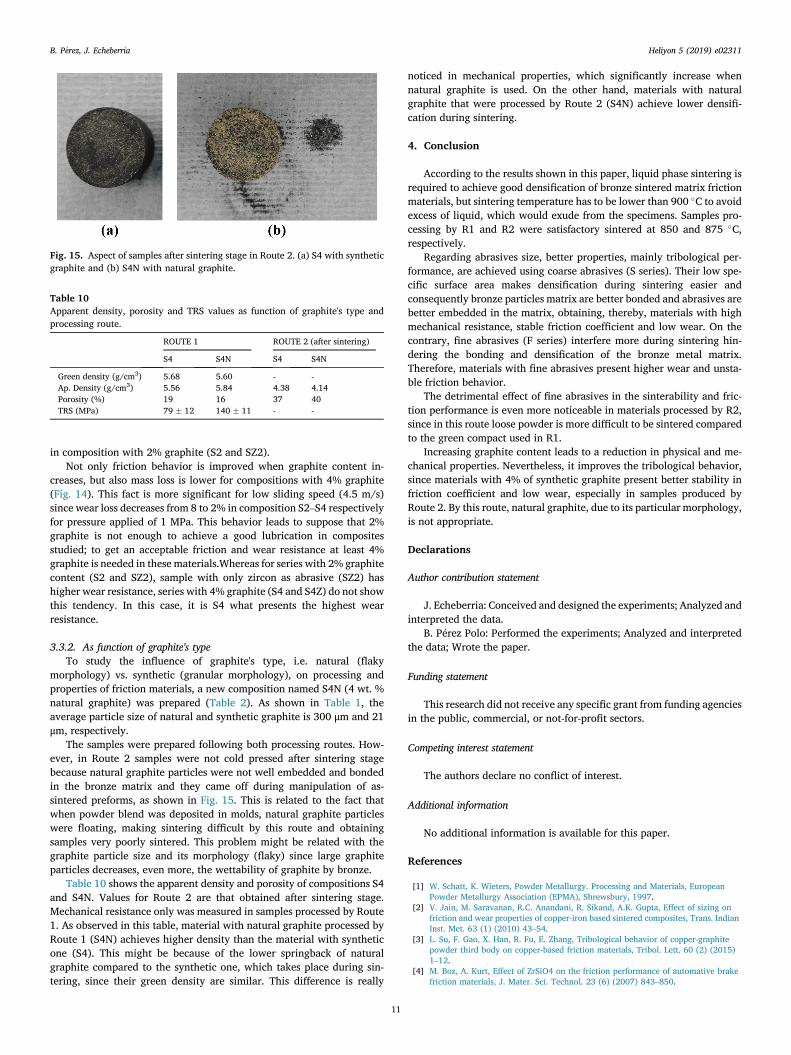
Fig. 15. Aspect of samples after sintering stage in Route 2. (a) S4 with syntheticgraphite and (b) S4N with natural graphite.
Table 10Apparent density, porosity and TRS values as function of graphite's type andprocessing route.
ROUTE 1 ROUTE 2 (after sintering)
S4 S4N S4 S4N
Green density (g/cm3) 5.68 5.60 - -Ap. Density (g/cm3) 5.56 5.84 4.38 4.14Porosity (%) 19 16 37 40TRS (MPa) 79 � 12 140 � 11 - -
B. P�erez, J. Echeberria Heliyon 5 (2019) e02311
in composition with 2% graphite (S2 and SZ2).Not only friction behavior is improved when graphite content in-
creases, but also mass loss is lower for compositions with 4% graphite(Fig. 14). This fact is more significant for low sliding speed (4.5 m/s)since wear loss decreases from 8 to 2% in composition S2–S4 respectivelyfor pressure applied of 1 MPa. This behavior leads to suppose that 2%graphite is not enough to achieve a good lubrication in compositesstudied; to get an acceptable friction and wear resistance at least 4%graphite is needed in these materials.Whereas for series with 2% graphitecontent (S2 and SZ2), sample with only zircon as abrasive (SZ2) hashigher wear resistance, series with 4% graphite (S4 and S4Z) do not showthis tendency. In this case, it is S4 what presents the highest wearresistance.
3.3.2. As function of graphite's typeTo study the influence of graphite's type, i.e. natural (flaky
morphology) vs. synthetic (granular morphology), on processing andproperties of friction materials, a new composition named S4N (4 wt. %natural graphite) was prepared (Table 2). As shown in Table 1, theaverage particle size of natural and synthetic graphite is 300 μm and 21μm, respectively.
The samples were prepared following both processing routes. How-ever, in Route 2 samples were not cold pressed after sintering stagebecause natural graphite particles were not well embedded and bondedin the bronze matrix and they came off during manipulation of as-sintered preforms, as shown in Fig. 15. This is related to the fact thatwhen powder blend was deposited in molds, natural graphite particleswere floating, making sintering difficult by this route and obtainingsamples very poorly sintered. This problem might be related with thegraphite particle size and its morphology (flaky) since large graphiteparticles decreases, even more, the wettability of graphite by bronze.
Table 10 shows the apparent density and porosity of compositions S4and S4N. Values for Route 2 are that obtained after sintering stage.Mechanical resistance only was measured in samples processed by Route1. As observed in this table, material with natural graphite processed byRoute 1 (S4N) achieves higher density than the material with syntheticone (S4). This might be because of the lower springback of naturalgraphite compared to the synthetic one, which takes place during sin-tering, since their green density are similar. This difference is really
11
noticed in mechanical properties, which significantly increase whennatural graphite is used. On the other hand, materials with naturalgraphite that were processed by Route 2 (S4N) achieve lower densifi-cation during sintering.
4. Conclusion
According to the results shown in this paper, liquid phase sintering isrequired to achieve good densification of bronze sintered matrix frictionmaterials, but sintering temperature has to be lower than 900 �C to avoidexcess of liquid, which would exude from the specimens. Samples pro-cessing by R1 and R2 were satisfactory sintered at 850 and 875 �C,respectively.
Regarding abrasives size, better properties, mainly tribological per-formance, are achieved using coarse abrasives (S series). Their low spe-cific surface area makes densification during sintering easier andconsequently bronze particles matrix are better bonded and abrasives arebetter embedded in the matrix, obtaining, thereby, materials with highmechanical resistance, stable friction coefficient and low wear. On thecontrary, fine abrasives (F series) interfere more during sintering hin-dering the bonding and densification of the bronze metal matrix.Therefore, materials with fine abrasives present higher wear and unsta-ble friction behavior.
The detrimental effect of fine abrasives in the sinterability and fric-tion performance is even more noticeable in materials processed by R2,since in this route loose powder is more difficult to be sintered comparedto the green compact used in R1.
Increasing graphite content leads to a reduction in physical and me-chanical properties. Nevertheless, it improves the tribological behavior,since materials with 4% of synthetic graphite present better stability infriction coefficient and low wear, especially in samples produced byRoute 2. By this route, natural graphite, due to its particular morphology,is not appropriate.
Declarations
Author contribution statement
J. Echeberria: Conceived and designed the experiments; Analyzed andinterpreted the data.
B. P�erez Polo: Performed the experiments; Analyzed and interpretedthe data; Wrote the paper.
Funding statement
This research did not receive any specific grant from funding agenciesin the public, commercial, or not-for-profit sectors.
Competing interest statement
The authors declare no conflict of interest.
Additional information
No additional information is available for this paper.
References
[1] W. Schatt, K. Wieters, Powder Metallurgy. Processing and Materials, EuropeanPowder Metallurgy Association (EPMA), Shrewsbury, 1997.
[2] V. Jain, M. Saravanan, R.C. Anandani, R. Sikand, A.K. Gupta, Effect of sizing onfriction and wear properties of copper-iron based sintered composites, Trans. IndianInst. Met. 63 (1) (2010) 43–54.
[3] L. Su, F. Gao, X. Han, R. Fu, E. Zhang, Tribological behavior of copper-graphitepowder third body on copper-based friction materials, Tribol. Lett. 60 (2) (2015)1–12.
[4] M. Boz, A. Kurt, Effect of ZrSiO4 on the friction performance of automative brakefriction materials, J. Mater. Sci. Technol. 23 (6) (2007) 843–850.
B. P�erez, J. Echeberria Heliyon 5 (2019) e02311
[5] R.L. Cox, Engineered Tribological Composites: the Art of Friction MaterialDevelopment, SAE International, Warrendale, Pennsylvania, USA, 2012.
[6] X. Xiong, J. Chen, P. Yao, S. Li, B. Huang, Friction and wear behaviors andmechanisms of Fe and SiO2 in Cu-based P/M friction materials, Wear 262 (9–10)(2007) 1182–1186.
[7] G. Kwabena Gyimah, P. Huang, D. Chen, Dry sliding wear studies of copper-basedpowder metallurgy brake materials, J. Tribol. 136 (4) (2014).
[8] B. Chen, Q. Bi, J. Yang, Y. Xia, J. Hao, Tribological properties of solid lubricants(graphite, h-BN) for Cu-based P/M friction composites, Tribol. Int. 41 (12) (2008)1145–1152.
[9] M. Boz, A. Kurt, The effect of Al2O3 on the friction performance of automotivebrake friction materials, Tribol. Int. 40 (2007) 1161–1169.
[10] K.H. Cho, H. Jang, Y.S. Hong, S.J. Kim, R.H. Basch, J.W. Fash, The size effect ofzircon particles on the friction characteristics of brake lining materials, Wear 264(3–4) (2008) 291–297.
[11] E.J. Lee, H.J. Hwang, W.G. Lee, K.H. Cho, H. Jang, Morphology and toughness ofabrasive particles and their effects on the friction and wear of friction materials: acase study with zircon and quartz, Tribol. Lett. 37 (3) (2010) 637–644.
[12] T. Ram Prabhu, V.K. Varma, S. Vedantam, Effect of reinforcement type, size, andvolume fraction on the tribological behavior of Fe matrix composites at high slidingspeed conditions, Wear 309 (1–2) (2014) 247–255.
[13] Y. Xiao, et al., Mechanical and tribological behaviors of copper metal matrixcomposites for brake pads used in high-speed trains, Tribol. Int. 119 (2018)585–592.
[14] Y. Zhan, G. Zhang, Friction and wear behavior of copper matrix compositesreinforced with SiC and graphite particles, Tribol. Lett. 17 (1) (2004) 91–98.
[15] P.T. Dewisme, Desarrollo de materiales de fricci�on basados en metal sinterizadopara aplicaciones en frenos de la industrial e�olica, Universidad de Navarra, Tecnun,2014.
[16] A.M. Martinez, La sustituci�on del cobre en las pastillas de freno org�anicas mediantepolvos met�alicos y el estudio de su reacci�on con los lubricantes s�olidos, Universidadde Navarra, Tecnun, 2015.
12
[17] L. Fuentes-Pacheco, M. Campos, Lead-free copper- base alloys for frictioncomponents: sinterability and recrystallization, Int. J. Powder Metall. 48 (3) (2012)29–39.
[18] X. Xiao, Y. Yin, J. Bao, L. Lu, X. Feng, Review on the friction and wear of brakematerials, Adv. Mech. Eng. 8 (5) (2016) 1–10.
[19] T.R. Prabhu, Effects of solid lubricants, load, and sliding speed on the tribologicalbehavior of silica reinforced composites using design of experiments, Mater. Des. 77(2015) 149–160.
[20] J. Chen, X. Xiong, P. Yao, E. Al, Effect of rubbed surface temperature on frictionbehaviour of iron based P/M friction materials, Powder Metall. Technol. 22 (4)(2004) 223–227.
[21] B. Perez Polo, Materiales de fricci�on de metal sinterizado base cobre: Influencia desus constituyentes en el procesamiento y propiedades tribol�ogicas, Universidad deNavarra, Tecnun, 2019.
[22] X.-M. Han, F. Gao, B.-Y. Song, R. Fu, Effect of friction speed on friction and wearperformance of Cu-matrix friction materials, Tribology 29 (1) (2009) 89–96.
[23] T. Ram Prabhu, Effect of bimodal size particles reinforcement on the wear, frictionand mechanical properties of brake composites, Tribol. Mater. Surf. Interfaces 10(4) (2016) 163–171.
[24] J. Kov�a�cik, �S. Emmer, J. Bielek, L. Kele�si, Effect of composition on frictioncoefficient of Cu-graphite composites, Wear 265 (3–4) (2008) 417–421.
[25] S.F. Moustafa, S.A. El-Badry, A.M. Sanad, B. Kieback, Friction and wear of copper-graphite composites made with Cu-coated and uncoated graphite powders, Wear253 (7–8) (2002) 699–710.
[26] D. Gultekin, M. Uysal, S. Aslan, M. Alaf, M.O. Guler, H. Akbulut, The effects ofapplied load on the coefficient of friction in Cu-MMC brake pad/Al-SiCp MMCbrake disc system, Wear 270 (1–2) (2010) 73–82.
[27] H. Kato, M. Takama, Y. Iwai, K. Washida, Y. Sasaki, Wear and mechanicalproperties of sintered copper-tin composites containing graphite or molybdenumdisulfide, Wear 255 (2003) 573–578.